User login
A National Survey of Veterans Affairs Medical Centers’ Cardiology Services (FULL)
The US Department of Veterans Affairs (VA) remains the largest integrated health care system in the US serving 9 million veterans. Two recent studies that compared 30-day mortality and readmission rates between VA and non-VA hospitals among older men with acute myocardial infarction (AMI), and heart failure (HF). The studies found that hospitalization at VA hospitals was associated with lower risk-standardized 30-day all-cause mortality rates for MI and HF when compared with hospitalization at non-VA hospitals.1,2
However, it is unknown whether the delivery of cardiovascular care is optimized in the VA system. For example, in comparisons between generalist-led hospitalized care for MI and HF, several studies have demonstrated that cardiology-led care has been associated with lower rates of mortality.3-5 Although data on the types of cardiac technology and use of cardiac procedures were described previously, we have not found detailed information on the types of inpatient cardiology services provided at VA medical centers nationwide.1,6,7 To develop further improvements in delivery of cardiovascular care within the VA, a better understanding of the types of resources that are currently available within the VA system must be made available. In this article, we present results of a national survey of cardiology services at VA facilities.
Methods
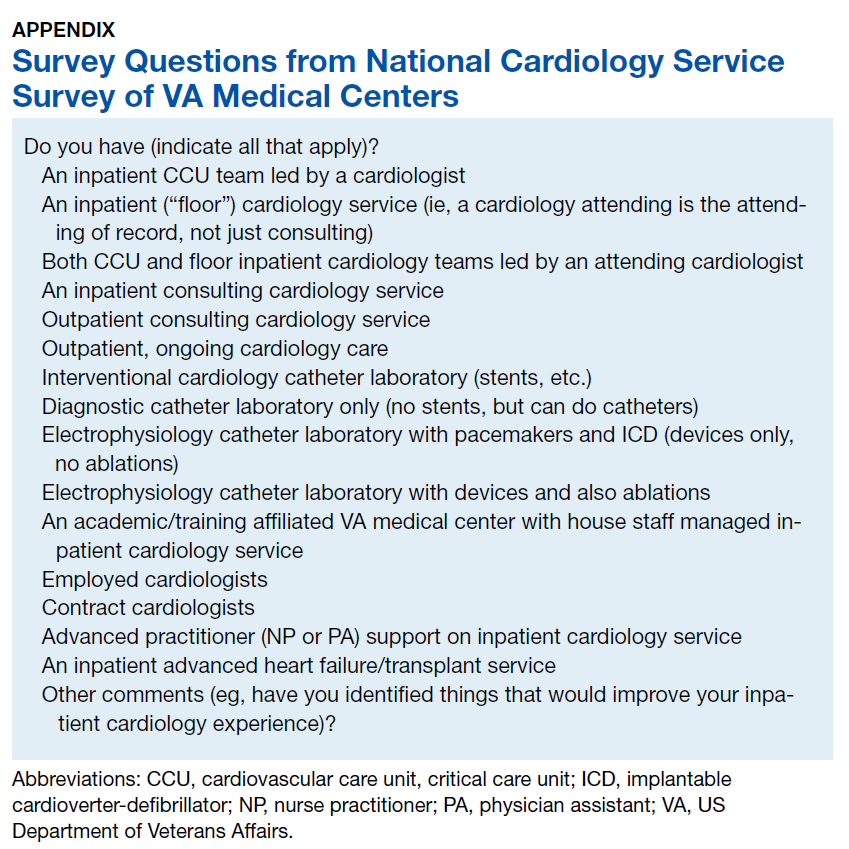
From February to March of 2017, we conducted a comprehensive nation-wide survey of all VA facilities to quantify the availability of cardiology services, excluding cardiothoracic surgical services. The survey questions are listed in the Appendix. The chief of medicine and the chief of cardiology were each e-mailed 3 times at every facility. If no response was received from a facility, we e-mailed the chief of staff 3 times. If there still was no response, the remaining facilities were contacted by phone and study authors (PE and WB) spoke to individuals directly regarding the structure of cardiology services at a facility. Responses were categorized by facility level of complexity. Complexity designation was determined by the VA Central Office (VACO)—level 1 facilities represent the most complex and level 3 facilities are the least complex. VACO also divides facility complexity into sublevels, for example level 1A facilities generally are associated with academic medical centers and provide the highest levels (tertiary or quaternary) of care.8
Results were coded according to a predetermined rubric for how cardiology services are structured (admitting service, consult service, inpatient, outpatient, other) and for how they were staffed (attending only, house staff, or advanced practice providers (APPs). After the first wave of surveys, 2 additional questions were added to the survey tool; these asked about employed vs contracted cardiologist and use of APPs. The results were tabulated and simple percentages calculated to express the prevalence of each structure and staffing model.
The study was reviewed and approved by the University of Utah/Salt Lake City VA Medical Center joint institutional review board and all authors completed human subjects research training.
Results
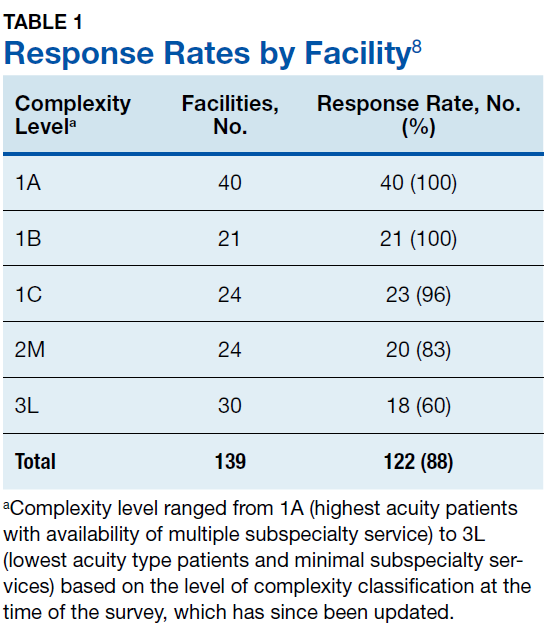
Study authors initially identified all 168 VA medical center facilities operating in 2017. Initial polling revealed that multiple facilities either were substations or had agreements for cardiology services from larger facilities, with 1 facility having 2 campuses with different levels of service at each. After adjusting for these nuances, the total number of potential respondents was 139. We obtained a response from 122 of the 139 facilities for an overall survey completion rate of 88%. Response rates varied by complexity level (Table 1). The survey received responses from all Level 1A and 1B facilities, 96% from Level 1C facilities; 83% (20/24) from level 2 facilities, and 62% (18/30) from level 3 facilities. (Please note that in the reference document providing detailed descriptions of the VA level of complexity has different numbers for each facility type given that there has been reassignments of the levels since our survey was completed.)8
We were specifically interested in inpatient cardiology services and whether facilities provided only consult services or inpatient services led by a cardiology attending. Having inpatient services does not exclude the availability of consult-liaison services (Table 2).
Higher complexity facilities (1A and 1B) were more likely to have dedicated, cardiology-led inpatient services, while lower complexity facilities relied on a cardiology consult service. Two-thirds of Level 3 facilities did not have inpatient cardiology services available.
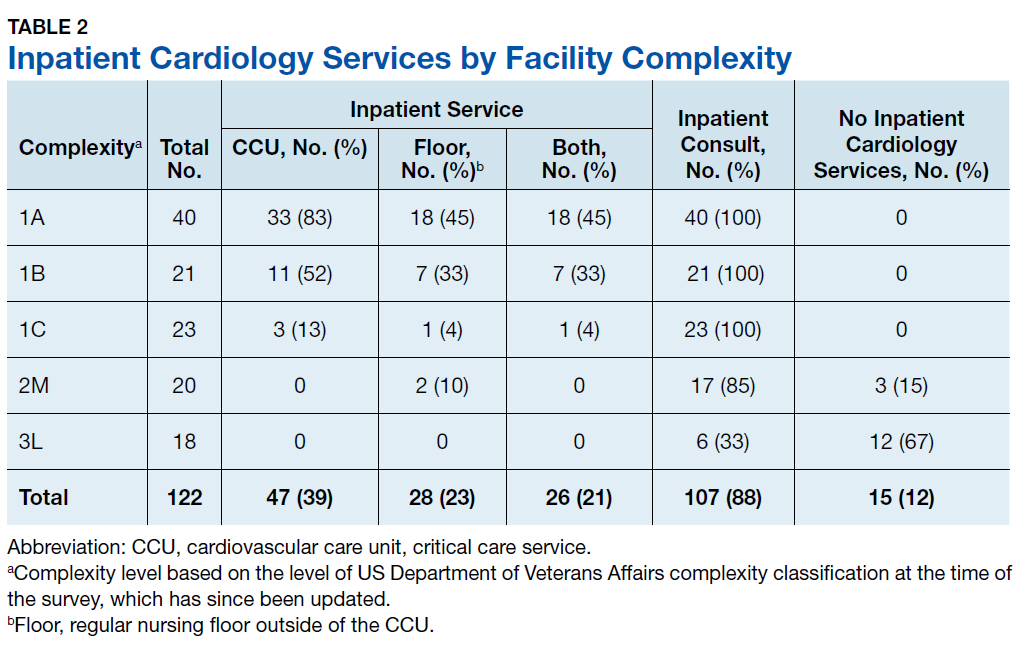
Dedicated cardiovascular care unit (CCU) teams were the most common inpatient service provided, present in more than half of all Level 1 facilities and 83% of Level 1A facilities (Table 3). Cardiology-led floor teams were available in 45% and 33% of level 1A and 1B facilities, respectively, but were much less common in Level 1C and Levels 2 and 3 facilities (4%, 10%, 0%, respectively). Only 31% of Level 1 facilities had both a CCU team and a cardiology-led inpatient floor team. Inpatient consulting cardiologists were commonly available at Levels 1 and 2 facilities; however, only 33% of Level 3 facilities had inpatient consulting cardiologists.
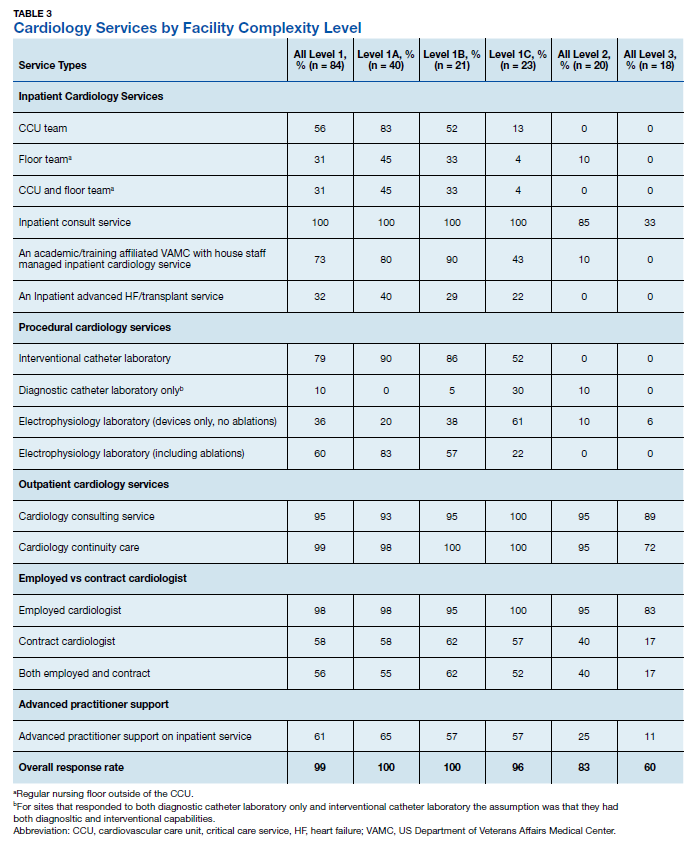
Housestaff-managed inpatient services, teams consisting of, but not limited to, medical residents in training, led by a cardiology attending were present in 73% of Level 1 facilities. Interestingly, Level 1B facilities were more likely to have housestaff-led services than were Level 1A facilities (90% and 80% respectively). Inpatient advanced heart failure services were less common and available only in Level 1 facilities. We did not survey the specific details of the other (eg, led by a noncardiology attending physician) models of inpatient cardiology care provided.
Cardiac catheterization (including interventional cardiology and electrophysiology [EP]) services, varied considerably. Ninety percent of Level 1A facilities offered interventional services, compared with only 52% of Level 1C facilities offered interventions. EP services were divided into simple (device only) and complex (ablations). As noted, complex EP services were more common in more complex facilities; for example, 10% of Level 2 facilities offered device placement but none had advanced EP services.
Outpatient services were widely available. Most facilities offered outpatient consultative cardiology services, ranging from 95% (Level 1) to 89% (Level 3) and outpatient cardiology continuity clinics 99% (Level 1) to 72% (Level 3).
Regardless of level of complexity, > 80% of facilities employed cardiologists. Many also used contract cardiologists. No facility utilized only contracted cardiologists. Use of nurse practitioners (NPs) and physician assistants (PAs) to assist with managing inpatient services was relatively common, with 61% of Level 1 facilities using such services.
Discussion
Studies of patient outcomes for various conditions, including cardiac conditions, in the 1990s found that when compared with non-VA health-care systems, patient outcomes in the VA were less favorable.9 During the late 1990s, the VA embraced quality and safety initiatives that have continued to the present time.9,10 Recent studies have found that, in most (but not all) cases, VA patient outcomes are as good as, and in many cases better, than are non-VA patient outcomes.1,10,11 The exact changes that have improved care are not clear, though studies of other health care systems have considered variation in services and costs in relationship to morbidity and mortality outcomes.12-14 In the context of better patient outcomes in VA hospitals, the present study provides insight into the cardiology services available at VA facilities throughout the nation.
Limitations
While this study provides background information that may be useful in comparing cardiology services between VA and non-VA systems, drawing causal relationships may not be warranted. For example, while the literature generally supports the concept of inpatient cardiology services led by an attending cardiologist, a substantial numbers of VA inpatient facilities have not yet adopted this model.4-6 Even among more complex, level 1 facilities, we found that only 31% offered both an inpatient CCU and floor team service led by an attending cardiologist physician. Thus, 69% of Level 1 facilities reported caring for patients with a primary cardiology problem through a noncardiology admitting services (with access to a cardiology consultation service). Additional studies should be conducted that would evaluate patient outcomes in relationship to the types of services available at a given VA medical center. Patient outcomes in relationship to service provision between the VA and non-VA health care systems also are warranted.
This study is limited by its reliance on self-reporting. Although we believe that we reached respondents who were qualified to complete the survey, the accuracy of reporting was not independently validated. Further, we asked questions about the most frequent models of cardiology care but may not have captured more novel methods. In trying to keep the survey time to < 2 minutes, we did not explore other details of cardiology services, such as the availability of a dedicated pharmacist, nor more advanced procedures such as transcatheter aortic valve replacement. Additionally, the present study is a snapshot of cardiology services for a given period, and, as noted above, did not look at patient outcomes. Further research is needed to determine which service provided is most beneficial or feasible in improving patient outcomes, which includes examining the various models of inpatient cardiology-led services for optimal care delivery.
Conclusion
Cardiology services were widely available throughout the VA system. However, the types of services available varied considerably. Predictably, facilities that were more complex generally had more advanced services available. Providing a general overview of how cardiovascular care is being delivered currently across VA systems helps to identify areas for optimization within VA facilities of various complexities with initiatives such as implementation of cardiology-led inpatient services, which may be beneficial in improving patient care outcomes as demonstrated previously in other large healthcare systems.
Acknowledgments
This material is the result of work supported with resources and use of the facilities at the George E. Wahlen Salt Lake City VA Medical Center. We are grateful to all of those who responded to our survey, and the support of the facility leadership. We are thankful for Tasia M. Nash and Tammy Jackson who helped to organize the data, and to Leigh Eleazer for her help in the manuscript preparation and formatting.
1. Nuti SV, Qin L, Rumsfeld JS, et al. Association of admission to Veterans Affairs hospitals vs non-veterans affairs hospitals with mortality and readmission rates among older men hospitalized with acute myocardial infarction, heart failure, or pneumonia. JAMA. 2016;315(6):582-592.
2. Blay E Jr, DeLancey JO, Hewitt DB, Chung JW, Bilimoria KY. Initial public reporting of quality at Veterans Affairs vs non-Veterans Affairs hospitals. JAMA Intern Med. 2017;177(6):882-885.
3. Hartz A, James PA. A systematic review of studies comparing myocardial infarction mortality for generalists and specialists: lessons for research and health policy. J Am Board Fam Med. 2006;19(3):291-302.
4. Driscoll A, Meagher S, Kennedy R, et al. What is the impact of systems of care for heart failure on patients diagnosed with heart failure: a systematic review. BMC Cardiovasc Disord. 2016;16(1):195.
5. Mitchell P, Marle D, Donkor A, et al; National Heart Failure Audit Steering Group. National heart failure audit: April 2013-March 2014. https://www.nicor.org.uk/wp-content/uploads/2019/02/hfannual13-14-updated.pdf. Published 2014. Accessed October 8, 2019.6. Mirvis DM, Graney MJ. Variations in the use of cardiac procedures in the Veterans Health Administration. Am Heart J. 1999;137(4 pt 1):706-713.
7. Wright SM, Petersen LA, Daley J. Availability of cardiac technology: trends in procedure use and outcomes for patients with acute myocardial infarction. Med Care Res Rev. 1998;55(2):239-254.
8. US Department of Veterans Affairs. Summary of VHA Facility Complexity Model. https://www.vendorportal.ecms.va.gov. [Nonpublic source, not verified]
9. Jha AK, Perlin JB, Kizer KW, Dudley RA. Effect of the transformation of the Veterans Affairs Health Care System on the quality of care. N Engl J Med. 2003;348(22):2218-2227.
10. Atkins D, Clancy C. Advancing high performance in Veterans Affairs health care. JAMA. 2017;318(19):1927-1928.
11. O’Hanlon C, Huang C, Sloss E, et al. Comparing VA and non-VA quality of care: a systematic review. J Gen Intern Med. 2017;32(1):105-121.
12. Stukel TA; Lucas FL, Wennberg DE. Long-term outcomes of regional variations in intensity of invasive vs medical management of medicare patients with acute myocardial infarction. JAMA. 2005;293(11):1329-1337.
13. Krumholz HM, Chen J, Rathore SS, Wang Y, Radford MJ. Regional variation in the treatment and outcomes of myocardial infarction: investigating New England’s advantage. Am Heart J. 2003;146(2):242-249.
14. Petersen LA, Normand SL, Leape LL, McNeil BJ. Regionalization and the underuse of angiography in the Veterans Affairs Health Care System as compared with a fee-for-service system. N Engl J Med. 2003;348(22):2209-2217.
The US Department of Veterans Affairs (VA) remains the largest integrated health care system in the US serving 9 million veterans. Two recent studies that compared 30-day mortality and readmission rates between VA and non-VA hospitals among older men with acute myocardial infarction (AMI), and heart failure (HF). The studies found that hospitalization at VA hospitals was associated with lower risk-standardized 30-day all-cause mortality rates for MI and HF when compared with hospitalization at non-VA hospitals.1,2
However, it is unknown whether the delivery of cardiovascular care is optimized in the VA system. For example, in comparisons between generalist-led hospitalized care for MI and HF, several studies have demonstrated that cardiology-led care has been associated with lower rates of mortality.3-5 Although data on the types of cardiac technology and use of cardiac procedures were described previously, we have not found detailed information on the types of inpatient cardiology services provided at VA medical centers nationwide.1,6,7 To develop further improvements in delivery of cardiovascular care within the VA, a better understanding of the types of resources that are currently available within the VA system must be made available. In this article, we present results of a national survey of cardiology services at VA facilities.
Methods
From February to March of 2017, we conducted a comprehensive nation-wide survey of all VA facilities to quantify the availability of cardiology services, excluding cardiothoracic surgical services. The survey questions are listed in the Appendix. The chief of medicine and the chief of cardiology were each e-mailed 3 times at every facility. If no response was received from a facility, we e-mailed the chief of staff 3 times. If there still was no response, the remaining facilities were contacted by phone and study authors (PE and WB) spoke to individuals directly regarding the structure of cardiology services at a facility. Responses were categorized by facility level of complexity. Complexity designation was determined by the VA Central Office (VACO)—level 1 facilities represent the most complex and level 3 facilities are the least complex. VACO also divides facility complexity into sublevels, for example level 1A facilities generally are associated with academic medical centers and provide the highest levels (tertiary or quaternary) of care.8
Results were coded according to a predetermined rubric for how cardiology services are structured (admitting service, consult service, inpatient, outpatient, other) and for how they were staffed (attending only, house staff, or advanced practice providers (APPs). After the first wave of surveys, 2 additional questions were added to the survey tool; these asked about employed vs contracted cardiologist and use of APPs. The results were tabulated and simple percentages calculated to express the prevalence of each structure and staffing model.
The study was reviewed and approved by the University of Utah/Salt Lake City VA Medical Center joint institutional review board and all authors completed human subjects research training.
Results
Study authors initially identified all 168 VA medical center facilities operating in 2017. Initial polling revealed that multiple facilities either were substations or had agreements for cardiology services from larger facilities, with 1 facility having 2 campuses with different levels of service at each. After adjusting for these nuances, the total number of potential respondents was 139. We obtained a response from 122 of the 139 facilities for an overall survey completion rate of 88%. Response rates varied by complexity level (Table 1). The survey received responses from all Level 1A and 1B facilities, 96% from Level 1C facilities; 83% (20/24) from level 2 facilities, and 62% (18/30) from level 3 facilities. (Please note that in the reference document providing detailed descriptions of the VA level of complexity has different numbers for each facility type given that there has been reassignments of the levels since our survey was completed.)8
We were specifically interested in inpatient cardiology services and whether facilities provided only consult services or inpatient services led by a cardiology attending. Having inpatient services does not exclude the availability of consult-liaison services (Table 2).
Higher complexity facilities (1A and 1B) were more likely to have dedicated, cardiology-led inpatient services, while lower complexity facilities relied on a cardiology consult service. Two-thirds of Level 3 facilities did not have inpatient cardiology services available.
Dedicated cardiovascular care unit (CCU) teams were the most common inpatient service provided, present in more than half of all Level 1 facilities and 83% of Level 1A facilities (Table 3). Cardiology-led floor teams were available in 45% and 33% of level 1A and 1B facilities, respectively, but were much less common in Level 1C and Levels 2 and 3 facilities (4%, 10%, 0%, respectively). Only 31% of Level 1 facilities had both a CCU team and a cardiology-led inpatient floor team. Inpatient consulting cardiologists were commonly available at Levels 1 and 2 facilities; however, only 33% of Level 3 facilities had inpatient consulting cardiologists.
Housestaff-managed inpatient services, teams consisting of, but not limited to, medical residents in training, led by a cardiology attending were present in 73% of Level 1 facilities. Interestingly, Level 1B facilities were more likely to have housestaff-led services than were Level 1A facilities (90% and 80% respectively). Inpatient advanced heart failure services were less common and available only in Level 1 facilities. We did not survey the specific details of the other (eg, led by a noncardiology attending physician) models of inpatient cardiology care provided.
Cardiac catheterization (including interventional cardiology and electrophysiology [EP]) services, varied considerably. Ninety percent of Level 1A facilities offered interventional services, compared with only 52% of Level 1C facilities offered interventions. EP services were divided into simple (device only) and complex (ablations). As noted, complex EP services were more common in more complex facilities; for example, 10% of Level 2 facilities offered device placement but none had advanced EP services.
Outpatient services were widely available. Most facilities offered outpatient consultative cardiology services, ranging from 95% (Level 1) to 89% (Level 3) and outpatient cardiology continuity clinics 99% (Level 1) to 72% (Level 3).
Regardless of level of complexity, > 80% of facilities employed cardiologists. Many also used contract cardiologists. No facility utilized only contracted cardiologists. Use of nurse practitioners (NPs) and physician assistants (PAs) to assist with managing inpatient services was relatively common, with 61% of Level 1 facilities using such services.
Discussion
Studies of patient outcomes for various conditions, including cardiac conditions, in the 1990s found that when compared with non-VA health-care systems, patient outcomes in the VA were less favorable.9 During the late 1990s, the VA embraced quality and safety initiatives that have continued to the present time.9,10 Recent studies have found that, in most (but not all) cases, VA patient outcomes are as good as, and in many cases better, than are non-VA patient outcomes.1,10,11 The exact changes that have improved care are not clear, though studies of other health care systems have considered variation in services and costs in relationship to morbidity and mortality outcomes.12-14 In the context of better patient outcomes in VA hospitals, the present study provides insight into the cardiology services available at VA facilities throughout the nation.
Limitations
While this study provides background information that may be useful in comparing cardiology services between VA and non-VA systems, drawing causal relationships may not be warranted. For example, while the literature generally supports the concept of inpatient cardiology services led by an attending cardiologist, a substantial numbers of VA inpatient facilities have not yet adopted this model.4-6 Even among more complex, level 1 facilities, we found that only 31% offered both an inpatient CCU and floor team service led by an attending cardiologist physician. Thus, 69% of Level 1 facilities reported caring for patients with a primary cardiology problem through a noncardiology admitting services (with access to a cardiology consultation service). Additional studies should be conducted that would evaluate patient outcomes in relationship to the types of services available at a given VA medical center. Patient outcomes in relationship to service provision between the VA and non-VA health care systems also are warranted.
This study is limited by its reliance on self-reporting. Although we believe that we reached respondents who were qualified to complete the survey, the accuracy of reporting was not independently validated. Further, we asked questions about the most frequent models of cardiology care but may not have captured more novel methods. In trying to keep the survey time to < 2 minutes, we did not explore other details of cardiology services, such as the availability of a dedicated pharmacist, nor more advanced procedures such as transcatheter aortic valve replacement. Additionally, the present study is a snapshot of cardiology services for a given period, and, as noted above, did not look at patient outcomes. Further research is needed to determine which service provided is most beneficial or feasible in improving patient outcomes, which includes examining the various models of inpatient cardiology-led services for optimal care delivery.
Conclusion
Cardiology services were widely available throughout the VA system. However, the types of services available varied considerably. Predictably, facilities that were more complex generally had more advanced services available. Providing a general overview of how cardiovascular care is being delivered currently across VA systems helps to identify areas for optimization within VA facilities of various complexities with initiatives such as implementation of cardiology-led inpatient services, which may be beneficial in improving patient care outcomes as demonstrated previously in other large healthcare systems.
Acknowledgments
This material is the result of work supported with resources and use of the facilities at the George E. Wahlen Salt Lake City VA Medical Center. We are grateful to all of those who responded to our survey, and the support of the facility leadership. We are thankful for Tasia M. Nash and Tammy Jackson who helped to organize the data, and to Leigh Eleazer for her help in the manuscript preparation and formatting.
1. Nuti SV, Qin L, Rumsfeld JS, et al. Association of admission to Veterans Affairs hospitals vs non-veterans affairs hospitals with mortality and readmission rates among older men hospitalized with acute myocardial infarction, heart failure, or pneumonia. JAMA. 2016;315(6):582-592.
2. Blay E Jr, DeLancey JO, Hewitt DB, Chung JW, Bilimoria KY. Initial public reporting of quality at Veterans Affairs vs non-Veterans Affairs hospitals. JAMA Intern Med. 2017;177(6):882-885.
3. Hartz A, James PA. A systematic review of studies comparing myocardial infarction mortality for generalists and specialists: lessons for research and health policy. J Am Board Fam Med. 2006;19(3):291-302.
4. Driscoll A, Meagher S, Kennedy R, et al. What is the impact of systems of care for heart failure on patients diagnosed with heart failure: a systematic review. BMC Cardiovasc Disord. 2016;16(1):195.
5. Mitchell P, Marle D, Donkor A, et al; National Heart Failure Audit Steering Group. National heart failure audit: April 2013-March 2014. https://www.nicor.org.uk/wp-content/uploads/2019/02/hfannual13-14-updated.pdf. Published 2014. Accessed October 8, 2019.6. Mirvis DM, Graney MJ. Variations in the use of cardiac procedures in the Veterans Health Administration. Am Heart J. 1999;137(4 pt 1):706-713.
7. Wright SM, Petersen LA, Daley J. Availability of cardiac technology: trends in procedure use and outcomes for patients with acute myocardial infarction. Med Care Res Rev. 1998;55(2):239-254.
8. US Department of Veterans Affairs. Summary of VHA Facility Complexity Model. https://www.vendorportal.ecms.va.gov. [Nonpublic source, not verified]
9. Jha AK, Perlin JB, Kizer KW, Dudley RA. Effect of the transformation of the Veterans Affairs Health Care System on the quality of care. N Engl J Med. 2003;348(22):2218-2227.
10. Atkins D, Clancy C. Advancing high performance in Veterans Affairs health care. JAMA. 2017;318(19):1927-1928.
11. O’Hanlon C, Huang C, Sloss E, et al. Comparing VA and non-VA quality of care: a systematic review. J Gen Intern Med. 2017;32(1):105-121.
12. Stukel TA; Lucas FL, Wennberg DE. Long-term outcomes of regional variations in intensity of invasive vs medical management of medicare patients with acute myocardial infarction. JAMA. 2005;293(11):1329-1337.
13. Krumholz HM, Chen J, Rathore SS, Wang Y, Radford MJ. Regional variation in the treatment and outcomes of myocardial infarction: investigating New England’s advantage. Am Heart J. 2003;146(2):242-249.
14. Petersen LA, Normand SL, Leape LL, McNeil BJ. Regionalization and the underuse of angiography in the Veterans Affairs Health Care System as compared with a fee-for-service system. N Engl J Med. 2003;348(22):2209-2217.
Decrease in Inpatient Telemetry Utilization Through a System-Wide Electronic Health Record Change and a Multifaceted Hospitalist Intervention
Wasteful care may account for between 21% and 34% of the United States’ $3.2 trillion in annual healthcare expenditures, making it a prime target for cost-saving initiatives.1,2 Telemetry is a target for value improvement strategies because telemetry is overutilized, rarely leads to a change in management, and has associated guidelines on appropriate use.3-10 Telemetry use has been a focus of the Joint Commission’s National Patient Safety Goals since 2014, and it is also a focus of the Society of Hospital Medicine’s Choosing Wisely® campaign.11-13
Previous initiatives have evaluated how changes to telemetry orders or education and feedback affect telemetry use. Few studies have compared a system-wide electronic health record (EHR) approach to a multifaceted intervention. In seeking to address this gap, we adapted published guidelines from the American Heart Association (AHA) and incorporated them into our EHR ordering process.3 Simultaneously, we implemented a multifaceted quality improvement initiative and compared this combined program’s effectiveness to that of the EHR approach alone.
METHODS
Study Design, Setting, and Population
We performed a 2-group observational pre- to postintervention study at University of Utah Health. Hospital encounters of patients 18 years and older who had at least 1 inpatient acute care, nonintensive care unit (ICU) room charge and an admission date between January 1, 2014, and July 31, 2016, were included. Patient encounters with missing encounter-level covariates, such as case mix index (CMI) or attending provider identification, were excluded. The Institutional Review Board classified this project as quality improvement and did not require review and oversight.
Intervention
On July 6, 2015, our Epic (Epic Systems Corporation, Madison, WI) EHR telemetry order was modified to discourage unnecessary telemetry monitoring. The new order required providers ordering telemetry to choose a clinical indication and select a duration for monitoring, after which the order would expire and require physician renewal or discontinuation. These were the only changes that occurred for nonhospitalist providers. The nonhospitalist group included all admitting providers who were not hospitalists. This group included neurology (6.98%); cardiology (8.13%); other medical specialties such as pulmonology, hematology, and oncology (21.30%); cardiothoracic surgery (3.72%); orthopedic surgery (14.84%); general surgery (11.11%); neurosurgery (11.07%); and other surgical specialties, including urology, transplant, vascular surgery, and plastics (16.68%).
Between January 2015 and June 2015, we implemented a multicomponent program among our hospitalist service. The hospitalist service is composed of 4 teams with internal medicine residents and 2 teams with advanced practice providers, all staffed by academic hospitalists. Our program was composed of 5 elements, all of which were made before the hospital-wide changes to electronic telemetry orders and maintained throughout the study period, as follows: (1) a single provider education session reviewing available evidence (eg, AHA guidelines, Choosing Wisely® campaign), (2) removal of the telemetry order from hospitalist admission order set on March 23, 2015, (3) inclusion of telemetry discussion in the hospitalist group’s daily “Rounding Checklist,”14 (4) monthly feedback provided as part of hospitalist group meetings, and (5) a financial incentive, awarded to the division (no individual provider payment) if performance targets were met. See supplementary Appendix (“Implementation Manual”) for further details.
Data Source
We obtained data on patient age, gender, Medicare Severity-Diagnosis Related Group, Charlson comorbidity index (CCI), CMI, admitting unit, attending physician, admission and discharge dates, length of stay (LOS), 30-day readmission, bed charge (telemetry or nontelemetry), ICU stay, and inpatient mortality from the enterprise data warehouse. Telemetry days were determined through room billing charges, which are assigned based on the presence or absence of an active telemetry order at midnight. Code events came from a log kept by the hospital telephone operator, who is responsible for sending out all calls to the code team. Code event data were available starting July 19, 2014.
Measures
Our primary outcome was the percentage of hospital days that had telemetry charges for individual patients. All billed telemetry days on acute care floors were included regardless of admission status (inpatient vs observation), service, indication, or ordering provider. Secondary outcomes were inpatient mortality, escalation of care, code event rates, and appropriate telemetry utilization rates. Escalation of care was defined as transfer to an ICU after initially being admitted to an acute care floor. The code event rate was defined as the ratio of the number of code team activations to the number of patient days. Appropriate telemetry utilization rates were determined via chart review, as detailed below.
In order to evaluate changes in appropriateness of telemetry monitoring, 4 of the authors who are internal medicine physicians (KE, CC, JC, DG) performed chart reviews of 25 randomly selected patients in each group (hospitalist and nonhospitalist) before and after the intervention who received at least 1 day of telemetry monitoring. Each reviewer was provided a key based on AHA guidelines for monitoring indications and associated maximum allowable durations.3 Chart reviews were performed to determine the indication (if any) for monitoring, as well as the number of days that were indicated. The number of indicated days was compared to the number of telemetry days the patient received to determine the overall proportion of days that were indicated (“Telemetry appropriateness per visit”). Three reviewers (KE, AR, CC) also evaluated 100 patients on the hospitalist service after the intervention who did not receive any telemetry monitoring to evaluate whether patients with indications for telemetry monitoring were not receiving it after the intervention. For patients who had a possible indication, the indication was classified as Class I (“Cardiac monitoring is indicated in most, if not all, patients in this group”) or Class II (“Cardiac monitoring may be of benefit in some patients but is not considered essential for all patients”).3
Adjustment Variables
To account for differences in patient characteristics between hospitalist and nonhospitalist groups, we included age, gender, CMI, and CCI in statistical models. CCI was calculated according to the algorithm specified by Quan et al.15 using all patient diagnoses from previous visits and the index visit identified from the facility billing system.
Statistical Analysis
We computed descriptive statistics for study outcomes and visit characteristics for hospitalist and nonhospitalist visits for pre- and postintervention periods. Descriptive statistics were expressed as n (%) for categorical patient characteristics and outcome variables. For continuous patient characteristics, we expressed the variability of individual observations as the mean ± the standard deviation. For continuous outcomes, we expressed the precision of the mean estimates using standard error. Telemetry utilization per visit was weighted by the number of total acute care days per visit. Telemetry appropriateness per visit was weighted by the number of telemetry days per visit. Patients who did not receive any telemetry monitoring were included in the analysis and noted to have 0 telemetry days. All patients had at least 1 acute care day. Categorical variables were compared using χ2 tests, and continuous variables were compared using t tests. Code event rates were compared using the binomial probability mid-p exact test for person-time data.16
We fitted generalized linear regression models using generalized estimating equations to evaluate the relative change in outcomes of interest in the postintervention period compared with the preintervention period after adjusting for study covariates. The models included study group (hospitalist and nonhospitalist), time period (pre- and postintervention), an interaction term between study group and time period, and study covariates (age, gender, CMI, and CCI). The models were defined using a binomial distributional assumption and logit link function for mortality, escalation of care, and whether patients had at least 1 telemetry day. A gamma distributional assumption and log link function were used for LOS, telemetry acute care days per visit, and total acute care days per visit. A negative binomial distributional assumption and log link function were used for telemetry utilization and telemetry appropriateness. We used the log of the acute care days as an offset for telemetry utilization and the log of the telemetry days per visit as an offset for telemetry appropriateness. An exchangeable working correlation matrix was used to account for physician-level clustering for all outcomes. Intervention effects, representing the difference in odds for categorical variables and in amount for continuous variables, were calculated as exponentiation of the beta parameters for the covariate minus 1.
P values <.05 were considered significant. We used SAS version 9.4 statistical software (SAS Institute Inc., Cary, NC) for data analysis.
RESULTS

The percent of patients who had any telemetry charges decreased from 36.2% to 15.9% (P < .001) in the hospitalist group and from 31.8% to 28.0% in the nonhospitalist group (P < .001; Table 1). Rates of code events did not change over time (P = .9).
In the randomly selected sample of patients pre- and postintervention who received telemetry monitoring, there was an increase in telemetry appropriateness on the hospitalist service (46% to 72%, P = .025; Table 1). In the nonhospitalist group, appropriate telemetry utilization did not change significantly. Of the 100 randomly selected patients in the hospitalist group after the intervention who did not receive telemetry, no patient had an AHA Class I indication, and only 4 patients had a Class II indication.3,17
DISCUSSION
In this study, implementing a change in the EHR telemetry order produced reductions in telemetry days. However, when combined with a multicomponent program including education, audit and feedback, financial incentives, and changes to remove telemetry orders from admission orders sets, an even more marked improvement was seen. Neither intervention reduced LOS, increased code event rates, or increased rates of escalation of care.
Prior studies have evaluated interventions to reduce unnecessary telemetry monitoring with varying degrees of success. The most successful EHR intervention to date, from Dressler et al.,18 achieved a 70% reduction in overall telemetry use by integrating the AHA guidelines into their EHR and incorporating nursing discontinuation guidelines to ensure that telemetry discontinuation was both safe and timely. Other studies using stewardship approaches and standardized protocols have been less successful.19,20 One study utilizing a multidisciplinary approach but not including an EHR component showed modest improvements in telemetry.21
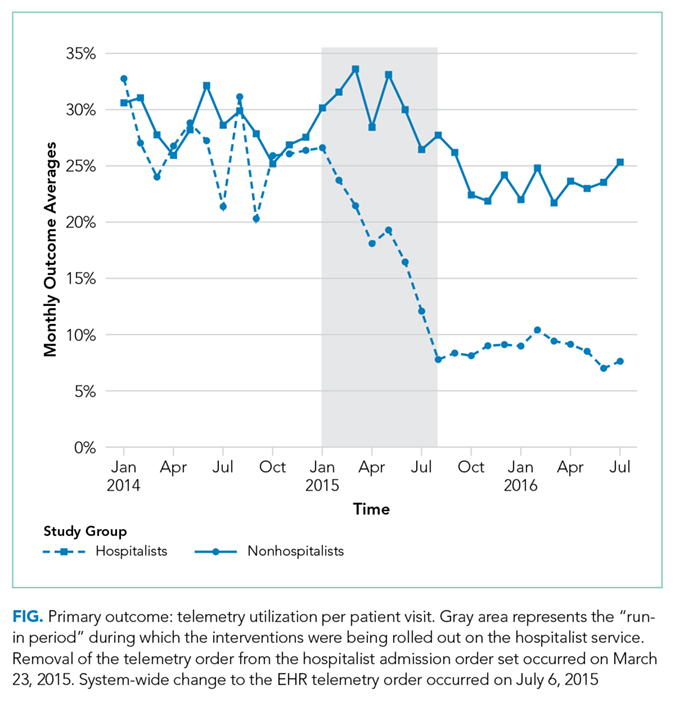
Although we are unable to differentiate the exact effect of each component of the intervention, we did note an immediate decrease in telemetry orders after removing the telemetry order from our admission order set, a trend that was magnified after the addition of broader EHR changes (Figure 1). Important additional contributors to our success seem to have been the standardization of rounds to include daily discussion of telemetry and the provision of routine feedback. We cannot discern whether other components of our program (such as the financial incentives) contributed more or less to our program, though the sum of these interventions produced an overall program that required substantial buy in and sustained focus from the hospitalist group. The importance of the hospitalist program is highlighted by the relatively large differences in improvement compared with the nonhospitalist group.
Our study has several limitations. First, the study was conducted at a single center, which may limit its generalizability. Second, the intervention was multifaceted, diminishing our ability to discern which aspects beyond the system-wide change in the telemetry order were most responsible for the observed effect among hospitalists. Third, we are unable to fully account for baseline differences in telemetry utilization between hospitalist and nonhospitalist groups. It is likely that different services utilize telemetry monitoring in different ways, and the hospitalist group may have been more aware of the existing guidelines for monitoring prior to the intervention. Furthermore, we had a limited sample size for the chart audits, which reduced the available statistical power for determining changes in the appropriateness of telemetry utilization. Additionally, because internal medicine residents rotate through various services, it is possible that the education they received on their hospitalist rotation as part of our intervention had a spillover effect in the nonhospitalist group. However, any effect should have decreased the difference between the groups. Lastly, although our postintervention time period was 1 year, we do not have data beyond that to monitor for sustainability of the results.
CONCLUSION
In this single-site study, combining EHR orders prompting physicians to choose a clinical indication and duration for monitoring with a broader program—including upstream changes in ordering as well as education, audit, and feedback—produced reductions in telemetry usage. Whether this reduction improves the appropriateness of telemetry utilization or reduces other effects of telemetry (eg, alert fatigue, calls for benign arrhythmias) cannot be discerned from our study. However, our results support the idea that multipronged approaches to telemetry use are most likely to produce improvements.
Acknowledgments
The authors thank Dr. Frank Thomas for his assistance with process engineering and Mr. Andrew Wood for his routine provision of data. The statistical analysis was supported by the University of Utah Study Design and Biostatistics Center, with funding in part from the National Center for Research Resources and the National Center for Advancing Translational Sciences, National Institutes of Health, through Grant 5UL1TR001067-05 (formerly 8UL1TR000105 and UL1RR025764).
Disclosure
The authors have no conflicts of interest to report.
1. National Health Expenditure Fact Sheet. 2015; https://www.cms.gov/Research-Statistics-Data-and-Systems/Statistics-Trends-and-Reports/NationalHealthExpendData/NHE-Fact-Sheet.html. Accessed June 27, 2017.
2. Berwick DM, Hackbarth AD. Eliminating waste in US health care. JAMA. 2012;307(14):1513-1516. PubMed
3. Drew BJ, Califf RM, Funk M, et al. Practice standards for electrocardiographic monitoring in hospital settings: an American Heart Association scientific statement from the Councils on Cardiovascular Nursing, Clinical Cardiology, and Cardiovascular Disease in the Young: endorsed by the International Society of Computerized Electrocardiology and the American Association of Critical-Care Nurses. Circulation. 2004;110(17):2721-2746. PubMed
4. Sandau KE, Funk M, Auerbach A, et al. Update to Practice Standards for Electrocardiographic Monitoring in Hospital Settings: A Scientific Statement From the American Heart Association. Circulation. 2017;136(19):e273-e344. PubMed
5. Mohammad R, Shah S, Donath E, et al. Non-critical care telemetry and in-hospital cardiac arrest outcomes. J Electrocardiol. 2015;48(3):426-429. PubMed
6. Dhillon SK, Rachko M, Hanon S, Schweitzer P, Bergmann SR. Telemetry monitoring guidelines for efficient and safe delivery of cardiac rhythm monitoring to noncritical hospital inpatients. Crit Pathw Cardiol. 2009;8(3):125-126. PubMed
7. Estrada CA, Rosman HS, Prasad NK, et al. Evaluation of guidelines for the use of telemetry in the non-intensive-care setting. J Gen Intern Med. 2000;15(1):51-55. PubMed
8. Estrada CA, Prasad NK, Rosman HS, Young MJ. Outcomes of patients hospitalized to a telemetry unit. Am J Cardiol. 1994;74(4):357-362. PubMed
9. Atzema C, Schull MJ, Borgundvaag B, Slaughter GR, Lee CK. ALARMED: adverse events in low-risk patients with chest pain receiving continuous electrocardiographic monitoring in the emergency department. A pilot study. Am J Emerg Med. 2006;24(1):62-67. PubMed
10. Schull MJ, Redelmeier DA. Continuous electrocardiographic monitoring and cardiac arrest outcomes in 8,932 telemetry ward patients. Acad Emerg Med. 2000;7(6):647-652. PubMed
11. The Joint Commission 2017 National Patient Safety Goals https://www.jointcommission.org/hap_2017_npsgs/. Accessed on February 15, 2017.
12. Joint Commission on Accreditation of Healthcare Organizations. The Joint Commission announces 2014 National Patient Safety Goal. Jt Comm Perspect. 2013;33(7):1, 3-4. PubMed
13. Bulger J, Nickel W, Messler J, et al. Choosing wisely in adult hospital medicine: five opportunities for improved healthcare value. J Hosp Med. 2013;8(9):486-492. PubMed
14. Yarbrough PM, Kukhareva PV, Horton D, Edholm K, Kawamoto K. Multifaceted intervention including education, rounding checklist implementation, cost feedback, and financial incentives reduces inpatient laboratory costs. J Hosp Med. 2016;11(5):348-354. PubMed
15. Quan H, Li B, Couris CM, et al. Updating and validating the Charlson comorbidity index and score for risk adjustment in hospital discharge abstracts using data from 6 countries. Am J Epidemiol. 2011;173(6):676-682. PubMed
16. Greenland S, Rothman KJ. Introduction to categorical statistics In: Rothman KJ, Greenland S, Lash TL, eds. Modern Epidemiology. Vol 3. Philadelphia, PA: Lippincott Williams & Wilkins; 2008: 238-257.
17. Henriques-Forsythe MN, Ivonye CC, Jamched U, Kamuguisha LK, Olejeme KA, Onwuanyi AE. Is telemetry overused? Is it as helpful as thought? Cleve Clin J Med. 2009;76(6):368-372. PubMed
18. Dressler R, Dryer MM, Coletti C, Mahoney D, Doorey AJ. Altering overuse of cardiac telemetry in non-intensive care unit settings by hardwiring the use of American Heart Association guidelines. JAMA Intern Med. 2014;174(11):1852-1854. PubMed
19. Boggan JC, Navar-Boggan AM, Patel V, Schulteis RD, Simel DL. Reductions in telemetry order duration do not reduce telemetry utilization. J Hosp Med. 2014;9(12):795-796. PubMed
20. Cantillon DJ, Loy M, Burkle A, et al. Association Between Off-site Central Monitoring Using Standardized Cardiac Telemetry and Clinical Outcomes Among Non-Critically Ill Patients. JAMA. 2016;316(5):519-524. PubMed
21. Svec D, Ahuja N, Evans KH, et al. Hospitalist intervention for appropriate use of telemetry reduces length of stay and cost. J Hosp Med. 2015;10(9):627-632. PubMed
Wasteful care may account for between 21% and 34% of the United States’ $3.2 trillion in annual healthcare expenditures, making it a prime target for cost-saving initiatives.1,2 Telemetry is a target for value improvement strategies because telemetry is overutilized, rarely leads to a change in management, and has associated guidelines on appropriate use.3-10 Telemetry use has been a focus of the Joint Commission’s National Patient Safety Goals since 2014, and it is also a focus of the Society of Hospital Medicine’s Choosing Wisely® campaign.11-13
Previous initiatives have evaluated how changes to telemetry orders or education and feedback affect telemetry use. Few studies have compared a system-wide electronic health record (EHR) approach to a multifaceted intervention. In seeking to address this gap, we adapted published guidelines from the American Heart Association (AHA) and incorporated them into our EHR ordering process.3 Simultaneously, we implemented a multifaceted quality improvement initiative and compared this combined program’s effectiveness to that of the EHR approach alone.
METHODS
Study Design, Setting, and Population
We performed a 2-group observational pre- to postintervention study at University of Utah Health. Hospital encounters of patients 18 years and older who had at least 1 inpatient acute care, nonintensive care unit (ICU) room charge and an admission date between January 1, 2014, and July 31, 2016, were included. Patient encounters with missing encounter-level covariates, such as case mix index (CMI) or attending provider identification, were excluded. The Institutional Review Board classified this project as quality improvement and did not require review and oversight.
Intervention
On July 6, 2015, our Epic (Epic Systems Corporation, Madison, WI) EHR telemetry order was modified to discourage unnecessary telemetry monitoring. The new order required providers ordering telemetry to choose a clinical indication and select a duration for monitoring, after which the order would expire and require physician renewal or discontinuation. These were the only changes that occurred for nonhospitalist providers. The nonhospitalist group included all admitting providers who were not hospitalists. This group included neurology (6.98%); cardiology (8.13%); other medical specialties such as pulmonology, hematology, and oncology (21.30%); cardiothoracic surgery (3.72%); orthopedic surgery (14.84%); general surgery (11.11%); neurosurgery (11.07%); and other surgical specialties, including urology, transplant, vascular surgery, and plastics (16.68%).
Between January 2015 and June 2015, we implemented a multicomponent program among our hospitalist service. The hospitalist service is composed of 4 teams with internal medicine residents and 2 teams with advanced practice providers, all staffed by academic hospitalists. Our program was composed of 5 elements, all of which were made before the hospital-wide changes to electronic telemetry orders and maintained throughout the study period, as follows: (1) a single provider education session reviewing available evidence (eg, AHA guidelines, Choosing Wisely® campaign), (2) removal of the telemetry order from hospitalist admission order set on March 23, 2015, (3) inclusion of telemetry discussion in the hospitalist group’s daily “Rounding Checklist,”14 (4) monthly feedback provided as part of hospitalist group meetings, and (5) a financial incentive, awarded to the division (no individual provider payment) if performance targets were met. See supplementary Appendix (“Implementation Manual”) for further details.
Data Source
We obtained data on patient age, gender, Medicare Severity-Diagnosis Related Group, Charlson comorbidity index (CCI), CMI, admitting unit, attending physician, admission and discharge dates, length of stay (LOS), 30-day readmission, bed charge (telemetry or nontelemetry), ICU stay, and inpatient mortality from the enterprise data warehouse. Telemetry days were determined through room billing charges, which are assigned based on the presence or absence of an active telemetry order at midnight. Code events came from a log kept by the hospital telephone operator, who is responsible for sending out all calls to the code team. Code event data were available starting July 19, 2014.
Measures
Our primary outcome was the percentage of hospital days that had telemetry charges for individual patients. All billed telemetry days on acute care floors were included regardless of admission status (inpatient vs observation), service, indication, or ordering provider. Secondary outcomes were inpatient mortality, escalation of care, code event rates, and appropriate telemetry utilization rates. Escalation of care was defined as transfer to an ICU after initially being admitted to an acute care floor. The code event rate was defined as the ratio of the number of code team activations to the number of patient days. Appropriate telemetry utilization rates were determined via chart review, as detailed below.
In order to evaluate changes in appropriateness of telemetry monitoring, 4 of the authors who are internal medicine physicians (KE, CC, JC, DG) performed chart reviews of 25 randomly selected patients in each group (hospitalist and nonhospitalist) before and after the intervention who received at least 1 day of telemetry monitoring. Each reviewer was provided a key based on AHA guidelines for monitoring indications and associated maximum allowable durations.3 Chart reviews were performed to determine the indication (if any) for monitoring, as well as the number of days that were indicated. The number of indicated days was compared to the number of telemetry days the patient received to determine the overall proportion of days that were indicated (“Telemetry appropriateness per visit”). Three reviewers (KE, AR, CC) also evaluated 100 patients on the hospitalist service after the intervention who did not receive any telemetry monitoring to evaluate whether patients with indications for telemetry monitoring were not receiving it after the intervention. For patients who had a possible indication, the indication was classified as Class I (“Cardiac monitoring is indicated in most, if not all, patients in this group”) or Class II (“Cardiac monitoring may be of benefit in some patients but is not considered essential for all patients”).3
Adjustment Variables
To account for differences in patient characteristics between hospitalist and nonhospitalist groups, we included age, gender, CMI, and CCI in statistical models. CCI was calculated according to the algorithm specified by Quan et al.15 using all patient diagnoses from previous visits and the index visit identified from the facility billing system.
Statistical Analysis
We computed descriptive statistics for study outcomes and visit characteristics for hospitalist and nonhospitalist visits for pre- and postintervention periods. Descriptive statistics were expressed as n (%) for categorical patient characteristics and outcome variables. For continuous patient characteristics, we expressed the variability of individual observations as the mean ± the standard deviation. For continuous outcomes, we expressed the precision of the mean estimates using standard error. Telemetry utilization per visit was weighted by the number of total acute care days per visit. Telemetry appropriateness per visit was weighted by the number of telemetry days per visit. Patients who did not receive any telemetry monitoring were included in the analysis and noted to have 0 telemetry days. All patients had at least 1 acute care day. Categorical variables were compared using χ2 tests, and continuous variables were compared using t tests. Code event rates were compared using the binomial probability mid-p exact test for person-time data.16
We fitted generalized linear regression models using generalized estimating equations to evaluate the relative change in outcomes of interest in the postintervention period compared with the preintervention period after adjusting for study covariates. The models included study group (hospitalist and nonhospitalist), time period (pre- and postintervention), an interaction term between study group and time period, and study covariates (age, gender, CMI, and CCI). The models were defined using a binomial distributional assumption and logit link function for mortality, escalation of care, and whether patients had at least 1 telemetry day. A gamma distributional assumption and log link function were used for LOS, telemetry acute care days per visit, and total acute care days per visit. A negative binomial distributional assumption and log link function were used for telemetry utilization and telemetry appropriateness. We used the log of the acute care days as an offset for telemetry utilization and the log of the telemetry days per visit as an offset for telemetry appropriateness. An exchangeable working correlation matrix was used to account for physician-level clustering for all outcomes. Intervention effects, representing the difference in odds for categorical variables and in amount for continuous variables, were calculated as exponentiation of the beta parameters for the covariate minus 1.
P values <.05 were considered significant. We used SAS version 9.4 statistical software (SAS Institute Inc., Cary, NC) for data analysis.
RESULTS
The percent of patients who had any telemetry charges decreased from 36.2% to 15.9% (P < .001) in the hospitalist group and from 31.8% to 28.0% in the nonhospitalist group (P < .001; Table 1). Rates of code events did not change over time (P = .9).
In the randomly selected sample of patients pre- and postintervention who received telemetry monitoring, there was an increase in telemetry appropriateness on the hospitalist service (46% to 72%, P = .025; Table 1). In the nonhospitalist group, appropriate telemetry utilization did not change significantly. Of the 100 randomly selected patients in the hospitalist group after the intervention who did not receive telemetry, no patient had an AHA Class I indication, and only 4 patients had a Class II indication.3,17
DISCUSSION
In this study, implementing a change in the EHR telemetry order produced reductions in telemetry days. However, when combined with a multicomponent program including education, audit and feedback, financial incentives, and changes to remove telemetry orders from admission orders sets, an even more marked improvement was seen. Neither intervention reduced LOS, increased code event rates, or increased rates of escalation of care.
Prior studies have evaluated interventions to reduce unnecessary telemetry monitoring with varying degrees of success. The most successful EHR intervention to date, from Dressler et al.,18 achieved a 70% reduction in overall telemetry use by integrating the AHA guidelines into their EHR and incorporating nursing discontinuation guidelines to ensure that telemetry discontinuation was both safe and timely. Other studies using stewardship approaches and standardized protocols have been less successful.19,20 One study utilizing a multidisciplinary approach but not including an EHR component showed modest improvements in telemetry.21
Although we are unable to differentiate the exact effect of each component of the intervention, we did note an immediate decrease in telemetry orders after removing the telemetry order from our admission order set, a trend that was magnified after the addition of broader EHR changes (Figure 1). Important additional contributors to our success seem to have been the standardization of rounds to include daily discussion of telemetry and the provision of routine feedback. We cannot discern whether other components of our program (such as the financial incentives) contributed more or less to our program, though the sum of these interventions produced an overall program that required substantial buy in and sustained focus from the hospitalist group. The importance of the hospitalist program is highlighted by the relatively large differences in improvement compared with the nonhospitalist group.
Our study has several limitations. First, the study was conducted at a single center, which may limit its generalizability. Second, the intervention was multifaceted, diminishing our ability to discern which aspects beyond the system-wide change in the telemetry order were most responsible for the observed effect among hospitalists. Third, we are unable to fully account for baseline differences in telemetry utilization between hospitalist and nonhospitalist groups. It is likely that different services utilize telemetry monitoring in different ways, and the hospitalist group may have been more aware of the existing guidelines for monitoring prior to the intervention. Furthermore, we had a limited sample size for the chart audits, which reduced the available statistical power for determining changes in the appropriateness of telemetry utilization. Additionally, because internal medicine residents rotate through various services, it is possible that the education they received on their hospitalist rotation as part of our intervention had a spillover effect in the nonhospitalist group. However, any effect should have decreased the difference between the groups. Lastly, although our postintervention time period was 1 year, we do not have data beyond that to monitor for sustainability of the results.
CONCLUSION
In this single-site study, combining EHR orders prompting physicians to choose a clinical indication and duration for monitoring with a broader program—including upstream changes in ordering as well as education, audit, and feedback—produced reductions in telemetry usage. Whether this reduction improves the appropriateness of telemetry utilization or reduces other effects of telemetry (eg, alert fatigue, calls for benign arrhythmias) cannot be discerned from our study. However, our results support the idea that multipronged approaches to telemetry use are most likely to produce improvements.
Acknowledgments
The authors thank Dr. Frank Thomas for his assistance with process engineering and Mr. Andrew Wood for his routine provision of data. The statistical analysis was supported by the University of Utah Study Design and Biostatistics Center, with funding in part from the National Center for Research Resources and the National Center for Advancing Translational Sciences, National Institutes of Health, through Grant 5UL1TR001067-05 (formerly 8UL1TR000105 and UL1RR025764).
Disclosure
The authors have no conflicts of interest to report.
1. National Health Expenditure Fact Sheet. 2015; https://www.cms.gov/Research-Statistics-Data-and-Systems/Statistics-Trends-and-Reports/NationalHealthExpendData/NHE-Fact-Sheet.html. Accessed June 27, 2017.
2. Berwick DM, Hackbarth AD. Eliminating waste in US health care. JAMA. 2012;307(14):1513-1516. PubMed
3. Drew BJ, Califf RM, Funk M, et al. Practice standards for electrocardiographic monitoring in hospital settings: an American Heart Association scientific statement from the Councils on Cardiovascular Nursing, Clinical Cardiology, and Cardiovascular Disease in the Young: endorsed by the International Society of Computerized Electrocardiology and the American Association of Critical-Care Nurses. Circulation. 2004;110(17):2721-2746. PubMed
4. Sandau KE, Funk M, Auerbach A, et al. Update to Practice Standards for Electrocardiographic Monitoring in Hospital Settings: A Scientific Statement From the American Heart Association. Circulation. 2017;136(19):e273-e344. PubMed
5. Mohammad R, Shah S, Donath E, et al. Non-critical care telemetry and in-hospital cardiac arrest outcomes. J Electrocardiol. 2015;48(3):426-429. PubMed
6. Dhillon SK, Rachko M, Hanon S, Schweitzer P, Bergmann SR. Telemetry monitoring guidelines for efficient and safe delivery of cardiac rhythm monitoring to noncritical hospital inpatients. Crit Pathw Cardiol. 2009;8(3):125-126. PubMed
7. Estrada CA, Rosman HS, Prasad NK, et al. Evaluation of guidelines for the use of telemetry in the non-intensive-care setting. J Gen Intern Med. 2000;15(1):51-55. PubMed
8. Estrada CA, Prasad NK, Rosman HS, Young MJ. Outcomes of patients hospitalized to a telemetry unit. Am J Cardiol. 1994;74(4):357-362. PubMed
9. Atzema C, Schull MJ, Borgundvaag B, Slaughter GR, Lee CK. ALARMED: adverse events in low-risk patients with chest pain receiving continuous electrocardiographic monitoring in the emergency department. A pilot study. Am J Emerg Med. 2006;24(1):62-67. PubMed
10. Schull MJ, Redelmeier DA. Continuous electrocardiographic monitoring and cardiac arrest outcomes in 8,932 telemetry ward patients. Acad Emerg Med. 2000;7(6):647-652. PubMed
11. The Joint Commission 2017 National Patient Safety Goals https://www.jointcommission.org/hap_2017_npsgs/. Accessed on February 15, 2017.
12. Joint Commission on Accreditation of Healthcare Organizations. The Joint Commission announces 2014 National Patient Safety Goal. Jt Comm Perspect. 2013;33(7):1, 3-4. PubMed
13. Bulger J, Nickel W, Messler J, et al. Choosing wisely in adult hospital medicine: five opportunities for improved healthcare value. J Hosp Med. 2013;8(9):486-492. PubMed
14. Yarbrough PM, Kukhareva PV, Horton D, Edholm K, Kawamoto K. Multifaceted intervention including education, rounding checklist implementation, cost feedback, and financial incentives reduces inpatient laboratory costs. J Hosp Med. 2016;11(5):348-354. PubMed
15. Quan H, Li B, Couris CM, et al. Updating and validating the Charlson comorbidity index and score for risk adjustment in hospital discharge abstracts using data from 6 countries. Am J Epidemiol. 2011;173(6):676-682. PubMed
16. Greenland S, Rothman KJ. Introduction to categorical statistics In: Rothman KJ, Greenland S, Lash TL, eds. Modern Epidemiology. Vol 3. Philadelphia, PA: Lippincott Williams & Wilkins; 2008: 238-257.
17. Henriques-Forsythe MN, Ivonye CC, Jamched U, Kamuguisha LK, Olejeme KA, Onwuanyi AE. Is telemetry overused? Is it as helpful as thought? Cleve Clin J Med. 2009;76(6):368-372. PubMed
18. Dressler R, Dryer MM, Coletti C, Mahoney D, Doorey AJ. Altering overuse of cardiac telemetry in non-intensive care unit settings by hardwiring the use of American Heart Association guidelines. JAMA Intern Med. 2014;174(11):1852-1854. PubMed
19. Boggan JC, Navar-Boggan AM, Patel V, Schulteis RD, Simel DL. Reductions in telemetry order duration do not reduce telemetry utilization. J Hosp Med. 2014;9(12):795-796. PubMed
20. Cantillon DJ, Loy M, Burkle A, et al. Association Between Off-site Central Monitoring Using Standardized Cardiac Telemetry and Clinical Outcomes Among Non-Critically Ill Patients. JAMA. 2016;316(5):519-524. PubMed
21. Svec D, Ahuja N, Evans KH, et al. Hospitalist intervention for appropriate use of telemetry reduces length of stay and cost. J Hosp Med. 2015;10(9):627-632. PubMed
© 2018 Society of Hospital Medicine