User login
Recent reports have drawn attention to the high and increasing rates of opioid prescribing and overdose‐related deaths in the United States.[1, 2, 3, 4, 5, 6, 7, 8, 9] These studies have focused on community‐based and emergency department prescribing, leaving prescribing practices in the inpatient setting unexamined. Given that pain is a frequent complaint in hospitalized patients, and that the Joint Commission mandates assessing pain as a vital sign, hospitalization is potentially a time of heightened use of such medications and could significantly contribute to nosocomial complications and subsequent outpatient use.[10] Variation in prescribing practices, unrelated to patient characteristics, could be a marker of inappropriate prescribing practices and poor quality of care.
Using a large, nationally representative cohort of admissions from July 2009 to June 2010, we sought to determine patterns and predictors of opioid utilization in nonsurgical admissions to US medical centers, hospital variation in use, and the association between hospital‐level use and the risk of opioid‐related adverse events. We hypothesized that hospitals with higher rates of opioid use would have an increased risk of an opioid‐related adverse event per patient exposed.
METHODS
Setting and Patients
We conducted a retrospective cohort study using data from 286 US nonfederal acute‐care facilities contributing to the database maintained by Premier (Premier Healthcare Solutions, Inc., Charlotte, NC). This database, created to measure healthcare utilization and quality of care, is drawn from voluntarily participating hospitals and contains data on approximately 1 in every 4 discharges nationwide.[11] Participating hospitals are similar in geographic distribution and metropolitan (urban/rural) status to hospitals nationwide, although large, nonteaching hospitals are slightly overrepresented in Premier. The database contains patient demographics, International Classification of Diseases, Ninth Revision, Clinical Modification (ICD‐9‐CM) codes, hospital demographics, and a date‐stamped log of all charges during the course of each hospitalization, including diagnostic tests, therapeutic treatments, and medications with dose and route of administration. The study was approved by the institutional review board at Beth Israel Deaconess Medical Center and granted a waiver of informed consent.
We studied a cohort of all adult nonsurgical admissions to participating hospitals from July 1, 2009, through June 30, 2010. We chose to study nonsurgical admissions, as patients undergoing surgical procedures have a clear indication for, and almost always receive, opioid pain medications. We defined a nonsurgical admission as an admission in which there were no charges for operating‐room procedures (including labor and delivery) and the attending of record was not a surgeon. We excluded admissions with unknown gender, since this is a key demographic variable, and admissions with a length of stay greater than 365 days, as these admissions are not representative of the typical admission to an acute‐care hospital. At the hospital level, we excluded hospitals contributing <100 admissions owing to resultant lack of precision in corresponding hospital prescribing rates, and hospitals that did not prescribe the full range of opioid medications (these hospitals had charges for codeine only), as these facilities seemed likely to have unusual limitations on prescribing or incomplete data capture.
Opioid Exposure
We defined opioid exposure as presence of 1 charge for an opioid medication during the admission. Opioid medications included morphine, hydrocodone, hydromorphone, oxycodone, fentanyl, meperidine, methadone, codeine, tramadol, buprenorphine, levorphanol, oxymorphone, pentazocine, propoxyphene, tapentadol, butorphanol, dezocine, and nalbuphine. We grouped the last 9 into an other category owing to infrequent use and/or differing characteristics from the main opioid drug types, such as synthetic, semisynthetic, and partial agonist qualities.
Severe Opioid‐Related Adverse Events
We defined severe opioid‐related adverse events as either naloxone exposure or an opioid‐related adverse drug event diagnosis code. Naloxone use in an adult patient exposed to opioids is one of the Institute for Healthcare Improvement's Trigger Tools for identifying adverse drug events[12] and previously has been demonstrated to have high positive predictive value for a confirmed adverse drug event.[13] We defined naloxone exposure as presence of 1 charge for naloxone. We excluded charges on hospital day 1 to focus on nosocomial events. We defined opioid‐related adverse drug events using ICD‐9‐CM diagnosis codes for poisoning by opioids (overdose, wrong substance given, or taken in error; ICD‐9‐CM 965.02, 965.09, E850.1, E850.2) and drugs causing adverse effects in therapeutic use (ICD‐9‐CM E935.1, E935.2), as specified in prior analyses by the Agency for Healthcare Research and Quality (AHRQ).[14, 15] To avoid capturing adverse events associated with outpatient use, we required the ICD‐9‐CM code to be qualified as not present on admission using the present on admission indicator required by the Centers for Medicare and Medicaid Services for all discharge diagnosis codes since 2008.[16]
Covariates of Interest
We were interested in the relationship between both patient and hospital characteristics and opioid exposure. Patient characteristics of interest included (1) demographic variables, such as age, sex, race (self‐reported by patients at the time of admission), marital status, and payer; (2) whether or not the patient spent any time in the intensive care unit (ICU); (3) comorbidities, identified via ICD‐9‐CM secondary diagnosis codes and diagnosis‐related groups using Healthcare Cost and Utilization Project Comorbidity Software, version 3.7, based on the work of Elixhauser et al[17, 18]; (4) primary ICD‐9‐CM discharge diagnosis groupings, selected based on hypothesized associations with receipt of opioids, and based on the Clinical Classifications Software (CCS)a diagnosis and procedure categorization scheme maintained by the AHRQ, and defined in the Appendix[19]; (5) and nonoperating‐room‐based procedures potentially necessitating opioids during the admission, selected from the 50 most common ICD‐9‐CM procedure codes in our cohort and grouped as cardiovascular procedures (catheterization and insertion of vascular stents), gastrointestinal procedures (upper and lower endoscopy), and mechanical ventilation, further defined in the Appendix. Hospital characteristics of interest included number of beds, population served (urban vs rural), teaching status, and US census region (Northeast, Midwest, South, West).
Statistical Analysis
We calculated the percent of admissions with exposure to any opioid and the percent exposed to each opioid, along with the total number of different opioid medications used during each admission. We also calculated the percent of admissions with parenteral administration and the percent of admissions with oral administration, among those exposed to the individual categories, and in aggregate. Because medications after discharge were unavailable in Premier's dataset, we report the percent of patients with a charge for opioids on the day of discharge.
We determined the daily dose of an opioid by taking the sum of the doses for that opioid charged on a given day. The average daily dose of an opioid was determined by taking the sum of the daily doses and dividing by the number of days on which 1 dose was charged. To facilitate comparison, all opioids, with the exception of those for which standard equivalences are unavailable (tramadol, other opioid category, oral fentanyl, epidural route for all), were converted to oral morphine equivalents using a standard equivalence conversion table.[20, 21] We excluded from our dosage calculations those charges for which standard morphine equivalence was unavailable, or for which dosage was missing. We also excluded from our dosage calculations any dose that was >3 standard deviations (SD) above the mean dose for that opioid, as such extreme values seemed physiologically implausible and more likely to be a data entry error that could lead to significant overestimation of the mean for that opioid.
All multivariable models used a generalized estimating equation (GEE) via the genmod procedure in SAS, with a Poisson distribution error term and a log link, controlling for repeated patient admissions with an autoregressive correlation structure.
To identify independent predictors of opioid receipt, we used a GEE model of opioid receipt where all patient and hospital characteristics listed in Table 1 were included as independent variables.
| Patient characteristics, N=1,139,419 | N | % |
|---|---|---|
| ||
| Age group, y | ||
| 1824 | 37,464 | 3 |
| 2534 | 66,541 | 6 |
| 3544 | 102,701 | 9 |
| 4554 | 174,830 | 15 |
| 5564 | 192,570 | 17 |
| 6574 | 196,407 | 17 |
| 75+ | 368,906 | 32 |
| Sex | ||
| Male | 527,062 | 46 |
| Female | 612,357 | 54 |
| Race | ||
| White | 711,993 | 62 |
| Black | 176,993 | 16 |
| Hispanic | 54,406 | 5 |
| Other | 196,027 | 17 |
| Marital status | ||
| Married | 427,648 | 38 |
| Single | 586,343 | 51 |
| Unknown/other | 125,428 | 11 |
| Primary insurance | ||
| Private/commercial | 269,725 | 24 |
| Medicare traditional | 502,301 | 44 |
| Medicare managed care | 126,344 | 11 |
| Medicaid | 125,025 | 11 |
| Self‐pay/other | 116,024 | 10 |
| ICU care | ||
| No | 1,023,027 | 90 |
| Yes | 116,392 | 10 |
| Comorbidities | ||
| AIDS | 5724 | 1 |
| Alcohol abuse | 79,633 | 7 |
| Deficiency anemias | 213,437 | 19 |
| RA/collagen vascular disease | 35,210 | 3 |
| Chronic blood‐loss anemia | 10,860 | 1 |
| CHF | 190,085 | 17 |
| Chronic pulmonary disease | 285,954 | 25 |
| Coagulopathy | 48,513 | 4 |
| Depression | 145,553 | 13 |
| DM without chronic complications | 270,087 | 24 |
| DM with chronic complications | 70,732 | 6 |
| Drug abuse | 66,886 | 6 |
| Hypertension | 696,299 | 61 |
| Hypothyroidism | 146,136 | 13 |
| Liver disease | 38,130 | 3 |
| Lymphoma | 14,032 | 1 |
| Fluid and electrolyte disorders | 326,576 | 29 |
| Metastatic cancer | 33,435 | 3 |
| Other neurological disorders | 124,195 | 11 |
| Obesity | 118,915 | 10 |
| Paralysis | 38,584 | 3 |
| PVD | 77,334 | 7 |
| Psychoses | 101,856 | 9 |
| Pulmonary circulation disease | 52,106 | 5 |
| Renal failure | 175,398 | 15 |
| Solid tumor without metastasis | 29,594 | 3 |
| Peptic ulcer disease excluding bleeding | 536 | 0 |
| Valvular disease | 86,616 | 8 |
| Weight loss | 45,132 | 4 |
| Primary discharge diagnoses | ||
| Cancer | 19,168 | 2 |
| Musculoskeletal injuries | 16,798 | 1 |
| Pain‐related diagnosesb | 101,533 | 9 |
| Alcohol‐related disorders | 16,777 | 1 |
| Substance‐related disorders | 13,697 | 1 |
| Psychiatric disorders | 41,153 | 4 |
| Mood disorders | 28,761 | 3 |
| Schizophrenia and other psychotic disorders | 12,392 | 1 |
| Procedures | ||
| Cardiovascular procedures | 59,901 | 5 |
| GI procedures | 31,224 | 3 |
| Mechanical ventilation | 7853 | 1 |
| Hospital characteristics, N=286 | ||
| Number of beds | ||
| <200 | 103 | 36 |
| 201300 | 63 | 22 |
| 301500 | 81 | 28 |
| >500 | 39 | 14 |
| Population served | ||
| Urban | 225 | 79 |
| Rural | 61 | 21 |
| Teaching status | ||
| Nonteaching | 207 | 72 |
| Teaching | 79 | 28 |
| US Census region | ||
| Northeast | 47 | 16 |
| Midwest | 63 | 22 |
| South | 115 | 40 |
| West | 61 | 21 |
To assess hospital variation in opioid prescribing after adjusting for patient characteristics, we used a GEE model of opioid receipt, controlling for all patient characteristics listed in Table 1. We then took the mean of the predicted probabilities of opioid receipt for the patients within each hospital in our cohort to derive the hospital prescribing rate adjusted for patient characteristics. We report the mean, SD, and range of the prescribing rates for the hospitals in our cohort before and after adjustment for patient characteristics.
To assess whether patients admitted to hospitals with higher rates of opioid prescribing have higher relative risk of severe opioid‐related adverse events, we stratified hospitals into opioid‐prescribing rate quartiles and compared the rates of opioid‐related adverse eventsboth overall and among opioid exposedbetween quartiles. To adjust for patient characteristics, we used a GEE model in which severe opioid‐related adverse event (yes/no) was the dependent variable and hospital‐prescribing rate quartile and all patient characteristics in Table 1 were independent variables. We also performed a sensitivity analysis in which we assessed the association between hospital prescribing‐rate quartile and the individual components of our composite outcome. Our results were qualitatively unchanged using this approach, and only the results of our main analysis are presented.
All analyses were carried out using SAS software, version 9.2 (SAS Institute Inc., Cary, NC).
RESULTS
Patient Admission Characteristics
There were 3,190,934 adult admissions to 300 acute‐care hospitals during our study period. After excluding admissions with a length of stay >365 days (n=25), missing patient sex (n=17), and charges for operating‐room procedures or a surgical attending of record (n=2,018,553), 1,172,339 admissions were available for analysis. There were 12 hospitals with incomplete opioid‐prescribing data (n=32,794) and 2 hospitals that contributed <100 admissions each (n=126), leaving 1,139,419 admissions in 286 hospitals in our analytic cohort. The median age of the cohort was 64 years (interquartile range, 4979 years), and 527,062 (46%) were men. Table 1 shows the characteristics of the admissions in the cohort.
Rate, Route, and Dose of Opioid Exposures
Overall, there were 576,373 (51%) admissions with charges for opioid medications. Among those exposed, 244,760 (43%) had charges for multiple opioids during the admission; 172,090 (30%) had charges for 2 different opioids; and 72,670 (13%) had charges for 3 different opioids. Table 2 shows the percent exposed to each opioid, the percent of exposed with parenteral and oral routes of administration, and the mean daily dose received in oral morphine equivalents.
| Exposed | Parenteral Administration | Oral Administration | Dose Received, in Oral Morphine Equivalents | |||||
|---|---|---|---|---|---|---|---|---|
| N | %a | N | %b | N | %b | Mean | SDc | |
| ||||||||
| All opioids | 576,373 | 51 | 378,771 | 66 | 371,796 | 65 | 68 | 185 |
| Morphine | 224,811 | 20 | 209,040 | 93 | 21,645 | 10 | 40 | 121 |
| Hydrocodone | 162,558 | 14 | 0 | 0 | 160,941 | 99 | 14 | 12 |
| Hydromorphone | 146,236 | 13 | 137,936 | 94 | 16,052 | 11 | 113 | 274 |
| Oxycodone | 126,733 | 11 | 0 | 0 | 125,033 | 99 | 26 | 37 |
| Fentanyl | 105,052 | 9 | 103,113 | 98 | 641 | 1 | 64 | 75 |
| Tramadol | 35,570 | 3 | 0 | 0 | 35,570 | 100 | ||
| Meperidine | 24,850 | 2 | 24,398 | 98 | 515 | 2 | 36 | 34 |
| Methadone | 15,302 | 1 | 370 | 2 | 14,781 | 97 | 337 | 384 |
| Codeine | 22,818 | 2 | 178 | 1 | 22,183 | 97 | 9 | 15 |
| Other | 45,469 | 4 | 5821 | 13 | 39,618 | 87 | ||
Among the medications/routes for which conversion to morphine equivalents was possible, dosage was missing in 39,728 out of 2,294,673 opioid charges (2%). The average daily dose received in oral morphine equivalents was 68 mg. A total dose of 50 mg per day was received in 39% of exposed, and a total dose of 100 mg per day was received in 23% of exposed. Among those exposed, 52% (26% of overall admissions) had charges for opioids on the day of discharge.
Rates of Opioid Use by Patient and Hospital Characteristics
Table 3 reports the association between admission characteristics and opioid use. Use was highest in patients between the ages of 25 and 54 years. Although use declined with age, 44% of admissions age 65 years had charges for opioid medication. After adjustment for patient demographics, comorbidities, and hospital characteristics, opioid use was more common in females than males, those age 2554 years compared with those older and younger, those of Caucasian race compared with non‐Caucasian race, and those with Medicare or Medicaid primary insurance. Among the primary discharge diagnoses, patients with musculoskeletal injuries, various specific and nonspecific pain‐related diagnoses, and cancer were significantly more likely to receive opioids than patients without these diagnoses, whereas patients with alcohol‐related disorders and psychiatric disorders were significantly less likely to receive opioids than patients without these diagnoses. Patients admitted to hospitals in the Midwest, South, and West were significantly more likely to receive opioid medications than patients in the Northeast.
| Exposed, N=576,373 | Unexposed, N=563,046 | % Exposed | Adjusted RRa | 95% CI | |
|---|---|---|---|---|---|
| |||||
| Patient characteristics | |||||
| Age group, y | |||||
| 1824 | 17,360 | 20,104 | 46 | (ref) | |
| 2534 | 37,793 | 28,748 | 57 | 1.17 | 1.16‐1.19 |
| 3544 | 60,712 | 41,989 | 59 | 1.16 | 1.15‐1.17 |
| 4554 | 103,798 | 71,032 | 59 | 1.11 | 1.09‐1.12 |
| 5564 | 108,256 | 84,314 | 56 | 1.00 | 0.98‐1.01 |
| 6574 | 98,110 | 98,297 | 50 | 0.84 | 0.83‐0.85 |
| 75+ | 150,344 | 218,562 | 41 | 0.71 | 0.70‐0.72 |
| Sex | |||||
| Male | 255,315 | 271,747 | 48 | (ref) | |
| Female | 321,058 | 291,299 | 52 | 1.11 | 1.10‐1.11 |
| Race | |||||
| White | 365,107 | 346,886 | 51 | (ref) | |
| Black | 92,013 | 84,980 | 52 | 0.93 | 0.92‐0.93 |
| Hispanic | 27,592 | 26,814 | 51 | 0.94 | 0.93‐0.94 |
| Other | 91,661 | 104,366 | 47 | 0.93 | 0.92‐0.93 |
| Marital status | |||||
| Married | 222,912 | 204,736 | 52 | (ref) | |
| Single | 297,742 | 288,601 | 51 | 1.00 | 0.99‐1.01 |
| Unknown/other | 55,719 | 69,709 | 44 | 0.94 | 0.93‐0.95 |
| Primary insurance | |||||
| Private/commercial | 143,954 | 125,771 | 53 | (ref) | |
| Medicare traditional | 236,114 | 266,187 | 47 | 1.10 | 1.09‐1.10 |
| Medicare managed care | 59,104 | 67,240 | 47 | 1.11 | 1.11‐1.12 |
| Medicaid | 73,583 | 51,442 | 59 | 1.13 | 1.12‐1.13 |
| Self‐pay/other | 63,618 | 52,406 | 55 | 1.03 | 1.02‐1.04 |
| ICU care | |||||
| No | 510,654 | 512,373 | 50 | (ref) | |
| Yes | 65,719 | 50,673 | 56 | 1.02 | 1.01‐1.03 |
| Comorbiditiesb | |||||
| AIDS | 3655 | 2069 | 64 | 1.09 | 1.07‐1.12 |
| Alcohol abuse | 35,112 | 44,521 | 44 | 0.92 | 0.91‐0.93 |
| Deficiency anemias | 115,842 | 97,595 | 54 | 1.08 | 1.08‐1.09 |
| RA/collagen vascular disease | 22,519 | 12,691 | 64 | 1.22 | 1.21‐1.23 |
| Chronic blood‐loss anemia | 6444 | 4416 | 59 | 1.04 | 1.02‐1.05 |
| CHF | 88,895 | 101,190 | 47 | 0.99 | 0.98‐0.99 |
| Chronic pulmonary disease | 153,667 | 132,287 | 54 | 1.08 | 1.08‐1.08 |
| Coagulopathy | 25,802 | 22,711 | 53 | 1.03 | 1.02‐1.04 |
| Depression | 83,051 | 62,502 | 57 | 1.08 | 1.08‐1.09 |
| DM without chronic complications | 136,184 | 133,903 | 50 | 0.99 | 0.99‐0.99 |
| DM with chronic complications | 38,696 | 32,036 | 55 | 1.04 | 1.03‐1.05 |
| Drug abuse | 37,202 | 29,684 | 56 | 1.14 | 1.13‐1.15 |
| Hypertension | 344,718 | 351,581 | 50 | 0.98 | 0.97‐0.98 |
| Hypothyroidism | 70,786 | 75,350 | 48 | 0.99 | 0.99‐0.99 |
| Liver disease | 24,067 | 14,063 | 63 | 1.15 | 1.14‐1.16 |
| Lymphoma | 7727 | 6305 | 55 | 1.16 | 1.14‐1.17 |
| Fluid and electrolyte disorders | 168,814 | 157,762 | 52 | 1.04 | 1.03‐1.04 |
| Metastatic cancer | 23,920 | 9515 | 72 | 1.40 | 1.39‐1.42 |
| Other neurological disorders | 51,091 | 73,104 | 41 | 0.87 | 0.86‐0.87 |
| Obesity | 69,584 | 49,331 | 59 | 1.05 | 1.04‐1.05 |
| Paralysis | 17,497 | 21,087 | 45 | 0.97 | 0.96‐0.98 |
| PVD | 42,176 | 35,158 | 55 | 1.11 | 1.11‐1.12 |
| Psychoses | 38,638 | 63,218 | 38 | 0.91 | 0.90‐0.92 |
| Pulmonary circulation disease | 26,656 | 25,450 | 51 | 1.05 | 1.04‐1.06 |
| Renal failure | 86,565 | 88,833 | 49 | 1.01 | 1.01‐1.02 |
| Solid tumor without metastasis | 16,258 | 13,336 | 55 | 1.14 | 1.13‐1.15 |
| Peptic ulcer disease excluding bleeding | 376 | 160 | 70 | 1.12 | 1.07‐1.18 |
| Valvular disease | 38,396 | 48,220 | 44 | 0.93 | 0.92‐0.94 |
| Weight loss | 25,724 | 19,408 | 57 | 1.09 | 1.08‐1.10 |
| Primary discharge diagnosesb | |||||
| Cancer | 13,986 | 5182 | 73 | 1.20 | 1.19‐1.21 |
| Musculoskeletal injuries | 14,638 | 2160 | 87 | 2.02 | 2.002.04 |
| Pain‐related diagnosesc | 64,656 | 36,877 | 64 | 1.20 | 1.20‐1.21 |
| Alcohol‐related disorders | 3425 | 13,352 | 20 | 0.46 | 0.44‐0.47 |
| Substance‐related disorders | 8680 | 5017 | 63 | 1.03 | 1.01‐1.04 |
| Psychiatric disorders | 7253 | 33,900 | 18 | 0.37 | 0.36‐0.38 |
| Mood disorders | 5943 | 22,818 | 21 | ||
| Schizophrenia and other psychotic disorders | 1310 | 11,082 | 11 | ||
| Proceduresb | |||||
| Cardiovascular procedures | 50,997 | 8904 | 85 | 1.80 | 1.79‐1.81 |
| GI procedures | 27,206 | 4018 | 87 | 1.70 | 1.69‐1.71 |
| Mechanical ventilation | 5341 | 2512 | 68 | 1.37 | 1.34‐1.39 |
| Hospital characteristics | |||||
| Number of beds | |||||
| <200 | 100,900 | 88,439 | 53 | (ref) | |
| 201300 | 104,213 | 99,995 | 51 | 0.95 | 0.95‐0.96 |
| 301500 | 215,340 | 209,104 | 51 | 0.94 | 0.94‐0.95 |
| >500 | 155,920 | 165,508 | 49 | 0.96 | 0.95‐0.96 |
| Population served | |||||
| Urban | 511,727 | 506,803 | 50 | (ref) | |
| Rural | 64,646 | 56,243 | 53 | 0.98 | 0.97‐0.99 |
| Teaching status | |||||
| Nonteaching | 366,623 | 343,581 | 52 | (ref) | |
| Teaching | 209,750 | 219,465 | 49 | 1.00 | 0.99‐1.01 |
| US Census region | |||||
| Northeast | 99,377 | 149,446 | 40 | (ref) | |
| Midwest | 123,194 | 120,322 | 51 | 1.26 | (1.25‐1.27) |
| South | 251,624 | 213,029 | 54 | 1.33 | (1.33‐1.34) |
| West | 102,178 | 80,249 | 56 | 1.37 | (1.36‐1.38) |
Variation in Opioid Prescribing
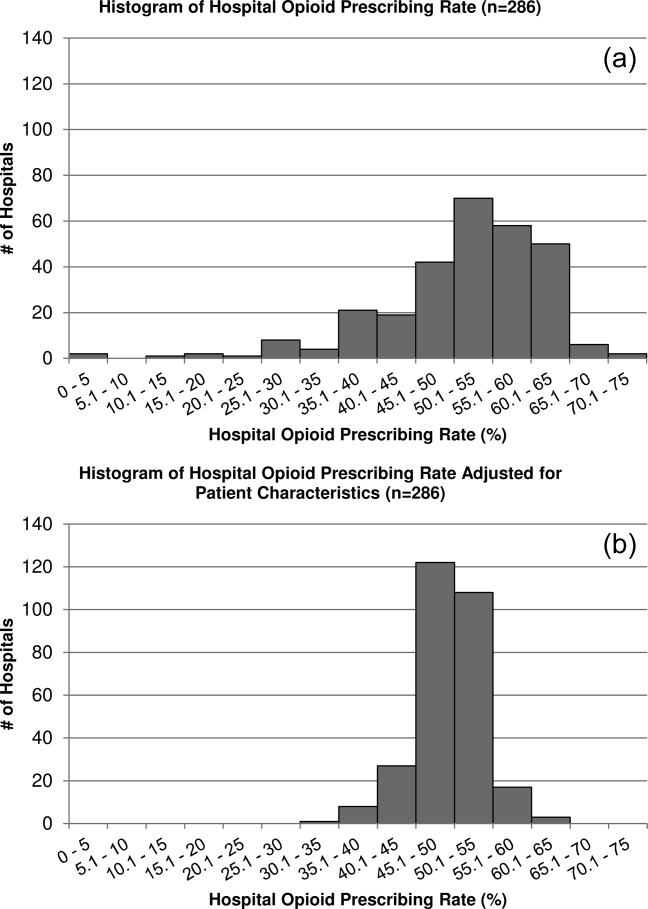
Figure 1 shows the histograms of hospital opioid prescribing rate for the 286 hospitals in our cohort (A) before and (B) after adjustment for patient characteristics. The observed rates ranged from 5% in the lowest‐prescribing hospital to 72% in the highest‐prescribing hospital, with a mean (SD) of 51% (10%). After adjusting for patient characteristics, the adjusted opioid‐prescribing rates ranged from 33% to 64%, with a mean (SD) of 50% (4%).

Severe Opioid‐Related Adverse Events
Among admissions with opioid exposure (n=576,373), naloxone use occurred in 2345 (0.41%) and opioid‐related adverse drug events in 1174 (0.20%), for a total of 3441 (0.60%) severe opioid‐related adverse events (some patients experienced both). Table 4 reports the opioid exposure and severe opioid‐related adverse‐event rates within hospital opioid‐prescribing rate quartiles, along with the adjusted association between the hospital opioid‐prescribing rate quartile and severe opioid‐related adverse events. After adjusting for patient characteristics, the relative risk of a severe opioid‐related adverse event was significantly greater in hospitals with higher opioid‐prescribing rates, both overall and among opioid exposed.
| Quartile | No. of Patients | Opioid Exposed, n (%) | Opioid‐Related Adverse Events, n (%) | Adjusted RR in All Patients, RR (95% CI), N=1,139,419a | Adjusted RR in Opioid Exposed, RR (95% CI), N=576,373a |
|---|---|---|---|---|---|
| |||||
| 1 | 349,747 | 132,824 (38) | 719 (0.21) | (ref) | (ref) |
| 2 | 266,652 | 134,590 (50) | 729 (0.27) | 1.31 (1.17‐1.45) | 1.07 (0.96‐1.18) |
| 3 | 251,042 | 139,770 (56) | 922 (0.37) | 1.72 (1.56‐1.90) | 1.31 (1.19‐1.44) |
| 4 | 271,978 | 169,189 (62) | 1071 (0.39) | 1.73 (1.57‐1.90) | 1.23 (1.12‐1.35) |
DISCUSSION
In this analysis of a large cohort of hospitalized nonsurgical patients, we found that more than half of all patients received opioids, with 43% of those exposed receiving multiple opioids during their admission and 52% receiving opioids on the day of discharge. Considerable hospital variation in opioid use was evident, and this was not fully explained by patient characteristics. Severe opioid‐related adverse events occurred more frequently at hospitals with higher opioid‐prescribing rates, and the relative risk of a severe adverse event per patient prescribed opioids was also higher in these hospitals. To our knowledge, this is the first study to describe the scope of opioid utilization and the relationship between utilization and severe opioid‐related adverse events in a sample of nonsurgical patients in US acute‐care facilities.
Our use of naloxone charges and opioid‐specific ICD‐9‐CM coding to define an opioid‐related adverse event was intended to capture only the most severe opioid‐related adverse events. We chose to focus on these events in our analysis to maximize the specificity of our outcome definition and thereby minimize confounding in our observed associations. The rate of less‐severe opioid‐related adverse events, such as nausea, constipation, and pruritis, is likely much higher and not captured in our outcome definition. Prior analyses have found variable rates of opioid‐related adverse events of approximately 1.8% to 13.6% of exposed patients.[22, 23, 24] However, these analyses focused on surgical patients and included less‐severe events. To our knowledge, ours is the first analysis of severe opioid‐related adverse events in nonsurgical patients.
Our finding that severe opioid‐related adverse events increase as opioid prescribing increases is consistent with that which has been demonstrated in the community setting, where rates of opioid‐related adverse events and mortality are higher in communities with higher levels of opioid prescribing.[2, 8, 25] This finding is expected, as greater use of a class of medications with known side effects would be expected to result in a higher overall rate of adverse events. More concerning, however, is the fact that this relationship persists when focusing exclusively on opioid‐exposed patients. Among similar patients receiving opioids at different hospitals, those hospitalized in facilities with higher opioid‐prescribing rates have higher rates of severe opioid‐related adverse events. This suggests that hospitals that use opioids more frequently do not do so more safely. Rather, the increased overall prescribing rates are associated with heightened risk for a serious adverse event per patient exposed and may reflect unsafe prescribing practices.
Furthermore, our results demonstrate both regional and hospital variation in use of opioids not fully explained by patient characteristics, similar to that which has been demonstrated for other drugs and heathcare services.[26, 27, 28, 29, 30] The implications of these findings are limited by our lack of information on pain severity or prior outpatient treatment, and our resultant inability to evaluate the appropriateness of opioid use in this analysis. Additionally, although we controlled for a large number of patient and hospital characteristics, there could be other significant predictors of use not accounted for in our analysis. However, it seems unlikely that differential pain severity or patient characteristics between patients in different regions of the country could fully explain a 37% relative difference in prescribing between the lowest‐ and highest‐prescribing regions, after accounting for the 44 patient‐level variables in our models. Whereas variation in use unrelated to patient factors could represent inappropriate prescribing practices, it could also be a marker of uncertainty regarding what constitutes appropriate prescribing and high‐quality care in this realm. Although guidelines advocate for standard pain assessments and a step‐up approach to treatment,[31, 32, 33] the lack of objective measures of pain severity and lack of evidence‐based recommendations on the use of opioids for noncancer pain[34] will almost certainly lead to persistent variation in opioid prescribing despite guideline‐driven care.
Nonetheless, our findings suggest that opportunities exist to make opioid prescribing safer in hospitalized patients. Studies aimed at elucidating the source of regional and hospital variation are necessary. Additionally, efforts should focus on identifying patient and prescribing characteristics associated with heightened risk of opioid‐related adverse events. Prior studies have demonstrated that the risks of opioid medications increase with increasing age of the patient.[35, 36] Although opioid use in our cohort declined with age, 44% of admissions age 65 years had charges for opioid medications. Studies in outpatients have also demonstrated that the risks of opioid overdose and overdose‐related death increase with dose.[5, 7] One study demonstrated a 3.7‐fold increased risk of overdose at doses of 5099 mg/day in oral morphine equivalents, and an 8.9‐fold increased risk at doses of 100 mg/day, compared with doses of 20 mg/day.[7] The prevalence of high dose exposure observed in our cohort, coupled with the older age of hospitalized patients, suggests potential targets for promoting safer use in hospitalized patients through interventions such as computerized decision support and enhanced monitoring in those at highest risk.
Because medications after discharge were unavailable in our dataset, the percentage of patients given a prescription for opioid medication on discharge is unknown. However, given that opioids are often tapered rather than abruptly discontinued, our finding that 26% of hospitalized nonsurgical patients received opioids on the day of discharge suggests that a substantial proportion of patients may be discharged with a prescription for opioid medication. Given the possibility of coexistent outpatient opioid prescriptions, these findings draw attention to the importance of assuring development and streamlined accessibility of data from state prescription drug monitoring programs and suggest that increased attention should be paid to the role that inpatient opioid prescribing plays in the increased rates of chronic opioid use and overdose‐related deaths in the United States.
There are additional limitations to our analysis. First, although the database used for this analysis captures a large proportion of admissions to US acute‐care facilities and is similar in composition, it is possible that participating medical centers differ from nonparticipating medical centers in ways that could be associated with opioid prescribing. Additionally, although Premier performs extensive validation and correction processes to assure the quality of their data, there is still likely to be a small amount of random error in the database, which could particularly impact dosage calculations. The lack of preadmission medications in our database precluded identification of the proportion of patients newly started on opioid medications. Lastly, it is possible that the hospital prescribing‐rate quartile is associated with patient characteristics unaccounted for in our analysis, and, therefore, the possibility of residual confounding still exists.
In conclusion, the majority of hospitalized nonsurgical patients are exposed to opioid medications during the course of their hospitalizations, often at high doses. More than half of those exposed are still receiving these medications on the day of discharge. We found hospital and regional variation in opioid use that was not fully explained by patient characteristics, and higher levels of hospital use were associated with higher risk of severe opioid‐related adverse events in opioid‐exposed patients. Further research is necessary to investigate the appropriateness of opioid use in this patient population, the sources of variation in use, and the predictors of opioid‐related adverse events in hospitalized patients to allow development of interventions to make hospital use safer.
Disclosures
Disclosures: Dr. Herzig had full access to all of the data in the study and takes responsibility for the integrity of the data and the accuracy of the data analysis. Dr. Herzig was funded by grant no. K23AG042459 from the National Institute on Aging. Dr. Marcantonio was funded by grant nos. P01AG031720, R01AG030618, R03AG028189, and K24AG035075 from the National Institute on Aging. The funding organization had no involvement in any aspect of the study, including design, conduct, and reporting of the study. None of the authors have any conflicts of interest to disclose.
- . A flood of opioids, a rising tide of deaths. N Engl J Med. 2010;363(21):1981–1985.
- , , . Increasing deaths from opioid analgesics in the United States. Pharmacoepidemiol Drug Saf. 2006;15(9):618–627.
- , , , . Trends in opioid prescribing by race/ethnicity for patients seeking care in US emergency departments. JAMA. 2008;299(1):70–78.
- , , , . Trends in medical use and abuse of opioid analgesics. JAMA. 2000;283(13):1710–1714.
- , , , et al. Association between opioid prescribing patterns and opioid overdose‐related deaths. JAMA. 2011;305(13):1315–1321.
- , , , et al. Prescription opioid mortality trends in New York City, 1990–2006: examining the emergence of an epidemic. Drug Alcohol Depend. 2013;132(1‐2):53–62.
- , , , et al. Opioid prescriptions for chronic pain and overdose: a cohort study. Ann Intern Med. 2010;152(2):85–92.
- , , , et al. Relationship of opioid prescription sales and overdoses, North Carolina. Drug Alcohol Depend. 2013;132(1‐2):81–86.
- Deaths from prescription opioids soar in New York. BMJ. 2013;346:f921.
- , , . Mortality in elderly dementia patients treated with risperidone. J Clin Psychopharmacol. 2006;26(6):566–570.
- , , , et al. Medication reconciliation: a practical tool to reduce the risk of medication errors. J Crit Care. 2003;18(4):201–205.
- , , . Adverse drug event trigger tool: a practical methodology for measuring medication related harm. Qual Saf Health Care. 2003;12(3):194–200.
- , , , , . Improvement in the detection of adverse drug events by the use of electronic health and prescription records: an evaluation of two trigger tools. Eur J Clin Pharmacol. 2013;69(2):255–259.
- , . Adverse Drug Events in U.S. Hospitals, 2004. Rockville, MD: Agency for Healthcare Research and Quality; April 2007. Statistical Brief 29.
- , , . Medication‐Related Adverse Outcomes in U.S. Hospitals and Emergency Departments, 2008. Rockville, MD: Agency for Healthcare Research and Quality; April 2011. Statistical Brief 109.
- US Centers for Medicare and Medicaid Services. Hospital‐Acquired Conditions (Present on Admission Indicator). Available at: http://www.cms.hhs.gov/HospitalAcqCond/. Accessed August 16, 2011. Updated September 20, 2012.
- , , . Fracture risk associated with the use of morphine and opiates. J Intern Med. 2006;260(1):76–87.
- , , , . Comorbidity measures for use with administrative data. Med Care. 1998;36(1):8–27.
- Clinical Classifications Software, Healthcare Cost and Utilization Project (HCUP). Rockville, MD; Agency for Healthcare Research and Quality; December 2009.
- , , , , . Clinical application of opioid equianalgesic data. Clin J Pain. 2003;19(5)286–297.
- , , , , , . Choosing the unit of measurement counts: the use of oral morphine equivalents in studies of opioid consumption is a useful addition to defined daily doses. Palliat Med. 2011;25(7):725–732.
- , , , . Cost and quality implications of opioid‐based postsurgical pain control using administrative claims data from a large health system: opioid‐related adverse events and their impact on clinical and economic outcomes. Pharmacotherapy. 2013;33(4):383–391.
- , , , et al. Opioid‐related adverse drug events in surgical hospitalizations: impact on costs and length of stay. Ann Pharmacother. 2007;41(3):400–406.
- , , , et al. Cost of opioid‐related adverse drug events in surgical patients. J Pain Symptom Manage. 2003;25(3):276–283.
- , . Opioid analgesics and rates of fatal drug poisoning in the United States. Am J Prev Med. 2006;31(6):506–511.
- , , , et al. Geographic variation in the treatment of acute myocardial infarction: the Cooperative Cardiovascular Project. JAMA. 1999;281(7):627–633.
- , , , et al; GUSTO‐1 Investigators. Regional variation across the United States in the management of acute myocardial infarction. Global Utilization of Streptokinase and Tissue Plasminogen Activator for Occluded Coronary Arteries. N Engl J Med. 1995;333(9):565–572.
- , , . Predictors of broad‐spectrum antibiotic prescribing for acute respiratory tract infections in adult primary care. JAMA. 2003;289(6):719–725.
- , , . Geographic variation in Medicare drug spending. N Engl J Med. 2010;363(5):405–409.
- , , . Geographic variation in outpatient antibiotic prescribing among older adults. Arch Intern Med. 2012;172(19):1465–1471.
- , , , et al. Clinical policy: critical issues in the prescribing of opioids for adult patients in the emergency department. Ann Emerg Med. 2012;60(4):499–525.
- The Joint Commission. Facts About Pain Management. Available at: http://www.jointcommission.org/pain_management/. Accessed July 23, 2012.
- The Joint Commission. Sentinel Event Alert: Safe Use of Opioids in Hospitals. Published August 8, 2012. Available at: http://www.jointcommission.org/assets/1/18/SEA_49_opioids_8_2_12_final.pdf. Accessed March 4, 2013.
- , , , , . Research gaps on use of opioids for chronic noncancer pain: findings from a review of the evidence for an American Pain Society and American Academy of Pain Medicine clinical practice guideline. J Pain. 2009;10(2):147–159.
- , , , , , . Side effects of opioids during short‐term administration: effect of age, gender, and race. Clin Pharmacol Ther. 2003;74(2):102–112.
- , , , . Postoperative day one: a high‐risk period for respiratory events. Am J Surg. 2005;190(5):752–756.
Recent reports have drawn attention to the high and increasing rates of opioid prescribing and overdose‐related deaths in the United States.[1, 2, 3, 4, 5, 6, 7, 8, 9] These studies have focused on community‐based and emergency department prescribing, leaving prescribing practices in the inpatient setting unexamined. Given that pain is a frequent complaint in hospitalized patients, and that the Joint Commission mandates assessing pain as a vital sign, hospitalization is potentially a time of heightened use of such medications and could significantly contribute to nosocomial complications and subsequent outpatient use.[10] Variation in prescribing practices, unrelated to patient characteristics, could be a marker of inappropriate prescribing practices and poor quality of care.
Using a large, nationally representative cohort of admissions from July 2009 to June 2010, we sought to determine patterns and predictors of opioid utilization in nonsurgical admissions to US medical centers, hospital variation in use, and the association between hospital‐level use and the risk of opioid‐related adverse events. We hypothesized that hospitals with higher rates of opioid use would have an increased risk of an opioid‐related adverse event per patient exposed.
METHODS
Setting and Patients
We conducted a retrospective cohort study using data from 286 US nonfederal acute‐care facilities contributing to the database maintained by Premier (Premier Healthcare Solutions, Inc., Charlotte, NC). This database, created to measure healthcare utilization and quality of care, is drawn from voluntarily participating hospitals and contains data on approximately 1 in every 4 discharges nationwide.[11] Participating hospitals are similar in geographic distribution and metropolitan (urban/rural) status to hospitals nationwide, although large, nonteaching hospitals are slightly overrepresented in Premier. The database contains patient demographics, International Classification of Diseases, Ninth Revision, Clinical Modification (ICD‐9‐CM) codes, hospital demographics, and a date‐stamped log of all charges during the course of each hospitalization, including diagnostic tests, therapeutic treatments, and medications with dose and route of administration. The study was approved by the institutional review board at Beth Israel Deaconess Medical Center and granted a waiver of informed consent.
We studied a cohort of all adult nonsurgical admissions to participating hospitals from July 1, 2009, through June 30, 2010. We chose to study nonsurgical admissions, as patients undergoing surgical procedures have a clear indication for, and almost always receive, opioid pain medications. We defined a nonsurgical admission as an admission in which there were no charges for operating‐room procedures (including labor and delivery) and the attending of record was not a surgeon. We excluded admissions with unknown gender, since this is a key demographic variable, and admissions with a length of stay greater than 365 days, as these admissions are not representative of the typical admission to an acute‐care hospital. At the hospital level, we excluded hospitals contributing <100 admissions owing to resultant lack of precision in corresponding hospital prescribing rates, and hospitals that did not prescribe the full range of opioid medications (these hospitals had charges for codeine only), as these facilities seemed likely to have unusual limitations on prescribing or incomplete data capture.
Opioid Exposure
We defined opioid exposure as presence of 1 charge for an opioid medication during the admission. Opioid medications included morphine, hydrocodone, hydromorphone, oxycodone, fentanyl, meperidine, methadone, codeine, tramadol, buprenorphine, levorphanol, oxymorphone, pentazocine, propoxyphene, tapentadol, butorphanol, dezocine, and nalbuphine. We grouped the last 9 into an other category owing to infrequent use and/or differing characteristics from the main opioid drug types, such as synthetic, semisynthetic, and partial agonist qualities.
Severe Opioid‐Related Adverse Events
We defined severe opioid‐related adverse events as either naloxone exposure or an opioid‐related adverse drug event diagnosis code. Naloxone use in an adult patient exposed to opioids is one of the Institute for Healthcare Improvement's Trigger Tools for identifying adverse drug events[12] and previously has been demonstrated to have high positive predictive value for a confirmed adverse drug event.[13] We defined naloxone exposure as presence of 1 charge for naloxone. We excluded charges on hospital day 1 to focus on nosocomial events. We defined opioid‐related adverse drug events using ICD‐9‐CM diagnosis codes for poisoning by opioids (overdose, wrong substance given, or taken in error; ICD‐9‐CM 965.02, 965.09, E850.1, E850.2) and drugs causing adverse effects in therapeutic use (ICD‐9‐CM E935.1, E935.2), as specified in prior analyses by the Agency for Healthcare Research and Quality (AHRQ).[14, 15] To avoid capturing adverse events associated with outpatient use, we required the ICD‐9‐CM code to be qualified as not present on admission using the present on admission indicator required by the Centers for Medicare and Medicaid Services for all discharge diagnosis codes since 2008.[16]
Covariates of Interest
We were interested in the relationship between both patient and hospital characteristics and opioid exposure. Patient characteristics of interest included (1) demographic variables, such as age, sex, race (self‐reported by patients at the time of admission), marital status, and payer; (2) whether or not the patient spent any time in the intensive care unit (ICU); (3) comorbidities, identified via ICD‐9‐CM secondary diagnosis codes and diagnosis‐related groups using Healthcare Cost and Utilization Project Comorbidity Software, version 3.7, based on the work of Elixhauser et al[17, 18]; (4) primary ICD‐9‐CM discharge diagnosis groupings, selected based on hypothesized associations with receipt of opioids, and based on the Clinical Classifications Software (CCS)a diagnosis and procedure categorization scheme maintained by the AHRQ, and defined in the Appendix[19]; (5) and nonoperating‐room‐based procedures potentially necessitating opioids during the admission, selected from the 50 most common ICD‐9‐CM procedure codes in our cohort and grouped as cardiovascular procedures (catheterization and insertion of vascular stents), gastrointestinal procedures (upper and lower endoscopy), and mechanical ventilation, further defined in the Appendix. Hospital characteristics of interest included number of beds, population served (urban vs rural), teaching status, and US census region (Northeast, Midwest, South, West).
Statistical Analysis
We calculated the percent of admissions with exposure to any opioid and the percent exposed to each opioid, along with the total number of different opioid medications used during each admission. We also calculated the percent of admissions with parenteral administration and the percent of admissions with oral administration, among those exposed to the individual categories, and in aggregate. Because medications after discharge were unavailable in Premier's dataset, we report the percent of patients with a charge for opioids on the day of discharge.
We determined the daily dose of an opioid by taking the sum of the doses for that opioid charged on a given day. The average daily dose of an opioid was determined by taking the sum of the daily doses and dividing by the number of days on which 1 dose was charged. To facilitate comparison, all opioids, with the exception of those for which standard equivalences are unavailable (tramadol, other opioid category, oral fentanyl, epidural route for all), were converted to oral morphine equivalents using a standard equivalence conversion table.[20, 21] We excluded from our dosage calculations those charges for which standard morphine equivalence was unavailable, or for which dosage was missing. We also excluded from our dosage calculations any dose that was >3 standard deviations (SD) above the mean dose for that opioid, as such extreme values seemed physiologically implausible and more likely to be a data entry error that could lead to significant overestimation of the mean for that opioid.
All multivariable models used a generalized estimating equation (GEE) via the genmod procedure in SAS, with a Poisson distribution error term and a log link, controlling for repeated patient admissions with an autoregressive correlation structure.
To identify independent predictors of opioid receipt, we used a GEE model of opioid receipt where all patient and hospital characteristics listed in Table 1 were included as independent variables.
| Patient characteristics, N=1,139,419 | N | % |
|---|---|---|
| ||
| Age group, y | ||
| 1824 | 37,464 | 3 |
| 2534 | 66,541 | 6 |
| 3544 | 102,701 | 9 |
| 4554 | 174,830 | 15 |
| 5564 | 192,570 | 17 |
| 6574 | 196,407 | 17 |
| 75+ | 368,906 | 32 |
| Sex | ||
| Male | 527,062 | 46 |
| Female | 612,357 | 54 |
| Race | ||
| White | 711,993 | 62 |
| Black | 176,993 | 16 |
| Hispanic | 54,406 | 5 |
| Other | 196,027 | 17 |
| Marital status | ||
| Married | 427,648 | 38 |
| Single | 586,343 | 51 |
| Unknown/other | 125,428 | 11 |
| Primary insurance | ||
| Private/commercial | 269,725 | 24 |
| Medicare traditional | 502,301 | 44 |
| Medicare managed care | 126,344 | 11 |
| Medicaid | 125,025 | 11 |
| Self‐pay/other | 116,024 | 10 |
| ICU care | ||
| No | 1,023,027 | 90 |
| Yes | 116,392 | 10 |
| Comorbidities | ||
| AIDS | 5724 | 1 |
| Alcohol abuse | 79,633 | 7 |
| Deficiency anemias | 213,437 | 19 |
| RA/collagen vascular disease | 35,210 | 3 |
| Chronic blood‐loss anemia | 10,860 | 1 |
| CHF | 190,085 | 17 |
| Chronic pulmonary disease | 285,954 | 25 |
| Coagulopathy | 48,513 | 4 |
| Depression | 145,553 | 13 |
| DM without chronic complications | 270,087 | 24 |
| DM with chronic complications | 70,732 | 6 |
| Drug abuse | 66,886 | 6 |
| Hypertension | 696,299 | 61 |
| Hypothyroidism | 146,136 | 13 |
| Liver disease | 38,130 | 3 |
| Lymphoma | 14,032 | 1 |
| Fluid and electrolyte disorders | 326,576 | 29 |
| Metastatic cancer | 33,435 | 3 |
| Other neurological disorders | 124,195 | 11 |
| Obesity | 118,915 | 10 |
| Paralysis | 38,584 | 3 |
| PVD | 77,334 | 7 |
| Psychoses | 101,856 | 9 |
| Pulmonary circulation disease | 52,106 | 5 |
| Renal failure | 175,398 | 15 |
| Solid tumor without metastasis | 29,594 | 3 |
| Peptic ulcer disease excluding bleeding | 536 | 0 |
| Valvular disease | 86,616 | 8 |
| Weight loss | 45,132 | 4 |
| Primary discharge diagnoses | ||
| Cancer | 19,168 | 2 |
| Musculoskeletal injuries | 16,798 | 1 |
| Pain‐related diagnosesb | 101,533 | 9 |
| Alcohol‐related disorders | 16,777 | 1 |
| Substance‐related disorders | 13,697 | 1 |
| Psychiatric disorders | 41,153 | 4 |
| Mood disorders | 28,761 | 3 |
| Schizophrenia and other psychotic disorders | 12,392 | 1 |
| Procedures | ||
| Cardiovascular procedures | 59,901 | 5 |
| GI procedures | 31,224 | 3 |
| Mechanical ventilation | 7853 | 1 |
| Hospital characteristics, N=286 | ||
| Number of beds | ||
| <200 | 103 | 36 |
| 201300 | 63 | 22 |
| 301500 | 81 | 28 |
| >500 | 39 | 14 |
| Population served | ||
| Urban | 225 | 79 |
| Rural | 61 | 21 |
| Teaching status | ||
| Nonteaching | 207 | 72 |
| Teaching | 79 | 28 |
| US Census region | ||
| Northeast | 47 | 16 |
| Midwest | 63 | 22 |
| South | 115 | 40 |
| West | 61 | 21 |
To assess hospital variation in opioid prescribing after adjusting for patient characteristics, we used a GEE model of opioid receipt, controlling for all patient characteristics listed in Table 1. We then took the mean of the predicted probabilities of opioid receipt for the patients within each hospital in our cohort to derive the hospital prescribing rate adjusted for patient characteristics. We report the mean, SD, and range of the prescribing rates for the hospitals in our cohort before and after adjustment for patient characteristics.
To assess whether patients admitted to hospitals with higher rates of opioid prescribing have higher relative risk of severe opioid‐related adverse events, we stratified hospitals into opioid‐prescribing rate quartiles and compared the rates of opioid‐related adverse eventsboth overall and among opioid exposedbetween quartiles. To adjust for patient characteristics, we used a GEE model in which severe opioid‐related adverse event (yes/no) was the dependent variable and hospital‐prescribing rate quartile and all patient characteristics in Table 1 were independent variables. We also performed a sensitivity analysis in which we assessed the association between hospital prescribing‐rate quartile and the individual components of our composite outcome. Our results were qualitatively unchanged using this approach, and only the results of our main analysis are presented.
All analyses were carried out using SAS software, version 9.2 (SAS Institute Inc., Cary, NC).
RESULTS
Patient Admission Characteristics
There were 3,190,934 adult admissions to 300 acute‐care hospitals during our study period. After excluding admissions with a length of stay >365 days (n=25), missing patient sex (n=17), and charges for operating‐room procedures or a surgical attending of record (n=2,018,553), 1,172,339 admissions were available for analysis. There were 12 hospitals with incomplete opioid‐prescribing data (n=32,794) and 2 hospitals that contributed <100 admissions each (n=126), leaving 1,139,419 admissions in 286 hospitals in our analytic cohort. The median age of the cohort was 64 years (interquartile range, 4979 years), and 527,062 (46%) were men. Table 1 shows the characteristics of the admissions in the cohort.
Rate, Route, and Dose of Opioid Exposures
Overall, there were 576,373 (51%) admissions with charges for opioid medications. Among those exposed, 244,760 (43%) had charges for multiple opioids during the admission; 172,090 (30%) had charges for 2 different opioids; and 72,670 (13%) had charges for 3 different opioids. Table 2 shows the percent exposed to each opioid, the percent of exposed with parenteral and oral routes of administration, and the mean daily dose received in oral morphine equivalents.
| Exposed | Parenteral Administration | Oral Administration | Dose Received, in Oral Morphine Equivalents | |||||
|---|---|---|---|---|---|---|---|---|
| N | %a | N | %b | N | %b | Mean | SDc | |
| ||||||||
| All opioids | 576,373 | 51 | 378,771 | 66 | 371,796 | 65 | 68 | 185 |
| Morphine | 224,811 | 20 | 209,040 | 93 | 21,645 | 10 | 40 | 121 |
| Hydrocodone | 162,558 | 14 | 0 | 0 | 160,941 | 99 | 14 | 12 |
| Hydromorphone | 146,236 | 13 | 137,936 | 94 | 16,052 | 11 | 113 | 274 |
| Oxycodone | 126,733 | 11 | 0 | 0 | 125,033 | 99 | 26 | 37 |
| Fentanyl | 105,052 | 9 | 103,113 | 98 | 641 | 1 | 64 | 75 |
| Tramadol | 35,570 | 3 | 0 | 0 | 35,570 | 100 | ||
| Meperidine | 24,850 | 2 | 24,398 | 98 | 515 | 2 | 36 | 34 |
| Methadone | 15,302 | 1 | 370 | 2 | 14,781 | 97 | 337 | 384 |
| Codeine | 22,818 | 2 | 178 | 1 | 22,183 | 97 | 9 | 15 |
| Other | 45,469 | 4 | 5821 | 13 | 39,618 | 87 | ||
Among the medications/routes for which conversion to morphine equivalents was possible, dosage was missing in 39,728 out of 2,294,673 opioid charges (2%). The average daily dose received in oral morphine equivalents was 68 mg. A total dose of 50 mg per day was received in 39% of exposed, and a total dose of 100 mg per day was received in 23% of exposed. Among those exposed, 52% (26% of overall admissions) had charges for opioids on the day of discharge.
Rates of Opioid Use by Patient and Hospital Characteristics
Table 3 reports the association between admission characteristics and opioid use. Use was highest in patients between the ages of 25 and 54 years. Although use declined with age, 44% of admissions age 65 years had charges for opioid medication. After adjustment for patient demographics, comorbidities, and hospital characteristics, opioid use was more common in females than males, those age 2554 years compared with those older and younger, those of Caucasian race compared with non‐Caucasian race, and those with Medicare or Medicaid primary insurance. Among the primary discharge diagnoses, patients with musculoskeletal injuries, various specific and nonspecific pain‐related diagnoses, and cancer were significantly more likely to receive opioids than patients without these diagnoses, whereas patients with alcohol‐related disorders and psychiatric disorders were significantly less likely to receive opioids than patients without these diagnoses. Patients admitted to hospitals in the Midwest, South, and West were significantly more likely to receive opioid medications than patients in the Northeast.
| Exposed, N=576,373 | Unexposed, N=563,046 | % Exposed | Adjusted RRa | 95% CI | |
|---|---|---|---|---|---|
| |||||
| Patient characteristics | |||||
| Age group, y | |||||
| 1824 | 17,360 | 20,104 | 46 | (ref) | |
| 2534 | 37,793 | 28,748 | 57 | 1.17 | 1.16‐1.19 |
| 3544 | 60,712 | 41,989 | 59 | 1.16 | 1.15‐1.17 |
| 4554 | 103,798 | 71,032 | 59 | 1.11 | 1.09‐1.12 |
| 5564 | 108,256 | 84,314 | 56 | 1.00 | 0.98‐1.01 |
| 6574 | 98,110 | 98,297 | 50 | 0.84 | 0.83‐0.85 |
| 75+ | 150,344 | 218,562 | 41 | 0.71 | 0.70‐0.72 |
| Sex | |||||
| Male | 255,315 | 271,747 | 48 | (ref) | |
| Female | 321,058 | 291,299 | 52 | 1.11 | 1.10‐1.11 |
| Race | |||||
| White | 365,107 | 346,886 | 51 | (ref) | |
| Black | 92,013 | 84,980 | 52 | 0.93 | 0.92‐0.93 |
| Hispanic | 27,592 | 26,814 | 51 | 0.94 | 0.93‐0.94 |
| Other | 91,661 | 104,366 | 47 | 0.93 | 0.92‐0.93 |
| Marital status | |||||
| Married | 222,912 | 204,736 | 52 | (ref) | |
| Single | 297,742 | 288,601 | 51 | 1.00 | 0.99‐1.01 |
| Unknown/other | 55,719 | 69,709 | 44 | 0.94 | 0.93‐0.95 |
| Primary insurance | |||||
| Private/commercial | 143,954 | 125,771 | 53 | (ref) | |
| Medicare traditional | 236,114 | 266,187 | 47 | 1.10 | 1.09‐1.10 |
| Medicare managed care | 59,104 | 67,240 | 47 | 1.11 | 1.11‐1.12 |
| Medicaid | 73,583 | 51,442 | 59 | 1.13 | 1.12‐1.13 |
| Self‐pay/other | 63,618 | 52,406 | 55 | 1.03 | 1.02‐1.04 |
| ICU care | |||||
| No | 510,654 | 512,373 | 50 | (ref) | |
| Yes | 65,719 | 50,673 | 56 | 1.02 | 1.01‐1.03 |
| Comorbiditiesb | |||||
| AIDS | 3655 | 2069 | 64 | 1.09 | 1.07‐1.12 |
| Alcohol abuse | 35,112 | 44,521 | 44 | 0.92 | 0.91‐0.93 |
| Deficiency anemias | 115,842 | 97,595 | 54 | 1.08 | 1.08‐1.09 |
| RA/collagen vascular disease | 22,519 | 12,691 | 64 | 1.22 | 1.21‐1.23 |
| Chronic blood‐loss anemia | 6444 | 4416 | 59 | 1.04 | 1.02‐1.05 |
| CHF | 88,895 | 101,190 | 47 | 0.99 | 0.98‐0.99 |
| Chronic pulmonary disease | 153,667 | 132,287 | 54 | 1.08 | 1.08‐1.08 |
| Coagulopathy | 25,802 | 22,711 | 53 | 1.03 | 1.02‐1.04 |
| Depression | 83,051 | 62,502 | 57 | 1.08 | 1.08‐1.09 |
| DM without chronic complications | 136,184 | 133,903 | 50 | 0.99 | 0.99‐0.99 |
| DM with chronic complications | 38,696 | 32,036 | 55 | 1.04 | 1.03‐1.05 |
| Drug abuse | 37,202 | 29,684 | 56 | 1.14 | 1.13‐1.15 |
| Hypertension | 344,718 | 351,581 | 50 | 0.98 | 0.97‐0.98 |
| Hypothyroidism | 70,786 | 75,350 | 48 | 0.99 | 0.99‐0.99 |
| Liver disease | 24,067 | 14,063 | 63 | 1.15 | 1.14‐1.16 |
| Lymphoma | 7727 | 6305 | 55 | 1.16 | 1.14‐1.17 |
| Fluid and electrolyte disorders | 168,814 | 157,762 | 52 | 1.04 | 1.03‐1.04 |
| Metastatic cancer | 23,920 | 9515 | 72 | 1.40 | 1.39‐1.42 |
| Other neurological disorders | 51,091 | 73,104 | 41 | 0.87 | 0.86‐0.87 |
| Obesity | 69,584 | 49,331 | 59 | 1.05 | 1.04‐1.05 |
| Paralysis | 17,497 | 21,087 | 45 | 0.97 | 0.96‐0.98 |
| PVD | 42,176 | 35,158 | 55 | 1.11 | 1.11‐1.12 |
| Psychoses | 38,638 | 63,218 | 38 | 0.91 | 0.90‐0.92 |
| Pulmonary circulation disease | 26,656 | 25,450 | 51 | 1.05 | 1.04‐1.06 |
| Renal failure | 86,565 | 88,833 | 49 | 1.01 | 1.01‐1.02 |
| Solid tumor without metastasis | 16,258 | 13,336 | 55 | 1.14 | 1.13‐1.15 |
| Peptic ulcer disease excluding bleeding | 376 | 160 | 70 | 1.12 | 1.07‐1.18 |
| Valvular disease | 38,396 | 48,220 | 44 | 0.93 | 0.92‐0.94 |
| Weight loss | 25,724 | 19,408 | 57 | 1.09 | 1.08‐1.10 |
| Primary discharge diagnosesb | |||||
| Cancer | 13,986 | 5182 | 73 | 1.20 | 1.19‐1.21 |
| Musculoskeletal injuries | 14,638 | 2160 | 87 | 2.02 | 2.002.04 |
| Pain‐related diagnosesc | 64,656 | 36,877 | 64 | 1.20 | 1.20‐1.21 |
| Alcohol‐related disorders | 3425 | 13,352 | 20 | 0.46 | 0.44‐0.47 |
| Substance‐related disorders | 8680 | 5017 | 63 | 1.03 | 1.01‐1.04 |
| Psychiatric disorders | 7253 | 33,900 | 18 | 0.37 | 0.36‐0.38 |
| Mood disorders | 5943 | 22,818 | 21 | ||
| Schizophrenia and other psychotic disorders | 1310 | 11,082 | 11 | ||
| Proceduresb | |||||
| Cardiovascular procedures | 50,997 | 8904 | 85 | 1.80 | 1.79‐1.81 |
| GI procedures | 27,206 | 4018 | 87 | 1.70 | 1.69‐1.71 |
| Mechanical ventilation | 5341 | 2512 | 68 | 1.37 | 1.34‐1.39 |
| Hospital characteristics | |||||
| Number of beds | |||||
| <200 | 100,900 | 88,439 | 53 | (ref) | |
| 201300 | 104,213 | 99,995 | 51 | 0.95 | 0.95‐0.96 |
| 301500 | 215,340 | 209,104 | 51 | 0.94 | 0.94‐0.95 |
| >500 | 155,920 | 165,508 | 49 | 0.96 | 0.95‐0.96 |
| Population served | |||||
| Urban | 511,727 | 506,803 | 50 | (ref) | |
| Rural | 64,646 | 56,243 | 53 | 0.98 | 0.97‐0.99 |
| Teaching status | |||||
| Nonteaching | 366,623 | 343,581 | 52 | (ref) | |
| Teaching | 209,750 | 219,465 | 49 | 1.00 | 0.99‐1.01 |
| US Census region | |||||
| Northeast | 99,377 | 149,446 | 40 | (ref) | |
| Midwest | 123,194 | 120,322 | 51 | 1.26 | (1.25‐1.27) |
| South | 251,624 | 213,029 | 54 | 1.33 | (1.33‐1.34) |
| West | 102,178 | 80,249 | 56 | 1.37 | (1.36‐1.38) |
Variation in Opioid Prescribing
Figure 1 shows the histograms of hospital opioid prescribing rate for the 286 hospitals in our cohort (A) before and (B) after adjustment for patient characteristics. The observed rates ranged from 5% in the lowest‐prescribing hospital to 72% in the highest‐prescribing hospital, with a mean (SD) of 51% (10%). After adjusting for patient characteristics, the adjusted opioid‐prescribing rates ranged from 33% to 64%, with a mean (SD) of 50% (4%).
Severe Opioid‐Related Adverse Events
Among admissions with opioid exposure (n=576,373), naloxone use occurred in 2345 (0.41%) and opioid‐related adverse drug events in 1174 (0.20%), for a total of 3441 (0.60%) severe opioid‐related adverse events (some patients experienced both). Table 4 reports the opioid exposure and severe opioid‐related adverse‐event rates within hospital opioid‐prescribing rate quartiles, along with the adjusted association between the hospital opioid‐prescribing rate quartile and severe opioid‐related adverse events. After adjusting for patient characteristics, the relative risk of a severe opioid‐related adverse event was significantly greater in hospitals with higher opioid‐prescribing rates, both overall and among opioid exposed.
| Quartile | No. of Patients | Opioid Exposed, n (%) | Opioid‐Related Adverse Events, n (%) | Adjusted RR in All Patients, RR (95% CI), N=1,139,419a | Adjusted RR in Opioid Exposed, RR (95% CI), N=576,373a |
|---|---|---|---|---|---|
| |||||
| 1 | 349,747 | 132,824 (38) | 719 (0.21) | (ref) | (ref) |
| 2 | 266,652 | 134,590 (50) | 729 (0.27) | 1.31 (1.17‐1.45) | 1.07 (0.96‐1.18) |
| 3 | 251,042 | 139,770 (56) | 922 (0.37) | 1.72 (1.56‐1.90) | 1.31 (1.19‐1.44) |
| 4 | 271,978 | 169,189 (62) | 1071 (0.39) | 1.73 (1.57‐1.90) | 1.23 (1.12‐1.35) |
DISCUSSION
In this analysis of a large cohort of hospitalized nonsurgical patients, we found that more than half of all patients received opioids, with 43% of those exposed receiving multiple opioids during their admission and 52% receiving opioids on the day of discharge. Considerable hospital variation in opioid use was evident, and this was not fully explained by patient characteristics. Severe opioid‐related adverse events occurred more frequently at hospitals with higher opioid‐prescribing rates, and the relative risk of a severe adverse event per patient prescribed opioids was also higher in these hospitals. To our knowledge, this is the first study to describe the scope of opioid utilization and the relationship between utilization and severe opioid‐related adverse events in a sample of nonsurgical patients in US acute‐care facilities.
Our use of naloxone charges and opioid‐specific ICD‐9‐CM coding to define an opioid‐related adverse event was intended to capture only the most severe opioid‐related adverse events. We chose to focus on these events in our analysis to maximize the specificity of our outcome definition and thereby minimize confounding in our observed associations. The rate of less‐severe opioid‐related adverse events, such as nausea, constipation, and pruritis, is likely much higher and not captured in our outcome definition. Prior analyses have found variable rates of opioid‐related adverse events of approximately 1.8% to 13.6% of exposed patients.[22, 23, 24] However, these analyses focused on surgical patients and included less‐severe events. To our knowledge, ours is the first analysis of severe opioid‐related adverse events in nonsurgical patients.
Our finding that severe opioid‐related adverse events increase as opioid prescribing increases is consistent with that which has been demonstrated in the community setting, where rates of opioid‐related adverse events and mortality are higher in communities with higher levels of opioid prescribing.[2, 8, 25] This finding is expected, as greater use of a class of medications with known side effects would be expected to result in a higher overall rate of adverse events. More concerning, however, is the fact that this relationship persists when focusing exclusively on opioid‐exposed patients. Among similar patients receiving opioids at different hospitals, those hospitalized in facilities with higher opioid‐prescribing rates have higher rates of severe opioid‐related adverse events. This suggests that hospitals that use opioids more frequently do not do so more safely. Rather, the increased overall prescribing rates are associated with heightened risk for a serious adverse event per patient exposed and may reflect unsafe prescribing practices.
Furthermore, our results demonstrate both regional and hospital variation in use of opioids not fully explained by patient characteristics, similar to that which has been demonstrated for other drugs and heathcare services.[26, 27, 28, 29, 30] The implications of these findings are limited by our lack of information on pain severity or prior outpatient treatment, and our resultant inability to evaluate the appropriateness of opioid use in this analysis. Additionally, although we controlled for a large number of patient and hospital characteristics, there could be other significant predictors of use not accounted for in our analysis. However, it seems unlikely that differential pain severity or patient characteristics between patients in different regions of the country could fully explain a 37% relative difference in prescribing between the lowest‐ and highest‐prescribing regions, after accounting for the 44 patient‐level variables in our models. Whereas variation in use unrelated to patient factors could represent inappropriate prescribing practices, it could also be a marker of uncertainty regarding what constitutes appropriate prescribing and high‐quality care in this realm. Although guidelines advocate for standard pain assessments and a step‐up approach to treatment,[31, 32, 33] the lack of objective measures of pain severity and lack of evidence‐based recommendations on the use of opioids for noncancer pain[34] will almost certainly lead to persistent variation in opioid prescribing despite guideline‐driven care.
Nonetheless, our findings suggest that opportunities exist to make opioid prescribing safer in hospitalized patients. Studies aimed at elucidating the source of regional and hospital variation are necessary. Additionally, efforts should focus on identifying patient and prescribing characteristics associated with heightened risk of opioid‐related adverse events. Prior studies have demonstrated that the risks of opioid medications increase with increasing age of the patient.[35, 36] Although opioid use in our cohort declined with age, 44% of admissions age 65 years had charges for opioid medications. Studies in outpatients have also demonstrated that the risks of opioid overdose and overdose‐related death increase with dose.[5, 7] One study demonstrated a 3.7‐fold increased risk of overdose at doses of 5099 mg/day in oral morphine equivalents, and an 8.9‐fold increased risk at doses of 100 mg/day, compared with doses of 20 mg/day.[7] The prevalence of high dose exposure observed in our cohort, coupled with the older age of hospitalized patients, suggests potential targets for promoting safer use in hospitalized patients through interventions such as computerized decision support and enhanced monitoring in those at highest risk.
Because medications after discharge were unavailable in our dataset, the percentage of patients given a prescription for opioid medication on discharge is unknown. However, given that opioids are often tapered rather than abruptly discontinued, our finding that 26% of hospitalized nonsurgical patients received opioids on the day of discharge suggests that a substantial proportion of patients may be discharged with a prescription for opioid medication. Given the possibility of coexistent outpatient opioid prescriptions, these findings draw attention to the importance of assuring development and streamlined accessibility of data from state prescription drug monitoring programs and suggest that increased attention should be paid to the role that inpatient opioid prescribing plays in the increased rates of chronic opioid use and overdose‐related deaths in the United States.
There are additional limitations to our analysis. First, although the database used for this analysis captures a large proportion of admissions to US acute‐care facilities and is similar in composition, it is possible that participating medical centers differ from nonparticipating medical centers in ways that could be associated with opioid prescribing. Additionally, although Premier performs extensive validation and correction processes to assure the quality of their data, there is still likely to be a small amount of random error in the database, which could particularly impact dosage calculations. The lack of preadmission medications in our database precluded identification of the proportion of patients newly started on opioid medications. Lastly, it is possible that the hospital prescribing‐rate quartile is associated with patient characteristics unaccounted for in our analysis, and, therefore, the possibility of residual confounding still exists.
In conclusion, the majority of hospitalized nonsurgical patients are exposed to opioid medications during the course of their hospitalizations, often at high doses. More than half of those exposed are still receiving these medications on the day of discharge. We found hospital and regional variation in opioid use that was not fully explained by patient characteristics, and higher levels of hospital use were associated with higher risk of severe opioid‐related adverse events in opioid‐exposed patients. Further research is necessary to investigate the appropriateness of opioid use in this patient population, the sources of variation in use, and the predictors of opioid‐related adverse events in hospitalized patients to allow development of interventions to make hospital use safer.
Disclosures
Disclosures: Dr. Herzig had full access to all of the data in the study and takes responsibility for the integrity of the data and the accuracy of the data analysis. Dr. Herzig was funded by grant no. K23AG042459 from the National Institute on Aging. Dr. Marcantonio was funded by grant nos. P01AG031720, R01AG030618, R03AG028189, and K24AG035075 from the National Institute on Aging. The funding organization had no involvement in any aspect of the study, including design, conduct, and reporting of the study. None of the authors have any conflicts of interest to disclose.
- . A flood of opioids, a rising tide of deaths. N Engl J Med. 2010;363(21):1981–1985.
- , , . Increasing deaths from opioid analgesics in the United States. Pharmacoepidemiol Drug Saf. 2006;15(9):618–627.
- , , , . Trends in opioid prescribing by race/ethnicity for patients seeking care in US emergency departments. JAMA. 2008;299(1):70–78.
- , , , . Trends in medical use and abuse of opioid analgesics. JAMA. 2000;283(13):1710–1714.
- , , , et al. Association between opioid prescribing patterns and opioid overdose‐related deaths. JAMA. 2011;305(13):1315–1321.
- , , , et al. Prescription opioid mortality trends in New York City, 1990–2006: examining the emergence of an epidemic. Drug Alcohol Depend. 2013;132(1‐2):53–62.
- , , , et al. Opioid prescriptions for chronic pain and overdose: a cohort study. Ann Intern Med. 2010;152(2):85–92.
- , , , et al. Relationship of opioid prescription sales and overdoses, North Carolina. Drug Alcohol Depend. 2013;132(1‐2):81–86.
- Deaths from prescription opioids soar in New York. BMJ. 2013;346:f921.
- , , . Mortality in elderly dementia patients treated with risperidone. J Clin Psychopharmacol. 2006;26(6):566–570.
- , , , et al. Medication reconciliation: a practical tool to reduce the risk of medication errors. J Crit Care. 2003;18(4):201–205.
- , , . Adverse drug event trigger tool: a practical methodology for measuring medication related harm. Qual Saf Health Care. 2003;12(3):194–200.
- , , , , . Improvement in the detection of adverse drug events by the use of electronic health and prescription records: an evaluation of two trigger tools. Eur J Clin Pharmacol. 2013;69(2):255–259.
- , . Adverse Drug Events in U.S. Hospitals, 2004. Rockville, MD: Agency for Healthcare Research and Quality; April 2007. Statistical Brief 29.
- , , . Medication‐Related Adverse Outcomes in U.S. Hospitals and Emergency Departments, 2008. Rockville, MD: Agency for Healthcare Research and Quality; April 2011. Statistical Brief 109.
- US Centers for Medicare and Medicaid Services. Hospital‐Acquired Conditions (Present on Admission Indicator). Available at: http://www.cms.hhs.gov/HospitalAcqCond/. Accessed August 16, 2011. Updated September 20, 2012.
- , , . Fracture risk associated with the use of morphine and opiates. J Intern Med. 2006;260(1):76–87.
- , , , . Comorbidity measures for use with administrative data. Med Care. 1998;36(1):8–27.
- Clinical Classifications Software, Healthcare Cost and Utilization Project (HCUP). Rockville, MD; Agency for Healthcare Research and Quality; December 2009.
- , , , , . Clinical application of opioid equianalgesic data. Clin J Pain. 2003;19(5)286–297.
- , , , , , . Choosing the unit of measurement counts: the use of oral morphine equivalents in studies of opioid consumption is a useful addition to defined daily doses. Palliat Med. 2011;25(7):725–732.
- , , , . Cost and quality implications of opioid‐based postsurgical pain control using administrative claims data from a large health system: opioid‐related adverse events and their impact on clinical and economic outcomes. Pharmacotherapy. 2013;33(4):383–391.
- , , , et al. Opioid‐related adverse drug events in surgical hospitalizations: impact on costs and length of stay. Ann Pharmacother. 2007;41(3):400–406.
- , , , et al. Cost of opioid‐related adverse drug events in surgical patients. J Pain Symptom Manage. 2003;25(3):276–283.
- , . Opioid analgesics and rates of fatal drug poisoning in the United States. Am J Prev Med. 2006;31(6):506–511.
- , , , et al. Geographic variation in the treatment of acute myocardial infarction: the Cooperative Cardiovascular Project. JAMA. 1999;281(7):627–633.
- , , , et al; GUSTO‐1 Investigators. Regional variation across the United States in the management of acute myocardial infarction. Global Utilization of Streptokinase and Tissue Plasminogen Activator for Occluded Coronary Arteries. N Engl J Med. 1995;333(9):565–572.
- , , . Predictors of broad‐spectrum antibiotic prescribing for acute respiratory tract infections in adult primary care. JAMA. 2003;289(6):719–725.
- , , . Geographic variation in Medicare drug spending. N Engl J Med. 2010;363(5):405–409.
- , , . Geographic variation in outpatient antibiotic prescribing among older adults. Arch Intern Med. 2012;172(19):1465–1471.
- , , , et al. Clinical policy: critical issues in the prescribing of opioids for adult patients in the emergency department. Ann Emerg Med. 2012;60(4):499–525.
- The Joint Commission. Facts About Pain Management. Available at: http://www.jointcommission.org/pain_management/. Accessed July 23, 2012.
- The Joint Commission. Sentinel Event Alert: Safe Use of Opioids in Hospitals. Published August 8, 2012. Available at: http://www.jointcommission.org/assets/1/18/SEA_49_opioids_8_2_12_final.pdf. Accessed March 4, 2013.
- , , , , . Research gaps on use of opioids for chronic noncancer pain: findings from a review of the evidence for an American Pain Society and American Academy of Pain Medicine clinical practice guideline. J Pain. 2009;10(2):147–159.
- , , , , , . Side effects of opioids during short‐term administration: effect of age, gender, and race. Clin Pharmacol Ther. 2003;74(2):102–112.
- , , , . Postoperative day one: a high‐risk period for respiratory events. Am J Surg. 2005;190(5):752–756.
© 2013 Society of Hospital Medicine