User login
The Diagnostic Yield of Noninvasive Microbiologic Sputum Sampling in a Cohort of Patients with Clinically Diagnosed Hospital-Acquired Pneumonia
Pneumonia is a major cause of hospitalization, mortality, and healthcare cost. 1,2 The diagnosis involves clinical features plus radiographic evidence of infection. Hospital-acquired pneumonia (HAP) is defined by the Infectious Disease Society of America (IDSA) as a pneumonia that occurs ≥48 hours after admission and is not associated with mechanical ventilation. 3
IDSA recommendations suggest that patients with suspected HAP be treated based on results of noninvasively obtained sputum cultures rather than being treated empirically. 3 This recommendation is graded as weak with low-quality evidence based on a lack of both evidence showing that respiratory cultures improve clinical outcomes and studies examining the yield of noninvasive collection methods. 4,5 However, resistant pathogens lead to a risk of inadequate empiric therapy, which is associated with increased mortality. 6 Culture data may provide an opportunity for escalation or de-escalation of antibiotic coverage. IDSA recommendations for microbiologic sampling are thus aimed at increasing appropriate coverage and minimizing unnecessary antibiotic exposure.
While the yield and clinical utility of sputum culture in community-acquired pneumonia has been studied extensively, data examining the yield of sputum culture in HAP (non–ventilator-associated pneumonia [non-VAP]) are sparse. In 1 small single-center study, researchers demonstrated positive sputum cultures in 17/35 (48.6%) patients with radiographically confirmed cases of HAP, 7 while in another study, researchers demonstrated positive sputum cultures in 57/63 (90.5%). 8 We aimed to identify the frequency with which sputum cultures positively identify an organism, identify predictors of positive sputum cultures, and characterize the microbiology of sputum cultures in a large cohort of HAP cases.
METHODS
We conducted a retrospective cohort study of patients admitted to a large academic medical center in Boston, Massachusetts, from January 2007 to July 2013. All patients ≥18 years of age were eligible for inclusion. We excluded outside hospital transfers, those with a length of hospitalization <48 hours, and psychiatric admissions.
The study was approved by the institutional review board at the Beth Israel Deaconess Medical Center and granted a waiver of informed consent. Data were collected from electronic databases and supplemented by chart review.
Hospital-Acquired Pneumonia
We defined HAP as pneumonia occurring at least 48 hours after admission, consistent with American Thoracic Society and IDSA criteria.3 To identify cases, we reviewed the charts of all admissions identified as having a discharge International Classification of Diseases, Ninth Revision, Clinical Modification (ICD-9-CM) code for bacterial pneumonia (481, 482, 483, 485, 486, 507), indicated as not “present-on-admission.” We validated that the treating clinician had clinically diagnosed pneumonia and initiated antibiotics for this purpose by performing chart review. We reviewed the radiologist interpretation of radiographs surrounding the date of the clinical diagnosis of pneumonia to confirm the presence of a new opacity. Uncertain cases (with respect to either the presence of pneumonia or the timing of the diagnosis) were reviewed by a second member of the study team and, in the case of disagreement, adjudicated by a third member of the study team. Only the first clinically validated HAP per hospitalization was included in the analysis. To focus on HAP rather than VAP, we excluded hospitalizations in which the date of a procedure code for mechanical ventilation preceded the date of pneumonia diagnosis.
Microbiology
In our analysis, we used sputum samples obtained from expectorated or induced samples to evaluate the yield of noninvasive sputum sampling, as recommended by the IDSA. We included sputum samples collected ≥48 hours after admission and within 7 days of the clinical diagnosis of HAP. Sputum samples with >10 epithelial cells per high-power field (hpf) were considered to be contaminated. Among noncontaminated samples, positive sputum cultures were defined as those with a microbiologic diagnosis other than “oral flora,” while those with no growth or growth of oral flora or only yeast were considered to be negative. The hospital’s microbiology laboratory does not routinely provide species identification for Gram-negative rods (GNRs) growing on culture in the presence of growth of ≥3 other colony types. We considered such GNRs (not further speciated) to represent a positive culture result in our analysis given that colonization versus pathogenicity is a clinical distinction and, as such, these results may impact antibiotic choice.
Statistical Analysis
Data were analyzed by using SAS software, version 9.3. We used a 2-sided P value of <0.05 to indicate statistical significance for all comparisons. We used the χ2 test and the nonparametric median test for unadjusted comparisons.
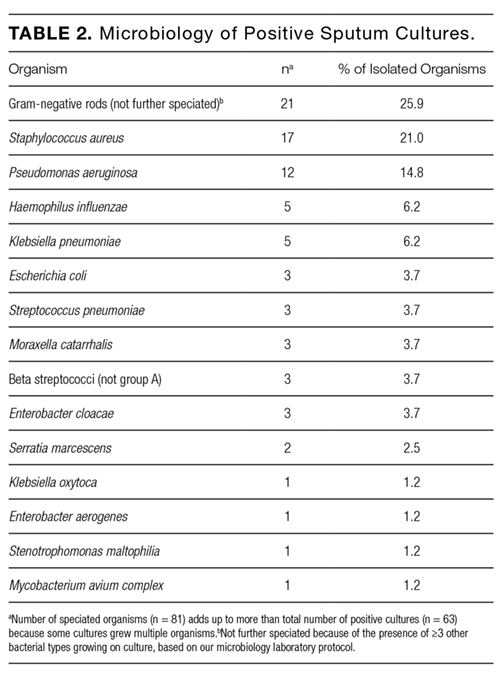
To identify predictors of a positive (versus negative or contaminated) sputum culture among patients with HAP, we used a generalized estimating equation model with a Poisson distribution error term, log link, and first-order autoregressive correlation structure to account for multiple sputum specimens per patient. We combined culture negative and contaminated samples to highlight the clinical utility of sputum culture in a real-world setting. Potential predictors chosen based on clinical grounds included all variables listed in Table 1. We defined comorbidities specified in Table 1 via ICD-9-CM secondary diagnosis codes and diagnosis related groups (DRGs) using Healthcare Cost and Utilization Project Comorbidity Software, version 3.7, based on the work of Elixhauser et al.9,10; dialysis use was defined by an ICD-9-CM procedure code of 39.95; inpatient steroid use was defined by a hospital pharmacy charge for a systemic steroid in the 7 days preceding the sputum sample.
RESULTS
There were 230,635 hospitalizations of patients ≥18 years of age from January 2007 to July 2013. After excluding outside hospital transfers (n = 14,422), hospitalizations <48 hours in duration (n = 59,774), and psychiatric hospitalizations (n = 9887), there were 146,552 hospitalizations in the cohort.
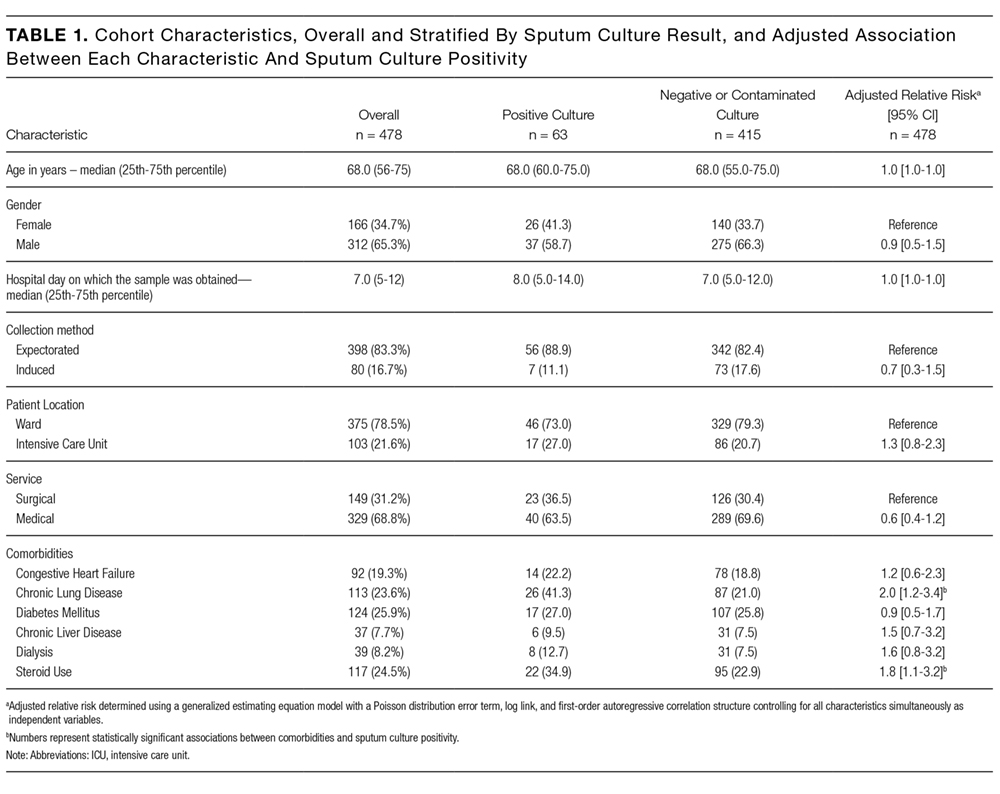
The top 3 bacterial organisms cultured from sputum samples were GNRs not further speciated (25.9%), Staphylococcus aureus (21.0%), and Pseudomonas aeruginosa (14.8%). The frequencies of isolated microorganisms are presented in Table 2.
In an adjusted analysis (Table 1), the significant predictors of a positive sputum culture were chronic lung disease (relative risk [RR] = 2.0; 95% confidence interval [CI], 1.2-3.4) and steroid use (RR = 1.8; 95% CI, 1.1-3.2).
DISCUSSION
To our knowledge, our study is the first to assess the predictors of positive sputum culture among patients with HAP (non-VAP) who had sputum samples obtained noninvasively, and this study is larger than prior studies in which researchers reported on sputum culture yield in HAP. Sputum samples were obtained in 29.4% cases of clinically diagnosed HAP. Although 87% of specimens obtained were culture-negative or contaminated, 13% yielded a bacterial organism. Although we do not report the antibiotic sensitivity patterns of the isolated organisms, the organisms identified frequently demonstrate antibiotic resistance, highlighting the potential for both antibiotic escalation and de-escalation based on sputum culture. In a multivariable model, presence of chronic lung disease and steroid use in the preceding week were both significantly associated with culture positivity.
The retrospective nature of the study raises the possibility of selection bias from systematic differences between the 29.4% of patients with HAP who had sputum collected and those who did not. Patients with sputum cultures were similar to patients without cultures in most measured characteristics, but we are unable to know what the yield of noninvasive sputum culture would have been had all patients with HAP been sampled. As such, our findings reflect the yield of sputum culture among patients with HAP for whom cultures were successfully obtained. It is not clear why only 29.4% of HAP patients received IDSA guideline-concordant care, but similar rates of culture use are reported elsewhere.7 While physician decision-making could have contributed to this finding, it is also possible that many sick, hospitalized patients are simply unable to produce sputum for analysis. In future studies, researchers should examine barriers to guideline-concordant care.
We considered a culture result of GNRs (not further speciated) as positive in our analysis because this result indicates growth of mixed bacterial types, the pathogenicity of which is a clinical determination. Physicians may request speciation and antibiotic sensitivities and, as such, these results have the potential to impact antibiotic choice. Had we considered such cultures to be negative or contaminated, the rate of culture positivity would have been only slightly reduced from 63/478 (13.2%) to 50/478 (10.5%).
The strengths of our study include the chart-based validation of administratively identified cases of pneumonia and a large cohort. There are also limitations. The single-center nature of the study has implications for pretest probability and generalizability. Additionally, in our study, we did not examine outcomes among patients treated empirically versus those treated based on sputum culture results. Finally, our reliance on administrative codes to identify cases of HAP for subsequent validation could have resulted in incomplete capture of HAP cases.
In conclusion, in our study, we provide an estimate of the diagnostic yield of sputum culture in a large cohort with chart-validated HAP, a description of HAP microbiology, and predictors of positive sputum culture. Thirteen percent of patients who had sputum culture testing received a microbiologic diagnosis. Because of the relative ease of obtaining a sputum sample and the microbiologic distribution in our study (representing a mix of commonly drug-resistant pathogens and more typical community-acquired pathogens), we suggest that sputum culture in HAP is a useful diagnostic tool with the potential to inform antibiotic escalation or de-escalation.
Acknowledgments
Dr. Herzig was funded by grant number K23AG042459 from the National Institute on Aging. Dr. Marcantonio was funded by grant number K24AG035075 from the National Institute on Aging. The funding organizations had no involvement in any aspect of the study, including design and conduct of the study; collection, management, analysis, and interpretation of the data; and preparation, review, or approval of the manuscript.
Disclosure
No conflicts of interest apply for any of the authors.
1. Kochanek KD, Xu J, Murphy SL, Miniño AM, Kung HC. Deaths: Final Data for 2009. Natl Vital Stat Rep. 2011;60(3):1-116. PubMed
2. Bonafede MM, Suaya JA, Wilson KL, Mannino DM, Polsky D. Incidence and cost of CAP in a large working-age population. Am J Manag Care. 2012;18(7):380-387. PubMed
3. Kalil AC, Metersky ML, Klompas M, et al. Management of Adults With Hospital-acquired and Ventilator-associated Pneumonia: 2016 Clinical Practice Guidelines by the Infectious Diseases Society of America and the American Thoracic Society. Clin Infect Dis. 2016;63(5):e61-e111. PubMed
4. Wahl WL, Franklin GA, Brandt MM, et al. Does bronchoalveolar lavage enhance our ability to treat ventilator-associated pneumonia in a trauma-burn intensive care unit? J Trauma. 2003;54(4):633-638. PubMed
5. Herer B, Fuhrman C, Demontrond D, Gazevic Z, Housset B, Chouaïd C. Diagnosis of nosocomial pneumonia in medical ward: Repeatability of the protected specimen brush. Eur Respir J. 2001;18(1):157-163. PubMed
6. Chung DR, Song JH, Kim SH, et al. High prevalence of multidrug-resistant nonfermenters in hospital-acquired pneumonia in Asia. Am J Respir Crit Care Med. 2011;184(12):1409-1417. PubMed
7. Russell CD, Koch O, Laurenson IF, O’Shea DT, Sutherland R, Mackintosh CL. Diagnosis and features of hospital-acquired pneumonia: a retrospective cohort study. J Hosp Infect. 2016;92(3):273-279. PubMed
8. Messika J, Stoclin A, Bouvard E, et al. The Challenging Diagnosis of Non-Community-Acquired Pneumonia in Non-Mechanically Ventilated Subjects: Value of Microbiological Investigation. Respir Care. 2016;61(2):225-234. PubMed
9. Elixhauser A, Steiner C, Harris DR, Coffey RM. Comorbidity measures for use with administrative data. Med Care. 1998;36(1):8-27. PubMed
10. HCUP Comorbidity Software. Healthcare Cost and Utilization Project (HCUP). January 2013. Agency for Healthcare Research and Quality, Rockville, MD. Available at: www.hcup-us.ahrq.gov/toolssoftware/comorbidity/comorbidity.jsp. Accessed on March 15, 2016.
Pneumonia is a major cause of hospitalization, mortality, and healthcare cost. 1,2 The diagnosis involves clinical features plus radiographic evidence of infection. Hospital-acquired pneumonia (HAP) is defined by the Infectious Disease Society of America (IDSA) as a pneumonia that occurs ≥48 hours after admission and is not associated with mechanical ventilation. 3
IDSA recommendations suggest that patients with suspected HAP be treated based on results of noninvasively obtained sputum cultures rather than being treated empirically. 3 This recommendation is graded as weak with low-quality evidence based on a lack of both evidence showing that respiratory cultures improve clinical outcomes and studies examining the yield of noninvasive collection methods. 4,5 However, resistant pathogens lead to a risk of inadequate empiric therapy, which is associated with increased mortality. 6 Culture data may provide an opportunity for escalation or de-escalation of antibiotic coverage. IDSA recommendations for microbiologic sampling are thus aimed at increasing appropriate coverage and minimizing unnecessary antibiotic exposure.
While the yield and clinical utility of sputum culture in community-acquired pneumonia has been studied extensively, data examining the yield of sputum culture in HAP (non–ventilator-associated pneumonia [non-VAP]) are sparse. In 1 small single-center study, researchers demonstrated positive sputum cultures in 17/35 (48.6%) patients with radiographically confirmed cases of HAP, 7 while in another study, researchers demonstrated positive sputum cultures in 57/63 (90.5%). 8 We aimed to identify the frequency with which sputum cultures positively identify an organism, identify predictors of positive sputum cultures, and characterize the microbiology of sputum cultures in a large cohort of HAP cases.
METHODS
We conducted a retrospective cohort study of patients admitted to a large academic medical center in Boston, Massachusetts, from January 2007 to July 2013. All patients ≥18 years of age were eligible for inclusion. We excluded outside hospital transfers, those with a length of hospitalization <48 hours, and psychiatric admissions.
The study was approved by the institutional review board at the Beth Israel Deaconess Medical Center and granted a waiver of informed consent. Data were collected from electronic databases and supplemented by chart review.
Hospital-Acquired Pneumonia
We defined HAP as pneumonia occurring at least 48 hours after admission, consistent with American Thoracic Society and IDSA criteria.3 To identify cases, we reviewed the charts of all admissions identified as having a discharge International Classification of Diseases, Ninth Revision, Clinical Modification (ICD-9-CM) code for bacterial pneumonia (481, 482, 483, 485, 486, 507), indicated as not “present-on-admission.” We validated that the treating clinician had clinically diagnosed pneumonia and initiated antibiotics for this purpose by performing chart review. We reviewed the radiologist interpretation of radiographs surrounding the date of the clinical diagnosis of pneumonia to confirm the presence of a new opacity. Uncertain cases (with respect to either the presence of pneumonia or the timing of the diagnosis) were reviewed by a second member of the study team and, in the case of disagreement, adjudicated by a third member of the study team. Only the first clinically validated HAP per hospitalization was included in the analysis. To focus on HAP rather than VAP, we excluded hospitalizations in which the date of a procedure code for mechanical ventilation preceded the date of pneumonia diagnosis.
Microbiology
In our analysis, we used sputum samples obtained from expectorated or induced samples to evaluate the yield of noninvasive sputum sampling, as recommended by the IDSA. We included sputum samples collected ≥48 hours after admission and within 7 days of the clinical diagnosis of HAP. Sputum samples with >10 epithelial cells per high-power field (hpf) were considered to be contaminated. Among noncontaminated samples, positive sputum cultures were defined as those with a microbiologic diagnosis other than “oral flora,” while those with no growth or growth of oral flora or only yeast were considered to be negative. The hospital’s microbiology laboratory does not routinely provide species identification for Gram-negative rods (GNRs) growing on culture in the presence of growth of ≥3 other colony types. We considered such GNRs (not further speciated) to represent a positive culture result in our analysis given that colonization versus pathogenicity is a clinical distinction and, as such, these results may impact antibiotic choice.
Statistical Analysis
Data were analyzed by using SAS software, version 9.3. We used a 2-sided P value of <0.05 to indicate statistical significance for all comparisons. We used the χ2 test and the nonparametric median test for unadjusted comparisons.
To identify predictors of a positive (versus negative or contaminated) sputum culture among patients with HAP, we used a generalized estimating equation model with a Poisson distribution error term, log link, and first-order autoregressive correlation structure to account for multiple sputum specimens per patient. We combined culture negative and contaminated samples to highlight the clinical utility of sputum culture in a real-world setting. Potential predictors chosen based on clinical grounds included all variables listed in Table 1. We defined comorbidities specified in Table 1 via ICD-9-CM secondary diagnosis codes and diagnosis related groups (DRGs) using Healthcare Cost and Utilization Project Comorbidity Software, version 3.7, based on the work of Elixhauser et al.9,10; dialysis use was defined by an ICD-9-CM procedure code of 39.95; inpatient steroid use was defined by a hospital pharmacy charge for a systemic steroid in the 7 days preceding the sputum sample.
RESULTS
There were 230,635 hospitalizations of patients ≥18 years of age from January 2007 to July 2013. After excluding outside hospital transfers (n = 14,422), hospitalizations <48 hours in duration (n = 59,774), and psychiatric hospitalizations (n = 9887), there were 146,552 hospitalizations in the cohort.
The top 3 bacterial organisms cultured from sputum samples were GNRs not further speciated (25.9%), Staphylococcus aureus (21.0%), and Pseudomonas aeruginosa (14.8%). The frequencies of isolated microorganisms are presented in Table 2.
In an adjusted analysis (Table 1), the significant predictors of a positive sputum culture were chronic lung disease (relative risk [RR] = 2.0; 95% confidence interval [CI], 1.2-3.4) and steroid use (RR = 1.8; 95% CI, 1.1-3.2).
DISCUSSION
To our knowledge, our study is the first to assess the predictors of positive sputum culture among patients with HAP (non-VAP) who had sputum samples obtained noninvasively, and this study is larger than prior studies in which researchers reported on sputum culture yield in HAP. Sputum samples were obtained in 29.4% cases of clinically diagnosed HAP. Although 87% of specimens obtained were culture-negative or contaminated, 13% yielded a bacterial organism. Although we do not report the antibiotic sensitivity patterns of the isolated organisms, the organisms identified frequently demonstrate antibiotic resistance, highlighting the potential for both antibiotic escalation and de-escalation based on sputum culture. In a multivariable model, presence of chronic lung disease and steroid use in the preceding week were both significantly associated with culture positivity.
The retrospective nature of the study raises the possibility of selection bias from systematic differences between the 29.4% of patients with HAP who had sputum collected and those who did not. Patients with sputum cultures were similar to patients without cultures in most measured characteristics, but we are unable to know what the yield of noninvasive sputum culture would have been had all patients with HAP been sampled. As such, our findings reflect the yield of sputum culture among patients with HAP for whom cultures were successfully obtained. It is not clear why only 29.4% of HAP patients received IDSA guideline-concordant care, but similar rates of culture use are reported elsewhere.7 While physician decision-making could have contributed to this finding, it is also possible that many sick, hospitalized patients are simply unable to produce sputum for analysis. In future studies, researchers should examine barriers to guideline-concordant care.
We considered a culture result of GNRs (not further speciated) as positive in our analysis because this result indicates growth of mixed bacterial types, the pathogenicity of which is a clinical determination. Physicians may request speciation and antibiotic sensitivities and, as such, these results have the potential to impact antibiotic choice. Had we considered such cultures to be negative or contaminated, the rate of culture positivity would have been only slightly reduced from 63/478 (13.2%) to 50/478 (10.5%).
The strengths of our study include the chart-based validation of administratively identified cases of pneumonia and a large cohort. There are also limitations. The single-center nature of the study has implications for pretest probability and generalizability. Additionally, in our study, we did not examine outcomes among patients treated empirically versus those treated based on sputum culture results. Finally, our reliance on administrative codes to identify cases of HAP for subsequent validation could have resulted in incomplete capture of HAP cases.
In conclusion, in our study, we provide an estimate of the diagnostic yield of sputum culture in a large cohort with chart-validated HAP, a description of HAP microbiology, and predictors of positive sputum culture. Thirteen percent of patients who had sputum culture testing received a microbiologic diagnosis. Because of the relative ease of obtaining a sputum sample and the microbiologic distribution in our study (representing a mix of commonly drug-resistant pathogens and more typical community-acquired pathogens), we suggest that sputum culture in HAP is a useful diagnostic tool with the potential to inform antibiotic escalation or de-escalation.
Acknowledgments
Dr. Herzig was funded by grant number K23AG042459 from the National Institute on Aging. Dr. Marcantonio was funded by grant number K24AG035075 from the National Institute on Aging. The funding organizations had no involvement in any aspect of the study, including design and conduct of the study; collection, management, analysis, and interpretation of the data; and preparation, review, or approval of the manuscript.
Disclosure
No conflicts of interest apply for any of the authors.
1. Kochanek KD, Xu J, Murphy SL, Miniño AM, Kung HC. Deaths: Final Data for 2009. Natl Vital Stat Rep. 2011;60(3):1-116. PubMed
2. Bonafede MM, Suaya JA, Wilson KL, Mannino DM, Polsky D. Incidence and cost of CAP in a large working-age population. Am J Manag Care. 2012;18(7):380-387. PubMed
3. Kalil AC, Metersky ML, Klompas M, et al. Management of Adults With Hospital-acquired and Ventilator-associated Pneumonia: 2016 Clinical Practice Guidelines by the Infectious Diseases Society of America and the American Thoracic Society. Clin Infect Dis. 2016;63(5):e61-e111. PubMed
4. Wahl WL, Franklin GA, Brandt MM, et al. Does bronchoalveolar lavage enhance our ability to treat ventilator-associated pneumonia in a trauma-burn intensive care unit? J Trauma. 2003;54(4):633-638. PubMed
5. Herer B, Fuhrman C, Demontrond D, Gazevic Z, Housset B, Chouaïd C. Diagnosis of nosocomial pneumonia in medical ward: Repeatability of the protected specimen brush. Eur Respir J. 2001;18(1):157-163. PubMed
6. Chung DR, Song JH, Kim SH, et al. High prevalence of multidrug-resistant nonfermenters in hospital-acquired pneumonia in Asia. Am J Respir Crit Care Med. 2011;184(12):1409-1417. PubMed
7. Russell CD, Koch O, Laurenson IF, O’Shea DT, Sutherland R, Mackintosh CL. Diagnosis and features of hospital-acquired pneumonia: a retrospective cohort study. J Hosp Infect. 2016;92(3):273-279. PubMed
8. Messika J, Stoclin A, Bouvard E, et al. The Challenging Diagnosis of Non-Community-Acquired Pneumonia in Non-Mechanically Ventilated Subjects: Value of Microbiological Investigation. Respir Care. 2016;61(2):225-234. PubMed
9. Elixhauser A, Steiner C, Harris DR, Coffey RM. Comorbidity measures for use with administrative data. Med Care. 1998;36(1):8-27. PubMed
10. HCUP Comorbidity Software. Healthcare Cost and Utilization Project (HCUP). January 2013. Agency for Healthcare Research and Quality, Rockville, MD. Available at: www.hcup-us.ahrq.gov/toolssoftware/comorbidity/comorbidity.jsp. Accessed on March 15, 2016.
© 2018 Society of Hospital Medicine
Hospital Antipsychotic Use
Antipsychotic medications are frequently used off label for management of behavioral symptoms associated with delirium and/or dementia. Despite regulations designed to curb inappropriate prescribing of these medications in nursing homes, substantial levels of use and variation in use have been observed in this setting.[1] Although antipsychotic medications are also frequently used in the hospital, the scope and variation in use have not been adequately investigated. Given the lack of oversight for medication prescribing in the hospital setting and the frequency of delirium, occurring in 15% to 26% of hospitalized older adults,[2, 3, 4] off‐label use of antipsychotic medications and variation in use could be substantial.
Because variation in practice is known to increase in the setting of controversy or lack of clarity regarding appropriate management,[5] large degrees of variation can draw attention to priority areas for clinical effectiveness studies, and the need for guidelines, clinical decision support, or regulatory oversight. In the absence of clear guidelines for the use of antipsychotic medication in nonpsychiatric hospitalized patients, we hypothesized that significant variation in use would persist after controlling for patient characteristics. Using a large, nationally representative cohort of admissions to 300 hospitals from July 2009 to June 2010, we sought to investigate prescribing patterns and hospital variation in use of antipsychotic medications in nonpsychiatric admissions to US hospitals.
METHODS
Setting and Data Collection
We conducted a retrospective cohort study using data from 300 US, nonfederal, acute care facilities contributing to the database maintained by Premier (Premier Healthcare Solutions, Inc., Charlotte, NC). This nationally representative database, created to measure healthcare utilization and quality of care, is drawn from voluntarily participating hospitals and contains data on approximately 1 in every 4 discharges nationwide.[6] Participating hospitals are similar in geographic distribution and urban/rural status to hospitals nationwide, although large, nonteaching hospitals are slightly over‐represented. The study was approved by the institutional review board at Beth Israel Deaconess Medical Center.
Inclusion and Exclusion Criteria
We studied a cohort of all adult (18 years) nonpsychiatric admissions to participating hospitals from July 1, 2009 through June 30, 2010. We excluded patients admitted to a psychiatry service or with any discharge diagnosis of a psychotic disorder (defined by the Elixhauser comorbidity Psychoses: 295.00‐298.9, 299.10‐299.11), because we were interested in use of antipsychotics for conditions other than primary psychiatric disorders. We also excluded patients with a charge for labor and delivery owing to the nonrepresentativeness of this patient population for the general hospitalized patient. We excluded admissions with unknown gender, and admissions with a length of stay greater than 365 days, as these admissions are not representative of the typical admission to an acute care hospital. We also excluded hospitals contributing less than 100 admissions owing to lack of precision in corresponding hospital prescribing rates.
Antipsychotic Medication Utilization
In‐hospital antipsychotic use was ascertained from pharmacy charges, reflecting each medication dispensed during the hospitalization. We categorized antipsychotic medications as typical (haloperidol, loxapine, thioridazine, molindone, thiothixine, pimozide, fluphenazine, trifluoperazine, chlorpromazine, and perphenazine) and atypical (aripiprazole, asenapine, clozapine, iloperidone, lurasidone, olanzapine, paliperidone, quetiapine, risperidone, and ziprasidone) based on classification by the Food and Drug Administration.[7, 8] We excluded prochlorperazine (Compazine) from our typical antipsychotic definition, as this medication is almost exclusively used as an antiemetic.
In the absence of guidelines for use of antipsychotic agents in hospitalized patients, we used the Centers for Medicare and Medicaid Services (CMS) guidelines for long‐term care facilities to define measures of potentially excessive dosing in the hospital setting.[9] These guidelines define the daily dosage levels of antipsychotics above which the medical necessity of the higher dose should be explained in the medical record. We defined any daily dosage above these specified levels as a potentially excessive daily dose.
Characteristics Associated With Use
We investigated the association between antipsychotic use and patient and hospital characteristics, selected based on clinical grounds. Patient characteristics included: (1) demographic variables such as age (<65, 6574, 75+ years), gender, self‐reported race, marital status, and primary insurance; (2) admission characteristic variables, including admitting department (surgical vs nonsurgical, defined by a surgical attending of record and presence of operating room charges), whether the patient spent any time in the intensive care unit (ICU), and whether they received mechanical ventilation; and (3) potential indications for use, including delirium (included delirium superimposed upon dementia), dementia (without delirium), and insomnia (see Supporting Information, Appendix, in the online version of this article for International Classification of Diseases, Ninth Revision, Clinical Modification [ICD‐9‐CM] codes). Hospital characteristics included number of beds, urban versus rural status, teaching status, and US Census region.
Statistical Analysis
We report the proportion of admissions with in‐hospital use of any antipsychotic, and the number of days of exposure, overall and stratified by typical and atypical.
We determined potentially excessive dosing by taking the sum of the doses for a specific antipsychotic charged on a given day and comparing it to the CMS guidelines for long‐term care settings described above. We report the percentage of exposed admissions with at least 1 day of potentially excessive dosing.
All multivariable models below were operationalized as generalized estimating equations with a Poisson error term, log link, robust variance estimator,[10] and an exchangeable correlation structure to account for repeated admissions of the same patient.
We investigated patient and hospital characteristics associated with use of any antipsychotic medication using a multivariable model that simultaneously included all patient and hospital characteristics in Table 1 as independent variables.
| % of Cohort | Any Exposure, % | Typical Exposure, % | Atypical Exposure, % | |
|---|---|---|---|---|
| ||||
| Patient characteristics | ||||
| Age group, y | ||||
| <65 | 52.1 | 4.6 | 2.0 | 3.1 |
| 6574 | 18.5 | 5.2 | 2.7 | 3.1 |
| 75+ | 29.4 | 8.8 | 4.6 | 5.4 |
| Gender | ||||
| Male | 43.8 | 6.6 | 3.6 | 3.8 |
| Female | 56.2 | 5.5 | 2.3 | 3.8 |
| Race | ||||
| White | 64.6 | 6.1 | 2.9 | 4.0 |
| Black | 13.5 | 5.5 | 2.8 | 3.3 |
| Hispanic | 5.0 | 4.9 | 2.2 | 3.2 |
| Other | 19.9 | 6.1 | 3.1 | 3.7 |
| Marital Status | ||||
| Married | 42.5 | 4.6 | 2.4 | 2.7 |
| Single | 46.7 | 7.2 | 3.2 | 4.7 |
| Unknown/other | 10.8 | 6.4 | 3.1 | 4.1 |
| Primary insurance | ||||
| Private (commercial) | 28.8 | 3.0 | 1.5 | 1.8 |
| Medicaid | 10.3 | 6.4 | 2.4 | 4.6 |
| Medicare managed | 10.6 | 7.1 | 4.1 | 4.0 |
| Medicare traditional | 40.9 | 8.0 | 3.7 | 5.3 |
| Self‐pay or other | 9.4 | 4.3 | 2.5 | 2.2 |
| Admitting department | ||||
| Surgical | 60.6 | 5.8 | 3.1 | 3.4 |
| Nonsurgical | 39.4 | 6.2 | 2.4 | 4.4 |
| Any ICU stay | 16.6 | 10.4 | 7.2 | 4.9 |
| Mechanical ventilation | 4.7 | 17.4 | 12.9 | 7.9 |
| Diagnoses | ||||
| Delirium | 3.2 | 28.6 | 19.4 | 15.7 |
| Dementia | 3.1 | 27.4 | 12.0 | 20.2 |
| Insomnia | 1.3 | 10.2 | 3.9 | 7.5 |
| Discharge disposition | ||||
| Home | 77.9 | 3.8 | 1.6 | 2.5 |
| SNF/Rehab | 15.5 | 13.7 | 6.8 | 9.0 |
| Hospice | 1.7 | 16.0 | 10.3 | 8.1 |
| Other | 4.9 | 11.6 | 7.6 | 5.7 |
| Hospital characteristics, % | ||||
| No. of beds | ||||
| 200 | 14.1 | 6.1 | 2.8 | 3.8 |
| 201300 | 18.6 | 6.1 | 2.9 | 3.9 |
| 301500 | 37.7 | 5.9 | 2.9 | 3.7 |
| 500+ | 29.7 | 5.9 | 2.8 | 3.8 |
| Population served | ||||
| Urban | 89.4 | 6.0 | 2.9 | 3.8 |
| Rural | 10.6 | 5.8 | 2.4 | 3.9 |
| Teaching status | ||||
| Teaching | 39.2 | 5.8 | 2.9 | 3.7 |
| Nonteaching | 60.8 | 6.0 | 2.8 | 3.9 |
| US Census region | ||||
| West | 16.9 | 5.9 | 3.2 | 3.5 |
| Northeast | 20.1 | 6.1 | 2.9 | 3.9 |
| Midwest | 21.9 | 5.7 | 2.5 | 3.8 |
| South | 41.0 | 6.1 | 2.9 | 3.9 |
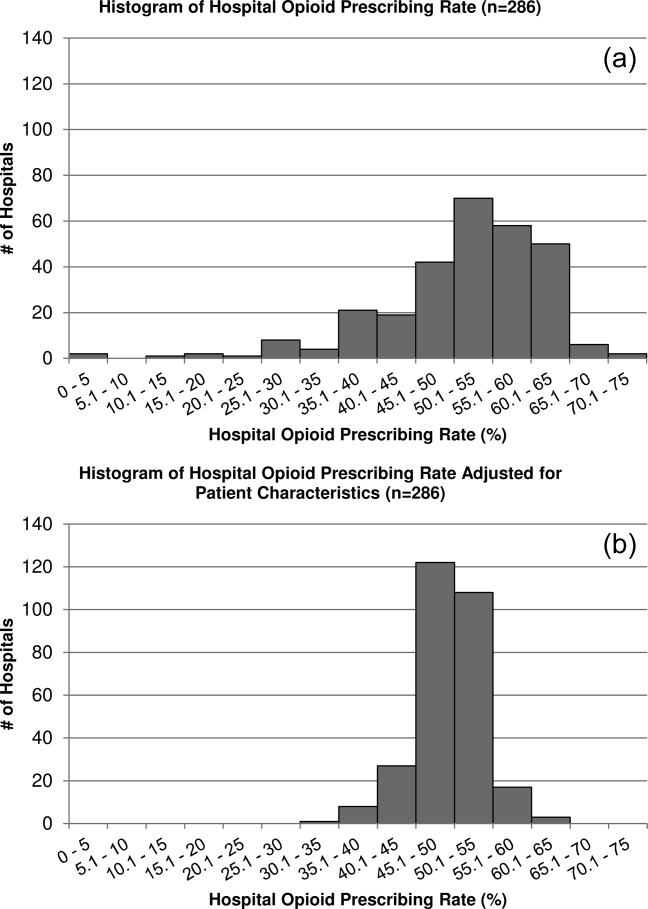
To determine hospital variation in antipsychotic use, we first determined the proportion of admissions at each hospital with at least 1 charge for antipsychotic medication. We then divided hospitals into quintiles based on their facility‐level antipsychotic prescribing rates and assigned all admissions to their corresponding hospital quintile. We then used a multivariable model to measure the adjusted association between prescribing quintile and patient‐level receipt of antipsychotic medication, controlling for all patient characteristics listed in Table 1 (except discharge disposition), and comorbidities using the Healthcare Cost and Utilization Project Comorbidity Software version 3.7 (Agency for Healthcare Research and Quality, Rockville, MD).[11] We used the lowest prescribing quintile as the reference group. We also report in the Supporting Information, Appendix, in the online version of this article, the distribution of prescribing rates for the hospitals in our cohort before and after adjustment for patient characteristics. For both approaches, we conducted stratified analyses in admissions with delirium and dementia.
All analyses were carried out using SAS software (SAS Institute Inc., Cary, NC).
RESULTS
Admission Characteristics
There were 3,190,934 admissions aged 18 years and over to 300 hospitals from July 1, 2009 to June 30, 2010. After excluding admissions with unknown gender (n = 17), length of stay greater than 365 days (n = 25), charges for labor and delivery (n = 323,111) or a psychiatric attending of record or psychiatric comorbidity (n = 172,669), and admissions to hospitals with fewer than 100 admissions (n = 31), our cohort included 2,695,081 admissions. The median age was 63 years (25th, 75th percentile 48, 77 years), and 1,514,986 (56%) were women. Table 1 shows the overall admission characteristics of the cohort and the percent exposed to antipsychotics among each patient and hospital characteristic.
Antipsychotic Use
There were 160,773 (6%) admissions with antipsychotic exposure. Among exposed admissions, 102,148 (64%) received atypical and 76,979 (48%) received typical antipsychotics, with 18,354 (11%) exposed to both. The median (25th, 75th percentile) length of stay among exposed was 5 days (3, 9 days), and the median (25th, 75th percentile) number of days of exposure was 3 (1, 5 days) overall, 3 days (2, 6 days) for atypical and 2 days (1, 3 days) for typical exposure.
Among admissions aged 65 to 74 years, 25,855 (5%) were exposed. Among admissions aged 75 years or older, 69,792 (9%) were exposed. Among admissions with delirium, exposure occurred in 24,787 (29%), with 13,640 (55%) receiving atypical, 16,828 (68%) receiving typical, and 5681 (23%) exposed to both. Among admissions with dementia, exposure occurred in 23,179 (27%), with 17,068 (74%) receiving atypical, 10,108 (44%) receiving typical, and 3997 (17%) exposed to both.
Use of Specific Drugs and Potentially Excessive Dosing
Table 2 demonstrates the most commonly used antipsychotic medications and the rates of potentially excessive dosing. Quetiapine and olanzapine were the most commonly used atypical antipsychotics, and haloperidol represented the majority of typical antipsychotic use. Among admissions with antipsychotic exposure, 47% received at least 1 potentially excessive daily dose, 18% of those with atypical exposure and 79% of those with typical exposure. Among admissions aged 65 years and up (n = 1,291,375), the prevalence of potentially excessive dosing was almost identical; 46% received at least 1 daily dose in excess of the recommended daily dose, 11% of those with atypical exposure and 79% of those with typical exposure.
| Agent |
Overall Prevalence,N = 2,695,081 |
% of Exposed With Potentially Excessive Dosing* | ||
|---|---|---|---|---|
| Within 100% of Recommended DD* | 101% to 150% of Recommended DD* | >150% of Recommended DD* | ||
| ||||
| Any antipsychotic | 6.0 | 52.9 | 20.2 | 26.9 |
| Atypical | 3.8 | 82.0 | 5.4 | 12.6 |
| Quetiapine (200) | 1.8 | 81.7 | 5.7 | 12.6 |
| Olanzapine (10) | 0.6 | 73.7 | 7.3 | 19.0 |
| Risperidone (2) | 0.9 | 79.2 | 6.8 | 14.0 |
| Other | 0.7 | 98.3 | 0.1 | 1.6 |
| Typical | 2.9 | 21.1 | 37.0 | 41.9 |
| Haloperidol (4) | 2.5 | 13.2 | 41.3 | 45.5 |
| Chlorpromazine (75) | 0.3 | 76.0 | 9.8 | 14.2 |
| Other | 0.4 | 89.1 | 2.9 | 8.0 |
Characteristics Associated With Antipsychotic Use
Among the patient and hospital characteristics included in our analysis, the 5 characteristics most strongly associated with antipsychotic exposure after adjustment were (Table 3): delirium (relative risk [RR]: 2.93, 95% confidence interval [CI]: 2.88‐2.98); dementia (RR: 2.78, 95% CI: 2.72‐2.83); insurance status, with higher risk among patients with traditional Medicare (RR: 2.09, 95% CI: 2.04‐2.13), Medicare managed (RR: 1.98, 95% CI: 1.93‐2.03), Medicaid (RR: 1.84, 95% CI: 1.80‐1.88), and self‐pay/other (RR: 1.26, 95% CI: 1.23‐1.29) compared to private (commercial) insurance; use of mechanical ventilation (RR: 1.84, 95% CI: 1.81‐1.87); and any ICU stay (RR: 1.53, 95% CI: 1.51‐1.55).
| Unadjusted RR of Receiving Any Antipsychotic [95% CI] | Adjusted RR of Receiving Any Antipsychotic [95% CI]* | |
|---|---|---|
| ||
| Age group, y, % | ||
| <65 | Reference | Reference |
| 6574 | 1.12 [1.10,1.14] | 0.74 [0.72, 0.75] |
| 75+ | 1.90 [1.88,1.92] | 1.03 [1.01, 1.05] |
| Gender | ||
| Female | Reference | Reference |
| Male | 1.19 [1.18,1.20] | 1.27 [1.26, 1.28] |
| Race | ||
| White | Reference | Reference |
| Black | 0.91 [0.90,0.92] | 0.85 [0.83, 0.86] |
| Hispanic | 0.80 [0.78,0.82] | 0.79 [0.76, 0.81] |
| Other | 0.99 [0.98,1.00] | 0.96 [0.95, 0.98] |
| Marital status | ||
| Married | Reference | Reference |
| Single | 1.57 [1.55,1.59] | 1.43 [1.42, 1.45] |
| Unknown/other | 1.41 [1.39,1.43] | 1.27 [1.24, 1.29] |
| Primary insurance | ||
| Private (commercial) | Reference | Reference |
| Medicaid | 2.13 [2.09,2.17] | 1.84 [1.80, 1.88] |
| Medicare managed | 2.35 [2.31,2.39] | 1.98 [1.93, 2.03] |
| Medicare traditional | 2.65 [2.61,2.69] | 2.09 [2.04, 2.13] |
| Self‐pay or other | 1.41 [1.38,1.44] | 1.26 [1.23, 1.29] |
| Admitting department | ||
| Surgical | Reference | Reference |
| Nonsurgical | 1.06 [1.05,1.07] | 1.05 [1.03, 1.06] |
| Any ICU stay | 2.05 [2.03,2.07] | 1.53 [1.51, 1.55] |
| Mechanical ventilation | 3.22 [3.18,3.26] | 1.84 [1.81, 1.87] |
| Diagnoses | ||
| Delirium | 5.48 [5.42, 5.45] | 2.93 [2.88, 2.98] |
| Dementia | 5.21 [5.15,5.27] | 2.78 [2.72, 2.83] |
| Insomnia | 1.72 [1.67,1.78] | 1.51 [1.45, 1.57] |
| No. of beds | ||
| 200 | Reference | Reference |
| 201300 | 1.01 [0.99,1.03] | 0.96 [0.94, 0.98] |
| 301500 | 0.98 [0.97,1.00] | 0.93 [0.91, 0.95] |
| 500+ | 0.97 [0.96,0.98] | 0.91 [0.90, 0.93] |
| Population served | ||
| Urban | Reference | Reference |
| Rural | 0.96 [0.95,0.98] | 0.91 [0.89, 0.93] |
| Teaching status | ||
| Teaching | Reference | Reference |
| Nonteaching | 1.03 [1.02,1.04] | 0.98 [0.97, 1.00] |
| US Census region | ||
| West | Reference | Reference |
| Northeast | 1.03 [1.01,1.05] | 1.04 [1.02, 1.06] |
| Midwest | 0.95 [0.94,0.97] | 0.93 [0.91, 0.94] |
| South | 1.02 [1.01,1.03] | 1.07 [1.05, 1.09] |
Hospital Variation in Antipsychotic Use
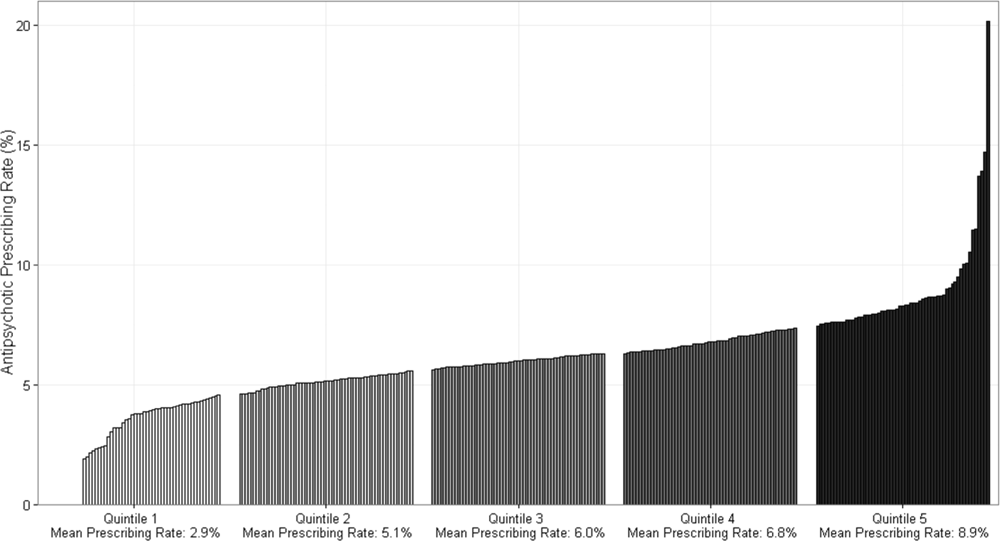
Figure 1 demonstrates the antipsychotic prescribing rate at each hospital in our cohort, and the corresponding quintiles. Patients admitted to hospitals in the highest prescribing quintile were more than twice as likely to be exposed to antipsychotics compared to patients admitted to hospitals in the lowest prescribing quintile, even after adjustment for patient characteristics and comorbidities (Table 4). This relationship was similar across subgroups of admissions with delirium and dementia (see Supporting Information, Appendix, in the online version of this article for the distribution of hospital antipsychotic prescribing rates before and after adjustment for patient characteristics).
| Admissions, No. (% of Total) | Unadjusted RR of Exposure [95% CI] | Adjusted RR of exposure [95% CI]* | |
|---|---|---|---|
| |||
| Overall | |||
| Q1 | 431,017 (16%) | Reference | Reference |
| Q2 | 630,486 (23%) | 1.67 [1.63, 1.71] | 1.59 [1.55, 1.62] |
| Q3 | 548,337 (20%) | 1.93 [1.88, 1.97] | 1.84 [1.80, 1.88] |
| Q4 | 639,027 (24%) | 2.16 [2.12, 2.21] | 2.07 [2.03, 2.12] |
| Q5 | 446,214 (17%) | 2.83 [2.77, 2.89] | 2.56 [2.50, 2.61] |
| Delirium | |||
| Q1 | 12,878 (15%) | Reference | Reference |
| Q2 | 20,588 (24%) | 1.58 [1.51, 1.65] | 1.58 [1.51, 1.65] |
| Q3 | 17,402 (20%) | 1.71 [1.64, 1.80] | 1.73 [1.65, 1.82] |
| Q4 | 20,943 (24%) | 2.01 [1.92, 2.10] | 1.99 [1.91, 2.08] |
| Q5 | 14,883 (17%) | 2.15 [2.05, 2.25] | 2.16 [2.07, 2.26] |
| Dementia | |||
| Q1 | 28,290 (15%) | Reference | Reference |
| Q2 | 42,018 (22%) | 1.43 [1.36, 1.50] | 1.40 [1.34, 1.47] |
| Q3 | 38,593 (21%) | 1.61 [1.53, 1.69] | 1.59 [1.51, 1.66] |
| Q4 | 44,638 (24%) | 1.69 [1.62, 1.77] | 1.69 [1.61, 1.77] |
| Q5 | 34,442 (18%) | 1.92 [1.83, 2.01] | 1.90 [1.81, 1.99] |
DISCUSSION
In this cohort of nonpsychiatric admissions to 300 US hospitals, antipsychotic medications were used in 6% of admissions, with atypical antipsychotics representing the majority of use. Potentially excessive daily doses based on CMS recommendations for long‐term care facilities occurred in almost half of admissions with any antipsychotic exposure, and in 87% of admissions with haloperidol exposure specifically. We found variation in hospital use of antipsychotics that was not fully accounted for by measured patient characteristics, and which persisted among subgroups of admissions with delirium and/or dementia. Although unmeasured patient characteristics or different billing practices between hospitals are potential explanations, our findings also raise the possibility of different hospital antipsychotic prescribing cultures. These findings provide new information regarding the scope of prescribing in US hospitals, and draw attention to the need for additional studies to better define what constitutes appropriate use of antipsychotics in the hospital setting.
A recent single‐center study at a large academic medical center found an overall antipsychotic exposure rate of 9% of nonpsychiatric admissions.[12] Our finding that 6% of admissions in this multicenter cohort were exposed to antipsychotics is slightly lower, but similar to the previous estimate. Assuming 37 million discharges from US hospitals each year,[13] our study suggests that more than 2 million hospitalized patients receive antipsychotics annually. With around 1.4 million residents in nursing homes on any given day,[14] and an exposure rate of 25% to 30% in that setting,[15, 16, 17] our study suggests that the number of patients exposed in the hospital setting is greater than the number exposed in the nursing home setting, the site of care for which prescribing regulations have been focused thus far.
Because our dataset does not contain preadmission medications, we were unable to specifically investigate new initiation. In the prior single‐center study, approximately 55% of overall use in the hospital setting was new initiation,[12] which would suggest that antipsychotics are newly initiated in around 1 million admissions each year in the hospital. Although we are unable to determine reason for use in our analysis, delirium was a strong predictor of antipsychotic use in our multivariable model, and prior studies have demonstrated delirium to be the most common reason for antipsychotic initiation in hospitalized patients,[12, 18] an indication for which efficacy/effectiveness data are lacking. A recent systematic review of antipsychotics for the treatment of delirium in older adults concluded that because of severe methodological limitations, the small number of existing studies on this topic do not support the use of antipsychotics in the treatment of delirium in older hospitalized adults.[19] Our results further highlight the need for randomized placebo‐controlled trials of antipsychotics in treatment of delirium.
We found variation in antipsychotic use between hospitals that was not fully explained by patient characteristics. Insufficient data to inform clinical decisions surrounding management of agitated delirium/dementia and lack of clear criteria by which to judge appropriateness of antipsychotic use may contribute to this variation. Some variation may relate to resource allocation at different hospitals, and the feasibility of implementing nonpharmacologic management options across settings. Our results collectively highlight the need for studies evaluating the efficacy/effectiveness of antipsychotics in the treatment of delirium and drivers of physician decision‐making in this realm, as well as the need for greater hospital investment in nonpharmacologic delirium‐prevention programs, which have been shown to be effective in prevention of delirium in hospitalized patients.[20]
We observed high levels of potentially excessive daily dosing using cutoffs applied in the long‐term care setting. The majority of the potentially excessive doses were in the setting of typical antipsychotic use, and haloperidol specifically, where doses exceeded 4 mg on at least 1 day in 87% of exposed admissions. Of note, the threshold for haloperidol dosage above which justification is required was decreased from 4 to 2 mg per day in the 2015 update to the CMS guidelines.[21] For the present analysis, we used the guidelines that were contemporaneous to our cohort; we are unable to determine current rates of potentially inappropriate dosages in the present analysis, but given the high prevalence in 2009 to 2010, and the lowering of the dosage threshold since then, it is unlikely that any decrease in use would be enough to substantially reduce the estimate. Whether these high dosages are actually inappropriate in the hospital setting is not established, and we were not able to review medical records to determine whether justification for use of such doses was documented.[22, 23] It is possible that hospitalized patients with altered pharmacodynamics and greater severity of illness could require larger doses of these medications; however, this is an area in need of further investigation, and current critical care guidelines note the lack of sufficient data upon which to justify use of haloperidol in the prevention or treatment of delirium in ICU patients.[24, 25]
The dosages in use are concerning given that the risk of extrapyramidal side effects increases with increasing dose, and prior studies have demonstrated an association between increased dose of antipsychotics and increased risk of other adverse events, including hip fracture and sudden cardiac death.[22, 23] Further, despite these known risks, studies have demonstrated failure to follow recommendations to mitigate risk,[26] such as electrocardiogram monitoring in individuals receiving intravenous haloperidol.[27] Our results suggest that physicians are similarly not following recommendations to use lower doses of haloperidol when treating older patients, given the almost identical incidence of potentially excessive dosing among admissions of patients aged 65 years and older in our cohort.[25] Clinical decision support prompts have been effective at increasing appropriate use of antipsychotic medications in several single‐center analyses,[28, 29, 30] and widespread implementation of such support with a focus on haloperidol dosing should be considered on the basis of our results.
The patient characteristics associated with antipsychotic use in this large, nationally representative analysis are consistent with those identified in prior single‐center analyses.[12, 18] Both prior analyses identified delirium as the most common reason for antipsychotic use, and dementia, intensive care unit stay, and mechanical ventilation were also previously identified as strong predictors of use that we believe hold face validity for the practicing hospitalist. On the other hand, some of the factors associated with antipsychotic use in our model cannot be readily explained, such as insurance status and race, and may be serving as proxies for other variables not included in our analysis. That nonwhite patients are less likely than white patients to receive antipsychotic medications in the hospital has been previously demonstrated,[12] and further investigation to understand this disparity is warranted.
Our study has several additional limitations. First, because our study is observational, the possibility of residual confounding exists, and we cannot rule out that there are other patient factors driving the hospital variation in antipsychotic use that we observed. Second, because guidelines do not exist for antipsychotic dosing in hospitalized patients, we could only comment on potentially excessive dosing, extrapolating from guidelines in the long‐term care setting. Whether such doses are actually excessive in hospitalized patients is not defined. Third, although Premier performs quality checks on charge and ICD‐9‐CM coding data submitted by participating hospitals, the validity of administrative data is uncertain. For example, the use of administrative data to identify delirium diagnoses is likely to have resulted in underestimation of delirium incidence among our different exposure groups. Delirium is likely to be coded more often in the setting of more severe or hyperactive cases, when antipsychotics are more likely to be utilized. This could result in an overestimation of the association between delirium and antipsychotic use. Additionally, differences in coding practices between hospitals for any of the variables in our models could explain some of the variation in antipsychotic prescribing that we observed. Finally, because we were unable to differentiate between new initiation and continuation of a preadmission antipsychotic, some of the variation that we observed is likely to reflect differences in outpatient antipsychotic prescribing practices.
In conclusion, in this large cohort of nonpsychiatric admissions to 300 US hospitals, we found that antipsychotic medication exposure was common, often at high daily doses. Delirium and dementia were the strongest predictors of use among the patient and hospital characteristics examined. The variation in antipsychotic prescribing that we observed was not fully accounted for by measured patient characteristics, and raises the possibility of differing hospital prescribing cultures. Our results draw attention to the need for additional research to better define what constitutes appropriate use of these potentially harmful medications in the hospital setting.
Disclosures: Dr. Herzig had full access to all of the data in the study and takes responsibility for the integrity of the data and the accuracy of the data analysis. Study concept and design: Drs. Herzig, Rothberg, Gurwitz, and Marcantonio. Acquisition of data: Dr. Herzig. Analysis of data: Mr. Guess. Interpretation of data: Drs. Herzig, Rothberg, Gurwitz, Marcantonio, and Mr. Guess. Drafting of the manuscript: Dr. Herzig. Critical revision of the manuscript for important intellectual content: Drs. Rothberg, Gurwitz, Marcantonio, and Mr. Guess. Dr. Herzig was funded by grant number K23AG042459 from the National Institute on Aging. Dr. Marcantonio was funded by grant number K24AG035075 from the National Institute on Aging. The funding organizations had no involvement in any aspect of the study, including design and conduct of the study; collection, management, analysis, and interpretation of the data; and preparation, review, or approval of the manuscript. The authors report no conflicts of interest.
- , , , et al. Variation in nursing home antipsychotic prescribing rates. Arch Intern Med. 2007;167(7):676–683.
- , . Precipitating factors for delirium in hospitalized elderly persons. Predictive model and interrelationship with baseline vulnerability. JAMA. 1996;275(11):852–857.
- , , , , . A predictive model for delirium in hospitalized elderly medical patients based on admission characteristics. Ann Intern Med. 1993;119(6):474–481.
- , , , , , . Delirium in hospitalized older persons: outcomes and predictors. J Am Geriatr Soc. 1994;42(8):809–815.
- , , , . Small‐area variations in the use of common surgical procedures: an international comparison of New England, England, and Norway. N Engl J Med. 1982;307(21):1310–1314.
- Premier Research Services. Available at: https://www.premierinc.com/transforming‐healthcare/healthcare‐performance‐improvement/premier‐research‐services. Accessed March 15, 2016.
- U.S. Food and Drug Administration. Atypical antipsychotic drugs information. Available at: http://www.fda.gov/drugs/drugsafety/postmarketdrugsafetyinformationforpatientsandproviders/ucm094303.htm. Accessed November 1, 2015.
- U.S. Food and Drug Administration. Information on conventional antipsychotics. Available at: http://www.fda.gov/drugs/drugsafety/postmarketdrugsafetyinformationforpatientsandproviders/ucm107211. htm. Accessed November 1, 2015.
- Centers for Medicare and Medicaid Services. State Operations Manual. Appendix PP: guidance to surveyors for long‐term care facilities. Available at: https://www.cms.gov/Medicare/Provider‐Enrollment‐and‐Certification/GuidanceforLawsAndRegulations/Downloads/som107 ap_pp_guidelines_ltcf.pdf. Revised October 14, 2005. Accessed March 15, 2016.
- . A modified Poisson regression approach to prospective studies with binary data. Am J Epidemiol. 2004;159(7):702–706.
- Healthcare Cost and Utilization Project. Comorbidity software, version 3.7. Agency for Healthcare Research and Quality, Rockville, MD. Available at: http://www.hcup‐us.ahrq.gov/toolssoftware/comorbidity/comorbidity.jsp. Accessed March 15, 2016.
- , , , et al. Antipsychotic use in hospitalized adults: rates, indications, and predictors. J Am Geriatr Soc. 2016;64(2):299–305.
- , . Overview of hospital stays in the United States, 2012. HCUP Statistical Brief #180. Agency for Healthcare Research and Quality, Rockville, MD. Available at: http://www.hcup‐us.ahrq.gov/reports/statbriefs/sb180‐Hospitalizations‐United‐States‐2012.pdf. Published October 2014. Accessed June 29, 2015.
- , , , . Long‐term care services in the United States: 2013 overview. Vital Health Stat 3. 2013;(37):1–107. Available at: http://www.cdc.gov/nchs/data/nsltcp/long_term_care_services_2013.pdf. Accessed March 16, 2016.
- , , , et al. The quality of antipsychotic drug prescribing in nursing homes. Arch Intern Med. 2005;165(11):1280–1285.
- , , , , , . Unexplained variation across US nursing homes in antipsychotic prescribing rates. Arch Intern Med. 2010;170(1):89–95.
- , , , , . Broadened use of atypical antipsychotics: safety, effectiveness, and policy challenges. Health Aff (Millwood). 2009;28(5):w770–w781.
- , , , , , . From hospital to community: use of antipsychotics in hospitalized elders. J Hosp Med. 2014;9(12):802–804.
- , , . Antipsychotics in the treatment of delirium in older hospitalized adults: a systematic review. J Am Geriatr Soc. 2011;59(suppl 2):S269–S276.
- , , , et al. Effectiveness of multicomponent nonpharmacological delirium interventions: a meta‐analysis. JAMA Intern Med. 2015;175(4):512–520.
- Centers for Medicare and Medicaid Services. State operations manual, appendix PP: guidance to surveyors for long‐term care facilities. Available at: https://www.cms.gov/Regulations‐and‐Guidance/Guidance/Manuals/downloads/som107ap_pp_guidelines_ltcf.pdf. Revised October 9, 2015. Accessed February 22, 2016.
- , , , , . Psychotropic drug use and the risk of hip fracture. N Engl J Med. 1987;316(7):363–369.
- , , , , . Atypical antipsychotic drugs and the risk of sudden cardiac death. N Engl J Med. 2009;360(3):225–235.
- , , , et al. Clinical practice guidelines for the management of pain, agitation, and delirium in adult patients in the intensive care unit. Crit Care Med. 2013;41(1):263–306.
- , , , , . Haloperidol overdosing in the treatment of agitated hospitalized older people with delirium: a retrospective chart review from a community teaching hospital. Drugs Aging. 2013;30(8):639–644.
- , , , . Unsafe use of intravenous haloperidol: evaluation of recommendation‐concordant care in hospitalized elderly adults. J Am Geriatr Soc. 2013;61(1):160–161.
- U.S. Food and Drug Administration. HALDOL brand of haloperidol injection. Available at: http://www.accessdata.fda.gov/drugsatfda_docs/label/2008/015923s082,018701s057lbl.pdf. Accessed February 23, 2016.
- , , , . Preventing potentially inappropriate medication use in hospitalized older patients with a computerized provider order entry warning system. Arch Intern Med. 2010;170(15):1331–1336.
- , , , et al. A standardized, bundled approach to providing geriatric‐focused acute care. J Am Geriatr Soc. 2014;62(5):936–942.
- , , , . Don't fuel the fire: decreasing intravenous haloperidol use in high risk patients via a customized electronic alert. J Am Med Inform Assoc. 2014;21(6):1109–1112.
Antipsychotic medications are frequently used off label for management of behavioral symptoms associated with delirium and/or dementia. Despite regulations designed to curb inappropriate prescribing of these medications in nursing homes, substantial levels of use and variation in use have been observed in this setting.[1] Although antipsychotic medications are also frequently used in the hospital, the scope and variation in use have not been adequately investigated. Given the lack of oversight for medication prescribing in the hospital setting and the frequency of delirium, occurring in 15% to 26% of hospitalized older adults,[2, 3, 4] off‐label use of antipsychotic medications and variation in use could be substantial.
Because variation in practice is known to increase in the setting of controversy or lack of clarity regarding appropriate management,[5] large degrees of variation can draw attention to priority areas for clinical effectiveness studies, and the need for guidelines, clinical decision support, or regulatory oversight. In the absence of clear guidelines for the use of antipsychotic medication in nonpsychiatric hospitalized patients, we hypothesized that significant variation in use would persist after controlling for patient characteristics. Using a large, nationally representative cohort of admissions to 300 hospitals from July 2009 to June 2010, we sought to investigate prescribing patterns and hospital variation in use of antipsychotic medications in nonpsychiatric admissions to US hospitals.
METHODS
Setting and Data Collection
We conducted a retrospective cohort study using data from 300 US, nonfederal, acute care facilities contributing to the database maintained by Premier (Premier Healthcare Solutions, Inc., Charlotte, NC). This nationally representative database, created to measure healthcare utilization and quality of care, is drawn from voluntarily participating hospitals and contains data on approximately 1 in every 4 discharges nationwide.[6] Participating hospitals are similar in geographic distribution and urban/rural status to hospitals nationwide, although large, nonteaching hospitals are slightly over‐represented. The study was approved by the institutional review board at Beth Israel Deaconess Medical Center.
Inclusion and Exclusion Criteria
We studied a cohort of all adult (18 years) nonpsychiatric admissions to participating hospitals from July 1, 2009 through June 30, 2010. We excluded patients admitted to a psychiatry service or with any discharge diagnosis of a psychotic disorder (defined by the Elixhauser comorbidity Psychoses: 295.00‐298.9, 299.10‐299.11), because we were interested in use of antipsychotics for conditions other than primary psychiatric disorders. We also excluded patients with a charge for labor and delivery owing to the nonrepresentativeness of this patient population for the general hospitalized patient. We excluded admissions with unknown gender, and admissions with a length of stay greater than 365 days, as these admissions are not representative of the typical admission to an acute care hospital. We also excluded hospitals contributing less than 100 admissions owing to lack of precision in corresponding hospital prescribing rates.
Antipsychotic Medication Utilization
In‐hospital antipsychotic use was ascertained from pharmacy charges, reflecting each medication dispensed during the hospitalization. We categorized antipsychotic medications as typical (haloperidol, loxapine, thioridazine, molindone, thiothixine, pimozide, fluphenazine, trifluoperazine, chlorpromazine, and perphenazine) and atypical (aripiprazole, asenapine, clozapine, iloperidone, lurasidone, olanzapine, paliperidone, quetiapine, risperidone, and ziprasidone) based on classification by the Food and Drug Administration.[7, 8] We excluded prochlorperazine (Compazine) from our typical antipsychotic definition, as this medication is almost exclusively used as an antiemetic.
In the absence of guidelines for use of antipsychotic agents in hospitalized patients, we used the Centers for Medicare and Medicaid Services (CMS) guidelines for long‐term care facilities to define measures of potentially excessive dosing in the hospital setting.[9] These guidelines define the daily dosage levels of antipsychotics above which the medical necessity of the higher dose should be explained in the medical record. We defined any daily dosage above these specified levels as a potentially excessive daily dose.
Characteristics Associated With Use
We investigated the association between antipsychotic use and patient and hospital characteristics, selected based on clinical grounds. Patient characteristics included: (1) demographic variables such as age (<65, 6574, 75+ years), gender, self‐reported race, marital status, and primary insurance; (2) admission characteristic variables, including admitting department (surgical vs nonsurgical, defined by a surgical attending of record and presence of operating room charges), whether the patient spent any time in the intensive care unit (ICU), and whether they received mechanical ventilation; and (3) potential indications for use, including delirium (included delirium superimposed upon dementia), dementia (without delirium), and insomnia (see Supporting Information, Appendix, in the online version of this article for International Classification of Diseases, Ninth Revision, Clinical Modification [ICD‐9‐CM] codes). Hospital characteristics included number of beds, urban versus rural status, teaching status, and US Census region.
Statistical Analysis
We report the proportion of admissions with in‐hospital use of any antipsychotic, and the number of days of exposure, overall and stratified by typical and atypical.
We determined potentially excessive dosing by taking the sum of the doses for a specific antipsychotic charged on a given day and comparing it to the CMS guidelines for long‐term care settings described above. We report the percentage of exposed admissions with at least 1 day of potentially excessive dosing.
All multivariable models below were operationalized as generalized estimating equations with a Poisson error term, log link, robust variance estimator,[10] and an exchangeable correlation structure to account for repeated admissions of the same patient.
We investigated patient and hospital characteristics associated with use of any antipsychotic medication using a multivariable model that simultaneously included all patient and hospital characteristics in Table 1 as independent variables.
| % of Cohort | Any Exposure, % | Typical Exposure, % | Atypical Exposure, % | |
|---|---|---|---|---|
| ||||
| Patient characteristics | ||||
| Age group, y | ||||
| <65 | 52.1 | 4.6 | 2.0 | 3.1 |
| 6574 | 18.5 | 5.2 | 2.7 | 3.1 |
| 75+ | 29.4 | 8.8 | 4.6 | 5.4 |
| Gender | ||||
| Male | 43.8 | 6.6 | 3.6 | 3.8 |
| Female | 56.2 | 5.5 | 2.3 | 3.8 |
| Race | ||||
| White | 64.6 | 6.1 | 2.9 | 4.0 |
| Black | 13.5 | 5.5 | 2.8 | 3.3 |
| Hispanic | 5.0 | 4.9 | 2.2 | 3.2 |
| Other | 19.9 | 6.1 | 3.1 | 3.7 |
| Marital Status | ||||
| Married | 42.5 | 4.6 | 2.4 | 2.7 |
| Single | 46.7 | 7.2 | 3.2 | 4.7 |
| Unknown/other | 10.8 | 6.4 | 3.1 | 4.1 |
| Primary insurance | ||||
| Private (commercial) | 28.8 | 3.0 | 1.5 | 1.8 |
| Medicaid | 10.3 | 6.4 | 2.4 | 4.6 |
| Medicare managed | 10.6 | 7.1 | 4.1 | 4.0 |
| Medicare traditional | 40.9 | 8.0 | 3.7 | 5.3 |
| Self‐pay or other | 9.4 | 4.3 | 2.5 | 2.2 |
| Admitting department | ||||
| Surgical | 60.6 | 5.8 | 3.1 | 3.4 |
| Nonsurgical | 39.4 | 6.2 | 2.4 | 4.4 |
| Any ICU stay | 16.6 | 10.4 | 7.2 | 4.9 |
| Mechanical ventilation | 4.7 | 17.4 | 12.9 | 7.9 |
| Diagnoses | ||||
| Delirium | 3.2 | 28.6 | 19.4 | 15.7 |
| Dementia | 3.1 | 27.4 | 12.0 | 20.2 |
| Insomnia | 1.3 | 10.2 | 3.9 | 7.5 |
| Discharge disposition | ||||
| Home | 77.9 | 3.8 | 1.6 | 2.5 |
| SNF/Rehab | 15.5 | 13.7 | 6.8 | 9.0 |
| Hospice | 1.7 | 16.0 | 10.3 | 8.1 |
| Other | 4.9 | 11.6 | 7.6 | 5.7 |
| Hospital characteristics, % | ||||
| No. of beds | ||||
| 200 | 14.1 | 6.1 | 2.8 | 3.8 |
| 201300 | 18.6 | 6.1 | 2.9 | 3.9 |
| 301500 | 37.7 | 5.9 | 2.9 | 3.7 |
| 500+ | 29.7 | 5.9 | 2.8 | 3.8 |
| Population served | ||||
| Urban | 89.4 | 6.0 | 2.9 | 3.8 |
| Rural | 10.6 | 5.8 | 2.4 | 3.9 |
| Teaching status | ||||
| Teaching | 39.2 | 5.8 | 2.9 | 3.7 |
| Nonteaching | 60.8 | 6.0 | 2.8 | 3.9 |
| US Census region | ||||
| West | 16.9 | 5.9 | 3.2 | 3.5 |
| Northeast | 20.1 | 6.1 | 2.9 | 3.9 |
| Midwest | 21.9 | 5.7 | 2.5 | 3.8 |
| South | 41.0 | 6.1 | 2.9 | 3.9 |
To determine hospital variation in antipsychotic use, we first determined the proportion of admissions at each hospital with at least 1 charge for antipsychotic medication. We then divided hospitals into quintiles based on their facility‐level antipsychotic prescribing rates and assigned all admissions to their corresponding hospital quintile. We then used a multivariable model to measure the adjusted association between prescribing quintile and patient‐level receipt of antipsychotic medication, controlling for all patient characteristics listed in Table 1 (except discharge disposition), and comorbidities using the Healthcare Cost and Utilization Project Comorbidity Software version 3.7 (Agency for Healthcare Research and Quality, Rockville, MD).[11] We used the lowest prescribing quintile as the reference group. We also report in the Supporting Information, Appendix, in the online version of this article, the distribution of prescribing rates for the hospitals in our cohort before and after adjustment for patient characteristics. For both approaches, we conducted stratified analyses in admissions with delirium and dementia.
All analyses were carried out using SAS software (SAS Institute Inc., Cary, NC).
RESULTS
Admission Characteristics
There were 3,190,934 admissions aged 18 years and over to 300 hospitals from July 1, 2009 to June 30, 2010. After excluding admissions with unknown gender (n = 17), length of stay greater than 365 days (n = 25), charges for labor and delivery (n = 323,111) or a psychiatric attending of record or psychiatric comorbidity (n = 172,669), and admissions to hospitals with fewer than 100 admissions (n = 31), our cohort included 2,695,081 admissions. The median age was 63 years (25th, 75th percentile 48, 77 years), and 1,514,986 (56%) were women. Table 1 shows the overall admission characteristics of the cohort and the percent exposed to antipsychotics among each patient and hospital characteristic.
Antipsychotic Use
There were 160,773 (6%) admissions with antipsychotic exposure. Among exposed admissions, 102,148 (64%) received atypical and 76,979 (48%) received typical antipsychotics, with 18,354 (11%) exposed to both. The median (25th, 75th percentile) length of stay among exposed was 5 days (3, 9 days), and the median (25th, 75th percentile) number of days of exposure was 3 (1, 5 days) overall, 3 days (2, 6 days) for atypical and 2 days (1, 3 days) for typical exposure.
Among admissions aged 65 to 74 years, 25,855 (5%) were exposed. Among admissions aged 75 years or older, 69,792 (9%) were exposed. Among admissions with delirium, exposure occurred in 24,787 (29%), with 13,640 (55%) receiving atypical, 16,828 (68%) receiving typical, and 5681 (23%) exposed to both. Among admissions with dementia, exposure occurred in 23,179 (27%), with 17,068 (74%) receiving atypical, 10,108 (44%) receiving typical, and 3997 (17%) exposed to both.
Use of Specific Drugs and Potentially Excessive Dosing
Table 2 demonstrates the most commonly used antipsychotic medications and the rates of potentially excessive dosing. Quetiapine and olanzapine were the most commonly used atypical antipsychotics, and haloperidol represented the majority of typical antipsychotic use. Among admissions with antipsychotic exposure, 47% received at least 1 potentially excessive daily dose, 18% of those with atypical exposure and 79% of those with typical exposure. Among admissions aged 65 years and up (n = 1,291,375), the prevalence of potentially excessive dosing was almost identical; 46% received at least 1 daily dose in excess of the recommended daily dose, 11% of those with atypical exposure and 79% of those with typical exposure.
| Agent |
Overall Prevalence,N = 2,695,081 |
% of Exposed With Potentially Excessive Dosing* | ||
|---|---|---|---|---|
| Within 100% of Recommended DD* | 101% to 150% of Recommended DD* | >150% of Recommended DD* | ||
| ||||
| Any antipsychotic | 6.0 | 52.9 | 20.2 | 26.9 |
| Atypical | 3.8 | 82.0 | 5.4 | 12.6 |
| Quetiapine (200) | 1.8 | 81.7 | 5.7 | 12.6 |
| Olanzapine (10) | 0.6 | 73.7 | 7.3 | 19.0 |
| Risperidone (2) | 0.9 | 79.2 | 6.8 | 14.0 |
| Other | 0.7 | 98.3 | 0.1 | 1.6 |
| Typical | 2.9 | 21.1 | 37.0 | 41.9 |
| Haloperidol (4) | 2.5 | 13.2 | 41.3 | 45.5 |
| Chlorpromazine (75) | 0.3 | 76.0 | 9.8 | 14.2 |
| Other | 0.4 | 89.1 | 2.9 | 8.0 |
Characteristics Associated With Antipsychotic Use
Among the patient and hospital characteristics included in our analysis, the 5 characteristics most strongly associated with antipsychotic exposure after adjustment were (Table 3): delirium (relative risk [RR]: 2.93, 95% confidence interval [CI]: 2.88‐2.98); dementia (RR: 2.78, 95% CI: 2.72‐2.83); insurance status, with higher risk among patients with traditional Medicare (RR: 2.09, 95% CI: 2.04‐2.13), Medicare managed (RR: 1.98, 95% CI: 1.93‐2.03), Medicaid (RR: 1.84, 95% CI: 1.80‐1.88), and self‐pay/other (RR: 1.26, 95% CI: 1.23‐1.29) compared to private (commercial) insurance; use of mechanical ventilation (RR: 1.84, 95% CI: 1.81‐1.87); and any ICU stay (RR: 1.53, 95% CI: 1.51‐1.55).
| Unadjusted RR of Receiving Any Antipsychotic [95% CI] | Adjusted RR of Receiving Any Antipsychotic [95% CI]* | |
|---|---|---|
| ||
| Age group, y, % | ||
| <65 | Reference | Reference |
| 6574 | 1.12 [1.10,1.14] | 0.74 [0.72, 0.75] |
| 75+ | 1.90 [1.88,1.92] | 1.03 [1.01, 1.05] |
| Gender | ||
| Female | Reference | Reference |
| Male | 1.19 [1.18,1.20] | 1.27 [1.26, 1.28] |
| Race | ||
| White | Reference | Reference |
| Black | 0.91 [0.90,0.92] | 0.85 [0.83, 0.86] |
| Hispanic | 0.80 [0.78,0.82] | 0.79 [0.76, 0.81] |
| Other | 0.99 [0.98,1.00] | 0.96 [0.95, 0.98] |
| Marital status | ||
| Married | Reference | Reference |
| Single | 1.57 [1.55,1.59] | 1.43 [1.42, 1.45] |
| Unknown/other | 1.41 [1.39,1.43] | 1.27 [1.24, 1.29] |
| Primary insurance | ||
| Private (commercial) | Reference | Reference |
| Medicaid | 2.13 [2.09,2.17] | 1.84 [1.80, 1.88] |
| Medicare managed | 2.35 [2.31,2.39] | 1.98 [1.93, 2.03] |
| Medicare traditional | 2.65 [2.61,2.69] | 2.09 [2.04, 2.13] |
| Self‐pay or other | 1.41 [1.38,1.44] | 1.26 [1.23, 1.29] |
| Admitting department | ||
| Surgical | Reference | Reference |
| Nonsurgical | 1.06 [1.05,1.07] | 1.05 [1.03, 1.06] |
| Any ICU stay | 2.05 [2.03,2.07] | 1.53 [1.51, 1.55] |
| Mechanical ventilation | 3.22 [3.18,3.26] | 1.84 [1.81, 1.87] |
| Diagnoses | ||
| Delirium | 5.48 [5.42, 5.45] | 2.93 [2.88, 2.98] |
| Dementia | 5.21 [5.15,5.27] | 2.78 [2.72, 2.83] |
| Insomnia | 1.72 [1.67,1.78] | 1.51 [1.45, 1.57] |
| No. of beds | ||
| 200 | Reference | Reference |
| 201300 | 1.01 [0.99,1.03] | 0.96 [0.94, 0.98] |
| 301500 | 0.98 [0.97,1.00] | 0.93 [0.91, 0.95] |
| 500+ | 0.97 [0.96,0.98] | 0.91 [0.90, 0.93] |
| Population served | ||
| Urban | Reference | Reference |
| Rural | 0.96 [0.95,0.98] | 0.91 [0.89, 0.93] |
| Teaching status | ||
| Teaching | Reference | Reference |
| Nonteaching | 1.03 [1.02,1.04] | 0.98 [0.97, 1.00] |
| US Census region | ||
| West | Reference | Reference |
| Northeast | 1.03 [1.01,1.05] | 1.04 [1.02, 1.06] |
| Midwest | 0.95 [0.94,0.97] | 0.93 [0.91, 0.94] |
| South | 1.02 [1.01,1.03] | 1.07 [1.05, 1.09] |
Hospital Variation in Antipsychotic Use
Figure 1 demonstrates the antipsychotic prescribing rate at each hospital in our cohort, and the corresponding quintiles. Patients admitted to hospitals in the highest prescribing quintile were more than twice as likely to be exposed to antipsychotics compared to patients admitted to hospitals in the lowest prescribing quintile, even after adjustment for patient characteristics and comorbidities (Table 4). This relationship was similar across subgroups of admissions with delirium and dementia (see Supporting Information, Appendix, in the online version of this article for the distribution of hospital antipsychotic prescribing rates before and after adjustment for patient characteristics).
| Admissions, No. (% of Total) | Unadjusted RR of Exposure [95% CI] | Adjusted RR of exposure [95% CI]* | |
|---|---|---|---|
| |||
| Overall | |||
| Q1 | 431,017 (16%) | Reference | Reference |
| Q2 | 630,486 (23%) | 1.67 [1.63, 1.71] | 1.59 [1.55, 1.62] |
| Q3 | 548,337 (20%) | 1.93 [1.88, 1.97] | 1.84 [1.80, 1.88] |
| Q4 | 639,027 (24%) | 2.16 [2.12, 2.21] | 2.07 [2.03, 2.12] |
| Q5 | 446,214 (17%) | 2.83 [2.77, 2.89] | 2.56 [2.50, 2.61] |
| Delirium | |||
| Q1 | 12,878 (15%) | Reference | Reference |
| Q2 | 20,588 (24%) | 1.58 [1.51, 1.65] | 1.58 [1.51, 1.65] |
| Q3 | 17,402 (20%) | 1.71 [1.64, 1.80] | 1.73 [1.65, 1.82] |
| Q4 | 20,943 (24%) | 2.01 [1.92, 2.10] | 1.99 [1.91, 2.08] |
| Q5 | 14,883 (17%) | 2.15 [2.05, 2.25] | 2.16 [2.07, 2.26] |
| Dementia | |||
| Q1 | 28,290 (15%) | Reference | Reference |
| Q2 | 42,018 (22%) | 1.43 [1.36, 1.50] | 1.40 [1.34, 1.47] |
| Q3 | 38,593 (21%) | 1.61 [1.53, 1.69] | 1.59 [1.51, 1.66] |
| Q4 | 44,638 (24%) | 1.69 [1.62, 1.77] | 1.69 [1.61, 1.77] |
| Q5 | 34,442 (18%) | 1.92 [1.83, 2.01] | 1.90 [1.81, 1.99] |
DISCUSSION
In this cohort of nonpsychiatric admissions to 300 US hospitals, antipsychotic medications were used in 6% of admissions, with atypical antipsychotics representing the majority of use. Potentially excessive daily doses based on CMS recommendations for long‐term care facilities occurred in almost half of admissions with any antipsychotic exposure, and in 87% of admissions with haloperidol exposure specifically. We found variation in hospital use of antipsychotics that was not fully accounted for by measured patient characteristics, and which persisted among subgroups of admissions with delirium and/or dementia. Although unmeasured patient characteristics or different billing practices between hospitals are potential explanations, our findings also raise the possibility of different hospital antipsychotic prescribing cultures. These findings provide new information regarding the scope of prescribing in US hospitals, and draw attention to the need for additional studies to better define what constitutes appropriate use of antipsychotics in the hospital setting.
A recent single‐center study at a large academic medical center found an overall antipsychotic exposure rate of 9% of nonpsychiatric admissions.[12] Our finding that 6% of admissions in this multicenter cohort were exposed to antipsychotics is slightly lower, but similar to the previous estimate. Assuming 37 million discharges from US hospitals each year,[13] our study suggests that more than 2 million hospitalized patients receive antipsychotics annually. With around 1.4 million residents in nursing homes on any given day,[14] and an exposure rate of 25% to 30% in that setting,[15, 16, 17] our study suggests that the number of patients exposed in the hospital setting is greater than the number exposed in the nursing home setting, the site of care for which prescribing regulations have been focused thus far.
Because our dataset does not contain preadmission medications, we were unable to specifically investigate new initiation. In the prior single‐center study, approximately 55% of overall use in the hospital setting was new initiation,[12] which would suggest that antipsychotics are newly initiated in around 1 million admissions each year in the hospital. Although we are unable to determine reason for use in our analysis, delirium was a strong predictor of antipsychotic use in our multivariable model, and prior studies have demonstrated delirium to be the most common reason for antipsychotic initiation in hospitalized patients,[12, 18] an indication for which efficacy/effectiveness data are lacking. A recent systematic review of antipsychotics for the treatment of delirium in older adults concluded that because of severe methodological limitations, the small number of existing studies on this topic do not support the use of antipsychotics in the treatment of delirium in older hospitalized adults.[19] Our results further highlight the need for randomized placebo‐controlled trials of antipsychotics in treatment of delirium.
We found variation in antipsychotic use between hospitals that was not fully explained by patient characteristics. Insufficient data to inform clinical decisions surrounding management of agitated delirium/dementia and lack of clear criteria by which to judge appropriateness of antipsychotic use may contribute to this variation. Some variation may relate to resource allocation at different hospitals, and the feasibility of implementing nonpharmacologic management options across settings. Our results collectively highlight the need for studies evaluating the efficacy/effectiveness of antipsychotics in the treatment of delirium and drivers of physician decision‐making in this realm, as well as the need for greater hospital investment in nonpharmacologic delirium‐prevention programs, which have been shown to be effective in prevention of delirium in hospitalized patients.[20]
We observed high levels of potentially excessive daily dosing using cutoffs applied in the long‐term care setting. The majority of the potentially excessive doses were in the setting of typical antipsychotic use, and haloperidol specifically, where doses exceeded 4 mg on at least 1 day in 87% of exposed admissions. Of note, the threshold for haloperidol dosage above which justification is required was decreased from 4 to 2 mg per day in the 2015 update to the CMS guidelines.[21] For the present analysis, we used the guidelines that were contemporaneous to our cohort; we are unable to determine current rates of potentially inappropriate dosages in the present analysis, but given the high prevalence in 2009 to 2010, and the lowering of the dosage threshold since then, it is unlikely that any decrease in use would be enough to substantially reduce the estimate. Whether these high dosages are actually inappropriate in the hospital setting is not established, and we were not able to review medical records to determine whether justification for use of such doses was documented.[22, 23] It is possible that hospitalized patients with altered pharmacodynamics and greater severity of illness could require larger doses of these medications; however, this is an area in need of further investigation, and current critical care guidelines note the lack of sufficient data upon which to justify use of haloperidol in the prevention or treatment of delirium in ICU patients.[24, 25]
The dosages in use are concerning given that the risk of extrapyramidal side effects increases with increasing dose, and prior studies have demonstrated an association between increased dose of antipsychotics and increased risk of other adverse events, including hip fracture and sudden cardiac death.[22, 23] Further, despite these known risks, studies have demonstrated failure to follow recommendations to mitigate risk,[26] such as electrocardiogram monitoring in individuals receiving intravenous haloperidol.[27] Our results suggest that physicians are similarly not following recommendations to use lower doses of haloperidol when treating older patients, given the almost identical incidence of potentially excessive dosing among admissions of patients aged 65 years and older in our cohort.[25] Clinical decision support prompts have been effective at increasing appropriate use of antipsychotic medications in several single‐center analyses,[28, 29, 30] and widespread implementation of such support with a focus on haloperidol dosing should be considered on the basis of our results.
The patient characteristics associated with antipsychotic use in this large, nationally representative analysis are consistent with those identified in prior single‐center analyses.[12, 18] Both prior analyses identified delirium as the most common reason for antipsychotic use, and dementia, intensive care unit stay, and mechanical ventilation were also previously identified as strong predictors of use that we believe hold face validity for the practicing hospitalist. On the other hand, some of the factors associated with antipsychotic use in our model cannot be readily explained, such as insurance status and race, and may be serving as proxies for other variables not included in our analysis. That nonwhite patients are less likely than white patients to receive antipsychotic medications in the hospital has been previously demonstrated,[12] and further investigation to understand this disparity is warranted.
Our study has several additional limitations. First, because our study is observational, the possibility of residual confounding exists, and we cannot rule out that there are other patient factors driving the hospital variation in antipsychotic use that we observed. Second, because guidelines do not exist for antipsychotic dosing in hospitalized patients, we could only comment on potentially excessive dosing, extrapolating from guidelines in the long‐term care setting. Whether such doses are actually excessive in hospitalized patients is not defined. Third, although Premier performs quality checks on charge and ICD‐9‐CM coding data submitted by participating hospitals, the validity of administrative data is uncertain. For example, the use of administrative data to identify delirium diagnoses is likely to have resulted in underestimation of delirium incidence among our different exposure groups. Delirium is likely to be coded more often in the setting of more severe or hyperactive cases, when antipsychotics are more likely to be utilized. This could result in an overestimation of the association between delirium and antipsychotic use. Additionally, differences in coding practices between hospitals for any of the variables in our models could explain some of the variation in antipsychotic prescribing that we observed. Finally, because we were unable to differentiate between new initiation and continuation of a preadmission antipsychotic, some of the variation that we observed is likely to reflect differences in outpatient antipsychotic prescribing practices.
In conclusion, in this large cohort of nonpsychiatric admissions to 300 US hospitals, we found that antipsychotic medication exposure was common, often at high daily doses. Delirium and dementia were the strongest predictors of use among the patient and hospital characteristics examined. The variation in antipsychotic prescribing that we observed was not fully accounted for by measured patient characteristics, and raises the possibility of differing hospital prescribing cultures. Our results draw attention to the need for additional research to better define what constitutes appropriate use of these potentially harmful medications in the hospital setting.
Disclosures: Dr. Herzig had full access to all of the data in the study and takes responsibility for the integrity of the data and the accuracy of the data analysis. Study concept and design: Drs. Herzig, Rothberg, Gurwitz, and Marcantonio. Acquisition of data: Dr. Herzig. Analysis of data: Mr. Guess. Interpretation of data: Drs. Herzig, Rothberg, Gurwitz, Marcantonio, and Mr. Guess. Drafting of the manuscript: Dr. Herzig. Critical revision of the manuscript for important intellectual content: Drs. Rothberg, Gurwitz, Marcantonio, and Mr. Guess. Dr. Herzig was funded by grant number K23AG042459 from the National Institute on Aging. Dr. Marcantonio was funded by grant number K24AG035075 from the National Institute on Aging. The funding organizations had no involvement in any aspect of the study, including design and conduct of the study; collection, management, analysis, and interpretation of the data; and preparation, review, or approval of the manuscript. The authors report no conflicts of interest.
- , , , et al. Variation in nursing home antipsychotic prescribing rates. Arch Intern Med. 2007;167(7):676–683.
- , . Precipitating factors for delirium in hospitalized elderly persons. Predictive model and interrelationship with baseline vulnerability. JAMA. 1996;275(11):852–857.
- , , , , . A predictive model for delirium in hospitalized elderly medical patients based on admission characteristics. Ann Intern Med. 1993;119(6):474–481.
- , , , , , . Delirium in hospitalized older persons: outcomes and predictors. J Am Geriatr Soc. 1994;42(8):809–815.
- , , , . Small‐area variations in the use of common surgical procedures: an international comparison of New England, England, and Norway. N Engl J Med. 1982;307(21):1310–1314.
- Premier Research Services. Available at: https://www.premierinc.com/transforming‐healthcare/healthcare‐performance‐improvement/premier‐research‐services. Accessed March 15, 2016.
- U.S. Food and Drug Administration. Atypical antipsychotic drugs information. Available at: http://www.fda.gov/drugs/drugsafety/postmarketdrugsafetyinformationforpatientsandproviders/ucm094303.htm. Accessed November 1, 2015.
- U.S. Food and Drug Administration. Information on conventional antipsychotics. Available at: http://www.fda.gov/drugs/drugsafety/postmarketdrugsafetyinformationforpatientsandproviders/ucm107211. htm. Accessed November 1, 2015.
- Centers for Medicare and Medicaid Services. State Operations Manual. Appendix PP: guidance to surveyors for long‐term care facilities. Available at: https://www.cms.gov/Medicare/Provider‐Enrollment‐and‐Certification/GuidanceforLawsAndRegulations/Downloads/som107 ap_pp_guidelines_ltcf.pdf. Revised October 14, 2005. Accessed March 15, 2016.
- . A modified Poisson regression approach to prospective studies with binary data. Am J Epidemiol. 2004;159(7):702–706.
- Healthcare Cost and Utilization Project. Comorbidity software, version 3.7. Agency for Healthcare Research and Quality, Rockville, MD. Available at: http://www.hcup‐us.ahrq.gov/toolssoftware/comorbidity/comorbidity.jsp. Accessed March 15, 2016.
- , , , et al. Antipsychotic use in hospitalized adults: rates, indications, and predictors. J Am Geriatr Soc. 2016;64(2):299–305.
- , . Overview of hospital stays in the United States, 2012. HCUP Statistical Brief #180. Agency for Healthcare Research and Quality, Rockville, MD. Available at: http://www.hcup‐us.ahrq.gov/reports/statbriefs/sb180‐Hospitalizations‐United‐States‐2012.pdf. Published October 2014. Accessed June 29, 2015.
- , , , . Long‐term care services in the United States: 2013 overview. Vital Health Stat 3. 2013;(37):1–107. Available at: http://www.cdc.gov/nchs/data/nsltcp/long_term_care_services_2013.pdf. Accessed March 16, 2016.
- , , , et al. The quality of antipsychotic drug prescribing in nursing homes. Arch Intern Med. 2005;165(11):1280–1285.
- , , , , , . Unexplained variation across US nursing homes in antipsychotic prescribing rates. Arch Intern Med. 2010;170(1):89–95.
- , , , , . Broadened use of atypical antipsychotics: safety, effectiveness, and policy challenges. Health Aff (Millwood). 2009;28(5):w770–w781.
- , , , , , . From hospital to community: use of antipsychotics in hospitalized elders. J Hosp Med. 2014;9(12):802–804.
- , , . Antipsychotics in the treatment of delirium in older hospitalized adults: a systematic review. J Am Geriatr Soc. 2011;59(suppl 2):S269–S276.
- , , , et al. Effectiveness of multicomponent nonpharmacological delirium interventions: a meta‐analysis. JAMA Intern Med. 2015;175(4):512–520.
- Centers for Medicare and Medicaid Services. State operations manual, appendix PP: guidance to surveyors for long‐term care facilities. Available at: https://www.cms.gov/Regulations‐and‐Guidance/Guidance/Manuals/downloads/som107ap_pp_guidelines_ltcf.pdf. Revised October 9, 2015. Accessed February 22, 2016.
- , , , , . Psychotropic drug use and the risk of hip fracture. N Engl J Med. 1987;316(7):363–369.
- , , , , . Atypical antipsychotic drugs and the risk of sudden cardiac death. N Engl J Med. 2009;360(3):225–235.
- , , , et al. Clinical practice guidelines for the management of pain, agitation, and delirium in adult patients in the intensive care unit. Crit Care Med. 2013;41(1):263–306.
- , , , , . Haloperidol overdosing in the treatment of agitated hospitalized older people with delirium: a retrospective chart review from a community teaching hospital. Drugs Aging. 2013;30(8):639–644.
- , , , . Unsafe use of intravenous haloperidol: evaluation of recommendation‐concordant care in hospitalized elderly adults. J Am Geriatr Soc. 2013;61(1):160–161.
- U.S. Food and Drug Administration. HALDOL brand of haloperidol injection. Available at: http://www.accessdata.fda.gov/drugsatfda_docs/label/2008/015923s082,018701s057lbl.pdf. Accessed February 23, 2016.
- , , , . Preventing potentially inappropriate medication use in hospitalized older patients with a computerized provider order entry warning system. Arch Intern Med. 2010;170(15):1331–1336.
- , , , et al. A standardized, bundled approach to providing geriatric‐focused acute care. J Am Geriatr Soc. 2014;62(5):936–942.
- , , , . Don't fuel the fire: decreasing intravenous haloperidol use in high risk patients via a customized electronic alert. J Am Med Inform Assoc. 2014;21(6):1109–1112.

Two‐Item Bedside Test for Delirium
Delirium (acute confusion) is common in older adults and leads to poor outcomes, such as death, clinician and caregiver burden, and prolonged cognitive and functional decline.[1, 2, 3, 4] Delirium is extremely costly, with estimates ranging from $143 to $152 billion annually (2005 US$).[5, 6] Early detection and management may improve the poor outcomes and reduce costs attributable to delirium,[3, 7] yet delirium identification in clinical practice has been challenging, particularly when translating research tools to the bedside.[8, 9, 10]As a result, only 12% to 35% of delirium cases are detected in routine care, with hypoactive delirium and delirium superimposed on dementia most likely to be missed.[11, 12, 13, 14, 15]
To address these issues, we recently developed and published the three‐dimensional Confusion Assessment Method (3D‐CAM), the 3‐minute diagnostic assessment for CAM‐defined delirium.[16] The 3D‐CAM is a structured assessment tool that includes mental status testing, patient symptom probes, and guided interviewer observations for signs of delirium. 3D‐CAM items were selected through a rigorous process to determine the most informative items for the 4 CAM diagnostic features.[17] The 3D‐CAM can be completed in 3 minutes, and has 95% sensitivity and 94% specificity relative to a reference standard.[16]
Despite the capabilities of the 3D‐CAM, there are situations when even 3 minutes is too long to devote to delirium identification. Moreover, a 2‐step approach in which a sensitive ultrabrief screen is administered, followed by the 3D‐CAM in positives, may be the most efficient approach for large‐scale delirium case identification. The aim of the current study was to use the 3D‐CAM database to identify the most sensitive single item and pair of items in the diagnosis of delirium, using the reference standard in the diagnostic accuracy analysis. We hypothesized that we could identify a single item with greater than 80% sensitivity and a pair of items with greater than 90% sensitivity for detection of delirium.
METHODS
Study Sample and Design
We analyzed data from the 3D‐CAM validation study,[16] which prospectively enrolled participants from a large urban teaching hospital in Boston, Massachusetts, using a consecutive enrollment sampling strategy. Inclusion criteria were: (1) 75 years old, (2) admitted to general or geriatric medicine services, (3) able to communicate in English, (4) without terminal conditions, (5) expected hospital stay of 2 days, (6) not a previous study participant. Experienced clinicians screened patients for eligibility. If the patient lacked capacity to provide consent, the designated surrogate decision maker was contacted. The study was approved by the institutional review board.
Reference Standard Delirium Diagnosis
The reference standard delirium diagnosis was based on an extensive (45 minutes) face‐to‐face patient interview by experienced clinician assessors (neuropsychologists or advanced practice nurses), medical record review, and input from the nurse and family members. This comprehensive assessment included: (1) reason for hospital admission, hospital course, and presence of cognitive concerns, (2) family, social, and functional history, (3) Montreal Cognitive Assessment,[18] (4) Geriatric Depression Scale,[19] (5) medical record review including scoring of comorbidities using the Charlson index,[20] determination of functional status using the basic and Instrumental Activities of Daily Living,[21, 22] psychoactive medications administered, and (6) a family member interview to assess the patient's baseline cognitive status that included the Eight‐Item Interview to Differentiate Aging and Dementia,[23] to assess the presence of dementia. Using all of these data, an expert panel, including the clinical assessor, the study principal investigator (E.R.M.), a geriatrician, and an experienced neuropsychologist, adjudicated the final delirium diagnoses using Diagnostic and Statistical Manual of Mental Disorders, 4th Edition (DSM‐IV) criteria. The panel also adjudicated for the presence or absence of dementia and mild cognitive impairment based on National Institute on Aging‐Alzheimer's Association (NIA‐AA) criteria.[24] This approach has been used in other delirium studies.[25]
3D‐CAM Assessments
After the reference standard assessment, the 3D‐CAM was administered by trained research assistants (RAs) who were blinded to the results of the reference standard. To reduce the likelihood of fluctuations or temporal changes, all assessments were completed between 11:00 am and 2:00 pm and for each participant, within a 2‐hour time period (for example, 11:23 am to 1:23 pm).
Statistical Analyses to Determine the Best Single‐ and Two‐Item Screeners
To determine the best single 3D‐CAM item to identify delirium, the responses of the 20 individual items in the 3D‐CAM (see Supporting Table 1 in the online version of this article) were compared to the reference standard to determine their sensitivity and specificity. Similarly, an algorithm was used to generate all unique 2‐item combinations of the 20 items (190 unique pairs), which were compared to the reference. An error, no response, or an answer of I do not know by the patient was considered a positive screen for delirium. The 2‐item screeners were considered positive if 1 or both of the items were positive. Sensitivity and specificity were calculated along with 95% confidence intervals (CIs).
Subset analyses were performed to determine sensitivity and specificity of individual items and pairs of items stratified by the patient's baseline cognitive status. Two strata were createdpatients with dementia (N=56), and patients with normal baseline cognitive status or mild cognitive impairment (MCI) (N=145). We chose to group MCI with normal for 2 reasons: (1) dementia is a well‐established and strong risk factor for delirium, whereas the evidence for MCI being a risk factor for delirium is less established and (2) to achieve adequate allocation of delirious cases in both strata. Last, we report the sensitivity of altered level of consciousness (LOC), which included lethargy, stupor, coma, and hypervigilance as a single screening item for delirium in the overall sample and by cognitive status. Analyses were conducted using commercially available software (SAS version 9.3; SAS Institute, Inc., Cary, NC).
RESULTS
Characteristics of the patients are shown in Table 1. Subjects had a mean age of 84 years, 62% were female, and 28% had a baseline dementia. Forty‐two (21%) had delirium based on the clinical reference standard. Twenty (10%) had less than a high school education and 100 (49%) had at least a college education.
| Characteristic | N (%) |
|---|---|
| |
| Age, y, mean (SD) | 84 (5.4) |
| Sex, n (%) female | 125 (62) |
| White, n (%) | 177 (88) |
| Education, n (%) | |
| Less than high school | 20 (10) |
| High school graduate | 75 (38) |
| College plus | 100 (49) |
| Vision interfered with interview, n (%) | 5 (2) |
| Hearing interfered with interview, n (%) | 18 (9) |
| English second language n (%) | 10 (5) |
| Charlson, mean (SD) | 3 (2.3) |
| ADL, n (% impaired) | 110 (55) |
| IADL, n (% impaired) | 163 (81) |
| MCI, n (%) | 50 (25) |
| Dementia, n (%) | 56 (28) |
| Delirium, n (%) | 42 (21) |
| MoCA, mean (SD) | 19 (6.6) |
| MoCA, median (range) | 20 (030) |
Single Item Screens
Table 2 reports the results of single‐item screens for delirium with sensitivity, the ability to correctly identify delirium when it is present by the reference standard, and specificity, the ability to correctly identify patients without delirium when it is not present by reference standard and 95% CIs. Items are listed in descending order of sensitivity; in the case of ties, the item with the higher specificity is listed first. The screening items with the highest sensitivity for delirium are Months of the year backwards, and Four digits backwards, both with a sensitivity of 83% (95% CI: 69%‐93%). Of these 2 items, Months of the year backwards had a much better specificity of 69% (95% CI: 61%‐76%), whereas Four digits backwards had a specificity of 52% (95% CI: 44%‐60%). The item What is the day of the week? had lower sensitivity at 71% (95% CI: 55%‐84%), but excellent specificity at 92% (95% CI: 87%‐96%).
| Screen Item | Screen Positive (%)c | Sensitivity (95% CI) | Specificity (95% CI) | LR | LR |
|---|---|---|---|---|---|
| |||||
| Months of the year backwards | 42 | 0.83 (0.69‐0.93) | 0.69 (0.61‐0.76) | 2.7 | 0.24 |
| Four digits backwards | 56 | 0.83 (0.69‐0.93) | 0.52 (0.44‐0.60) | 1.72 | 0.32 |
| What is the day of the week? | 21 | 0.71 (0.55‐0.84) | 0.92 (0.87‐0.96) | 9.46 | 0.31 |
| What is the year? | 16 | 0.55 (0.39‐0.70) | 0.94 (0.9‐0.97) | 9.67 | 0.48 |
| Have you felt confused during the past day? | 14 | 0.50 (0.34‐0.66) | 0.95 (0.9‐0.98) | 9.94 | 0.53 |
| Days of the week backwards | 15 | 0.50 (0.34‐0.66) | 0.94 (0.89‐0.97) | 7.95 | 0.53 |
| During the past day, did you see things that were not really there? | 11 | 0.45 (0.3‐0.61) | 0.97 (0.94‐0.99) | 17.98 | 0.56 |
| Three digits backwards | 15 | 0.45 (0.3‐0.61) | 0.92 (0.87‐0.96) | 5.99 | 0.59 |
| What type of place is this? | 9 | 0.38 (0.24‐0.54) | 0.99 (0.96‐1) | 30.29 | 0.63 |
| During the past day, did you think you were not in the hospital? | 10 | 0.38 (0.24‐0.54) | 0.97 (0.94‐0.99) | 15.14 | 0.64 |
We then examined performance of single‐item screeners in patients with and without dementia (Table 3). In persons with dementia, the best single item was also Months of the year backwards, with a sensitivity of 89% (95% CI: 72%‐98%) and a specificity of 61% (95% CI: 41%‐78%). In persons with normal baseline cognition or MCI, the best performing single item was Four digits backwards, with sensitivity of 79% (95% CI: 49%‐95%) and specificity of 51% (95% CI: 42%‐60%). Months of the year backwards also performed well, with sensitivity of 71% (95% CI: 42%‐92%) and specificity of 71% (95% CI: 62%‐79%).
| Test Item | Normal/MCI Patients (n=145) | Dementia Patients (n=56) | ||||||||
|---|---|---|---|---|---|---|---|---|---|---|
| Screen Positive (%)b | Sensitivity (95% CI) | Specificity (95% CI) | LR | LR | Screen Positive (%)b | Sensitivity (95% CI) | Specificity (95% CI) | LR | LR | |
| ||||||||||
| Months backwards | 33 | 0.71 (0.42‐0.92) | 0.71 (0.62‐0.79) | 2.46 | 0.4 | 64 | 0.89 (0.72‐0.98) | 0.61 (0.41‐0.78) | 2.27 | 0.18 |
| Four digits backwards | 52 | 0.79 (0.49‐0.95) | 0.51 (0.42‐0.60) | 1.61 | 0.42 | 66 | 0.86 (0.67‐0.96) | 0.54 (0.34‐0.72) | 1.85 | 0.27 |
| What is the day of the week? | 10 | 0.64 (0.35‐0.87) | 0.96 (0.91‐0.99) | 16.84 | 0.37 | 50 | 0.75 (0.55‐0.89) | 0.75 (0.55‐0.89) | 3 | 0.33 |
Two‐Item Screens
Table 4 reports the results of 2‐item screens for delirium with sensitivity, specificity, and 95% CIs. Item pairs are listed in descending order of sensitivity following the same convention as in Table 2. The 2‐item screen with the highest sensitivity for delirium is the combination of What is the day of the week? and Months of the year backwards, with a sensitivity of 93% (95% CI: 81%‐99%) and specificity of 64% (95% CI: 56%‐70%). This screen had a positive and negative likelihood ratio (LR) of 2.59 and 0.11, respectively. The combination of What is the day of the week? and Four digits backwards had the same sensitivity 93% (95% CI: 81%‐99%), but lower specificity of 48% (95% CI: 40%‐56%). The combination of What type of place is this? (hospital) and Four digits backwards had a sensitivity of 90% (95% CI: 77%‐97%) and specificity of 51% (95% CI: 43%‐50%).
| Screen Item 1 | Screen Item 2 | Screen Positive (%)c | Sensitivity (95% CI) | Specificity (95% CI) | LR | LR |
|---|---|---|---|---|---|---|
| ||||||
| What is the day of the week? | Months backwards | 48 | 0.93 (0.81‐0.99) | 0.64 (0.56‐0.70) | 2.59 | 0.11 |
| What is the day of the week? | Four digits backwards | 60 | 0.93 (0.81‐0.99) | 0.48 (0.4‐0.56) | 1.8 | 0.15 |
| Four digits backwards | Months backwards | 65 | 0.93 (0.81‐0.99) | 0.42 (0.34‐0.50) | 1.6 | 0.17 |
| What type of place is this? | Four digits backwards | 58 | 0.90 (0.77‐0.97) | 0.51 (0.43‐0.50) | 1.84 | 0.19 |
| What is the year? | Four digits backwards | 59 | 0.9 (0.77‐0.97) | 0.5 (0.42‐0.5) | 1.80 | 0.19 |
| What is the day of the week? | Three digits backwards | 30 | 0.88 (0.74‐0.96) | 0.86 (0.79‐0.90) | 6.09 | 0.14 |
| What is the year? | Months backwards | 44 | 0.88 (0.74‐0.96) | 0.68 (0.6‐0.75) | 2.75 | 0.18 |
| What type of place is this? | Months backwards | 43 | 0.86 (0.71‐0.95) | 0.69 (0.61‐0.70) | 2.73 | 0.21 |
| During the past day, did you think you were not in the hospital? | Months backwards | 43 | 0.86 (0.71‐0.95) | 0.69 (0.61‐0.70) | 2.73 | 0.21 |
| Days of the week backwards | Months backwards | 43 | 0.86 (0.71‐0.95) | 0.68 (0.6‐0.75) | 2.67 | 0.21 |
When subjects were stratified by baseline cognition, the best 2‐item screens for normal and MCI patients was What is the day of the week? and Four digits backwards, with 93% sensitivity (95% CI: 66%‐100%) and 50% specificity (95% CI: 42%‐59%). The best pair of items for patients with dementia (Table 5) was the same as the overall sample, What is the day of the week? and Months of the year backwards, but its performance differed with a higher sensitivity of 96% (95% CI: 82%‐100%) and lower specificity of 43% (95% CI: 24%‐63%). This same pair of items had 86% sensitivity (95% CI: 57%‐98%) and 69% (95% CI: 60%‐77%) specificity for persons with either normal cognition or MCI.
| Test Item 1 | Test Item 2 | Normal/MCI Patients (n=145) | Dementia Patients (n=56) | ||||||||
|---|---|---|---|---|---|---|---|---|---|---|---|
| Item Positive (%)b | Sensitivity (95% CI) | Specificity (95% CI) | LR | LR | Item Positive (%)b | Sensitivity (95% CI) | Specificity (95% CI) | LR | LR | ||
| |||||||||||
| What is the day of the week? | Months backwards | 36 | 0.86 (0.57‐0.98) | 0.69 (0.60‐0.77) | 2.74 | 0.21 | 77 | 0.96 (0.82‐1) | 0.43 (0.24‐0.63) | 1.69 | 0.08 |
| What is the day of the week? | Four digits backwards | 54 | 0.93 (0.66‐1) | 0.5 (0.42‐0.59) | 1.87 | 0.14 | 77 | 0.93 (0.76‐0.99) | 0.39 (0.22‐0.59) | 1.53 | 0.18 |
| Four digits backwards | Months backwards | 61 | 0.93 (0.66‐1) | 0.43 (0.34‐0.52) | 1.62 | 0.17 | 77 | 0.93 (0.76‐0.99) | 0.39 (0.22‐0.59) | 1.53 | 0.18 |
Altered Level of Consciousness as a Screener for Delirium
Altered level of consciousness (ALOC) was uncommon in our sample, with an overall prevalence of 10/201 (4.9%). When examined as a screening item for delirium, ALOC had very poor sensitivity of 19% (95% CI: 9%‐34%) but had excellent specificity 99% (95% CI: 96%‐100%). Altered LOC also demonstrated poor screening performance when stratified by cognitive status, with a sensitivity of 14% in the normal and MCI group (95% CI: 2%‐43%) and sensitivity of 21% (95% CI: 8%‐41%) in persons with dementia.
Positive and Negative Predictive Values
Although we focused on sensitivity and specificity in evaluating 1‐ and 2‐item screeners, we also examined positive and negative predictive values. These values will vary depending on the overall prevalence of delirium, which was 21% in this dataset. The best 1‐item screener, Months of the year backwards, had a positive predictive value of 31% and negative predictive value of 94%. The best 2‐item screener, Months of the year backwards with What is the day of the week?, had a positive predictive value of 41% and negative predictive value of 97% (see Supporting Tables 2 and 3 in the online version of this article) LRs for the items are in Tables 2 through 5.
DISCUSSION
Identifying simple, efficient, bedside case‐identification methods for delirium is an essential step toward improving recognition of this highly morbid syndrome in hospitalized older adults. In this study, we identified a single cognitive item, Months of the year backwards, that identified 83% of delirium cases when compared with a reference standard diagnosis. Furthermore, we identified 2 items, Months of the year backwards and What is the day of the week? which when used in combination identified 93% of delirium cases. The same 1 and 2 items also worked well in patients with dementia, in whom delirium is often missed. Although these items require further clinical validation, the development of an ultrabrief 2‐item test that identifies over 90% of delirium cases and can be completed in less than 1 minute (recently, we administered the best 2‐item screener to 20 consecutive general medicine patients over age 70 years, and it was completed in a median of 36.5 seconds), holds great potential for simplifying bedside delirium screening and improving the care of hospitalized older adults.
Our current findings both confirm and extend the emerging literature on best screening items for delirium. Sands and colleagues (2010)[26] tested a single test for delirium, Do you think (name of patient) has been more confused lately? in 21 subjects and achieved a sensitivity of 80%. Han and colleagues developed a screening tool in emergency‐department patients using the LOC question from the Richmond Agitation‐Sedation Scale and spelling the word lunch backwards, and achieved 98% sensitivity, but in a younger emergency department population with a low prevalence of dementia.[27] O'Regan et al. recently also found Months of the year backwards to be the best single‐screening item for delirium in a large sample, but only tested a 1‐item screen.[28] Our study extends these studies in several important ways by: (1) employing a rigorous clinical reference standard diagnosis of delirium, (2) having a large sample with a high prevalence of patients with dementia, (3) use of a general medical population, and (4) examining the best 2‐item screens in addition to the best single item.
Systematic intervention programs[29, 30, 31] that focus on improved delirium evaluation and management have the potential to improve patient outcomes and reduce costs. However, targeting these programs to patients with delirium has proven difficult, as only 12% to 35% of delirium cases are recognized in routine clinical practice.[11, 12, 13, 14, 15] The 1‐ and 2‐item screeners we identified could play an important role in future delirium identification. The 3D‐CAM combines high sensitivity (95%) with high specificity (94%)[16] and therefore would be an excellent choice as the second step after a positive screen. The feasibility, effectiveness, and cost of administering these screeners, followed by a brief diagnostic tool such as the 3D‐CAM, should be evaluated in future work.
Our study has noteworthy strengths, including the use of a large purposefully challenging clinical sample with advanced age that included a substantial proportion with dementia, a detailed assessment, and the testing of very brief and practical tools for bedside delirium screening.[25] This study also has several important limitations. Most importantly, we presented secondary analysis of individual items and pairs of items drawn from the 3D CAM assessment; therefore, the 2‐item bedside screen requires prospective clinical validation. The reference standard was based on the DSM‐IV, because this study was conducted prior to the release of DSM‐V. In addition, the ordering of the reference standard and 3D‐CAM assessments was not randomized due to feasibility constraints. In addition, this study was cross‐sectional, involved only a single hospital, and enrolled only older medical patients during the day shift. Our sample was older (aged 75 years and older), and a younger sample may have had a different prevalence of delirium, which could affect the positive predictive value of our ultrabrief screen. We plan to test this in a sample of patients aged 70 years and older in future studies. Finally, it should be noted that these best 1‐item and 2‐item screeners miss 17% and 7% of delirium cases, respectively. In cases where this is unacceptably high, alternative approaches might be necessary.
It is important to remember that these 1‐ and 2‐item screeners are not diagnostic tools and therefore should not be used in isolation. Optimally, they will be followed by a more specific evaluation, such as the 3D‐CAM, as part of a systematic delirium identification process. For instance, in our sample (with a delirium rate of 21%), the best 2‐item screener had a positive predictive value of 41%, meaning that positive screens are more likely to be false positives than true positives (see Supporting Tables 2 and 3 in the online version of this article).[32] Nevertheless, by reducing the total number of patients who require diagnostic instrument administration, use of these ultrabrief screeners can improve efficiency and result in a net benefit to delirium case‐identification efforts.[32]
Time has been demonstrated to be a barrier to delirium identification in previous studies, but there are likely others. These may include, for instance, staff nihilism about screening making a difference, ambiguous responsibility for delirium screening and management, unsupportive system leadership, and absent payment for these activities.[31] Moreover, it is possible that the 2‐step process we propose may create an incentive for staff to avoid positive screens as they see it creating more work for themselves. We plan to identify and address such barriers in our future work.
In conclusion, we identified a single screening item for delirium, Months of the year backwards, with 83% sensitivity, and a pair of items, Months of the year backwards and What is the day of the week?, with 93% sensitivity relative to a rigorous reference standard diagnosis. These ultrabrief screening items work well in patients with and without dementia, and should require very little training of staff. Future studies should further validate these tools, and determine their translatability and scalability into programs for systematic, widespread delirium detection. Developing efficient and accurate case identification strategies is a necessary prerequisite to appropriately target delirium management protocols, enabling healthcare systems to effectively address this costly and deadly condition.
Disclosures
Author contributionsD.M.F. conceived the study idea, participated in its design and coordination, and drafted the initial manuscript. S.K.I. contributed to the study design and conceptualization, supervision, funding, preliminary analysis, and interpretation of the data, and critical revision of the manuscript. J.G. conducted the analysis for the study and critically revised the manuscript. L.N. supervised the analysis for the study and critically revised the manuscript. R.J. contributed to the study design and critical revision of the manuscript. J.S.S. critically revised the manuscript. E.R.M. obtained funding for the study, supervised all data collection, assisted in drafting and critically revising the manuscript, and contributed to the conceptualization, design, and supervision of the study. All authors have seen and agree with the contents of the manuscript.
This work was supported by the National Institute of Aging grant number R01AG030618 and K24AG035075 to Dr. Marcantonio. Dr. Inouye's time was supported in part by grants P01AG031720, R01AG044518, and K07AG041835 from the National Institute on Aging. Dr. Inouye holds the Milton and Shirley F. Levy Family Chair (Hebrew Senior Life/Harvard Medical School). Dr. Fick is partially supported from National Institute of Nursing Research grant number R01 NR011042. Dr. Saczynski was supported in part by funding from the National Institute on Aging (K01AG33643) and from the National Heart Lung and Blood Institute (U01HL105268). The funding agencies had no role and the authors retained full autonomy in the preparation of this article. All authors and coauthors have no financial or nonfinancial conflicts of interest to disclose regarding this article.
This article was presented at the Presidential Poster Session at the American Geriatrics Society 2014 Annual Meeting in Orlando, Florida, May 14, 2014.
- , , , , , Delirium in elderly patients and the risk of postdischarge mortality, institutionalization, and dementia: a meta‐analysis. JAMA. 2010;304(4):443–451.
- , , , et al. Cognitive trajectories after postoperative delirium. N Engl J Med. 2012;367(1):30–39.
- , , Delirium in elderly people. Lancet. 2014;383:911–922.
- , , , Delirium superimposed on dementia is associated with prolonged length of stay and poor outcomes in hospitalized older adults. J Hosp Med. 2013;8(9):500–505.
- , , , , One‐year health care costs associated with delirium in the elderly population. Arch Intern Med. 2008;168(1):27–32.
- , The importance of delirium: Economic and societal costs. J Am Geriatr Soc. 2011;59(suppl 2):S241–S243.
- Delirium. Ann Intern Med. 2011;154(11):ITC6.
- , , , , , Fostering implementation of health services research findings into practice: a consolidated framework for advancing implementation science. Implement Sci. 2009;4:50.
- , , , Mixed‐methods approach to understanding nurses' clinical reasoning in recognizing delirium in hospitalized older adults. J Contin Educ Nurs. 2014;45:1–13.
- , , Educational interventions to improve recognition of delirium: a systematic review. J Am Geriatr Soc. 2013;61(11):1983–1993.
- , Delirium superimposed on dementia: accuracy of nurse documentation. J Gerontol Nurs. 2012;38(1):32–42.
- , , , et al. Detection of delirium by bedside nurses using the confusion assessment method. J Am Geriatr Soc. 2006;54:685–689.
- , , , et al. Documentation of delirium in elderly patients with hip fracture. J Gerontol Nurs. 2002;28(11):23–29.
- , , , Recorded delirium in a national sample of elderly inpatients: potential implications for recognition. J Geriatr Psychiatry Neurol. 2003;16(1):32–38.
- , , , et al. A tale of two methods: chart and interview methods for identifying delirium. J Am Geriatr Soc. 2014;62(3):518–524.
- , , , et al. 3D‐CAM: Derivation and validation of a 3‐minute diagnostic interview for CAM‐defined delirium: a cross‐sectional diagnostic test study. Ann Intern Med. 2014;161(8):554–561.
- , , , et al. Selecting optimal screening items for delirium: an application of item response theory. BMC Med Res Methodol. 2013;13:8.
- , , , et al. The Montreal Cognitive Assessment, MoCA: a brief screening tool for mild cognitive impairment. J Am Geriatr Soc. 2005;53(4):695–699.
- Geriatric Depression Scale. Psychopharmacol Bull. 1988;24(4):709–711.
- , , , A new method of classifying prognostic comorbidity in longitudinal studies: development and validation. J Chronic Dis. 1987;40(5):373–383.
- , , , , Studies of illness in the aged: the index of ADL: a standardized measure of biological and psychosocial function. JAMA. 1963;185:914–919.
- , Assessment of older people: self‐maintaining and instrumental activities of daily living. Gerontologist. 1969;9(3):179–186.
- , , , et al. The AD8: a brief informant interview to detect dementia. Neurology. 2005;65(4):559–564.
- , , , et al. The diagnosis of dementia due to Alzheimer's disease: recommendations from the National Institute on Aging‐Alzheimer's Association workgroups on diagnostic guidelines for Alzheimer's disease. Alzheimers Dement. 2011;7(3):263–269.
- , , , et al. Delirium diagnosis methodology used in research: a survey‐based study. Am J Geriatr Psychiatry. 2014;22(12):1513–1521.
- , , , , Single Question in Delirium (SQiD): testing its efficacy against psychiatrist interview, the Confusion Assessment Method and the Memorial Delirium Assessment Scale. Palliat Med. 2010;24(6):561–565.
- , , , et al. Diagnosing delirium in older emergency department patients: validity and reliability of the delirium triage screen and the brief confusion assessment method. Ann Emerg Med. 2013;62(5):457–465.
- , , , et al. Attention! A good bedside test for delirium? J Neurol Neurosurg Psychiatry. 2014;85(10):1122–1131.
- , , , , A model for management of delirious postacute care patients. J Am Geriatr Soc. 2005;53(10):1817–1825.
- , , , Computerized decision support for delirium superimposed on dementia in older adults: a pilot study. J Gerontol Nurs. 2011;37(4):39–47.
- , , , et al. Barriers and facilitators to implementing delirium rounds in a clinical trial across three diverse hospital settings. Clin Nurs Res. 2014;23(2):201–215.
- , Antecedent probability and the efficiency of psychometric signs, patterns, or cutting scores. Psychol Bull. 1955;52(3):194.
Delirium (acute confusion) is common in older adults and leads to poor outcomes, such as death, clinician and caregiver burden, and prolonged cognitive and functional decline.[1, 2, 3, 4] Delirium is extremely costly, with estimates ranging from $143 to $152 billion annually (2005 US$).[5, 6] Early detection and management may improve the poor outcomes and reduce costs attributable to delirium,[3, 7] yet delirium identification in clinical practice has been challenging, particularly when translating research tools to the bedside.[8, 9, 10]As a result, only 12% to 35% of delirium cases are detected in routine care, with hypoactive delirium and delirium superimposed on dementia most likely to be missed.[11, 12, 13, 14, 15]
To address these issues, we recently developed and published the three‐dimensional Confusion Assessment Method (3D‐CAM), the 3‐minute diagnostic assessment for CAM‐defined delirium.[16] The 3D‐CAM is a structured assessment tool that includes mental status testing, patient symptom probes, and guided interviewer observations for signs of delirium. 3D‐CAM items were selected through a rigorous process to determine the most informative items for the 4 CAM diagnostic features.[17] The 3D‐CAM can be completed in 3 minutes, and has 95% sensitivity and 94% specificity relative to a reference standard.[16]
Despite the capabilities of the 3D‐CAM, there are situations when even 3 minutes is too long to devote to delirium identification. Moreover, a 2‐step approach in which a sensitive ultrabrief screen is administered, followed by the 3D‐CAM in positives, may be the most efficient approach for large‐scale delirium case identification. The aim of the current study was to use the 3D‐CAM database to identify the most sensitive single item and pair of items in the diagnosis of delirium, using the reference standard in the diagnostic accuracy analysis. We hypothesized that we could identify a single item with greater than 80% sensitivity and a pair of items with greater than 90% sensitivity for detection of delirium.
METHODS
Study Sample and Design
We analyzed data from the 3D‐CAM validation study,[16] which prospectively enrolled participants from a large urban teaching hospital in Boston, Massachusetts, using a consecutive enrollment sampling strategy. Inclusion criteria were: (1) 75 years old, (2) admitted to general or geriatric medicine services, (3) able to communicate in English, (4) without terminal conditions, (5) expected hospital stay of 2 days, (6) not a previous study participant. Experienced clinicians screened patients for eligibility. If the patient lacked capacity to provide consent, the designated surrogate decision maker was contacted. The study was approved by the institutional review board.
Reference Standard Delirium Diagnosis
The reference standard delirium diagnosis was based on an extensive (45 minutes) face‐to‐face patient interview by experienced clinician assessors (neuropsychologists or advanced practice nurses), medical record review, and input from the nurse and family members. This comprehensive assessment included: (1) reason for hospital admission, hospital course, and presence of cognitive concerns, (2) family, social, and functional history, (3) Montreal Cognitive Assessment,[18] (4) Geriatric Depression Scale,[19] (5) medical record review including scoring of comorbidities using the Charlson index,[20] determination of functional status using the basic and Instrumental Activities of Daily Living,[21, 22] psychoactive medications administered, and (6) a family member interview to assess the patient's baseline cognitive status that included the Eight‐Item Interview to Differentiate Aging and Dementia,[23] to assess the presence of dementia. Using all of these data, an expert panel, including the clinical assessor, the study principal investigator (E.R.M.), a geriatrician, and an experienced neuropsychologist, adjudicated the final delirium diagnoses using Diagnostic and Statistical Manual of Mental Disorders, 4th Edition (DSM‐IV) criteria. The panel also adjudicated for the presence or absence of dementia and mild cognitive impairment based on National Institute on Aging‐Alzheimer's Association (NIA‐AA) criteria.[24] This approach has been used in other delirium studies.[25]
3D‐CAM Assessments
After the reference standard assessment, the 3D‐CAM was administered by trained research assistants (RAs) who were blinded to the results of the reference standard. To reduce the likelihood of fluctuations or temporal changes, all assessments were completed between 11:00 am and 2:00 pm and for each participant, within a 2‐hour time period (for example, 11:23 am to 1:23 pm).
Statistical Analyses to Determine the Best Single‐ and Two‐Item Screeners
To determine the best single 3D‐CAM item to identify delirium, the responses of the 20 individual items in the 3D‐CAM (see Supporting Table 1 in the online version of this article) were compared to the reference standard to determine their sensitivity and specificity. Similarly, an algorithm was used to generate all unique 2‐item combinations of the 20 items (190 unique pairs), which were compared to the reference. An error, no response, or an answer of I do not know by the patient was considered a positive screen for delirium. The 2‐item screeners were considered positive if 1 or both of the items were positive. Sensitivity and specificity were calculated along with 95% confidence intervals (CIs).
Subset analyses were performed to determine sensitivity and specificity of individual items and pairs of items stratified by the patient's baseline cognitive status. Two strata were createdpatients with dementia (N=56), and patients with normal baseline cognitive status or mild cognitive impairment (MCI) (N=145). We chose to group MCI with normal for 2 reasons: (1) dementia is a well‐established and strong risk factor for delirium, whereas the evidence for MCI being a risk factor for delirium is less established and (2) to achieve adequate allocation of delirious cases in both strata. Last, we report the sensitivity of altered level of consciousness (LOC), which included lethargy, stupor, coma, and hypervigilance as a single screening item for delirium in the overall sample and by cognitive status. Analyses were conducted using commercially available software (SAS version 9.3; SAS Institute, Inc., Cary, NC).
RESULTS
Characteristics of the patients are shown in Table 1. Subjects had a mean age of 84 years, 62% were female, and 28% had a baseline dementia. Forty‐two (21%) had delirium based on the clinical reference standard. Twenty (10%) had less than a high school education and 100 (49%) had at least a college education.
| Characteristic | N (%) |
|---|---|
| |
| Age, y, mean (SD) | 84 (5.4) |
| Sex, n (%) female | 125 (62) |
| White, n (%) | 177 (88) |
| Education, n (%) | |
| Less than high school | 20 (10) |
| High school graduate | 75 (38) |
| College plus | 100 (49) |
| Vision interfered with interview, n (%) | 5 (2) |
| Hearing interfered with interview, n (%) | 18 (9) |
| English second language n (%) | 10 (5) |
| Charlson, mean (SD) | 3 (2.3) |
| ADL, n (% impaired) | 110 (55) |
| IADL, n (% impaired) | 163 (81) |
| MCI, n (%) | 50 (25) |
| Dementia, n (%) | 56 (28) |
| Delirium, n (%) | 42 (21) |
| MoCA, mean (SD) | 19 (6.6) |
| MoCA, median (range) | 20 (030) |
Single Item Screens
Table 2 reports the results of single‐item screens for delirium with sensitivity, the ability to correctly identify delirium when it is present by the reference standard, and specificity, the ability to correctly identify patients without delirium when it is not present by reference standard and 95% CIs. Items are listed in descending order of sensitivity; in the case of ties, the item with the higher specificity is listed first. The screening items with the highest sensitivity for delirium are Months of the year backwards, and Four digits backwards, both with a sensitivity of 83% (95% CI: 69%‐93%). Of these 2 items, Months of the year backwards had a much better specificity of 69% (95% CI: 61%‐76%), whereas Four digits backwards had a specificity of 52% (95% CI: 44%‐60%). The item What is the day of the week? had lower sensitivity at 71% (95% CI: 55%‐84%), but excellent specificity at 92% (95% CI: 87%‐96%).
| Screen Item | Screen Positive (%)c | Sensitivity (95% CI) | Specificity (95% CI) | LR | LR |
|---|---|---|---|---|---|
| |||||
| Months of the year backwards | 42 | 0.83 (0.69‐0.93) | 0.69 (0.61‐0.76) | 2.7 | 0.24 |
| Four digits backwards | 56 | 0.83 (0.69‐0.93) | 0.52 (0.44‐0.60) | 1.72 | 0.32 |
| What is the day of the week? | 21 | 0.71 (0.55‐0.84) | 0.92 (0.87‐0.96) | 9.46 | 0.31 |
| What is the year? | 16 | 0.55 (0.39‐0.70) | 0.94 (0.9‐0.97) | 9.67 | 0.48 |
| Have you felt confused during the past day? | 14 | 0.50 (0.34‐0.66) | 0.95 (0.9‐0.98) | 9.94 | 0.53 |
| Days of the week backwards | 15 | 0.50 (0.34‐0.66) | 0.94 (0.89‐0.97) | 7.95 | 0.53 |
| During the past day, did you see things that were not really there? | 11 | 0.45 (0.3‐0.61) | 0.97 (0.94‐0.99) | 17.98 | 0.56 |
| Three digits backwards | 15 | 0.45 (0.3‐0.61) | 0.92 (0.87‐0.96) | 5.99 | 0.59 |
| What type of place is this? | 9 | 0.38 (0.24‐0.54) | 0.99 (0.96‐1) | 30.29 | 0.63 |
| During the past day, did you think you were not in the hospital? | 10 | 0.38 (0.24‐0.54) | 0.97 (0.94‐0.99) | 15.14 | 0.64 |
We then examined performance of single‐item screeners in patients with and without dementia (Table 3). In persons with dementia, the best single item was also Months of the year backwards, with a sensitivity of 89% (95% CI: 72%‐98%) and a specificity of 61% (95% CI: 41%‐78%). In persons with normal baseline cognition or MCI, the best performing single item was Four digits backwards, with sensitivity of 79% (95% CI: 49%‐95%) and specificity of 51% (95% CI: 42%‐60%). Months of the year backwards also performed well, with sensitivity of 71% (95% CI: 42%‐92%) and specificity of 71% (95% CI: 62%‐79%).
| Test Item | Normal/MCI Patients (n=145) | Dementia Patients (n=56) | ||||||||
|---|---|---|---|---|---|---|---|---|---|---|
| Screen Positive (%)b | Sensitivity (95% CI) | Specificity (95% CI) | LR | LR | Screen Positive (%)b | Sensitivity (95% CI) | Specificity (95% CI) | LR | LR | |
| ||||||||||
| Months backwards | 33 | 0.71 (0.42‐0.92) | 0.71 (0.62‐0.79) | 2.46 | 0.4 | 64 | 0.89 (0.72‐0.98) | 0.61 (0.41‐0.78) | 2.27 | 0.18 |
| Four digits backwards | 52 | 0.79 (0.49‐0.95) | 0.51 (0.42‐0.60) | 1.61 | 0.42 | 66 | 0.86 (0.67‐0.96) | 0.54 (0.34‐0.72) | 1.85 | 0.27 |
| What is the day of the week? | 10 | 0.64 (0.35‐0.87) | 0.96 (0.91‐0.99) | 16.84 | 0.37 | 50 | 0.75 (0.55‐0.89) | 0.75 (0.55‐0.89) | 3 | 0.33 |
Two‐Item Screens
Table 4 reports the results of 2‐item screens for delirium with sensitivity, specificity, and 95% CIs. Item pairs are listed in descending order of sensitivity following the same convention as in Table 2. The 2‐item screen with the highest sensitivity for delirium is the combination of What is the day of the week? and Months of the year backwards, with a sensitivity of 93% (95% CI: 81%‐99%) and specificity of 64% (95% CI: 56%‐70%). This screen had a positive and negative likelihood ratio (LR) of 2.59 and 0.11, respectively. The combination of What is the day of the week? and Four digits backwards had the same sensitivity 93% (95% CI: 81%‐99%), but lower specificity of 48% (95% CI: 40%‐56%). The combination of What type of place is this? (hospital) and Four digits backwards had a sensitivity of 90% (95% CI: 77%‐97%) and specificity of 51% (95% CI: 43%‐50%).
| Screen Item 1 | Screen Item 2 | Screen Positive (%)c | Sensitivity (95% CI) | Specificity (95% CI) | LR | LR |
|---|---|---|---|---|---|---|
| ||||||
| What is the day of the week? | Months backwards | 48 | 0.93 (0.81‐0.99) | 0.64 (0.56‐0.70) | 2.59 | 0.11 |
| What is the day of the week? | Four digits backwards | 60 | 0.93 (0.81‐0.99) | 0.48 (0.4‐0.56) | 1.8 | 0.15 |
| Four digits backwards | Months backwards | 65 | 0.93 (0.81‐0.99) | 0.42 (0.34‐0.50) | 1.6 | 0.17 |
| What type of place is this? | Four digits backwards | 58 | 0.90 (0.77‐0.97) | 0.51 (0.43‐0.50) | 1.84 | 0.19 |
| What is the year? | Four digits backwards | 59 | 0.9 (0.77‐0.97) | 0.5 (0.42‐0.5) | 1.80 | 0.19 |
| What is the day of the week? | Three digits backwards | 30 | 0.88 (0.74‐0.96) | 0.86 (0.79‐0.90) | 6.09 | 0.14 |
| What is the year? | Months backwards | 44 | 0.88 (0.74‐0.96) | 0.68 (0.6‐0.75) | 2.75 | 0.18 |
| What type of place is this? | Months backwards | 43 | 0.86 (0.71‐0.95) | 0.69 (0.61‐0.70) | 2.73 | 0.21 |
| During the past day, did you think you were not in the hospital? | Months backwards | 43 | 0.86 (0.71‐0.95) | 0.69 (0.61‐0.70) | 2.73 | 0.21 |
| Days of the week backwards | Months backwards | 43 | 0.86 (0.71‐0.95) | 0.68 (0.6‐0.75) | 2.67 | 0.21 |
When subjects were stratified by baseline cognition, the best 2‐item screens for normal and MCI patients was What is the day of the week? and Four digits backwards, with 93% sensitivity (95% CI: 66%‐100%) and 50% specificity (95% CI: 42%‐59%). The best pair of items for patients with dementia (Table 5) was the same as the overall sample, What is the day of the week? and Months of the year backwards, but its performance differed with a higher sensitivity of 96% (95% CI: 82%‐100%) and lower specificity of 43% (95% CI: 24%‐63%). This same pair of items had 86% sensitivity (95% CI: 57%‐98%) and 69% (95% CI: 60%‐77%) specificity for persons with either normal cognition or MCI.
| Test Item 1 | Test Item 2 | Normal/MCI Patients (n=145) | Dementia Patients (n=56) | ||||||||
|---|---|---|---|---|---|---|---|---|---|---|---|
| Item Positive (%)b | Sensitivity (95% CI) | Specificity (95% CI) | LR | LR | Item Positive (%)b | Sensitivity (95% CI) | Specificity (95% CI) | LR | LR | ||
| |||||||||||
| What is the day of the week? | Months backwards | 36 | 0.86 (0.57‐0.98) | 0.69 (0.60‐0.77) | 2.74 | 0.21 | 77 | 0.96 (0.82‐1) | 0.43 (0.24‐0.63) | 1.69 | 0.08 |
| What is the day of the week? | Four digits backwards | 54 | 0.93 (0.66‐1) | 0.5 (0.42‐0.59) | 1.87 | 0.14 | 77 | 0.93 (0.76‐0.99) | 0.39 (0.22‐0.59) | 1.53 | 0.18 |
| Four digits backwards | Months backwards | 61 | 0.93 (0.66‐1) | 0.43 (0.34‐0.52) | 1.62 | 0.17 | 77 | 0.93 (0.76‐0.99) | 0.39 (0.22‐0.59) | 1.53 | 0.18 |
Altered Level of Consciousness as a Screener for Delirium
Altered level of consciousness (ALOC) was uncommon in our sample, with an overall prevalence of 10/201 (4.9%). When examined as a screening item for delirium, ALOC had very poor sensitivity of 19% (95% CI: 9%‐34%) but had excellent specificity 99% (95% CI: 96%‐100%). Altered LOC also demonstrated poor screening performance when stratified by cognitive status, with a sensitivity of 14% in the normal and MCI group (95% CI: 2%‐43%) and sensitivity of 21% (95% CI: 8%‐41%) in persons with dementia.
Positive and Negative Predictive Values
Although we focused on sensitivity and specificity in evaluating 1‐ and 2‐item screeners, we also examined positive and negative predictive values. These values will vary depending on the overall prevalence of delirium, which was 21% in this dataset. The best 1‐item screener, Months of the year backwards, had a positive predictive value of 31% and negative predictive value of 94%. The best 2‐item screener, Months of the year backwards with What is the day of the week?, had a positive predictive value of 41% and negative predictive value of 97% (see Supporting Tables 2 and 3 in the online version of this article) LRs for the items are in Tables 2 through 5.
DISCUSSION
Identifying simple, efficient, bedside case‐identification methods for delirium is an essential step toward improving recognition of this highly morbid syndrome in hospitalized older adults. In this study, we identified a single cognitive item, Months of the year backwards, that identified 83% of delirium cases when compared with a reference standard diagnosis. Furthermore, we identified 2 items, Months of the year backwards and What is the day of the week? which when used in combination identified 93% of delirium cases. The same 1 and 2 items also worked well in patients with dementia, in whom delirium is often missed. Although these items require further clinical validation, the development of an ultrabrief 2‐item test that identifies over 90% of delirium cases and can be completed in less than 1 minute (recently, we administered the best 2‐item screener to 20 consecutive general medicine patients over age 70 years, and it was completed in a median of 36.5 seconds), holds great potential for simplifying bedside delirium screening and improving the care of hospitalized older adults.
Our current findings both confirm and extend the emerging literature on best screening items for delirium. Sands and colleagues (2010)[26] tested a single test for delirium, Do you think (name of patient) has been more confused lately? in 21 subjects and achieved a sensitivity of 80%. Han and colleagues developed a screening tool in emergency‐department patients using the LOC question from the Richmond Agitation‐Sedation Scale and spelling the word lunch backwards, and achieved 98% sensitivity, but in a younger emergency department population with a low prevalence of dementia.[27] O'Regan et al. recently also found Months of the year backwards to be the best single‐screening item for delirium in a large sample, but only tested a 1‐item screen.[28] Our study extends these studies in several important ways by: (1) employing a rigorous clinical reference standard diagnosis of delirium, (2) having a large sample with a high prevalence of patients with dementia, (3) use of a general medical population, and (4) examining the best 2‐item screens in addition to the best single item.
Systematic intervention programs[29, 30, 31] that focus on improved delirium evaluation and management have the potential to improve patient outcomes and reduce costs. However, targeting these programs to patients with delirium has proven difficult, as only 12% to 35% of delirium cases are recognized in routine clinical practice.[11, 12, 13, 14, 15] The 1‐ and 2‐item screeners we identified could play an important role in future delirium identification. The 3D‐CAM combines high sensitivity (95%) with high specificity (94%)[16] and therefore would be an excellent choice as the second step after a positive screen. The feasibility, effectiveness, and cost of administering these screeners, followed by a brief diagnostic tool such as the 3D‐CAM, should be evaluated in future work.
Our study has noteworthy strengths, including the use of a large purposefully challenging clinical sample with advanced age that included a substantial proportion with dementia, a detailed assessment, and the testing of very brief and practical tools for bedside delirium screening.[25] This study also has several important limitations. Most importantly, we presented secondary analysis of individual items and pairs of items drawn from the 3D CAM assessment; therefore, the 2‐item bedside screen requires prospective clinical validation. The reference standard was based on the DSM‐IV, because this study was conducted prior to the release of DSM‐V. In addition, the ordering of the reference standard and 3D‐CAM assessments was not randomized due to feasibility constraints. In addition, this study was cross‐sectional, involved only a single hospital, and enrolled only older medical patients during the day shift. Our sample was older (aged 75 years and older), and a younger sample may have had a different prevalence of delirium, which could affect the positive predictive value of our ultrabrief screen. We plan to test this in a sample of patients aged 70 years and older in future studies. Finally, it should be noted that these best 1‐item and 2‐item screeners miss 17% and 7% of delirium cases, respectively. In cases where this is unacceptably high, alternative approaches might be necessary.
It is important to remember that these 1‐ and 2‐item screeners are not diagnostic tools and therefore should not be used in isolation. Optimally, they will be followed by a more specific evaluation, such as the 3D‐CAM, as part of a systematic delirium identification process. For instance, in our sample (with a delirium rate of 21%), the best 2‐item screener had a positive predictive value of 41%, meaning that positive screens are more likely to be false positives than true positives (see Supporting Tables 2 and 3 in the online version of this article).[32] Nevertheless, by reducing the total number of patients who require diagnostic instrument administration, use of these ultrabrief screeners can improve efficiency and result in a net benefit to delirium case‐identification efforts.[32]
Time has been demonstrated to be a barrier to delirium identification in previous studies, but there are likely others. These may include, for instance, staff nihilism about screening making a difference, ambiguous responsibility for delirium screening and management, unsupportive system leadership, and absent payment for these activities.[31] Moreover, it is possible that the 2‐step process we propose may create an incentive for staff to avoid positive screens as they see it creating more work for themselves. We plan to identify and address such barriers in our future work.
In conclusion, we identified a single screening item for delirium, Months of the year backwards, with 83% sensitivity, and a pair of items, Months of the year backwards and What is the day of the week?, with 93% sensitivity relative to a rigorous reference standard diagnosis. These ultrabrief screening items work well in patients with and without dementia, and should require very little training of staff. Future studies should further validate these tools, and determine their translatability and scalability into programs for systematic, widespread delirium detection. Developing efficient and accurate case identification strategies is a necessary prerequisite to appropriately target delirium management protocols, enabling healthcare systems to effectively address this costly and deadly condition.
Disclosures
Author contributionsD.M.F. conceived the study idea, participated in its design and coordination, and drafted the initial manuscript. S.K.I. contributed to the study design and conceptualization, supervision, funding, preliminary analysis, and interpretation of the data, and critical revision of the manuscript. J.G. conducted the analysis for the study and critically revised the manuscript. L.N. supervised the analysis for the study and critically revised the manuscript. R.J. contributed to the study design and critical revision of the manuscript. J.S.S. critically revised the manuscript. E.R.M. obtained funding for the study, supervised all data collection, assisted in drafting and critically revising the manuscript, and contributed to the conceptualization, design, and supervision of the study. All authors have seen and agree with the contents of the manuscript.
This work was supported by the National Institute of Aging grant number R01AG030618 and K24AG035075 to Dr. Marcantonio. Dr. Inouye's time was supported in part by grants P01AG031720, R01AG044518, and K07AG041835 from the National Institute on Aging. Dr. Inouye holds the Milton and Shirley F. Levy Family Chair (Hebrew Senior Life/Harvard Medical School). Dr. Fick is partially supported from National Institute of Nursing Research grant number R01 NR011042. Dr. Saczynski was supported in part by funding from the National Institute on Aging (K01AG33643) and from the National Heart Lung and Blood Institute (U01HL105268). The funding agencies had no role and the authors retained full autonomy in the preparation of this article. All authors and coauthors have no financial or nonfinancial conflicts of interest to disclose regarding this article.
This article was presented at the Presidential Poster Session at the American Geriatrics Society 2014 Annual Meeting in Orlando, Florida, May 14, 2014.
- , , , , , Delirium in elderly patients and the risk of postdischarge mortality, institutionalization, and dementia: a meta‐analysis. JAMA. 2010;304(4):443–451.
- , , , et al. Cognitive trajectories after postoperative delirium. N Engl J Med. 2012;367(1):30–39.
- , , Delirium in elderly people. Lancet. 2014;383:911–922.
- , , , Delirium superimposed on dementia is associated with prolonged length of stay and poor outcomes in hospitalized older adults. J Hosp Med. 2013;8(9):500–505.
- , , , , One‐year health care costs associated with delirium in the elderly population. Arch Intern Med. 2008;168(1):27–32.
- , The importance of delirium: Economic and societal costs. J Am Geriatr Soc. 2011;59(suppl 2):S241–S243.
- Delirium. Ann Intern Med. 2011;154(11):ITC6.
- , , , , , Fostering implementation of health services research findings into practice: a consolidated framework for advancing implementation science. Implement Sci. 2009;4:50.
- , , , Mixed‐methods approach to understanding nurses' clinical reasoning in recognizing delirium in hospitalized older adults. J Contin Educ Nurs. 2014;45:1–13.
- , , Educational interventions to improve recognition of delirium: a systematic review. J Am Geriatr Soc. 2013;61(11):1983–1993.
- , Delirium superimposed on dementia: accuracy of nurse documentation. J Gerontol Nurs. 2012;38(1):32–42.
- , , , et al. Detection of delirium by bedside nurses using the confusion assessment method. J Am Geriatr Soc. 2006;54:685–689.
- , , , et al. Documentation of delirium in elderly patients with hip fracture. J Gerontol Nurs. 2002;28(11):23–29.
- , , , Recorded delirium in a national sample of elderly inpatients: potential implications for recognition. J Geriatr Psychiatry Neurol. 2003;16(1):32–38.
- , , , et al. A tale of two methods: chart and interview methods for identifying delirium. J Am Geriatr Soc. 2014;62(3):518–524.
- , , , et al. 3D‐CAM: Derivation and validation of a 3‐minute diagnostic interview for CAM‐defined delirium: a cross‐sectional diagnostic test study. Ann Intern Med. 2014;161(8):554–561.
- , , , et al. Selecting optimal screening items for delirium: an application of item response theory. BMC Med Res Methodol. 2013;13:8.
- , , , et al. The Montreal Cognitive Assessment, MoCA: a brief screening tool for mild cognitive impairment. J Am Geriatr Soc. 2005;53(4):695–699.
- Geriatric Depression Scale. Psychopharmacol Bull. 1988;24(4):709–711.
- , , , A new method of classifying prognostic comorbidity in longitudinal studies: development and validation. J Chronic Dis. 1987;40(5):373–383.
- , , , , Studies of illness in the aged: the index of ADL: a standardized measure of biological and psychosocial function. JAMA. 1963;185:914–919.
- , Assessment of older people: self‐maintaining and instrumental activities of daily living. Gerontologist. 1969;9(3):179–186.
- , , , et al. The AD8: a brief informant interview to detect dementia. Neurology. 2005;65(4):559–564.
- , , , et al. The diagnosis of dementia due to Alzheimer's disease: recommendations from the National Institute on Aging‐Alzheimer's Association workgroups on diagnostic guidelines for Alzheimer's disease. Alzheimers Dement. 2011;7(3):263–269.
- , , , et al. Delirium diagnosis methodology used in research: a survey‐based study. Am J Geriatr Psychiatry. 2014;22(12):1513–1521.
- , , , , Single Question in Delirium (SQiD): testing its efficacy against psychiatrist interview, the Confusion Assessment Method and the Memorial Delirium Assessment Scale. Palliat Med. 2010;24(6):561–565.
- , , , et al. Diagnosing delirium in older emergency department patients: validity and reliability of the delirium triage screen and the brief confusion assessment method. Ann Emerg Med. 2013;62(5):457–465.
- , , , et al. Attention! A good bedside test for delirium? J Neurol Neurosurg Psychiatry. 2014;85(10):1122–1131.
- , , , , A model for management of delirious postacute care patients. J Am Geriatr Soc. 2005;53(10):1817–1825.
- , , , Computerized decision support for delirium superimposed on dementia in older adults: a pilot study. J Gerontol Nurs. 2011;37(4):39–47.
- , , , et al. Barriers and facilitators to implementing delirium rounds in a clinical trial across three diverse hospital settings. Clin Nurs Res. 2014;23(2):201–215.
- , Antecedent probability and the efficiency of psychometric signs, patterns, or cutting scores. Psychol Bull. 1955;52(3):194.
© 2015 Society of Hospital Medicine
Reducing Inappropriate Acid Suppressives
Prior studies have found that up to 70% of acid‐suppressive medication (ASM) use in the hospital is not indicated, most commonly for stress ulcer prophylaxis in patients outside of the intensive care unit (ICU).[1, 2, 3, 4, 5, 6, 7] Accordingly, reducing inappropriate use of ASM for stress ulcer prophylaxis in hospitalized patients is 1 of the 5 opportunities for improved healthcare value identified by the Society of Hospital Medicine as part of the American Board of Internal Medicine's Choosing Wisely campaign.[8]
We designed and tested a computerized clinical decision support (CDS) intervention with the goal of reducing use of ASM for stress ulcer prophylaxis in hospitalized patients outside the ICU at an academic medical center.
METHODS
Study Design
We conducted a quasiexperimental study using an interrupted time series to analyze data collected prospectively during clinical care before and after implementation of our intervention. The study was deemed a quality improvement initiative by the Beth Israel Deaconess Medical Center Committee on Clinical Investigations/Institutional Review Board.
Patients and Setting
All admissions >18 years of age to a 649‐bed academic medical center in Boston, Massachusetts from September 12, 2011 through July 3, 2012 were included. The medical center consists of an East and West Campus, located across the street from each other. Care for both critically ill and noncritically ill medical and surgical patients occurs on both campuses. Differences include greater proportions of patients with gastrointestinal and oncologic conditions on the East Campus, and renal and cardiac conditions on the West Campus. Additionally, labor and delivery occurs exclusively on the East Campus, and the density of ICU beds is greater on the West Campus. Both campuses utilize a computer‐based provider order entry (POE) system.
Intervention
Our study was implemented in 2 phases (Figure 1).
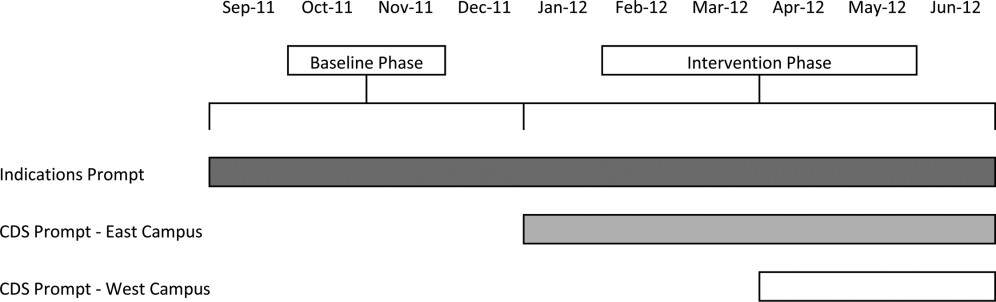
Baseline Phase
The purpose of the first phase was to obtain baseline data on ASM use prior to implementing our CDS tool designed to influence prescribing. During this baseline phase, a computerized prompt was activated through our POE system whenever a clinician initiated an order for ASM (histamine 2 receptor antagonists or proton pump inhibitors), asking the clinician to select the reason/reasons for the order based on the following predefined response options: (1) active/recent upper gastrointestinal bleed, (2) continuing preadmission medication, (3) Helicobacter pylori treatment, (4) prophylaxis in patient on medications that increase bleeding risk, (5) stress ulcer prophylaxis, (6) suspected/known peptic ulcer disease, gastritis, esophagitis, gastroesophageal reflux disease, and (7) other, with a free‐text box to input the indication. This indications prompt was rolled out to the entire medical center on September 12, 2011 and remained active for the duration of the study period.
Intervention Phase
In the second phase of the study, if a clinician selected stress ulcer prophylaxis as the only indication for ordering ASM, a CDS prompt alerted the clinician that Stress ulcer prophylaxis is not recommended for patients outside of the intensive care unit (ASHP Therapeutic Guidelines on Stress Ulcer Prophylaxis. Am J Health‐Syst Pharm. 1999, 56:347‐79). The clinician could then select either, For use in ICUOrder Medication, Choose Other Indication, or Cancel Order. This CDS prompt was rolled out in a staggered manner to the East Campus on January 3, 2012, followed by the West Campus on April 3, 2012.
Outcomes
The primary outcome was the rate of ASM use with stress ulcer prophylaxis selected as the only indication in a patient located outside of the ICU. We confirmed patient location in the 24 hours after the order was placed. Secondary outcomes were rates of overall ASM use, defined via pharmacy charges, and rates of use on discharge.
Statistical Analysis
To assure stable measurement of trends, we studied at least 3 months before and after the intervention on each campus. We used the Fisher exact test to compare the rates of our primary and secondary outcomes before and after the intervention, stratified by campus. For our primary outcomeat least 1 ASM order with stress ulcer prophylaxis selected as the only indication during hospitalizationwe developed a logistic regression model with a generalized estimating equation and exchangeable working correlation structure to control for admission characteristics (Table 1) and repeated admissions. Using a term for the interaction between time and the intervention, this model allowed us to assess changes in level and trend for the odds of a patient receiving at least 1 ASM order with stress ulcer prophylaxis as the only indication before, compared to after the intervention, stratified by campus. We used a 2‐sided type I error of <0.05 to indicate statistical significance.
| Study Phase | Campus | |||
|---|---|---|---|---|
| East | West | |||
| Baseline, n=3,747 | Intervention, n=6,191 | Baseline, n=11,177 | Intervention, n=5,285 | |
| ||||
| Age, y, mean (SD) | 48.1 (18.5) | 47.7 (18.2) | 61.0 (18.0) | 60.3 (18.1) |
| Gender, no. (%) | ||||
| Female | 2744 (73.2%) | 4542 (73.4%) | 5551 (49.7%) | 2653 (50.2%) |
| Male | 1003 (26.8%) | 1649 (26.6%) | 5626 (50.3%) | 2632 (49.8%) |
| Race, no. (%) | ||||
| Asian | 281 (7.5%) | 516 (8.3%) | 302 (2.7%) | 156 (3%) |
| Black | 424 (11.3%) | 667 (10.8%) | 1426 (12.8%) | 685 (13%) |
| Hispanic | 224 (6%) | 380 (6.1%) | 619 (5.5%) | 282 (5.3%) |
| Other | 378 (10.1%) | 738 (11.9%) | 776 (6.9%) | 396 (7.5%) |
| White | 2440 (65.1%) | 3890 (62.8%) | 8054 (72%) | 3766 (71.3%) |
| Charlson score, mean (SD) | 0.8 (1.1) | 0.7 (1.1) | 1.5 (1.4) | 1.4 (1.4) |
| Gastrointestinal bleeding, no. (%)* | 49 (1.3%) | 99 (1.6%) | 385 (3.4%) | 149 (2.8%) |
| Other medication exposures, no. (%) | ||||
| Therapeutic anticoagulant | 218 (5.8%) | 409 (6.6%) | 2242 (20.1%) | 1022 (19.3%) |
| Prophylactic anticoagulant | 1081 (28.8%) | 1682 (27.2%) | 5999 (53.7%) | 2892 (54.7%) |
| NSAID | 1899 (50.7%) | 3141 (50.7%) | 1248 (11.2%) | 575 (10.9%) |
| Antiplatelet | 313 (8.4%) | 585 (9.4%) | 4543 (40.6%) | 2071 (39.2%) |
| Admitting department, no. (%) | ||||
| Surgery | 2507 (66.9%) | 4146 (67%) | 3255 (29.1%) | 1578 (29.9%) |
| Nonsurgery | 1240 (33.1%) | 2045 (33%) | 7922 (70.9%) | 3707 (70.1%) |
| Any ICU Stay, no. (%) | 217 (5.8%) | 383 (6.2%) | 2786 (24.9%) | 1252 (23.7%) |
RESULTS
There were 26,400 adult admissions during the study period, and 22,330 discrete orders for ASM. Overall, 12,056 (46%) admissions had at least 1 charge for ASM. Admission characteristics were similar before and after the intervention on each campus (Table 1).
Table 2 shows the indications chosen each time ASM was ordered, stratified by campus and study phase. Although selection of stress ulcer prophylaxis decreased on both campuses during the intervention phase, selection of continuing preadmission medication increased.
| Study Phase | Campus | |||
|---|---|---|---|---|
| East | West | |||
| Baseline, n=2,062 | Intervention, n=3,243 | Baseline, n=12,038 | Intervention, n=4,987 | |
| ||||
| Indication* | ||||
| Continuing preadmission medication | 910 (44.1%) | 1695 (52.3%) | 5597 (46.5%) | 2802 (56.2%) |
| PUD, gastritis, esophagitis, GERD | 440 (21.3%) | 797 (24.6%) | 1303 (10.8%) | 582 (11.7%) |
| Stress ulcer prophylaxis | 298 (14.4%) | 100 (3.1%) | 2659 (22.1%) | 681 (13.7%) |
| Prophylaxis in patient on medications that increase bleeding risk | 226 (11.0%) | 259 (8.0%) | 965 (8.0%) | 411 (8.2%) |
| Active/recent gastrointestinal bleed | 154 (7.5%) | 321 (9.9%) | 1450 (12.0%) | 515 (10.3) |
| Helicobacter pylori treatment | 6 (0.2%) | 2 (0.1%) | 43 (0.4%) | 21 (0.4%) |
| Other | 111 (5.4%) | 156 (4.8%) | 384 (3.2%) | 186 (3.7%) |
Table 3 shows the unadjusted comparison of outcomes between baseline and intervention phases on each campus. Use of ASM with stress ulcer prophylaxis as the only indication decreased during the intervention phase on both campuses. There was a nonsignificant reduction in overall rates of use on both campuses, and use on discharge was unchanged. Figure 2 demonstrates the unadjusted and modeled monthly rates of admissions with at least 1 ASM order with stress ulcer prophylaxis selected as the only indication, stratified by campus. After adjusting for the admission characteristics in Table 1, during the intervention phase on both campuses there was a significant immediate reduction in the odds of receiving an ASM with stress ulcer prophylaxis selected as the only indication (East Campus odds ratio [OR]: 0.36, 95% confidence interval [CI]: 0.180.71; West Campus OR: 0.41, 95% CI: 0.280.60), and a significant change in trend compared to the baseline phase (East Campus 1.5% daily decrease in odds of receiving ASM solely for stress ulcer prophylaxis, P=0.002; West Campus 0.9% daily decrease in odds of receiving ASM solely for stress ulcer prophylaxis, P=0.02).
| Study Phase | Campus | |||||
|---|---|---|---|---|---|---|
| East | West | |||||
| Baseline, n=3,747 | Intervention, n=6,191 | P Value* | Baseline, n=11,177 | Intervention, n=5,285 | P Value* | |
| ||||||
| Outcome | ||||||
| Any inappropriate acid‐suppressive exposure | 4.0% | 0.6% | <0.001 | 7.7% | 2.2% | <0.001 |
| Any acid‐suppressive exposure | 33.1% | 31.8% | 0.16 | 54.5% | 52.9% | 0.05 |
| Discharged on acid‐suppressive medication | 18.9% | 19.6% | 0.40 | 34.7% | 34.7% | 0.95 |
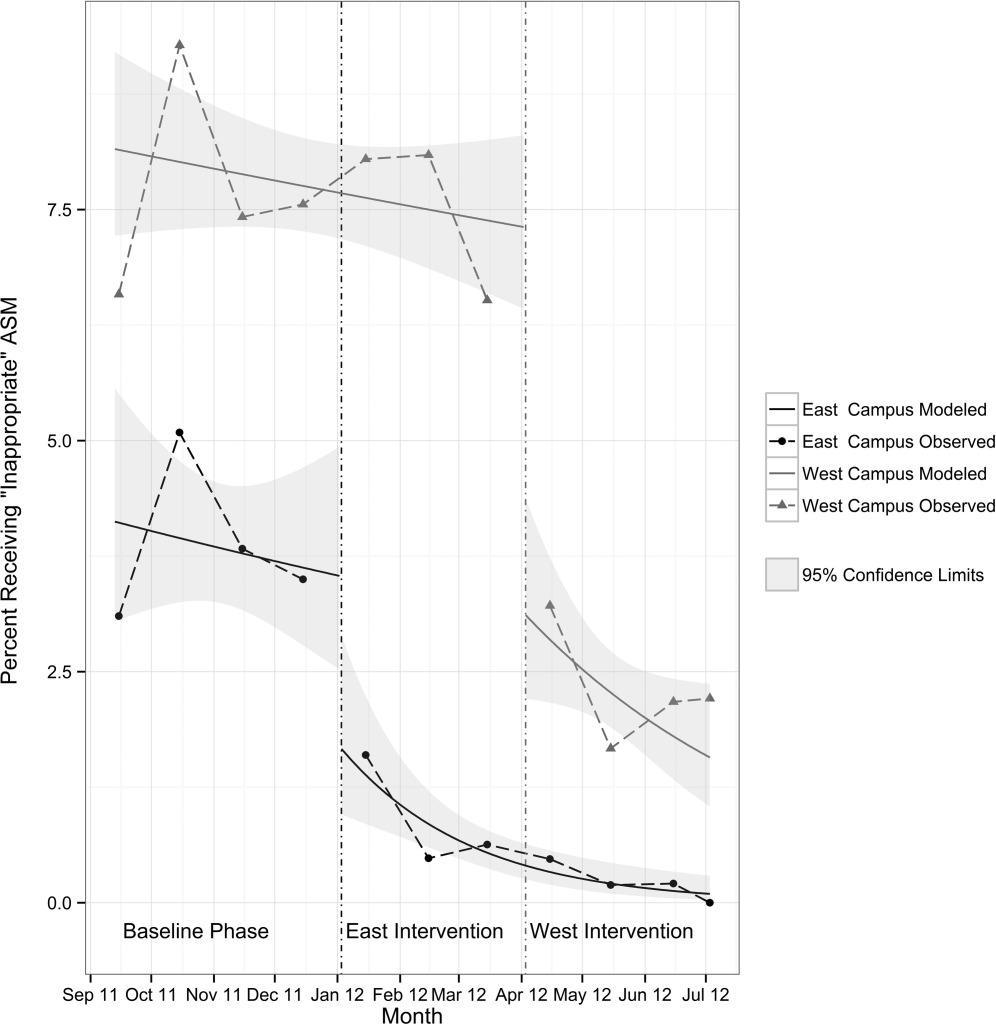
DISCUSSION
In this single‐center study, we found that a computerized CDS intervention resulted in a significant reduction in use of ASM for the sole purpose of stress ulcer prophylaxis in patients outside the ICU, a nonsignificant reduction in overall use, and no change in use on discharge. We found low rates of use for the isolated purpose of stress ulcer prophylaxis even before the intervention, and continuing preadmission medication was the most commonly selected indication throughout the study.
Although overall rates of ASM use declined after the intervention, the change was not statistically significant, and was not of the same magnitude as the decline in rates of use for the purpose of stress ulcer prophylaxis. This suggests that our intervention, in part, led to substitution of 1 indication for another. The indication that increased the most after rollout on both campuses was continuing preadmission medication. There are at least 2 possibilities for this finding: (1) the intervention prompted physicians to more accurately record the indication, or (2) physicians falsified the indication in order to execute the order. To explore these possibilities, we reviewed the charts of a random sample of 100 admissions during each of the baseline and intervention phases where continuing preadmission medication was selected as an indication for an ASM order. We found that 6/100 orders in the baseline phase and 7/100 orders in the intervention phase incorrectly indicated that the patient was on ASM prior to admission (P=0.77). This suggests that scenario 1 above is the more likely explanation for the increased use of this indication, and that the intervention, in part, simply unmasked the true rate of use at our medical center for the isolated purpose of stress ulcer prophylaxis.
These findings have implications for others attempting to use computerized CDS to better understand physician prescribing. They suggest that information collected through computer‐based interaction with clinicians at the point of care may not always be accurate or complete. As institutions increasingly use similar interventions to drive behavior, information obtained from such interaction should be validated, and when possible, patient outcomes should be measured.
Our findings suggest that rates of ASM use for the purpose of stress ulcer prophylaxis in the hospital may have declined over the last decade. Studies demonstrating that up to 70% of inpatient use of ASM was inappropriate were conducted 5 to 10 years ago.[1, 2, 3, 4, 5] Since then, studies have demonstrated risk of nosocomial infections in patients on ASM.[9, 10, 11] It is possible that the low rate of use for stress ulcer prophylaxis in our study is attributable to awareness of the risks of these medications, and limited our ability to detect differences in overall use. It is also possible, however, that a portion of the admissions with continuation of preadmission medication as the indication were started on these medications during a prior hospitalization. Thus, some portion of preadmission use is likely to represent failed medication reconciliation during a prior discharge. In this context, hospitalization may serve as an opportunity to evaluate the indication for ASM use even when these medications show up as preadmission medications.
There are additional limitations. First, the single‐center nature limits generalizability. Second, the first phase of our study, designed to obtain baseline data on ASM use, may have led to changes in prescribing prior to implementation of our CDS tool. Additionally, we did not validate the accuracy of each of the chosen indications, or the site of initial prescription in the case of preadmission exposure. Last, our study was not powered to investigate changes in rates of nosocomial gastrointestinal bleeding or nosocomial pneumonia owing to the infrequent nature of these complications.
In conclusion, we designed a simple computerized CDS intervention that was associated with a reduction in ASM use for stress ulcer prophylaxis in patients outside the ICU, a nonsignificant reduction in overall use, and no change in use on discharge. The majority of inpatient use represented continuation of preadmission medication, suggesting that interventions to improve the appropriateness of ASM prescribing should span the continuum of care. Future studies should investigate whether it is worthwhile and appropriate to reevaluate continued use of preadmission ASM during an inpatient stay.
Acknowledgements
The authors acknowledge Joshua Guthermann, MBA, and Jane Hui Chen Lim, MBA, for their assistance in the early phases of data analysis, and Long H. Ngo, PhD, for his statistical consultation.
Disclosures: Dr. Herzig was funded by a Young Clinician Research Award from the Center for Integration of Medicine and Innovative Technology, a nonprofit consortium of Boston teaching hospitals and universities, and grant number K23AG042459 from the National Institute on Aging. Dr. Marcantonio was funded by grant number K24AG035075 from the National Institute on Aging. The funding organizations had no involvement in any aspect of the study, including design, conduct, and reporting of the study. Dr. Herzig had full access to all of the data in the study and takes responsibility for the integrity of the data and the accuracy of the data analysis. Drs. Herzig and Marcantonio were responsible for the study concept and design. Drs. Herzig, Feinbloom, Howell, and Ms. Adra and Mr. Afonso were responsible for the acquisition of data. Drs. Herzig, Howell, Marcantonio, and Mr. Guess were responsible for the analysis and interpretation of the data. Dr. Herzig drafted the manuscript. All of the authors participated in the critical revision of the manuscript for important intellectual content. Drs. Herzig and Marcantonio were responsible for study supervision. The authors report no conflicts of interest.
- , . Stress ulcer prophylaxis in hospitalized patients not in intensive care units. Am J Health Syst Pharm. 2007;64(13):1396–1400.
- , . Magnitude and economic impact of inappropriate use of stress ulcer prophylaxis in non‐ICU hospitalized patients. Am J Gastroenterol. 2006;101(10):2200–2205.
- , . Stress‐ulcer prophylaxis for general medical patients: a review of the evidence. J Hosp Med. 2007;2(2):86–92.
- , , , et al. Hospital use of acid‐suppressive medications and its fall‐out on prescribing in general practice: a 1‐month survey. Aliment Pharmacol Ther. 2003;17(12):1503–1506.
- , , , , , . Inadequate use of acid‐suppressive therapy in hospitalized patients and its implications for general practice. Dig Dis Sci. 2005;50(12):2307–2311.
- , . Brief report: reducing inappropriate usage of stress ulcer prophylaxis among internal medicine residents. A practice‐based educational intervention. J Gen Intern Med. 2006;21(5):498–500.
- , , . Inappropriate continuation of stress ulcer prophylactic therapy after discharge. Ann Pharmacother. 2007;41(10):1611–1616.
- , , , et al. Choosing wisely in adult hospital medicine: five opportunities for improved healthcare value. J Hosp Med. 2013;8(9):486–492.
- , , , , . Risk of Clostridium difficile diarrhea among hospital inpatients prescribed proton pump inhibitors: cohort and case‐control studies. CMAJ. 2004;171(1):33–38.
- , , , et al. Iatrogenic gastric acid suppression and the risk of nosocomial Clostridium difficile infection. Arch Intern Med. 2010;170(9):784–790.
- , , , . Acid‐suppressive medication use and the risk for hospital‐acquired pneumonia. JAMA. 2009;301(20):2120–2128.
- Healthcare Cost and Utilization Project. Clinical classifications software (CCS) for ICD‐9‐CM. December 2009. Agency for Healthcare Research and Quality, Rockville, MD. Available at: www.hcup‐us.ahrq.gov/toolssoftware/ccs/ccs.jsp. Accessed June 18, 2014.
Prior studies have found that up to 70% of acid‐suppressive medication (ASM) use in the hospital is not indicated, most commonly for stress ulcer prophylaxis in patients outside of the intensive care unit (ICU).[1, 2, 3, 4, 5, 6, 7] Accordingly, reducing inappropriate use of ASM for stress ulcer prophylaxis in hospitalized patients is 1 of the 5 opportunities for improved healthcare value identified by the Society of Hospital Medicine as part of the American Board of Internal Medicine's Choosing Wisely campaign.[8]
We designed and tested a computerized clinical decision support (CDS) intervention with the goal of reducing use of ASM for stress ulcer prophylaxis in hospitalized patients outside the ICU at an academic medical center.
METHODS
Study Design
We conducted a quasiexperimental study using an interrupted time series to analyze data collected prospectively during clinical care before and after implementation of our intervention. The study was deemed a quality improvement initiative by the Beth Israel Deaconess Medical Center Committee on Clinical Investigations/Institutional Review Board.
Patients and Setting
All admissions >18 years of age to a 649‐bed academic medical center in Boston, Massachusetts from September 12, 2011 through July 3, 2012 were included. The medical center consists of an East and West Campus, located across the street from each other. Care for both critically ill and noncritically ill medical and surgical patients occurs on both campuses. Differences include greater proportions of patients with gastrointestinal and oncologic conditions on the East Campus, and renal and cardiac conditions on the West Campus. Additionally, labor and delivery occurs exclusively on the East Campus, and the density of ICU beds is greater on the West Campus. Both campuses utilize a computer‐based provider order entry (POE) system.
Intervention
Our study was implemented in 2 phases (Figure 1).
Baseline Phase
The purpose of the first phase was to obtain baseline data on ASM use prior to implementing our CDS tool designed to influence prescribing. During this baseline phase, a computerized prompt was activated through our POE system whenever a clinician initiated an order for ASM (histamine 2 receptor antagonists or proton pump inhibitors), asking the clinician to select the reason/reasons for the order based on the following predefined response options: (1) active/recent upper gastrointestinal bleed, (2) continuing preadmission medication, (3) Helicobacter pylori treatment, (4) prophylaxis in patient on medications that increase bleeding risk, (5) stress ulcer prophylaxis, (6) suspected/known peptic ulcer disease, gastritis, esophagitis, gastroesophageal reflux disease, and (7) other, with a free‐text box to input the indication. This indications prompt was rolled out to the entire medical center on September 12, 2011 and remained active for the duration of the study period.
Intervention Phase
In the second phase of the study, if a clinician selected stress ulcer prophylaxis as the only indication for ordering ASM, a CDS prompt alerted the clinician that Stress ulcer prophylaxis is not recommended for patients outside of the intensive care unit (ASHP Therapeutic Guidelines on Stress Ulcer Prophylaxis. Am J Health‐Syst Pharm. 1999, 56:347‐79). The clinician could then select either, For use in ICUOrder Medication, Choose Other Indication, or Cancel Order. This CDS prompt was rolled out in a staggered manner to the East Campus on January 3, 2012, followed by the West Campus on April 3, 2012.
Outcomes
The primary outcome was the rate of ASM use with stress ulcer prophylaxis selected as the only indication in a patient located outside of the ICU. We confirmed patient location in the 24 hours after the order was placed. Secondary outcomes were rates of overall ASM use, defined via pharmacy charges, and rates of use on discharge.
Statistical Analysis
To assure stable measurement of trends, we studied at least 3 months before and after the intervention on each campus. We used the Fisher exact test to compare the rates of our primary and secondary outcomes before and after the intervention, stratified by campus. For our primary outcomeat least 1 ASM order with stress ulcer prophylaxis selected as the only indication during hospitalizationwe developed a logistic regression model with a generalized estimating equation and exchangeable working correlation structure to control for admission characteristics (Table 1) and repeated admissions. Using a term for the interaction between time and the intervention, this model allowed us to assess changes in level and trend for the odds of a patient receiving at least 1 ASM order with stress ulcer prophylaxis as the only indication before, compared to after the intervention, stratified by campus. We used a 2‐sided type I error of <0.05 to indicate statistical significance.
| Study Phase | Campus | |||
|---|---|---|---|---|
| East | West | |||
| Baseline, n=3,747 | Intervention, n=6,191 | Baseline, n=11,177 | Intervention, n=5,285 | |
| ||||
| Age, y, mean (SD) | 48.1 (18.5) | 47.7 (18.2) | 61.0 (18.0) | 60.3 (18.1) |
| Gender, no. (%) | ||||
| Female | 2744 (73.2%) | 4542 (73.4%) | 5551 (49.7%) | 2653 (50.2%) |
| Male | 1003 (26.8%) | 1649 (26.6%) | 5626 (50.3%) | 2632 (49.8%) |
| Race, no. (%) | ||||
| Asian | 281 (7.5%) | 516 (8.3%) | 302 (2.7%) | 156 (3%) |
| Black | 424 (11.3%) | 667 (10.8%) | 1426 (12.8%) | 685 (13%) |
| Hispanic | 224 (6%) | 380 (6.1%) | 619 (5.5%) | 282 (5.3%) |
| Other | 378 (10.1%) | 738 (11.9%) | 776 (6.9%) | 396 (7.5%) |
| White | 2440 (65.1%) | 3890 (62.8%) | 8054 (72%) | 3766 (71.3%) |
| Charlson score, mean (SD) | 0.8 (1.1) | 0.7 (1.1) | 1.5 (1.4) | 1.4 (1.4) |
| Gastrointestinal bleeding, no. (%)* | 49 (1.3%) | 99 (1.6%) | 385 (3.4%) | 149 (2.8%) |
| Other medication exposures, no. (%) | ||||
| Therapeutic anticoagulant | 218 (5.8%) | 409 (6.6%) | 2242 (20.1%) | 1022 (19.3%) |
| Prophylactic anticoagulant | 1081 (28.8%) | 1682 (27.2%) | 5999 (53.7%) | 2892 (54.7%) |
| NSAID | 1899 (50.7%) | 3141 (50.7%) | 1248 (11.2%) | 575 (10.9%) |
| Antiplatelet | 313 (8.4%) | 585 (9.4%) | 4543 (40.6%) | 2071 (39.2%) |
| Admitting department, no. (%) | ||||
| Surgery | 2507 (66.9%) | 4146 (67%) | 3255 (29.1%) | 1578 (29.9%) |
| Nonsurgery | 1240 (33.1%) | 2045 (33%) | 7922 (70.9%) | 3707 (70.1%) |
| Any ICU Stay, no. (%) | 217 (5.8%) | 383 (6.2%) | 2786 (24.9%) | 1252 (23.7%) |
RESULTS
There were 26,400 adult admissions during the study period, and 22,330 discrete orders for ASM. Overall, 12,056 (46%) admissions had at least 1 charge for ASM. Admission characteristics were similar before and after the intervention on each campus (Table 1).
Table 2 shows the indications chosen each time ASM was ordered, stratified by campus and study phase. Although selection of stress ulcer prophylaxis decreased on both campuses during the intervention phase, selection of continuing preadmission medication increased.
| Study Phase | Campus | |||
|---|---|---|---|---|
| East | West | |||
| Baseline, n=2,062 | Intervention, n=3,243 | Baseline, n=12,038 | Intervention, n=4,987 | |
| ||||
| Indication* | ||||
| Continuing preadmission medication | 910 (44.1%) | 1695 (52.3%) | 5597 (46.5%) | 2802 (56.2%) |
| PUD, gastritis, esophagitis, GERD | 440 (21.3%) | 797 (24.6%) | 1303 (10.8%) | 582 (11.7%) |
| Stress ulcer prophylaxis | 298 (14.4%) | 100 (3.1%) | 2659 (22.1%) | 681 (13.7%) |
| Prophylaxis in patient on medications that increase bleeding risk | 226 (11.0%) | 259 (8.0%) | 965 (8.0%) | 411 (8.2%) |
| Active/recent gastrointestinal bleed | 154 (7.5%) | 321 (9.9%) | 1450 (12.0%) | 515 (10.3) |
| Helicobacter pylori treatment | 6 (0.2%) | 2 (0.1%) | 43 (0.4%) | 21 (0.4%) |
| Other | 111 (5.4%) | 156 (4.8%) | 384 (3.2%) | 186 (3.7%) |
Table 3 shows the unadjusted comparison of outcomes between baseline and intervention phases on each campus. Use of ASM with stress ulcer prophylaxis as the only indication decreased during the intervention phase on both campuses. There was a nonsignificant reduction in overall rates of use on both campuses, and use on discharge was unchanged. Figure 2 demonstrates the unadjusted and modeled monthly rates of admissions with at least 1 ASM order with stress ulcer prophylaxis selected as the only indication, stratified by campus. After adjusting for the admission characteristics in Table 1, during the intervention phase on both campuses there was a significant immediate reduction in the odds of receiving an ASM with stress ulcer prophylaxis selected as the only indication (East Campus odds ratio [OR]: 0.36, 95% confidence interval [CI]: 0.180.71; West Campus OR: 0.41, 95% CI: 0.280.60), and a significant change in trend compared to the baseline phase (East Campus 1.5% daily decrease in odds of receiving ASM solely for stress ulcer prophylaxis, P=0.002; West Campus 0.9% daily decrease in odds of receiving ASM solely for stress ulcer prophylaxis, P=0.02).
| Study Phase | Campus | |||||
|---|---|---|---|---|---|---|
| East | West | |||||
| Baseline, n=3,747 | Intervention, n=6,191 | P Value* | Baseline, n=11,177 | Intervention, n=5,285 | P Value* | |
| ||||||
| Outcome | ||||||
| Any inappropriate acid‐suppressive exposure | 4.0% | 0.6% | <0.001 | 7.7% | 2.2% | <0.001 |
| Any acid‐suppressive exposure | 33.1% | 31.8% | 0.16 | 54.5% | 52.9% | 0.05 |
| Discharged on acid‐suppressive medication | 18.9% | 19.6% | 0.40 | 34.7% | 34.7% | 0.95 |
DISCUSSION
In this single‐center study, we found that a computerized CDS intervention resulted in a significant reduction in use of ASM for the sole purpose of stress ulcer prophylaxis in patients outside the ICU, a nonsignificant reduction in overall use, and no change in use on discharge. We found low rates of use for the isolated purpose of stress ulcer prophylaxis even before the intervention, and continuing preadmission medication was the most commonly selected indication throughout the study.
Although overall rates of ASM use declined after the intervention, the change was not statistically significant, and was not of the same magnitude as the decline in rates of use for the purpose of stress ulcer prophylaxis. This suggests that our intervention, in part, led to substitution of 1 indication for another. The indication that increased the most after rollout on both campuses was continuing preadmission medication. There are at least 2 possibilities for this finding: (1) the intervention prompted physicians to more accurately record the indication, or (2) physicians falsified the indication in order to execute the order. To explore these possibilities, we reviewed the charts of a random sample of 100 admissions during each of the baseline and intervention phases where continuing preadmission medication was selected as an indication for an ASM order. We found that 6/100 orders in the baseline phase and 7/100 orders in the intervention phase incorrectly indicated that the patient was on ASM prior to admission (P=0.77). This suggests that scenario 1 above is the more likely explanation for the increased use of this indication, and that the intervention, in part, simply unmasked the true rate of use at our medical center for the isolated purpose of stress ulcer prophylaxis.
These findings have implications for others attempting to use computerized CDS to better understand physician prescribing. They suggest that information collected through computer‐based interaction with clinicians at the point of care may not always be accurate or complete. As institutions increasingly use similar interventions to drive behavior, information obtained from such interaction should be validated, and when possible, patient outcomes should be measured.
Our findings suggest that rates of ASM use for the purpose of stress ulcer prophylaxis in the hospital may have declined over the last decade. Studies demonstrating that up to 70% of inpatient use of ASM was inappropriate were conducted 5 to 10 years ago.[1, 2, 3, 4, 5] Since then, studies have demonstrated risk of nosocomial infections in patients on ASM.[9, 10, 11] It is possible that the low rate of use for stress ulcer prophylaxis in our study is attributable to awareness of the risks of these medications, and limited our ability to detect differences in overall use. It is also possible, however, that a portion of the admissions with continuation of preadmission medication as the indication were started on these medications during a prior hospitalization. Thus, some portion of preadmission use is likely to represent failed medication reconciliation during a prior discharge. In this context, hospitalization may serve as an opportunity to evaluate the indication for ASM use even when these medications show up as preadmission medications.
There are additional limitations. First, the single‐center nature limits generalizability. Second, the first phase of our study, designed to obtain baseline data on ASM use, may have led to changes in prescribing prior to implementation of our CDS tool. Additionally, we did not validate the accuracy of each of the chosen indications, or the site of initial prescription in the case of preadmission exposure. Last, our study was not powered to investigate changes in rates of nosocomial gastrointestinal bleeding or nosocomial pneumonia owing to the infrequent nature of these complications.
In conclusion, we designed a simple computerized CDS intervention that was associated with a reduction in ASM use for stress ulcer prophylaxis in patients outside the ICU, a nonsignificant reduction in overall use, and no change in use on discharge. The majority of inpatient use represented continuation of preadmission medication, suggesting that interventions to improve the appropriateness of ASM prescribing should span the continuum of care. Future studies should investigate whether it is worthwhile and appropriate to reevaluate continued use of preadmission ASM during an inpatient stay.
Acknowledgements
The authors acknowledge Joshua Guthermann, MBA, and Jane Hui Chen Lim, MBA, for their assistance in the early phases of data analysis, and Long H. Ngo, PhD, for his statistical consultation.
Disclosures: Dr. Herzig was funded by a Young Clinician Research Award from the Center for Integration of Medicine and Innovative Technology, a nonprofit consortium of Boston teaching hospitals and universities, and grant number K23AG042459 from the National Institute on Aging. Dr. Marcantonio was funded by grant number K24AG035075 from the National Institute on Aging. The funding organizations had no involvement in any aspect of the study, including design, conduct, and reporting of the study. Dr. Herzig had full access to all of the data in the study and takes responsibility for the integrity of the data and the accuracy of the data analysis. Drs. Herzig and Marcantonio were responsible for the study concept and design. Drs. Herzig, Feinbloom, Howell, and Ms. Adra and Mr. Afonso were responsible for the acquisition of data. Drs. Herzig, Howell, Marcantonio, and Mr. Guess were responsible for the analysis and interpretation of the data. Dr. Herzig drafted the manuscript. All of the authors participated in the critical revision of the manuscript for important intellectual content. Drs. Herzig and Marcantonio were responsible for study supervision. The authors report no conflicts of interest.
- , . Stress ulcer prophylaxis in hospitalized patients not in intensive care units. Am J Health Syst Pharm. 2007;64(13):1396–1400.
- , . Magnitude and economic impact of inappropriate use of stress ulcer prophylaxis in non‐ICU hospitalized patients. Am J Gastroenterol. 2006;101(10):2200–2205.
- , . Stress‐ulcer prophylaxis for general medical patients: a review of the evidence. J Hosp Med. 2007;2(2):86–92.
- , , , et al. Hospital use of acid‐suppressive medications and its fall‐out on prescribing in general practice: a 1‐month survey. Aliment Pharmacol Ther. 2003;17(12):1503–1506.
- , , , , , . Inadequate use of acid‐suppressive therapy in hospitalized patients and its implications for general practice. Dig Dis Sci. 2005;50(12):2307–2311.
- , . Brief report: reducing inappropriate usage of stress ulcer prophylaxis among internal medicine residents. A practice‐based educational intervention. J Gen Intern Med. 2006;21(5):498–500.
- , , . Inappropriate continuation of stress ulcer prophylactic therapy after discharge. Ann Pharmacother. 2007;41(10):1611–1616.
- , , , et al. Choosing wisely in adult hospital medicine: five opportunities for improved healthcare value. J Hosp Med. 2013;8(9):486–492.
- , , , , . Risk of Clostridium difficile diarrhea among hospital inpatients prescribed proton pump inhibitors: cohort and case‐control studies. CMAJ. 2004;171(1):33–38.
- , , , et al. Iatrogenic gastric acid suppression and the risk of nosocomial Clostridium difficile infection. Arch Intern Med. 2010;170(9):784–790.
- , , , . Acid‐suppressive medication use and the risk for hospital‐acquired pneumonia. JAMA. 2009;301(20):2120–2128.
- Healthcare Cost and Utilization Project. Clinical classifications software (CCS) for ICD‐9‐CM. December 2009. Agency for Healthcare Research and Quality, Rockville, MD. Available at: www.hcup‐us.ahrq.gov/toolssoftware/ccs/ccs.jsp. Accessed June 18, 2014.

Opioids and Opioid‐Related Adverse Events
Recent reports have drawn attention to the high and increasing rates of opioid prescribing and overdose‐related deaths in the United States.[1, 2, 3, 4, 5, 6, 7, 8, 9] These studies have focused on community‐based and emergency department prescribing, leaving prescribing practices in the inpatient setting unexamined. Given that pain is a frequent complaint in hospitalized patients, and that the Joint Commission mandates assessing pain as a vital sign, hospitalization is potentially a time of heightened use of such medications and could significantly contribute to nosocomial complications and subsequent outpatient use.[10] Variation in prescribing practices, unrelated to patient characteristics, could be a marker of inappropriate prescribing practices and poor quality of care.
Using a large, nationally representative cohort of admissions from July 2009 to June 2010, we sought to determine patterns and predictors of opioid utilization in nonsurgical admissions to US medical centers, hospital variation in use, and the association between hospital‐level use and the risk of opioid‐related adverse events. We hypothesized that hospitals with higher rates of opioid use would have an increased risk of an opioid‐related adverse event per patient exposed.
METHODS
Setting and Patients
We conducted a retrospective cohort study using data from 286 US nonfederal acute‐care facilities contributing to the database maintained by Premier (Premier Healthcare Solutions, Inc., Charlotte, NC). This database, created to measure healthcare utilization and quality of care, is drawn from voluntarily participating hospitals and contains data on approximately 1 in every 4 discharges nationwide.[11] Participating hospitals are similar in geographic distribution and metropolitan (urban/rural) status to hospitals nationwide, although large, nonteaching hospitals are slightly overrepresented in Premier. The database contains patient demographics, International Classification of Diseases, Ninth Revision, Clinical Modification (ICD‐9‐CM) codes, hospital demographics, and a date‐stamped log of all charges during the course of each hospitalization, including diagnostic tests, therapeutic treatments, and medications with dose and route of administration. The study was approved by the institutional review board at Beth Israel Deaconess Medical Center and granted a waiver of informed consent.
We studied a cohort of all adult nonsurgical admissions to participating hospitals from July 1, 2009, through June 30, 2010. We chose to study nonsurgical admissions, as patients undergoing surgical procedures have a clear indication for, and almost always receive, opioid pain medications. We defined a nonsurgical admission as an admission in which there were no charges for operating‐room procedures (including labor and delivery) and the attending of record was not a surgeon. We excluded admissions with unknown gender, since this is a key demographic variable, and admissions with a length of stay greater than 365 days, as these admissions are not representative of the typical admission to an acute‐care hospital. At the hospital level, we excluded hospitals contributing <100 admissions owing to resultant lack of precision in corresponding hospital prescribing rates, and hospitals that did not prescribe the full range of opioid medications (these hospitals had charges for codeine only), as these facilities seemed likely to have unusual limitations on prescribing or incomplete data capture.
Opioid Exposure
We defined opioid exposure as presence of 1 charge for an opioid medication during the admission. Opioid medications included morphine, hydrocodone, hydromorphone, oxycodone, fentanyl, meperidine, methadone, codeine, tramadol, buprenorphine, levorphanol, oxymorphone, pentazocine, propoxyphene, tapentadol, butorphanol, dezocine, and nalbuphine. We grouped the last 9 into an other category owing to infrequent use and/or differing characteristics from the main opioid drug types, such as synthetic, semisynthetic, and partial agonist qualities.
Severe Opioid‐Related Adverse Events
We defined severe opioid‐related adverse events as either naloxone exposure or an opioid‐related adverse drug event diagnosis code. Naloxone use in an adult patient exposed to opioids is one of the Institute for Healthcare Improvement's Trigger Tools for identifying adverse drug events[12] and previously has been demonstrated to have high positive predictive value for a confirmed adverse drug event.[13] We defined naloxone exposure as presence of 1 charge for naloxone. We excluded charges on hospital day 1 to focus on nosocomial events. We defined opioid‐related adverse drug events using ICD‐9‐CM diagnosis codes for poisoning by opioids (overdose, wrong substance given, or taken in error; ICD‐9‐CM 965.02, 965.09, E850.1, E850.2) and drugs causing adverse effects in therapeutic use (ICD‐9‐CM E935.1, E935.2), as specified in prior analyses by the Agency for Healthcare Research and Quality (AHRQ).[14, 15] To avoid capturing adverse events associated with outpatient use, we required the ICD‐9‐CM code to be qualified as not present on admission using the present on admission indicator required by the Centers for Medicare and Medicaid Services for all discharge diagnosis codes since 2008.[16]
Covariates of Interest
We were interested in the relationship between both patient and hospital characteristics and opioid exposure. Patient characteristics of interest included (1) demographic variables, such as age, sex, race (self‐reported by patients at the time of admission), marital status, and payer; (2) whether or not the patient spent any time in the intensive care unit (ICU); (3) comorbidities, identified via ICD‐9‐CM secondary diagnosis codes and diagnosis‐related groups using Healthcare Cost and Utilization Project Comorbidity Software, version 3.7, based on the work of Elixhauser et al[17, 18]; (4) primary ICD‐9‐CM discharge diagnosis groupings, selected based on hypothesized associations with receipt of opioids, and based on the Clinical Classifications Software (CCS)a diagnosis and procedure categorization scheme maintained by the AHRQ, and defined in the Appendix[19]; (5) and nonoperating‐room‐based procedures potentially necessitating opioids during the admission, selected from the 50 most common ICD‐9‐CM procedure codes in our cohort and grouped as cardiovascular procedures (catheterization and insertion of vascular stents), gastrointestinal procedures (upper and lower endoscopy), and mechanical ventilation, further defined in the Appendix. Hospital characteristics of interest included number of beds, population served (urban vs rural), teaching status, and US census region (Northeast, Midwest, South, West).
Statistical Analysis
We calculated the percent of admissions with exposure to any opioid and the percent exposed to each opioid, along with the total number of different opioid medications used during each admission. We also calculated the percent of admissions with parenteral administration and the percent of admissions with oral administration, among those exposed to the individual categories, and in aggregate. Because medications after discharge were unavailable in Premier's dataset, we report the percent of patients with a charge for opioids on the day of discharge.
We determined the daily dose of an opioid by taking the sum of the doses for that opioid charged on a given day. The average daily dose of an opioid was determined by taking the sum of the daily doses and dividing by the number of days on which 1 dose was charged. To facilitate comparison, all opioids, with the exception of those for which standard equivalences are unavailable (tramadol, other opioid category, oral fentanyl, epidural route for all), were converted to oral morphine equivalents using a standard equivalence conversion table.[20, 21] We excluded from our dosage calculations those charges for which standard morphine equivalence was unavailable, or for which dosage was missing. We also excluded from our dosage calculations any dose that was >3 standard deviations (SD) above the mean dose for that opioid, as such extreme values seemed physiologically implausible and more likely to be a data entry error that could lead to significant overestimation of the mean for that opioid.
All multivariable models used a generalized estimating equation (GEE) via the genmod procedure in SAS, with a Poisson distribution error term and a log link, controlling for repeated patient admissions with an autoregressive correlation structure.
To identify independent predictors of opioid receipt, we used a GEE model of opioid receipt where all patient and hospital characteristics listed in Table 1 were included as independent variables.
| Patient characteristics, N=1,139,419 | N | % |
|---|---|---|
| ||
| Age group, y | ||
| 1824 | 37,464 | 3 |
| 2534 | 66,541 | 6 |
| 3544 | 102,701 | 9 |
| 4554 | 174,830 | 15 |
| 5564 | 192,570 | 17 |
| 6574 | 196,407 | 17 |
| 75+ | 368,906 | 32 |
| Sex | ||
| Male | 527,062 | 46 |
| Female | 612,357 | 54 |
| Race | ||
| White | 711,993 | 62 |
| Black | 176,993 | 16 |
| Hispanic | 54,406 | 5 |
| Other | 196,027 | 17 |
| Marital status | ||
| Married | 427,648 | 38 |
| Single | 586,343 | 51 |
| Unknown/other | 125,428 | 11 |
| Primary insurance | ||
| Private/commercial | 269,725 | 24 |
| Medicare traditional | 502,301 | 44 |
| Medicare managed care | 126,344 | 11 |
| Medicaid | 125,025 | 11 |
| Self‐pay/other | 116,024 | 10 |
| ICU care | ||
| No | 1,023,027 | 90 |
| Yes | 116,392 | 10 |
| Comorbidities | ||
| AIDS | 5724 | 1 |
| Alcohol abuse | 79,633 | 7 |
| Deficiency anemias | 213,437 | 19 |
| RA/collagen vascular disease | 35,210 | 3 |
| Chronic blood‐loss anemia | 10,860 | 1 |
| CHF | 190,085 | 17 |
| Chronic pulmonary disease | 285,954 | 25 |
| Coagulopathy | 48,513 | 4 |
| Depression | 145,553 | 13 |
| DM without chronic complications | 270,087 | 24 |
| DM with chronic complications | 70,732 | 6 |
| Drug abuse | 66,886 | 6 |
| Hypertension | 696,299 | 61 |
| Hypothyroidism | 146,136 | 13 |
| Liver disease | 38,130 | 3 |
| Lymphoma | 14,032 | 1 |
| Fluid and electrolyte disorders | 326,576 | 29 |
| Metastatic cancer | 33,435 | 3 |
| Other neurological disorders | 124,195 | 11 |
| Obesity | 118,915 | 10 |
| Paralysis | 38,584 | 3 |
| PVD | 77,334 | 7 |
| Psychoses | 101,856 | 9 |
| Pulmonary circulation disease | 52,106 | 5 |
| Renal failure | 175,398 | 15 |
| Solid tumor without metastasis | 29,594 | 3 |
| Peptic ulcer disease excluding bleeding | 536 | 0 |
| Valvular disease | 86,616 | 8 |
| Weight loss | 45,132 | 4 |
| Primary discharge diagnoses | ||
| Cancer | 19,168 | 2 |
| Musculoskeletal injuries | 16,798 | 1 |
| Pain‐related diagnosesb | 101,533 | 9 |
| Alcohol‐related disorders | 16,777 | 1 |
| Substance‐related disorders | 13,697 | 1 |
| Psychiatric disorders | 41,153 | 4 |
| Mood disorders | 28,761 | 3 |
| Schizophrenia and other psychotic disorders | 12,392 | 1 |
| Procedures | ||
| Cardiovascular procedures | 59,901 | 5 |
| GI procedures | 31,224 | 3 |
| Mechanical ventilation | 7853 | 1 |
| Hospital characteristics, N=286 | ||
| Number of beds | ||
| <200 | 103 | 36 |
| 201300 | 63 | 22 |
| 301500 | 81 | 28 |
| >500 | 39 | 14 |
| Population served | ||
| Urban | 225 | 79 |
| Rural | 61 | 21 |
| Teaching status | ||
| Nonteaching | 207 | 72 |
| Teaching | 79 | 28 |
| US Census region | ||
| Northeast | 47 | 16 |
| Midwest | 63 | 22 |
| South | 115 | 40 |
| West | 61 | 21 |
To assess hospital variation in opioid prescribing after adjusting for patient characteristics, we used a GEE model of opioid receipt, controlling for all patient characteristics listed in Table 1. We then took the mean of the predicted probabilities of opioid receipt for the patients within each hospital in our cohort to derive the hospital prescribing rate adjusted for patient characteristics. We report the mean, SD, and range of the prescribing rates for the hospitals in our cohort before and after adjustment for patient characteristics.
To assess whether patients admitted to hospitals with higher rates of opioid prescribing have higher relative risk of severe opioid‐related adverse events, we stratified hospitals into opioid‐prescribing rate quartiles and compared the rates of opioid‐related adverse eventsboth overall and among opioid exposedbetween quartiles. To adjust for patient characteristics, we used a GEE model in which severe opioid‐related adverse event (yes/no) was the dependent variable and hospital‐prescribing rate quartile and all patient characteristics in Table 1 were independent variables. We also performed a sensitivity analysis in which we assessed the association between hospital prescribing‐rate quartile and the individual components of our composite outcome. Our results were qualitatively unchanged using this approach, and only the results of our main analysis are presented.
All analyses were carried out using SAS software, version 9.2 (SAS Institute Inc., Cary, NC).
RESULTS
Patient Admission Characteristics
There were 3,190,934 adult admissions to 300 acute‐care hospitals during our study period. After excluding admissions with a length of stay >365 days (n=25), missing patient sex (n=17), and charges for operating‐room procedures or a surgical attending of record (n=2,018,553), 1,172,339 admissions were available for analysis. There were 12 hospitals with incomplete opioid‐prescribing data (n=32,794) and 2 hospitals that contributed <100 admissions each (n=126), leaving 1,139,419 admissions in 286 hospitals in our analytic cohort. The median age of the cohort was 64 years (interquartile range, 4979 years), and 527,062 (46%) were men. Table 1 shows the characteristics of the admissions in the cohort.
Rate, Route, and Dose of Opioid Exposures
Overall, there were 576,373 (51%) admissions with charges for opioid medications. Among those exposed, 244,760 (43%) had charges for multiple opioids during the admission; 172,090 (30%) had charges for 2 different opioids; and 72,670 (13%) had charges for 3 different opioids. Table 2 shows the percent exposed to each opioid, the percent of exposed with parenteral and oral routes of administration, and the mean daily dose received in oral morphine equivalents.
| Exposed | Parenteral Administration | Oral Administration | Dose Received, in Oral Morphine Equivalents | |||||
|---|---|---|---|---|---|---|---|---|
| N | %a | N | %b | N | %b | Mean | SDc | |
| ||||||||
| All opioids | 576,373 | 51 | 378,771 | 66 | 371,796 | 65 | 68 | 185 |
| Morphine | 224,811 | 20 | 209,040 | 93 | 21,645 | 10 | 40 | 121 |
| Hydrocodone | 162,558 | 14 | 0 | 0 | 160,941 | 99 | 14 | 12 |
| Hydromorphone | 146,236 | 13 | 137,936 | 94 | 16,052 | 11 | 113 | 274 |
| Oxycodone | 126,733 | 11 | 0 | 0 | 125,033 | 99 | 26 | 37 |
| Fentanyl | 105,052 | 9 | 103,113 | 98 | 641 | 1 | 64 | 75 |
| Tramadol | 35,570 | 3 | 0 | 0 | 35,570 | 100 | ||
| Meperidine | 24,850 | 2 | 24,398 | 98 | 515 | 2 | 36 | 34 |
| Methadone | 15,302 | 1 | 370 | 2 | 14,781 | 97 | 337 | 384 |
| Codeine | 22,818 | 2 | 178 | 1 | 22,183 | 97 | 9 | 15 |
| Other | 45,469 | 4 | 5821 | 13 | 39,618 | 87 | ||
Among the medications/routes for which conversion to morphine equivalents was possible, dosage was missing in 39,728 out of 2,294,673 opioid charges (2%). The average daily dose received in oral morphine equivalents was 68 mg. A total dose of 50 mg per day was received in 39% of exposed, and a total dose of 100 mg per day was received in 23% of exposed. Among those exposed, 52% (26% of overall admissions) had charges for opioids on the day of discharge.
Rates of Opioid Use by Patient and Hospital Characteristics
Table 3 reports the association between admission characteristics and opioid use. Use was highest in patients between the ages of 25 and 54 years. Although use declined with age, 44% of admissions age 65 years had charges for opioid medication. After adjustment for patient demographics, comorbidities, and hospital characteristics, opioid use was more common in females than males, those age 2554 years compared with those older and younger, those of Caucasian race compared with non‐Caucasian race, and those with Medicare or Medicaid primary insurance. Among the primary discharge diagnoses, patients with musculoskeletal injuries, various specific and nonspecific pain‐related diagnoses, and cancer were significantly more likely to receive opioids than patients without these diagnoses, whereas patients with alcohol‐related disorders and psychiatric disorders were significantly less likely to receive opioids than patients without these diagnoses. Patients admitted to hospitals in the Midwest, South, and West were significantly more likely to receive opioid medications than patients in the Northeast.
| Exposed, N=576,373 | Unexposed, N=563,046 | % Exposed | Adjusted RRa | 95% CI | |
|---|---|---|---|---|---|
| |||||
| Patient characteristics | |||||
| Age group, y | |||||
| 1824 | 17,360 | 20,104 | 46 | (ref) | |
| 2534 | 37,793 | 28,748 | 57 | 1.17 | 1.16‐1.19 |
| 3544 | 60,712 | 41,989 | 59 | 1.16 | 1.15‐1.17 |
| 4554 | 103,798 | 71,032 | 59 | 1.11 | 1.09‐1.12 |
| 5564 | 108,256 | 84,314 | 56 | 1.00 | 0.98‐1.01 |
| 6574 | 98,110 | 98,297 | 50 | 0.84 | 0.83‐0.85 |
| 75+ | 150,344 | 218,562 | 41 | 0.71 | 0.70‐0.72 |
| Sex | |||||
| Male | 255,315 | 271,747 | 48 | (ref) | |
| Female | 321,058 | 291,299 | 52 | 1.11 | 1.10‐1.11 |
| Race | |||||
| White | 365,107 | 346,886 | 51 | (ref) | |
| Black | 92,013 | 84,980 | 52 | 0.93 | 0.92‐0.93 |
| Hispanic | 27,592 | 26,814 | 51 | 0.94 | 0.93‐0.94 |
| Other | 91,661 | 104,366 | 47 | 0.93 | 0.92‐0.93 |
| Marital status | |||||
| Married | 222,912 | 204,736 | 52 | (ref) | |
| Single | 297,742 | 288,601 | 51 | 1.00 | 0.99‐1.01 |
| Unknown/other | 55,719 | 69,709 | 44 | 0.94 | 0.93‐0.95 |
| Primary insurance | |||||
| Private/commercial | 143,954 | 125,771 | 53 | (ref) | |
| Medicare traditional | 236,114 | 266,187 | 47 | 1.10 | 1.09‐1.10 |
| Medicare managed care | 59,104 | 67,240 | 47 | 1.11 | 1.11‐1.12 |
| Medicaid | 73,583 | 51,442 | 59 | 1.13 | 1.12‐1.13 |
| Self‐pay/other | 63,618 | 52,406 | 55 | 1.03 | 1.02‐1.04 |
| ICU care | |||||
| No | 510,654 | 512,373 | 50 | (ref) | |
| Yes | 65,719 | 50,673 | 56 | 1.02 | 1.01‐1.03 |
| Comorbiditiesb | |||||
| AIDS | 3655 | 2069 | 64 | 1.09 | 1.07‐1.12 |
| Alcohol abuse | 35,112 | 44,521 | 44 | 0.92 | 0.91‐0.93 |
| Deficiency anemias | 115,842 | 97,595 | 54 | 1.08 | 1.08‐1.09 |
| RA/collagen vascular disease | 22,519 | 12,691 | 64 | 1.22 | 1.21‐1.23 |
| Chronic blood‐loss anemia | 6444 | 4416 | 59 | 1.04 | 1.02‐1.05 |
| CHF | 88,895 | 101,190 | 47 | 0.99 | 0.98‐0.99 |
| Chronic pulmonary disease | 153,667 | 132,287 | 54 | 1.08 | 1.08‐1.08 |
| Coagulopathy | 25,802 | 22,711 | 53 | 1.03 | 1.02‐1.04 |
| Depression | 83,051 | 62,502 | 57 | 1.08 | 1.08‐1.09 |
| DM without chronic complications | 136,184 | 133,903 | 50 | 0.99 | 0.99‐0.99 |
| DM with chronic complications | 38,696 | 32,036 | 55 | 1.04 | 1.03‐1.05 |
| Drug abuse | 37,202 | 29,684 | 56 | 1.14 | 1.13‐1.15 |
| Hypertension | 344,718 | 351,581 | 50 | 0.98 | 0.97‐0.98 |
| Hypothyroidism | 70,786 | 75,350 | 48 | 0.99 | 0.99‐0.99 |
| Liver disease | 24,067 | 14,063 | 63 | 1.15 | 1.14‐1.16 |
| Lymphoma | 7727 | 6305 | 55 | 1.16 | 1.14‐1.17 |
| Fluid and electrolyte disorders | 168,814 | 157,762 | 52 | 1.04 | 1.03‐1.04 |
| Metastatic cancer | 23,920 | 9515 | 72 | 1.40 | 1.39‐1.42 |
| Other neurological disorders | 51,091 | 73,104 | 41 | 0.87 | 0.86‐0.87 |
| Obesity | 69,584 | 49,331 | 59 | 1.05 | 1.04‐1.05 |
| Paralysis | 17,497 | 21,087 | 45 | 0.97 | 0.96‐0.98 |
| PVD | 42,176 | 35,158 | 55 | 1.11 | 1.11‐1.12 |
| Psychoses | 38,638 | 63,218 | 38 | 0.91 | 0.90‐0.92 |
| Pulmonary circulation disease | 26,656 | 25,450 | 51 | 1.05 | 1.04‐1.06 |
| Renal failure | 86,565 | 88,833 | 49 | 1.01 | 1.01‐1.02 |
| Solid tumor without metastasis | 16,258 | 13,336 | 55 | 1.14 | 1.13‐1.15 |
| Peptic ulcer disease excluding bleeding | 376 | 160 | 70 | 1.12 | 1.07‐1.18 |
| Valvular disease | 38,396 | 48,220 | 44 | 0.93 | 0.92‐0.94 |
| Weight loss | 25,724 | 19,408 | 57 | 1.09 | 1.08‐1.10 |
| Primary discharge diagnosesb | |||||
| Cancer | 13,986 | 5182 | 73 | 1.20 | 1.19‐1.21 |
| Musculoskeletal injuries | 14,638 | 2160 | 87 | 2.02 | 2.002.04 |
| Pain‐related diagnosesc | 64,656 | 36,877 | 64 | 1.20 | 1.20‐1.21 |
| Alcohol‐related disorders | 3425 | 13,352 | 20 | 0.46 | 0.44‐0.47 |
| Substance‐related disorders | 8680 | 5017 | 63 | 1.03 | 1.01‐1.04 |
| Psychiatric disorders | 7253 | 33,900 | 18 | 0.37 | 0.36‐0.38 |
| Mood disorders | 5943 | 22,818 | 21 | ||
| Schizophrenia and other psychotic disorders | 1310 | 11,082 | 11 | ||
| Proceduresb | |||||
| Cardiovascular procedures | 50,997 | 8904 | 85 | 1.80 | 1.79‐1.81 |
| GI procedures | 27,206 | 4018 | 87 | 1.70 | 1.69‐1.71 |
| Mechanical ventilation | 5341 | 2512 | 68 | 1.37 | 1.34‐1.39 |
| Hospital characteristics | |||||
| Number of beds | |||||
| <200 | 100,900 | 88,439 | 53 | (ref) | |
| 201300 | 104,213 | 99,995 | 51 | 0.95 | 0.95‐0.96 |
| 301500 | 215,340 | 209,104 | 51 | 0.94 | 0.94‐0.95 |
| >500 | 155,920 | 165,508 | 49 | 0.96 | 0.95‐0.96 |
| Population served | |||||
| Urban | 511,727 | 506,803 | 50 | (ref) | |
| Rural | 64,646 | 56,243 | 53 | 0.98 | 0.97‐0.99 |
| Teaching status | |||||
| Nonteaching | 366,623 | 343,581 | 52 | (ref) | |
| Teaching | 209,750 | 219,465 | 49 | 1.00 | 0.99‐1.01 |
| US Census region | |||||
| Northeast | 99,377 | 149,446 | 40 | (ref) | |
| Midwest | 123,194 | 120,322 | 51 | 1.26 | (1.25‐1.27) |
| South | 251,624 | 213,029 | 54 | 1.33 | (1.33‐1.34) |
| West | 102,178 | 80,249 | 56 | 1.37 | (1.36‐1.38) |
Variation in Opioid Prescribing
Figure 1 shows the histograms of hospital opioid prescribing rate for the 286 hospitals in our cohort (A) before and (B) after adjustment for patient characteristics. The observed rates ranged from 5% in the lowest‐prescribing hospital to 72% in the highest‐prescribing hospital, with a mean (SD) of 51% (10%). After adjusting for patient characteristics, the adjusted opioid‐prescribing rates ranged from 33% to 64%, with a mean (SD) of 50% (4%).

Severe Opioid‐Related Adverse Events
Among admissions with opioid exposure (n=576,373), naloxone use occurred in 2345 (0.41%) and opioid‐related adverse drug events in 1174 (0.20%), for a total of 3441 (0.60%) severe opioid‐related adverse events (some patients experienced both). Table 4 reports the opioid exposure and severe opioid‐related adverse‐event rates within hospital opioid‐prescribing rate quartiles, along with the adjusted association between the hospital opioid‐prescribing rate quartile and severe opioid‐related adverse events. After adjusting for patient characteristics, the relative risk of a severe opioid‐related adverse event was significantly greater in hospitals with higher opioid‐prescribing rates, both overall and among opioid exposed.
| Quartile | No. of Patients | Opioid Exposed, n (%) | Opioid‐Related Adverse Events, n (%) | Adjusted RR in All Patients, RR (95% CI), N=1,139,419a | Adjusted RR in Opioid Exposed, RR (95% CI), N=576,373a |
|---|---|---|---|---|---|
| |||||
| 1 | 349,747 | 132,824 (38) | 719 (0.21) | (ref) | (ref) |
| 2 | 266,652 | 134,590 (50) | 729 (0.27) | 1.31 (1.17‐1.45) | 1.07 (0.96‐1.18) |
| 3 | 251,042 | 139,770 (56) | 922 (0.37) | 1.72 (1.56‐1.90) | 1.31 (1.19‐1.44) |
| 4 | 271,978 | 169,189 (62) | 1071 (0.39) | 1.73 (1.57‐1.90) | 1.23 (1.12‐1.35) |
DISCUSSION
In this analysis of a large cohort of hospitalized nonsurgical patients, we found that more than half of all patients received opioids, with 43% of those exposed receiving multiple opioids during their admission and 52% receiving opioids on the day of discharge. Considerable hospital variation in opioid use was evident, and this was not fully explained by patient characteristics. Severe opioid‐related adverse events occurred more frequently at hospitals with higher opioid‐prescribing rates, and the relative risk of a severe adverse event per patient prescribed opioids was also higher in these hospitals. To our knowledge, this is the first study to describe the scope of opioid utilization and the relationship between utilization and severe opioid‐related adverse events in a sample of nonsurgical patients in US acute‐care facilities.
Our use of naloxone charges and opioid‐specific ICD‐9‐CM coding to define an opioid‐related adverse event was intended to capture only the most severe opioid‐related adverse events. We chose to focus on these events in our analysis to maximize the specificity of our outcome definition and thereby minimize confounding in our observed associations. The rate of less‐severe opioid‐related adverse events, such as nausea, constipation, and pruritis, is likely much higher and not captured in our outcome definition. Prior analyses have found variable rates of opioid‐related adverse events of approximately 1.8% to 13.6% of exposed patients.[22, 23, 24] However, these analyses focused on surgical patients and included less‐severe events. To our knowledge, ours is the first analysis of severe opioid‐related adverse events in nonsurgical patients.
Our finding that severe opioid‐related adverse events increase as opioid prescribing increases is consistent with that which has been demonstrated in the community setting, where rates of opioid‐related adverse events and mortality are higher in communities with higher levels of opioid prescribing.[2, 8, 25] This finding is expected, as greater use of a class of medications with known side effects would be expected to result in a higher overall rate of adverse events. More concerning, however, is the fact that this relationship persists when focusing exclusively on opioid‐exposed patients. Among similar patients receiving opioids at different hospitals, those hospitalized in facilities with higher opioid‐prescribing rates have higher rates of severe opioid‐related adverse events. This suggests that hospitals that use opioids more frequently do not do so more safely. Rather, the increased overall prescribing rates are associated with heightened risk for a serious adverse event per patient exposed and may reflect unsafe prescribing practices.
Furthermore, our results demonstrate both regional and hospital variation in use of opioids not fully explained by patient characteristics, similar to that which has been demonstrated for other drugs and heathcare services.[26, 27, 28, 29, 30] The implications of these findings are limited by our lack of information on pain severity or prior outpatient treatment, and our resultant inability to evaluate the appropriateness of opioid use in this analysis. Additionally, although we controlled for a large number of patient and hospital characteristics, there could be other significant predictors of use not accounted for in our analysis. However, it seems unlikely that differential pain severity or patient characteristics between patients in different regions of the country could fully explain a 37% relative difference in prescribing between the lowest‐ and highest‐prescribing regions, after accounting for the 44 patient‐level variables in our models. Whereas variation in use unrelated to patient factors could represent inappropriate prescribing practices, it could also be a marker of uncertainty regarding what constitutes appropriate prescribing and high‐quality care in this realm. Although guidelines advocate for standard pain assessments and a step‐up approach to treatment,[31, 32, 33] the lack of objective measures of pain severity and lack of evidence‐based recommendations on the use of opioids for noncancer pain[34] will almost certainly lead to persistent variation in opioid prescribing despite guideline‐driven care.
Nonetheless, our findings suggest that opportunities exist to make opioid prescribing safer in hospitalized patients. Studies aimed at elucidating the source of regional and hospital variation are necessary. Additionally, efforts should focus on identifying patient and prescribing characteristics associated with heightened risk of opioid‐related adverse events. Prior studies have demonstrated that the risks of opioid medications increase with increasing age of the patient.[35, 36] Although opioid use in our cohort declined with age, 44% of admissions age 65 years had charges for opioid medications. Studies in outpatients have also demonstrated that the risks of opioid overdose and overdose‐related death increase with dose.[5, 7] One study demonstrated a 3.7‐fold increased risk of overdose at doses of 5099 mg/day in oral morphine equivalents, and an 8.9‐fold increased risk at doses of 100 mg/day, compared with doses of 20 mg/day.[7] The prevalence of high dose exposure observed in our cohort, coupled with the older age of hospitalized patients, suggests potential targets for promoting safer use in hospitalized patients through interventions such as computerized decision support and enhanced monitoring in those at highest risk.
Because medications after discharge were unavailable in our dataset, the percentage of patients given a prescription for opioid medication on discharge is unknown. However, given that opioids are often tapered rather than abruptly discontinued, our finding that 26% of hospitalized nonsurgical patients received opioids on the day of discharge suggests that a substantial proportion of patients may be discharged with a prescription for opioid medication. Given the possibility of coexistent outpatient opioid prescriptions, these findings draw attention to the importance of assuring development and streamlined accessibility of data from state prescription drug monitoring programs and suggest that increased attention should be paid to the role that inpatient opioid prescribing plays in the increased rates of chronic opioid use and overdose‐related deaths in the United States.
There are additional limitations to our analysis. First, although the database used for this analysis captures a large proportion of admissions to US acute‐care facilities and is similar in composition, it is possible that participating medical centers differ from nonparticipating medical centers in ways that could be associated with opioid prescribing. Additionally, although Premier performs extensive validation and correction processes to assure the quality of their data, there is still likely to be a small amount of random error in the database, which could particularly impact dosage calculations. The lack of preadmission medications in our database precluded identification of the proportion of patients newly started on opioid medications. Lastly, it is possible that the hospital prescribing‐rate quartile is associated with patient characteristics unaccounted for in our analysis, and, therefore, the possibility of residual confounding still exists.
In conclusion, the majority of hospitalized nonsurgical patients are exposed to opioid medications during the course of their hospitalizations, often at high doses. More than half of those exposed are still receiving these medications on the day of discharge. We found hospital and regional variation in opioid use that was not fully explained by patient characteristics, and higher levels of hospital use were associated with higher risk of severe opioid‐related adverse events in opioid‐exposed patients. Further research is necessary to investigate the appropriateness of opioid use in this patient population, the sources of variation in use, and the predictors of opioid‐related adverse events in hospitalized patients to allow development of interventions to make hospital use safer.
Disclosures
Disclosures: Dr. Herzig had full access to all of the data in the study and takes responsibility for the integrity of the data and the accuracy of the data analysis. Dr. Herzig was funded by grant no. K23AG042459 from the National Institute on Aging. Dr. Marcantonio was funded by grant nos. P01AG031720, R01AG030618, R03AG028189, and K24AG035075 from the National Institute on Aging. The funding organization had no involvement in any aspect of the study, including design, conduct, and reporting of the study. None of the authors have any conflicts of interest to disclose.
- . A flood of opioids, a rising tide of deaths. N Engl J Med. 2010;363(21):1981–1985.
- , , . Increasing deaths from opioid analgesics in the United States. Pharmacoepidemiol Drug Saf. 2006;15(9):618–627.
- , , , . Trends in opioid prescribing by race/ethnicity for patients seeking care in US emergency departments. JAMA. 2008;299(1):70–78.
- , , , . Trends in medical use and abuse of opioid analgesics. JAMA. 2000;283(13):1710–1714.
- , , , et al. Association between opioid prescribing patterns and opioid overdose‐related deaths. JAMA. 2011;305(13):1315–1321.
- , , , et al. Prescription opioid mortality trends in New York City, 1990–2006: examining the emergence of an epidemic. Drug Alcohol Depend. 2013;132(1‐2):53–62.
- , , , et al. Opioid prescriptions for chronic pain and overdose: a cohort study. Ann Intern Med. 2010;152(2):85–92.
- , , , et al. Relationship of opioid prescription sales and overdoses, North Carolina. Drug Alcohol Depend. 2013;132(1‐2):81–86.
- Deaths from prescription opioids soar in New York. BMJ. 2013;346:f921.
- , , . Mortality in elderly dementia patients treated with risperidone. J Clin Psychopharmacol. 2006;26(6):566–570.
- , , , et al. Medication reconciliation: a practical tool to reduce the risk of medication errors. J Crit Care. 2003;18(4):201–205.
- , , . Adverse drug event trigger tool: a practical methodology for measuring medication related harm. Qual Saf Health Care. 2003;12(3):194–200.
- , , , , . Improvement in the detection of adverse drug events by the use of electronic health and prescription records: an evaluation of two trigger tools. Eur J Clin Pharmacol. 2013;69(2):255–259.
- , . Adverse Drug Events in U.S. Hospitals, 2004. Rockville, MD: Agency for Healthcare Research and Quality; April 2007. Statistical Brief 29.
- , , . Medication‐Related Adverse Outcomes in U.S. Hospitals and Emergency Departments, 2008. Rockville, MD: Agency for Healthcare Research and Quality; April 2011. Statistical Brief 109.
- US Centers for Medicare and Medicaid Services. Hospital‐Acquired Conditions (Present on Admission Indicator). Available at: http://www.cms.hhs.gov/HospitalAcqCond/. Accessed August 16, 2011. Updated September 20, 2012.
- , , . Fracture risk associated with the use of morphine and opiates. J Intern Med. 2006;260(1):76–87.
- , , , . Comorbidity measures for use with administrative data. Med Care. 1998;36(1):8–27.
- Clinical Classifications Software, Healthcare Cost and Utilization Project (HCUP). Rockville, MD; Agency for Healthcare Research and Quality; December 2009.
- , , , , . Clinical application of opioid equianalgesic data. Clin J Pain. 2003;19(5)286–297.
- , , , , , . Choosing the unit of measurement counts: the use of oral morphine equivalents in studies of opioid consumption is a useful addition to defined daily doses. Palliat Med. 2011;25(7):725–732.
- , , , . Cost and quality implications of opioid‐based postsurgical pain control using administrative claims data from a large health system: opioid‐related adverse events and their impact on clinical and economic outcomes. Pharmacotherapy. 2013;33(4):383–391.
- , , , et al. Opioid‐related adverse drug events in surgical hospitalizations: impact on costs and length of stay. Ann Pharmacother. 2007;41(3):400–406.
- , , , et al. Cost of opioid‐related adverse drug events in surgical patients. J Pain Symptom Manage. 2003;25(3):276–283.
- , . Opioid analgesics and rates of fatal drug poisoning in the United States. Am J Prev Med. 2006;31(6):506–511.
- , , , et al. Geographic variation in the treatment of acute myocardial infarction: the Cooperative Cardiovascular Project. JAMA. 1999;281(7):627–633.
- , , , et al; GUSTO‐1 Investigators. Regional variation across the United States in the management of acute myocardial infarction. Global Utilization of Streptokinase and Tissue Plasminogen Activator for Occluded Coronary Arteries. N Engl J Med. 1995;333(9):565–572.
- , , . Predictors of broad‐spectrum antibiotic prescribing for acute respiratory tract infections in adult primary care. JAMA. 2003;289(6):719–725.
- , , . Geographic variation in Medicare drug spending. N Engl J Med. 2010;363(5):405–409.
- , , . Geographic variation in outpatient antibiotic prescribing among older adults. Arch Intern Med. 2012;172(19):1465–1471.
- , , , et al. Clinical policy: critical issues in the prescribing of opioids for adult patients in the emergency department. Ann Emerg Med. 2012;60(4):499–525.
- The Joint Commission. Facts About Pain Management. Available at: http://www.jointcommission.org/pain_management/. Accessed July 23, 2012.
- The Joint Commission. Sentinel Event Alert: Safe Use of Opioids in Hospitals. Published August 8, 2012. Available at: http://www.jointcommission.org/assets/1/18/SEA_49_opioids_8_2_12_final.pdf. Accessed March 4, 2013.
- , , , , . Research gaps on use of opioids for chronic noncancer pain: findings from a review of the evidence for an American Pain Society and American Academy of Pain Medicine clinical practice guideline. J Pain. 2009;10(2):147–159.
- , , , , , . Side effects of opioids during short‐term administration: effect of age, gender, and race. Clin Pharmacol Ther. 2003;74(2):102–112.
- , , , . Postoperative day one: a high‐risk period for respiratory events. Am J Surg. 2005;190(5):752–756.
Recent reports have drawn attention to the high and increasing rates of opioid prescribing and overdose‐related deaths in the United States.[1, 2, 3, 4, 5, 6, 7, 8, 9] These studies have focused on community‐based and emergency department prescribing, leaving prescribing practices in the inpatient setting unexamined. Given that pain is a frequent complaint in hospitalized patients, and that the Joint Commission mandates assessing pain as a vital sign, hospitalization is potentially a time of heightened use of such medications and could significantly contribute to nosocomial complications and subsequent outpatient use.[10] Variation in prescribing practices, unrelated to patient characteristics, could be a marker of inappropriate prescribing practices and poor quality of care.
Using a large, nationally representative cohort of admissions from July 2009 to June 2010, we sought to determine patterns and predictors of opioid utilization in nonsurgical admissions to US medical centers, hospital variation in use, and the association between hospital‐level use and the risk of opioid‐related adverse events. We hypothesized that hospitals with higher rates of opioid use would have an increased risk of an opioid‐related adverse event per patient exposed.
METHODS
Setting and Patients
We conducted a retrospective cohort study using data from 286 US nonfederal acute‐care facilities contributing to the database maintained by Premier (Premier Healthcare Solutions, Inc., Charlotte, NC). This database, created to measure healthcare utilization and quality of care, is drawn from voluntarily participating hospitals and contains data on approximately 1 in every 4 discharges nationwide.[11] Participating hospitals are similar in geographic distribution and metropolitan (urban/rural) status to hospitals nationwide, although large, nonteaching hospitals are slightly overrepresented in Premier. The database contains patient demographics, International Classification of Diseases, Ninth Revision, Clinical Modification (ICD‐9‐CM) codes, hospital demographics, and a date‐stamped log of all charges during the course of each hospitalization, including diagnostic tests, therapeutic treatments, and medications with dose and route of administration. The study was approved by the institutional review board at Beth Israel Deaconess Medical Center and granted a waiver of informed consent.
We studied a cohort of all adult nonsurgical admissions to participating hospitals from July 1, 2009, through June 30, 2010. We chose to study nonsurgical admissions, as patients undergoing surgical procedures have a clear indication for, and almost always receive, opioid pain medications. We defined a nonsurgical admission as an admission in which there were no charges for operating‐room procedures (including labor and delivery) and the attending of record was not a surgeon. We excluded admissions with unknown gender, since this is a key demographic variable, and admissions with a length of stay greater than 365 days, as these admissions are not representative of the typical admission to an acute‐care hospital. At the hospital level, we excluded hospitals contributing <100 admissions owing to resultant lack of precision in corresponding hospital prescribing rates, and hospitals that did not prescribe the full range of opioid medications (these hospitals had charges for codeine only), as these facilities seemed likely to have unusual limitations on prescribing or incomplete data capture.
Opioid Exposure
We defined opioid exposure as presence of 1 charge for an opioid medication during the admission. Opioid medications included morphine, hydrocodone, hydromorphone, oxycodone, fentanyl, meperidine, methadone, codeine, tramadol, buprenorphine, levorphanol, oxymorphone, pentazocine, propoxyphene, tapentadol, butorphanol, dezocine, and nalbuphine. We grouped the last 9 into an other category owing to infrequent use and/or differing characteristics from the main opioid drug types, such as synthetic, semisynthetic, and partial agonist qualities.
Severe Opioid‐Related Adverse Events
We defined severe opioid‐related adverse events as either naloxone exposure or an opioid‐related adverse drug event diagnosis code. Naloxone use in an adult patient exposed to opioids is one of the Institute for Healthcare Improvement's Trigger Tools for identifying adverse drug events[12] and previously has been demonstrated to have high positive predictive value for a confirmed adverse drug event.[13] We defined naloxone exposure as presence of 1 charge for naloxone. We excluded charges on hospital day 1 to focus on nosocomial events. We defined opioid‐related adverse drug events using ICD‐9‐CM diagnosis codes for poisoning by opioids (overdose, wrong substance given, or taken in error; ICD‐9‐CM 965.02, 965.09, E850.1, E850.2) and drugs causing adverse effects in therapeutic use (ICD‐9‐CM E935.1, E935.2), as specified in prior analyses by the Agency for Healthcare Research and Quality (AHRQ).[14, 15] To avoid capturing adverse events associated with outpatient use, we required the ICD‐9‐CM code to be qualified as not present on admission using the present on admission indicator required by the Centers for Medicare and Medicaid Services for all discharge diagnosis codes since 2008.[16]
Covariates of Interest
We were interested in the relationship between both patient and hospital characteristics and opioid exposure. Patient characteristics of interest included (1) demographic variables, such as age, sex, race (self‐reported by patients at the time of admission), marital status, and payer; (2) whether or not the patient spent any time in the intensive care unit (ICU); (3) comorbidities, identified via ICD‐9‐CM secondary diagnosis codes and diagnosis‐related groups using Healthcare Cost and Utilization Project Comorbidity Software, version 3.7, based on the work of Elixhauser et al[17, 18]; (4) primary ICD‐9‐CM discharge diagnosis groupings, selected based on hypothesized associations with receipt of opioids, and based on the Clinical Classifications Software (CCS)a diagnosis and procedure categorization scheme maintained by the AHRQ, and defined in the Appendix[19]; (5) and nonoperating‐room‐based procedures potentially necessitating opioids during the admission, selected from the 50 most common ICD‐9‐CM procedure codes in our cohort and grouped as cardiovascular procedures (catheterization and insertion of vascular stents), gastrointestinal procedures (upper and lower endoscopy), and mechanical ventilation, further defined in the Appendix. Hospital characteristics of interest included number of beds, population served (urban vs rural), teaching status, and US census region (Northeast, Midwest, South, West).
Statistical Analysis
We calculated the percent of admissions with exposure to any opioid and the percent exposed to each opioid, along with the total number of different opioid medications used during each admission. We also calculated the percent of admissions with parenteral administration and the percent of admissions with oral administration, among those exposed to the individual categories, and in aggregate. Because medications after discharge were unavailable in Premier's dataset, we report the percent of patients with a charge for opioids on the day of discharge.
We determined the daily dose of an opioid by taking the sum of the doses for that opioid charged on a given day. The average daily dose of an opioid was determined by taking the sum of the daily doses and dividing by the number of days on which 1 dose was charged. To facilitate comparison, all opioids, with the exception of those for which standard equivalences are unavailable (tramadol, other opioid category, oral fentanyl, epidural route for all), were converted to oral morphine equivalents using a standard equivalence conversion table.[20, 21] We excluded from our dosage calculations those charges for which standard morphine equivalence was unavailable, or for which dosage was missing. We also excluded from our dosage calculations any dose that was >3 standard deviations (SD) above the mean dose for that opioid, as such extreme values seemed physiologically implausible and more likely to be a data entry error that could lead to significant overestimation of the mean for that opioid.
All multivariable models used a generalized estimating equation (GEE) via the genmod procedure in SAS, with a Poisson distribution error term and a log link, controlling for repeated patient admissions with an autoregressive correlation structure.
To identify independent predictors of opioid receipt, we used a GEE model of opioid receipt where all patient and hospital characteristics listed in Table 1 were included as independent variables.
| Patient characteristics, N=1,139,419 | N | % |
|---|---|---|
| ||
| Age group, y | ||
| 1824 | 37,464 | 3 |
| 2534 | 66,541 | 6 |
| 3544 | 102,701 | 9 |
| 4554 | 174,830 | 15 |
| 5564 | 192,570 | 17 |
| 6574 | 196,407 | 17 |
| 75+ | 368,906 | 32 |
| Sex | ||
| Male | 527,062 | 46 |
| Female | 612,357 | 54 |
| Race | ||
| White | 711,993 | 62 |
| Black | 176,993 | 16 |
| Hispanic | 54,406 | 5 |
| Other | 196,027 | 17 |
| Marital status | ||
| Married | 427,648 | 38 |
| Single | 586,343 | 51 |
| Unknown/other | 125,428 | 11 |
| Primary insurance | ||
| Private/commercial | 269,725 | 24 |
| Medicare traditional | 502,301 | 44 |
| Medicare managed care | 126,344 | 11 |
| Medicaid | 125,025 | 11 |
| Self‐pay/other | 116,024 | 10 |
| ICU care | ||
| No | 1,023,027 | 90 |
| Yes | 116,392 | 10 |
| Comorbidities | ||
| AIDS | 5724 | 1 |
| Alcohol abuse | 79,633 | 7 |
| Deficiency anemias | 213,437 | 19 |
| RA/collagen vascular disease | 35,210 | 3 |
| Chronic blood‐loss anemia | 10,860 | 1 |
| CHF | 190,085 | 17 |
| Chronic pulmonary disease | 285,954 | 25 |
| Coagulopathy | 48,513 | 4 |
| Depression | 145,553 | 13 |
| DM without chronic complications | 270,087 | 24 |
| DM with chronic complications | 70,732 | 6 |
| Drug abuse | 66,886 | 6 |
| Hypertension | 696,299 | 61 |
| Hypothyroidism | 146,136 | 13 |
| Liver disease | 38,130 | 3 |
| Lymphoma | 14,032 | 1 |
| Fluid and electrolyte disorders | 326,576 | 29 |
| Metastatic cancer | 33,435 | 3 |
| Other neurological disorders | 124,195 | 11 |
| Obesity | 118,915 | 10 |
| Paralysis | 38,584 | 3 |
| PVD | 77,334 | 7 |
| Psychoses | 101,856 | 9 |
| Pulmonary circulation disease | 52,106 | 5 |
| Renal failure | 175,398 | 15 |
| Solid tumor without metastasis | 29,594 | 3 |
| Peptic ulcer disease excluding bleeding | 536 | 0 |
| Valvular disease | 86,616 | 8 |
| Weight loss | 45,132 | 4 |
| Primary discharge diagnoses | ||
| Cancer | 19,168 | 2 |
| Musculoskeletal injuries | 16,798 | 1 |
| Pain‐related diagnosesb | 101,533 | 9 |
| Alcohol‐related disorders | 16,777 | 1 |
| Substance‐related disorders | 13,697 | 1 |
| Psychiatric disorders | 41,153 | 4 |
| Mood disorders | 28,761 | 3 |
| Schizophrenia and other psychotic disorders | 12,392 | 1 |
| Procedures | ||
| Cardiovascular procedures | 59,901 | 5 |
| GI procedures | 31,224 | 3 |
| Mechanical ventilation | 7853 | 1 |
| Hospital characteristics, N=286 | ||
| Number of beds | ||
| <200 | 103 | 36 |
| 201300 | 63 | 22 |
| 301500 | 81 | 28 |
| >500 | 39 | 14 |
| Population served | ||
| Urban | 225 | 79 |
| Rural | 61 | 21 |
| Teaching status | ||
| Nonteaching | 207 | 72 |
| Teaching | 79 | 28 |
| US Census region | ||
| Northeast | 47 | 16 |
| Midwest | 63 | 22 |
| South | 115 | 40 |
| West | 61 | 21 |
To assess hospital variation in opioid prescribing after adjusting for patient characteristics, we used a GEE model of opioid receipt, controlling for all patient characteristics listed in Table 1. We then took the mean of the predicted probabilities of opioid receipt for the patients within each hospital in our cohort to derive the hospital prescribing rate adjusted for patient characteristics. We report the mean, SD, and range of the prescribing rates for the hospitals in our cohort before and after adjustment for patient characteristics.
To assess whether patients admitted to hospitals with higher rates of opioid prescribing have higher relative risk of severe opioid‐related adverse events, we stratified hospitals into opioid‐prescribing rate quartiles and compared the rates of opioid‐related adverse eventsboth overall and among opioid exposedbetween quartiles. To adjust for patient characteristics, we used a GEE model in which severe opioid‐related adverse event (yes/no) was the dependent variable and hospital‐prescribing rate quartile and all patient characteristics in Table 1 were independent variables. We also performed a sensitivity analysis in which we assessed the association between hospital prescribing‐rate quartile and the individual components of our composite outcome. Our results were qualitatively unchanged using this approach, and only the results of our main analysis are presented.
All analyses were carried out using SAS software, version 9.2 (SAS Institute Inc., Cary, NC).
RESULTS
Patient Admission Characteristics
There were 3,190,934 adult admissions to 300 acute‐care hospitals during our study period. After excluding admissions with a length of stay >365 days (n=25), missing patient sex (n=17), and charges for operating‐room procedures or a surgical attending of record (n=2,018,553), 1,172,339 admissions were available for analysis. There were 12 hospitals with incomplete opioid‐prescribing data (n=32,794) and 2 hospitals that contributed <100 admissions each (n=126), leaving 1,139,419 admissions in 286 hospitals in our analytic cohort. The median age of the cohort was 64 years (interquartile range, 4979 years), and 527,062 (46%) were men. Table 1 shows the characteristics of the admissions in the cohort.
Rate, Route, and Dose of Opioid Exposures
Overall, there were 576,373 (51%) admissions with charges for opioid medications. Among those exposed, 244,760 (43%) had charges for multiple opioids during the admission; 172,090 (30%) had charges for 2 different opioids; and 72,670 (13%) had charges for 3 different opioids. Table 2 shows the percent exposed to each opioid, the percent of exposed with parenteral and oral routes of administration, and the mean daily dose received in oral morphine equivalents.
| Exposed | Parenteral Administration | Oral Administration | Dose Received, in Oral Morphine Equivalents | |||||
|---|---|---|---|---|---|---|---|---|
| N | %a | N | %b | N | %b | Mean | SDc | |
| ||||||||
| All opioids | 576,373 | 51 | 378,771 | 66 | 371,796 | 65 | 68 | 185 |
| Morphine | 224,811 | 20 | 209,040 | 93 | 21,645 | 10 | 40 | 121 |
| Hydrocodone | 162,558 | 14 | 0 | 0 | 160,941 | 99 | 14 | 12 |
| Hydromorphone | 146,236 | 13 | 137,936 | 94 | 16,052 | 11 | 113 | 274 |
| Oxycodone | 126,733 | 11 | 0 | 0 | 125,033 | 99 | 26 | 37 |
| Fentanyl | 105,052 | 9 | 103,113 | 98 | 641 | 1 | 64 | 75 |
| Tramadol | 35,570 | 3 | 0 | 0 | 35,570 | 100 | ||
| Meperidine | 24,850 | 2 | 24,398 | 98 | 515 | 2 | 36 | 34 |
| Methadone | 15,302 | 1 | 370 | 2 | 14,781 | 97 | 337 | 384 |
| Codeine | 22,818 | 2 | 178 | 1 | 22,183 | 97 | 9 | 15 |
| Other | 45,469 | 4 | 5821 | 13 | 39,618 | 87 | ||
Among the medications/routes for which conversion to morphine equivalents was possible, dosage was missing in 39,728 out of 2,294,673 opioid charges (2%). The average daily dose received in oral morphine equivalents was 68 mg. A total dose of 50 mg per day was received in 39% of exposed, and a total dose of 100 mg per day was received in 23% of exposed. Among those exposed, 52% (26% of overall admissions) had charges for opioids on the day of discharge.
Rates of Opioid Use by Patient and Hospital Characteristics
Table 3 reports the association between admission characteristics and opioid use. Use was highest in patients between the ages of 25 and 54 years. Although use declined with age, 44% of admissions age 65 years had charges for opioid medication. After adjustment for patient demographics, comorbidities, and hospital characteristics, opioid use was more common in females than males, those age 2554 years compared with those older and younger, those of Caucasian race compared with non‐Caucasian race, and those with Medicare or Medicaid primary insurance. Among the primary discharge diagnoses, patients with musculoskeletal injuries, various specific and nonspecific pain‐related diagnoses, and cancer were significantly more likely to receive opioids than patients without these diagnoses, whereas patients with alcohol‐related disorders and psychiatric disorders were significantly less likely to receive opioids than patients without these diagnoses. Patients admitted to hospitals in the Midwest, South, and West were significantly more likely to receive opioid medications than patients in the Northeast.
| Exposed, N=576,373 | Unexposed, N=563,046 | % Exposed | Adjusted RRa | 95% CI | |
|---|---|---|---|---|---|
| |||||
| Patient characteristics | |||||
| Age group, y | |||||
| 1824 | 17,360 | 20,104 | 46 | (ref) | |
| 2534 | 37,793 | 28,748 | 57 | 1.17 | 1.16‐1.19 |
| 3544 | 60,712 | 41,989 | 59 | 1.16 | 1.15‐1.17 |
| 4554 | 103,798 | 71,032 | 59 | 1.11 | 1.09‐1.12 |
| 5564 | 108,256 | 84,314 | 56 | 1.00 | 0.98‐1.01 |
| 6574 | 98,110 | 98,297 | 50 | 0.84 | 0.83‐0.85 |
| 75+ | 150,344 | 218,562 | 41 | 0.71 | 0.70‐0.72 |
| Sex | |||||
| Male | 255,315 | 271,747 | 48 | (ref) | |
| Female | 321,058 | 291,299 | 52 | 1.11 | 1.10‐1.11 |
| Race | |||||
| White | 365,107 | 346,886 | 51 | (ref) | |
| Black | 92,013 | 84,980 | 52 | 0.93 | 0.92‐0.93 |
| Hispanic | 27,592 | 26,814 | 51 | 0.94 | 0.93‐0.94 |
| Other | 91,661 | 104,366 | 47 | 0.93 | 0.92‐0.93 |
| Marital status | |||||
| Married | 222,912 | 204,736 | 52 | (ref) | |
| Single | 297,742 | 288,601 | 51 | 1.00 | 0.99‐1.01 |
| Unknown/other | 55,719 | 69,709 | 44 | 0.94 | 0.93‐0.95 |
| Primary insurance | |||||
| Private/commercial | 143,954 | 125,771 | 53 | (ref) | |
| Medicare traditional | 236,114 | 266,187 | 47 | 1.10 | 1.09‐1.10 |
| Medicare managed care | 59,104 | 67,240 | 47 | 1.11 | 1.11‐1.12 |
| Medicaid | 73,583 | 51,442 | 59 | 1.13 | 1.12‐1.13 |
| Self‐pay/other | 63,618 | 52,406 | 55 | 1.03 | 1.02‐1.04 |
| ICU care | |||||
| No | 510,654 | 512,373 | 50 | (ref) | |
| Yes | 65,719 | 50,673 | 56 | 1.02 | 1.01‐1.03 |
| Comorbiditiesb | |||||
| AIDS | 3655 | 2069 | 64 | 1.09 | 1.07‐1.12 |
| Alcohol abuse | 35,112 | 44,521 | 44 | 0.92 | 0.91‐0.93 |
| Deficiency anemias | 115,842 | 97,595 | 54 | 1.08 | 1.08‐1.09 |
| RA/collagen vascular disease | 22,519 | 12,691 | 64 | 1.22 | 1.21‐1.23 |
| Chronic blood‐loss anemia | 6444 | 4416 | 59 | 1.04 | 1.02‐1.05 |
| CHF | 88,895 | 101,190 | 47 | 0.99 | 0.98‐0.99 |
| Chronic pulmonary disease | 153,667 | 132,287 | 54 | 1.08 | 1.08‐1.08 |
| Coagulopathy | 25,802 | 22,711 | 53 | 1.03 | 1.02‐1.04 |
| Depression | 83,051 | 62,502 | 57 | 1.08 | 1.08‐1.09 |
| DM without chronic complications | 136,184 | 133,903 | 50 | 0.99 | 0.99‐0.99 |
| DM with chronic complications | 38,696 | 32,036 | 55 | 1.04 | 1.03‐1.05 |
| Drug abuse | 37,202 | 29,684 | 56 | 1.14 | 1.13‐1.15 |
| Hypertension | 344,718 | 351,581 | 50 | 0.98 | 0.97‐0.98 |
| Hypothyroidism | 70,786 | 75,350 | 48 | 0.99 | 0.99‐0.99 |
| Liver disease | 24,067 | 14,063 | 63 | 1.15 | 1.14‐1.16 |
| Lymphoma | 7727 | 6305 | 55 | 1.16 | 1.14‐1.17 |
| Fluid and electrolyte disorders | 168,814 | 157,762 | 52 | 1.04 | 1.03‐1.04 |
| Metastatic cancer | 23,920 | 9515 | 72 | 1.40 | 1.39‐1.42 |
| Other neurological disorders | 51,091 | 73,104 | 41 | 0.87 | 0.86‐0.87 |
| Obesity | 69,584 | 49,331 | 59 | 1.05 | 1.04‐1.05 |
| Paralysis | 17,497 | 21,087 | 45 | 0.97 | 0.96‐0.98 |
| PVD | 42,176 | 35,158 | 55 | 1.11 | 1.11‐1.12 |
| Psychoses | 38,638 | 63,218 | 38 | 0.91 | 0.90‐0.92 |
| Pulmonary circulation disease | 26,656 | 25,450 | 51 | 1.05 | 1.04‐1.06 |
| Renal failure | 86,565 | 88,833 | 49 | 1.01 | 1.01‐1.02 |
| Solid tumor without metastasis | 16,258 | 13,336 | 55 | 1.14 | 1.13‐1.15 |
| Peptic ulcer disease excluding bleeding | 376 | 160 | 70 | 1.12 | 1.07‐1.18 |
| Valvular disease | 38,396 | 48,220 | 44 | 0.93 | 0.92‐0.94 |
| Weight loss | 25,724 | 19,408 | 57 | 1.09 | 1.08‐1.10 |
| Primary discharge diagnosesb | |||||
| Cancer | 13,986 | 5182 | 73 | 1.20 | 1.19‐1.21 |
| Musculoskeletal injuries | 14,638 | 2160 | 87 | 2.02 | 2.002.04 |
| Pain‐related diagnosesc | 64,656 | 36,877 | 64 | 1.20 | 1.20‐1.21 |
| Alcohol‐related disorders | 3425 | 13,352 | 20 | 0.46 | 0.44‐0.47 |
| Substance‐related disorders | 8680 | 5017 | 63 | 1.03 | 1.01‐1.04 |
| Psychiatric disorders | 7253 | 33,900 | 18 | 0.37 | 0.36‐0.38 |
| Mood disorders | 5943 | 22,818 | 21 | ||
| Schizophrenia and other psychotic disorders | 1310 | 11,082 | 11 | ||
| Proceduresb | |||||
| Cardiovascular procedures | 50,997 | 8904 | 85 | 1.80 | 1.79‐1.81 |
| GI procedures | 27,206 | 4018 | 87 | 1.70 | 1.69‐1.71 |
| Mechanical ventilation | 5341 | 2512 | 68 | 1.37 | 1.34‐1.39 |
| Hospital characteristics | |||||
| Number of beds | |||||
| <200 | 100,900 | 88,439 | 53 | (ref) | |
| 201300 | 104,213 | 99,995 | 51 | 0.95 | 0.95‐0.96 |
| 301500 | 215,340 | 209,104 | 51 | 0.94 | 0.94‐0.95 |
| >500 | 155,920 | 165,508 | 49 | 0.96 | 0.95‐0.96 |
| Population served | |||||
| Urban | 511,727 | 506,803 | 50 | (ref) | |
| Rural | 64,646 | 56,243 | 53 | 0.98 | 0.97‐0.99 |
| Teaching status | |||||
| Nonteaching | 366,623 | 343,581 | 52 | (ref) | |
| Teaching | 209,750 | 219,465 | 49 | 1.00 | 0.99‐1.01 |
| US Census region | |||||
| Northeast | 99,377 | 149,446 | 40 | (ref) | |
| Midwest | 123,194 | 120,322 | 51 | 1.26 | (1.25‐1.27) |
| South | 251,624 | 213,029 | 54 | 1.33 | (1.33‐1.34) |
| West | 102,178 | 80,249 | 56 | 1.37 | (1.36‐1.38) |
Variation in Opioid Prescribing
Figure 1 shows the histograms of hospital opioid prescribing rate for the 286 hospitals in our cohort (A) before and (B) after adjustment for patient characteristics. The observed rates ranged from 5% in the lowest‐prescribing hospital to 72% in the highest‐prescribing hospital, with a mean (SD) of 51% (10%). After adjusting for patient characteristics, the adjusted opioid‐prescribing rates ranged from 33% to 64%, with a mean (SD) of 50% (4%).
Severe Opioid‐Related Adverse Events
Among admissions with opioid exposure (n=576,373), naloxone use occurred in 2345 (0.41%) and opioid‐related adverse drug events in 1174 (0.20%), for a total of 3441 (0.60%) severe opioid‐related adverse events (some patients experienced both). Table 4 reports the opioid exposure and severe opioid‐related adverse‐event rates within hospital opioid‐prescribing rate quartiles, along with the adjusted association between the hospital opioid‐prescribing rate quartile and severe opioid‐related adverse events. After adjusting for patient characteristics, the relative risk of a severe opioid‐related adverse event was significantly greater in hospitals with higher opioid‐prescribing rates, both overall and among opioid exposed.
| Quartile | No. of Patients | Opioid Exposed, n (%) | Opioid‐Related Adverse Events, n (%) | Adjusted RR in All Patients, RR (95% CI), N=1,139,419a | Adjusted RR in Opioid Exposed, RR (95% CI), N=576,373a |
|---|---|---|---|---|---|
| |||||
| 1 | 349,747 | 132,824 (38) | 719 (0.21) | (ref) | (ref) |
| 2 | 266,652 | 134,590 (50) | 729 (0.27) | 1.31 (1.17‐1.45) | 1.07 (0.96‐1.18) |
| 3 | 251,042 | 139,770 (56) | 922 (0.37) | 1.72 (1.56‐1.90) | 1.31 (1.19‐1.44) |
| 4 | 271,978 | 169,189 (62) | 1071 (0.39) | 1.73 (1.57‐1.90) | 1.23 (1.12‐1.35) |
DISCUSSION
In this analysis of a large cohort of hospitalized nonsurgical patients, we found that more than half of all patients received opioids, with 43% of those exposed receiving multiple opioids during their admission and 52% receiving opioids on the day of discharge. Considerable hospital variation in opioid use was evident, and this was not fully explained by patient characteristics. Severe opioid‐related adverse events occurred more frequently at hospitals with higher opioid‐prescribing rates, and the relative risk of a severe adverse event per patient prescribed opioids was also higher in these hospitals. To our knowledge, this is the first study to describe the scope of opioid utilization and the relationship between utilization and severe opioid‐related adverse events in a sample of nonsurgical patients in US acute‐care facilities.
Our use of naloxone charges and opioid‐specific ICD‐9‐CM coding to define an opioid‐related adverse event was intended to capture only the most severe opioid‐related adverse events. We chose to focus on these events in our analysis to maximize the specificity of our outcome definition and thereby minimize confounding in our observed associations. The rate of less‐severe opioid‐related adverse events, such as nausea, constipation, and pruritis, is likely much higher and not captured in our outcome definition. Prior analyses have found variable rates of opioid‐related adverse events of approximately 1.8% to 13.6% of exposed patients.[22, 23, 24] However, these analyses focused on surgical patients and included less‐severe events. To our knowledge, ours is the first analysis of severe opioid‐related adverse events in nonsurgical patients.
Our finding that severe opioid‐related adverse events increase as opioid prescribing increases is consistent with that which has been demonstrated in the community setting, where rates of opioid‐related adverse events and mortality are higher in communities with higher levels of opioid prescribing.[2, 8, 25] This finding is expected, as greater use of a class of medications with known side effects would be expected to result in a higher overall rate of adverse events. More concerning, however, is the fact that this relationship persists when focusing exclusively on opioid‐exposed patients. Among similar patients receiving opioids at different hospitals, those hospitalized in facilities with higher opioid‐prescribing rates have higher rates of severe opioid‐related adverse events. This suggests that hospitals that use opioids more frequently do not do so more safely. Rather, the increased overall prescribing rates are associated with heightened risk for a serious adverse event per patient exposed and may reflect unsafe prescribing practices.
Furthermore, our results demonstrate both regional and hospital variation in use of opioids not fully explained by patient characteristics, similar to that which has been demonstrated for other drugs and heathcare services.[26, 27, 28, 29, 30] The implications of these findings are limited by our lack of information on pain severity or prior outpatient treatment, and our resultant inability to evaluate the appropriateness of opioid use in this analysis. Additionally, although we controlled for a large number of patient and hospital characteristics, there could be other significant predictors of use not accounted for in our analysis. However, it seems unlikely that differential pain severity or patient characteristics between patients in different regions of the country could fully explain a 37% relative difference in prescribing between the lowest‐ and highest‐prescribing regions, after accounting for the 44 patient‐level variables in our models. Whereas variation in use unrelated to patient factors could represent inappropriate prescribing practices, it could also be a marker of uncertainty regarding what constitutes appropriate prescribing and high‐quality care in this realm. Although guidelines advocate for standard pain assessments and a step‐up approach to treatment,[31, 32, 33] the lack of objective measures of pain severity and lack of evidence‐based recommendations on the use of opioids for noncancer pain[34] will almost certainly lead to persistent variation in opioid prescribing despite guideline‐driven care.
Nonetheless, our findings suggest that opportunities exist to make opioid prescribing safer in hospitalized patients. Studies aimed at elucidating the source of regional and hospital variation are necessary. Additionally, efforts should focus on identifying patient and prescribing characteristics associated with heightened risk of opioid‐related adverse events. Prior studies have demonstrated that the risks of opioid medications increase with increasing age of the patient.[35, 36] Although opioid use in our cohort declined with age, 44% of admissions age 65 years had charges for opioid medications. Studies in outpatients have also demonstrated that the risks of opioid overdose and overdose‐related death increase with dose.[5, 7] One study demonstrated a 3.7‐fold increased risk of overdose at doses of 5099 mg/day in oral morphine equivalents, and an 8.9‐fold increased risk at doses of 100 mg/day, compared with doses of 20 mg/day.[7] The prevalence of high dose exposure observed in our cohort, coupled with the older age of hospitalized patients, suggests potential targets for promoting safer use in hospitalized patients through interventions such as computerized decision support and enhanced monitoring in those at highest risk.
Because medications after discharge were unavailable in our dataset, the percentage of patients given a prescription for opioid medication on discharge is unknown. However, given that opioids are often tapered rather than abruptly discontinued, our finding that 26% of hospitalized nonsurgical patients received opioids on the day of discharge suggests that a substantial proportion of patients may be discharged with a prescription for opioid medication. Given the possibility of coexistent outpatient opioid prescriptions, these findings draw attention to the importance of assuring development and streamlined accessibility of data from state prescription drug monitoring programs and suggest that increased attention should be paid to the role that inpatient opioid prescribing plays in the increased rates of chronic opioid use and overdose‐related deaths in the United States.
There are additional limitations to our analysis. First, although the database used for this analysis captures a large proportion of admissions to US acute‐care facilities and is similar in composition, it is possible that participating medical centers differ from nonparticipating medical centers in ways that could be associated with opioid prescribing. Additionally, although Premier performs extensive validation and correction processes to assure the quality of their data, there is still likely to be a small amount of random error in the database, which could particularly impact dosage calculations. The lack of preadmission medications in our database precluded identification of the proportion of patients newly started on opioid medications. Lastly, it is possible that the hospital prescribing‐rate quartile is associated with patient characteristics unaccounted for in our analysis, and, therefore, the possibility of residual confounding still exists.
In conclusion, the majority of hospitalized nonsurgical patients are exposed to opioid medications during the course of their hospitalizations, often at high doses. More than half of those exposed are still receiving these medications on the day of discharge. We found hospital and regional variation in opioid use that was not fully explained by patient characteristics, and higher levels of hospital use were associated with higher risk of severe opioid‐related adverse events in opioid‐exposed patients. Further research is necessary to investigate the appropriateness of opioid use in this patient population, the sources of variation in use, and the predictors of opioid‐related adverse events in hospitalized patients to allow development of interventions to make hospital use safer.
Disclosures
Disclosures: Dr. Herzig had full access to all of the data in the study and takes responsibility for the integrity of the data and the accuracy of the data analysis. Dr. Herzig was funded by grant no. K23AG042459 from the National Institute on Aging. Dr. Marcantonio was funded by grant nos. P01AG031720, R01AG030618, R03AG028189, and K24AG035075 from the National Institute on Aging. The funding organization had no involvement in any aspect of the study, including design, conduct, and reporting of the study. None of the authors have any conflicts of interest to disclose.
- . A flood of opioids, a rising tide of deaths. N Engl J Med. 2010;363(21):1981–1985.
- , , . Increasing deaths from opioid analgesics in the United States. Pharmacoepidemiol Drug Saf. 2006;15(9):618–627.
- , , , . Trends in opioid prescribing by race/ethnicity for patients seeking care in US emergency departments. JAMA. 2008;299(1):70–78.
- , , , . Trends in medical use and abuse of opioid analgesics. JAMA. 2000;283(13):1710–1714.
- , , , et al. Association between opioid prescribing patterns and opioid overdose‐related deaths. JAMA. 2011;305(13):1315–1321.
- , , , et al. Prescription opioid mortality trends in New York City, 1990–2006: examining the emergence of an epidemic. Drug Alcohol Depend. 2013;132(1‐2):53–62.
- , , , et al. Opioid prescriptions for chronic pain and overdose: a cohort study. Ann Intern Med. 2010;152(2):85–92.
- , , , et al. Relationship of opioid prescription sales and overdoses, North Carolina. Drug Alcohol Depend. 2013;132(1‐2):81–86.
- Deaths from prescription opioids soar in New York. BMJ. 2013;346:f921.
- , , . Mortality in elderly dementia patients treated with risperidone. J Clin Psychopharmacol. 2006;26(6):566–570.
- , , , et al. Medication reconciliation: a practical tool to reduce the risk of medication errors. J Crit Care. 2003;18(4):201–205.
- , , . Adverse drug event trigger tool: a practical methodology for measuring medication related harm. Qual Saf Health Care. 2003;12(3):194–200.
- , , , , . Improvement in the detection of adverse drug events by the use of electronic health and prescription records: an evaluation of two trigger tools. Eur J Clin Pharmacol. 2013;69(2):255–259.
- , . Adverse Drug Events in U.S. Hospitals, 2004. Rockville, MD: Agency for Healthcare Research and Quality; April 2007. Statistical Brief 29.
- , , . Medication‐Related Adverse Outcomes in U.S. Hospitals and Emergency Departments, 2008. Rockville, MD: Agency for Healthcare Research and Quality; April 2011. Statistical Brief 109.
- US Centers for Medicare and Medicaid Services. Hospital‐Acquired Conditions (Present on Admission Indicator). Available at: http://www.cms.hhs.gov/HospitalAcqCond/. Accessed August 16, 2011. Updated September 20, 2012.
- , , . Fracture risk associated with the use of morphine and opiates. J Intern Med. 2006;260(1):76–87.
- , , , . Comorbidity measures for use with administrative data. Med Care. 1998;36(1):8–27.
- Clinical Classifications Software, Healthcare Cost and Utilization Project (HCUP). Rockville, MD; Agency for Healthcare Research and Quality; December 2009.
- , , , , . Clinical application of opioid equianalgesic data. Clin J Pain. 2003;19(5)286–297.
- , , , , , . Choosing the unit of measurement counts: the use of oral morphine equivalents in studies of opioid consumption is a useful addition to defined daily doses. Palliat Med. 2011;25(7):725–732.
- , , , . Cost and quality implications of opioid‐based postsurgical pain control using administrative claims data from a large health system: opioid‐related adverse events and their impact on clinical and economic outcomes. Pharmacotherapy. 2013;33(4):383–391.
- , , , et al. Opioid‐related adverse drug events in surgical hospitalizations: impact on costs and length of stay. Ann Pharmacother. 2007;41(3):400–406.
- , , , et al. Cost of opioid‐related adverse drug events in surgical patients. J Pain Symptom Manage. 2003;25(3):276–283.
- , . Opioid analgesics and rates of fatal drug poisoning in the United States. Am J Prev Med. 2006;31(6):506–511.
- , , , et al. Geographic variation in the treatment of acute myocardial infarction: the Cooperative Cardiovascular Project. JAMA. 1999;281(7):627–633.
- , , , et al; GUSTO‐1 Investigators. Regional variation across the United States in the management of acute myocardial infarction. Global Utilization of Streptokinase and Tissue Plasminogen Activator for Occluded Coronary Arteries. N Engl J Med. 1995;333(9):565–572.
- , , . Predictors of broad‐spectrum antibiotic prescribing for acute respiratory tract infections in adult primary care. JAMA. 2003;289(6):719–725.
- , , . Geographic variation in Medicare drug spending. N Engl J Med. 2010;363(5):405–409.
- , , . Geographic variation in outpatient antibiotic prescribing among older adults. Arch Intern Med. 2012;172(19):1465–1471.
- , , , et al. Clinical policy: critical issues in the prescribing of opioids for adult patients in the emergency department. Ann Emerg Med. 2012;60(4):499–525.
- The Joint Commission. Facts About Pain Management. Available at: http://www.jointcommission.org/pain_management/. Accessed July 23, 2012.
- The Joint Commission. Sentinel Event Alert: Safe Use of Opioids in Hospitals. Published August 8, 2012. Available at: http://www.jointcommission.org/assets/1/18/SEA_49_opioids_8_2_12_final.pdf. Accessed March 4, 2013.
- , , , , . Research gaps on use of opioids for chronic noncancer pain: findings from a review of the evidence for an American Pain Society and American Academy of Pain Medicine clinical practice guideline. J Pain. 2009;10(2):147–159.
- , , , , , . Side effects of opioids during short‐term administration: effect of age, gender, and race. Clin Pharmacol Ther. 2003;74(2):102–112.
- , , , . Postoperative day one: a high‐risk period for respiratory events. Am J Surg. 2005;190(5):752–756.
© 2013 Society of Hospital Medicine