User login
A 40-year-old man was brought to the emergency department with altered mental status. His roommate had found him lying unconscious in snow on the lawn outside his residence. When the emergency medical services team arrived, they recorded a core body temperature of 28.3°C (82.9°F) and instituted advanced cardiac life support.
During transit to the hospital, the patient’s heart rhythm changed from asystole to ventricular fibrillation, and defibrillation was performed twice.
Upon his arrival at the emergency room, advanced life support was continued, resulting in return of spontaneous circulation, with slow, wide-complex QRS rhythm noted on electrocardiography (ECG).
On examination, the patient’s pupils were fixed and dilated. The extremities were cold to palpation. The core body temperature dropped to 27.7°C (81.9°F).
Laboratory test results showed severe acidemia (arterial pH 6.8), elevated aspartate aminotransferase and alanine aminotransferase levels, and elevated creatinine and troponin. The troponin was measured 3 times and rose from 0.8 ng/mL to 0.9 ng/mL. A urine toxicology screen was positive for cannabinoids and cocaine.
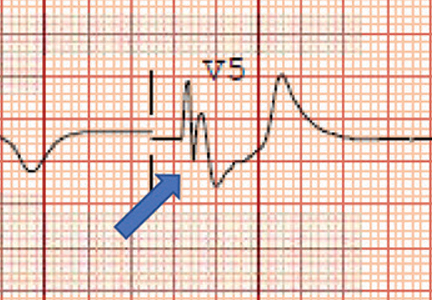
 is typically seen in precordial leads V3 to V6 and is a marker for hypothermia.")
ECG revealed J-point elevation (Osborn waves) in the precordial leads (Figure 1). A baseline electrocardiogram in the medical record from a previous admission had been normal.
An aggressive hypothermia protocol was initiated, but the patient died despite resuscitation efforts.
HYPOTHERMIA AND HEART RHYTHMS
Hypothermia—a core body temperature below 35°C (95°F)—causes generalized slowing of impulse conduction through cardiac tissues, shown on ECG as a prolongation of the PR, RR, QRS, and QT intervals.1
A characteristic feature is elevation of the J point, also called the J wave or Osborn wave, most prominent in precordial leads V2 to V5 and caused by abnormal membrane repolarization in the early phase. The degree of hypothermia correlates linearly with the amplitude of the Osborn wave.2,3
Laboratory tests can identify complications such as rhabdomyolysis, spontaneous bleeding, and lactic acidosis. Moderate to severe hypothermia may cause prolongation of all ECG intervals. Management requires resuscitation and rewarming.
Conditions to consider in the differential diagnosis are Brugada syndrome, hypercalcemia, and early repolarization syndrome.
- Doshi HH, Giudici MC. The EKG in hypothermia and hyperthermia. J Electrocardiol 2015; 48:203–208.
- Alsafwah S. Electrocardiographic changes in hypothermia. Heart Lung 2001; 30:161–163.
- Graham CA, McNaughton GW, Wyatt JP. The electrocardiogram in hypothermia. Wilderness Environ Med 2001; 12:232–235.
A 40-year-old man was brought to the emergency department with altered mental status. His roommate had found him lying unconscious in snow on the lawn outside his residence. When the emergency medical services team arrived, they recorded a core body temperature of 28.3°C (82.9°F) and instituted advanced cardiac life support.
During transit to the hospital, the patient’s heart rhythm changed from asystole to ventricular fibrillation, and defibrillation was performed twice.
Upon his arrival at the emergency room, advanced life support was continued, resulting in return of spontaneous circulation, with slow, wide-complex QRS rhythm noted on electrocardiography (ECG).
On examination, the patient’s pupils were fixed and dilated. The extremities were cold to palpation. The core body temperature dropped to 27.7°C (81.9°F).
Laboratory test results showed severe acidemia (arterial pH 6.8), elevated aspartate aminotransferase and alanine aminotransferase levels, and elevated creatinine and troponin. The troponin was measured 3 times and rose from 0.8 ng/mL to 0.9 ng/mL. A urine toxicology screen was positive for cannabinoids and cocaine.
ECG revealed J-point elevation (Osborn waves) in the precordial leads (Figure 1). A baseline electrocardiogram in the medical record from a previous admission had been normal.
An aggressive hypothermia protocol was initiated, but the patient died despite resuscitation efforts.
HYPOTHERMIA AND HEART RHYTHMS
Hypothermia—a core body temperature below 35°C (95°F)—causes generalized slowing of impulse conduction through cardiac tissues, shown on ECG as a prolongation of the PR, RR, QRS, and QT intervals.1
A characteristic feature is elevation of the J point, also called the J wave or Osborn wave, most prominent in precordial leads V2 to V5 and caused by abnormal membrane repolarization in the early phase. The degree of hypothermia correlates linearly with the amplitude of the Osborn wave.2,3
Laboratory tests can identify complications such as rhabdomyolysis, spontaneous bleeding, and lactic acidosis. Moderate to severe hypothermia may cause prolongation of all ECG intervals. Management requires resuscitation and rewarming.
Conditions to consider in the differential diagnosis are Brugada syndrome, hypercalcemia, and early repolarization syndrome.
- Doshi HH, Giudici MC. The EKG in hypothermia and hyperthermia. J Electrocardiol 2015; 48:203–208.
- Alsafwah S. Electrocardiographic changes in hypothermia. Heart Lung 2001; 30:161–163.
- Graham CA, McNaughton GW, Wyatt JP. The electrocardiogram in hypothermia. Wilderness Environ Med 2001; 12:232–235.