User login
Despite widespread efforts to predict 30‐day rehospitalizations among discharged general medical patients,[1, 2, 3] not many strategies have incorporated patient‐reported outcome (PRO) measures in predictive models.[4] This despite the many longitudinal studies of the ambulatory population that demonstrate the higher likelihood of hospitalizations among those who score poorly on General Self‐Rated Health (GSRH),[5, 6, 7] baseline or declining Health‐Related Quality of Life,[8, 9, 10, 11, 12] psychological symptoms,[13, 14] and physical symptoms assessments.[15] One of the few existing studies that included PRO measures in 30‐day readmission models showed the predictive value of the 12‐item short form (SF12) Physical Component Score.[16] Others showed that persistent symptoms were associated with readmissions in patients with heart disease.[17, 18]
The paucity of efforts to connect PRO measures to utilization may be due to the limited availability of these measures in routine clinical records and the incomplete knowledge about how various PRO measures may fluctuate during episodes of acute illnesses and their treatments during hospitalizations. Health perception measures reflect both enduring features like self‐concept as well as dynamic features like a person's immediate health status.[19] As such, GSRH reflects the presence of chronic illnesses but is also responsive to acute events.[20, 21] Similarly, Health‐Related Quality of Life measures are dynamic as they decline around episodes of acute illness but are stable over a longer time window in their tendency to recover.[22] We do not know how fluctuations in measures of symptom burden, perceived health, and quality of life around the hospital‐to‐home transition may differentially inform readmission risk. Using a longitudinal cohort study, we addressed 2 questions: (1) How do PRO measures change when measured serially during the hospital‐to‐home transition? (2) How does the relative timing of each PRO measure variably inform the risk of subsequent utilization events including hospital readmissions?
METHODS
We conducted a longitudinal cohort study using data originally collected for a trial (
The following instruments were administered at each interview. The physical symptom severity portion of the Memorial Symptom Assessment Scale (MSAS) solicited the severity rank (none/a little bit/somewhat/quite a bit/very much) of 17 physical symptoms in the last week; the score was calculated by averaging the severity rank of the 12 most common symptom in the sample.[25, 26] The Patient Reported Outcomes Measurement Information System (PROMIS) Global Health Short Form is an instrument assessing GSRH (1 item), Social Activities (1 item), Global Physical Health (4 items), and Global Mental Health (4 items including a single‐item quality‐of‐life measure). Fatigue and pain for Global Physical Health, and emotional health for Global Mental Health were assessed over the past 7 days. Each of the 2 Global Health scores was standardized to a national mean of 50 and standard deviation of 10.[27]
The rate of survey completion at each follow‐up was calculated. Characteristics of participants were tabulated. Characteristics of patients censored prior to study completion were compared with patients with complete data. Box plots for MSAS physical symptom severity, and Global Physical and Mental Health scores were constructed to illustrate the comparisons of the mean scores between each consecutive survey period using t tests assuming unequal variance. A similar box plot of GSRH illustrated the comparison of the median score between consecutive surveys using the rank sum test. Hospital‐based utilization events were defined as either an emergency department visit or hospitalization at 1 of the 2 hospitals of the Cook County Health & Hospitals System (CCHHS). After accounting for patient data censored due to death (date reported by family) or withdrawal from study, Kaplan‐Meier curves showing time to first hospital‐based utilization event during each interval between surveys were drawn separately for above‐ and below‐median MSAS, Global Physical and Mental Health scores, and for poor or fair versus good, very good, or excellent GSRH assessment. The null hypothesis that the survivor functions were equal between the better and worse median quantiles or GSRH categories was tested using the log‐rank test at 14 and 30 days from survey completion. Hazard ratios for time to first utilization event within 14 days of each survey were calculated for the MSAS score, Global Physical and Mental Health as continuous variables, and GSRH response categories relative to poor using bivariate and multivariate Cox proportional hazard equations. Multivariate models incorporated the following 5 covariates: at least 1 utilization event during the study period prior to the survey, Charlson score, age, gender, and race/ethnicity category. Likelihood ratio statistics were calculated to test the hypothesis that the model including the PRO measure and covariates predicted the outcome equally well compared to the nested model with only covariates. We used the traditional threshold of .05 when reporting significance. All analyses were performed in Stata 13 (StataCorp, College Station, TX). The methods for patient consent, data collection, analyses, and reporting were reviewed and approved by the CCHHS institutional review board.
RESULTS
A total of 196 patients completed the initial survey. The completion rates were 98%, 90%, and 88% for the 30‐, 90‐, and 180‐day follow‐up surveys, respectively. As shown in Table 1, participants average age was 52 years, and about half were women. The majority was non‐Hispanic black, and 21% preferred to complete the survey in Spanish. Diabetes, congestive heart failure, cancer, and chronic pulmonary disease were each prevalent in at least one‐fifth of our patient cohort. Demographic characteristics were similar between the 160 patients who completed all 3 follow‐up surveys and the 36 who missed at least 1 follow‐up survey. Among the latter group, 1 withdrew at 30 days, 1 withdrew and 4 had died at 90 days, and 1 withdrew and 9 had died at 180 days.
| |
| Age, y, mean (SD) | 52 (10) |
| Female, n (%) | 100 (51) |
| Race/ethnicity category, n (%) | |
| Non‐Hispanic black | 117 (60) |
| Hispanic | 52 (27) |
| Non‐Hispanic white | 20 (10) |
| Other | 6 (3) |
| Language, n (%) | |
| English | 155 (79) |
| Spanish | 41 (21) |
| Charlson Comorbidity Index, median (range) | 1 (09) |
| Charlson comorbidities, n (%) | |
| Diabetes | 71 (36) |
| Congestive heart failure | 52 (27) |
| Cancer (with and without metastases) | 43 (22) |
| Chronic pulmonary disease | 40 (20) |
| Myocardial infarction | 17 (9) |
| Renal disease | 11 (6) |
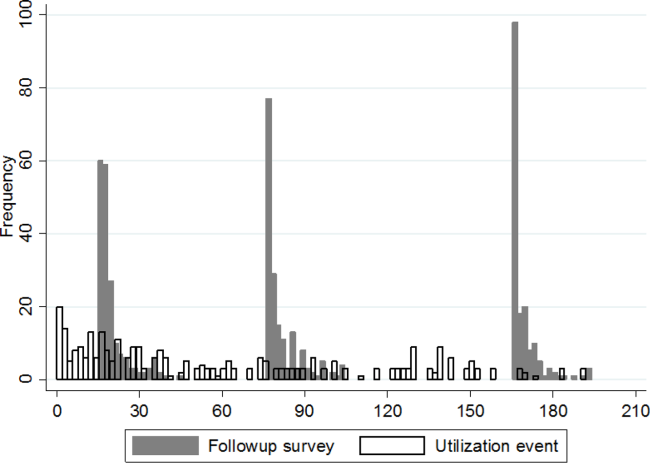
Figure 1 shows a timeline of the follow‐up surveys and utilization events in the form of overlapping histograms. The majority of 30‐day follow‐up questionnaires were completed earlier than targeted, at a median of 17 (interquartile range [IQR] 16, 20) days after discharge. Similarly, questionnaires targeted for 90 and 180 days were completed at medians of 78 (IQR 7684) and 167 (IQR 166169) days from discharge. Fifty‐four (28%) patients experienced a first utilization event in the first 30 days following discharge. During the 60‐, 90‐, and 30‐day intervals after the first, second, and third follow‐up surveys, respectively, 63 (33%), 54 (31%), and 16 (9%) patients experienced a first utilization event.

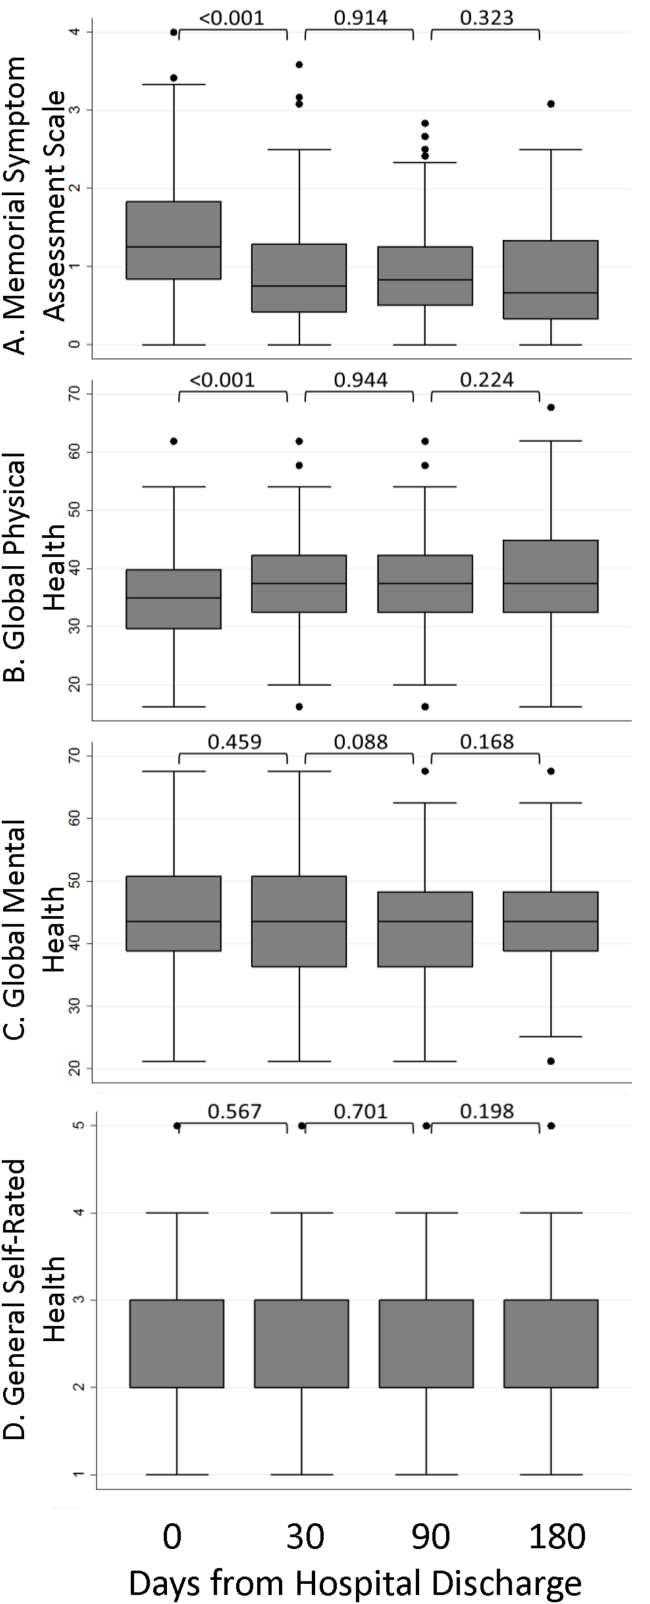
A significant improvement in MSAS physical symptom severity was detected between the hospitalization and the 30‐day follow‐up (Figure 2A). Although the mean Global Physical Health score was below the national mean of 50 at every survey period, a similar improvement in the measure was noted between the hospitalization and the 30‐day follow‐up (Figure 2B). The mean Global Mental Health score was also below the national mean but remained stable throughout the study (Figure 2C). The median GSRH was stable at 2 (IQR 23) at every survey wave (Figure 2D). Of note, compared to patients who completed all 3 follow‐up surveys, patients who missed at least 1 follow‐up reported higher MSAS score (1.5 vs 1.8, P=0.03), lower Global Physical Health (36.1 vs 33.5, P=0.09), and lower Global Mental Health (44.7 vs 41.0, P=0.03) during their hospitalization. In addition, patients with complete data experienced an average of 1.2 utilization events during the study, whereas those with missing data experienced an average of 2.1 utilization events (P=0.03).
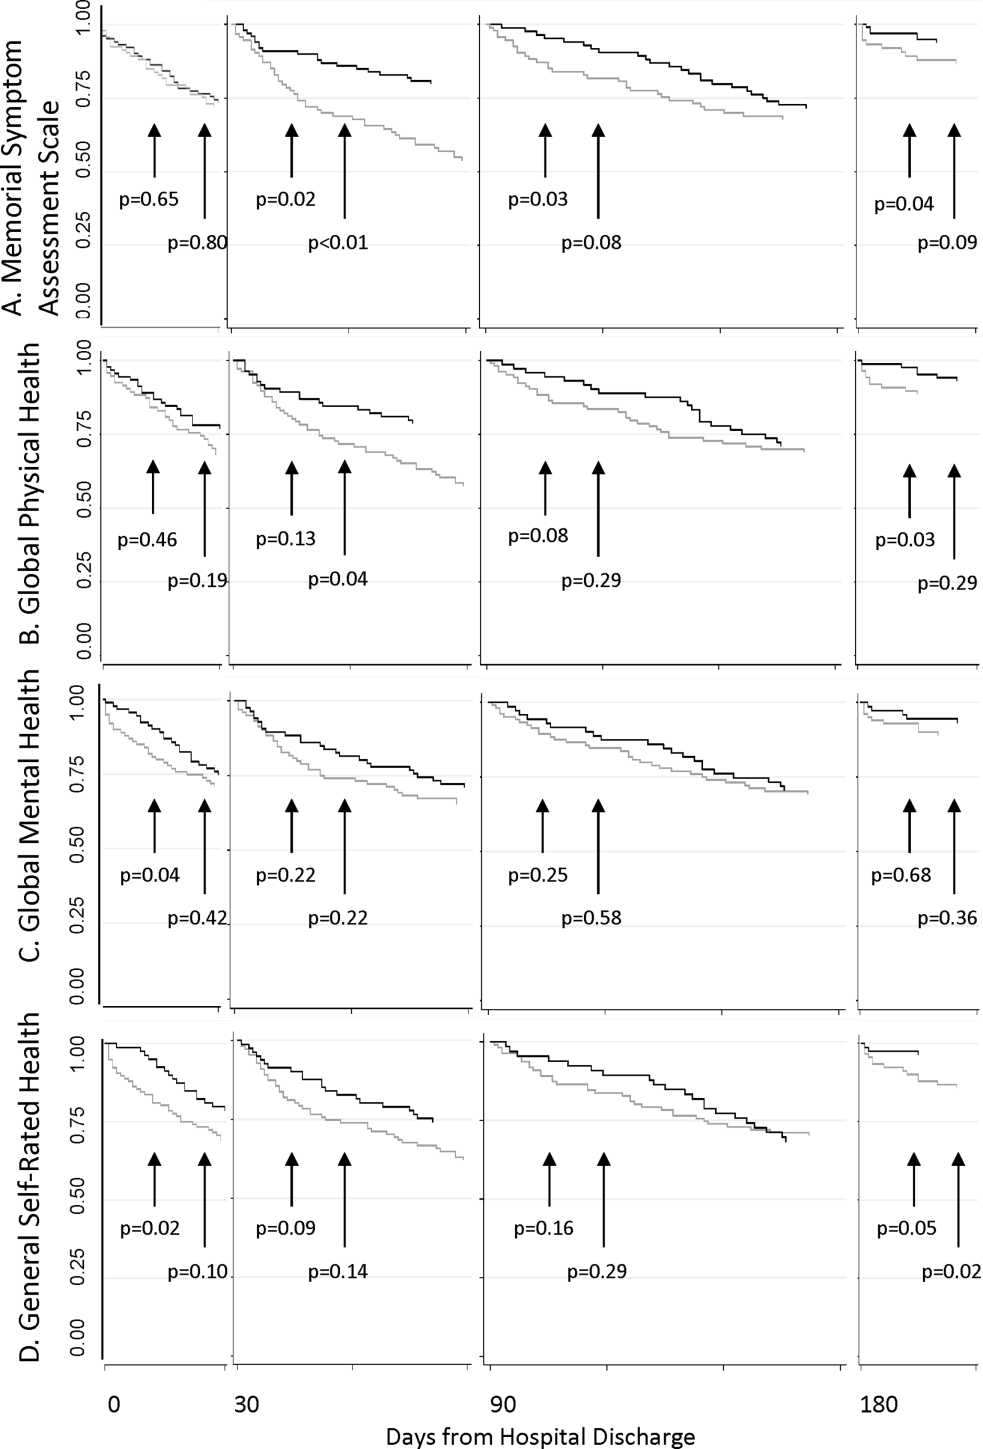
The MSAS physical symptom severity and Global Physical Health scores from the index hospitalizations did not identify patients with a first utilization event within 30 days. However, patients with poor Global Mental Health and GSRH in the hospital were more likely to experience a utilization event within 14 days of discharge (Figure 3). During the postdischarge period, patients scoring poorly on each of the PRO measures trended toward a greater risk of an early utilization event, but the association between utilization and MSAS was most consistently significant (Figure 3A). In general, the associations with MSAS, Global Physical Health, and GSRH were stronger with the risk of utilization events within 14 days than within 30 days (Figure 3A,B,D). The Global Mental Health score was not associated with a subsequent utilization when measured during the 180‐day postdischarge period.
As shown in Table 2, Cox proportional hazard models incorporating covariates preserved most of the significant associations seen in the unadjusted analyses. Global Mental Health and good relative to poor GSRH obtained during the hospitalization remained significant. MSAS obtained at each postdischarge follow‐up trended positively with utilization and was statistically significant at 90 and 180 days. Global Physical Health obtained at each postdischarge follow‐up similarly trended negatively with utilization and was significant at 180 days. Each multivariate model incorporating a PRO measure with a significant coefficient contributed to better fit of the predictive model compared to the nested model without the PRO measure.
| Unadjusted Hazard Ratio | P | Adjusted Hazard Ratio* | P | Likelihood Ratio | P | |
|---|---|---|---|---|---|---|
| ||||||
| Hospital discharge | ||||||
| MSAS | 1.47 | 0.11 | 1.38 | 0.19 | 1.65 | 0.20 |
| Global Physical Health | 0.96 | 0.10 | 0.96 | 0.13 | 2.29 | 0.13 |
| Global Mental Health | 0.96 | 0.05 | 0.96 | 0.05 | 4.05 | 0.04 |
| GSRH | ||||||
| Fair | 1.09 | 0.85 | 1.26 | 0.61 | 12.27 | 0.02 |
| Good | 0.24 | 0.04 | 0.23 | 0.03 | ||
| Very good | 1.09 | 0.90 | 1.40 | 0.63 | ||
| Excellent | NC | NS | NC | NS | ||
| 30 days | ||||||
| MSAS | 1.54 | 0.07 | 1.40 | 0.20 | 1.57 | 0.21 |
| Global Physical Health | 0.96 | 0.08 | 0.97 | 0.24 | 1.42 | 0.23 |
| Global Mental Health | 0.98 | 0.42 | 0.99 | 0.62 | 0.25 | 0.62 |
| GSRH | ||||||
| Fair | 0.92 | 0.86 | 1.19 | 0.72 | 8.85 | 0.07 |
| Good | 0.85 | 0.31 | 0.94 | 0.91 | ||
| Very good | NC | NS | NC | NS | ||
| Excellent | 2.69 | 0.36 | 6.28 | 0.11 | ||
| 90 days | ||||||
| MSAS | 2.23 | 0.03 | 2.20 | 0.05 | 3.79 | 0.05 |
| Global Physical Health | 0.94 | 0.07 | 0.95 | 0.11 | 2.75 | 0.10 |
| Global Mental Health | 0.96 | 0.20 | 0.95 | 0.15 | 2.11 | 0.15 |
| GSRH | ||||||
| Fair | 0.75 | 0.63 | 0.67 | 0.53 | 6.67 | 0.15 |
| Good | 0.32 | 0.19 | 0.28 | 0.15 | ||
| Very good | NC | NS | NC | NS | ||
| Excellent | 2.12 | 0.50 | 2.20 | 0.49 | ||
| 180 days | ||||||
| MSAS | 2.39 | 0.03 | 3.51 | 0.01 | 7.04 | 0.01 |
| Global Physical Health | 0.93 | 0.06 | 0.93 | 0.03 | 4.61 | 0.03 |
| Global Mental Health | 0.97 | 0.38 | 0.96 | 0.33 | 0.95 | 0.33 |
| GSRH | ||||||
| Fair | 0.98 | 0.98 | 0.64 | 0.55 | 7.13 | 0.13 |
| Good | 0.33 | 0.23 | 0.20 | 0.09 | ||
| Very good | NC | NS | NC | NS | ||
| Excellent | NC | NS | NC | NS | ||
DISCUSSION
In this longitudinal cohort study, patients, on average, reported relatively severe symptoms, low PROMIS Global Physical and Mental Health scores, and poor GSRH during the inpatient stay in an urban safety‐net hospital. Symptom severity and Global Physical Health improved, on average, by 30 days before stabilizing, but their poor levels in the hospital did not predict 30‐day hospital‐based utilization events. On the other hand, Global Mental Health and GSRH were stable through hospitalizations, and patients scoring poorly on these measures were at greater risk of utilization events within 14 days of discharge. PRO measures obtained during the 180‐day postdischarge period trended toward distinguishing populations with greater baseline risk of proximate utilization events. However, MSAS physical symptom severity and Global Physical Health were more consistently predictive of these events at statistically significant levels compared to Global Mental Health and GSRH in our relatively small sample of patients. Each of these measures selectively improved the fit‐of‐risk prediction models for hospital‐based utilization.
Some of the heterogeneity in readmission risk is explained by differences in PRO measures. Although the MSAS score and Global Physical Health assessment were reliable predictors of utilization when measured in ambulatory settings, they were less discriminating during acute hospitalizations when everyone, on average, reported severe symptoms and poor function. Our results were consistent with other studies that demonstrated the fairly rapid recovery in symptoms that follow hospitalizations,[28, 29] and these measures may become informative of utilization risk as early as 2 weeks postdischarge. GSRH and Global Mental Health (a measure of health‐related quality of life) only predicted utilizations immediately at hospital discharge. As multidimensional measures that reflect physical, social, and emotional capacity, these measures may indicate vulnerabilities in patients least able to handle the stresses of the early postdischarge period.
There is growing momentum around collecting PRO measures in routine clinical care as quality indicators that capture patient‐centered concerns.[30] Our study explored a novel application of these measures whose routine collection will likely proliferate, not solely for the purpose of helping healthcare systems identify patients at risk of unplanned resource utilization. Although multidimensional PRO measures seldom reflect conditions directly modifiable by simple interventions, we believe that the association between physical symptom burden and utilization in our data reveals a possible target for practice improvement. Hospitalists have contributed enormously to shorter lengths of stay that risk sicker and quicker discharges.[31] To mitigate its potential side effects on symptom management, a discharge plan that acknowledges physical symptoms that sometimes persist or recur beyond the hospitalization may be appropriate. This may be accomplished by ensuring that acute symptoms are resolving, giving clear instructions for symptom management at home, as now the standard of care for conditions like asthma,[32] and explicitly communicating the presence of residual symptoms to providers entrusted with continuity care. As an effective feedback measure that can drive continuous quality improvement, we believe that a technology‐based surveillance strategy that spans both the inpatient and outpatient domains is necessary.[23]
There are some notable similarities and differences between the results of our study and a recent hospital‐based study of PRO measures that used data from the Multi‐Center Hospitalist Project.[16] The Physical Component Score of the SF12 is similar to the PROMIS Global Physical Health score in that both incorporate measures of physical function, perceived health, pain, and energy level. Curiously, the SF12 Physical Component Score, but not the PROMIS Global Physical Health score, was associated with 30‐day rehospitalizations. An important difference between the measures is where the SF12 asks about limitations during the past 4 weeks the PROMIS instrument inquires about physical function in general and levels of fatigue and pain in the past 7 days. Considering most hospitalizations last <7 days, the PROMIS instrument may better reflect the declines associated with the acute illness related to the hospitalization than the SF12 score. Additionally, the discrepancy between the association between hospital‐based GSRH and utilization in our study and the absence, thereof, in Hasan et al. is noteworthy. The difference here may be explained by their use of a 0‐ to 100‐point response scale in contrast to our study's verbally labeled 5‐point scale in the PROMIS instrument. The range of rating scales for survey questions is traditionally governed by the tension between the difficulty with mapping respondents judgment on an excessively large scale on one hand, and the failure of insufficient response options to discriminate between respondents with different underlying judgment on the other.[33] We suspect the former to be a drawback of the unlabeled 100‐point response scale, and conjecture that an association might be found in the Multi‐Center Hospitalist Study data if the responses were grouped into summative categories.
We recognize several limitations in our study. The first is the generalizability of our patient population to others, not insignificantly because of the high proportion of the uninsured (around 70% during the study period) and racial/ethnic minorities among them. Although utilization patterns are clearly affected by socioeconomic status,[34] there may also be differences in the way validated PRO measures are calibrated between patients of public and private healthcare systems.[35] Another limitation is our inability to count utilization events at institutions outside of the CCHHS during our study. However, because the study was conducted prior to Cook County's Medicaid expansion demonstration program as part of the Affordable Care Act,[36] many patients established in our system faced barriers to receiving nonemergency care outside of the CCHHS supporting our assumption that few of our patients were discharged from other hospitals. Causality cannot be established in observational studies. Consequently, high prior‐symptom burden may be associated with utilizations through unmeasured variables. Measures of symptom burden are vulnerable to overendorsement and amplification.[37, 38] Inferences based on statistical significance are affected by sample size, and our conclusions may change if conducted with a larger number of participants. Our response rates were excellent through the survey waves, but we did not achieve perfect follow‐up. Worse levels of PRO responses and higher levels of utilization among censored patients biased our results toward the null. Finally, although we did not find any predominant comorbidities associated with hospital‐based utilizations in our sample, our analyses may be vulnerable to inadequate control for illness severity, which may also have biased our results.
PRO measures are likely to be useful in clinical medicine.[39] But to fully apply the powers of PROs in informing clinically and operationally relevant outcomes, we must actively develop a system for obtaining these measures in routine clinical care. The availability of patient downtime makes hospitalizations conducive to gathering patient‐generated data, and may further enhance patient‐provider communication if survey output was readily available in electronic medical records. Exploring innovative strategies for collecting PROs in the hospital and beyond remains our future work.
Disclosures
Funded by the Agency for Healthcare Research and Quality: R24 HS19481‐01 to support technology implementation. The authors report no conflicts of interest, relevant financial interests, activities, relationships, and affiliations that influenced this work. The first and senior authors had full access to all data and take responsibility for their integrity and the accuracy of the data analysis.
- , , , . Potentially avoidable 30‐day hospital readmissions in medical patients: derivation and validation of a prediction model. JAMA Intern Med. 2013;173:632–638.
- , , , et al. Derivation and validation of an index to predict early death or unplanned readmission after discharge from hospital to the community. CMAJ. 2010;182:551–557.
- , , , . Redefining readmission risk factors for general medicine patients. J Hosp Med. 2011;6:54–60.
- , , , et al. Risk prediction models for hospital readmission: a systematic review. JAMA. 2011;306:1688–1698.
- , , , . Predicting mortality and healthcare utilization with a single question. Health Serv Res. 2005;40:1234–1246.
- , , . Repeated hospitalizations and self‐rated health among the elderly: a multivariate failure time analysis. Am J Epidemiol. 2001;153 3 232–241.
- , , , , , . Screening elders for risk of hospital admission. J Am Geriatr Soc. 1993;41:811–817.
- , , , et al. Baseline quality of life as a predictor of mortality and hospitalization in 5,025 patients with congestive heart failure. SOLVD Investigations. Studies of Left Ventricular Dysfunction Investigators. Am J Cardiol. 1996;78:890–895.
- , , , , . Using quality of life to predict hospitalization and mortality in patients with obstructive lung disease. Chest. 2002;122:429–436.
- , , , . Intraindividual change in SF‐36 in ambulatory clinic primary care patients predicted mortality and hospitalizations. J Clin Epidemiol. 2004;57:277–283.
- , , , et al. Use of health‐related, quality‐of‐life metrics to predict mortality and hospitalizations in community‐dwelling seniors. J Am Geriatr Soc. 2006;54:667–673.
- , , , . Medical outcomes study short form‐36: a consistent and powerful predictor of morbidity and mortality in dialysis patients. Am J Kidney Dis. 2003;41:1286–1292.
- , , , et al. Relationship of depression to increased risk of mortality and rehospitalization in patients with congestive heart failure. Arch Intern Med. 2001;161:1849–1856.
- , , , et al. Depression as a predictor of mortality and hospitalization among hemodialysis patients in the United States and Europe. Kidney Int. 2002;62:199–207.
- , , , , . Health status predicts long‐term outcomes in outpatients with coronary disease. Circulation. 2002;106:43–49.
- , , , et al. Hospital readmission in general medicine patients: a prediction model. J Gen Intern Med. 2010;25:211–219.
- , , , , , . Persistent angina pectoris in ischaemic cardiomyopathy: increased rehospitalization and major adverse cardiac events. Eur J Heart Fail. 2014;16:854–860.
- , , , et al. Relation of dyspnea severity on admission for acute heart failure with outcomes and costs. Am J Cardiol. 2015;115:75–81.
- , , . Two views of self‐rated general health status. Soc Sci Med. 2003;56:203–217.
- , , . Self‐rated health and physical disability in elderly survivors of a major medical event. J Gerontol B Psychol Sci Soc Sci. 1996;51:S96–S104.
- , , . Predicting changes in perceived health status. Am J Public Health. 1984;74:611–614.
- , , , , . Quality of life before and after intensive care. Anaesthesia. 2005;60:322–329.
- , , , , , Trick WE. Health perceptions and symptom burden in primary care: measuring health using audio computer‐assisted self‐interviews [published online ahead of print December 7, 2014]. Qual Life Res. doi: 10.1007/s11136‐014‐0884‐4.
- , , . Adapting a clinical comorbidity index for use with ICD‐9‐CM administrative databases. J Clin Epidemiol. 1992;45:613–619.
- , , , et al. The Memorial Symptom Assessment Scale: an instrument for the evaluation of symptom prevalence, characteristics and distress. Eur J Cancer. 1994;30A:1326–1336.
- , , , , . The Memorial Symptom Assessment Scale short form (MSAS‐SF). Cancer. 2000;89:1162–1171.
- , , , , . Development of physical and mental health summary schores from the Patient‐Reported Outcomes Measurement Information System (PROMIS) global items. Qual Life Res. 2009;18:873–880.
- , , , et al. Improvements in signs and symptoms during hospitalization for acute heart failure follow different patterns and depend on the measurement scales used: an international, prospective registry to evaluate the evolution of measures of disease severity in acute heart failure (MEASURE‐AHF). J Card Fail. 2008;14:777–784.
- , , , . Longitudinal assessment of symptom severity among hospitalized elders diagnosed with cancer, heart failure, and chronic obstructive pulmonary disease. J Hosp Med. 2012;7:567–572.
- , , , . The patient experience and health outcomes. N Engl J Med. 2013;368:201–203.
- , , , . "Quicker and sicker" under Medicare's prospective payment system for hospitals: new evidence on an old issue from a national longitudinal survey. Bull Econ Res. 2011;63:1–27.
- Agency for Healthcare Research and Quality. Asthma care quality improvement measures. Available at: http://www.ahrq.gov/professionals/quality‐patient‐safety/quality‐resources/tools/asthmaqual/asthmacare/appendix‐d.html. Accessed January 30, 2015.
- , , . The Psychology of Survey Response. New York, NY: Cambridge University Press; 2000.
- , , , et al. Health care for children and youth in the United States: annual report on patterns of coverage, utilization, quality, and expenditures by income. Ambul Pediatr. 2005;5:6–44.
- , , , et al. Levels of symptom burden during chemotherapy for advanced lung cancer: differences between public hospitals and a tertiary cancer center. J Clin Oncol. 2011;29:2859–2865.
- . Profiles of Medicaid outreach and enrollment strategies: the Cook County early expansion initiative. The Henry J. Kaiser Family Foundation. Available at: http://kff.org/medicaid/issue-brief/profiles-of-medicaid-outreach-and-enrollment-strategies-the-cook-county-early-expansion-initiative. Published April 7, 2014. Accessed December 2, 2014.
- , , . A primary care perspective on prevailing assumptions about persistent medically unexplained physical symptoms. Int J Psychiatry Med. 2002;32:125–140.
- , , , . Symptom burden and comorbidities impact the consistency of responses on patient‐reported functional outcomes. Arch Phys Med Rehabil. 2014;95:79–86.
- , , , et al. Implementing patient‐reported outcomes assessment in clinical practice: a review of the options and considerations. Qual Life Res. 2012;21:1305–1314.
Despite widespread efforts to predict 30‐day rehospitalizations among discharged general medical patients,[1, 2, 3] not many strategies have incorporated patient‐reported outcome (PRO) measures in predictive models.[4] This despite the many longitudinal studies of the ambulatory population that demonstrate the higher likelihood of hospitalizations among those who score poorly on General Self‐Rated Health (GSRH),[5, 6, 7] baseline or declining Health‐Related Quality of Life,[8, 9, 10, 11, 12] psychological symptoms,[13, 14] and physical symptoms assessments.[15] One of the few existing studies that included PRO measures in 30‐day readmission models showed the predictive value of the 12‐item short form (SF12) Physical Component Score.[16] Others showed that persistent symptoms were associated with readmissions in patients with heart disease.[17, 18]
The paucity of efforts to connect PRO measures to utilization may be due to the limited availability of these measures in routine clinical records and the incomplete knowledge about how various PRO measures may fluctuate during episodes of acute illnesses and their treatments during hospitalizations. Health perception measures reflect both enduring features like self‐concept as well as dynamic features like a person's immediate health status.[19] As such, GSRH reflects the presence of chronic illnesses but is also responsive to acute events.[20, 21] Similarly, Health‐Related Quality of Life measures are dynamic as they decline around episodes of acute illness but are stable over a longer time window in their tendency to recover.[22] We do not know how fluctuations in measures of symptom burden, perceived health, and quality of life around the hospital‐to‐home transition may differentially inform readmission risk. Using a longitudinal cohort study, we addressed 2 questions: (1) How do PRO measures change when measured serially during the hospital‐to‐home transition? (2) How does the relative timing of each PRO measure variably inform the risk of subsequent utilization events including hospital readmissions?
METHODS
We conducted a longitudinal cohort study using data originally collected for a trial (
The following instruments were administered at each interview. The physical symptom severity portion of the Memorial Symptom Assessment Scale (MSAS) solicited the severity rank (none/a little bit/somewhat/quite a bit/very much) of 17 physical symptoms in the last week; the score was calculated by averaging the severity rank of the 12 most common symptom in the sample.[25, 26] The Patient Reported Outcomes Measurement Information System (PROMIS) Global Health Short Form is an instrument assessing GSRH (1 item), Social Activities (1 item), Global Physical Health (4 items), and Global Mental Health (4 items including a single‐item quality‐of‐life measure). Fatigue and pain for Global Physical Health, and emotional health for Global Mental Health were assessed over the past 7 days. Each of the 2 Global Health scores was standardized to a national mean of 50 and standard deviation of 10.[27]
The rate of survey completion at each follow‐up was calculated. Characteristics of participants were tabulated. Characteristics of patients censored prior to study completion were compared with patients with complete data. Box plots for MSAS physical symptom severity, and Global Physical and Mental Health scores were constructed to illustrate the comparisons of the mean scores between each consecutive survey period using t tests assuming unequal variance. A similar box plot of GSRH illustrated the comparison of the median score between consecutive surveys using the rank sum test. Hospital‐based utilization events were defined as either an emergency department visit or hospitalization at 1 of the 2 hospitals of the Cook County Health & Hospitals System (CCHHS). After accounting for patient data censored due to death (date reported by family) or withdrawal from study, Kaplan‐Meier curves showing time to first hospital‐based utilization event during each interval between surveys were drawn separately for above‐ and below‐median MSAS, Global Physical and Mental Health scores, and for poor or fair versus good, very good, or excellent GSRH assessment. The null hypothesis that the survivor functions were equal between the better and worse median quantiles or GSRH categories was tested using the log‐rank test at 14 and 30 days from survey completion. Hazard ratios for time to first utilization event within 14 days of each survey were calculated for the MSAS score, Global Physical and Mental Health as continuous variables, and GSRH response categories relative to poor using bivariate and multivariate Cox proportional hazard equations. Multivariate models incorporated the following 5 covariates: at least 1 utilization event during the study period prior to the survey, Charlson score, age, gender, and race/ethnicity category. Likelihood ratio statistics were calculated to test the hypothesis that the model including the PRO measure and covariates predicted the outcome equally well compared to the nested model with only covariates. We used the traditional threshold of .05 when reporting significance. All analyses were performed in Stata 13 (StataCorp, College Station, TX). The methods for patient consent, data collection, analyses, and reporting were reviewed and approved by the CCHHS institutional review board.
RESULTS
A total of 196 patients completed the initial survey. The completion rates were 98%, 90%, and 88% for the 30‐, 90‐, and 180‐day follow‐up surveys, respectively. As shown in Table 1, participants average age was 52 years, and about half were women. The majority was non‐Hispanic black, and 21% preferred to complete the survey in Spanish. Diabetes, congestive heart failure, cancer, and chronic pulmonary disease were each prevalent in at least one‐fifth of our patient cohort. Demographic characteristics were similar between the 160 patients who completed all 3 follow‐up surveys and the 36 who missed at least 1 follow‐up survey. Among the latter group, 1 withdrew at 30 days, 1 withdrew and 4 had died at 90 days, and 1 withdrew and 9 had died at 180 days.
| |
| Age, y, mean (SD) | 52 (10) |
| Female, n (%) | 100 (51) |
| Race/ethnicity category, n (%) | |
| Non‐Hispanic black | 117 (60) |
| Hispanic | 52 (27) |
| Non‐Hispanic white | 20 (10) |
| Other | 6 (3) |
| Language, n (%) | |
| English | 155 (79) |
| Spanish | 41 (21) |
| Charlson Comorbidity Index, median (range) | 1 (09) |
| Charlson comorbidities, n (%) | |
| Diabetes | 71 (36) |
| Congestive heart failure | 52 (27) |
| Cancer (with and without metastases) | 43 (22) |
| Chronic pulmonary disease | 40 (20) |
| Myocardial infarction | 17 (9) |
| Renal disease | 11 (6) |
Figure 1 shows a timeline of the follow‐up surveys and utilization events in the form of overlapping histograms. The majority of 30‐day follow‐up questionnaires were completed earlier than targeted, at a median of 17 (interquartile range [IQR] 16, 20) days after discharge. Similarly, questionnaires targeted for 90 and 180 days were completed at medians of 78 (IQR 7684) and 167 (IQR 166169) days from discharge. Fifty‐four (28%) patients experienced a first utilization event in the first 30 days following discharge. During the 60‐, 90‐, and 30‐day intervals after the first, second, and third follow‐up surveys, respectively, 63 (33%), 54 (31%), and 16 (9%) patients experienced a first utilization event.
A significant improvement in MSAS physical symptom severity was detected between the hospitalization and the 30‐day follow‐up (Figure 2A). Although the mean Global Physical Health score was below the national mean of 50 at every survey period, a similar improvement in the measure was noted between the hospitalization and the 30‐day follow‐up (Figure 2B). The mean Global Mental Health score was also below the national mean but remained stable throughout the study (Figure 2C). The median GSRH was stable at 2 (IQR 23) at every survey wave (Figure 2D). Of note, compared to patients who completed all 3 follow‐up surveys, patients who missed at least 1 follow‐up reported higher MSAS score (1.5 vs 1.8, P=0.03), lower Global Physical Health (36.1 vs 33.5, P=0.09), and lower Global Mental Health (44.7 vs 41.0, P=0.03) during their hospitalization. In addition, patients with complete data experienced an average of 1.2 utilization events during the study, whereas those with missing data experienced an average of 2.1 utilization events (P=0.03).
The MSAS physical symptom severity and Global Physical Health scores from the index hospitalizations did not identify patients with a first utilization event within 30 days. However, patients with poor Global Mental Health and GSRH in the hospital were more likely to experience a utilization event within 14 days of discharge (Figure 3). During the postdischarge period, patients scoring poorly on each of the PRO measures trended toward a greater risk of an early utilization event, but the association between utilization and MSAS was most consistently significant (Figure 3A). In general, the associations with MSAS, Global Physical Health, and GSRH were stronger with the risk of utilization events within 14 days than within 30 days (Figure 3A,B,D). The Global Mental Health score was not associated with a subsequent utilization when measured during the 180‐day postdischarge period.
As shown in Table 2, Cox proportional hazard models incorporating covariates preserved most of the significant associations seen in the unadjusted analyses. Global Mental Health and good relative to poor GSRH obtained during the hospitalization remained significant. MSAS obtained at each postdischarge follow‐up trended positively with utilization and was statistically significant at 90 and 180 days. Global Physical Health obtained at each postdischarge follow‐up similarly trended negatively with utilization and was significant at 180 days. Each multivariate model incorporating a PRO measure with a significant coefficient contributed to better fit of the predictive model compared to the nested model without the PRO measure.
| Unadjusted Hazard Ratio | P | Adjusted Hazard Ratio* | P | Likelihood Ratio | P | |
|---|---|---|---|---|---|---|
| ||||||
| Hospital discharge | ||||||
| MSAS | 1.47 | 0.11 | 1.38 | 0.19 | 1.65 | 0.20 |
| Global Physical Health | 0.96 | 0.10 | 0.96 | 0.13 | 2.29 | 0.13 |
| Global Mental Health | 0.96 | 0.05 | 0.96 | 0.05 | 4.05 | 0.04 |
| GSRH | ||||||
| Fair | 1.09 | 0.85 | 1.26 | 0.61 | 12.27 | 0.02 |
| Good | 0.24 | 0.04 | 0.23 | 0.03 | ||
| Very good | 1.09 | 0.90 | 1.40 | 0.63 | ||
| Excellent | NC | NS | NC | NS | ||
| 30 days | ||||||
| MSAS | 1.54 | 0.07 | 1.40 | 0.20 | 1.57 | 0.21 |
| Global Physical Health | 0.96 | 0.08 | 0.97 | 0.24 | 1.42 | 0.23 |
| Global Mental Health | 0.98 | 0.42 | 0.99 | 0.62 | 0.25 | 0.62 |
| GSRH | ||||||
| Fair | 0.92 | 0.86 | 1.19 | 0.72 | 8.85 | 0.07 |
| Good | 0.85 | 0.31 | 0.94 | 0.91 | ||
| Very good | NC | NS | NC | NS | ||
| Excellent | 2.69 | 0.36 | 6.28 | 0.11 | ||
| 90 days | ||||||
| MSAS | 2.23 | 0.03 | 2.20 | 0.05 | 3.79 | 0.05 |
| Global Physical Health | 0.94 | 0.07 | 0.95 | 0.11 | 2.75 | 0.10 |
| Global Mental Health | 0.96 | 0.20 | 0.95 | 0.15 | 2.11 | 0.15 |
| GSRH | ||||||
| Fair | 0.75 | 0.63 | 0.67 | 0.53 | 6.67 | 0.15 |
| Good | 0.32 | 0.19 | 0.28 | 0.15 | ||
| Very good | NC | NS | NC | NS | ||
| Excellent | 2.12 | 0.50 | 2.20 | 0.49 | ||
| 180 days | ||||||
| MSAS | 2.39 | 0.03 | 3.51 | 0.01 | 7.04 | 0.01 |
| Global Physical Health | 0.93 | 0.06 | 0.93 | 0.03 | 4.61 | 0.03 |
| Global Mental Health | 0.97 | 0.38 | 0.96 | 0.33 | 0.95 | 0.33 |
| GSRH | ||||||
| Fair | 0.98 | 0.98 | 0.64 | 0.55 | 7.13 | 0.13 |
| Good | 0.33 | 0.23 | 0.20 | 0.09 | ||
| Very good | NC | NS | NC | NS | ||
| Excellent | NC | NS | NC | NS | ||
DISCUSSION
In this longitudinal cohort study, patients, on average, reported relatively severe symptoms, low PROMIS Global Physical and Mental Health scores, and poor GSRH during the inpatient stay in an urban safety‐net hospital. Symptom severity and Global Physical Health improved, on average, by 30 days before stabilizing, but their poor levels in the hospital did not predict 30‐day hospital‐based utilization events. On the other hand, Global Mental Health and GSRH were stable through hospitalizations, and patients scoring poorly on these measures were at greater risk of utilization events within 14 days of discharge. PRO measures obtained during the 180‐day postdischarge period trended toward distinguishing populations with greater baseline risk of proximate utilization events. However, MSAS physical symptom severity and Global Physical Health were more consistently predictive of these events at statistically significant levels compared to Global Mental Health and GSRH in our relatively small sample of patients. Each of these measures selectively improved the fit‐of‐risk prediction models for hospital‐based utilization.
Some of the heterogeneity in readmission risk is explained by differences in PRO measures. Although the MSAS score and Global Physical Health assessment were reliable predictors of utilization when measured in ambulatory settings, they were less discriminating during acute hospitalizations when everyone, on average, reported severe symptoms and poor function. Our results were consistent with other studies that demonstrated the fairly rapid recovery in symptoms that follow hospitalizations,[28, 29] and these measures may become informative of utilization risk as early as 2 weeks postdischarge. GSRH and Global Mental Health (a measure of health‐related quality of life) only predicted utilizations immediately at hospital discharge. As multidimensional measures that reflect physical, social, and emotional capacity, these measures may indicate vulnerabilities in patients least able to handle the stresses of the early postdischarge period.
There is growing momentum around collecting PRO measures in routine clinical care as quality indicators that capture patient‐centered concerns.[30] Our study explored a novel application of these measures whose routine collection will likely proliferate, not solely for the purpose of helping healthcare systems identify patients at risk of unplanned resource utilization. Although multidimensional PRO measures seldom reflect conditions directly modifiable by simple interventions, we believe that the association between physical symptom burden and utilization in our data reveals a possible target for practice improvement. Hospitalists have contributed enormously to shorter lengths of stay that risk sicker and quicker discharges.[31] To mitigate its potential side effects on symptom management, a discharge plan that acknowledges physical symptoms that sometimes persist or recur beyond the hospitalization may be appropriate. This may be accomplished by ensuring that acute symptoms are resolving, giving clear instructions for symptom management at home, as now the standard of care for conditions like asthma,[32] and explicitly communicating the presence of residual symptoms to providers entrusted with continuity care. As an effective feedback measure that can drive continuous quality improvement, we believe that a technology‐based surveillance strategy that spans both the inpatient and outpatient domains is necessary.[23]
There are some notable similarities and differences between the results of our study and a recent hospital‐based study of PRO measures that used data from the Multi‐Center Hospitalist Project.[16] The Physical Component Score of the SF12 is similar to the PROMIS Global Physical Health score in that both incorporate measures of physical function, perceived health, pain, and energy level. Curiously, the SF12 Physical Component Score, but not the PROMIS Global Physical Health score, was associated with 30‐day rehospitalizations. An important difference between the measures is where the SF12 asks about limitations during the past 4 weeks the PROMIS instrument inquires about physical function in general and levels of fatigue and pain in the past 7 days. Considering most hospitalizations last <7 days, the PROMIS instrument may better reflect the declines associated with the acute illness related to the hospitalization than the SF12 score. Additionally, the discrepancy between the association between hospital‐based GSRH and utilization in our study and the absence, thereof, in Hasan et al. is noteworthy. The difference here may be explained by their use of a 0‐ to 100‐point response scale in contrast to our study's verbally labeled 5‐point scale in the PROMIS instrument. The range of rating scales for survey questions is traditionally governed by the tension between the difficulty with mapping respondents judgment on an excessively large scale on one hand, and the failure of insufficient response options to discriminate between respondents with different underlying judgment on the other.[33] We suspect the former to be a drawback of the unlabeled 100‐point response scale, and conjecture that an association might be found in the Multi‐Center Hospitalist Study data if the responses were grouped into summative categories.
We recognize several limitations in our study. The first is the generalizability of our patient population to others, not insignificantly because of the high proportion of the uninsured (around 70% during the study period) and racial/ethnic minorities among them. Although utilization patterns are clearly affected by socioeconomic status,[34] there may also be differences in the way validated PRO measures are calibrated between patients of public and private healthcare systems.[35] Another limitation is our inability to count utilization events at institutions outside of the CCHHS during our study. However, because the study was conducted prior to Cook County's Medicaid expansion demonstration program as part of the Affordable Care Act,[36] many patients established in our system faced barriers to receiving nonemergency care outside of the CCHHS supporting our assumption that few of our patients were discharged from other hospitals. Causality cannot be established in observational studies. Consequently, high prior‐symptom burden may be associated with utilizations through unmeasured variables. Measures of symptom burden are vulnerable to overendorsement and amplification.[37, 38] Inferences based on statistical significance are affected by sample size, and our conclusions may change if conducted with a larger number of participants. Our response rates were excellent through the survey waves, but we did not achieve perfect follow‐up. Worse levels of PRO responses and higher levels of utilization among censored patients biased our results toward the null. Finally, although we did not find any predominant comorbidities associated with hospital‐based utilizations in our sample, our analyses may be vulnerable to inadequate control for illness severity, which may also have biased our results.
PRO measures are likely to be useful in clinical medicine.[39] But to fully apply the powers of PROs in informing clinically and operationally relevant outcomes, we must actively develop a system for obtaining these measures in routine clinical care. The availability of patient downtime makes hospitalizations conducive to gathering patient‐generated data, and may further enhance patient‐provider communication if survey output was readily available in electronic medical records. Exploring innovative strategies for collecting PROs in the hospital and beyond remains our future work.
Disclosures
Funded by the Agency for Healthcare Research and Quality: R24 HS19481‐01 to support technology implementation. The authors report no conflicts of interest, relevant financial interests, activities, relationships, and affiliations that influenced this work. The first and senior authors had full access to all data and take responsibility for their integrity and the accuracy of the data analysis.
- , , , . Potentially avoidable 30‐day hospital readmissions in medical patients: derivation and validation of a prediction model. JAMA Intern Med. 2013;173:632–638.
- , , , et al. Derivation and validation of an index to predict early death or unplanned readmission after discharge from hospital to the community. CMAJ. 2010;182:551–557.
- , , , . Redefining readmission risk factors for general medicine patients. J Hosp Med. 2011;6:54–60.
- , , , et al. Risk prediction models for hospital readmission: a systematic review. JAMA. 2011;306:1688–1698.
- , , , . Predicting mortality and healthcare utilization with a single question. Health Serv Res. 2005;40:1234–1246.
- , , . Repeated hospitalizations and self‐rated health among the elderly: a multivariate failure time analysis. Am J Epidemiol. 2001;153 3 232–241.
- , , , , , . Screening elders for risk of hospital admission. J Am Geriatr Soc. 1993;41:811–817.
- , , , et al. Baseline quality of life as a predictor of mortality and hospitalization in 5,025 patients with congestive heart failure. SOLVD Investigations. Studies of Left Ventricular Dysfunction Investigators. Am J Cardiol. 1996;78:890–895.
- , , , , . Using quality of life to predict hospitalization and mortality in patients with obstructive lung disease. Chest. 2002;122:429–436.
- , , , . Intraindividual change in SF‐36 in ambulatory clinic primary care patients predicted mortality and hospitalizations. J Clin Epidemiol. 2004;57:277–283.
- , , , et al. Use of health‐related, quality‐of‐life metrics to predict mortality and hospitalizations in community‐dwelling seniors. J Am Geriatr Soc. 2006;54:667–673.
- , , , . Medical outcomes study short form‐36: a consistent and powerful predictor of morbidity and mortality in dialysis patients. Am J Kidney Dis. 2003;41:1286–1292.
- , , , et al. Relationship of depression to increased risk of mortality and rehospitalization in patients with congestive heart failure. Arch Intern Med. 2001;161:1849–1856.
- , , , et al. Depression as a predictor of mortality and hospitalization among hemodialysis patients in the United States and Europe. Kidney Int. 2002;62:199–207.
- , , , , . Health status predicts long‐term outcomes in outpatients with coronary disease. Circulation. 2002;106:43–49.
- , , , et al. Hospital readmission in general medicine patients: a prediction model. J Gen Intern Med. 2010;25:211–219.
- , , , , , . Persistent angina pectoris in ischaemic cardiomyopathy: increased rehospitalization and major adverse cardiac events. Eur J Heart Fail. 2014;16:854–860.
- , , , et al. Relation of dyspnea severity on admission for acute heart failure with outcomes and costs. Am J Cardiol. 2015;115:75–81.
- , , . Two views of self‐rated general health status. Soc Sci Med. 2003;56:203–217.
- , , . Self‐rated health and physical disability in elderly survivors of a major medical event. J Gerontol B Psychol Sci Soc Sci. 1996;51:S96–S104.
- , , . Predicting changes in perceived health status. Am J Public Health. 1984;74:611–614.
- , , , , . Quality of life before and after intensive care. Anaesthesia. 2005;60:322–329.
- , , , , , Trick WE. Health perceptions and symptom burden in primary care: measuring health using audio computer‐assisted self‐interviews [published online ahead of print December 7, 2014]. Qual Life Res. doi: 10.1007/s11136‐014‐0884‐4.
- , , . Adapting a clinical comorbidity index for use with ICD‐9‐CM administrative databases. J Clin Epidemiol. 1992;45:613–619.
- , , , et al. The Memorial Symptom Assessment Scale: an instrument for the evaluation of symptom prevalence, characteristics and distress. Eur J Cancer. 1994;30A:1326–1336.
- , , , , . The Memorial Symptom Assessment Scale short form (MSAS‐SF). Cancer. 2000;89:1162–1171.
- , , , , . Development of physical and mental health summary schores from the Patient‐Reported Outcomes Measurement Information System (PROMIS) global items. Qual Life Res. 2009;18:873–880.
- , , , et al. Improvements in signs and symptoms during hospitalization for acute heart failure follow different patterns and depend on the measurement scales used: an international, prospective registry to evaluate the evolution of measures of disease severity in acute heart failure (MEASURE‐AHF). J Card Fail. 2008;14:777–784.
- , , , . Longitudinal assessment of symptom severity among hospitalized elders diagnosed with cancer, heart failure, and chronic obstructive pulmonary disease. J Hosp Med. 2012;7:567–572.
- , , , . The patient experience and health outcomes. N Engl J Med. 2013;368:201–203.
- , , , . "Quicker and sicker" under Medicare's prospective payment system for hospitals: new evidence on an old issue from a national longitudinal survey. Bull Econ Res. 2011;63:1–27.
- Agency for Healthcare Research and Quality. Asthma care quality improvement measures. Available at: http://www.ahrq.gov/professionals/quality‐patient‐safety/quality‐resources/tools/asthmaqual/asthmacare/appendix‐d.html. Accessed January 30, 2015.
- , , . The Psychology of Survey Response. New York, NY: Cambridge University Press; 2000.
- , , , et al. Health care for children and youth in the United States: annual report on patterns of coverage, utilization, quality, and expenditures by income. Ambul Pediatr. 2005;5:6–44.
- , , , et al. Levels of symptom burden during chemotherapy for advanced lung cancer: differences between public hospitals and a tertiary cancer center. J Clin Oncol. 2011;29:2859–2865.
- . Profiles of Medicaid outreach and enrollment strategies: the Cook County early expansion initiative. The Henry J. Kaiser Family Foundation. Available at: http://kff.org/medicaid/issue-brief/profiles-of-medicaid-outreach-and-enrollment-strategies-the-cook-county-early-expansion-initiative. Published April 7, 2014. Accessed December 2, 2014.
- , , . A primary care perspective on prevailing assumptions about persistent medically unexplained physical symptoms. Int J Psychiatry Med. 2002;32:125–140.
- , , , . Symptom burden and comorbidities impact the consistency of responses on patient‐reported functional outcomes. Arch Phys Med Rehabil. 2014;95:79–86.
- , , , et al. Implementing patient‐reported outcomes assessment in clinical practice: a review of the options and considerations. Qual Life Res. 2012;21:1305–1314.
© 2015 Society of Hospital Medicine