User login
Patient-level exclusions from mHealth in a safety-net health system
Interest in mHealth—the use of mobile communication devices for clinical and public health—has exploded among clinicians and researchers for its potential to efficiently improve patient health. Recent studies have used mHealth’s asynchronous receptive and expressive communication functions in interventions targeted to managing care transitions and hospital readmissions.1-3 We also recently published on improved readmission risk assessments using postdischarge measures of patient reported outcomes, which could be collected through mobile devices. 4 But persistent disparities in access to5 and engagement with6 smartphones may threaten validity and equity when mHealth strategies do not fully address its own limitations.
Disparities introduced by uneven access to technology are well known, but the rapid, albeit belated, adoption of mobile devices by racial minority groups in the United States has allowed authors of recent thoughtful publications to recast mHealth as itself offering solutions to the disparities’ problem.7,8 Others have cautioned the emergence of disparities along domains other than race, such as low literacy and limited English proficiency (LEP).9 In this paper, we assessed the impact of inadequate reading health literacy (IRHL) and LEP on factors related to access and engagement with mHealth. We conducted our study among urban low-income adults in whom IRHL and LEP are common.
METHODS
We surveyed patients in a large public safety-net health system serving 132 municipalities, including the city of Chicago, in northeastern Illinois. In 2015, nearly 90% of patients were racial-ethnic minorities with more than one-third insured by Medicaid and another one-third uninsured. We sampled adult inpatients and outpatients separately by nonselectively approaching patients in November 2015 to complete an in-person questionnaire in a 464-bed hospital and in 2 primary-care clinics. All inpatients occupied a nonisolation room in a general medical-surgical ward that had been sampled for data collection for that day in 9-day cycles with 8 other similar units. All outpatients in the clinic waiting areas were approached on consecutive days until a predetermined recruitment target was met. Each participant was surveyed once in his/her preferred language (English or Spanish), was 18 years and older, consented verbally, and received no compensation. Sample size provided 80% power to detect a device ownership rate of 50% in an evenly allocated low literacy population compared to a reference rate of 66% assuming a 2-sided α of 0.05 using the Fisher exact test.
The 18-item questionnaire was informed by constructs addressed in the 2015 Pew Research Center smartphone survey.10 However, in addition to device ownership, we inquired about device capabilities, service-plan details, service interruptions due to difficulty paying bills in the previous year, home-Internet access, an active e-mail account, and self-assigned demographics. Self-reported reading health literacy,11 more directly measured than e-health literacy, was screened using a parsimonious instrument validated as a dichotomized measure.12 Instruments in English and Spanish were tested for appropriate and comprehensible word choices and syntax through pilot testing. We inferred LEP among patients preferring to complete the survey in Spanish based on our familiarity with the population. We defined any Internet access as having a mobile data-service plan or having home-Internet access. In addition, we inquired about primary insurance provider and offered Medicaid patients an informational brochure about the federal Lifeline Program (https://www.fcc.gov/lifeline) that subsidizes text-messaging-enabled cellular telephone service for low-income patients. Notably, we assessed engagement by asking about the extent of patients’ interest in “new ways of communicating with your doctor, clinic, or pharmacy using” text, e-mail, or mobile apps with a 5-level response scale ranging from “not at all interested” to “very interested”.
Participant characteristics were confirmed to be similar to the Cook County Health and Hospitals System patient population in 2015 with regards to age, gender, and race/ethnicity. We calculated unadjusted and adjusted odds ratios for IRHL and LEP’s association with each dependent measure of access (to smartphone, Internet, or e-mail) and engagement (using text messaging, e-mail, or mobile apps) controlling for age, gender, primary payer, recruitment location, IRHL, and LEP. Because we oversampled inpatients, we estimated sampling-weight-adjusted proportions and 95% confidence intervals (CI) of the entire CCHHS patient population with access to smartphone, data/text plan, non-prepaid plan, and service interruptions using STATA v13 (StataCorp LP, College Station Texas). The project received a waiver upon review by the local Institutional Review Board.
RESULTS
Participation rate was 65% (302/464). Differences in patients by site are shown in Table 1. IRHL was more frequent and LEP less frequent among hospitalized patients. As shown in Table 2, patients with IRHL were less likely to have any Internet access, to have an active e-mail account, and to be interested in using e-mail for healthcare communications. Patients with LEP were less likely than English speakers to be interested in using mobile apps. Inpatients were less likely than outpatients to be interested in text messaging for healthcare communications.

The estimated proportion (95% CI) of the health system’s patients owning a text-enabled mobile device was 87% (75%-94%) and an Internet-enabled mobile device was 64% (47%-78%). The proportion with no data service interruptions in the previous year was 40% (31%-50%).
DISCUSSION
In this cross-section of urban low-income adult patients, IRHL and LEP were factors associated with potential disparities introduced by mHealth. Even as access to smartphones becomes ubiquitous, lagging access to Internet and e-mail among low literacy patients, and low levels of technology engagement for healthcare communications among patients with IRHL or LEP, underscore concerns about equity in health systems’ adoption of mHealth strategies. Hospitalized patients were found to have diminished engagement with mHealth independent of IRHL and LEP.

Regarding engagement, significantly fewer patients with IRHL or LEP were interested in using technology for healthcare communications. Our finding suggests that health disparities already associated with these conditions13 may not be reduced by mobile device outreach alone and may even be worsened by it. Touch screens, audio-enabled questionnaires, and language translation engines are innovations that may be helpful to mitigate IRHL and LEP, but evidence is scarce. Privacy and security concerns, and lack of experience with technology, may also lower engagement. A contemporaneous study found lower apps’ usage among Latinos, also suggesting that language concordance between apps, their source, and targeted users is important.14 Low-tech solutions involving mobile telephone or even lower tech in-person communications targeted to the estimated 26% of the US population with low literacy15 and 20% with LEP16 may be practical stopgap measures. Even as disparities in access to technology across race-ethnicity are diminishing,10 equity across poverty levels, low levels of education, cultural norms, and disabilities may be more challenging to overcome. Our assessment indicates that large exclusions of a safety-net population in 2015 are a legitimate concern in communication strategies that rely too heavily on mHealth. These findings underscore the CONSORT-EHEALTH recommendation that investigators report web-based recruitment strategies and data-collection methods comprehensively.17
Regarding access, our estimates suggest that historical disparities in smartphone ownership are diminishing, but access to Internet capabilities may still be lower among the urban poor compared to the nation as a whole. The Pew Research Center found that 64% of Americans owned a smartphone in 2015 (respondents defined smartphone).10 In comparison, 87% (95% CI, 75%, 94%) of our study participants owned a text-enabled mobile device and 64% (47%, 78%) owned an Internet-enabled mobile device. However, the 40% (31%, 50%) of our safety-net population with an uninterrupted data plan over the previous year may be lower than the 50% of Americans reporting uninterrupted data plans over their lifetime.10 The impact of expense-related data plan interruptions is magnified by the 40% of our study population—compared to 15% of Americans—who are dependent on mobile devices for Internet access.10 The association between Internet connectivity and literacy evokes multiple bidirectional pathways yet to be elucidated. But if mHealth can reduce health disparities, closing the gap in device ownership is only a partial accomplishment, and future work also needs to expand Internet connectivity to allow literacy-enhancing and literacy-naïve technologies to flourish.
This study has limitations. Our study population was a consecutive sample and participation rate was less than 100%. However, we recruited participants into the study the way we may also have approached patients to introduce mHealth options in our clinical settings. Our sampling method proved adequate for our primary goal to explain differences in technology access and engagement using regression analysis. Although our patient population may not directly generalize to many healthcare systems, including other safety-net systems serving regions with variable technology uptake,18 our findings reflect the capacities and the preferences of the most disadvantaged segments of urban populations. We systematically excluded LEP non-Spanish speakers, but they consisted of less than 5% of inpatients and no outpatients. We did not assess current technology use. Finally, as discussed earlier, access and use of new technologies change rapidly and frequent updates are necessary.
mHealth is a promising tool because it may increase healthcare access, improve care quality, and promote research. All these potential benefits will be obtained with accompanying efforts to reduce healthcare disparities, especially where some technologies themselves are exclusionary.
Disclosures
The authors report no financial conflicts of interest.
1. Khosravi P, Ghapanchi AH. Investigating the effectiveness of technologies applied to assist seniors: a systematic literature review. Int J Med Inform. 2016;85:17-26. PubMed
2. Feltner C, Jones CD, Cené CW, et al. Transitional care interventions to prevent readmissions for persons with heart failure: a systematic review and meta-analysis. Ann Intern Med. 2014;160:774-784. PubMed
3. Prieto-Centurion V, Gussin HA, Rolle AJ, Krishnan JA. Chronic obstructive pulmonary disease readmissions at minority-serving institutions. Ann Am Thorac Soc. 2013;10:680-684. PubMed
4. Hinami K, Smith J, Deamant CD, BuBeshter K, Trick WE. When do patient-reported outcome measures inform readmission risk? J Hosp Med. 2015;10:294-300. PubMed
5. Gibbons MC. A historical overview of health disparities and the potential of eHealth solutions. J Med Internet Res. 2005;7:e50. PubMed
6. Nelson LA, Mulvaney SA, Gebretsadik T, Ho YX, Johnson KB, Osborn CY. Disparities in the use of a mHealth medication adherence promotion intervention for low-income adults with type2 diabetes. J Am Med Inform Assoc. 2016;23:12-18. PubMed
7. Martin T. Assessing mHealth: opportunities and barriers to patient engagement. J Health Care Poor Underserved. 2012;23:935-941. PubMed
8. Horn IB, Mendoza FS. Reframing the disparities agenda: a time to rethink, a time to focus. Acad Pediatr. 2013;14:115-116. PubMed
9. Viswanath K, Nagler RH, Bigman-Galimore CA, McCauley MP, Jung M, Ramanadhan S. The communications revolution and health inequalities in the 21st century: implications for cancer control. Cancer Epidemiol, BiomarkersPrev. 2012;21:1701-1708. PubMed
10. Pew Research Center. The Smartphone Difference. Pew Research Center; April 2015. Available at: http://www.pewinternet.org/2015/04/01/us-smartphone-use-in-2015/. Accessed January 12, 2017.
11. Baker DW. The meaning and measure of health literacy. J Gen Intern Med. 2011;21:878-883. PubMed
12. Morris NS, MacLean CD, Chew LD, Littenberg B. The single item literacy screener: evalution of a brief instrument to identify limited reading ability. BMC Fam Pract. 2006;7:21. PubMed
13. Sentell T, Braun K. Low health literacy, limited English proficiency, and health status in Asians, Latinos, and other racial/ethnic groups in California. J Health Commun. 2012;17:82-99. PubMed
14. Arora S, Ford K, Terp S, et al. Describing the evolution of mobile technology usage for Latino patients and comparing findings to national mHealth estimates. J Am Med Inform Assoc. 2016;23:979-983. PubMed
15. Paasche-Orlow MK, Parker RM, Gazmararian JA, Nielsen-Bohlman LT, Rudd RR. The prevalence of limited health literacy. J Gen Intern Med. 2005;20:175-184. PubMed
16. US Census Bureau. Detailed languages spoken at home and ability to speak English for the population 5 years and over: 2009-2013. Published 2015. Available at: http://www.census.gov/data/tables/2013/demo/2009-2013-lang-tables.html. Accessed March 31, 2016.
17. Eysenbach G, CONSORT-EHEALTH Group. CONSORT-EHEALTH: improving and standardizing evaluation reports of Web-based and mobile health intervention. J Med Internet Res. 2011;13:e126. PubMed
18. Schickedanz A, Huang D, Lopex A, et al. Access, interest, and attitudes toward electronic communication for health care among patients in the medical safety net. J Gen Intern Med. 2013;28:914-920. PubMed
Interest in mHealth—the use of mobile communication devices for clinical and public health—has exploded among clinicians and researchers for its potential to efficiently improve patient health. Recent studies have used mHealth’s asynchronous receptive and expressive communication functions in interventions targeted to managing care transitions and hospital readmissions.1-3 We also recently published on improved readmission risk assessments using postdischarge measures of patient reported outcomes, which could be collected through mobile devices. 4 But persistent disparities in access to5 and engagement with6 smartphones may threaten validity and equity when mHealth strategies do not fully address its own limitations.
Disparities introduced by uneven access to technology are well known, but the rapid, albeit belated, adoption of mobile devices by racial minority groups in the United States has allowed authors of recent thoughtful publications to recast mHealth as itself offering solutions to the disparities’ problem.7,8 Others have cautioned the emergence of disparities along domains other than race, such as low literacy and limited English proficiency (LEP).9 In this paper, we assessed the impact of inadequate reading health literacy (IRHL) and LEP on factors related to access and engagement with mHealth. We conducted our study among urban low-income adults in whom IRHL and LEP are common.
METHODS
We surveyed patients in a large public safety-net health system serving 132 municipalities, including the city of Chicago, in northeastern Illinois. In 2015, nearly 90% of patients were racial-ethnic minorities with more than one-third insured by Medicaid and another one-third uninsured. We sampled adult inpatients and outpatients separately by nonselectively approaching patients in November 2015 to complete an in-person questionnaire in a 464-bed hospital and in 2 primary-care clinics. All inpatients occupied a nonisolation room in a general medical-surgical ward that had been sampled for data collection for that day in 9-day cycles with 8 other similar units. All outpatients in the clinic waiting areas were approached on consecutive days until a predetermined recruitment target was met. Each participant was surveyed once in his/her preferred language (English or Spanish), was 18 years and older, consented verbally, and received no compensation. Sample size provided 80% power to detect a device ownership rate of 50% in an evenly allocated low literacy population compared to a reference rate of 66% assuming a 2-sided α of 0.05 using the Fisher exact test.
The 18-item questionnaire was informed by constructs addressed in the 2015 Pew Research Center smartphone survey.10 However, in addition to device ownership, we inquired about device capabilities, service-plan details, service interruptions due to difficulty paying bills in the previous year, home-Internet access, an active e-mail account, and self-assigned demographics. Self-reported reading health literacy,11 more directly measured than e-health literacy, was screened using a parsimonious instrument validated as a dichotomized measure.12 Instruments in English and Spanish were tested for appropriate and comprehensible word choices and syntax through pilot testing. We inferred LEP among patients preferring to complete the survey in Spanish based on our familiarity with the population. We defined any Internet access as having a mobile data-service plan or having home-Internet access. In addition, we inquired about primary insurance provider and offered Medicaid patients an informational brochure about the federal Lifeline Program (https://www.fcc.gov/lifeline) that subsidizes text-messaging-enabled cellular telephone service for low-income patients. Notably, we assessed engagement by asking about the extent of patients’ interest in “new ways of communicating with your doctor, clinic, or pharmacy using” text, e-mail, or mobile apps with a 5-level response scale ranging from “not at all interested” to “very interested”.
Participant characteristics were confirmed to be similar to the Cook County Health and Hospitals System patient population in 2015 with regards to age, gender, and race/ethnicity. We calculated unadjusted and adjusted odds ratios for IRHL and LEP’s association with each dependent measure of access (to smartphone, Internet, or e-mail) and engagement (using text messaging, e-mail, or mobile apps) controlling for age, gender, primary payer, recruitment location, IRHL, and LEP. Because we oversampled inpatients, we estimated sampling-weight-adjusted proportions and 95% confidence intervals (CI) of the entire CCHHS patient population with access to smartphone, data/text plan, non-prepaid plan, and service interruptions using STATA v13 (StataCorp LP, College Station Texas). The project received a waiver upon review by the local Institutional Review Board.
RESULTS
Participation rate was 65% (302/464). Differences in patients by site are shown in Table 1. IRHL was more frequent and LEP less frequent among hospitalized patients. As shown in Table 2, patients with IRHL were less likely to have any Internet access, to have an active e-mail account, and to be interested in using e-mail for healthcare communications. Patients with LEP were less likely than English speakers to be interested in using mobile apps. Inpatients were less likely than outpatients to be interested in text messaging for healthcare communications.
The estimated proportion (95% CI) of the health system’s patients owning a text-enabled mobile device was 87% (75%-94%) and an Internet-enabled mobile device was 64% (47%-78%). The proportion with no data service interruptions in the previous year was 40% (31%-50%).
DISCUSSION
In this cross-section of urban low-income adult patients, IRHL and LEP were factors associated with potential disparities introduced by mHealth. Even as access to smartphones becomes ubiquitous, lagging access to Internet and e-mail among low literacy patients, and low levels of technology engagement for healthcare communications among patients with IRHL or LEP, underscore concerns about equity in health systems’ adoption of mHealth strategies. Hospitalized patients were found to have diminished engagement with mHealth independent of IRHL and LEP.
Regarding engagement, significantly fewer patients with IRHL or LEP were interested in using technology for healthcare communications. Our finding suggests that health disparities already associated with these conditions13 may not be reduced by mobile device outreach alone and may even be worsened by it. Touch screens, audio-enabled questionnaires, and language translation engines are innovations that may be helpful to mitigate IRHL and LEP, but evidence is scarce. Privacy and security concerns, and lack of experience with technology, may also lower engagement. A contemporaneous study found lower apps’ usage among Latinos, also suggesting that language concordance between apps, their source, and targeted users is important.14 Low-tech solutions involving mobile telephone or even lower tech in-person communications targeted to the estimated 26% of the US population with low literacy15 and 20% with LEP16 may be practical stopgap measures. Even as disparities in access to technology across race-ethnicity are diminishing,10 equity across poverty levels, low levels of education, cultural norms, and disabilities may be more challenging to overcome. Our assessment indicates that large exclusions of a safety-net population in 2015 are a legitimate concern in communication strategies that rely too heavily on mHealth. These findings underscore the CONSORT-EHEALTH recommendation that investigators report web-based recruitment strategies and data-collection methods comprehensively.17
Regarding access, our estimates suggest that historical disparities in smartphone ownership are diminishing, but access to Internet capabilities may still be lower among the urban poor compared to the nation as a whole. The Pew Research Center found that 64% of Americans owned a smartphone in 2015 (respondents defined smartphone).10 In comparison, 87% (95% CI, 75%, 94%) of our study participants owned a text-enabled mobile device and 64% (47%, 78%) owned an Internet-enabled mobile device. However, the 40% (31%, 50%) of our safety-net population with an uninterrupted data plan over the previous year may be lower than the 50% of Americans reporting uninterrupted data plans over their lifetime.10 The impact of expense-related data plan interruptions is magnified by the 40% of our study population—compared to 15% of Americans—who are dependent on mobile devices for Internet access.10 The association between Internet connectivity and literacy evokes multiple bidirectional pathways yet to be elucidated. But if mHealth can reduce health disparities, closing the gap in device ownership is only a partial accomplishment, and future work also needs to expand Internet connectivity to allow literacy-enhancing and literacy-naïve technologies to flourish.
This study has limitations. Our study population was a consecutive sample and participation rate was less than 100%. However, we recruited participants into the study the way we may also have approached patients to introduce mHealth options in our clinical settings. Our sampling method proved adequate for our primary goal to explain differences in technology access and engagement using regression analysis. Although our patient population may not directly generalize to many healthcare systems, including other safety-net systems serving regions with variable technology uptake,18 our findings reflect the capacities and the preferences of the most disadvantaged segments of urban populations. We systematically excluded LEP non-Spanish speakers, but they consisted of less than 5% of inpatients and no outpatients. We did not assess current technology use. Finally, as discussed earlier, access and use of new technologies change rapidly and frequent updates are necessary.
mHealth is a promising tool because it may increase healthcare access, improve care quality, and promote research. All these potential benefits will be obtained with accompanying efforts to reduce healthcare disparities, especially where some technologies themselves are exclusionary.
Disclosures
The authors report no financial conflicts of interest.
1. Khosravi P, Ghapanchi AH. Investigating the effectiveness of technologies applied to assist seniors: a systematic literature review. Int J Med Inform. 2016;85:17-26. PubMed
2. Feltner C, Jones CD, Cené CW, et al. Transitional care interventions to prevent readmissions for persons with heart failure: a systematic review and meta-analysis. Ann Intern Med. 2014;160:774-784. PubMed
3. Prieto-Centurion V, Gussin HA, Rolle AJ, Krishnan JA. Chronic obstructive pulmonary disease readmissions at minority-serving institutions. Ann Am Thorac Soc. 2013;10:680-684. PubMed
4. Hinami K, Smith J, Deamant CD, BuBeshter K, Trick WE. When do patient-reported outcome measures inform readmission risk? J Hosp Med. 2015;10:294-300. PubMed
5. Gibbons MC. A historical overview of health disparities and the potential of eHealth solutions. J Med Internet Res. 2005;7:e50. PubMed
6. Nelson LA, Mulvaney SA, Gebretsadik T, Ho YX, Johnson KB, Osborn CY. Disparities in the use of a mHealth medication adherence promotion intervention for low-income adults with type2 diabetes. J Am Med Inform Assoc. 2016;23:12-18. PubMed
7. Martin T. Assessing mHealth: opportunities and barriers to patient engagement. J Health Care Poor Underserved. 2012;23:935-941. PubMed
8. Horn IB, Mendoza FS. Reframing the disparities agenda: a time to rethink, a time to focus. Acad Pediatr. 2013;14:115-116. PubMed
9. Viswanath K, Nagler RH, Bigman-Galimore CA, McCauley MP, Jung M, Ramanadhan S. The communications revolution and health inequalities in the 21st century: implications for cancer control. Cancer Epidemiol, BiomarkersPrev. 2012;21:1701-1708. PubMed
10. Pew Research Center. The Smartphone Difference. Pew Research Center; April 2015. Available at: http://www.pewinternet.org/2015/04/01/us-smartphone-use-in-2015/. Accessed January 12, 2017.
11. Baker DW. The meaning and measure of health literacy. J Gen Intern Med. 2011;21:878-883. PubMed
12. Morris NS, MacLean CD, Chew LD, Littenberg B. The single item literacy screener: evalution of a brief instrument to identify limited reading ability. BMC Fam Pract. 2006;7:21. PubMed
13. Sentell T, Braun K. Low health literacy, limited English proficiency, and health status in Asians, Latinos, and other racial/ethnic groups in California. J Health Commun. 2012;17:82-99. PubMed
14. Arora S, Ford K, Terp S, et al. Describing the evolution of mobile technology usage for Latino patients and comparing findings to national mHealth estimates. J Am Med Inform Assoc. 2016;23:979-983. PubMed
15. Paasche-Orlow MK, Parker RM, Gazmararian JA, Nielsen-Bohlman LT, Rudd RR. The prevalence of limited health literacy. J Gen Intern Med. 2005;20:175-184. PubMed
16. US Census Bureau. Detailed languages spoken at home and ability to speak English for the population 5 years and over: 2009-2013. Published 2015. Available at: http://www.census.gov/data/tables/2013/demo/2009-2013-lang-tables.html. Accessed March 31, 2016.
17. Eysenbach G, CONSORT-EHEALTH Group. CONSORT-EHEALTH: improving and standardizing evaluation reports of Web-based and mobile health intervention. J Med Internet Res. 2011;13:e126. PubMed
18. Schickedanz A, Huang D, Lopex A, et al. Access, interest, and attitudes toward electronic communication for health care among patients in the medical safety net. J Gen Intern Med. 2013;28:914-920. PubMed
© 2017 Society of Hospital Medicine
Patient‐Reported Outcome Measures
Despite widespread efforts to predict 30‐day rehospitalizations among discharged general medical patients,[1, 2, 3] not many strategies have incorporated patient‐reported outcome (PRO) measures in predictive models.[4] This despite the many longitudinal studies of the ambulatory population that demonstrate the higher likelihood of hospitalizations among those who score poorly on General Self‐Rated Health (GSRH),[5, 6, 7] baseline or declining Health‐Related Quality of Life,[8, 9, 10, 11, 12] psychological symptoms,[13, 14] and physical symptoms assessments.[15] One of the few existing studies that included PRO measures in 30‐day readmission models showed the predictive value of the 12‐item short form (SF12) Physical Component Score.[16] Others showed that persistent symptoms were associated with readmissions in patients with heart disease.[17, 18]
The paucity of efforts to connect PRO measures to utilization may be due to the limited availability of these measures in routine clinical records and the incomplete knowledge about how various PRO measures may fluctuate during episodes of acute illnesses and their treatments during hospitalizations. Health perception measures reflect both enduring features like self‐concept as well as dynamic features like a person's immediate health status.[19] As such, GSRH reflects the presence of chronic illnesses but is also responsive to acute events.[20, 21] Similarly, Health‐Related Quality of Life measures are dynamic as they decline around episodes of acute illness but are stable over a longer time window in their tendency to recover.[22] We do not know how fluctuations in measures of symptom burden, perceived health, and quality of life around the hospital‐to‐home transition may differentially inform readmission risk. Using a longitudinal cohort study, we addressed 2 questions: (1) How do PRO measures change when measured serially during the hospital‐to‐home transition? (2) How does the relative timing of each PRO measure variably inform the risk of subsequent utilization events including hospital readmissions?
METHODS
We conducted a longitudinal cohort study using data originally collected for a trial (
The following instruments were administered at each interview. The physical symptom severity portion of the Memorial Symptom Assessment Scale (MSAS) solicited the severity rank (none/a little bit/somewhat/quite a bit/very much) of 17 physical symptoms in the last week; the score was calculated by averaging the severity rank of the 12 most common symptom in the sample.[25, 26] The Patient Reported Outcomes Measurement Information System (PROMIS) Global Health Short Form is an instrument assessing GSRH (1 item), Social Activities (1 item), Global Physical Health (4 items), and Global Mental Health (4 items including a single‐item quality‐of‐life measure). Fatigue and pain for Global Physical Health, and emotional health for Global Mental Health were assessed over the past 7 days. Each of the 2 Global Health scores was standardized to a national mean of 50 and standard deviation of 10.[27]
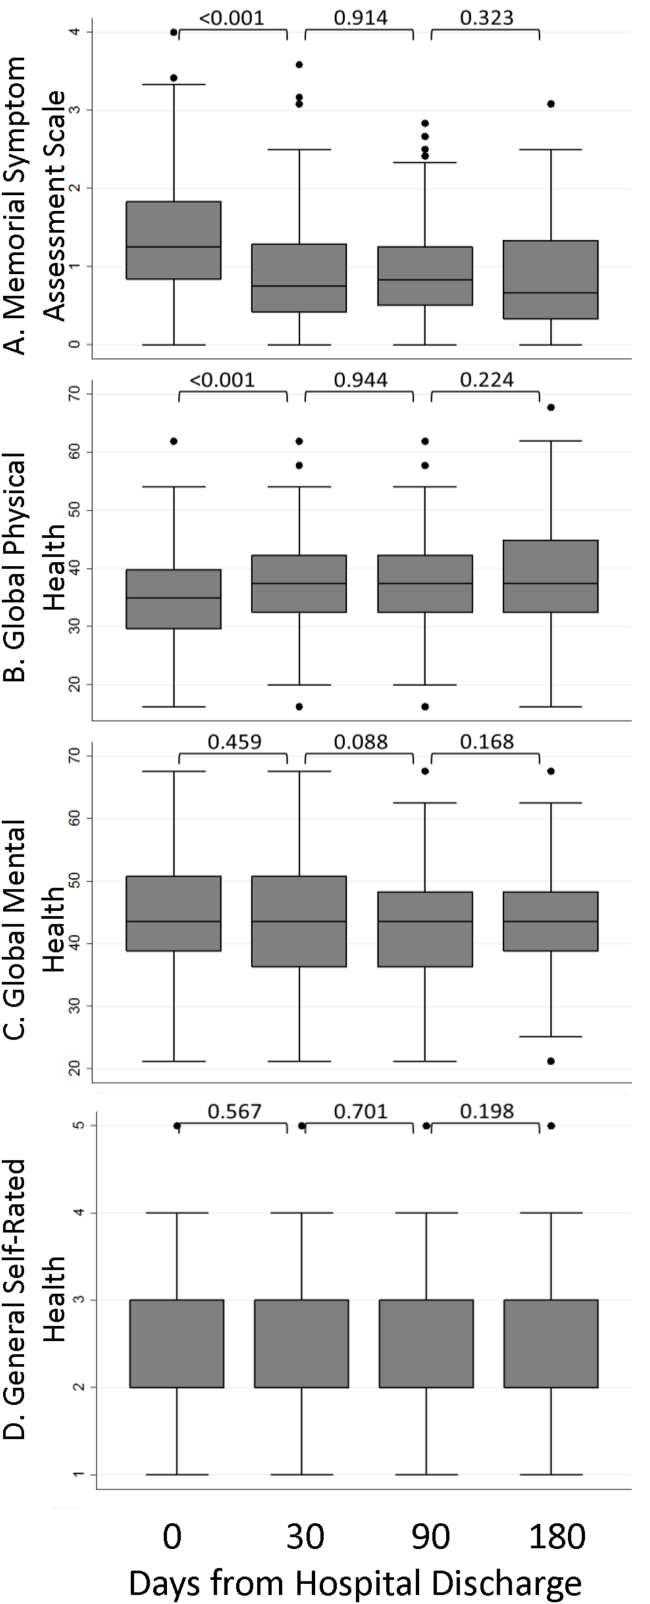
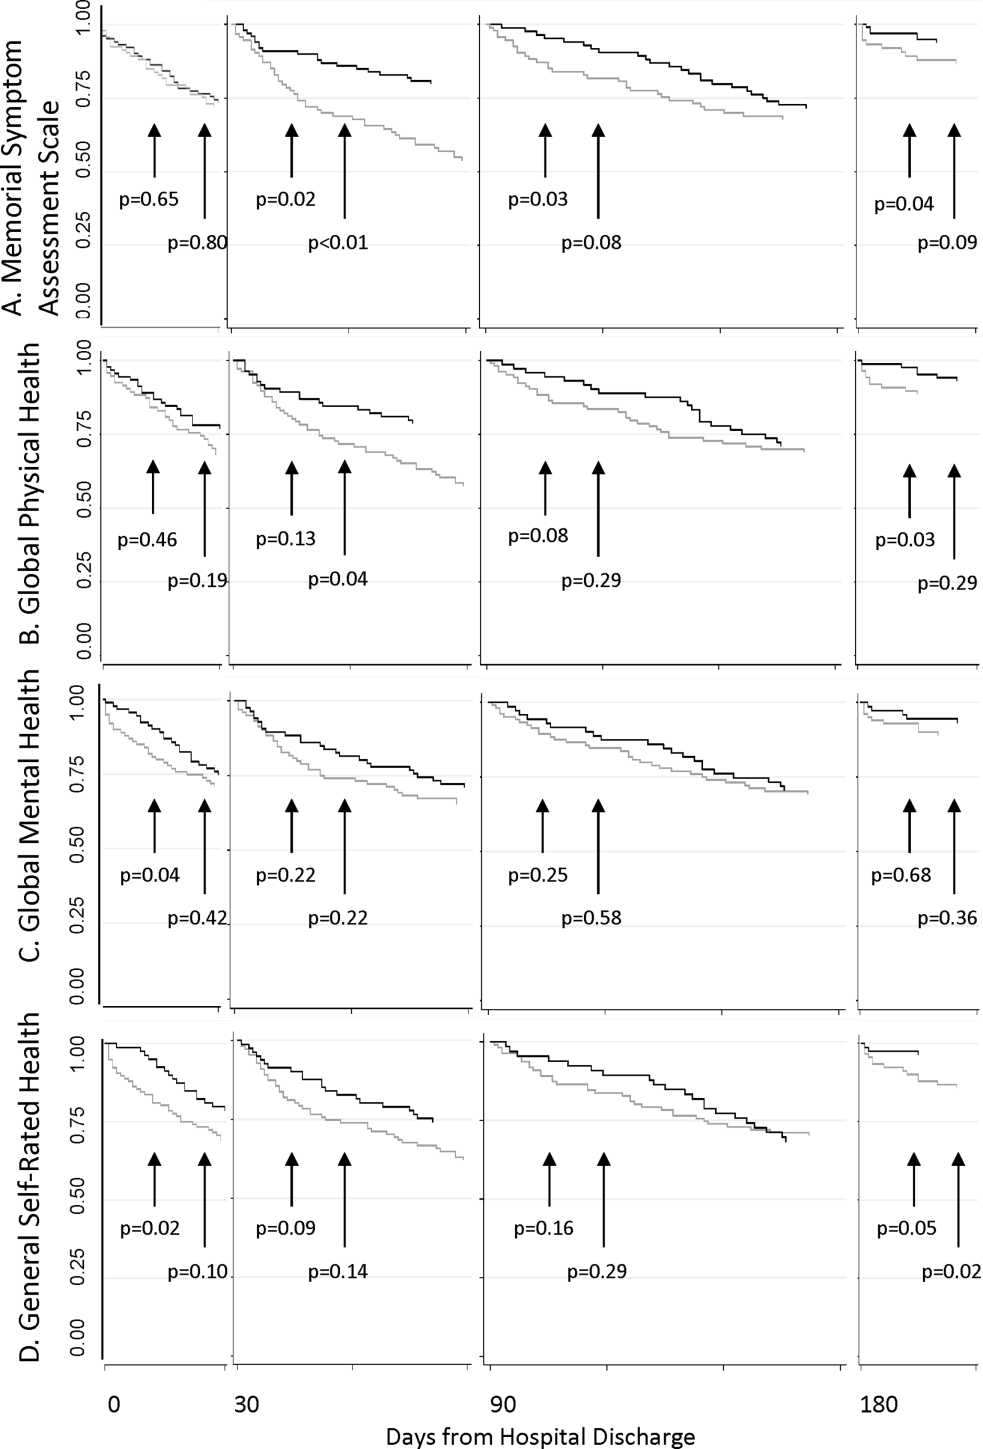
The rate of survey completion at each follow‐up was calculated. Characteristics of participants were tabulated. Characteristics of patients censored prior to study completion were compared with patients with complete data. Box plots for MSAS physical symptom severity, and Global Physical and Mental Health scores were constructed to illustrate the comparisons of the mean scores between each consecutive survey period using t tests assuming unequal variance. A similar box plot of GSRH illustrated the comparison of the median score between consecutive surveys using the rank sum test. Hospital‐based utilization events were defined as either an emergency department visit or hospitalization at 1 of the 2 hospitals of the Cook County Health & Hospitals System (CCHHS). After accounting for patient data censored due to death (date reported by family) or withdrawal from study, Kaplan‐Meier curves showing time to first hospital‐based utilization event during each interval between surveys were drawn separately for above‐ and below‐median MSAS, Global Physical and Mental Health scores, and for poor or fair versus good, very good, or excellent GSRH assessment. The null hypothesis that the survivor functions were equal between the better and worse median quantiles or GSRH categories was tested using the log‐rank test at 14 and 30 days from survey completion. Hazard ratios for time to first utilization event within 14 days of each survey were calculated for the MSAS score, Global Physical and Mental Health as continuous variables, and GSRH response categories relative to poor using bivariate and multivariate Cox proportional hazard equations. Multivariate models incorporated the following 5 covariates: at least 1 utilization event during the study period prior to the survey, Charlson score, age, gender, and race/ethnicity category. Likelihood ratio statistics were calculated to test the hypothesis that the model including the PRO measure and covariates predicted the outcome equally well compared to the nested model with only covariates. We used the traditional threshold of .05 when reporting significance. All analyses were performed in Stata 13 (StataCorp, College Station, TX). The methods for patient consent, data collection, analyses, and reporting were reviewed and approved by the CCHHS institutional review board.
RESULTS
A total of 196 patients completed the initial survey. The completion rates were 98%, 90%, and 88% for the 30‐, 90‐, and 180‐day follow‐up surveys, respectively. As shown in Table 1, participants average age was 52 years, and about half were women. The majority was non‐Hispanic black, and 21% preferred to complete the survey in Spanish. Diabetes, congestive heart failure, cancer, and chronic pulmonary disease were each prevalent in at least one‐fifth of our patient cohort. Demographic characteristics were similar between the 160 patients who completed all 3 follow‐up surveys and the 36 who missed at least 1 follow‐up survey. Among the latter group, 1 withdrew at 30 days, 1 withdrew and 4 had died at 90 days, and 1 withdrew and 9 had died at 180 days.
| |
| Age, y, mean (SD) | 52 (10) |
| Female, n (%) | 100 (51) |
| Race/ethnicity category, n (%) | |
| Non‐Hispanic black | 117 (60) |
| Hispanic | 52 (27) |
| Non‐Hispanic white | 20 (10) |
| Other | 6 (3) |
| Language, n (%) | |
| English | 155 (79) |
| Spanish | 41 (21) |
| Charlson Comorbidity Index, median (range) | 1 (09) |
| Charlson comorbidities, n (%) | |
| Diabetes | 71 (36) |
| Congestive heart failure | 52 (27) |
| Cancer (with and without metastases) | 43 (22) |
| Chronic pulmonary disease | 40 (20) |
| Myocardial infarction | 17 (9) |
| Renal disease | 11 (6) |
Figure 1 shows a timeline of the follow‐up surveys and utilization events in the form of overlapping histograms. The majority of 30‐day follow‐up questionnaires were completed earlier than targeted, at a median of 17 (interquartile range [IQR] 16, 20) days after discharge. Similarly, questionnaires targeted for 90 and 180 days were completed at medians of 78 (IQR 7684) and 167 (IQR 166169) days from discharge. Fifty‐four (28%) patients experienced a first utilization event in the first 30 days following discharge. During the 60‐, 90‐, and 30‐day intervals after the first, second, and third follow‐up surveys, respectively, 63 (33%), 54 (31%), and 16 (9%) patients experienced a first utilization event.

A significant improvement in MSAS physical symptom severity was detected between the hospitalization and the 30‐day follow‐up (Figure 2A). Although the mean Global Physical Health score was below the national mean of 50 at every survey period, a similar improvement in the measure was noted between the hospitalization and the 30‐day follow‐up (Figure 2B). The mean Global Mental Health score was also below the national mean but remained stable throughout the study (Figure 2C). The median GSRH was stable at 2 (IQR 23) at every survey wave (Figure 2D). Of note, compared to patients who completed all 3 follow‐up surveys, patients who missed at least 1 follow‐up reported higher MSAS score (1.5 vs 1.8, P=0.03), lower Global Physical Health (36.1 vs 33.5, P=0.09), and lower Global Mental Health (44.7 vs 41.0, P=0.03) during their hospitalization. In addition, patients with complete data experienced an average of 1.2 utilization events during the study, whereas those with missing data experienced an average of 2.1 utilization events (P=0.03).
The MSAS physical symptom severity and Global Physical Health scores from the index hospitalizations did not identify patients with a first utilization event within 30 days. However, patients with poor Global Mental Health and GSRH in the hospital were more likely to experience a utilization event within 14 days of discharge (Figure 3). During the postdischarge period, patients scoring poorly on each of the PRO measures trended toward a greater risk of an early utilization event, but the association between utilization and MSAS was most consistently significant (Figure 3A). In general, the associations with MSAS, Global Physical Health, and GSRH were stronger with the risk of utilization events within 14 days than within 30 days (Figure 3A,B,D). The Global Mental Health score was not associated with a subsequent utilization when measured during the 180‐day postdischarge period.
As shown in Table 2, Cox proportional hazard models incorporating covariates preserved most of the significant associations seen in the unadjusted analyses. Global Mental Health and good relative to poor GSRH obtained during the hospitalization remained significant. MSAS obtained at each postdischarge follow‐up trended positively with utilization and was statistically significant at 90 and 180 days. Global Physical Health obtained at each postdischarge follow‐up similarly trended negatively with utilization and was significant at 180 days. Each multivariate model incorporating a PRO measure with a significant coefficient contributed to better fit of the predictive model compared to the nested model without the PRO measure.
| Unadjusted Hazard Ratio | P | Adjusted Hazard Ratio* | P | Likelihood Ratio | P | |
|---|---|---|---|---|---|---|
| ||||||
| Hospital discharge | ||||||
| MSAS | 1.47 | 0.11 | 1.38 | 0.19 | 1.65 | 0.20 |
| Global Physical Health | 0.96 | 0.10 | 0.96 | 0.13 | 2.29 | 0.13 |
| Global Mental Health | 0.96 | 0.05 | 0.96 | 0.05 | 4.05 | 0.04 |
| GSRH | ||||||
| Fair | 1.09 | 0.85 | 1.26 | 0.61 | 12.27 | 0.02 |
| Good | 0.24 | 0.04 | 0.23 | 0.03 | ||
| Very good | 1.09 | 0.90 | 1.40 | 0.63 | ||
| Excellent | NC | NS | NC | NS | ||
| 30 days | ||||||
| MSAS | 1.54 | 0.07 | 1.40 | 0.20 | 1.57 | 0.21 |
| Global Physical Health | 0.96 | 0.08 | 0.97 | 0.24 | 1.42 | 0.23 |
| Global Mental Health | 0.98 | 0.42 | 0.99 | 0.62 | 0.25 | 0.62 |
| GSRH | ||||||
| Fair | 0.92 | 0.86 | 1.19 | 0.72 | 8.85 | 0.07 |
| Good | 0.85 | 0.31 | 0.94 | 0.91 | ||
| Very good | NC | NS | NC | NS | ||
| Excellent | 2.69 | 0.36 | 6.28 | 0.11 | ||
| 90 days | ||||||
| MSAS | 2.23 | 0.03 | 2.20 | 0.05 | 3.79 | 0.05 |
| Global Physical Health | 0.94 | 0.07 | 0.95 | 0.11 | 2.75 | 0.10 |
| Global Mental Health | 0.96 | 0.20 | 0.95 | 0.15 | 2.11 | 0.15 |
| GSRH | ||||||
| Fair | 0.75 | 0.63 | 0.67 | 0.53 | 6.67 | 0.15 |
| Good | 0.32 | 0.19 | 0.28 | 0.15 | ||
| Very good | NC | NS | NC | NS | ||
| Excellent | 2.12 | 0.50 | 2.20 | 0.49 | ||
| 180 days | ||||||
| MSAS | 2.39 | 0.03 | 3.51 | 0.01 | 7.04 | 0.01 |
| Global Physical Health | 0.93 | 0.06 | 0.93 | 0.03 | 4.61 | 0.03 |
| Global Mental Health | 0.97 | 0.38 | 0.96 | 0.33 | 0.95 | 0.33 |
| GSRH | ||||||
| Fair | 0.98 | 0.98 | 0.64 | 0.55 | 7.13 | 0.13 |
| Good | 0.33 | 0.23 | 0.20 | 0.09 | ||
| Very good | NC | NS | NC | NS | ||
| Excellent | NC | NS | NC | NS | ||
DISCUSSION
In this longitudinal cohort study, patients, on average, reported relatively severe symptoms, low PROMIS Global Physical and Mental Health scores, and poor GSRH during the inpatient stay in an urban safety‐net hospital. Symptom severity and Global Physical Health improved, on average, by 30 days before stabilizing, but their poor levels in the hospital did not predict 30‐day hospital‐based utilization events. On the other hand, Global Mental Health and GSRH were stable through hospitalizations, and patients scoring poorly on these measures were at greater risk of utilization events within 14 days of discharge. PRO measures obtained during the 180‐day postdischarge period trended toward distinguishing populations with greater baseline risk of proximate utilization events. However, MSAS physical symptom severity and Global Physical Health were more consistently predictive of these events at statistically significant levels compared to Global Mental Health and GSRH in our relatively small sample of patients. Each of these measures selectively improved the fit‐of‐risk prediction models for hospital‐based utilization.
Some of the heterogeneity in readmission risk is explained by differences in PRO measures. Although the MSAS score and Global Physical Health assessment were reliable predictors of utilization when measured in ambulatory settings, they were less discriminating during acute hospitalizations when everyone, on average, reported severe symptoms and poor function. Our results were consistent with other studies that demonstrated the fairly rapid recovery in symptoms that follow hospitalizations,[28, 29] and these measures may become informative of utilization risk as early as 2 weeks postdischarge. GSRH and Global Mental Health (a measure of health‐related quality of life) only predicted utilizations immediately at hospital discharge. As multidimensional measures that reflect physical, social, and emotional capacity, these measures may indicate vulnerabilities in patients least able to handle the stresses of the early postdischarge period.
There is growing momentum around collecting PRO measures in routine clinical care as quality indicators that capture patient‐centered concerns.[30] Our study explored a novel application of these measures whose routine collection will likely proliferate, not solely for the purpose of helping healthcare systems identify patients at risk of unplanned resource utilization. Although multidimensional PRO measures seldom reflect conditions directly modifiable by simple interventions, we believe that the association between physical symptom burden and utilization in our data reveals a possible target for practice improvement. Hospitalists have contributed enormously to shorter lengths of stay that risk sicker and quicker discharges.[31] To mitigate its potential side effects on symptom management, a discharge plan that acknowledges physical symptoms that sometimes persist or recur beyond the hospitalization may be appropriate. This may be accomplished by ensuring that acute symptoms are resolving, giving clear instructions for symptom management at home, as now the standard of care for conditions like asthma,[32] and explicitly communicating the presence of residual symptoms to providers entrusted with continuity care. As an effective feedback measure that can drive continuous quality improvement, we believe that a technology‐based surveillance strategy that spans both the inpatient and outpatient domains is necessary.[23]
There are some notable similarities and differences between the results of our study and a recent hospital‐based study of PRO measures that used data from the Multi‐Center Hospitalist Project.[16] The Physical Component Score of the SF12 is similar to the PROMIS Global Physical Health score in that both incorporate measures of physical function, perceived health, pain, and energy level. Curiously, the SF12 Physical Component Score, but not the PROMIS Global Physical Health score, was associated with 30‐day rehospitalizations. An important difference between the measures is where the SF12 asks about limitations during the past 4 weeks the PROMIS instrument inquires about physical function in general and levels of fatigue and pain in the past 7 days. Considering most hospitalizations last <7 days, the PROMIS instrument may better reflect the declines associated with the acute illness related to the hospitalization than the SF12 score. Additionally, the discrepancy between the association between hospital‐based GSRH and utilization in our study and the absence, thereof, in Hasan et al. is noteworthy. The difference here may be explained by their use of a 0‐ to 100‐point response scale in contrast to our study's verbally labeled 5‐point scale in the PROMIS instrument. The range of rating scales for survey questions is traditionally governed by the tension between the difficulty with mapping respondents judgment on an excessively large scale on one hand, and the failure of insufficient response options to discriminate between respondents with different underlying judgment on the other.[33] We suspect the former to be a drawback of the unlabeled 100‐point response scale, and conjecture that an association might be found in the Multi‐Center Hospitalist Study data if the responses were grouped into summative categories.
We recognize several limitations in our study. The first is the generalizability of our patient population to others, not insignificantly because of the high proportion of the uninsured (around 70% during the study period) and racial/ethnic minorities among them. Although utilization patterns are clearly affected by socioeconomic status,[34] there may also be differences in the way validated PRO measures are calibrated between patients of public and private healthcare systems.[35] Another limitation is our inability to count utilization events at institutions outside of the CCHHS during our study. However, because the study was conducted prior to Cook County's Medicaid expansion demonstration program as part of the Affordable Care Act,[36] many patients established in our system faced barriers to receiving nonemergency care outside of the CCHHS supporting our assumption that few of our patients were discharged from other hospitals. Causality cannot be established in observational studies. Consequently, high prior‐symptom burden may be associated with utilizations through unmeasured variables. Measures of symptom burden are vulnerable to overendorsement and amplification.[37, 38] Inferences based on statistical significance are affected by sample size, and our conclusions may change if conducted with a larger number of participants. Our response rates were excellent through the survey waves, but we did not achieve perfect follow‐up. Worse levels of PRO responses and higher levels of utilization among censored patients biased our results toward the null. Finally, although we did not find any predominant comorbidities associated with hospital‐based utilizations in our sample, our analyses may be vulnerable to inadequate control for illness severity, which may also have biased our results.
PRO measures are likely to be useful in clinical medicine.[39] But to fully apply the powers of PROs in informing clinically and operationally relevant outcomes, we must actively develop a system for obtaining these measures in routine clinical care. The availability of patient downtime makes hospitalizations conducive to gathering patient‐generated data, and may further enhance patient‐provider communication if survey output was readily available in electronic medical records. Exploring innovative strategies for collecting PROs in the hospital and beyond remains our future work.
Disclosures
Funded by the Agency for Healthcare Research and Quality: R24 HS19481‐01 to support technology implementation. The authors report no conflicts of interest, relevant financial interests, activities, relationships, and affiliations that influenced this work. The first and senior authors had full access to all data and take responsibility for their integrity and the accuracy of the data analysis.
- , , , . Potentially avoidable 30‐day hospital readmissions in medical patients: derivation and validation of a prediction model. JAMA Intern Med. 2013;173:632–638.
- , , , et al. Derivation and validation of an index to predict early death or unplanned readmission after discharge from hospital to the community. CMAJ. 2010;182:551–557.
- , , , . Redefining readmission risk factors for general medicine patients. J Hosp Med. 2011;6:54–60.
- , , , et al. Risk prediction models for hospital readmission: a systematic review. JAMA. 2011;306:1688–1698.
- , , , . Predicting mortality and healthcare utilization with a single question. Health Serv Res. 2005;40:1234–1246.
- , , . Repeated hospitalizations and self‐rated health among the elderly: a multivariate failure time analysis. Am J Epidemiol. 2001;153 3 232–241.
- , , , , , . Screening elders for risk of hospital admission. J Am Geriatr Soc. 1993;41:811–817.
- , , , et al. Baseline quality of life as a predictor of mortality and hospitalization in 5,025 patients with congestive heart failure. SOLVD Investigations. Studies of Left Ventricular Dysfunction Investigators. Am J Cardiol. 1996;78:890–895.
- , , , , . Using quality of life to predict hospitalization and mortality in patients with obstructive lung disease. Chest. 2002;122:429–436.
- , , , . Intraindividual change in SF‐36 in ambulatory clinic primary care patients predicted mortality and hospitalizations. J Clin Epidemiol. 2004;57:277–283.
- , , , et al. Use of health‐related, quality‐of‐life metrics to predict mortality and hospitalizations in community‐dwelling seniors. J Am Geriatr Soc. 2006;54:667–673.
- , , , . Medical outcomes study short form‐36: a consistent and powerful predictor of morbidity and mortality in dialysis patients. Am J Kidney Dis. 2003;41:1286–1292.
- , , , et al. Relationship of depression to increased risk of mortality and rehospitalization in patients with congestive heart failure. Arch Intern Med. 2001;161:1849–1856.
- , , , et al. Depression as a predictor of mortality and hospitalization among hemodialysis patients in the United States and Europe. Kidney Int. 2002;62:199–207.
- , , , , . Health status predicts long‐term outcomes in outpatients with coronary disease. Circulation. 2002;106:43–49.
- , , , et al. Hospital readmission in general medicine patients: a prediction model. J Gen Intern Med. 2010;25:211–219.
- , , , , , . Persistent angina pectoris in ischaemic cardiomyopathy: increased rehospitalization and major adverse cardiac events. Eur J Heart Fail. 2014;16:854–860.
- , , , et al. Relation of dyspnea severity on admission for acute heart failure with outcomes and costs. Am J Cardiol. 2015;115:75–81.
- , , . Two views of self‐rated general health status. Soc Sci Med. 2003;56:203–217.
- , , . Self‐rated health and physical disability in elderly survivors of a major medical event. J Gerontol B Psychol Sci Soc Sci. 1996;51:S96–S104.
- , , . Predicting changes in perceived health status. Am J Public Health. 1984;74:611–614.
- , , , , . Quality of life before and after intensive care. Anaesthesia. 2005;60:322–329.
- , , , , , Trick WE. Health perceptions and symptom burden in primary care: measuring health using audio computer‐assisted self‐interviews [published online ahead of print December 7, 2014]. Qual Life Res. doi: 10.1007/s11136‐014‐0884‐4.
- , , . Adapting a clinical comorbidity index for use with ICD‐9‐CM administrative databases. J Clin Epidemiol. 1992;45:613–619.
- , , , et al. The Memorial Symptom Assessment Scale: an instrument for the evaluation of symptom prevalence, characteristics and distress. Eur J Cancer. 1994;30A:1326–1336.
- , , , , . The Memorial Symptom Assessment Scale short form (MSAS‐SF). Cancer. 2000;89:1162–1171.
- , , , , . Development of physical and mental health summary schores from the Patient‐Reported Outcomes Measurement Information System (PROMIS) global items. Qual Life Res. 2009;18:873–880.
- , , , et al. Improvements in signs and symptoms during hospitalization for acute heart failure follow different patterns and depend on the measurement scales used: an international, prospective registry to evaluate the evolution of measures of disease severity in acute heart failure (MEASURE‐AHF). J Card Fail. 2008;14:777–784.
- , , , . Longitudinal assessment of symptom severity among hospitalized elders diagnosed with cancer, heart failure, and chronic obstructive pulmonary disease. J Hosp Med. 2012;7:567–572.
- , , , . The patient experience and health outcomes. N Engl J Med. 2013;368:201–203.
- , , , . "Quicker and sicker" under Medicare's prospective payment system for hospitals: new evidence on an old issue from a national longitudinal survey. Bull Econ Res. 2011;63:1–27.
- Agency for Healthcare Research and Quality. Asthma care quality improvement measures. Available at: http://www.ahrq.gov/professionals/quality‐patient‐safety/quality‐resources/tools/asthmaqual/asthmacare/appendix‐d.html. Accessed January 30, 2015.
- , , . The Psychology of Survey Response. New York, NY: Cambridge University Press; 2000.
- , , , et al. Health care for children and youth in the United States: annual report on patterns of coverage, utilization, quality, and expenditures by income. Ambul Pediatr. 2005;5:6–44.
- , , , et al. Levels of symptom burden during chemotherapy for advanced lung cancer: differences between public hospitals and a tertiary cancer center. J Clin Oncol. 2011;29:2859–2865.
- . Profiles of Medicaid outreach and enrollment strategies: the Cook County early expansion initiative. The Henry J. Kaiser Family Foundation. Available at: http://kff.org/medicaid/issue-brief/profiles-of-medicaid-outreach-and-enrollment-strategies-the-cook-county-early-expansion-initiative. Published April 7, 2014. Accessed December 2, 2014.
- , , . A primary care perspective on prevailing assumptions about persistent medically unexplained physical symptoms. Int J Psychiatry Med. 2002;32:125–140.
- , , , . Symptom burden and comorbidities impact the consistency of responses on patient‐reported functional outcomes. Arch Phys Med Rehabil. 2014;95:79–86.
- , , , et al. Implementing patient‐reported outcomes assessment in clinical practice: a review of the options and considerations. Qual Life Res. 2012;21:1305–1314.
Despite widespread efforts to predict 30‐day rehospitalizations among discharged general medical patients,[1, 2, 3] not many strategies have incorporated patient‐reported outcome (PRO) measures in predictive models.[4] This despite the many longitudinal studies of the ambulatory population that demonstrate the higher likelihood of hospitalizations among those who score poorly on General Self‐Rated Health (GSRH),[5, 6, 7] baseline or declining Health‐Related Quality of Life,[8, 9, 10, 11, 12] psychological symptoms,[13, 14] and physical symptoms assessments.[15] One of the few existing studies that included PRO measures in 30‐day readmission models showed the predictive value of the 12‐item short form (SF12) Physical Component Score.[16] Others showed that persistent symptoms were associated with readmissions in patients with heart disease.[17, 18]
The paucity of efforts to connect PRO measures to utilization may be due to the limited availability of these measures in routine clinical records and the incomplete knowledge about how various PRO measures may fluctuate during episodes of acute illnesses and their treatments during hospitalizations. Health perception measures reflect both enduring features like self‐concept as well as dynamic features like a person's immediate health status.[19] As such, GSRH reflects the presence of chronic illnesses but is also responsive to acute events.[20, 21] Similarly, Health‐Related Quality of Life measures are dynamic as they decline around episodes of acute illness but are stable over a longer time window in their tendency to recover.[22] We do not know how fluctuations in measures of symptom burden, perceived health, and quality of life around the hospital‐to‐home transition may differentially inform readmission risk. Using a longitudinal cohort study, we addressed 2 questions: (1) How do PRO measures change when measured serially during the hospital‐to‐home transition? (2) How does the relative timing of each PRO measure variably inform the risk of subsequent utilization events including hospital readmissions?
METHODS
We conducted a longitudinal cohort study using data originally collected for a trial (
The following instruments were administered at each interview. The physical symptom severity portion of the Memorial Symptom Assessment Scale (MSAS) solicited the severity rank (none/a little bit/somewhat/quite a bit/very much) of 17 physical symptoms in the last week; the score was calculated by averaging the severity rank of the 12 most common symptom in the sample.[25, 26] The Patient Reported Outcomes Measurement Information System (PROMIS) Global Health Short Form is an instrument assessing GSRH (1 item), Social Activities (1 item), Global Physical Health (4 items), and Global Mental Health (4 items including a single‐item quality‐of‐life measure). Fatigue and pain for Global Physical Health, and emotional health for Global Mental Health were assessed over the past 7 days. Each of the 2 Global Health scores was standardized to a national mean of 50 and standard deviation of 10.[27]
The rate of survey completion at each follow‐up was calculated. Characteristics of participants were tabulated. Characteristics of patients censored prior to study completion were compared with patients with complete data. Box plots for MSAS physical symptom severity, and Global Physical and Mental Health scores were constructed to illustrate the comparisons of the mean scores between each consecutive survey period using t tests assuming unequal variance. A similar box plot of GSRH illustrated the comparison of the median score between consecutive surveys using the rank sum test. Hospital‐based utilization events were defined as either an emergency department visit or hospitalization at 1 of the 2 hospitals of the Cook County Health & Hospitals System (CCHHS). After accounting for patient data censored due to death (date reported by family) or withdrawal from study, Kaplan‐Meier curves showing time to first hospital‐based utilization event during each interval between surveys were drawn separately for above‐ and below‐median MSAS, Global Physical and Mental Health scores, and for poor or fair versus good, very good, or excellent GSRH assessment. The null hypothesis that the survivor functions were equal between the better and worse median quantiles or GSRH categories was tested using the log‐rank test at 14 and 30 days from survey completion. Hazard ratios for time to first utilization event within 14 days of each survey were calculated for the MSAS score, Global Physical and Mental Health as continuous variables, and GSRH response categories relative to poor using bivariate and multivariate Cox proportional hazard equations. Multivariate models incorporated the following 5 covariates: at least 1 utilization event during the study period prior to the survey, Charlson score, age, gender, and race/ethnicity category. Likelihood ratio statistics were calculated to test the hypothesis that the model including the PRO measure and covariates predicted the outcome equally well compared to the nested model with only covariates. We used the traditional threshold of .05 when reporting significance. All analyses were performed in Stata 13 (StataCorp, College Station, TX). The methods for patient consent, data collection, analyses, and reporting were reviewed and approved by the CCHHS institutional review board.
RESULTS
A total of 196 patients completed the initial survey. The completion rates were 98%, 90%, and 88% for the 30‐, 90‐, and 180‐day follow‐up surveys, respectively. As shown in Table 1, participants average age was 52 years, and about half were women. The majority was non‐Hispanic black, and 21% preferred to complete the survey in Spanish. Diabetes, congestive heart failure, cancer, and chronic pulmonary disease were each prevalent in at least one‐fifth of our patient cohort. Demographic characteristics were similar between the 160 patients who completed all 3 follow‐up surveys and the 36 who missed at least 1 follow‐up survey. Among the latter group, 1 withdrew at 30 days, 1 withdrew and 4 had died at 90 days, and 1 withdrew and 9 had died at 180 days.
| |
| Age, y, mean (SD) | 52 (10) |
| Female, n (%) | 100 (51) |
| Race/ethnicity category, n (%) | |
| Non‐Hispanic black | 117 (60) |
| Hispanic | 52 (27) |
| Non‐Hispanic white | 20 (10) |
| Other | 6 (3) |
| Language, n (%) | |
| English | 155 (79) |
| Spanish | 41 (21) |
| Charlson Comorbidity Index, median (range) | 1 (09) |
| Charlson comorbidities, n (%) | |
| Diabetes | 71 (36) |
| Congestive heart failure | 52 (27) |
| Cancer (with and without metastases) | 43 (22) |
| Chronic pulmonary disease | 40 (20) |
| Myocardial infarction | 17 (9) |
| Renal disease | 11 (6) |
Figure 1 shows a timeline of the follow‐up surveys and utilization events in the form of overlapping histograms. The majority of 30‐day follow‐up questionnaires were completed earlier than targeted, at a median of 17 (interquartile range [IQR] 16, 20) days after discharge. Similarly, questionnaires targeted for 90 and 180 days were completed at medians of 78 (IQR 7684) and 167 (IQR 166169) days from discharge. Fifty‐four (28%) patients experienced a first utilization event in the first 30 days following discharge. During the 60‐, 90‐, and 30‐day intervals after the first, second, and third follow‐up surveys, respectively, 63 (33%), 54 (31%), and 16 (9%) patients experienced a first utilization event.
A significant improvement in MSAS physical symptom severity was detected between the hospitalization and the 30‐day follow‐up (Figure 2A). Although the mean Global Physical Health score was below the national mean of 50 at every survey period, a similar improvement in the measure was noted between the hospitalization and the 30‐day follow‐up (Figure 2B). The mean Global Mental Health score was also below the national mean but remained stable throughout the study (Figure 2C). The median GSRH was stable at 2 (IQR 23) at every survey wave (Figure 2D). Of note, compared to patients who completed all 3 follow‐up surveys, patients who missed at least 1 follow‐up reported higher MSAS score (1.5 vs 1.8, P=0.03), lower Global Physical Health (36.1 vs 33.5, P=0.09), and lower Global Mental Health (44.7 vs 41.0, P=0.03) during their hospitalization. In addition, patients with complete data experienced an average of 1.2 utilization events during the study, whereas those with missing data experienced an average of 2.1 utilization events (P=0.03).
The MSAS physical symptom severity and Global Physical Health scores from the index hospitalizations did not identify patients with a first utilization event within 30 days. However, patients with poor Global Mental Health and GSRH in the hospital were more likely to experience a utilization event within 14 days of discharge (Figure 3). During the postdischarge period, patients scoring poorly on each of the PRO measures trended toward a greater risk of an early utilization event, but the association between utilization and MSAS was most consistently significant (Figure 3A). In general, the associations with MSAS, Global Physical Health, and GSRH were stronger with the risk of utilization events within 14 days than within 30 days (Figure 3A,B,D). The Global Mental Health score was not associated with a subsequent utilization when measured during the 180‐day postdischarge period.
As shown in Table 2, Cox proportional hazard models incorporating covariates preserved most of the significant associations seen in the unadjusted analyses. Global Mental Health and good relative to poor GSRH obtained during the hospitalization remained significant. MSAS obtained at each postdischarge follow‐up trended positively with utilization and was statistically significant at 90 and 180 days. Global Physical Health obtained at each postdischarge follow‐up similarly trended negatively with utilization and was significant at 180 days. Each multivariate model incorporating a PRO measure with a significant coefficient contributed to better fit of the predictive model compared to the nested model without the PRO measure.
| Unadjusted Hazard Ratio | P | Adjusted Hazard Ratio* | P | Likelihood Ratio | P | |
|---|---|---|---|---|---|---|
| ||||||
| Hospital discharge | ||||||
| MSAS | 1.47 | 0.11 | 1.38 | 0.19 | 1.65 | 0.20 |
| Global Physical Health | 0.96 | 0.10 | 0.96 | 0.13 | 2.29 | 0.13 |
| Global Mental Health | 0.96 | 0.05 | 0.96 | 0.05 | 4.05 | 0.04 |
| GSRH | ||||||
| Fair | 1.09 | 0.85 | 1.26 | 0.61 | 12.27 | 0.02 |
| Good | 0.24 | 0.04 | 0.23 | 0.03 | ||
| Very good | 1.09 | 0.90 | 1.40 | 0.63 | ||
| Excellent | NC | NS | NC | NS | ||
| 30 days | ||||||
| MSAS | 1.54 | 0.07 | 1.40 | 0.20 | 1.57 | 0.21 |
| Global Physical Health | 0.96 | 0.08 | 0.97 | 0.24 | 1.42 | 0.23 |
| Global Mental Health | 0.98 | 0.42 | 0.99 | 0.62 | 0.25 | 0.62 |
| GSRH | ||||||
| Fair | 0.92 | 0.86 | 1.19 | 0.72 | 8.85 | 0.07 |
| Good | 0.85 | 0.31 | 0.94 | 0.91 | ||
| Very good | NC | NS | NC | NS | ||
| Excellent | 2.69 | 0.36 | 6.28 | 0.11 | ||
| 90 days | ||||||
| MSAS | 2.23 | 0.03 | 2.20 | 0.05 | 3.79 | 0.05 |
| Global Physical Health | 0.94 | 0.07 | 0.95 | 0.11 | 2.75 | 0.10 |
| Global Mental Health | 0.96 | 0.20 | 0.95 | 0.15 | 2.11 | 0.15 |
| GSRH | ||||||
| Fair | 0.75 | 0.63 | 0.67 | 0.53 | 6.67 | 0.15 |
| Good | 0.32 | 0.19 | 0.28 | 0.15 | ||
| Very good | NC | NS | NC | NS | ||
| Excellent | 2.12 | 0.50 | 2.20 | 0.49 | ||
| 180 days | ||||||
| MSAS | 2.39 | 0.03 | 3.51 | 0.01 | 7.04 | 0.01 |
| Global Physical Health | 0.93 | 0.06 | 0.93 | 0.03 | 4.61 | 0.03 |
| Global Mental Health | 0.97 | 0.38 | 0.96 | 0.33 | 0.95 | 0.33 |
| GSRH | ||||||
| Fair | 0.98 | 0.98 | 0.64 | 0.55 | 7.13 | 0.13 |
| Good | 0.33 | 0.23 | 0.20 | 0.09 | ||
| Very good | NC | NS | NC | NS | ||
| Excellent | NC | NS | NC | NS | ||
DISCUSSION
In this longitudinal cohort study, patients, on average, reported relatively severe symptoms, low PROMIS Global Physical and Mental Health scores, and poor GSRH during the inpatient stay in an urban safety‐net hospital. Symptom severity and Global Physical Health improved, on average, by 30 days before stabilizing, but their poor levels in the hospital did not predict 30‐day hospital‐based utilization events. On the other hand, Global Mental Health and GSRH were stable through hospitalizations, and patients scoring poorly on these measures were at greater risk of utilization events within 14 days of discharge. PRO measures obtained during the 180‐day postdischarge period trended toward distinguishing populations with greater baseline risk of proximate utilization events. However, MSAS physical symptom severity and Global Physical Health were more consistently predictive of these events at statistically significant levels compared to Global Mental Health and GSRH in our relatively small sample of patients. Each of these measures selectively improved the fit‐of‐risk prediction models for hospital‐based utilization.
Some of the heterogeneity in readmission risk is explained by differences in PRO measures. Although the MSAS score and Global Physical Health assessment were reliable predictors of utilization when measured in ambulatory settings, they were less discriminating during acute hospitalizations when everyone, on average, reported severe symptoms and poor function. Our results were consistent with other studies that demonstrated the fairly rapid recovery in symptoms that follow hospitalizations,[28, 29] and these measures may become informative of utilization risk as early as 2 weeks postdischarge. GSRH and Global Mental Health (a measure of health‐related quality of life) only predicted utilizations immediately at hospital discharge. As multidimensional measures that reflect physical, social, and emotional capacity, these measures may indicate vulnerabilities in patients least able to handle the stresses of the early postdischarge period.
There is growing momentum around collecting PRO measures in routine clinical care as quality indicators that capture patient‐centered concerns.[30] Our study explored a novel application of these measures whose routine collection will likely proliferate, not solely for the purpose of helping healthcare systems identify patients at risk of unplanned resource utilization. Although multidimensional PRO measures seldom reflect conditions directly modifiable by simple interventions, we believe that the association between physical symptom burden and utilization in our data reveals a possible target for practice improvement. Hospitalists have contributed enormously to shorter lengths of stay that risk sicker and quicker discharges.[31] To mitigate its potential side effects on symptom management, a discharge plan that acknowledges physical symptoms that sometimes persist or recur beyond the hospitalization may be appropriate. This may be accomplished by ensuring that acute symptoms are resolving, giving clear instructions for symptom management at home, as now the standard of care for conditions like asthma,[32] and explicitly communicating the presence of residual symptoms to providers entrusted with continuity care. As an effective feedback measure that can drive continuous quality improvement, we believe that a technology‐based surveillance strategy that spans both the inpatient and outpatient domains is necessary.[23]
There are some notable similarities and differences between the results of our study and a recent hospital‐based study of PRO measures that used data from the Multi‐Center Hospitalist Project.[16] The Physical Component Score of the SF12 is similar to the PROMIS Global Physical Health score in that both incorporate measures of physical function, perceived health, pain, and energy level. Curiously, the SF12 Physical Component Score, but not the PROMIS Global Physical Health score, was associated with 30‐day rehospitalizations. An important difference between the measures is where the SF12 asks about limitations during the past 4 weeks the PROMIS instrument inquires about physical function in general and levels of fatigue and pain in the past 7 days. Considering most hospitalizations last <7 days, the PROMIS instrument may better reflect the declines associated with the acute illness related to the hospitalization than the SF12 score. Additionally, the discrepancy between the association between hospital‐based GSRH and utilization in our study and the absence, thereof, in Hasan et al. is noteworthy. The difference here may be explained by their use of a 0‐ to 100‐point response scale in contrast to our study's verbally labeled 5‐point scale in the PROMIS instrument. The range of rating scales for survey questions is traditionally governed by the tension between the difficulty with mapping respondents judgment on an excessively large scale on one hand, and the failure of insufficient response options to discriminate between respondents with different underlying judgment on the other.[33] We suspect the former to be a drawback of the unlabeled 100‐point response scale, and conjecture that an association might be found in the Multi‐Center Hospitalist Study data if the responses were grouped into summative categories.
We recognize several limitations in our study. The first is the generalizability of our patient population to others, not insignificantly because of the high proportion of the uninsured (around 70% during the study period) and racial/ethnic minorities among them. Although utilization patterns are clearly affected by socioeconomic status,[34] there may also be differences in the way validated PRO measures are calibrated between patients of public and private healthcare systems.[35] Another limitation is our inability to count utilization events at institutions outside of the CCHHS during our study. However, because the study was conducted prior to Cook County's Medicaid expansion demonstration program as part of the Affordable Care Act,[36] many patients established in our system faced barriers to receiving nonemergency care outside of the CCHHS supporting our assumption that few of our patients were discharged from other hospitals. Causality cannot be established in observational studies. Consequently, high prior‐symptom burden may be associated with utilizations through unmeasured variables. Measures of symptom burden are vulnerable to overendorsement and amplification.[37, 38] Inferences based on statistical significance are affected by sample size, and our conclusions may change if conducted with a larger number of participants. Our response rates were excellent through the survey waves, but we did not achieve perfect follow‐up. Worse levels of PRO responses and higher levels of utilization among censored patients biased our results toward the null. Finally, although we did not find any predominant comorbidities associated with hospital‐based utilizations in our sample, our analyses may be vulnerable to inadequate control for illness severity, which may also have biased our results.
PRO measures are likely to be useful in clinical medicine.[39] But to fully apply the powers of PROs in informing clinically and operationally relevant outcomes, we must actively develop a system for obtaining these measures in routine clinical care. The availability of patient downtime makes hospitalizations conducive to gathering patient‐generated data, and may further enhance patient‐provider communication if survey output was readily available in electronic medical records. Exploring innovative strategies for collecting PROs in the hospital and beyond remains our future work.
Disclosures
Funded by the Agency for Healthcare Research and Quality: R24 HS19481‐01 to support technology implementation. The authors report no conflicts of interest, relevant financial interests, activities, relationships, and affiliations that influenced this work. The first and senior authors had full access to all data and take responsibility for their integrity and the accuracy of the data analysis.
- , , , . Potentially avoidable 30‐day hospital readmissions in medical patients: derivation and validation of a prediction model. JAMA Intern Med. 2013;173:632–638.
- , , , et al. Derivation and validation of an index to predict early death or unplanned readmission after discharge from hospital to the community. CMAJ. 2010;182:551–557.
- , , , . Redefining readmission risk factors for general medicine patients. J Hosp Med. 2011;6:54–60.
- , , , et al. Risk prediction models for hospital readmission: a systematic review. JAMA. 2011;306:1688–1698.
- , , , . Predicting mortality and healthcare utilization with a single question. Health Serv Res. 2005;40:1234–1246.
- , , . Repeated hospitalizations and self‐rated health among the elderly: a multivariate failure time analysis. Am J Epidemiol. 2001;153 3 232–241.
- , , , , , . Screening elders for risk of hospital admission. J Am Geriatr Soc. 1993;41:811–817.
- , , , et al. Baseline quality of life as a predictor of mortality and hospitalization in 5,025 patients with congestive heart failure. SOLVD Investigations. Studies of Left Ventricular Dysfunction Investigators. Am J Cardiol. 1996;78:890–895.
- , , , , . Using quality of life to predict hospitalization and mortality in patients with obstructive lung disease. Chest. 2002;122:429–436.
- , , , . Intraindividual change in SF‐36 in ambulatory clinic primary care patients predicted mortality and hospitalizations. J Clin Epidemiol. 2004;57:277–283.
- , , , et al. Use of health‐related, quality‐of‐life metrics to predict mortality and hospitalizations in community‐dwelling seniors. J Am Geriatr Soc. 2006;54:667–673.
- , , , . Medical outcomes study short form‐36: a consistent and powerful predictor of morbidity and mortality in dialysis patients. Am J Kidney Dis. 2003;41:1286–1292.
- , , , et al. Relationship of depression to increased risk of mortality and rehospitalization in patients with congestive heart failure. Arch Intern Med. 2001;161:1849–1856.
- , , , et al. Depression as a predictor of mortality and hospitalization among hemodialysis patients in the United States and Europe. Kidney Int. 2002;62:199–207.
- , , , , . Health status predicts long‐term outcomes in outpatients with coronary disease. Circulation. 2002;106:43–49.
- , , , et al. Hospital readmission in general medicine patients: a prediction model. J Gen Intern Med. 2010;25:211–219.
- , , , , , . Persistent angina pectoris in ischaemic cardiomyopathy: increased rehospitalization and major adverse cardiac events. Eur J Heart Fail. 2014;16:854–860.
- , , , et al. Relation of dyspnea severity on admission for acute heart failure with outcomes and costs. Am J Cardiol. 2015;115:75–81.
- , , . Two views of self‐rated general health status. Soc Sci Med. 2003;56:203–217.
- , , . Self‐rated health and physical disability in elderly survivors of a major medical event. J Gerontol B Psychol Sci Soc Sci. 1996;51:S96–S104.
- , , . Predicting changes in perceived health status. Am J Public Health. 1984;74:611–614.
- , , , , . Quality of life before and after intensive care. Anaesthesia. 2005;60:322–329.
- , , , , , Trick WE. Health perceptions and symptom burden in primary care: measuring health using audio computer‐assisted self‐interviews [published online ahead of print December 7, 2014]. Qual Life Res. doi: 10.1007/s11136‐014‐0884‐4.
- , , . Adapting a clinical comorbidity index for use with ICD‐9‐CM administrative databases. J Clin Epidemiol. 1992;45:613–619.
- , , , et al. The Memorial Symptom Assessment Scale: an instrument for the evaluation of symptom prevalence, characteristics and distress. Eur J Cancer. 1994;30A:1326–1336.
- , , , , . The Memorial Symptom Assessment Scale short form (MSAS‐SF). Cancer. 2000;89:1162–1171.
- , , , , . Development of physical and mental health summary schores from the Patient‐Reported Outcomes Measurement Information System (PROMIS) global items. Qual Life Res. 2009;18:873–880.
- , , , et al. Improvements in signs and symptoms during hospitalization for acute heart failure follow different patterns and depend on the measurement scales used: an international, prospective registry to evaluate the evolution of measures of disease severity in acute heart failure (MEASURE‐AHF). J Card Fail. 2008;14:777–784.
- , , , . Longitudinal assessment of symptom severity among hospitalized elders diagnosed with cancer, heart failure, and chronic obstructive pulmonary disease. J Hosp Med. 2012;7:567–572.
- , , , . The patient experience and health outcomes. N Engl J Med. 2013;368:201–203.
- , , , . "Quicker and sicker" under Medicare's prospective payment system for hospitals: new evidence on an old issue from a national longitudinal survey. Bull Econ Res. 2011;63:1–27.
- Agency for Healthcare Research and Quality. Asthma care quality improvement measures. Available at: http://www.ahrq.gov/professionals/quality‐patient‐safety/quality‐resources/tools/asthmaqual/asthmacare/appendix‐d.html. Accessed January 30, 2015.
- , , . The Psychology of Survey Response. New York, NY: Cambridge University Press; 2000.
- , , , et al. Health care for children and youth in the United States: annual report on patterns of coverage, utilization, quality, and expenditures by income. Ambul Pediatr. 2005;5:6–44.
- , , , et al. Levels of symptom burden during chemotherapy for advanced lung cancer: differences between public hospitals and a tertiary cancer center. J Clin Oncol. 2011;29:2859–2865.
- . Profiles of Medicaid outreach and enrollment strategies: the Cook County early expansion initiative. The Henry J. Kaiser Family Foundation. Available at: http://kff.org/medicaid/issue-brief/profiles-of-medicaid-outreach-and-enrollment-strategies-the-cook-county-early-expansion-initiative. Published April 7, 2014. Accessed December 2, 2014.
- , , . A primary care perspective on prevailing assumptions about persistent medically unexplained physical symptoms. Int J Psychiatry Med. 2002;32:125–140.
- , , , . Symptom burden and comorbidities impact the consistency of responses on patient‐reported functional outcomes. Arch Phys Med Rehabil. 2014;95:79–86.
- , , , et al. Implementing patient‐reported outcomes assessment in clinical practice: a review of the options and considerations. Qual Life Res. 2012;21:1305–1314.
© 2015 Society of Hospital Medicine
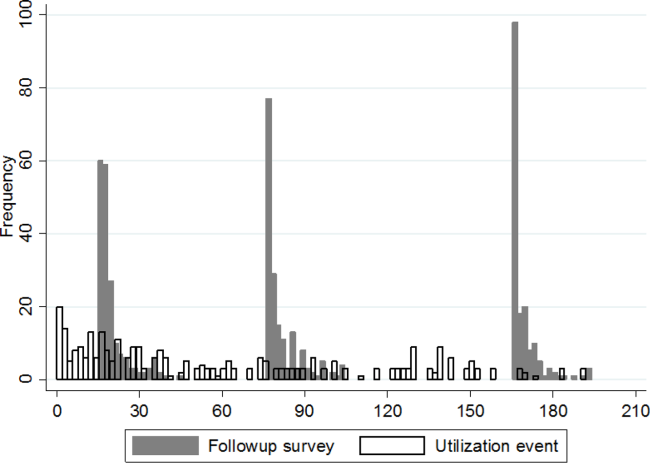
Improving Central Venous Catheterization
At times central venous catheters are essential to the delivery of appropriate medical care. Because catheter‐related complications are associated with limited operator experience,1 insertion technique,2 and venous site of insertion (eg, femoral, internal jugular, or subclavian vein),3 house staff training programs strive to provide their residents with appropriate training and oversight for this skill. Most quality improvement initiatives directed at reducing complications associated with central venous catheters have focused on patients in the intensive care unit (ICU).4, 5 However, in some hospitals more central venous catheters are inserted in patients not in the ICU,6 and practices that increase the risk of complications may be more common on wards.7
In our hospital, most catheters are placed in the femoral vein. Because femoral venous placement likely increases a patient's risk of thrombosis, hematoma, and bloodstream infection,8 we developed a program to change residents' choice of venous insertion site and improve their infection‐control practices during their general medicine ward rotation. The program provided simulated hands‐on experience in a simulation laboratory. We evaluated our intervention through a firm‐based clinical trial that compared the usual practice to our intervention. We compared infection‐control practices and resident choice of venous insertion site between the intervention and control groups; we also assessed residents' knowledge about catheter‐related complications, and we monitored patients for catheter‐related complications.
METHODS
Setting and Study Design
We conducted a prospective, firm‐based clinical trial approved by the institutional review board at Cook County Hospital, a 464‐bed public teaching hospital. We evaluated all central venous catheters inserted by residents on the general medicine service from November 15, 2004, to March 31, 2005. The internal medicine residency program assigns residents to 1 of 3 firms for their entire 3 years of training. We designated 1 firm as the intervention group; the other 2 firms constituted the control group.
Educational Intervention
At the beginning of each 4‐week general medicine ward rotation, intervention‐firm residents attended an educational and simulation laboratory session. Control‐firm residents received the usual ward orientation. We conducted 6 sessions, with total attendance of 40 intervention‐firm residents, or approximately 7 residents per session. A chief medical resident experienced in catheter placement and an attending internist led and supervised each 2‐hour training session. The sessions were conducted at the Simulation Laboratory of Rush University and included a presentation about indications for central venous catheter insertion, insertion techniques, common complications, and practice placing catheters in mannequins. During the hands‐on session, each participant observed the expert insert a triple‐lumen catheter in the mannequin's internal jugular and subclavian veins. Then, with supervision, each participant practiced catheter insertion using recommended infection‐control practices (eg, use of gloves, mask, and large drape, and chlorhexidine skin preparation).
Resident Survey
Before each session, we administered a survey that assessed residents' knowledge of insertion techniques and their confidence in placing catheters at each venous insertion site. To measure change in the confidence level of residents, we distributed an abbreviated survey 2 additional times, immediately after the session and at the end of the study period. We measured confidence with answers to survey questions, which were rated on a 5‐point Likert scale, from strongly disagree to strongly agree. In addition to measuring the change in residents' confidence, the final survey repeated knowledge assessment questions, evaluated residents' attitudes regarding venous insertion sites, and asked about potential strategies to improve insertion practices.
Central Venous Catheter Detection and Monitoring
At the end of each day, residents reported catheter insertions to chief residents during routine sign‐out rounds. If a catheter had been inserted, the chief resident interviewed the resident about type of catheter, venous insertion site, duration of attempt, patient location, immediate complications, number of inserters, inserter attendance at an educational session, inserter specialty, and professional designation (eg, resident, fellow, attending), indication for insertion, and adherence to infection‐control practices. For all insertion attempts, the research team reviewed the medical record and recorded patient characteristics that might influence venous insertion site (eg, thrombocytopenia, coagulopathy, and body mass index) and evaluated patients for insertion‐related complications.
We prospectively monitored patients for mechanical (ie, pneumothorax or hematoma), thromboembolic, or infectious complications. To evaluate for pneumothorax, postinsertion chest radiographs were reviewed by a physician‐investigator, and radiologists' interpretations and progress notes were reviewed. To evaluate for infectious or other mechanical complications, progress notes also were reviewed. We required radiographic confirmation of venous thromboembolism. To categorize potential bloodstream infections, we used Centers for Disease Control and Prevention definitions.9 All medical record and radiograph reviews were performed by investigators who were masked to patient firm assignment. We monitored patients until catheter removal or hospital discharge. After patient discharge, we reviewed the electronic record, including emergency room visits and repeat hospitalizations, for 30 days after the earlier of hospital discharge or catheter removal.
Statistics
Because we were aware that temporary dialysis catheters are sometimes placed in femoral veins to preserve the subclavian or internal jugular venous sites for more permanent tunneled intravascular catheters, our prespecified plans were to compare venous insertion sites between intervention and control groups after excluding temporary dialysis catheters. To more completely describe catheter use, we also collected data on temporary dialysis catheters, and we present the results both with and without inclusion of data on temporary dialysis catheters. If multiple residents attempted to insert a catheter, we would have used the group that the final inserter was in to determine intervention versus control group assignment; however, this never occurred.
To determine resident confidence in inserting catheters, we collapsed the responses of agree and strongly agree and of disagree and strongly disagree into single categories; thus, frequency of agreement was evaluated as a dichotomous outcome. To test whether residents' confidence changed between the 3 surveys, we analyzed responses using the matched‐pair signed rank test, with the initial survey used as the referent.
We dichotomized certain continuous variables using the following cut points: body mass index 30 kg/m2; coagulopathy, international normalized ratio (INR) > 1.5; thrombocytopenia, platelets < 100 109/L. Data were entered into a relational database (Microsoft Access, Microsoft Inc., Redmond, WA) and merged analyzed using Stata software, version 8.2 (Stata Corporation, College Station, TX).
RESULTS
Patient and Catheter Characteristics
Fifty‐four catheters were inserted in 48 patients during the study period, 16 (30%) in the intervention group and 38 (70%) in the control group. Mean number of catheters inserted per resident for each 4‐week rotation was 0.24; therefore, on average, a resident would insert 1 catheter every 4 general‐medicine rotations. Most catheters were inserted between 7:00 AM and 5:00 PM; the most common reason for insertion was to administer intravenous medications to a patient without intravenous access, followed by the need for a temporary dialysis catheter. Most catheters were inserted by the medicine team rather than radiology or a subspecialty service (Table 1). Most patient characteristics and reasons for insertion were similar between groups; however, more patients in the control group had thrombocytopenia (Table 1).
| Characteristic | Central venous catheters inserted | ||
|---|---|---|---|
| Intervention (n = 16), n (%) | Control (n = 38), n (%) | P | |
| |||
| Patient | |||
| Body mass index 30 kg/m2 | 5 (31) | 11 (29) | 1.0 |
| INR > 1.5 | 3 (19) | 3 (7.9) | 0.37 |
| Platelet count < 100k | 0 (0) | 9 (24) | 0.05 |
| Charlson index, mean (interquartile range) | 2 (24) | 2 (14) | 0.58 |
| Physician inserting catheter | |||
| Resident on general medicine servicea | 15 (100) | 34/37 (92) | 1.0 |
| Subspecialty fellow | 0 (0) | 2/37 (5.3) | 1.0 |
| Radiology fellow or attending | 0 (0) | 1/37 (2.6) | 1.0 |
| Reason for insertion | |||
| No intravenous access | 7 (44) | 19 (50) | 0.67 |
| Temporary dialysis catheterb | 7 (44) | 14 (37) | 0.63 |
| Total parenteral nutrition | 1 (6.2) | 3 (7.9) | 1.0 |
| Otherc | 1 (6.2) | 2 (5.3) | 1.0 |
| Time of day of insertion | |||
| Between 7 AM and 5 PM | 12/14 (86) | 25/37 (68) | 0.30 |
Insertion Practices
Femoral venous insertion was the most common type of catheter insertion (67%), followed by internal jugular (26%) and subclavian (7%); there were no differences in insertion site between the intervention and control groups (Table 2). When we excluded temporary dialysis catheters, 39% of central venous catheters were inserted in the internal jugular vein. Although a smaller proportion of catheters inserted by the intervention group were placed in a femoral vein, the difference was not significant (Table 2).
| Intervention (n = 16), n (%) | Control (n = 38), n (%) | Risk ratio (95% CI) | P | |
|---|---|---|---|---|
| ||||
| Self‐reported practices during CVC insertion | ||||
| Mask worn | 12 (75) | 13 (34) | 2.2 (1.33.7) | 0.008 |
| Large drape used | 15 (94) | 28 (74) | 1.3 (1.01.6) | 0.14 |
| Cap worn | 3 (19) | 5 (13) | 1.4 (0.45.3) | 0.6 |
| Gown worn | 8 (50) | 18 (47) | 1.1 (0.61.9) | 0.9 |
| Sterile gloves worn | 15 (94) | 36 (95) | 1.0 (0.81.2) | 1.0 |
| Venous insertion sitea | Difference (95% CI) | |||
| Femoral | 10 (62) | 26 (68) | 6% (34%22%) | 0.67 |
| Internal jugular | 5 (31) | 9 (24) | ||
| Subclavian | 1 (6.2) | 3 (7.9) | ||
| Excluding dialysis cathetersa | n = 9 | n = 24 | ||
| Femoral | 4 (44) | 14 (58) | 14% (52%24%) | 0.7 |
| Internal jugular | 5 (56) | 8 (33) | ||
| Subclavian | 0 (0) | 2 (8) | ||
For most insertions, residents reported using sterile gloves (94%) and a large drape (80%); however, most did not report use of a sterile gown (48%), mask (46%), or cap (15%). Residents in the intervention group were more likely to report use of a mask, and there was a trend toward increased use of large drapes (Table 2). No patient characteristics predicted femoral venous insertion (data not shown).
Complications
The most frequent complication was arterial puncture (n = 4); all four occurred during femoral venous insertion attempts. Compared to subclavian or internal jugular venous placement, there was a trend toward more mechanical complications among femoral catheters (Table 3). One episode of clinical sepsis occurred, in an intervention‐group patient who had femoral and internal jugular catheters, and no pneumothoraxes or episodes of venous thromboembolism occurred (Table 3). The overall incidence of bloodstream infection was 2.7 per 1000 central‐line days; there was no difference between the intervention and control groups (9.2 versus 0 per 1000 central‐line days; P = .29).
| Complication | Femoral (n = 36), n (%) | Subclavian or IJ (n = 18), n (%) | Difference (95% CI) |
|---|---|---|---|
| |||
| Mechanical (arterial puncture, hematoma, or pneumothorax)a | 4 (11) | 0 | 11% (1%21%) |
| Venous thromboembolismb | 0 (0) | 0 (0) | 0% |
| Infection rate (per 1000 central‐line days)c | 4.3 | 7.0 | 2.7 (1913) |
Survey Responses
Before the educational session, many residents did not recognize that femoral venous catheter insertions had a higher risk of arterial puncture or venous thrombosis (Table 4); by the final survey, residents were more likely to recognize the higher risk of these complications during femoral venous insertions. Most residents recognized the higher risk of infectious complications at the femoral site (Table 4).
| Respondents in Agreement, n (%) | |||
|---|---|---|---|
| Presession n = 35 | Postsession n = 34 | Follow‐up n = 35 | |
| |||
| Knowledge | |||
| Complications are most frequent at the femoral site | 27 (77%) | 30 (86%) | |
| Arterial puncture risk is lowest at the femoral sitea | 16 (46%) | 7 (21%)b | |
| Thrombosis risk is lowest at the femoral sitea | 11 (31%) | 6 (18%) | |
| Infection risk is lowest at the femoral site | 1/33 (3%) | 0 (0%) | |
| Attitudes | |||
| I feel confident:c | |||
| Inserting a femoral CVC | 53 | 59b | 89d |
| Inserting an internal jugular CVC | 41 | 71d | 40 |
| Inserting a subclavian CVC | 24 | 65d | 34d |
| Options to increase placement in jugular or subclavian veins | |||
| Availability of ultrasound machine | 31 (89) | ||
| Expert supervisor available to assist with placement | 30 (86) | ||
| Insert CVC within 2 weeks of educational session | 30 (86) | ||
| Rotation through a service that often places CVCsa | 26 (76) | ||
| I do not plan to use this skill after my residency | 4 (11) | ||
| Barriers to inserting a subclavian or internal jugular CVC | |||
| Preexisting internal jugular or subclavian CVC | 11 (31) | ||
| For temporary dialysis, desire to preserve site | 26 (74) | ||
| Practices | |||
| More likely to remove unnecessary catheter | 29 (83) | ||
| Improved infection‐control practices | 28 (80) | ||
| Increased motivation for internal jugular or subclavian venous insertion | 27 (78) | ||
| Less likely to place a CVC | 9 (26) | ||
| Internal jugular or subclavian CVC inserted for the first time after training | 7/30 (23) | ||
Residents overwhelmingly responded that the lecture was useful (95%), that mannequins provided a valuable skill‐building exercise (90%), and that the session should be incorporated into the training program (95%). Immediately after the session, residents had increased confidence about inserting a central venous catheter at any venous site, especially for internal jugular or subclavian insertions. By the final survey, the confidence of residents about inserting catheters in the internal jugular or subclavian veins had returned to baseline but had increased for femoral‐site insertions (Table 4).
Most residents in the intervention group agreed that the educational session motivated them to remove unnecessary catheters, improve insertion‐related infection‐control practices, and place the catheter in an internal jugular or subclavian vein; some agreed because of the educational session, they were less likely to place a central venous catheter. Some reported successfully inserting a central venous catheter in the subclavian or internal jugular vein for the first time (Table 4).
DISCUSSION
An educational session designed to teach residents appropriate central venous catheter insertion practices that included simulated hands‐on training increased knowledge about insertion‐related complications and improved certain infection‐control practices. Although residents' confidence in inserting subclavian or internal jugular catheters initially improved, our training session did not change the choice of venous insertion site from femoral to subclavian or internal jugular veins, possibly because there were few opportunities for residents to insert a catheter during the 4‐week general medical ward rotations. Thus, although an active educational intervention improved the knowledge and confidence of residents, it had a minimal effect on behavior (only improved certain infection‐control practices). Catheter‐associated complications were infrequent and similar in the intervention and control groups.
Central venous catheter insertion is a skill that many general internists do not perform10; however, until recently the American Board of Internal Medicine considered it a requisite skill for internal medicine residents, and most residents at our hospital reported a desire to learn this skill. Although in our study complications were infrequent, suggesting that a change in venous insertion site is unlikely to dramatically improve patient safety, we believe that residents should become skilled at inserting catheters in internal jugular or subclavian veins, the currently recommended optimal venous insertion.8
There is evidence that single educational interventions are unlikely to result in substantial, sustained behavioral change, especially passive educational programs.11 However, a previous study documented a change in provider behavior and possibly a reduction in bloodstream infections after a single hands‐on training session.12 Our hands‐on educational format was very popular and likely improved some infection‐control practices but did not change provider behavior about choice of venous insertion site. In other institutions, mentoring residents on appropriate catheter insertion technique has been accomplished by establishing a procedure service13 or by resident rotation in a high‐volume location (eg, cardiac catheterization laboratory).14 Another option to facilitate behavioral change would be to provide a portable ultrasound machine, as requested by our residents, which may reduce complication rates.15, 16 At our hospital, we decided to supplement hands‐on training with expert bedside supervision during catheter insertion; the expert is provided through a procedure service that is led by hospitalists. The procedure service has a dedicated portable ultrasound machine to assist with internal jugular vein cannulation.
By the end of our study period, residents' confidence in subclavian or internal jugular catheter insertions had returned to presession levels; however, they reported increased confidence in femoral venous catheter insertions. These findings suggest that the session increased residents' confidence with catheter insertions in general, but not specifically for venous sites for which they had no previous experience. For subclavian or internal jugular catheter insertions, their confidence decayed to the presession baseline, likely because of few opportunities to insert catheters in patients; on average, each resident inserts 1 central venous catheter on the general medicine wards approximately every 4 months.
Our survey found that our intervention changed residents' attitudes about infection‐control practices. In particular, intervention‐group residents reported that they were more likely to remove unnecessary catheters and that they had used a mask and large drape during catheter insertion. Use of full‐barrier precautions (ie, sterile gloves and gown, large sterile drape, cap, and mask) has been shown to reduce the risk of bloodstream infection2 and is included in national guidelines.17 Adherence to these guidelines has been included in successful quality improvement initiatives.4, 5, 18 Compared to internists' adherence to recommendations for infection control reported in another survey,10 residents who attended our educational session reported more use of large sterile drapes (94% vs. 35%) or masks (75% vs. 66%); however, they were less likely to use a sterile gown (50% vs. 72%). Use of a large sterile drape is common in our hospital, likely because the drape is included in the central venous catheter package. We suspect that at our hospital, poor adherence to certain recommendations (eg, using a sterile gown) was due in part to difficulty accessing supplies. Another possibility is that use of a cap, compared to use of large drapes, is perceived as not giving the patient much additional protection. In fact, there is no evidence that using a cap provides benefit beyond that of other, more intuitively beneficial recommended infection‐control practices, such as using sterile gloves and a large sterile drape. The procedure service has addressed the supply problem by stocking hard‐to‐find items on a procedure cart.
Only 2 clinically evident complications associated with catheter insertion occurred (one patient with clinical sepsis and one with a hematoma). Although it is possible that we missed minor complications, our rates were similar to those reported by other investigators: clinically diagnosed venous thromboembolism, 0%2.2%3, 19, 20; pneumothorax, 1.4%21; catheter‐associated primary bloodstream infection, 1‐6/1000 catheter‐days.22, 23 Comparing complication rates was hindered by variability in definitions, methods of ascertainment, and populations evaluated. For example, the rate of venous thromboembolism was dramatically higher when routine diagnostic imaging was used, and detection of catheter‐associated infections likely increased when catheter‐tip cultures were routinely performed. We required clinical evidence of complications, and our study differs from others in that we evaluated general medicine ward patients.
This study had several limitations. Placement of central venous catheters on general medicine wards was less frequent than we anticipated based on a brief period of pilot data collection; therefore, our study was not powered to detect relatively small changes in venous insertion sites or differences in complications. Also, because direct observation was not possible, we relied on self‐reported adherence to infection‐control practices. However, intervention residents' self‐reported poor adherence to gown, glove, and cap use suggests that their responses were unbiased.
An educational session focused on central venous catheter insertion practices was well received by residents, increased their knowledge about complications, and improved infection‐control practices, but had no effect on increasing use of subclavian or internal jugular veins for catheter insertion. Despite continued frequent use of femoral venous catheters, clinically apparent complications were infrequent. However, we believe it is important to teach residents optimal catheter insertion techniques, including preferential placement of catheters in subclavian or internal jugular veins. Therefore, the section of hospital medicine at our hospital initiated a procedure service that provides expert bedside supervision, including use of a portable ultrasound machine, for catheter insertions.
Acknowledgements
The authors acknowledge Kathleen Murray for data collection and form development; Donald Blom for assistance with determining bloodstream infection; Laura Sadowski for developing and leading the focus group session; Yannis Guerra for assistance with the educational sessions; Oksana Barilyak, Anand Despande, and Saurabh Sharma for assistance with data collection; and chief residents Rony Ghaoui, Sean Halleran, Priya Kansal, Parag Sampat, and Sunita Nathan for interviewing residents about catheter insertions.
- ,,,,.Central vein catheterization. Failure and complication rates by three percutaneous approaches.Arch Intern Med.1986;146:259–261.
- ,,, et al.Prevention of central venous catheter‐related infections by using maximal sterile barrier precautions during insertion.Infect Control Hosp Epidemiol.1994;15:231–238.
- ,,, et al.Complications of femoral and subclavian venous catheterization in critically ill patients: a randomized controlled trial.JAMA.2001;286:700–707.
- ,,, et al.Eliminating catheter‐related bloodstream infections in the intensive care unit.Crit Care Med.2004;32:2014–2020.
- ,,, et al.The effect of an education program on the incidence of central venous catheter‐associated bloodstream infection in a medical ICU.Chest.2004;126:1612–1618.
- ,,, et al.Prevalence of the use of central venous access devices within and outside of the intensive care unit: results of a survey among hospitals in the prevention epicenter program of the Centers for Disease Control and Prevention.Infect Control Hosp Epidemiol.2003;24:942–945.
- ,,,,,.Unnecessary use of central venous catheters: the need to look outside the intensive care unit.Infect Control Hosp Epidemiol.2004;25:266–268.
- ,.Preventing complications of central venous catheterization.N Engl J Med.2003;348:1123–1133.
- ,,,,.CDC definitions for nosocomial infections, 1988.Am J Infect Control.1988;16:128–140.
- ,,,.Why is it that internists do not follow guidelines for preventing intravascular catheter infections?Infect Control Hosp Epidemiol.2005;26:525–533.
- ,,, et al.Changing provider behavior: an overview of systematic reviews of interventions.Med Care.2001;39:II2–II45.
- ,,, et al.Education of physicians‐in‐training can decrease the risk for vascular catheter infection.Ann Intern Med.2000;132:641–648.
- ,, et al.Creation of an innovative inpatient medical procedure service and a method to evaluate house staff competency.J Gen Intern Med.2004;19:510–513.
- ,,,.A curricular initiative for internal medicine residents to enhance proficiency in internal jugular central venous line placement.Mayo Clin Proc.2005;80:212–218.
- ,,,,,.Improvement of internal jugular vein cannulation using an ultrasound‐guided technique.Intensive Care Med.1997;23:916–919.
- ,,.Facilitation of internal jugular venous cannulation using an audio‐guided Doppler ultrasound vascular access device: results from a prospective, dual‐center, randomized, crossover clinical study.Crit Care Med.1995;23:60–65.
- ,,, et al.Guidelines for the prevention of intravascular catheter‐related infections.MMWR Morb Mortal Wkly Rep.2002;1(RR10):1–26.
- ,,, et al.The impact of bedside behavior on catheter‐related bacteremia in the intensive care unit.Arch Surg.2004;139:131–136.
- ,,,,,.A prospective evaluation of the use of femoral venous catheters in critically ill adults.Crit Care Med.1997;25:1986–1989.
- ,,,,.Deep venous thrombosis caused by femoral venous catheters in critically ill adult patients.Chest.2000;117:178–183.
- ,,.Complications of central venous catheters: internal jugular versus subclavian access—a systematic review.Crit Care Med.2002;30:454–460.
- ,,,,,.Prospective evaluation of risk factors for bloodstream infection in patients receiving home infusion therapy.Ann Intern Med.1999;131:340–347.
- ,,,.Nosocomial infections in combined medical‐surgical intensive care units in the United States.Infect Control Hosp Epidemiol.2000;21:510–515.
At times central venous catheters are essential to the delivery of appropriate medical care. Because catheter‐related complications are associated with limited operator experience,1 insertion technique,2 and venous site of insertion (eg, femoral, internal jugular, or subclavian vein),3 house staff training programs strive to provide their residents with appropriate training and oversight for this skill. Most quality improvement initiatives directed at reducing complications associated with central venous catheters have focused on patients in the intensive care unit (ICU).4, 5 However, in some hospitals more central venous catheters are inserted in patients not in the ICU,6 and practices that increase the risk of complications may be more common on wards.7
In our hospital, most catheters are placed in the femoral vein. Because femoral venous placement likely increases a patient's risk of thrombosis, hematoma, and bloodstream infection,8 we developed a program to change residents' choice of venous insertion site and improve their infection‐control practices during their general medicine ward rotation. The program provided simulated hands‐on experience in a simulation laboratory. We evaluated our intervention through a firm‐based clinical trial that compared the usual practice to our intervention. We compared infection‐control practices and resident choice of venous insertion site between the intervention and control groups; we also assessed residents' knowledge about catheter‐related complications, and we monitored patients for catheter‐related complications.
METHODS
Setting and Study Design
We conducted a prospective, firm‐based clinical trial approved by the institutional review board at Cook County Hospital, a 464‐bed public teaching hospital. We evaluated all central venous catheters inserted by residents on the general medicine service from November 15, 2004, to March 31, 2005. The internal medicine residency program assigns residents to 1 of 3 firms for their entire 3 years of training. We designated 1 firm as the intervention group; the other 2 firms constituted the control group.
Educational Intervention
At the beginning of each 4‐week general medicine ward rotation, intervention‐firm residents attended an educational and simulation laboratory session. Control‐firm residents received the usual ward orientation. We conducted 6 sessions, with total attendance of 40 intervention‐firm residents, or approximately 7 residents per session. A chief medical resident experienced in catheter placement and an attending internist led and supervised each 2‐hour training session. The sessions were conducted at the Simulation Laboratory of Rush University and included a presentation about indications for central venous catheter insertion, insertion techniques, common complications, and practice placing catheters in mannequins. During the hands‐on session, each participant observed the expert insert a triple‐lumen catheter in the mannequin's internal jugular and subclavian veins. Then, with supervision, each participant practiced catheter insertion using recommended infection‐control practices (eg, use of gloves, mask, and large drape, and chlorhexidine skin preparation).
Resident Survey
Before each session, we administered a survey that assessed residents' knowledge of insertion techniques and their confidence in placing catheters at each venous insertion site. To measure change in the confidence level of residents, we distributed an abbreviated survey 2 additional times, immediately after the session and at the end of the study period. We measured confidence with answers to survey questions, which were rated on a 5‐point Likert scale, from strongly disagree to strongly agree. In addition to measuring the change in residents' confidence, the final survey repeated knowledge assessment questions, evaluated residents' attitudes regarding venous insertion sites, and asked about potential strategies to improve insertion practices.
Central Venous Catheter Detection and Monitoring
At the end of each day, residents reported catheter insertions to chief residents during routine sign‐out rounds. If a catheter had been inserted, the chief resident interviewed the resident about type of catheter, venous insertion site, duration of attempt, patient location, immediate complications, number of inserters, inserter attendance at an educational session, inserter specialty, and professional designation (eg, resident, fellow, attending), indication for insertion, and adherence to infection‐control practices. For all insertion attempts, the research team reviewed the medical record and recorded patient characteristics that might influence venous insertion site (eg, thrombocytopenia, coagulopathy, and body mass index) and evaluated patients for insertion‐related complications.
We prospectively monitored patients for mechanical (ie, pneumothorax or hematoma), thromboembolic, or infectious complications. To evaluate for pneumothorax, postinsertion chest radiographs were reviewed by a physician‐investigator, and radiologists' interpretations and progress notes were reviewed. To evaluate for infectious or other mechanical complications, progress notes also were reviewed. We required radiographic confirmation of venous thromboembolism. To categorize potential bloodstream infections, we used Centers for Disease Control and Prevention definitions.9 All medical record and radiograph reviews were performed by investigators who were masked to patient firm assignment. We monitored patients until catheter removal or hospital discharge. After patient discharge, we reviewed the electronic record, including emergency room visits and repeat hospitalizations, for 30 days after the earlier of hospital discharge or catheter removal.
Statistics
Because we were aware that temporary dialysis catheters are sometimes placed in femoral veins to preserve the subclavian or internal jugular venous sites for more permanent tunneled intravascular catheters, our prespecified plans were to compare venous insertion sites between intervention and control groups after excluding temporary dialysis catheters. To more completely describe catheter use, we also collected data on temporary dialysis catheters, and we present the results both with and without inclusion of data on temporary dialysis catheters. If multiple residents attempted to insert a catheter, we would have used the group that the final inserter was in to determine intervention versus control group assignment; however, this never occurred.
To determine resident confidence in inserting catheters, we collapsed the responses of agree and strongly agree and of disagree and strongly disagree into single categories; thus, frequency of agreement was evaluated as a dichotomous outcome. To test whether residents' confidence changed between the 3 surveys, we analyzed responses using the matched‐pair signed rank test, with the initial survey used as the referent.
We dichotomized certain continuous variables using the following cut points: body mass index 30 kg/m2; coagulopathy, international normalized ratio (INR) > 1.5; thrombocytopenia, platelets < 100 109/L. Data were entered into a relational database (Microsoft Access, Microsoft Inc., Redmond, WA) and merged analyzed using Stata software, version 8.2 (Stata Corporation, College Station, TX).
RESULTS
Patient and Catheter Characteristics
Fifty‐four catheters were inserted in 48 patients during the study period, 16 (30%) in the intervention group and 38 (70%) in the control group. Mean number of catheters inserted per resident for each 4‐week rotation was 0.24; therefore, on average, a resident would insert 1 catheter every 4 general‐medicine rotations. Most catheters were inserted between 7:00 AM and 5:00 PM; the most common reason for insertion was to administer intravenous medications to a patient without intravenous access, followed by the need for a temporary dialysis catheter. Most catheters were inserted by the medicine team rather than radiology or a subspecialty service (Table 1). Most patient characteristics and reasons for insertion were similar between groups; however, more patients in the control group had thrombocytopenia (Table 1).
| Characteristic | Central venous catheters inserted | ||
|---|---|---|---|
| Intervention (n = 16), n (%) | Control (n = 38), n (%) | P | |
| |||
| Patient | |||
| Body mass index 30 kg/m2 | 5 (31) | 11 (29) | 1.0 |
| INR > 1.5 | 3 (19) | 3 (7.9) | 0.37 |
| Platelet count < 100k | 0 (0) | 9 (24) | 0.05 |
| Charlson index, mean (interquartile range) | 2 (24) | 2 (14) | 0.58 |
| Physician inserting catheter | |||
| Resident on general medicine servicea | 15 (100) | 34/37 (92) | 1.0 |
| Subspecialty fellow | 0 (0) | 2/37 (5.3) | 1.0 |
| Radiology fellow or attending | 0 (0) | 1/37 (2.6) | 1.0 |
| Reason for insertion | |||
| No intravenous access | 7 (44) | 19 (50) | 0.67 |
| Temporary dialysis catheterb | 7 (44) | 14 (37) | 0.63 |
| Total parenteral nutrition | 1 (6.2) | 3 (7.9) | 1.0 |
| Otherc | 1 (6.2) | 2 (5.3) | 1.0 |
| Time of day of insertion | |||
| Between 7 AM and 5 PM | 12/14 (86) | 25/37 (68) | 0.30 |
Insertion Practices
Femoral venous insertion was the most common type of catheter insertion (67%), followed by internal jugular (26%) and subclavian (7%); there were no differences in insertion site between the intervention and control groups (Table 2). When we excluded temporary dialysis catheters, 39% of central venous catheters were inserted in the internal jugular vein. Although a smaller proportion of catheters inserted by the intervention group were placed in a femoral vein, the difference was not significant (Table 2).
| Intervention (n = 16), n (%) | Control (n = 38), n (%) | Risk ratio (95% CI) | P | |
|---|---|---|---|---|
| ||||
| Self‐reported practices during CVC insertion | ||||
| Mask worn | 12 (75) | 13 (34) | 2.2 (1.33.7) | 0.008 |
| Large drape used | 15 (94) | 28 (74) | 1.3 (1.01.6) | 0.14 |
| Cap worn | 3 (19) | 5 (13) | 1.4 (0.45.3) | 0.6 |
| Gown worn | 8 (50) | 18 (47) | 1.1 (0.61.9) | 0.9 |
| Sterile gloves worn | 15 (94) | 36 (95) | 1.0 (0.81.2) | 1.0 |
| Venous insertion sitea | Difference (95% CI) | |||
| Femoral | 10 (62) | 26 (68) | 6% (34%22%) | 0.67 |
| Internal jugular | 5 (31) | 9 (24) | ||
| Subclavian | 1 (6.2) | 3 (7.9) | ||
| Excluding dialysis cathetersa | n = 9 | n = 24 | ||
| Femoral | 4 (44) | 14 (58) | 14% (52%24%) | 0.7 |
| Internal jugular | 5 (56) | 8 (33) | ||
| Subclavian | 0 (0) | 2 (8) | ||
For most insertions, residents reported using sterile gloves (94%) and a large drape (80%); however, most did not report use of a sterile gown (48%), mask (46%), or cap (15%). Residents in the intervention group were more likely to report use of a mask, and there was a trend toward increased use of large drapes (Table 2). No patient characteristics predicted femoral venous insertion (data not shown).
Complications
The most frequent complication was arterial puncture (n = 4); all four occurred during femoral venous insertion attempts. Compared to subclavian or internal jugular venous placement, there was a trend toward more mechanical complications among femoral catheters (Table 3). One episode of clinical sepsis occurred, in an intervention‐group patient who had femoral and internal jugular catheters, and no pneumothoraxes or episodes of venous thromboembolism occurred (Table 3). The overall incidence of bloodstream infection was 2.7 per 1000 central‐line days; there was no difference between the intervention and control groups (9.2 versus 0 per 1000 central‐line days; P = .29).
| Complication | Femoral (n = 36), n (%) | Subclavian or IJ (n = 18), n (%) | Difference (95% CI) |
|---|---|---|---|
| |||
| Mechanical (arterial puncture, hematoma, or pneumothorax)a | 4 (11) | 0 | 11% (1%21%) |
| Venous thromboembolismb | 0 (0) | 0 (0) | 0% |
| Infection rate (per 1000 central‐line days)c | 4.3 | 7.0 | 2.7 (1913) |
Survey Responses
Before the educational session, many residents did not recognize that femoral venous catheter insertions had a higher risk of arterial puncture or venous thrombosis (Table 4); by the final survey, residents were more likely to recognize the higher risk of these complications during femoral venous insertions. Most residents recognized the higher risk of infectious complications at the femoral site (Table 4).
| Respondents in Agreement, n (%) | |||
|---|---|---|---|
| Presession n = 35 | Postsession n = 34 | Follow‐up n = 35 | |
| |||
| Knowledge | |||
| Complications are most frequent at the femoral site | 27 (77%) | 30 (86%) | |
| Arterial puncture risk is lowest at the femoral sitea | 16 (46%) | 7 (21%)b | |
| Thrombosis risk is lowest at the femoral sitea | 11 (31%) | 6 (18%) | |
| Infection risk is lowest at the femoral site | 1/33 (3%) | 0 (0%) | |
| Attitudes | |||
| I feel confident:c | |||
| Inserting a femoral CVC | 53 | 59b | 89d |
| Inserting an internal jugular CVC | 41 | 71d | 40 |
| Inserting a subclavian CVC | 24 | 65d | 34d |
| Options to increase placement in jugular or subclavian veins | |||
| Availability of ultrasound machine | 31 (89) | ||
| Expert supervisor available to assist with placement | 30 (86) | ||
| Insert CVC within 2 weeks of educational session | 30 (86) | ||
| Rotation through a service that often places CVCsa | 26 (76) | ||
| I do not plan to use this skill after my residency | 4 (11) | ||
| Barriers to inserting a subclavian or internal jugular CVC | |||
| Preexisting internal jugular or subclavian CVC | 11 (31) | ||
| For temporary dialysis, desire to preserve site | 26 (74) | ||
| Practices | |||
| More likely to remove unnecessary catheter | 29 (83) | ||
| Improved infection‐control practices | 28 (80) | ||
| Increased motivation for internal jugular or subclavian venous insertion | 27 (78) | ||
| Less likely to place a CVC | 9 (26) | ||
| Internal jugular or subclavian CVC inserted for the first time after training | 7/30 (23) | ||
Residents overwhelmingly responded that the lecture was useful (95%), that mannequins provided a valuable skill‐building exercise (90%), and that the session should be incorporated into the training program (95%). Immediately after the session, residents had increased confidence about inserting a central venous catheter at any venous site, especially for internal jugular or subclavian insertions. By the final survey, the confidence of residents about inserting catheters in the internal jugular or subclavian veins had returned to baseline but had increased for femoral‐site insertions (Table 4).
Most residents in the intervention group agreed that the educational session motivated them to remove unnecessary catheters, improve insertion‐related infection‐control practices, and place the catheter in an internal jugular or subclavian vein; some agreed because of the educational session, they were less likely to place a central venous catheter. Some reported successfully inserting a central venous catheter in the subclavian or internal jugular vein for the first time (Table 4).
DISCUSSION
An educational session designed to teach residents appropriate central venous catheter insertion practices that included simulated hands‐on training increased knowledge about insertion‐related complications and improved certain infection‐control practices. Although residents' confidence in inserting subclavian or internal jugular catheters initially improved, our training session did not change the choice of venous insertion site from femoral to subclavian or internal jugular veins, possibly because there were few opportunities for residents to insert a catheter during the 4‐week general medical ward rotations. Thus, although an active educational intervention improved the knowledge and confidence of residents, it had a minimal effect on behavior (only improved certain infection‐control practices). Catheter‐associated complications were infrequent and similar in the intervention and control groups.
Central venous catheter insertion is a skill that many general internists do not perform10; however, until recently the American Board of Internal Medicine considered it a requisite skill for internal medicine residents, and most residents at our hospital reported a desire to learn this skill. Although in our study complications were infrequent, suggesting that a change in venous insertion site is unlikely to dramatically improve patient safety, we believe that residents should become skilled at inserting catheters in internal jugular or subclavian veins, the currently recommended optimal venous insertion.8
There is evidence that single educational interventions are unlikely to result in substantial, sustained behavioral change, especially passive educational programs.11 However, a previous study documented a change in provider behavior and possibly a reduction in bloodstream infections after a single hands‐on training session.12 Our hands‐on educational format was very popular and likely improved some infection‐control practices but did not change provider behavior about choice of venous insertion site. In other institutions, mentoring residents on appropriate catheter insertion technique has been accomplished by establishing a procedure service13 or by resident rotation in a high‐volume location (eg, cardiac catheterization laboratory).14 Another option to facilitate behavioral change would be to provide a portable ultrasound machine, as requested by our residents, which may reduce complication rates.15, 16 At our hospital, we decided to supplement hands‐on training with expert bedside supervision during catheter insertion; the expert is provided through a procedure service that is led by hospitalists. The procedure service has a dedicated portable ultrasound machine to assist with internal jugular vein cannulation.
By the end of our study period, residents' confidence in subclavian or internal jugular catheter insertions had returned to presession levels; however, they reported increased confidence in femoral venous catheter insertions. These findings suggest that the session increased residents' confidence with catheter insertions in general, but not specifically for venous sites for which they had no previous experience. For subclavian or internal jugular catheter insertions, their confidence decayed to the presession baseline, likely because of few opportunities to insert catheters in patients; on average, each resident inserts 1 central venous catheter on the general medicine wards approximately every 4 months.
Our survey found that our intervention changed residents' attitudes about infection‐control practices. In particular, intervention‐group residents reported that they were more likely to remove unnecessary catheters and that they had used a mask and large drape during catheter insertion. Use of full‐barrier precautions (ie, sterile gloves and gown, large sterile drape, cap, and mask) has been shown to reduce the risk of bloodstream infection2 and is included in national guidelines.17 Adherence to these guidelines has been included in successful quality improvement initiatives.4, 5, 18 Compared to internists' adherence to recommendations for infection control reported in another survey,10 residents who attended our educational session reported more use of large sterile drapes (94% vs. 35%) or masks (75% vs. 66%); however, they were less likely to use a sterile gown (50% vs. 72%). Use of a large sterile drape is common in our hospital, likely because the drape is included in the central venous catheter package. We suspect that at our hospital, poor adherence to certain recommendations (eg, using a sterile gown) was due in part to difficulty accessing supplies. Another possibility is that use of a cap, compared to use of large drapes, is perceived as not giving the patient much additional protection. In fact, there is no evidence that using a cap provides benefit beyond that of other, more intuitively beneficial recommended infection‐control practices, such as using sterile gloves and a large sterile drape. The procedure service has addressed the supply problem by stocking hard‐to‐find items on a procedure cart.
Only 2 clinically evident complications associated with catheter insertion occurred (one patient with clinical sepsis and one with a hematoma). Although it is possible that we missed minor complications, our rates were similar to those reported by other investigators: clinically diagnosed venous thromboembolism, 0%2.2%3, 19, 20; pneumothorax, 1.4%21; catheter‐associated primary bloodstream infection, 1‐6/1000 catheter‐days.22, 23 Comparing complication rates was hindered by variability in definitions, methods of ascertainment, and populations evaluated. For example, the rate of venous thromboembolism was dramatically higher when routine diagnostic imaging was used, and detection of catheter‐associated infections likely increased when catheter‐tip cultures were routinely performed. We required clinical evidence of complications, and our study differs from others in that we evaluated general medicine ward patients.
This study had several limitations. Placement of central venous catheters on general medicine wards was less frequent than we anticipated based on a brief period of pilot data collection; therefore, our study was not powered to detect relatively small changes in venous insertion sites or differences in complications. Also, because direct observation was not possible, we relied on self‐reported adherence to infection‐control practices. However, intervention residents' self‐reported poor adherence to gown, glove, and cap use suggests that their responses were unbiased.
An educational session focused on central venous catheter insertion practices was well received by residents, increased their knowledge about complications, and improved infection‐control practices, but had no effect on increasing use of subclavian or internal jugular veins for catheter insertion. Despite continued frequent use of femoral venous catheters, clinically apparent complications were infrequent. However, we believe it is important to teach residents optimal catheter insertion techniques, including preferential placement of catheters in subclavian or internal jugular veins. Therefore, the section of hospital medicine at our hospital initiated a procedure service that provides expert bedside supervision, including use of a portable ultrasound machine, for catheter insertions.
Acknowledgements
The authors acknowledge Kathleen Murray for data collection and form development; Donald Blom for assistance with determining bloodstream infection; Laura Sadowski for developing and leading the focus group session; Yannis Guerra for assistance with the educational sessions; Oksana Barilyak, Anand Despande, and Saurabh Sharma for assistance with data collection; and chief residents Rony Ghaoui, Sean Halleran, Priya Kansal, Parag Sampat, and Sunita Nathan for interviewing residents about catheter insertions.
- ,,,,.Central vein catheterization. Failure and complication rates by three percutaneous approaches.Arch Intern Med.1986;146:259–261.
- ,,, et al.Prevention of central venous catheter‐related infections by using maximal sterile barrier precautions during insertion.Infect Control Hosp Epidemiol.1994;15:231–238.
- ,,, et al.Complications of femoral and subclavian venous catheterization in critically ill patients: a randomized controlled trial.JAMA.2001;286:700–707.
- ,,, et al.Eliminating catheter‐related bloodstream infections in the intensive care unit.Crit Care Med.2004;32:2014–2020.
- ,,, et al.The effect of an education program on the incidence of central venous catheter‐associated bloodstream infection in a medical ICU.Chest.2004;126:1612–1618.
- ,,, et al.Prevalence of the use of central venous access devices within and outside of the intensive care unit: results of a survey among hospitals in the prevention epicenter program of the Centers for Disease Control and Prevention.Infect Control Hosp Epidemiol.2003;24:942–945.
- ,,,,,.Unnecessary use of central venous catheters: the need to look outside the intensive care unit.Infect Control Hosp Epidemiol.2004;25:266–268.
- ,.Preventing complications of central venous catheterization.N Engl J Med.2003;348:1123–1133.
- ,,,,.CDC definitions for nosocomial infections, 1988.Am J Infect Control.1988;16:128–140.
- ,,,.Why is it that internists do not follow guidelines for preventing intravascular catheter infections?Infect Control Hosp Epidemiol.2005;26:525–533.
- ,,, et al.Changing provider behavior: an overview of systematic reviews of interventions.Med Care.2001;39:II2–II45.
- ,,, et al.Education of physicians‐in‐training can decrease the risk for vascular catheter infection.Ann Intern Med.2000;132:641–648.
- ,, et al.Creation of an innovative inpatient medical procedure service and a method to evaluate house staff competency.J Gen Intern Med.2004;19:510–513.
- ,,,.A curricular initiative for internal medicine residents to enhance proficiency in internal jugular central venous line placement.Mayo Clin Proc.2005;80:212–218.
- ,,,,,.Improvement of internal jugular vein cannulation using an ultrasound‐guided technique.Intensive Care Med.1997;23:916–919.
- ,,.Facilitation of internal jugular venous cannulation using an audio‐guided Doppler ultrasound vascular access device: results from a prospective, dual‐center, randomized, crossover clinical study.Crit Care Med.1995;23:60–65.
- ,,, et al.Guidelines for the prevention of intravascular catheter‐related infections.MMWR Morb Mortal Wkly Rep.2002;1(RR10):1–26.
- ,,, et al.The impact of bedside behavior on catheter‐related bacteremia in the intensive care unit.Arch Surg.2004;139:131–136.
- ,,,,,.A prospective evaluation of the use of femoral venous catheters in critically ill adults.Crit Care Med.1997;25:1986–1989.
- ,,,,.Deep venous thrombosis caused by femoral venous catheters in critically ill adult patients.Chest.2000;117:178–183.
- ,,.Complications of central venous catheters: internal jugular versus subclavian access—a systematic review.Crit Care Med.2002;30:454–460.
- ,,,,,.Prospective evaluation of risk factors for bloodstream infection in patients receiving home infusion therapy.Ann Intern Med.1999;131:340–347.
- ,,,.Nosocomial infections in combined medical‐surgical intensive care units in the United States.Infect Control Hosp Epidemiol.2000;21:510–515.
Copyright © 2007 Society of Hospital Medicine