User login

It’ s easy to find figures on what hospitalists earn these days, but if your own income doesn’t match up, does that mean you’re underpaid? Not necessarily.
The SHM Survey
There are several sources that provide figures on hospitalist income, but SHM offers an accurate, detailed—and the largest representative—picture of what hospitalists earn now. In spring 2006, SHM released its latest comprehensive survey of membership, “The 2005-2006 SHM Survey: The Authoritative Source on the State of the Hospitalist Movement.” The report is based on responses of 396 hospital medicine groups representing more than 2,500 hospitalists. However, Joseph A. Miller, senior vice president of SHM, warns that the survey’s salary figures may skew toward one or more specific demographics.
“In our survey, we have a number of respondents in each cell—academic, pediatric, etc.—as well as a range of geographic areas and other differences,” he says. “Anyone who looks at the metric needs to understand the factors behind it.”
John Nelson, MD, director, hospital practice, Overlake Hospital, Bellevue, Wash., and author of “Practice Management” for The Hospitalist, who has participated in developing and analyzing SHM surveys for years, agrees that the figures in the survey should be used as general guidelines only. “It’s easy to take individual metrics in a vacuum without considering the variables,” he warns.
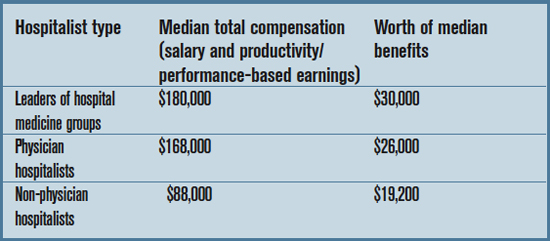
With these caveats in mind, the basic information on hospitalist compensation from the survey breaks down as follows: (table right)
To put these numbers in perspective, the median number of patient encounters per hospitalist was 2,328 per year, and the median number of work RVUs was 3,213.
Both leader- and physician-hospitalists have enjoyed an 8% increase in compensation, as well as an 8% increase in benefits, compared with the 2003-2004 survey. Non-physician hospitalists have seen a whopping increase in median income of 26% since 2003-2004. (Their benefits increased 7%.)
Perhaps the main reason for steadily increasing hospitalist incomes is that demand for hospitalists continues to exceed supply. “I’ve been trying to recruit hospitalists to my group for years,” says Dr. Nelson. “I thought that by 2002 or 2003, the number of available physicians would exceed the demand—but that hasn’t happened. It’s true that the number of doctors interested in hospital medicine has gone up pretty dramatically, but the demand went up even faster.”
By some estimates, says Dr. Nelson, there are two or three open positions for every hospitalist jobseeker.
—John Nelson, MD
Forms of Payment
To break these figures down further, income varies with type of compensation. In other words, how you are paid can influence how much you’re paid. Physician hospitalists who are paid 100% salary had a median income of $150,000. Those who are 100% productivity/performance-based make more money—a median income of $165,000; and those with a mixed-compensation model make the most of all, with a median income of $170,000.
Currently, according to the SHM survey, only 28% of respondents are 100% salary-based and 5% are 100% productivity/performance-based. The remaining majority (67%) is compensated with a combination of the two. Compared to the 2003-2004 SHM survey, the mixed compensation model increased from 47%.
“The portion of hospitalists paid via straight salary or based solely on production has been declining in the last few years,” says Dr. Nelson. “I think [a] low base and high productivity component is ideal, but [a] lower base does impede recruiting even if the total income is very attractive.”
IPC—The Hospitalist Company, one of the largest employers of hospitalists, uses the same combination of base salary and incentives for all physicians, regardless of their level of experience.
“We might change the salary figures slightly for different geographic areas, says Tim Lary, vice president of physician staffing for IPC, “but within our company, the average physician earns a little bit north of $200,000. A large portion earn over $300,000 because of our incentive plan.” That figure includes a base salary of approximately $150,000; the rest is comprised of incentives based on “typical counters” that hospitalists see, according to Lary, including productivity, quality indicators, and compliance.
Lary postulates that compensation is higher at a large organization like IPC because those employers have an infrastructure in place that ensures cost-effectiveness. “We have a 99.9% collection rate because we have a good central business office,” he says. “Small groups don’t have resources like that. We also do a great deal of training in proper coding techniques so that we can bill appropriately.”
A Grain of Salt
Before you barge in to your director’s office and ask for a raise, you should understand that the salaries summarized here have severe limitations and should be seen only as rough guidelines. There are major factors that can boost annual compensation, including:
- A heavy load of on-call, night, or weekend work;
- Employment in a geographic region with a shortage of physicians;
- Employment in a geographic region with higher physician incomes (such as the southeast);
- The type of practice you work for; and
- New practices recruiting hospitalists.
Also keep in mind that compensation totals include all bonuses and incentives received during the year.
Find Your Figure
Hospitalist income—particularly productivity-based income—is also directly affected by workload. Dr. Nelson suggests using the information in the SHM survey to find a rough guideline for productivity and compensation.
“Take the compensation figure from the survey for your region, production type, etc. and take the average production numbers from that same subgroup,” he says. “Then do the math to find the number of dollars per encounter or per RVU, and gauge your own numbers. If you have 25% more encounters, your income should be 25% higher than the average.”
The best rule of thumb for estimating what you should make, says Dr. Nelson, is to aim for five to 15% more than physicians working in traditional practice in your market. Unfortunately, information on what other doctors earn may not be readily available. Some sources (including a few listed in the sidebar to this article) provide information on all physician incomes, but is broken down by region at best. “You have to ask around,” says Dr. Nelson. “And if you’re interviewing, ask what they’re offering—then go and interview at a private practice and ask what they’re offering.”
In other words, there’s no easy way to tell if what you make is exactly on the mark for other hospitalists in your area—unless you ask those other hospitalists. But the SHM survey information should provide enough information to give you an idea. You can view an executive summary of the survey or purchase a complete copy at www.hospitalmedicine.org. TH
Jane Jerrard is the monthly writer for “Career Development.”
It’ s easy to find figures on what hospitalists earn these days, but if your own income doesn’t match up, does that mean you’re underpaid? Not necessarily.
The SHM Survey
There are several sources that provide figures on hospitalist income, but SHM offers an accurate, detailed—and the largest representative—picture of what hospitalists earn now. In spring 2006, SHM released its latest comprehensive survey of membership, “The 2005-2006 SHM Survey: The Authoritative Source on the State of the Hospitalist Movement.” The report is based on responses of 396 hospital medicine groups representing more than 2,500 hospitalists. However, Joseph A. Miller, senior vice president of SHM, warns that the survey’s salary figures may skew toward one or more specific demographics.
“In our survey, we have a number of respondents in each cell—academic, pediatric, etc.—as well as a range of geographic areas and other differences,” he says. “Anyone who looks at the metric needs to understand the factors behind it.”
John Nelson, MD, director, hospital practice, Overlake Hospital, Bellevue, Wash., and author of “Practice Management” for The Hospitalist, who has participated in developing and analyzing SHM surveys for years, agrees that the figures in the survey should be used as general guidelines only. “It’s easy to take individual metrics in a vacuum without considering the variables,” he warns.
With these caveats in mind, the basic information on hospitalist compensation from the survey breaks down as follows: (table right)
To put these numbers in perspective, the median number of patient encounters per hospitalist was 2,328 per year, and the median number of work RVUs was 3,213.
Both leader- and physician-hospitalists have enjoyed an 8% increase in compensation, as well as an 8% increase in benefits, compared with the 2003-2004 survey. Non-physician hospitalists have seen a whopping increase in median income of 26% since 2003-2004. (Their benefits increased 7%.)
Perhaps the main reason for steadily increasing hospitalist incomes is that demand for hospitalists continues to exceed supply. “I’ve been trying to recruit hospitalists to my group for years,” says Dr. Nelson. “I thought that by 2002 or 2003, the number of available physicians would exceed the demand—but that hasn’t happened. It’s true that the number of doctors interested in hospital medicine has gone up pretty dramatically, but the demand went up even faster.”
By some estimates, says Dr. Nelson, there are two or three open positions for every hospitalist jobseeker.
—John Nelson, MD
Forms of Payment
To break these figures down further, income varies with type of compensation. In other words, how you are paid can influence how much you’re paid. Physician hospitalists who are paid 100% salary had a median income of $150,000. Those who are 100% productivity/performance-based make more money—a median income of $165,000; and those with a mixed-compensation model make the most of all, with a median income of $170,000.
Currently, according to the SHM survey, only 28% of respondents are 100% salary-based and 5% are 100% productivity/performance-based. The remaining majority (67%) is compensated with a combination of the two. Compared to the 2003-2004 SHM survey, the mixed compensation model increased from 47%.
“The portion of hospitalists paid via straight salary or based solely on production has been declining in the last few years,” says Dr. Nelson. “I think [a] low base and high productivity component is ideal, but [a] lower base does impede recruiting even if the total income is very attractive.”
IPC—The Hospitalist Company, one of the largest employers of hospitalists, uses the same combination of base salary and incentives for all physicians, regardless of their level of experience.
“We might change the salary figures slightly for different geographic areas, says Tim Lary, vice president of physician staffing for IPC, “but within our company, the average physician earns a little bit north of $200,000. A large portion earn over $300,000 because of our incentive plan.” That figure includes a base salary of approximately $150,000; the rest is comprised of incentives based on “typical counters” that hospitalists see, according to Lary, including productivity, quality indicators, and compliance.
Lary postulates that compensation is higher at a large organization like IPC because those employers have an infrastructure in place that ensures cost-effectiveness. “We have a 99.9% collection rate because we have a good central business office,” he says. “Small groups don’t have resources like that. We also do a great deal of training in proper coding techniques so that we can bill appropriately.”
A Grain of Salt
Before you barge in to your director’s office and ask for a raise, you should understand that the salaries summarized here have severe limitations and should be seen only as rough guidelines. There are major factors that can boost annual compensation, including:
- A heavy load of on-call, night, or weekend work;
- Employment in a geographic region with a shortage of physicians;
- Employment in a geographic region with higher physician incomes (such as the southeast);
- The type of practice you work for; and
- New practices recruiting hospitalists.
Also keep in mind that compensation totals include all bonuses and incentives received during the year.
Find Your Figure
Hospitalist income—particularly productivity-based income—is also directly affected by workload. Dr. Nelson suggests using the information in the SHM survey to find a rough guideline for productivity and compensation.
“Take the compensation figure from the survey for your region, production type, etc. and take the average production numbers from that same subgroup,” he says. “Then do the math to find the number of dollars per encounter or per RVU, and gauge your own numbers. If you have 25% more encounters, your income should be 25% higher than the average.”
The best rule of thumb for estimating what you should make, says Dr. Nelson, is to aim for five to 15% more than physicians working in traditional practice in your market. Unfortunately, information on what other doctors earn may not be readily available. Some sources (including a few listed in the sidebar to this article) provide information on all physician incomes, but is broken down by region at best. “You have to ask around,” says Dr. Nelson. “And if you’re interviewing, ask what they’re offering—then go and interview at a private practice and ask what they’re offering.”
In other words, there’s no easy way to tell if what you make is exactly on the mark for other hospitalists in your area—unless you ask those other hospitalists. But the SHM survey information should provide enough information to give you an idea. You can view an executive summary of the survey or purchase a complete copy at www.hospitalmedicine.org. TH
Jane Jerrard is the monthly writer for “Career Development.”