User login
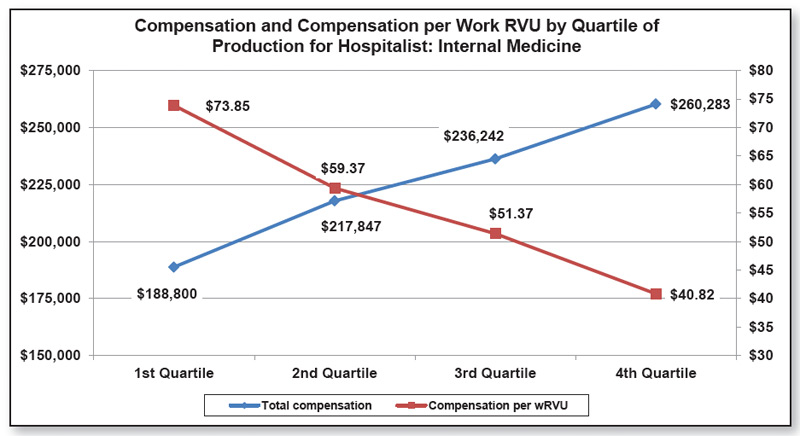
Perhaps one of the most interesting concepts in the 2011 SHM/MGMA State of Hospital Medicine report is illustrated by the potentially confusing graph, at right, which is reproduced from the report. By taking a few minutes to fully understand what the graph portrays, users can gain valuable insights into the relationship between productivity and compensation.
Let’s say I’m a hospitalist and my annual work RVU (wRVU) productivity is in the bottom 25% (first quartile) of all of the hospitalists who responded to the survey. My total compensation is likely to be relatively low—a median of $188,800—but my compensation per unit of work is likely to be relatively high—a median of $73.85 per wRVU.
On the other hand, if I’m a hospitalist with productivity in the top 25% of all hospitalists (fourth quartile), my overall compensation will probably be much higher—a median of $260,283—but my average compensation per unit of work has probably gone down quite a bit (note the median of $40.82 per wRVU).
Why is it that my compensation has gone up, but not at the same rate as my productivity?
Well, despite the increasing popularity of productivity incentives among HM groups in recent years, the majority of hospitalists still receive most of their pay in the form of a fixed salary. In fact, the survey, at right, found that the average hospitalist compensation package consists of about 80% fixed-base compensation, 16% productivity incentive, and 4% quality/performance incentive. Such compensation models give clear advantages to hospitalists with low productivity, and disadvantages to those with very high productivity.
Yes, many hospitalists can earn at least a bit more if they increase their productivity, but it’s often pennies on the dollar because neither their base salary nor their quality bonus components increase as their productivity goes up. Some of you might argue that compensation should rise in a straight line along with productivity, as it does in a practice with a 100% productivity-based compensation plan (some know this as the “eat what you treat” plan).
But what rises in a straight line can also fall in a straight line, and few hospitalists are comfortable with the risk of significant drops in income if their volume decreases for some reason.
Others might argue that it’s a good thing for compensation increases to taper off at high productivity levels, since this provides at least some reward for working harder but is less likely to incentivize people to work at unreasonable levels. And a few might argue that compensation per unit of work should actually increase at high productivity levels because once a hospitalist has covered their base salary and contribution to practice overhead, any additional revenue they bring into the practice is pure profit.
I have my opinions about these things, and I’m sure you do, too. But one of the things I like best about HM is the wide variety of practices out there. With so many hospitalist practices and so much variety, there’s a compensation model out there somewhere to suit everyone.