User login
Patients with human immunodeficiency virus (HIV) are at a 2‐ to 10‐fold greater risk for venous thromboembolism (VTE) compared with the general population.[1] Although antiphospholipid antibodies and protein S deficiency have often been cited as reasons for the thrombophilia associated with HIV, previous studies have also documented an increased risk of VTE with declining CD4+ cell count.[2, 3, 4, 5, 6, 7, 8] Worsening immune function places HIV patients at increased risk for opportunistic and nonopportunistic infections and malignancies, all independently associated with an increased risk of VTE.[5, 9, 10, 11, 12] Although increasing use of antiretroviral therapy has greatly decreased these sequelae, these complications of HIV infection are associated with an increased frequency of hospitalization.[13, 14, 15, 16] HIV infection and associated inflammation has been implicated in cardiovascular conditions such as cardiomyopathy, pulmonary hypertension, and myocardial infarction.[17, 18] Additionally, progression of HIV infection appears to influence T‐cell activation and differentiation in a manner that leads to early immunosenescence in infected individuals.[19, 20]
VTE prophylaxis is effective.[21] Virtually all efforts to decrease VTE have been focused on improving the prescription of prophylaxis with varying degrees of success.[22] These interventions have been employed with the tacit assumption that medication prescribed for inpatients will always be administered. However, at our institution, recent research has demonstrated that a significant proportion of prescribed thromboprophylaxis doses are not administered to hospitalized patients.[23] Refusal by the patient or a family member was the most commonly documented reason for dose nonadministration. In addition, the rate of thromboprophylaxis nonadministration varied greatly between nursing units with distinct patient populations. We hypothesized that nonadministration of VTE prophylaxis may be more common in patients with HIV, and this phenomenon may contribute to their increased risk for VTE.
The purpose of this study was to determine if the proportion of nonadministered thromboprophylaxis is greater among hospitalized patients with HIV and to characterize documented reasons for dose nonadministration.
METHODS
This study was conducted at The Johns Hopkins Hospital (JHH), a large, urban, academic medical center in Baltimore, Maryland. This single‐center retrospective cohort study utilized an existing dataset containing dose administration data extracted from an electronic medication administration record (eMAR). This dataset included information for all prescribed doses of thromboprophylaxis (heparin 5000 U subcutaneously every 8 or 12 hours, heparin 7500 U subcutaneously every 12 hours, enoxaparin 30 mg subcutaneously every 12 hours, or enoxaparin 40 mg subcutaneously daily) for patients hospitalized on medicine units at JHH from November 2007 to December 2008. This time period follows the implementation of an electronic order set for VTE prophylaxis.[24, 25] Data available for each dose included drug name, dose, frequency, patient demographics, and whether or not the dose was administered. Each dose not administered included a reason for nonadministration, which was chosen from a dropdown menu of responses on the eMAR by the nurse at the time the dose was due. A separate electronic report was obtained from an internal administrative database, which identified all patients within the dose administration dataset who had the International Classification of Diseases, 9th Revision code 042 (HIV diagnosis). A report identifying patient history numbers with matching diagnostic code for HIV was appended to the dose administration dataset using a relational database (Microsoft Access; Microsoft Corp., Redmond, WA) prior to analysis. The dose administration data were obtained previously for a separate analysis.[23] Approval for this study was granted from the institutional review board of Johns Hopkins Medicine.
Our analytic plan included comparisons between patients with and without HIV on a dose, patient, and unit level. As JHH operates a nursing unit dedicated to the inpatient care of patients with HIV, we included analyses of dose characteristics between this unit and other medicine units. It should be noted that patients without a diagnosis of HIV are sometimes cared for on this unit. Therefore, the electronic medical record for each patient without the diagnosis code for HIV hospitalized on this unit was reviewed to determine HIV status. An analysis was performed comparing visit identification numbers with diagnosis codes to identify potential seroconversions during the study period. Although we planned to compare nonadministration and documented refusal of doses on the unit level, a lack of patients with HIV on a number of units limited our ability to perform these analyses.
Statistical Analysis
The percent of doses not administered was calculated as the number of doses not administered divided by the number of doses prescribed. Likewise, the percent of prescribed doses documented as refused was calculated as the number of prescribed doses documented as refused divided by the number of doses prescribed. For each comparison, an odds ratio (OR) with 95% confidence interval (CI) was reported. Univariate and multivariate regression analyses were performed to assess the relationship between patient factors and dose nonadministration and documented refusal, respectively. Generalized estimating equations (GEE) using a logit link and an exchangeable correlation structure were used in these analyses. The GEE technique was used to account for within‐individual correlation of administration and documented refusal status.
Categorical data were compared using the two‐sided [2] test. Parametric and nonparametric continuous data were compared using the Student t test and Mann‐Whitney U test, respectively. A P value of <0.05 was considered statistically significant for all analyses. Analyses were performed using Minitab 15 (Minitab Inc., State College, PA) and Stata (StataCorp, College Station, TX).
RESULTS
During the 8‐month study period, 42,870 doses of thromboprophylaxis were prescribed during 4947 patient admissions to 13 individual medicine units. Overall, the diagnosis code for HIV was present in 12% of patient visits. The proportion of nonadministered doses per unit ranged from 6% to 27%, whereas the number of doses prescribed per unit ranged from 34 to 7301.
Patient characteristics were described on the visit level (Table 1). Patients with HIV were significantly younger, more often male and black, and had a longer length of stay compared with patients without HIV. Patients hospitalized on the HIV care unit had similar characteristics to the overall population of patients with HIV. It should be noted that not all patients cared for on this unit had a diagnosis of HIV, as patients from other medicine services are sometimes cared for in this location.
| Patients Without HIV | Patients With HIV | P | |
|---|---|---|---|
| |||
| Visits, n | 4,364 | 583 | N/A |
| Male, n (%) | 2,039 (47) | 370 (64) | <0.001 |
| Mean ageSD, y | 5618 | 469 | <0.001 |
| Race, n (%) | |||
| African American | 2,603 (60) | 522 (90) | <0.001 |
| Caucasian | 1,610 (37) | 53 (9) | <0.001 |
| Asian, Pacific Islander, other | 151 (4) | 8 (1) | 0.006 |
| Median length of stay (IQR), d | 3 (15) | 4 (27) | 0.002 |
| Marital status, n (%) | |||
| Single | 2,051 (47) | 471 (81) | <0.001 |
| Married | 1,405 (32) | 71 (12) | <0.001 |
| Widowed | 486 (11) | 10 (1) | <0.001 |
| Divorced | 402 (9) | 28 (5) | <0.001 |
| Separated | 33 (1) | 3 (1) | 0.607 |
| Unknown | 5 (0) | 0 (0) | 0.465 |
| Payor, n (%) | |||
| Medicare | 1,771 (41) | 133 (23) | <0.001 |
| Medicaid | 1,343 (31) | 392 (67) | <0.001 |
| Commercial | 1,181 (27) | 43 (7) | <0.001 |
| Other including self‐pay | 69 (1) | 15 (3) | 0.087 |
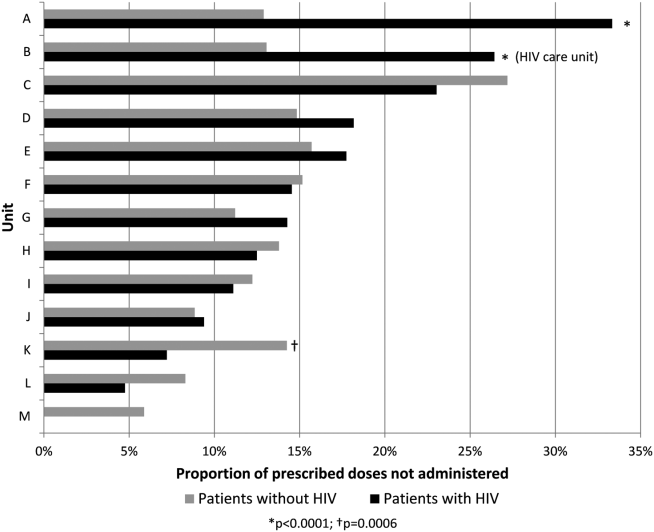
Overall, 17% of prescribed prophylaxis doses were not administered. A greater proportion of prescribed doses were not administered to patients with HIV compared with patients without HIV (23.5% vs 16.1%, OR: 1.59, 95% CI: 1.49‐1.70, P<0.001) (Table 2). Using a GEE and univariate regression, HIV diagnosis was associated with nonadministration of doses (OR: 1.37, 95% CI: 1.17‐1.60, P<0.001) (Table 3). Race, age, length of stay, and drug (heparin vs enoxaparin) were each associated with nonadministration. There was no significant association between nonadministration and sex, marital status, or payor. When stratified by nursing unit, there was substantial variation in the proportion of nonadministered doses between units. Within each unit, the proportion of doses not administered varied when stratified by HIV status. For example, on unit A, the proportion of doses not administered was greater for patients with HIV compared with patients without HIV (33.3% vs 12.9%, OR: 3.38, 95% CI: 2.61 to 4.37, P<0.001) (Figure 1). However, on unit K, the proportion of doses not administered to patients with HIV was 2‐fold less than in patients without HIV (7.2% vs 14.3%, OR: 0.47, 95% CI: 0.30‐0.74, P<0.001). Unit‐level analysis was not possible in regression models due to drastic imbalance in the prevalence of HIV across units. When comparing doses prescribed in the HIV care unit to all other medicine units, the proportion not administered (23.9% vs 16.3%, OR: 1.61, 95% CI: 1.49‐1.73, P<0.001) closely resembled the values seen when comparing patients with and without HIV hospital wide (23.5% vs 16.1%). However, when doses on the HIV care unit were stratified by HIV status, the doses not administered were 2‐fold greater, as a proportion, for patients with HIV compared with those without HIV (26.4% vs 13.1%, OR: 2.39, 95% CI: 1.93‐2.96, P<0.001).
| Doses Prescribed | Doses Not Administered (% of Doses Prescribed) | Doses Documented as Refused (% of All Doses Prescribed) | |
|---|---|---|---|
| |||
| All patients with HIV | 5,681 | 1,334 (23.5%)a | 935 (16.5%)a |
| All patients without HIV | 37,189 | 6,005 (16.1%) | 3,935 (10.6%) |
| HIV care unit | 4,452 | 1,063 (23.9%)a | 709 (15.9%)a |
| All other units | 38,418 | 6,276 (16.3%) | 4,161 (10.8%) |
| HIV care unit: patients with HIV | 3,602 | 952 (26.4%)a | 651 (18.1%)a |
| HIV care unit: patients without HIV | 850 | 111 (13.1%) | 58 (6.8%) |
| All other units: patients with HIV | 2,079 | 382 (18.4%)b | 284 (13.7%)a |
| All other units: patients without HIV | 36,339 | 5,894 (16.2%) | 3,877 (10.7%) |
| Nonadministered, n (%) | P | Documented as Refused, n (%) | P | |
|---|---|---|---|---|
| ||||
| Race | 0.001 | 0.072 | ||
| African American | 2,601 (17.8) | 1,708 (11.7) | ||
| Caucasian | 4,379 (16.4) | 2,922 (10.9) | ||
| Asian, Pacific Islander, other | 359 (23.4) | 240 (15.6) | ||
| HIV status | <0.001 | 0.002 | ||
| Negative | 6,005 (16.2) | 3,935 (10.6) | ||
| Positive | 1,344 (23.5) | 935 (16.5) | ||
| Age, y | <0.001 | <0.001 | ||
| 19 | 59 (20.6) | 44 (15.3) | ||
| 2029 | 1,260 (33.8) | 1,000 (26.8) | ||
| 3039 | 1,088 (28.1) | 845 (21.8) | ||
| 4049 | 1,628 (21.0) | 1,104 (14.2) | ||
| 5059 | 1,493 (16.1) | 953 (10.3) | ||
| 6069 | 900 (12.6) | 515 (7.2) | ||
| 7079 | 571 (9.6) | 250 (4.2) | ||
| 8089 | 252 (6.2) | 95 (2.3) | ||
| 90 | 88 (11.5) | 84 (8.4) | ||
| Sex | 0.372 | 0.919 | ||
| Male | 3,689 (17.3) | 2,392 (11.2) | ||
| Female | 3,650 (17.0) | 2,478 (11.5) | ||
| Drug | <0.001 | <0.001 | ||
| Heparin | 6,833 (18.4) | 4,515 (12.2) | ||
| Enoxaparin | 506 (8.9) | 355 (6.2) | ||
| Length of stay, d | <0.001 | <0.001 | ||
| 01 | 446 (24.3) | 282 (15.4) | ||
| 23 | 1,463 (19.4) | 971 (12.9) | ||
| 47 | 2,332 (18.9) | 1,620 (13.1) | ||
| 8 | 3,098 (14.6) | 1,997 (9.4) | ||
The results of the multivariate regression analyses with GEE are displayed in Table 4. HIV diagnosis, non‐African American race, and heparin (as compared with enoxaparin) were associated with increased likelihood of nonadministration. Increasing age and increasing length of stay were associated with decreased likelihood of nonadministration by a small but significant amount.
| OR of Nonadministration | 95% CI, P | OR of Documented Refusal | 95% CI, P | |
|---|---|---|---|---|
| ||||
| Race | ||||
| African American | 1.00 | Reference | 1.00 | Reference |
| Caucasian | 1.62 | 1.44‐1.81, <0.001 | 1.53 | 1.32‐1.77, <0.001 |
| Asian, Pacific Islander, Other | 1.54 | 1.19‐2.00, 0.001 | 1.48 | 1.07‐2.01, 0.019 |
| HIV status | ||||
| Negative | 1.00 | Reference | 1.00 | Reference |
| Positive | 1.21 | 1.001.45, 0.039 | 1.29 | 1.06‐1.56, 0.012 |
| Age, per year | 0.97 | 0.97‐0.98, <0.001 | 0.97 | 0.96‐0.97, <0.001 |
| Drug | ||||
| Heparin | 1.00 | Reference | 1.00 | Reference |
| Enoxaparin | 0.45 | 0.40‐0.51, <0.001 | 0.53 | 0.47‐0.61, <0.001 |
| Length of stay, per day | 0.991 | 0.987‐0.995, <0.001 | 0.989 | 0.983‐0.993, <0.001 |
The most commonly documented reason for nonadministration was refusal by the patient or family member (66% of all doses not administered). The second most common reason, patient condition not appropriate, accounted for an additional 10% of doses. Across all nursing units, the proportion of prescribed doses that were documented as refused was significantly greater for patients with HIV compared with patients without HIV (16.5% vs 10.6%, OR: 1.66, 95% CI: 1.54‐1.80, P<0.0001) (Table 2). Using the GEE and multivariate regression, HIV diagnosis, non‐African American race, and heparin were associated with increased risk of documented dose refusal. Age and length of stay were inversely related to the likelihood of documented dose refusal. When all administered doses were excluded from the analysis, the association between these variables and documented dose refusal were not as strong. Age and length of stay remained significantly inversely related; however, the other factors were no longer significantly positively associated with documented dose refusal.
Within the HIV care unit, the proportion of prescribed doses documented as refused was greater for patients with HIV compared with patients without HIV (18.1% vs 6.8%, OR: 3.01, 95% CI: 2.28‐3.99, P<0.0001). For all other medicine units, the proportion of nonadministered doses documented as refused was also greater for patients with HIV compared with patients without HIV (13.7% vs 10.7%, OR: 1.32, 95% CI: 1.16‐1.51, P<0.0001).
DISCUSSION
We have identified that nonadministration of thromboprophylaxis was more common among patients with HIV at our institution. Substantial variation in the proportion of doses not administered existed on the nursing unit level, as well as within each unit when stratified by HIV status. This disparity in dose administration was observed on the HIV care unit as well, as the proportion not administered was about 2‐fold greater for patients with HIV compared with those without HIV. Documented dose refusal appeared to account for the majority of nonadministered doses in our cohort. Our analysis also demonstrated that HIV diagnosis is significantly associated with both dose nonadministration and documented dose refusal at our institution.
Medication refusal is a well‐recognized phenomenon among hospitalized patients. A recent study of medication administration in hospitalized patients in the United Kingdom noted that refusal accounted for about 45% of omitted doses.[26] Fanikos et al. also found that documented refusal of doses contributed significantly to the overall number of VTE prophylaxis doses not administered to patients.[27] In our study, the proportion of nonadministered doses documented as refused by the patient or family member was significantly greater in patients with HIV than in patients without HIV across all units. Interestingly, the difference was greater on the HIV care unit when doses were stratified by HIV status. This observation leads us to hypothesize that specific hospital care environments may influence dose nonadministration and refusal rates among our patient population.
Based on regression analyses, increasing age and length of stay were associated with a decreased likelihood of any particular dose not being administered and with any particular dose being documented as refused. It is important to note that our GEE did not take into account date or time of each dose, and therefore we cannot make conclusions as to the likelihood of dose nonadministration or refusal of doses in relation to each other on a time scale. One cannot assume that a dose due later in a hospital course was more or less likely to be given than a dose due on the first hospital day. Although we did not expect these findings, one can hypothesize that patients who are older or have longer stays may be perceived to have more severe illness, and therefore greater need for prophylaxis, from nursing staff and others involved in their care. The associations were small but significant and warrant future investigation.
To our knowledge, this is the first investigation comparing the proportion of nonadministered doses of thromboprophylaxis between patients with and without HIV. Our data show that nonadministered doses and refused doses of thromboprophylaxis are more frequent among patients with HIV. In addition, we noted that nonadministration was more common on the dedicated HIV care unit compared with other units. We cannot currently offer a clear explanation for the disparity observed between units, and more specifically, within the HIV care unit. However, it is possible that a unique culture of care and provider‐specific factors may contribute.
Our study was limited by a number of factors. Seroconversion among patients during the study period was possible; however, our analysis revealed only 2 instances among nearly 4000 unique patients. A more significant limitation was the level of analysis allowed by the dataset. We examined dose characteristics on a dose and unit level, but the ability to analyze doses based on the prescriber and nurse level may have provided valuable insight into the specific reasons behind the observations presented here. Additionally, the specific unit assigned to a given dose in our dataset represented the discharge location for the corresponding patient, making it possible that some amount of nonadministered doses may be attributed to the incorrect unit. However, we do not believe that unit‐to‐unit transfers would be frequent enough to influence the overall results. In addition, we did not link nonadministration of thromboprophylaxis with VTE events, as these data were not present in the current dataset. Although this is a limitation of the current study, we believe that the notion that missed doses of thromboprophylaxis place patients at higher risk for VTE is plausible, as the efficacy of thromboprophylaxis is well established.[28, 29, 30] It is important to note that the reason for nonadministration selected by the nurse on the eMAR may not always represent the only reason or even the true reason for dose nonadministration. It is possible that dose refusal may be over‐represented in our sample, in part due to inaccurate documentation. Recent investigations at JHH have identified varying attitudes on the part of the patient and the nurse regarding thromboprophylaxis. A questionnaire and interview of patients showed a large knowledge gap regarding thromboprophylaxis, with many individuals unable to explain its role or significance in their medical care.[31] A common theme was also observed in a survey of nurses regarding VTE prophylaxis: doses were sometimes considered optional for reasons such as ambulation status, perceived severity of illness, or reason for hospitalization. Some nurses also reported that after an initial refused dose, they may continue to document subsequent doses as refused, sometimes without offering the dose to the patient.[32] As variation in practice was observed between individual nurses, it is also likely that the culture of care may vary between units, influencing thromboprophylaxis nonadministration rates as well as documentation of doses as refused. The dose‐level data used for the GEE analyses did not include date and time of administration, which limited the ability of the GEE to more completely account for autocorrelation.
To further investigate the findings of this and related studies, we intend to more closely analyze data at multiple levels with the goal of identifying an appropriate and feasible target for intervention. Additionally, further investigation should be performed with the goal of determining the relationship between decreased exposure to thromboprophylaxis and VTE. However, as patients with HIV appear to be at increased risk of VTE, ensuring that thromboprophylaxis is delivered appropriately and consistently should be an important goal for all who provide care to this population.
- , , , , . Venous thromboembolism in patients with HIV/AIDS: a case‐control study. J Acquir Immune Defic Syndr. 2008;48(3):310–314.
- , , . AIDS and thrombosis: retrospective study of 131 HIV‐infected patients. AIDS Patient Care STDS. 2001;15(6):311–320.
- , , , et al. HIV and risk of venous thromboembolism: a Danish nationwide population‐based cohort study. HIV Med. 2011;12(4):202–210.
- , , , . Epidemiology of thrombosis in HIV‐infected individuals. The adult/adolescent spectrum of HIV disease project. AIDS. 2000;14(3):321–324.
- , , . Thrombotic complications in patients infected with HIV in the era of highly active antiretroviral therapy: a case series. Clin Infect Dis. 2004;39(8):1214–1222.
- , , . Circulating coagulation inhibitors in the acquired immunodeficiency syndrome. Ann Intern Med. 1986;104(2):175–180.
- , . The pathogenesis of the antiphospholipid syndrome. N Engl J Med. 2013;368(11):1033–1044.
- , , , . Acquired protein C and protein S deficiency in HIV‐infected patients. Clin Appl Thromb Hemost. 2003;9(4):325–331.
- , , , et al. Antiphospholipid syndrome associated with cytomegalovirus infection: case report and review. Clin Infect Dis. 1997;24(2):197–200.
- , . Viral infections and antiphospholipid antibodies. Semin Arthritis Rheum. 2002;31(4):256–263.
- , . AIDS‐defining and non‐AIDS‐defining malignancies: cancer occurrence in the antiretroviral therapy era. Curr Opin Oncol. 2007;19(5):446–451.
- , , , , . Pathogenesis, clinical and laboratory aspects of thrombosis in cancer. J Thromb Thrombolysis. 2007;24(1):29–38.
- , , , et al. Patterns of diagnoses in hospital admissions in a multistate cohort of HIV‐positive adults in 2001. Med Care. 2005;43(9 suppl):III3–III14.
- , , , et al. Opportunistic infections as causes of death in HIV‐infected patients in the HAART era in France. Scand J Infect Dis. 2005;37(6‐7):482–487.
- , , , et al. Rates of hospitalizations and associated diagnoses in a large multisite cohort of HIV patients in the United States, 1994–2005. AIDS. 2008;22(11):1345–1354.
- , , . Hospitalizations for metabolic conditions, opportunistic infections, and injection drug use among HIV patients: trends between 1996 and 2000 in 12 states. J Acquir Immune Defic Syndr. 2005;40(5):609–616.
- , , , , , . Cardiovascular disease in HIV infection. Am Heart J. 2006;151:1147–1155.
- , , , et al. Epidemiological evidence for cardiovascular disease in HIV‐infected patients and relationship to highly active antiretroviral therapy. Circulation. 2008;118(2):e29–e35.
- , , , et al. Immune activation and CD8+ T‐cell differentiation towards senescence in HIV‐1 infection. PLoS Biol. 2004;2(2):E20.
- , , , , . CD4 T cell depletion is linked directly to immune activation in the pathogenesis of HIV‐1 and HIV‐2 but only indirectly to the viral load. J Immunol. 2002;169(6):3400–3406.
- , . Thromboprophylaxis in nonsurgical patients. Hematology Am Soc Hematol Educ Program. 2012;2012:631–637.
- , . Practices to prevent venous thromboembolism [published online ahead of print May 24, 2013]. BMJ Qual Saf. doi:10.1136/bmjqs‐2012‐001782.
- , , , et al. Patterns of non‐administration of ordered doses of venous thromboembolism prophylaxis: implications for novel intervention strategies. PLoS One. 2013;8(6):e66311.
- , , , et al. Lessons from The Johns Hopkins multi‐disciplinary venous thromboembolism (VTE) prevention collaborative. BMJ. 2012;344:e3935.
- , , , et al. Impact of a venous thromboembolism prophylaxis “smart order set”: improved compliance, fewer events [published online ahead of print April 4, 2013]. Am J Hematol. doi: 10.1002/ajh.23450.
- , , . Dose omissions in hospitalized patients in a UK hospital: an analysis of the relative contribution of adverse drug reactions. Drug Saf. 2012;35(8):677–683.
- , , , et al. Adherence to pharmacological thromboprophylaxis orders in hospitalized patients. Am J Med. 2010;123(6):536–541.
- , , , et al. A comparison of enoxaparin with placebo for the prevention of venous thromboembolism in acutely ill medical patients. Prophylaxis in medical patients with enoxaparin study group. N Engl J Med. 1999;341(11):793–800.
- , , , et al. Randomized, placebo‐controlled trial of dalteparin for the prevention of venous thromboembolism in acutely ill medical patients. Circulation. 2004;110(7):874–879.
- , , , et al. Efficacy and safety of fondaparinux for the prevention of venous thromboembolism in older acute medical patients: randomised placebo controlled trial. BMJ. 2006;332(7537):325–329.
- , , , et al. Patient perspectives on pharmacological venous thromboembolism prophylaxis at The Johns Hopkins Hospital. J Thromb Thrombolysis. 2013;35(3):416.
- , , , et al. Culture of care and documented patient refusal of pharmacologic venous thromboembolism prophylaxis. J Thromb Thrombolysis. 2011;31(3):367–400.
Patients with human immunodeficiency virus (HIV) are at a 2‐ to 10‐fold greater risk for venous thromboembolism (VTE) compared with the general population.[1] Although antiphospholipid antibodies and protein S deficiency have often been cited as reasons for the thrombophilia associated with HIV, previous studies have also documented an increased risk of VTE with declining CD4+ cell count.[2, 3, 4, 5, 6, 7, 8] Worsening immune function places HIV patients at increased risk for opportunistic and nonopportunistic infections and malignancies, all independently associated with an increased risk of VTE.[5, 9, 10, 11, 12] Although increasing use of antiretroviral therapy has greatly decreased these sequelae, these complications of HIV infection are associated with an increased frequency of hospitalization.[13, 14, 15, 16] HIV infection and associated inflammation has been implicated in cardiovascular conditions such as cardiomyopathy, pulmonary hypertension, and myocardial infarction.[17, 18] Additionally, progression of HIV infection appears to influence T‐cell activation and differentiation in a manner that leads to early immunosenescence in infected individuals.[19, 20]
VTE prophylaxis is effective.[21] Virtually all efforts to decrease VTE have been focused on improving the prescription of prophylaxis with varying degrees of success.[22] These interventions have been employed with the tacit assumption that medication prescribed for inpatients will always be administered. However, at our institution, recent research has demonstrated that a significant proportion of prescribed thromboprophylaxis doses are not administered to hospitalized patients.[23] Refusal by the patient or a family member was the most commonly documented reason for dose nonadministration. In addition, the rate of thromboprophylaxis nonadministration varied greatly between nursing units with distinct patient populations. We hypothesized that nonadministration of VTE prophylaxis may be more common in patients with HIV, and this phenomenon may contribute to their increased risk for VTE.
The purpose of this study was to determine if the proportion of nonadministered thromboprophylaxis is greater among hospitalized patients with HIV and to characterize documented reasons for dose nonadministration.
METHODS
This study was conducted at The Johns Hopkins Hospital (JHH), a large, urban, academic medical center in Baltimore, Maryland. This single‐center retrospective cohort study utilized an existing dataset containing dose administration data extracted from an electronic medication administration record (eMAR). This dataset included information for all prescribed doses of thromboprophylaxis (heparin 5000 U subcutaneously every 8 or 12 hours, heparin 7500 U subcutaneously every 12 hours, enoxaparin 30 mg subcutaneously every 12 hours, or enoxaparin 40 mg subcutaneously daily) for patients hospitalized on medicine units at JHH from November 2007 to December 2008. This time period follows the implementation of an electronic order set for VTE prophylaxis.[24, 25] Data available for each dose included drug name, dose, frequency, patient demographics, and whether or not the dose was administered. Each dose not administered included a reason for nonadministration, which was chosen from a dropdown menu of responses on the eMAR by the nurse at the time the dose was due. A separate electronic report was obtained from an internal administrative database, which identified all patients within the dose administration dataset who had the International Classification of Diseases, 9th Revision code 042 (HIV diagnosis). A report identifying patient history numbers with matching diagnostic code for HIV was appended to the dose administration dataset using a relational database (Microsoft Access; Microsoft Corp., Redmond, WA) prior to analysis. The dose administration data were obtained previously for a separate analysis.[23] Approval for this study was granted from the institutional review board of Johns Hopkins Medicine.
Our analytic plan included comparisons between patients with and without HIV on a dose, patient, and unit level. As JHH operates a nursing unit dedicated to the inpatient care of patients with HIV, we included analyses of dose characteristics between this unit and other medicine units. It should be noted that patients without a diagnosis of HIV are sometimes cared for on this unit. Therefore, the electronic medical record for each patient without the diagnosis code for HIV hospitalized on this unit was reviewed to determine HIV status. An analysis was performed comparing visit identification numbers with diagnosis codes to identify potential seroconversions during the study period. Although we planned to compare nonadministration and documented refusal of doses on the unit level, a lack of patients with HIV on a number of units limited our ability to perform these analyses.
Statistical Analysis
The percent of doses not administered was calculated as the number of doses not administered divided by the number of doses prescribed. Likewise, the percent of prescribed doses documented as refused was calculated as the number of prescribed doses documented as refused divided by the number of doses prescribed. For each comparison, an odds ratio (OR) with 95% confidence interval (CI) was reported. Univariate and multivariate regression analyses were performed to assess the relationship between patient factors and dose nonadministration and documented refusal, respectively. Generalized estimating equations (GEE) using a logit link and an exchangeable correlation structure were used in these analyses. The GEE technique was used to account for within‐individual correlation of administration and documented refusal status.
Categorical data were compared using the two‐sided [2] test. Parametric and nonparametric continuous data were compared using the Student t test and Mann‐Whitney U test, respectively. A P value of <0.05 was considered statistically significant for all analyses. Analyses were performed using Minitab 15 (Minitab Inc., State College, PA) and Stata (StataCorp, College Station, TX).
RESULTS
During the 8‐month study period, 42,870 doses of thromboprophylaxis were prescribed during 4947 patient admissions to 13 individual medicine units. Overall, the diagnosis code for HIV was present in 12% of patient visits. The proportion of nonadministered doses per unit ranged from 6% to 27%, whereas the number of doses prescribed per unit ranged from 34 to 7301.
Patient characteristics were described on the visit level (Table 1). Patients with HIV were significantly younger, more often male and black, and had a longer length of stay compared with patients without HIV. Patients hospitalized on the HIV care unit had similar characteristics to the overall population of patients with HIV. It should be noted that not all patients cared for on this unit had a diagnosis of HIV, as patients from other medicine services are sometimes cared for in this location.
| Patients Without HIV | Patients With HIV | P | |
|---|---|---|---|
| |||
| Visits, n | 4,364 | 583 | N/A |
| Male, n (%) | 2,039 (47) | 370 (64) | <0.001 |
| Mean ageSD, y | 5618 | 469 | <0.001 |
| Race, n (%) | |||
| African American | 2,603 (60) | 522 (90) | <0.001 |
| Caucasian | 1,610 (37) | 53 (9) | <0.001 |
| Asian, Pacific Islander, other | 151 (4) | 8 (1) | 0.006 |
| Median length of stay (IQR), d | 3 (15) | 4 (27) | 0.002 |
| Marital status, n (%) | |||
| Single | 2,051 (47) | 471 (81) | <0.001 |
| Married | 1,405 (32) | 71 (12) | <0.001 |
| Widowed | 486 (11) | 10 (1) | <0.001 |
| Divorced | 402 (9) | 28 (5) | <0.001 |
| Separated | 33 (1) | 3 (1) | 0.607 |
| Unknown | 5 (0) | 0 (0) | 0.465 |
| Payor, n (%) | |||
| Medicare | 1,771 (41) | 133 (23) | <0.001 |
| Medicaid | 1,343 (31) | 392 (67) | <0.001 |
| Commercial | 1,181 (27) | 43 (7) | <0.001 |
| Other including self‐pay | 69 (1) | 15 (3) | 0.087 |
Overall, 17% of prescribed prophylaxis doses were not administered. A greater proportion of prescribed doses were not administered to patients with HIV compared with patients without HIV (23.5% vs 16.1%, OR: 1.59, 95% CI: 1.49‐1.70, P<0.001) (Table 2). Using a GEE and univariate regression, HIV diagnosis was associated with nonadministration of doses (OR: 1.37, 95% CI: 1.17‐1.60, P<0.001) (Table 3). Race, age, length of stay, and drug (heparin vs enoxaparin) were each associated with nonadministration. There was no significant association between nonadministration and sex, marital status, or payor. When stratified by nursing unit, there was substantial variation in the proportion of nonadministered doses between units. Within each unit, the proportion of doses not administered varied when stratified by HIV status. For example, on unit A, the proportion of doses not administered was greater for patients with HIV compared with patients without HIV (33.3% vs 12.9%, OR: 3.38, 95% CI: 2.61 to 4.37, P<0.001) (Figure 1). However, on unit K, the proportion of doses not administered to patients with HIV was 2‐fold less than in patients without HIV (7.2% vs 14.3%, OR: 0.47, 95% CI: 0.30‐0.74, P<0.001). Unit‐level analysis was not possible in regression models due to drastic imbalance in the prevalence of HIV across units. When comparing doses prescribed in the HIV care unit to all other medicine units, the proportion not administered (23.9% vs 16.3%, OR: 1.61, 95% CI: 1.49‐1.73, P<0.001) closely resembled the values seen when comparing patients with and without HIV hospital wide (23.5% vs 16.1%). However, when doses on the HIV care unit were stratified by HIV status, the doses not administered were 2‐fold greater, as a proportion, for patients with HIV compared with those without HIV (26.4% vs 13.1%, OR: 2.39, 95% CI: 1.93‐2.96, P<0.001).
| Doses Prescribed | Doses Not Administered (% of Doses Prescribed) | Doses Documented as Refused (% of All Doses Prescribed) | |
|---|---|---|---|
| |||
| All patients with HIV | 5,681 | 1,334 (23.5%)a | 935 (16.5%)a |
| All patients without HIV | 37,189 | 6,005 (16.1%) | 3,935 (10.6%) |
| HIV care unit | 4,452 | 1,063 (23.9%)a | 709 (15.9%)a |
| All other units | 38,418 | 6,276 (16.3%) | 4,161 (10.8%) |
| HIV care unit: patients with HIV | 3,602 | 952 (26.4%)a | 651 (18.1%)a |
| HIV care unit: patients without HIV | 850 | 111 (13.1%) | 58 (6.8%) |
| All other units: patients with HIV | 2,079 | 382 (18.4%)b | 284 (13.7%)a |
| All other units: patients without HIV | 36,339 | 5,894 (16.2%) | 3,877 (10.7%) |
| Nonadministered, n (%) | P | Documented as Refused, n (%) | P | |
|---|---|---|---|---|
| ||||
| Race | 0.001 | 0.072 | ||
| African American | 2,601 (17.8) | 1,708 (11.7) | ||
| Caucasian | 4,379 (16.4) | 2,922 (10.9) | ||
| Asian, Pacific Islander, other | 359 (23.4) | 240 (15.6) | ||
| HIV status | <0.001 | 0.002 | ||
| Negative | 6,005 (16.2) | 3,935 (10.6) | ||
| Positive | 1,344 (23.5) | 935 (16.5) | ||
| Age, y | <0.001 | <0.001 | ||
| 19 | 59 (20.6) | 44 (15.3) | ||
| 2029 | 1,260 (33.8) | 1,000 (26.8) | ||
| 3039 | 1,088 (28.1) | 845 (21.8) | ||
| 4049 | 1,628 (21.0) | 1,104 (14.2) | ||
| 5059 | 1,493 (16.1) | 953 (10.3) | ||
| 6069 | 900 (12.6) | 515 (7.2) | ||
| 7079 | 571 (9.6) | 250 (4.2) | ||
| 8089 | 252 (6.2) | 95 (2.3) | ||
| 90 | 88 (11.5) | 84 (8.4) | ||
| Sex | 0.372 | 0.919 | ||
| Male | 3,689 (17.3) | 2,392 (11.2) | ||
| Female | 3,650 (17.0) | 2,478 (11.5) | ||
| Drug | <0.001 | <0.001 | ||
| Heparin | 6,833 (18.4) | 4,515 (12.2) | ||
| Enoxaparin | 506 (8.9) | 355 (6.2) | ||
| Length of stay, d | <0.001 | <0.001 | ||
| 01 | 446 (24.3) | 282 (15.4) | ||
| 23 | 1,463 (19.4) | 971 (12.9) | ||
| 47 | 2,332 (18.9) | 1,620 (13.1) | ||
| 8 | 3,098 (14.6) | 1,997 (9.4) | ||
The results of the multivariate regression analyses with GEE are displayed in Table 4. HIV diagnosis, non‐African American race, and heparin (as compared with enoxaparin) were associated with increased likelihood of nonadministration. Increasing age and increasing length of stay were associated with decreased likelihood of nonadministration by a small but significant amount.
| OR of Nonadministration | 95% CI, P | OR of Documented Refusal | 95% CI, P | |
|---|---|---|---|---|
| ||||
| Race | ||||
| African American | 1.00 | Reference | 1.00 | Reference |
| Caucasian | 1.62 | 1.44‐1.81, <0.001 | 1.53 | 1.32‐1.77, <0.001 |
| Asian, Pacific Islander, Other | 1.54 | 1.19‐2.00, 0.001 | 1.48 | 1.07‐2.01, 0.019 |
| HIV status | ||||
| Negative | 1.00 | Reference | 1.00 | Reference |
| Positive | 1.21 | 1.001.45, 0.039 | 1.29 | 1.06‐1.56, 0.012 |
| Age, per year | 0.97 | 0.97‐0.98, <0.001 | 0.97 | 0.96‐0.97, <0.001 |
| Drug | ||||
| Heparin | 1.00 | Reference | 1.00 | Reference |
| Enoxaparin | 0.45 | 0.40‐0.51, <0.001 | 0.53 | 0.47‐0.61, <0.001 |
| Length of stay, per day | 0.991 | 0.987‐0.995, <0.001 | 0.989 | 0.983‐0.993, <0.001 |
The most commonly documented reason for nonadministration was refusal by the patient or family member (66% of all doses not administered). The second most common reason, patient condition not appropriate, accounted for an additional 10% of doses. Across all nursing units, the proportion of prescribed doses that were documented as refused was significantly greater for patients with HIV compared with patients without HIV (16.5% vs 10.6%, OR: 1.66, 95% CI: 1.54‐1.80, P<0.0001) (Table 2). Using the GEE and multivariate regression, HIV diagnosis, non‐African American race, and heparin were associated with increased risk of documented dose refusal. Age and length of stay were inversely related to the likelihood of documented dose refusal. When all administered doses were excluded from the analysis, the association between these variables and documented dose refusal were not as strong. Age and length of stay remained significantly inversely related; however, the other factors were no longer significantly positively associated with documented dose refusal.
Within the HIV care unit, the proportion of prescribed doses documented as refused was greater for patients with HIV compared with patients without HIV (18.1% vs 6.8%, OR: 3.01, 95% CI: 2.28‐3.99, P<0.0001). For all other medicine units, the proportion of nonadministered doses documented as refused was also greater for patients with HIV compared with patients without HIV (13.7% vs 10.7%, OR: 1.32, 95% CI: 1.16‐1.51, P<0.0001).
DISCUSSION
We have identified that nonadministration of thromboprophylaxis was more common among patients with HIV at our institution. Substantial variation in the proportion of doses not administered existed on the nursing unit level, as well as within each unit when stratified by HIV status. This disparity in dose administration was observed on the HIV care unit as well, as the proportion not administered was about 2‐fold greater for patients with HIV compared with those without HIV. Documented dose refusal appeared to account for the majority of nonadministered doses in our cohort. Our analysis also demonstrated that HIV diagnosis is significantly associated with both dose nonadministration and documented dose refusal at our institution.
Medication refusal is a well‐recognized phenomenon among hospitalized patients. A recent study of medication administration in hospitalized patients in the United Kingdom noted that refusal accounted for about 45% of omitted doses.[26] Fanikos et al. also found that documented refusal of doses contributed significantly to the overall number of VTE prophylaxis doses not administered to patients.[27] In our study, the proportion of nonadministered doses documented as refused by the patient or family member was significantly greater in patients with HIV than in patients without HIV across all units. Interestingly, the difference was greater on the HIV care unit when doses were stratified by HIV status. This observation leads us to hypothesize that specific hospital care environments may influence dose nonadministration and refusal rates among our patient population.
Based on regression analyses, increasing age and length of stay were associated with a decreased likelihood of any particular dose not being administered and with any particular dose being documented as refused. It is important to note that our GEE did not take into account date or time of each dose, and therefore we cannot make conclusions as to the likelihood of dose nonadministration or refusal of doses in relation to each other on a time scale. One cannot assume that a dose due later in a hospital course was more or less likely to be given than a dose due on the first hospital day. Although we did not expect these findings, one can hypothesize that patients who are older or have longer stays may be perceived to have more severe illness, and therefore greater need for prophylaxis, from nursing staff and others involved in their care. The associations were small but significant and warrant future investigation.
To our knowledge, this is the first investigation comparing the proportion of nonadministered doses of thromboprophylaxis between patients with and without HIV. Our data show that nonadministered doses and refused doses of thromboprophylaxis are more frequent among patients with HIV. In addition, we noted that nonadministration was more common on the dedicated HIV care unit compared with other units. We cannot currently offer a clear explanation for the disparity observed between units, and more specifically, within the HIV care unit. However, it is possible that a unique culture of care and provider‐specific factors may contribute.
Our study was limited by a number of factors. Seroconversion among patients during the study period was possible; however, our analysis revealed only 2 instances among nearly 4000 unique patients. A more significant limitation was the level of analysis allowed by the dataset. We examined dose characteristics on a dose and unit level, but the ability to analyze doses based on the prescriber and nurse level may have provided valuable insight into the specific reasons behind the observations presented here. Additionally, the specific unit assigned to a given dose in our dataset represented the discharge location for the corresponding patient, making it possible that some amount of nonadministered doses may be attributed to the incorrect unit. However, we do not believe that unit‐to‐unit transfers would be frequent enough to influence the overall results. In addition, we did not link nonadministration of thromboprophylaxis with VTE events, as these data were not present in the current dataset. Although this is a limitation of the current study, we believe that the notion that missed doses of thromboprophylaxis place patients at higher risk for VTE is plausible, as the efficacy of thromboprophylaxis is well established.[28, 29, 30] It is important to note that the reason for nonadministration selected by the nurse on the eMAR may not always represent the only reason or even the true reason for dose nonadministration. It is possible that dose refusal may be over‐represented in our sample, in part due to inaccurate documentation. Recent investigations at JHH have identified varying attitudes on the part of the patient and the nurse regarding thromboprophylaxis. A questionnaire and interview of patients showed a large knowledge gap regarding thromboprophylaxis, with many individuals unable to explain its role or significance in their medical care.[31] A common theme was also observed in a survey of nurses regarding VTE prophylaxis: doses were sometimes considered optional for reasons such as ambulation status, perceived severity of illness, or reason for hospitalization. Some nurses also reported that after an initial refused dose, they may continue to document subsequent doses as refused, sometimes without offering the dose to the patient.[32] As variation in practice was observed between individual nurses, it is also likely that the culture of care may vary between units, influencing thromboprophylaxis nonadministration rates as well as documentation of doses as refused. The dose‐level data used for the GEE analyses did not include date and time of administration, which limited the ability of the GEE to more completely account for autocorrelation.
To further investigate the findings of this and related studies, we intend to more closely analyze data at multiple levels with the goal of identifying an appropriate and feasible target for intervention. Additionally, further investigation should be performed with the goal of determining the relationship between decreased exposure to thromboprophylaxis and VTE. However, as patients with HIV appear to be at increased risk of VTE, ensuring that thromboprophylaxis is delivered appropriately and consistently should be an important goal for all who provide care to this population.
- , , , , . Venous thromboembolism in patients with HIV/AIDS: a case‐control study. J Acquir Immune Defic Syndr. 2008;48(3):310–314.
- , , . AIDS and thrombosis: retrospective study of 131 HIV‐infected patients. AIDS Patient Care STDS. 2001;15(6):311–320.
- , , , et al. HIV and risk of venous thromboembolism: a Danish nationwide population‐based cohort study. HIV Med. 2011;12(4):202–210.
- , , , . Epidemiology of thrombosis in HIV‐infected individuals. The adult/adolescent spectrum of HIV disease project. AIDS. 2000;14(3):321–324.
- , , . Thrombotic complications in patients infected with HIV in the era of highly active antiretroviral therapy: a case series. Clin Infect Dis. 2004;39(8):1214–1222.
- , , . Circulating coagulation inhibitors in the acquired immunodeficiency syndrome. Ann Intern Med. 1986;104(2):175–180.
- , . The pathogenesis of the antiphospholipid syndrome. N Engl J Med. 2013;368(11):1033–1044.
- , , , . Acquired protein C and protein S deficiency in HIV‐infected patients. Clin Appl Thromb Hemost. 2003;9(4):325–331.
- , , , et al. Antiphospholipid syndrome associated with cytomegalovirus infection: case report and review. Clin Infect Dis. 1997;24(2):197–200.
- , . Viral infections and antiphospholipid antibodies. Semin Arthritis Rheum. 2002;31(4):256–263.
- , . AIDS‐defining and non‐AIDS‐defining malignancies: cancer occurrence in the antiretroviral therapy era. Curr Opin Oncol. 2007;19(5):446–451.
- , , , , . Pathogenesis, clinical and laboratory aspects of thrombosis in cancer. J Thromb Thrombolysis. 2007;24(1):29–38.
- , , , et al. Patterns of diagnoses in hospital admissions in a multistate cohort of HIV‐positive adults in 2001. Med Care. 2005;43(9 suppl):III3–III14.
- , , , et al. Opportunistic infections as causes of death in HIV‐infected patients in the HAART era in France. Scand J Infect Dis. 2005;37(6‐7):482–487.
- , , , et al. Rates of hospitalizations and associated diagnoses in a large multisite cohort of HIV patients in the United States, 1994–2005. AIDS. 2008;22(11):1345–1354.
- , , . Hospitalizations for metabolic conditions, opportunistic infections, and injection drug use among HIV patients: trends between 1996 and 2000 in 12 states. J Acquir Immune Defic Syndr. 2005;40(5):609–616.
- , , , , , . Cardiovascular disease in HIV infection. Am Heart J. 2006;151:1147–1155.
- , , , et al. Epidemiological evidence for cardiovascular disease in HIV‐infected patients and relationship to highly active antiretroviral therapy. Circulation. 2008;118(2):e29–e35.
- , , , et al. Immune activation and CD8+ T‐cell differentiation towards senescence in HIV‐1 infection. PLoS Biol. 2004;2(2):E20.
- , , , , . CD4 T cell depletion is linked directly to immune activation in the pathogenesis of HIV‐1 and HIV‐2 but only indirectly to the viral load. J Immunol. 2002;169(6):3400–3406.
- , . Thromboprophylaxis in nonsurgical patients. Hematology Am Soc Hematol Educ Program. 2012;2012:631–637.
- , . Practices to prevent venous thromboembolism [published online ahead of print May 24, 2013]. BMJ Qual Saf. doi:10.1136/bmjqs‐2012‐001782.
- , , , et al. Patterns of non‐administration of ordered doses of venous thromboembolism prophylaxis: implications for novel intervention strategies. PLoS One. 2013;8(6):e66311.
- , , , et al. Lessons from The Johns Hopkins multi‐disciplinary venous thromboembolism (VTE) prevention collaborative. BMJ. 2012;344:e3935.
- , , , et al. Impact of a venous thromboembolism prophylaxis “smart order set”: improved compliance, fewer events [published online ahead of print April 4, 2013]. Am J Hematol. doi: 10.1002/ajh.23450.
- , , . Dose omissions in hospitalized patients in a UK hospital: an analysis of the relative contribution of adverse drug reactions. Drug Saf. 2012;35(8):677–683.
- , , , et al. Adherence to pharmacological thromboprophylaxis orders in hospitalized patients. Am J Med. 2010;123(6):536–541.
- , , , et al. A comparison of enoxaparin with placebo for the prevention of venous thromboembolism in acutely ill medical patients. Prophylaxis in medical patients with enoxaparin study group. N Engl J Med. 1999;341(11):793–800.
- , , , et al. Randomized, placebo‐controlled trial of dalteparin for the prevention of venous thromboembolism in acutely ill medical patients. Circulation. 2004;110(7):874–879.
- , , , et al. Efficacy and safety of fondaparinux for the prevention of venous thromboembolism in older acute medical patients: randomised placebo controlled trial. BMJ. 2006;332(7537):325–329.
- , , , et al. Patient perspectives on pharmacological venous thromboembolism prophylaxis at The Johns Hopkins Hospital. J Thromb Thrombolysis. 2013;35(3):416.
- , , , et al. Culture of care and documented patient refusal of pharmacologic venous thromboembolism prophylaxis. J Thromb Thrombolysis. 2011;31(3):367–400.
© 2014 Society of Hospital Medicine
