User login
Impact of Displaying Inpatient Pharmaceutical Costs at the Time of Order Entry: Lessons From a Tertiary Care Center
Secondary to rising healthcare costs in the United States, broad efforts are underway to identify and reduce waste in the health system.1,2 A recent systematic review exhibited that many physicians inaccurately estimate the cost of medications.3 Raising awareness of medication costs among prescribers is one potential way to promote high-value care.
Some evidence suggests that cost transparency may help prescribers understand how medication orders drive costs. In a previous study carried out at the Johns Hopkins Hospital, fee data were displayed to providers for diagnostic laboratory tests.4 An 8.6% decrease (95% confidence interval [CI], –8.99% to –8.19%) in test ordering was observed when costs were displayed vs a 5.6% increase (95% CI, 4.90% to 6.39%) in ordering when costs were not displayed during a 6-month intervention period (P < 0.001). Conversely, a similar study that investigated the impact of cost transparency on inpatient imaging utilization did not demonstrate a significant influence of cost display.5 This suggests that cost transparency may work in some areas of care but not in others. A systematic review that investigated price-display interventions for imaging, laboratory studies, and medications reported 10 studies that demonstrated a statistically significant decrease in expenditures without an effect on patient safety.6
Informing prescribers of institution-specific medication costs within and between drug classes may enable the selection of less expensive, therapeutically equivalent drugs. Prior studies investigating the effect of medication cost display were conducted in a variety of patient care settings, including ambulatory clinics,7 urgent care centers,8 and operating rooms,9,10 with some yielding positive results in terms of ordering and cost11,12 and others having no impact.13,14 Currently, there is little evidence specifically addressing the effect of cost display for medications in the inpatient setting.
As part of an institutional initiative to control pharmaceutical expenditures, informational messaging for several high-cost drugs was initiated at our tertiary care hospital in April 2015. The goal of our study was to assess the effect of these medication cost messages on ordering practices. We hypothesized that the display of inpatient pharmaceutical costs at the time of order entry would result in a reduction in ordering.
METHODS
Setting, Intervention, and Participants
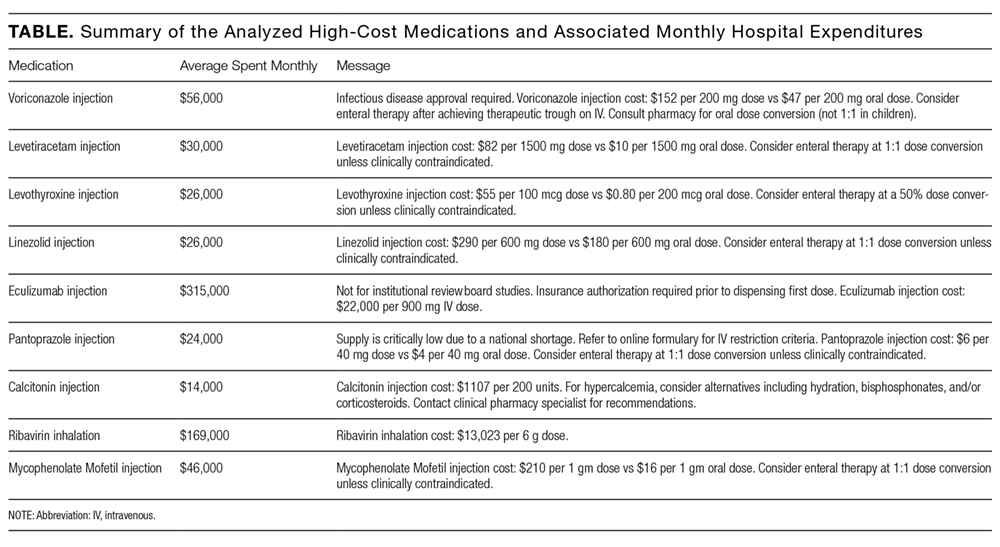
As part of an effort to educate prescribers about the high cost of medications, 9 intravenous (IV) medications were selected by the Johns Hopkins Hospital Pharmacy and Therapeutics Committee as targets for drug cost messaging. The intention of the committee was to implement a rapid, low-cost, proof-of-concept, quality-improvement project that was not designed as prospective research. Representatives from the pharmacy and clinicians from relevant clinical areas participated in preimplementation discussions to help identify medications that were subjectively felt to be overused at our institution and potentially modifiable through provider education. The criteria for selecting drug targets included a variety of factors, such as medications infrequently ordered but representing a significant cost per dose (eg, eculizumab and ribavirin), frequently ordered medications with less expensive substitutes (eg, linezolid and voriconazole), and high-cost medications without direct therapeutic alternatives (eg, calcitonin). From April 10, 2015, to October 5, 2015, the computerized Provider Order Entry System (cPOE), Sunrise Clinical Manager (Allscripts Corporation, Chicago, IL), displayed the cost for targeted medications. Seven of the medication alerts also included a reasonable therapeutic alternative and its cost. There were no restrictions placed on ordering; prescribers were able to choose the high-cost medications at their discretion.
Despite the fact that this initiative was not designed as a research project, we felt it was important to formally evaluate the impact of the drug cost messaging effort to inform future quality-improvement interventions. Each medication was compared to its preintervention baseline utilization dating back to January 1, 2013. For the 7 medications with alternatives offered, we also analyzed use of the suggested alternative during these time periods.
Data Sources and Measurement
Our study utilized data obtained from the pharmacy order verification system and the cPOE database. Data were collected over a period of 143 weeks from January 1, 2013, to October 5, 2015, to allow for a baseline period (January 1, 2013, to April 9, 2015) and an intervention period (April 10, 2015, to October 5, 2015). Data elements extracted included drug characteristics (dosage form, route, cost, strength, name, and quantity), patient characteristics (race, gender, and age), clinical setting (facility location, inpatient or outpatient), and billing information (provider name, doses dispensed from pharmacy, order number, revenue or procedure code, record number, date of service, and unique billing number) for each admission. Using these elements, we generated the following 8 variables to use in our analyses: week, month, period identifier, drug name, dosage form, weekly orders, weekly patient days, and number of weekly orders per 10,000 patient days. Average wholesale price (AWP), referred to as medication cost in this manuscript, was used to report all drug costs in all associated cost calculations. While the actual cost of acquisition and price charged to the patient may vary based on several factors, including manufacturer and payer, we chose to use AWP as a generalizable estimate of the cost of acquisition of the drug for the hospital.
Variables
“Week” and “month” were defined as the week and month of our study, respectively. The “period identifier” was a binary variable that identified the time period before and after the intervention. “Weekly orders” was defined as the total number of new orders placed per week for each specified drug included in our study. For example, if a patient received 2 discrete, new orders for a medication in a given week, 2 orders would be counted toward the “weekly orders” variable. “Patient days,” defined as the total number of patients treated at our facility, was summated for each week of our study to yield “weekly patient days.” To derive the “number of weekly orders per 10,000 patient days,” we divided weekly orders by weekly patient days and multiplied the resultant figure by 10,000.
Statistical Analysis

Segmented regression, a form of interrupted time series analysis, is a quasi-experimental design that was used to determine the immediate and sustained effects of the drug cost messages on the rate of medication ordering.15-17 The model enabled the use of comparison groups (alternative medications, as described above) to enhance internal validity.
In time series data, outcomes may not be independent over time. Autocorrelation of the error terms can arise when outcomes are more similar at time points closer together than outcomes at time points further apart. Failure to account for autocorrelation of the error terms may lead to underestimated standard errors. The presence of autocorrelation, assessed by calculating the Durbin-Watson statistic, was significant among our data. To adjust for this, we employed a Prais-Winsten estimation to adjust the error term (εt) calculated in our models.
Two segmented linear regression models were used to estimate trends in ordering before and after the intervention. The presence or absence of a comparator drug determined which model was to be used. When only single medications were under study, as in the case of eculizumab and calcitonin, our regression model was as follows:
Yt = (β0) + (β1)(Timet) + (β2)(Interventiont) + (β3)(Post-Intervention Timet) + (εt)
In our single-drug model, Yt denoted the number of orders per 10,000 patient days at week “t”; Timet was a continuous variable that indicated the number of weeks prior to or after the study intervention (April 10, 2015) and ranged from –116 to 27 weeks. Post-Intervention Timet was a continuous variable that denoted the number of weeks since the start of the intervention and is coded as zero for all time periods prior to the intervention. β0 was the estimated baseline number of orders per 10,000 patient days at the beginning of the study. β1 is the trend of orders per 10,000 patient days per week during the preintervention period; β2 represents an estimate of the change in the number of orders per 10,000 patient days immediately after the intervention; β3 denotes the difference between preintervention and postintervention slopes; and εt is the “error term,” which represents autocorrelation and random variability of the data.
As mentioned previously, alternative dosage forms of 7 medications included in our study were utilized as comparison groups. In these instances (when multiple drugs were included in our analyses), the following regression model was applied:
Y t = ( β 0 ) + ( β 1 )(Time t ) + ( β 2 )(Intervention t ) + ( β 3 )(Post-Intervention Time t ) + ( β 4 )(Cohort) + ( β 5 )(Cohort)(Time t ) + ( β 6 )(Cohort)(Intervention t ) + ( β 7 )(Cohort)(Post-Intervention Time t ) + ( ε t )
Here, 3 coefficients were added (β4-β7) to describe an additional cohort of orders. Cohort, a binary indicator variable, held a value of either 0 or 1 when the model was used to describe the treatment or comparison group, respectively. The coefficients β4-β7 described the treatment group, and β0-β3 described the comparison group. β4 was the difference in the number of baseline orders per 10,000 patient days between treatment and comparison groups; Β5 represented the difference between the estimated ordering trends of treatment and comparison groups; and Β6 indicated the difference in immediate changes in the number of orders per 10,000 patient days in the 2 groups following the intervention.
The number of orders per week was recorded for each medicine, which enabled a large number of data points to be included in our analyses. This allowed for more accurate and stable estimates to be made in our regression model. A total of 143 data points were collected for each study group, 116 before and 27 following each intervention.
All analyses were conducted by using STATA version 13.1 (StataCorp LP, College Station, TX).
RESULTS

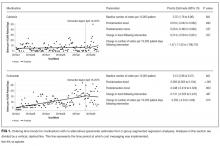
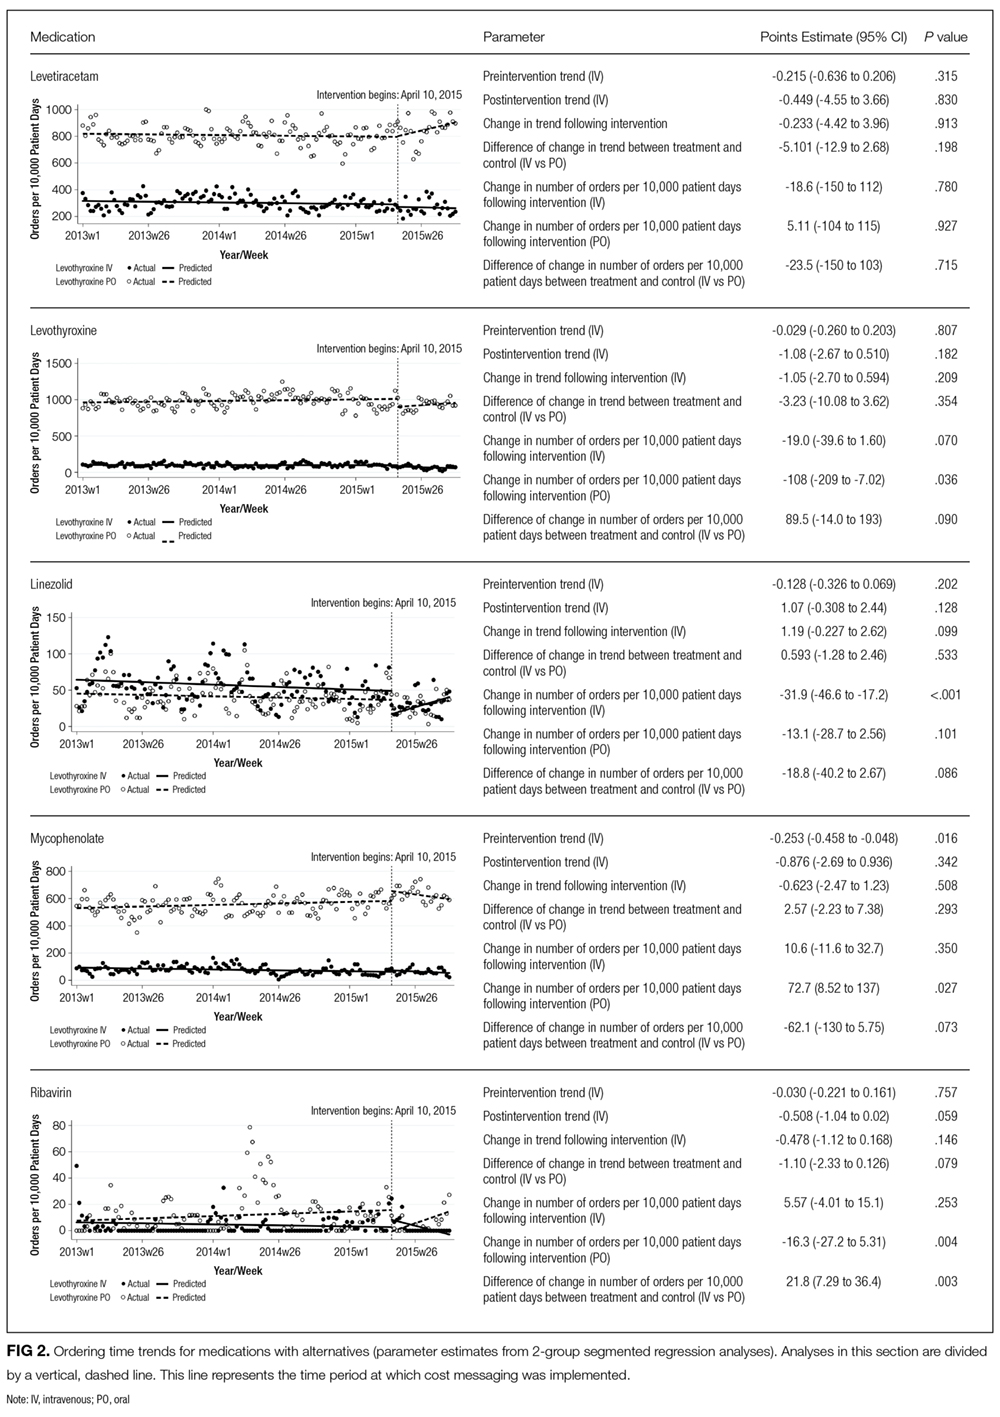
Initial results pertaining to 9 IV medications were examined (Table). Following the implementation of cost messaging, no significant changes were observed in order frequency or trend for IV formulations of eculizumab, calcitonin, levetiracetam, linezolid, mycophenolate, ribavirin, voriconazole, and levothyroxine (Figures 1 and 2). However, a significant decrease in the number of oral ribavirin orders (Figure 2), the control group for the IV form, was observed (–16.3 orders per 10,000 patient days; P = .004; 95% CI, –27.2 to –5.31).
DISCUSSION
Our results suggest that the passive strategy of displaying cost alone was not effective in altering prescriber ordering patterns for the selected medications. This may be due to a lack of awareness regarding direct financial impact on the patient, importance of costs in medical decision-making, or a perceived lack of alternatives or suitability of recommended alternatives. These results may prove valuable to hospital and pharmacy leadership as they develop strategies to curb medication expense.
Changes observed in IV pantoprazole ordering are instructive. Due to a national shortage, the IV form of this medication underwent a restriction, which required approval by the pharmacy prior to dispensing. This restriction was instituted independently of our study and led to a 73% decrease from usage rates prior to policy implementation (Figure 3). Ordering was restricted according to defined criteria for IV use. The restriction did not apply to oral pantoprazole, and no significant change in ordering of the oral formulation was noted during the evaluated period (Figure 3).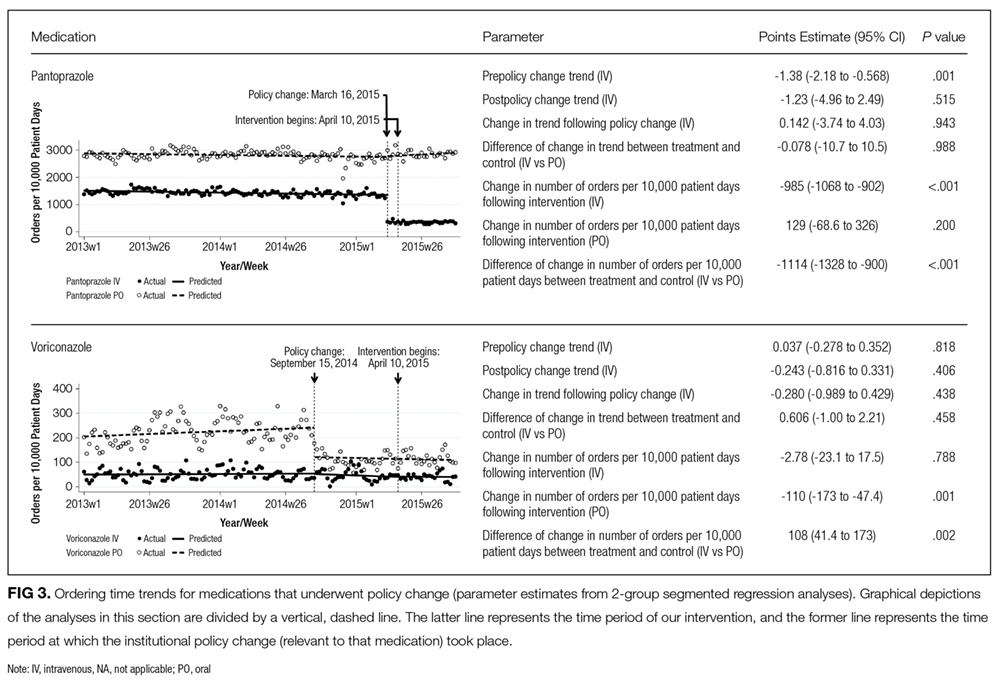
The dramatic effect of policy changes, as observed with pantoprazole and voriconazole, suggests that a more active strategy may have a greater impact on prescriber behavior when it comes to medication ordering in the inpatient setting. It also highlights several potential sources of confounding that may introduce bias to cost-transparency studies.
This study has multiple limitations. First, as with all observational study designs, causation cannot be drawn with certainty from our results. While we were able to compare medications to their preintervention baselines, the data could have been impacted by longitudinal or seasonal trends in medication ordering, which may have been impacted by seasonal variability in disease prevalence, changes in resistance patterns, and annual cycling of house staff in an academic medical center. While there appear to be potential seasonal patterns regarding prescribing patterns for some of the medications included in this analysis, we also believe the linear regressions capture the overall trends in prescribing adequately. Nonstationarity, or trends in the mean and variance of the outcome that are not related to the intervention, may introduce bias in the interpretation of our findings. However, we believe the parameters included in our models, namely the immediate change in the intercept following the intervention and the change in the trend of the rate of prescribing over time from pre- to postintervention, provide substantial protections from faulty interpretation. Our models are limited to the extent that these parameters do not account for nonstationarity. Additionally, we did not collect data on dosing frequency or duration of treatment, which would have been dependent on factors that are not readily quantified, such as indication, clinical rationale, or patient response. Thus, we were not able to evaluate the impact of the intervention on these factors.
Although intended to enhance internal validity, comparison groups were also subject to external influence. For example, we observed a significant, short-lived rise in oral ribavirin (a control medication) ordering during the preintervention baseline period that appeared to be independent of our intervention and may speak to the unaccounted-for longitudinal variability detailed above.
Finally, the clinical indication and setting may be important. Previous studies performed at the same hospital with price displays showed a reduction in laboratory ordering but no change in imaging.18,19 One might speculate that ordering fewer laboratory tests is viewed by providers as eliminating waste rather than choosing a less expensive option to accomplish the same diagnostic task at hand. Therapeutics may be more similar to radiology tests, because patients presumably need the treatment and often do not have the option of simply not ordering without a concerted effort to reevaluate the treatment plan. Additionally, in a tertiary care teaching center such as ours, a junior clinician, oftentimes at the behest of a more senior colleague, enters most orders. In an environment in which the ordering prescriber has more autonomy or when the order is driven by a junior practitioner rather than an attending (such as daily laboratories), results may be different. Additionally, institutions that incentivize prescribers directly to practice cost-conscious care may experience different results from similar interventions.
We conclude that, in the case of medication cost messaging, a strategy of displaying cost information alone was insufficient to affect prescriber ordering behavior. Coupling cost transparency with educational interventions and active stewardship to impact clinical practice is worthy of further study.
Disclosures: The authors state that there were no external sponsors for this work. The Johns Hopkins Hospital and University “funded” this work by paying the salaries of the authors. The author team maintained independence and made all decisions regarding the study design, data collection, data analysis, interpretation of results, writing of the research report, and decision to submit it for publication. Dr. Shermock had full access to all the study data and takes responsibility for the integrity of the data and accuracy of the data analysis.
1. Berwick DM, Hackbarth AD. Eliminating Waste in US Health Care. JAMA. 2012;307(14):1513-1516. PubMed
2. PricewaterhouseCoopers’ Health Research Institute. The Price of Excess: Identifying Waste in Healthcare Spending. http://www.pwc.com/us/en/healthcare/publications/the-price-of-excess.html. Accessed June 17, 2015.
3. Allan GM, Lexchin J, Wiebe N. Physician awareness of drug cost: a systematic review. PLoS Med. 2007;4(9):e283. PubMed
4. Feldman LS, Shihab HM, Thiemann D, et al. Impact of providing fee data on laboratory test ordering: a controlled clinical trial. JAMA Intern Med. 2013;173(10):903-908. PubMed
5. Durand DJ, Feldman LS, Lewin JS, Brotman DJ. Provider cost transparency alone has no impact on inpatient imaging utilization. J Am Coll Radiol. 2013;10(2):108-113. PubMed
6. Silvestri MT, Bongiovanni TR, Glover JG, Gross CP. Impact of price display on provider ordering: A systematic review. J Hosp Med. 2016;11(1):65-76. PubMed
7. Ornstein SM, MacFarlane LL, Jenkins RG, Pan Q, Wager KA. Medication cost information in a computer-based patient record system. Impact on prescribing in a family medicine clinical practice. Arch Fam Med. 1999;8(2):118-121. PubMed
8. Guterman JJ, Chernof BA, Mares B, Gross-Schulman SG, Gan PG, Thomas D. Modifying provider behavior: A low-tech approach to pharmaceutical ordering. J Gen Intern Med. 2002;17(10):792-796. PubMed
9. McNitt JD, Bode ET, Nelson RE. Long-term pharmaceutical cost reduction using a data management system. Anesth Analg. 1998;87(4):837-842. PubMed
10. Horrow JC, Rosenberg H. Price stickers do not alter drug usage. Can J Anaesth. 1994;41(11):1047-1052. PubMed
11. Guterman JJ, Chernof BA, Mares B, Gross-Schulman SG, Gan PG, Thomas D. Modifying provider behavior: A low-tech approach to pharmaceutical ordering. J Gen Intern Med. 2002;17(10):792-796. PubMed
12. McNitt JD, Bode ET, Nelson RE. Long-term pharmaceutical cost reduction using a data management system. Anesth Analg. 1998;87(4):837-842. PubMed
13. Ornstein SM, MacFarlane LL, Jenkins RG, Pan Q, Wager KA. Medication cost information in a computer-based patient record system. Impact on prescribing in a family medicine clinical practice. Arch Fam Med. 1999;8(2):118-121. PubMed
14. Horrow JC, Rosenberg H. Price stickers do not alter drug usage. Can J Anaesth. 1994;41(11):1047-1052. PubMed
15. Jandoc R, Burden AM, Mamdani M, Levesque LE, Cadarette SM. Interrupted time series analysis in drug utilization research is increasing: Systematic review and recommendations. J Clin Epidemiol. 2015;68(8):950-56. PubMed
16. Linden A. Conducting interrupted time-series analysis for single- and multiple-group comparisons. Stata J. 2015;15(2):480-500.
17. Linden A, Adams JL. Applying a propensity score-based weighting model to interrupted time series data: improving causal inference in programme evaluation. J Eval Clin Pract. 2011;17(6):1231-1238. PubMed
18. Feldman LS, Shihab HM, Thiemann D, et al. Impact of providing fee data on laboratory test ordering: a controlled clinical trial. JAMA Intern Med. 2013;173(10):903-908. PubMed
19. Durand DJ, Feldman LS, Lewin JS, Brotman DJ. Provider cost transparency alone has no impact on inpatient imaging utilization. J Am Coll Radiol. 2013;10(2):108-113. PubMed
Secondary to rising healthcare costs in the United States, broad efforts are underway to identify and reduce waste in the health system.1,2 A recent systematic review exhibited that many physicians inaccurately estimate the cost of medications.3 Raising awareness of medication costs among prescribers is one potential way to promote high-value care.
Some evidence suggests that cost transparency may help prescribers understand how medication orders drive costs. In a previous study carried out at the Johns Hopkins Hospital, fee data were displayed to providers for diagnostic laboratory tests.4 An 8.6% decrease (95% confidence interval [CI], –8.99% to –8.19%) in test ordering was observed when costs were displayed vs a 5.6% increase (95% CI, 4.90% to 6.39%) in ordering when costs were not displayed during a 6-month intervention period (P < 0.001). Conversely, a similar study that investigated the impact of cost transparency on inpatient imaging utilization did not demonstrate a significant influence of cost display.5 This suggests that cost transparency may work in some areas of care but not in others. A systematic review that investigated price-display interventions for imaging, laboratory studies, and medications reported 10 studies that demonstrated a statistically significant decrease in expenditures without an effect on patient safety.6
Informing prescribers of institution-specific medication costs within and between drug classes may enable the selection of less expensive, therapeutically equivalent drugs. Prior studies investigating the effect of medication cost display were conducted in a variety of patient care settings, including ambulatory clinics,7 urgent care centers,8 and operating rooms,9,10 with some yielding positive results in terms of ordering and cost11,12 and others having no impact.13,14 Currently, there is little evidence specifically addressing the effect of cost display for medications in the inpatient setting.
As part of an institutional initiative to control pharmaceutical expenditures, informational messaging for several high-cost drugs was initiated at our tertiary care hospital in April 2015. The goal of our study was to assess the effect of these medication cost messages on ordering practices. We hypothesized that the display of inpatient pharmaceutical costs at the time of order entry would result in a reduction in ordering.
METHODS
Setting, Intervention, and Participants
As part of an effort to educate prescribers about the high cost of medications, 9 intravenous (IV) medications were selected by the Johns Hopkins Hospital Pharmacy and Therapeutics Committee as targets for drug cost messaging. The intention of the committee was to implement a rapid, low-cost, proof-of-concept, quality-improvement project that was not designed as prospective research. Representatives from the pharmacy and clinicians from relevant clinical areas participated in preimplementation discussions to help identify medications that were subjectively felt to be overused at our institution and potentially modifiable through provider education. The criteria for selecting drug targets included a variety of factors, such as medications infrequently ordered but representing a significant cost per dose (eg, eculizumab and ribavirin), frequently ordered medications with less expensive substitutes (eg, linezolid and voriconazole), and high-cost medications without direct therapeutic alternatives (eg, calcitonin). From April 10, 2015, to October 5, 2015, the computerized Provider Order Entry System (cPOE), Sunrise Clinical Manager (Allscripts Corporation, Chicago, IL), displayed the cost for targeted medications. Seven of the medication alerts also included a reasonable therapeutic alternative and its cost. There were no restrictions placed on ordering; prescribers were able to choose the high-cost medications at their discretion.
Despite the fact that this initiative was not designed as a research project, we felt it was important to formally evaluate the impact of the drug cost messaging effort to inform future quality-improvement interventions. Each medication was compared to its preintervention baseline utilization dating back to January 1, 2013. For the 7 medications with alternatives offered, we also analyzed use of the suggested alternative during these time periods.
Data Sources and Measurement
Our study utilized data obtained from the pharmacy order verification system and the cPOE database. Data were collected over a period of 143 weeks from January 1, 2013, to October 5, 2015, to allow for a baseline period (January 1, 2013, to April 9, 2015) and an intervention period (April 10, 2015, to October 5, 2015). Data elements extracted included drug characteristics (dosage form, route, cost, strength, name, and quantity), patient characteristics (race, gender, and age), clinical setting (facility location, inpatient or outpatient), and billing information (provider name, doses dispensed from pharmacy, order number, revenue or procedure code, record number, date of service, and unique billing number) for each admission. Using these elements, we generated the following 8 variables to use in our analyses: week, month, period identifier, drug name, dosage form, weekly orders, weekly patient days, and number of weekly orders per 10,000 patient days. Average wholesale price (AWP), referred to as medication cost in this manuscript, was used to report all drug costs in all associated cost calculations. While the actual cost of acquisition and price charged to the patient may vary based on several factors, including manufacturer and payer, we chose to use AWP as a generalizable estimate of the cost of acquisition of the drug for the hospital.
Variables
“Week” and “month” were defined as the week and month of our study, respectively. The “period identifier” was a binary variable that identified the time period before and after the intervention. “Weekly orders” was defined as the total number of new orders placed per week for each specified drug included in our study. For example, if a patient received 2 discrete, new orders for a medication in a given week, 2 orders would be counted toward the “weekly orders” variable. “Patient days,” defined as the total number of patients treated at our facility, was summated for each week of our study to yield “weekly patient days.” To derive the “number of weekly orders per 10,000 patient days,” we divided weekly orders by weekly patient days and multiplied the resultant figure by 10,000.
Statistical Analysis
Segmented regression, a form of interrupted time series analysis, is a quasi-experimental design that was used to determine the immediate and sustained effects of the drug cost messages on the rate of medication ordering.15-17 The model enabled the use of comparison groups (alternative medications, as described above) to enhance internal validity.
In time series data, outcomes may not be independent over time. Autocorrelation of the error terms can arise when outcomes are more similar at time points closer together than outcomes at time points further apart. Failure to account for autocorrelation of the error terms may lead to underestimated standard errors. The presence of autocorrelation, assessed by calculating the Durbin-Watson statistic, was significant among our data. To adjust for this, we employed a Prais-Winsten estimation to adjust the error term (εt) calculated in our models.
Two segmented linear regression models were used to estimate trends in ordering before and after the intervention. The presence or absence of a comparator drug determined which model was to be used. When only single medications were under study, as in the case of eculizumab and calcitonin, our regression model was as follows:
Yt = (β0) + (β1)(Timet) + (β2)(Interventiont) + (β3)(Post-Intervention Timet) + (εt)
In our single-drug model, Yt denoted the number of orders per 10,000 patient days at week “t”; Timet was a continuous variable that indicated the number of weeks prior to or after the study intervention (April 10, 2015) and ranged from –116 to 27 weeks. Post-Intervention Timet was a continuous variable that denoted the number of weeks since the start of the intervention and is coded as zero for all time periods prior to the intervention. β0 was the estimated baseline number of orders per 10,000 patient days at the beginning of the study. β1 is the trend of orders per 10,000 patient days per week during the preintervention period; β2 represents an estimate of the change in the number of orders per 10,000 patient days immediately after the intervention; β3 denotes the difference between preintervention and postintervention slopes; and εt is the “error term,” which represents autocorrelation and random variability of the data.
As mentioned previously, alternative dosage forms of 7 medications included in our study were utilized as comparison groups. In these instances (when multiple drugs were included in our analyses), the following regression model was applied:
Y t = ( β 0 ) + ( β 1 )(Time t ) + ( β 2 )(Intervention t ) + ( β 3 )(Post-Intervention Time t ) + ( β 4 )(Cohort) + ( β 5 )(Cohort)(Time t ) + ( β 6 )(Cohort)(Intervention t ) + ( β 7 )(Cohort)(Post-Intervention Time t ) + ( ε t )
Here, 3 coefficients were added (β4-β7) to describe an additional cohort of orders. Cohort, a binary indicator variable, held a value of either 0 or 1 when the model was used to describe the treatment or comparison group, respectively. The coefficients β4-β7 described the treatment group, and β0-β3 described the comparison group. β4 was the difference in the number of baseline orders per 10,000 patient days between treatment and comparison groups; Β5 represented the difference between the estimated ordering trends of treatment and comparison groups; and Β6 indicated the difference in immediate changes in the number of orders per 10,000 patient days in the 2 groups following the intervention.
The number of orders per week was recorded for each medicine, which enabled a large number of data points to be included in our analyses. This allowed for more accurate and stable estimates to be made in our regression model. A total of 143 data points were collected for each study group, 116 before and 27 following each intervention.
All analyses were conducted by using STATA version 13.1 (StataCorp LP, College Station, TX).
RESULTS
Initial results pertaining to 9 IV medications were examined (Table). Following the implementation of cost messaging, no significant changes were observed in order frequency or trend for IV formulations of eculizumab, calcitonin, levetiracetam, linezolid, mycophenolate, ribavirin, voriconazole, and levothyroxine (Figures 1 and 2). However, a significant decrease in the number of oral ribavirin orders (Figure 2), the control group for the IV form, was observed (–16.3 orders per 10,000 patient days; P = .004; 95% CI, –27.2 to –5.31).
DISCUSSION
Our results suggest that the passive strategy of displaying cost alone was not effective in altering prescriber ordering patterns for the selected medications. This may be due to a lack of awareness regarding direct financial impact on the patient, importance of costs in medical decision-making, or a perceived lack of alternatives or suitability of recommended alternatives. These results may prove valuable to hospital and pharmacy leadership as they develop strategies to curb medication expense.
Changes observed in IV pantoprazole ordering are instructive. Due to a national shortage, the IV form of this medication underwent a restriction, which required approval by the pharmacy prior to dispensing. This restriction was instituted independently of our study and led to a 73% decrease from usage rates prior to policy implementation (Figure 3). Ordering was restricted according to defined criteria for IV use. The restriction did not apply to oral pantoprazole, and no significant change in ordering of the oral formulation was noted during the evaluated period (Figure 3).
The dramatic effect of policy changes, as observed with pantoprazole and voriconazole, suggests that a more active strategy may have a greater impact on prescriber behavior when it comes to medication ordering in the inpatient setting. It also highlights several potential sources of confounding that may introduce bias to cost-transparency studies.
This study has multiple limitations. First, as with all observational study designs, causation cannot be drawn with certainty from our results. While we were able to compare medications to their preintervention baselines, the data could have been impacted by longitudinal or seasonal trends in medication ordering, which may have been impacted by seasonal variability in disease prevalence, changes in resistance patterns, and annual cycling of house staff in an academic medical center. While there appear to be potential seasonal patterns regarding prescribing patterns for some of the medications included in this analysis, we also believe the linear regressions capture the overall trends in prescribing adequately. Nonstationarity, or trends in the mean and variance of the outcome that are not related to the intervention, may introduce bias in the interpretation of our findings. However, we believe the parameters included in our models, namely the immediate change in the intercept following the intervention and the change in the trend of the rate of prescribing over time from pre- to postintervention, provide substantial protections from faulty interpretation. Our models are limited to the extent that these parameters do not account for nonstationarity. Additionally, we did not collect data on dosing frequency or duration of treatment, which would have been dependent on factors that are not readily quantified, such as indication, clinical rationale, or patient response. Thus, we were not able to evaluate the impact of the intervention on these factors.
Although intended to enhance internal validity, comparison groups were also subject to external influence. For example, we observed a significant, short-lived rise in oral ribavirin (a control medication) ordering during the preintervention baseline period that appeared to be independent of our intervention and may speak to the unaccounted-for longitudinal variability detailed above.
Finally, the clinical indication and setting may be important. Previous studies performed at the same hospital with price displays showed a reduction in laboratory ordering but no change in imaging.18,19 One might speculate that ordering fewer laboratory tests is viewed by providers as eliminating waste rather than choosing a less expensive option to accomplish the same diagnostic task at hand. Therapeutics may be more similar to radiology tests, because patients presumably need the treatment and often do not have the option of simply not ordering without a concerted effort to reevaluate the treatment plan. Additionally, in a tertiary care teaching center such as ours, a junior clinician, oftentimes at the behest of a more senior colleague, enters most orders. In an environment in which the ordering prescriber has more autonomy or when the order is driven by a junior practitioner rather than an attending (such as daily laboratories), results may be different. Additionally, institutions that incentivize prescribers directly to practice cost-conscious care may experience different results from similar interventions.
We conclude that, in the case of medication cost messaging, a strategy of displaying cost information alone was insufficient to affect prescriber ordering behavior. Coupling cost transparency with educational interventions and active stewardship to impact clinical practice is worthy of further study.
Disclosures: The authors state that there were no external sponsors for this work. The Johns Hopkins Hospital and University “funded” this work by paying the salaries of the authors. The author team maintained independence and made all decisions regarding the study design, data collection, data analysis, interpretation of results, writing of the research report, and decision to submit it for publication. Dr. Shermock had full access to all the study data and takes responsibility for the integrity of the data and accuracy of the data analysis.
1. Berwick DM, Hackbarth AD. Eliminating Waste in US Health Care. JAMA. 2012;307(14):1513-1516. PubMed
2. PricewaterhouseCoopers’ Health Research Institute. The Price of Excess: Identifying Waste in Healthcare Spending. http://www.pwc.com/us/en/healthcare/publications/the-price-of-excess.html. Accessed June 17, 2015.
3. Allan GM, Lexchin J, Wiebe N. Physician awareness of drug cost: a systematic review. PLoS Med. 2007;4(9):e283. PubMed
4. Feldman LS, Shihab HM, Thiemann D, et al. Impact of providing fee data on laboratory test ordering: a controlled clinical trial. JAMA Intern Med. 2013;173(10):903-908. PubMed
5. Durand DJ, Feldman LS, Lewin JS, Brotman DJ. Provider cost transparency alone has no impact on inpatient imaging utilization. J Am Coll Radiol. 2013;10(2):108-113. PubMed
6. Silvestri MT, Bongiovanni TR, Glover JG, Gross CP. Impact of price display on provider ordering: A systematic review. J Hosp Med. 2016;11(1):65-76. PubMed
7. Ornstein SM, MacFarlane LL, Jenkins RG, Pan Q, Wager KA. Medication cost information in a computer-based patient record system. Impact on prescribing in a family medicine clinical practice. Arch Fam Med. 1999;8(2):118-121. PubMed
8. Guterman JJ, Chernof BA, Mares B, Gross-Schulman SG, Gan PG, Thomas D. Modifying provider behavior: A low-tech approach to pharmaceutical ordering. J Gen Intern Med. 2002;17(10):792-796. PubMed
9. McNitt JD, Bode ET, Nelson RE. Long-term pharmaceutical cost reduction using a data management system. Anesth Analg. 1998;87(4):837-842. PubMed
10. Horrow JC, Rosenberg H. Price stickers do not alter drug usage. Can J Anaesth. 1994;41(11):1047-1052. PubMed
11. Guterman JJ, Chernof BA, Mares B, Gross-Schulman SG, Gan PG, Thomas D. Modifying provider behavior: A low-tech approach to pharmaceutical ordering. J Gen Intern Med. 2002;17(10):792-796. PubMed
12. McNitt JD, Bode ET, Nelson RE. Long-term pharmaceutical cost reduction using a data management system. Anesth Analg. 1998;87(4):837-842. PubMed
13. Ornstein SM, MacFarlane LL, Jenkins RG, Pan Q, Wager KA. Medication cost information in a computer-based patient record system. Impact on prescribing in a family medicine clinical practice. Arch Fam Med. 1999;8(2):118-121. PubMed
14. Horrow JC, Rosenberg H. Price stickers do not alter drug usage. Can J Anaesth. 1994;41(11):1047-1052. PubMed
15. Jandoc R, Burden AM, Mamdani M, Levesque LE, Cadarette SM. Interrupted time series analysis in drug utilization research is increasing: Systematic review and recommendations. J Clin Epidemiol. 2015;68(8):950-56. PubMed
16. Linden A. Conducting interrupted time-series analysis for single- and multiple-group comparisons. Stata J. 2015;15(2):480-500.
17. Linden A, Adams JL. Applying a propensity score-based weighting model to interrupted time series data: improving causal inference in programme evaluation. J Eval Clin Pract. 2011;17(6):1231-1238. PubMed
18. Feldman LS, Shihab HM, Thiemann D, et al. Impact of providing fee data on laboratory test ordering: a controlled clinical trial. JAMA Intern Med. 2013;173(10):903-908. PubMed
19. Durand DJ, Feldman LS, Lewin JS, Brotman DJ. Provider cost transparency alone has no impact on inpatient imaging utilization. J Am Coll Radiol. 2013;10(2):108-113. PubMed
© 2017 Society of Hospital Medicine
The Johns Hopkins VTE Collaborative
Venous thromboembolism (VTE), which encompasses deep venous thrombosis and pulmonary embolism, is an important cause of preventable morbidity and mortality.[1] Each year it is estimated as many as 600,000 American's suffer VTE and as many as 100,000 die.[2] Consequently, patient safety and healthcare quality, accrediting organizations such as The Joint Commission, and federal agencies such as the Centers for Disease Control and Prevention and Agency for Healthcare Research and Quality (AHRQ) have made VTE prevention a priority.[3, 4, 5]
Despite widespread recognition that VTE prophylaxis is an important patient safety measure, poor performance is common. The ENDORSE (Epidemiologic International Day for the Evaluation of Patients at Risk for Venous Thromboembolism in the Acute Hospital Care Setting) study of over 68,000 hospitalized patients in 32 countries noted only 58.5% of surgical patients and 39.5% medical patients received American College of Chest Physicians (ACCP) guideline‐appropriate VTE prophylaxis.[6] In 2005, an audit of the surgical services at The Johns Hopkins Hospital found that only 33% of 322 randomly selected patients were prescribed prophylaxis consistent with the ACCP guidelines.
Achieving defect‐free VTE prevention requires attention to each step in the process: (1) assessment of both VTE and bleeding risk, (2) prescription of risk‐appropriate VTE prophylaxis, and (3) administration of risk‐appropriate VTE prophylaxis. In 2005, to improve our VTE prevention performance at Johns Hopkins Hospital, the Center for Innovations organized a VTE Collaborative of 2 physicians, 1 nurse, and 1 pharmacist dedicated to VTE quality improvement. Since then, the group has grown dramatically, adding a clinical informatics expert and numerous other members and coming under the auspices of The Armstrong Institute for Patient Safety. Recognizing that many, though not all, VTEs are potentially preventable,[7, 8] the mission of the Johns Hopkins VTE Collaborative is to ensure that all hospitalized patients receive risk‐appropriate, best‐practice VTE prophylaxis. This article chronicles the innovative strategies that the Johns Hopkins VTE Collaborative has employed over the past decade to improve our hospital's performance in VTE prevention (Table 1).
|
| Strategies to improve VTE prophylaxis ordering |
| Paper‐based patient risk assessment forms (before computer order entry) |
| Mandatory evidence‐based specialty‐specific computer clinical decision support smart order sets |
| Group data and competitions |
| 1‐on‐1 provider feedback |
| Pay for performance |
| Individualized feedback with resident scorecards |
| Strategies to improve VTE prophylaxis administration |
| Identification of missed doses as a major contributor to preventable VTE |
| Identification of physician, nurse and patient contributors to missed doses |
| Collaboration with patients to create patient‐centered educational materials |
| Novel web‐based module for nursing education |
| Real‐time missed doses alert |
| Targeted 1‐on‐1 patient education |
ENSURING EVERY PATIENT IS PRESCRIBED RISK‐APPROPRIATE PROPHYLAXIS
With the support of hospital leadership, the VTE Collaborative held a series of events in 2005 with medical and surgical providers to review the current evidence supporting VTE prophylaxis and achieve consensus on appropriate practice based upon the 2004 ACCP VTE Prophylaxis Guideline. The result was the development of 5 evidence‐based, paper VTE prophylaxis order sets that guided the ordering provider on the assessment of VTE and bleeding risk and facilitated the selection of risk‐appropriate VTE prophylaxis. Because there were no validated VTE or bleeding risk assessment tools at the time we developed our order sets, we used specialty‐specific VTE risk factors derived from the 2004 ACCP Guideline. To identify patients inappropriate for pharmacologic prophylaxis, we used exclusion criteria derived from contemporary randomized clinical trials of pharmacologic prophylaxis in the target populations (ie, active bleeding, abnormal activated partial thromboplastin time not due to a lupus inhibitor) or mutually agreed upon thresholds after discussion with individual provider groups (platelet count <50,000/L). On the Johns Hopkins Hospital inpatient acute rehabilitation unit, introduction of the paper order sets increased adherence with ACCP guidelines from 27% to 98% (P < 0.0001) and reduced symptomatic VTE from 49 per 1000 admissions to 8 per 1000 admissions (P = 0.0001).[9] This study demonstrated that paper order sets used consistently by a dedicated group of providers can result in sustained improvements in practice. Paper order sets remain a low‐tech, easy‐to‐implement strategy that can be applied in any healthcare setting. Other services also saw improvements in risk‐appropriate prophylaxis prescription. In a follow‐up cross‐sectional analysis of the surgical services at Johns Hopkins, we found that appropriate VTE prophylaxis prescription improved from 33% to 62% in a sample of 226 patients. Unfortunately, paper order sets had several disadvantages including (1) the inherent difficulty of making them a mandatory part of the admission or transfer process, (2) their existence outside the usual clinical workflow, and (3) the labor‐ and time‐intensive data collection that made it difficult to provide credible, timely performance reports to providers and leadership.
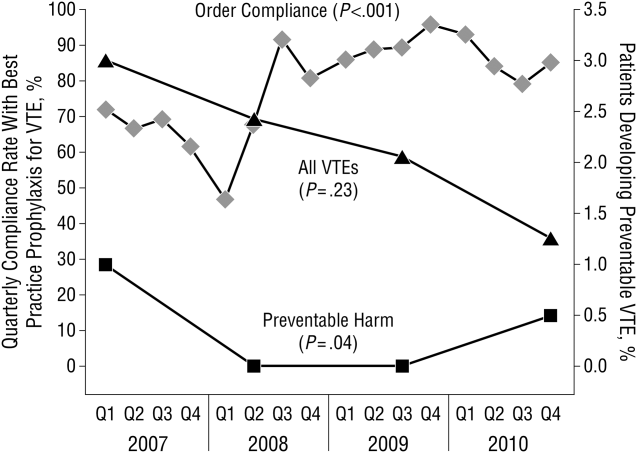
These disadvantages and our adoption of a computerized provider order entry system prompted us to pursue the development and implementation of mandatory, evidence‐based, specialty‐specific computerized clinical decision support (CCDS) VTE prophylaxis order sets. Using the Translating Research Into Practice approach to quality improvement,[10] we collaborated with providers to design 16 different evidence‐based specialty‐specific CCDS VTE order sets. These CCDS VTE order sets, which are imbedded in the specialty‐specific admission and transfer order sets, assist providers in assessing patients' VTE and bleeding risk factors and provide evidence‐based risk‐appropriate VTE prophylaxis (see Supporting Figure 1 in the online version of this article). Individual patient data are saved in an administrative database and can be easily aggregated for research analyses and quality improvement/performance reporting. A detailed discussion of our strategy for change is discussed in Streiff et al.[11] Because pharmacologic prophylaxis is not appropriate for every patient, and not all VTE are preventable, even with perfect prophylaxis, the goals of our collaborative are to ensure that every patient is ordered VTE prophylaxis consistent with their risk profile (risk‐appropriate prophylaxis) and to eliminate preventable episodes of VTE (VTE that occurs in the setting of suboptimal prophylaxis). In a prepost quasi‐experimental study of 1599 trauma patients, the CCDS VTE order set increased risk‐appropriate prophylaxis prescription from 66.2% to 84.4% (P < .001) and reduced the incidence of potentially preventable harm from VTE from 1% to 0.17% (P = 0.04) (Figure 1).[12] On the medical service, the CCDS VTE order set improved risk‐appropriate VTE prophylaxis prescription from 65.6% to 90.1% (P < 0.0001) and reduced the incidence of potentially preventable harm attributable to VTE from 1.1% to 0% (P = 0.001). There was no increase in major bleeding (International Society of Thrombosis and Hemostasis definition: hemoglobin decline of 2 grams/dL or transfusion of 2 or more units of blood or bleeding into a critical organ such as brain, gastrointestinal tract, or eye) postorder set implementation (0.3% vs 0.1%, P = 0.625) or all‐cause mortality (1.3% vs 2.0%, P = 0.285).[13]
These order sets demonstrated that CCDS tools can lead to significant improvements in prescribing practices and reductions in preventable harm from VTE without increasing the risk of major bleeding complications. In addition to improving the quality of care, the order sets also improved the consistency of care. In a retrospective analysis, we found that implementation of CCDS VTE order sets eliminated racial disparities in prescribing practices. In the preimplementation group, risk‐appropriate VTE prophylaxis was prescribed for 70.1% of black patients and 56.6% of white patients on the trauma service (P = 0.025) and 69.5% of black patients and 61.7% of white patients on the medical service (P = 0.015). After implementation of the CCDS VTE order sets, care improved for all patients such that the previously observed disparities were eliminated (trauma service 84.5% vs 85.5%, P = 0.99 and medical service 91.8% vs 88.0%, P = 0.082).[14] These data indicate that standardizing care can potentially eliminate disparities in clinical practice.
Although implementation of mandatory evidence‐based, specialty‐specific CDSS VTE order sets led to substantial improvements in VTE prophylaxis ordering, high performance was not uniform across our institution. On the medical service, substantial disparities in adherence to order set recommendations existed. On the housestaff services, over 90% of patients consistently received risk‐appropriate VTE prophylaxis compared with only 85% on the hospitalist service. Examination of individual provider performance found that some providers only ordered risk‐appropriate prophylaxis 50% of the time, whereas others were doing so 98% of the time. To address this disparity, we conducted a retrospective analysis of a prospective performance improvement project conducted on the Johns Hopkins Hospitalist service studying the impact of individualized hospitalist attending feedback on VTE prevention practices. During the preintervention period (January 2009December 2010), guideline‐adherent VTE prophylaxis was ordered for 86% (95% confidence interval [CI]: 85%‐88%) of patients. Six months after initiation of direct face‐to‐face provider feedback (January 2011June 2011), guideline‐adherent VTE prophylaxis rates rose to 90% (95% CI: 88‐93). Subsequently (July 2011December 2012), a pay‐for‐performance (P4P) initiative was added to direct face‐to‐face provider feedback. During the P4P initiative, provider incentive per relative value unit (RVU) was progressively increased with increasing performance on provision of risk‐appropriate VTE prophylaxis (adherence <80% = no bonus to $0.50 per RVU for adherence 95%). During this period, prescription of guideline‐adherent prophylaxis rose to 94% (95% CI: 93%‐96%).[15] These initiatives transformed the hospitalist unit from a consistently low‐performance unit to a high‐performance unit.
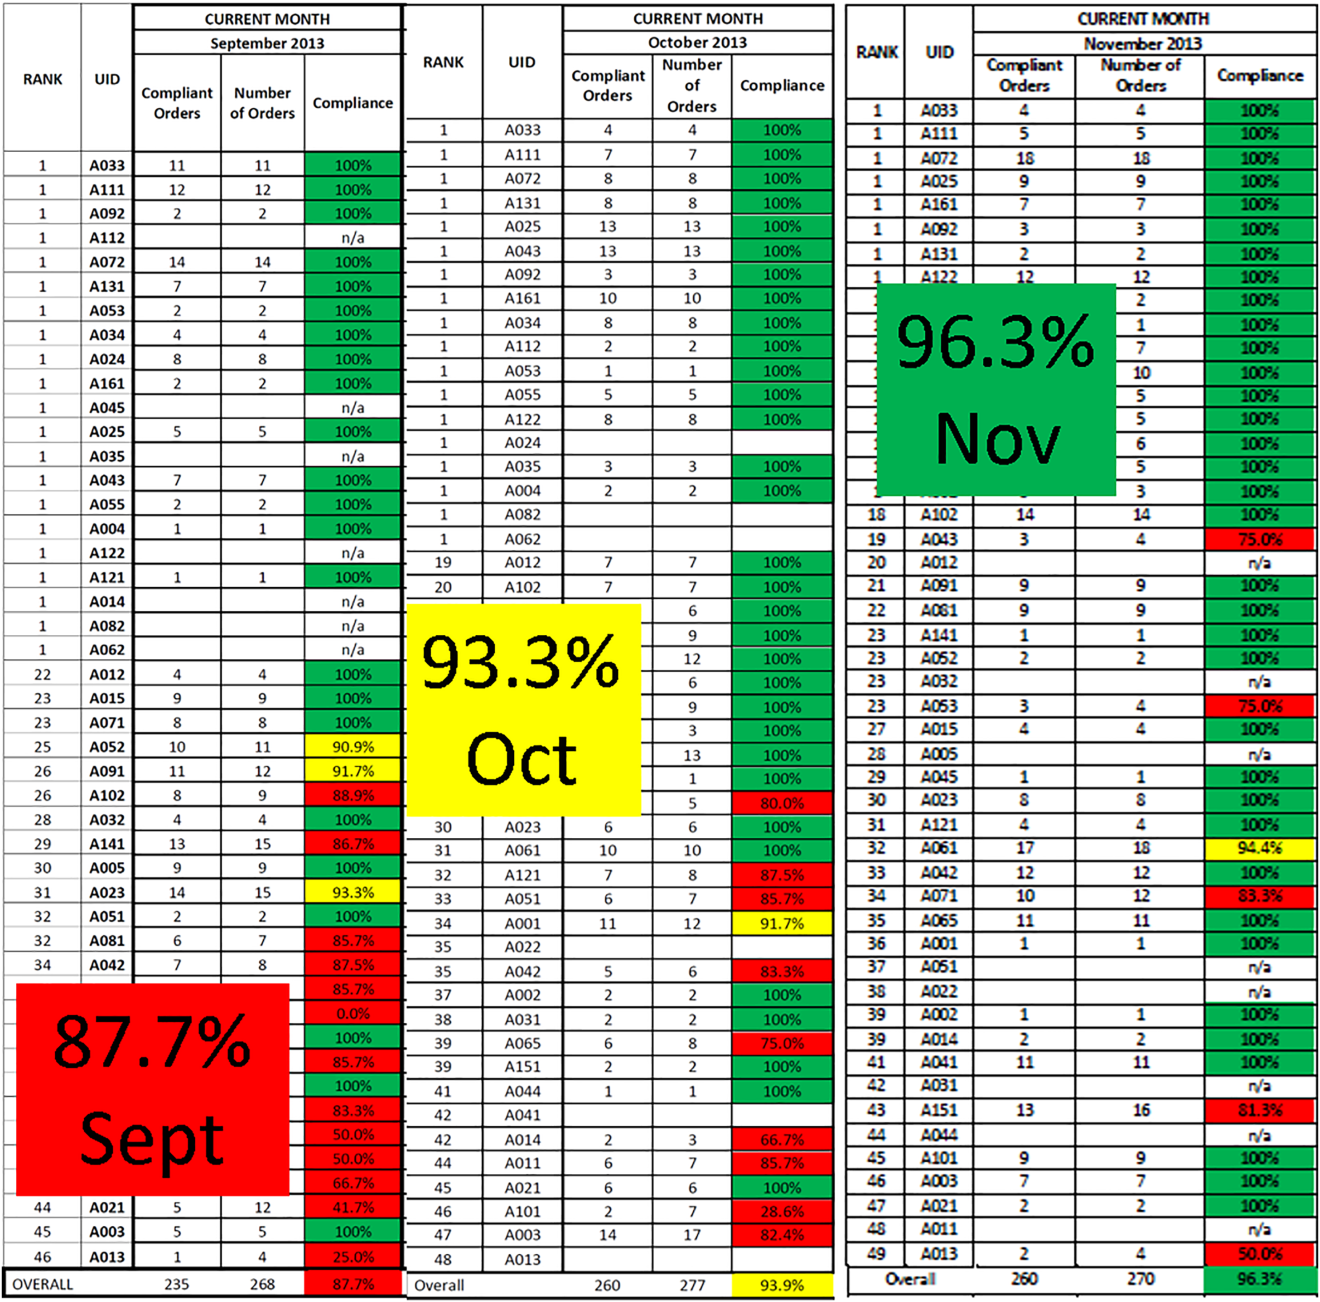
Similar findings were noted on the trauma service. Although the original plan was to provide feedback to attending trauma surgeons, that plan changed when we found that performance was driven entirely by resident practice; residents write the VTE prophylaxis orders, which is then attributed to attending performance. Resident performance varied widely; 42 of 75 (56%) residents on the trauma service ordered risk‐appropriate prophylaxis for 100% of their patients. In contrast, 7 (9.3%) residents never ordered optimal prophylaxis for any of their patients.[16] To motivate all residents to prescribe optimal prophylaxis, we developed an individualized resident VTE prophylaxis scorecard (Figure 2). This prospective cohort study of 2420 patients and 49 general surgery residents compared resident VTE prophylaxis performance on the general surgery service during 3 periods: period 1 (baseline, July 2013September 2013), period 2 (surgery resident scorecard, October 2013December 2013), period 3 (resident scorecard plus individualized 1‐on‐1 coaching, January 2014March 2014). At baseline, 89.4% of patients were prescribed appropriate VTE prophylaxis, and only 45% of residents prescribed risk‐appropriate prophylaxis for all their patients. During the scorecard period, 95.4% of patients were prescribed risk‐appropriate VTE prophylaxis (P < 0.001). During the scorecard plus coaching period, risk‐appropriate prophylaxis rose to 96.4%. These prescribing practice changes were durable. During the 15 months prior to issuing scorecards, 88.0% of patients (3718/4226) were prescribed risk‐appropriate prophylaxis. After implementation, 95.8% of patients (3799/3966) were prescribed risk‐appropriate prophylaxis (P < 0.001) (see Supporting Figure 2 in the online version of this article). During the baseline period, 7 of 865 patients (0.81%) had a VTE during their hospital stay, of which 3 (0.35%) were potentially preventable. In contrast, none of the 3 of 784 patients who suffered VTE during the postimplementation period had a potentially preventable event (0.35% vs 0%, P = 0.046).[17] These studies demonstrate that providing physicians with their own specific data can be a powerful tool for performance improvement that may be applicable to many other quality and safety measures. Our group recently received funding from the AHRQ to scale this work to other residents, nurse practitioners, physician assistants, and attending physicians (1R01HS024547, Individualized Performance Feedback on Venous Thromboembolism Prevention Practice).
IMPROVING VTE PROPHYLAXIS ADMINISTRATION
Ordering VTE prophylaxis does not ensure its administration. We conducted a retrospective review of electronic administration records of 10,526 consecutive patients admitted over a 7‐month period at The Johns Hopkins Hospital. Twelve percent of the over 100,000 ordered doses of VTE prophylaxis were not administered, and the proportion of nonadministered doses on individual floors varied 5‐fold from 5.4% to 26.9%. The proportion of nonadministered doses was significantly higher on medical floors compared with all other services (17.5% vs 8.1%, odds ratio [OR]: 2.1 [95% CI: 2.0‐2.2]). Patient or family member refusal was the most common cause for nonadministered doses of VTE prophylaxis accounting for 59% of all missed doses. Eight percent of patients missed more than half their prescribed doses, and 5% of patients missed over 75% of ordered doses of VTE prophylaxis. Consistent with the Pareto principle, over 80% of the missed doses of prophylaxis were accounted for by just 20% of the patients.[18] A retrospective analysis of hospital‐acquired VTE at Johns Hopkins found that 39% of events occurred in patients who missed 1 or more doses of appropriate VTE prophylaxis.[19] Louis et al. noted that nonadministration of 1 dose of VTE prophylaxis was associated with a significant increase in risk for hospital acquired VTE.[20] These data indicate the need for more aggressive interventions to reduce missed doses to improve VTE prevention.
To fully understand the root causes of VTE prophylaxis non‐administration, we conducted a series of studies examining each of the participants in the VTE prevention care pathway, physicians, nurses, and patients. In a survey of 122 resident physicians, we found significant differences in clinical practice between medicine and surgery residents. Medicine residents were more likely to believe that VTE prophylaxis was overprescribed, and that it was appropriate for nurses to make judgement calls about whether patients needed the prophylaxis that was prescribed.[21] In a mixed methods study that included a written survey and qualitative observations of nursing practice, we found that some nurses presented pharmacologic VTE prophylaxis injections as optional to patients. Furthermore, nurses on units where nonadministration was higher were more likely to believe that VTE prophylaxis was prescribed for patients unnecessarily, and that they could use their clinical judgement to determine when it was appropriate to omit doses of pharmacologic prophylaxis.[22] Our team also examined patient preferences in regard to VTE prophylaxis. In a survey of 227 consecutive medical and surgical inpatients, we found that 60% of patients would prefer an oral route of administration if available. Patients with a preference for a parenteral route of administration (27.5%) were less likely to refuse prophylaxis (37.5% vs 51.3%, P < 0.0001).[23] These findings underscore the fact that unit culture, nursing attitudes and beliefs, and patient preferences have an important influence on medication administration, and that nursepatient communication is an important target for modifying adherence.
PATIENT‐CENTERED APPROACHES TO IMPROVE VTE PROPHYLAXIS ADMINISTRATION
To address nurse‐ and patient‐related factors that influence VTE prophylaxis administration, we applied for and received a Patient Centered Outcomes Research Institute contract to develop patient‐centered interventions to engage and empower patients to take an active role in their preventive care. To achieve these aims, we partnered with 3 national patient advocacy organizations, the National Blood Clot Alliance, the North American Thrombosis Forum, and ClotCare, as well as our local Johns Hopkins Patient and Family Advisory Council. Using a modified Delphi method, we engaged patient stakeholders from the 4 collaborating organizations to build consensus on patient‐centered VTE education methods. Input from this Delphi assessment was used to build educational materials including paper brochures published in 8 different languages and a 10‐minute educational video filmed by an Oscar‐winning documentary director featuring both clinicians and patients relating their VTE experience and the importance of VTE prevention.[24] These educational materials are available for public use (
ENGAGING TRAINEES IN MULTIDISCIPLINARY PATIENT SAFETY/QUALITY IMPROVEMENT INITIATIVES
Trainees from many healthcare‐related disciplines have played a critical role in our quest to improve VTE prevention. Over the past 10 years, we have mentored countless medical students, public health graduate students, nursing students, residents, and postdoctoral fellows in research projects that have resulted in numerous high‐quality publications. Trainees have helped to dispel staff concerns about patient falls in connection of intermittent pneumatic compression devices,[25] identify the weaknesses of current publicly reported VTE measures,[26, 27, 28, 29] identify opportunities to improve VTE prevention practices within clinical specialties,[30, 31, 32] define the role of surveillance bias in VTE outcomes reporting,[33, 34, 35] discover and fully explore the important problem of missed doses of VTE prophylaxis,[18, 21, 22, 23, 36] and summarize knowledge about VTE prevention via systematic reviews and meta‐analyses.[37, 38, 39] These collaborations have been a classic win‐win. The mentees learn critical skills while growing their curriculum vitae with contributions to the literature, allowing them to progress in their careers (ie, obtain a residency match, faculty positions). The faculty have leveraged this work to obtain over $3 million in extramural funding to develop interventions to study and improve the quality of VTE preventive care for hospitalized patients.
In healthcare, we have not yet achieved defect‐free VTE prevention; however, we have a better understanding of the path to accomplishing this goal. In this article we describe our goal of zero harm from VTE and our learning journey to realize that goal. Although the journey never ends, a critical ingredient to the success of our program has been the multidisciplinary nature of our VTE collaborative team. The combination of expertise from medicine, surgery, nursing, pharmacy, clinical informatics, and public health has facilitated the development of innovative strategies to improve VTE prevention that integrate seamlessly into clinical workflow. The approach used for VTE can be applied to eliminate other types of harms.
Disclosures
Mr. Lau, Dr. Streiff, and Dr. Haut are supported by a grant from the Agency for Healthcare Research and Quality (1R01HS024547) titled Individualized Performance Feedback on Venous Thromboembolism Prevention Practice and a contract from the Patient‐Centered Outcomes Research Institute titled Preventing Venous Thromboembolism: Empowering Patients and Enabling Patient‐Centered Care via Health Information Technology (CE‐12‐11‐4489). Mr. Lau is supported by the Institute for Excellence in Education Berkheimer Faculty Education Scholar Grant and a contract (AD‐1306‐03980) from the Patient‐Centered Outcomes Research Institute titled Patient Centered Approaches to Collect Sexual Orientation/Gender Identity Information in the Emergency Department. Ms. Hobson has given expert witness testimony in various medical malpractice cases. Dr. Streiff has received research funding from Portola and Janssen; consulted for Bio2Medical, CSL Behring, Merck, and Janssen HealthCare; and has given expert witness testimony in various medical malpractice cases. Dr. Haut receives royalties from Lippincott, Williams, and Wilkins for a book titled Avoiding Common ICU Errors. Dr. Haut is a paid consultant and speaker for the Preventing Avoidable Venous ThromboembolismEvery Patient, Every Time VHA/Vizient IMPERATIV Advantage Performance Improvement Collaborative. Dr. Haut is a paid consultant and speaker for the Illinois Surgical Quality Improvement Collaborative. All other authors report no disclosures.
- , . Thromboprophylaxis in nonsurgical patients. Hematology Am Soc Hematol Educ Program. 2012;2012:631–637.
- Office of the Surgeon General (US); National Heart, Lung, and Blood Institute (US). The Surgeon General's Call to Action to Prevent Deep Vein Thrombosis and Pulmonary Embolism. Rockville, MD: Office of the Surgeon General; 2008.
- , . Prevention of venous thromboembolism: brief update review. In: Making Health Care Safer II: An Updated Critical Analysis of the Evidence for Patient Safety Practices. Rockville, MD: Agency for Healthcare Research and Quality; 2013.
- , , , et al. The top patient safety strategies that can be encouraged for adoption now. Ann Intern Med. 2013;158:365–368.
- , . Practices to prevent venous thromboembolism: a brief review. BMJ Qual Saf. 2014;23:187–195.
- , , , et al. Venous thromboembolism risk and prophylaxis in the acute hospital care setting (ENDORSE study): a multinational cross‐sectional study. Lancet. 2008;371:387–394.
- , . The CMS ruling on venous thromboembolism after total knee or hip arthroplasty: weighing risks and benefits. JAMA. 2009;301:1063–1065.
- , , , et al. ICD‐9 code‐based venous thromboembolism performance targets fail to measure up. Am J Med Qual. 2016;31(5):448–453.
- , , , , . Evidence‐based venous thromboembolism prophylaxis is associated with a six‐fold decrease in numbers of symptomatic venous thromboembolisms in rehabilitation inpatients. PM R. 2011;3:1111–1115.e1.
- , , . Translating evidence into practice: a model for large scale knowledge translation. BMJ. 2008;337:a1714.
- , , , et al. Lessons from the Johns Hopkins Multi‐Disciplinary Venous Thromboembolism (VTE) Prevention Collaborative. BMJ. 2012;344:e3935.
- , , , et al. Improved prophylaxis and decreased rates of preventable harm with the use of a mandatory computerized clinical decision support tool for prophylaxis for venous thromboembolism in trauma. Arch Surg. 2012;147:901–907.
- , , , et al. Impact of a venous thromboembolism prophylaxis “smart order set”: improved compliance, fewer events. Am J Hematol. 2013;88(7):545–549.
- , , , et al. Eliminating health care disparities with mandatory clinical decision support: the venous thromboembolism (VTE) example. Med Care. 2015;53:18–24.
- , , , et al. Use of provider‐level dashboards and pay‐for‐performance in venous thromboembolism prophylaxis. J Hosp Med. 2015;10:172–178.
- , , , , , . Attending physician performance measure scores and resident physicians' ordering practices. JAMA Surg. 2015;150:813–814.
- , , , et al. Individualized performance feedback to surgical residents improves appropriate venous thromboembolism prophylaxis prescription and reduces potentially preventable VTE: a prospective cohort study [published online November 25, 2015]. Ann Surg. doi: 10.1097/SLA.0000000000001512.
- , , , et al. Patterns of non‐administration of ordered doses of venous thromboembolism prophylaxis: implications for novel intervention strategies. PLoS One. 2013;8:e66311.
- , , , et al. Preventability of hospital‐acquired venous thromboembolism. JAMA Surg. 2015;150(9):912–915.
- , , , et al. Correlation of missed doses of enoxaparin with increased incidence of deep vein thrombosis in trauma and general surgery patients. JAMA Surg. 2014;149:365–370.
- , , , et al. Prescriber knowledge and attitudes regarding non‐administration of prescribed pharmacologic venous thromboembolism prophylaxis [published online May 21, 2016]. J Thromb Thrombolysis. doi:10.1007/s11239-016-1378-8.
- , , , et al. Hidden barriers to delivery of pharmacological venous thromboembolism prophylaxis: the role of nursing beliefs and practices. J Patient Saf. 2016;12:63–68.
- , , , et al. Patient preferences regarding pharmacologic venous thromboembolism prophylaxis. J Hosp Med. 2015;10:108–111.
- , , , et al. Patient preferences for receiving education on venous thromboembolism prevention—a survey of stakeholder organizations. PLoS One. 2016;11:e0152084.
- , , , , , . Are sequential compression devices commonly associated with in‐hospital falls? A myth‐busters review using the patient safety net database. J Patient Saf. 2011;7:77–79.
- , , , , . No association between hospital‐reported perioperative venous thromboembolism prophylaxis and outcome rates in publicly reported data. JAMA Surg. 2014;149:400–401.
- , , , , . Linking processes and outcomes: a key strategy to prevent and report harm from venous thromboembolism in surgical patients. JAMA Surg. 2013;148:299–300.
- , , , et al. Hazards of benchmarking complications with the National Trauma Data Bank: numerators in search of denominators. J Trauma. 2008;64:273–277; discussion 277–279.
- , , , et al. Is the meaningful use venous thromboembolism VTE‐6 measure meaningful? A retrospective analysis of one hospital's VTE‐6 cases. Jt Comm J Qual Patient Saf. 2016;42(9):410–416.
- , , , et al. Is venous thromboembolism in colorectal surgery patients preventable or inevitable? One institution's experience. J Am Coll Surg. 2013;216:395–401.e1.
- , , , et al. Venous thromboembolic prophylaxis after a hepatic resection: patterns of care among liver surgeons. HPB (Oxford). 2014;16:892–898.
- , , , et al. Defining incidence and risk factors of venous thromboembolism after hepatectomy. J Gastrointest Surg. 2014;18:1116–1124.
- , , , et al. Can increased incidence of deep vein thrombosis (DVT) be used as a marker of quality of care in the absence of standardized screening? The potential effect of surveillance bias on reported DVT rates after trauma. J Trauma. 2007;63:1132–1135; discussion 1135–1137.
- , . Surveillance bias in outcomes reporting. JAMA. 2011;305:2462–2463.
- , , , et al. Surveillance bias and deep vein thrombosis in the national trauma data bank: the more we look, the more we find. J Trauma. 2008;64:932–936; discussion 936–937.
- , , , et al. Nonadministration of thromboprophylaxis in hospitalized patients with HIV: a missed opportunity for prevention? J Hosp Med. 2014;9:215–220.
- , , , et al. Pharmacologic and mechanical prophylaxis of venous thromboembolism among special populations. Comparative effectiveness review No. 116. Prepared by the Johns Hopkins University Evidence‐based Practice Center under Contract No. 290‐2007‐10061‐I.) AHRQ Publication No. 13‐EHC082–1. Rockville, MD: Agency for Healthcare Research and Quality; 2013.
- , , , et al. Pharmacologic and mechanical strategies for preventing venous thromboembolism after bariatric surgery: a systematic review and meta‐analysis. JAMA Surg. 2013;148:675–686.
- , , , et al. The effectiveness of prophylactic inferior vena cava filters in trauma patients: a systematic review and meta‐analysis. JAMA Surg. 2014;149:194–202.
Venous thromboembolism (VTE), which encompasses deep venous thrombosis and pulmonary embolism, is an important cause of preventable morbidity and mortality.[1] Each year it is estimated as many as 600,000 American's suffer VTE and as many as 100,000 die.[2] Consequently, patient safety and healthcare quality, accrediting organizations such as The Joint Commission, and federal agencies such as the Centers for Disease Control and Prevention and Agency for Healthcare Research and Quality (AHRQ) have made VTE prevention a priority.[3, 4, 5]
Despite widespread recognition that VTE prophylaxis is an important patient safety measure, poor performance is common. The ENDORSE (Epidemiologic International Day for the Evaluation of Patients at Risk for Venous Thromboembolism in the Acute Hospital Care Setting) study of over 68,000 hospitalized patients in 32 countries noted only 58.5% of surgical patients and 39.5% medical patients received American College of Chest Physicians (ACCP) guideline‐appropriate VTE prophylaxis.[6] In 2005, an audit of the surgical services at The Johns Hopkins Hospital found that only 33% of 322 randomly selected patients were prescribed prophylaxis consistent with the ACCP guidelines.
Achieving defect‐free VTE prevention requires attention to each step in the process: (1) assessment of both VTE and bleeding risk, (2) prescription of risk‐appropriate VTE prophylaxis, and (3) administration of risk‐appropriate VTE prophylaxis. In 2005, to improve our VTE prevention performance at Johns Hopkins Hospital, the Center for Innovations organized a VTE Collaborative of 2 physicians, 1 nurse, and 1 pharmacist dedicated to VTE quality improvement. Since then, the group has grown dramatically, adding a clinical informatics expert and numerous other members and coming under the auspices of The Armstrong Institute for Patient Safety. Recognizing that many, though not all, VTEs are potentially preventable,[7, 8] the mission of the Johns Hopkins VTE Collaborative is to ensure that all hospitalized patients receive risk‐appropriate, best‐practice VTE prophylaxis. This article chronicles the innovative strategies that the Johns Hopkins VTE Collaborative has employed over the past decade to improve our hospital's performance in VTE prevention (Table 1).
|
| Strategies to improve VTE prophylaxis ordering |
| Paper‐based patient risk assessment forms (before computer order entry) |
| Mandatory evidence‐based specialty‐specific computer clinical decision support smart order sets |
| Group data and competitions |
| 1‐on‐1 provider feedback |
| Pay for performance |
| Individualized feedback with resident scorecards |
| Strategies to improve VTE prophylaxis administration |
| Identification of missed doses as a major contributor to preventable VTE |
| Identification of physician, nurse and patient contributors to missed doses |
| Collaboration with patients to create patient‐centered educational materials |
| Novel web‐based module for nursing education |
| Real‐time missed doses alert |
| Targeted 1‐on‐1 patient education |
ENSURING EVERY PATIENT IS PRESCRIBED RISK‐APPROPRIATE PROPHYLAXIS
With the support of hospital leadership, the VTE Collaborative held a series of events in 2005 with medical and surgical providers to review the current evidence supporting VTE prophylaxis and achieve consensus on appropriate practice based upon the 2004 ACCP VTE Prophylaxis Guideline. The result was the development of 5 evidence‐based, paper VTE prophylaxis order sets that guided the ordering provider on the assessment of VTE and bleeding risk and facilitated the selection of risk‐appropriate VTE prophylaxis. Because there were no validated VTE or bleeding risk assessment tools at the time we developed our order sets, we used specialty‐specific VTE risk factors derived from the 2004 ACCP Guideline. To identify patients inappropriate for pharmacologic prophylaxis, we used exclusion criteria derived from contemporary randomized clinical trials of pharmacologic prophylaxis in the target populations (ie, active bleeding, abnormal activated partial thromboplastin time not due to a lupus inhibitor) or mutually agreed upon thresholds after discussion with individual provider groups (platelet count <50,000/L). On the Johns Hopkins Hospital inpatient acute rehabilitation unit, introduction of the paper order sets increased adherence with ACCP guidelines from 27% to 98% (P < 0.0001) and reduced symptomatic VTE from 49 per 1000 admissions to 8 per 1000 admissions (P = 0.0001).[9] This study demonstrated that paper order sets used consistently by a dedicated group of providers can result in sustained improvements in practice. Paper order sets remain a low‐tech, easy‐to‐implement strategy that can be applied in any healthcare setting. Other services also saw improvements in risk‐appropriate prophylaxis prescription. In a follow‐up cross‐sectional analysis of the surgical services at Johns Hopkins, we found that appropriate VTE prophylaxis prescription improved from 33% to 62% in a sample of 226 patients. Unfortunately, paper order sets had several disadvantages including (1) the inherent difficulty of making them a mandatory part of the admission or transfer process, (2) their existence outside the usual clinical workflow, and (3) the labor‐ and time‐intensive data collection that made it difficult to provide credible, timely performance reports to providers and leadership.
These disadvantages and our adoption of a computerized provider order entry system prompted us to pursue the development and implementation of mandatory, evidence‐based, specialty‐specific computerized clinical decision support (CCDS) VTE prophylaxis order sets. Using the Translating Research Into Practice approach to quality improvement,[10] we collaborated with providers to design 16 different evidence‐based specialty‐specific CCDS VTE order sets. These CCDS VTE order sets, which are imbedded in the specialty‐specific admission and transfer order sets, assist providers in assessing patients' VTE and bleeding risk factors and provide evidence‐based risk‐appropriate VTE prophylaxis (see Supporting Figure 1 in the online version of this article). Individual patient data are saved in an administrative database and can be easily aggregated for research analyses and quality improvement/performance reporting. A detailed discussion of our strategy for change is discussed in Streiff et al.[11] Because pharmacologic prophylaxis is not appropriate for every patient, and not all VTE are preventable, even with perfect prophylaxis, the goals of our collaborative are to ensure that every patient is ordered VTE prophylaxis consistent with their risk profile (risk‐appropriate prophylaxis) and to eliminate preventable episodes of VTE (VTE that occurs in the setting of suboptimal prophylaxis). In a prepost quasi‐experimental study of 1599 trauma patients, the CCDS VTE order set increased risk‐appropriate prophylaxis prescription from 66.2% to 84.4% (P < .001) and reduced the incidence of potentially preventable harm from VTE from 1% to 0.17% (P = 0.04) (Figure 1).[12] On the medical service, the CCDS VTE order set improved risk‐appropriate VTE prophylaxis prescription from 65.6% to 90.1% (P < 0.0001) and reduced the incidence of potentially preventable harm attributable to VTE from 1.1% to 0% (P = 0.001). There was no increase in major bleeding (International Society of Thrombosis and Hemostasis definition: hemoglobin decline of 2 grams/dL or transfusion of 2 or more units of blood or bleeding into a critical organ such as brain, gastrointestinal tract, or eye) postorder set implementation (0.3% vs 0.1%, P = 0.625) or all‐cause mortality (1.3% vs 2.0%, P = 0.285).[13]
These order sets demonstrated that CCDS tools can lead to significant improvements in prescribing practices and reductions in preventable harm from VTE without increasing the risk of major bleeding complications. In addition to improving the quality of care, the order sets also improved the consistency of care. In a retrospective analysis, we found that implementation of CCDS VTE order sets eliminated racial disparities in prescribing practices. In the preimplementation group, risk‐appropriate VTE prophylaxis was prescribed for 70.1% of black patients and 56.6% of white patients on the trauma service (P = 0.025) and 69.5% of black patients and 61.7% of white patients on the medical service (P = 0.015). After implementation of the CCDS VTE order sets, care improved for all patients such that the previously observed disparities were eliminated (trauma service 84.5% vs 85.5%, P = 0.99 and medical service 91.8% vs 88.0%, P = 0.082).[14] These data indicate that standardizing care can potentially eliminate disparities in clinical practice.
Although implementation of mandatory evidence‐based, specialty‐specific CDSS VTE order sets led to substantial improvements in VTE prophylaxis ordering, high performance was not uniform across our institution. On the medical service, substantial disparities in adherence to order set recommendations existed. On the housestaff services, over 90% of patients consistently received risk‐appropriate VTE prophylaxis compared with only 85% on the hospitalist service. Examination of individual provider performance found that some providers only ordered risk‐appropriate prophylaxis 50% of the time, whereas others were doing so 98% of the time. To address this disparity, we conducted a retrospective analysis of a prospective performance improvement project conducted on the Johns Hopkins Hospitalist service studying the impact of individualized hospitalist attending feedback on VTE prevention practices. During the preintervention period (January 2009December 2010), guideline‐adherent VTE prophylaxis was ordered for 86% (95% confidence interval [CI]: 85%‐88%) of patients. Six months after initiation of direct face‐to‐face provider feedback (January 2011June 2011), guideline‐adherent VTE prophylaxis rates rose to 90% (95% CI: 88‐93). Subsequently (July 2011December 2012), a pay‐for‐performance (P4P) initiative was added to direct face‐to‐face provider feedback. During the P4P initiative, provider incentive per relative value unit (RVU) was progressively increased with increasing performance on provision of risk‐appropriate VTE prophylaxis (adherence <80% = no bonus to $0.50 per RVU for adherence 95%). During this period, prescription of guideline‐adherent prophylaxis rose to 94% (95% CI: 93%‐96%).[15] These initiatives transformed the hospitalist unit from a consistently low‐performance unit to a high‐performance unit.
Similar findings were noted on the trauma service. Although the original plan was to provide feedback to attending trauma surgeons, that plan changed when we found that performance was driven entirely by resident practice; residents write the VTE prophylaxis orders, which is then attributed to attending performance. Resident performance varied widely; 42 of 75 (56%) residents on the trauma service ordered risk‐appropriate prophylaxis for 100% of their patients. In contrast, 7 (9.3%) residents never ordered optimal prophylaxis for any of their patients.[16] To motivate all residents to prescribe optimal prophylaxis, we developed an individualized resident VTE prophylaxis scorecard (Figure 2). This prospective cohort study of 2420 patients and 49 general surgery residents compared resident VTE prophylaxis performance on the general surgery service during 3 periods: period 1 (baseline, July 2013September 2013), period 2 (surgery resident scorecard, October 2013December 2013), period 3 (resident scorecard plus individualized 1‐on‐1 coaching, January 2014March 2014). At baseline, 89.4% of patients were prescribed appropriate VTE prophylaxis, and only 45% of residents prescribed risk‐appropriate prophylaxis for all their patients. During the scorecard period, 95.4% of patients were prescribed risk‐appropriate VTE prophylaxis (P < 0.001). During the scorecard plus coaching period, risk‐appropriate prophylaxis rose to 96.4%. These prescribing practice changes were durable. During the 15 months prior to issuing scorecards, 88.0% of patients (3718/4226) were prescribed risk‐appropriate prophylaxis. After implementation, 95.8% of patients (3799/3966) were prescribed risk‐appropriate prophylaxis (P < 0.001) (see Supporting Figure 2 in the online version of this article). During the baseline period, 7 of 865 patients (0.81%) had a VTE during their hospital stay, of which 3 (0.35%) were potentially preventable. In contrast, none of the 3 of 784 patients who suffered VTE during the postimplementation period had a potentially preventable event (0.35% vs 0%, P = 0.046).[17] These studies demonstrate that providing physicians with their own specific data can be a powerful tool for performance improvement that may be applicable to many other quality and safety measures. Our group recently received funding from the AHRQ to scale this work to other residents, nurse practitioners, physician assistants, and attending physicians (1R01HS024547, Individualized Performance Feedback on Venous Thromboembolism Prevention Practice).
IMPROVING VTE PROPHYLAXIS ADMINISTRATION
Ordering VTE prophylaxis does not ensure its administration. We conducted a retrospective review of electronic administration records of 10,526 consecutive patients admitted over a 7‐month period at The Johns Hopkins Hospital. Twelve percent of the over 100,000 ordered doses of VTE prophylaxis were not administered, and the proportion of nonadministered doses on individual floors varied 5‐fold from 5.4% to 26.9%. The proportion of nonadministered doses was significantly higher on medical floors compared with all other services (17.5% vs 8.1%, odds ratio [OR]: 2.1 [95% CI: 2.0‐2.2]). Patient or family member refusal was the most common cause for nonadministered doses of VTE prophylaxis accounting for 59% of all missed doses. Eight percent of patients missed more than half their prescribed doses, and 5% of patients missed over 75% of ordered doses of VTE prophylaxis. Consistent with the Pareto principle, over 80% of the missed doses of prophylaxis were accounted for by just 20% of the patients.[18] A retrospective analysis of hospital‐acquired VTE at Johns Hopkins found that 39% of events occurred in patients who missed 1 or more doses of appropriate VTE prophylaxis.[19] Louis et al. noted that nonadministration of 1 dose of VTE prophylaxis was associated with a significant increase in risk for hospital acquired VTE.[20] These data indicate the need for more aggressive interventions to reduce missed doses to improve VTE prevention.
To fully understand the root causes of VTE prophylaxis non‐administration, we conducted a series of studies examining each of the participants in the VTE prevention care pathway, physicians, nurses, and patients. In a survey of 122 resident physicians, we found significant differences in clinical practice between medicine and surgery residents. Medicine residents were more likely to believe that VTE prophylaxis was overprescribed, and that it was appropriate for nurses to make judgement calls about whether patients needed the prophylaxis that was prescribed.[21] In a mixed methods study that included a written survey and qualitative observations of nursing practice, we found that some nurses presented pharmacologic VTE prophylaxis injections as optional to patients. Furthermore, nurses on units where nonadministration was higher were more likely to believe that VTE prophylaxis was prescribed for patients unnecessarily, and that they could use their clinical judgement to determine when it was appropriate to omit doses of pharmacologic prophylaxis.[22] Our team also examined patient preferences in regard to VTE prophylaxis. In a survey of 227 consecutive medical and surgical inpatients, we found that 60% of patients would prefer an oral route of administration if available. Patients with a preference for a parenteral route of administration (27.5%) were less likely to refuse prophylaxis (37.5% vs 51.3%, P < 0.0001).[23] These findings underscore the fact that unit culture, nursing attitudes and beliefs, and patient preferences have an important influence on medication administration, and that nursepatient communication is an important target for modifying adherence.
PATIENT‐CENTERED APPROACHES TO IMPROVE VTE PROPHYLAXIS ADMINISTRATION
To address nurse‐ and patient‐related factors that influence VTE prophylaxis administration, we applied for and received a Patient Centered Outcomes Research Institute contract to develop patient‐centered interventions to engage and empower patients to take an active role in their preventive care. To achieve these aims, we partnered with 3 national patient advocacy organizations, the National Blood Clot Alliance, the North American Thrombosis Forum, and ClotCare, as well as our local Johns Hopkins Patient and Family Advisory Council. Using a modified Delphi method, we engaged patient stakeholders from the 4 collaborating organizations to build consensus on patient‐centered VTE education methods. Input from this Delphi assessment was used to build educational materials including paper brochures published in 8 different languages and a 10‐minute educational video filmed by an Oscar‐winning documentary director featuring both clinicians and patients relating their VTE experience and the importance of VTE prevention.[24] These educational materials are available for public use (
ENGAGING TRAINEES IN MULTIDISCIPLINARY PATIENT SAFETY/QUALITY IMPROVEMENT INITIATIVES
Trainees from many healthcare‐related disciplines have played a critical role in our quest to improve VTE prevention. Over the past 10 years, we have mentored countless medical students, public health graduate students, nursing students, residents, and postdoctoral fellows in research projects that have resulted in numerous high‐quality publications. Trainees have helped to dispel staff concerns about patient falls in connection of intermittent pneumatic compression devices,[25] identify the weaknesses of current publicly reported VTE measures,[26, 27, 28, 29] identify opportunities to improve VTE prevention practices within clinical specialties,[30, 31, 32] define the role of surveillance bias in VTE outcomes reporting,[33, 34, 35] discover and fully explore the important problem of missed doses of VTE prophylaxis,[18, 21, 22, 23, 36] and summarize knowledge about VTE prevention via systematic reviews and meta‐analyses.[37, 38, 39] These collaborations have been a classic win‐win. The mentees learn critical skills while growing their curriculum vitae with contributions to the literature, allowing them to progress in their careers (ie, obtain a residency match, faculty positions). The faculty have leveraged this work to obtain over $3 million in extramural funding to develop interventions to study and improve the quality of VTE preventive care for hospitalized patients.
In healthcare, we have not yet achieved defect‐free VTE prevention; however, we have a better understanding of the path to accomplishing this goal. In this article we describe our goal of zero harm from VTE and our learning journey to realize that goal. Although the journey never ends, a critical ingredient to the success of our program has been the multidisciplinary nature of our VTE collaborative team. The combination of expertise from medicine, surgery, nursing, pharmacy, clinical informatics, and public health has facilitated the development of innovative strategies to improve VTE prevention that integrate seamlessly into clinical workflow. The approach used for VTE can be applied to eliminate other types of harms.
Disclosures
Mr. Lau, Dr. Streiff, and Dr. Haut are supported by a grant from the Agency for Healthcare Research and Quality (1R01HS024547) titled Individualized Performance Feedback on Venous Thromboembolism Prevention Practice and a contract from the Patient‐Centered Outcomes Research Institute titled Preventing Venous Thromboembolism: Empowering Patients and Enabling Patient‐Centered Care via Health Information Technology (CE‐12‐11‐4489). Mr. Lau is supported by the Institute for Excellence in Education Berkheimer Faculty Education Scholar Grant and a contract (AD‐1306‐03980) from the Patient‐Centered Outcomes Research Institute titled Patient Centered Approaches to Collect Sexual Orientation/Gender Identity Information in the Emergency Department. Ms. Hobson has given expert witness testimony in various medical malpractice cases. Dr. Streiff has received research funding from Portola and Janssen; consulted for Bio2Medical, CSL Behring, Merck, and Janssen HealthCare; and has given expert witness testimony in various medical malpractice cases. Dr. Haut receives royalties from Lippincott, Williams, and Wilkins for a book titled Avoiding Common ICU Errors. Dr. Haut is a paid consultant and speaker for the Preventing Avoidable Venous ThromboembolismEvery Patient, Every Time VHA/Vizient IMPERATIV Advantage Performance Improvement Collaborative. Dr. Haut is a paid consultant and speaker for the Illinois Surgical Quality Improvement Collaborative. All other authors report no disclosures.
- , . Thromboprophylaxis in nonsurgical patients. Hematology Am Soc Hematol Educ Program. 2012;2012:631–637.
- Office of the Surgeon General (US); National Heart, Lung, and Blood Institute (US). The Surgeon General's Call to Action to Prevent Deep Vein Thrombosis and Pulmonary Embolism. Rockville, MD: Office of the Surgeon General; 2008.
- , . Prevention of venous thromboembolism: brief update review. In: Making Health Care Safer II: An Updated Critical Analysis of the Evidence for Patient Safety Practices. Rockville, MD: Agency for Healthcare Research and Quality; 2013.
- , , , et al. The top patient safety strategies that can be encouraged for adoption now. Ann Intern Med. 2013;158:365–368.
- , . Practices to prevent venous thromboembolism: a brief review. BMJ Qual Saf. 2014;23:187–195.
- , , , et al. Venous thromboembolism risk and prophylaxis in the acute hospital care setting (ENDORSE study): a multinational cross‐sectional study. Lancet. 2008;371:387–394.
- , . The CMS ruling on venous thromboembolism after total knee or hip arthroplasty: weighing risks and benefits. JAMA. 2009;301:1063–1065.
- , , , et al. ICD‐9 code‐based venous thromboembolism performance targets fail to measure up. Am J Med Qual. 2016;31(5):448–453.
- , , , , . Evidence‐based venous thromboembolism prophylaxis is associated with a six‐fold decrease in numbers of symptomatic venous thromboembolisms in rehabilitation inpatients. PM R. 2011;3:1111–1115.e1.
- , , . Translating evidence into practice: a model for large scale knowledge translation. BMJ. 2008;337:a1714.
- , , , et al. Lessons from the Johns Hopkins Multi‐Disciplinary Venous Thromboembolism (VTE) Prevention Collaborative. BMJ. 2012;344:e3935.
- , , , et al. Improved prophylaxis and decreased rates of preventable harm with the use of a mandatory computerized clinical decision support tool for prophylaxis for venous thromboembolism in trauma. Arch Surg. 2012;147:901–907.
- , , , et al. Impact of a venous thromboembolism prophylaxis “smart order set”: improved compliance, fewer events. Am J Hematol. 2013;88(7):545–549.
- , , , et al. Eliminating health care disparities with mandatory clinical decision support: the venous thromboembolism (VTE) example. Med Care. 2015;53:18–24.
- , , , et al. Use of provider‐level dashboards and pay‐for‐performance in venous thromboembolism prophylaxis. J Hosp Med. 2015;10:172–178.
- , , , , , . Attending physician performance measure scores and resident physicians' ordering practices. JAMA Surg. 2015;150:813–814.
- , , , et al. Individualized performance feedback to surgical residents improves appropriate venous thromboembolism prophylaxis prescription and reduces potentially preventable VTE: a prospective cohort study [published online November 25, 2015]. Ann Surg. doi: 10.1097/SLA.0000000000001512.
- , , , et al. Patterns of non‐administration of ordered doses of venous thromboembolism prophylaxis: implications for novel intervention strategies. PLoS One. 2013;8:e66311.
- , , , et al. Preventability of hospital‐acquired venous thromboembolism. JAMA Surg. 2015;150(9):912–915.
- , , , et al. Correlation of missed doses of enoxaparin with increased incidence of deep vein thrombosis in trauma and general surgery patients. JAMA Surg. 2014;149:365–370.
- , , , et al. Prescriber knowledge and attitudes regarding non‐administration of prescribed pharmacologic venous thromboembolism prophylaxis [published online May 21, 2016]. J Thromb Thrombolysis. doi:10.1007/s11239-016-1378-8.
- , , , et al. Hidden barriers to delivery of pharmacological venous thromboembolism prophylaxis: the role of nursing beliefs and practices. J Patient Saf. 2016;12:63–68.
- , , , et al. Patient preferences regarding pharmacologic venous thromboembolism prophylaxis. J Hosp Med. 2015;10:108–111.
- , , , et al. Patient preferences for receiving education on venous thromboembolism prevention—a survey of stakeholder organizations. PLoS One. 2016;11:e0152084.
- , , , , , . Are sequential compression devices commonly associated with in‐hospital falls? A myth‐busters review using the patient safety net database. J Patient Saf. 2011;7:77–79.
- , , , , . No association between hospital‐reported perioperative venous thromboembolism prophylaxis and outcome rates in publicly reported data. JAMA Surg. 2014;149:400–401.
- , , , , . Linking processes and outcomes: a key strategy to prevent and report harm from venous thromboembolism in surgical patients. JAMA Surg. 2013;148:299–300.
- , , , et al. Hazards of benchmarking complications with the National Trauma Data Bank: numerators in search of denominators. J Trauma. 2008;64:273–277; discussion 277–279.
- , , , et al. Is the meaningful use venous thromboembolism VTE‐6 measure meaningful? A retrospective analysis of one hospital's VTE‐6 cases. Jt Comm J Qual Patient Saf. 2016;42(9):410–416.
- , , , et al. Is venous thromboembolism in colorectal surgery patients preventable or inevitable? One institution's experience. J Am Coll Surg. 2013;216:395–401.e1.
- , , , et al. Venous thromboembolic prophylaxis after a hepatic resection: patterns of care among liver surgeons. HPB (Oxford). 2014;16:892–898.
- , , , et al. Defining incidence and risk factors of venous thromboembolism after hepatectomy. J Gastrointest Surg. 2014;18:1116–1124.
- , , , et al. Can increased incidence of deep vein thrombosis (DVT) be used as a marker of quality of care in the absence of standardized screening? The potential effect of surveillance bias on reported DVT rates after trauma. J Trauma. 2007;63:1132–1135; discussion 1135–1137.
- , . Surveillance bias in outcomes reporting. JAMA. 2011;305:2462–2463.
- , , , et al. Surveillance bias and deep vein thrombosis in the national trauma data bank: the more we look, the more we find. J Trauma. 2008;64:932–936; discussion 936–937.
- , , , et al. Nonadministration of thromboprophylaxis in hospitalized patients with HIV: a missed opportunity for prevention? J Hosp Med. 2014;9:215–220.
- , , , et al. Pharmacologic and mechanical prophylaxis of venous thromboembolism among special populations. Comparative effectiveness review No. 116. Prepared by the Johns Hopkins University Evidence‐based Practice Center under Contract No. 290‐2007‐10061‐I.) AHRQ Publication No. 13‐EHC082–1. Rockville, MD: Agency for Healthcare Research and Quality; 2013.
- , , , et al. Pharmacologic and mechanical strategies for preventing venous thromboembolism after bariatric surgery: a systematic review and meta‐analysis. JAMA Surg. 2013;148:675–686.
- , , , et al. The effectiveness of prophylactic inferior vena cava filters in trauma patients: a systematic review and meta‐analysis. JAMA Surg. 2014;149:194–202.
© 2016 Society of Hospital Medicine

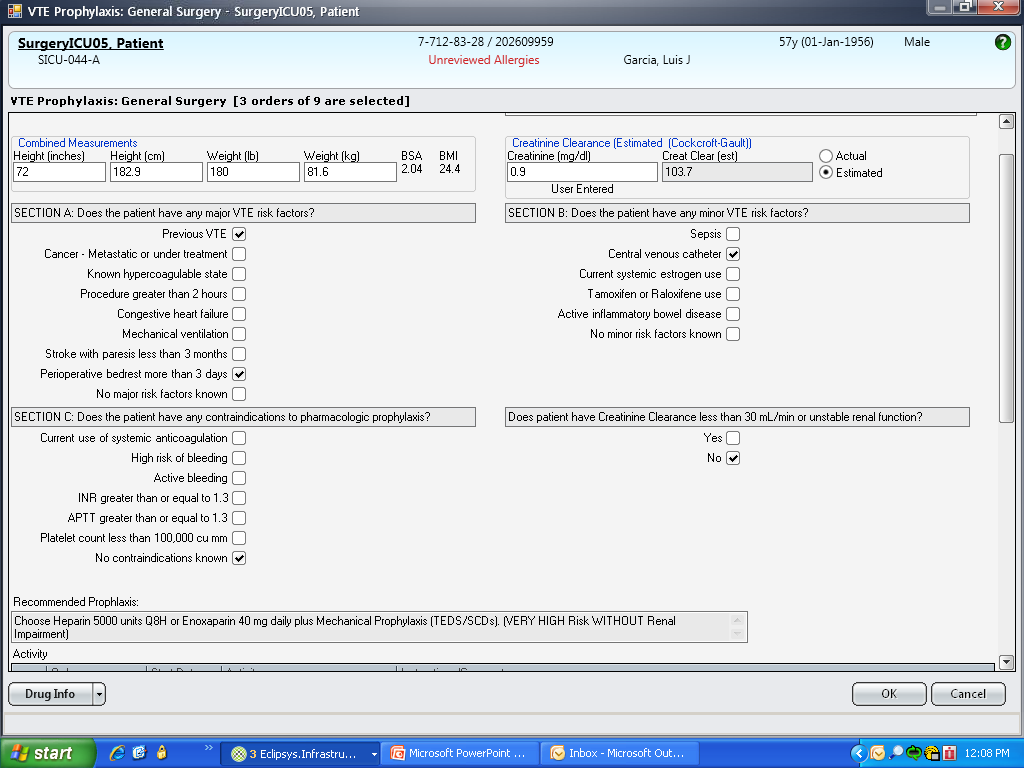
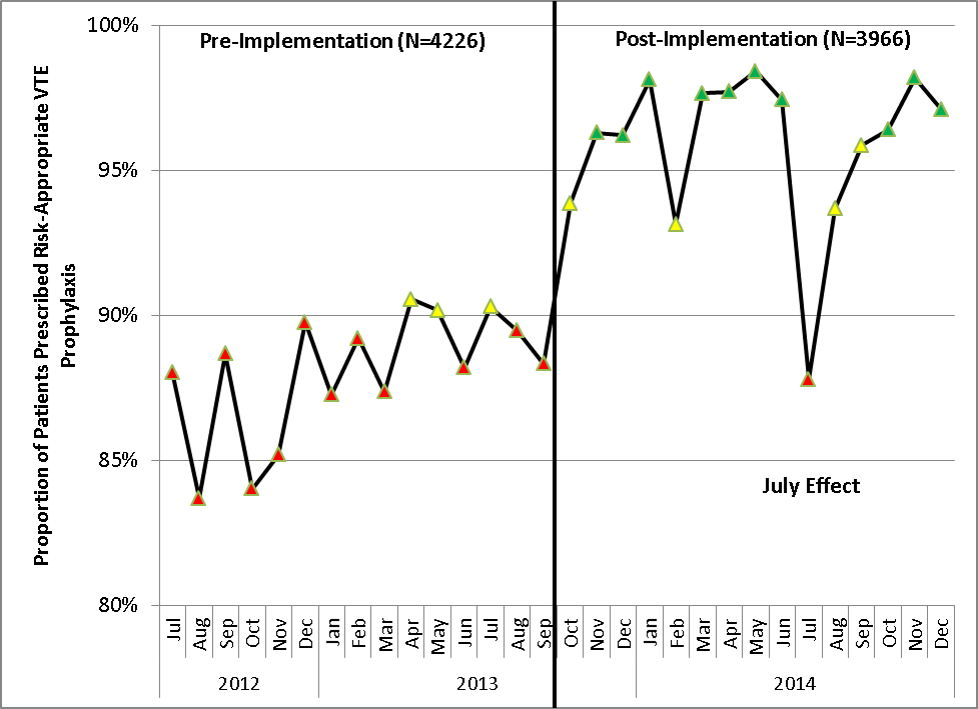
Thromboembolism Prophylaxis Preferences
The 2012 American College of Chest Physicians (ACCP) guidelines on antithrombotic and thrombolytic therapy conducted a systematic review focusing on patient values and preferences regarding antithrombotic therapy, including thromboprophylaxis.[1] They found that patient values and preferences are highly variable and should be considered when developing future clinical practice guidelines. Notably, there were no studies evaluating patient preferences for venous thromboembolism (VTE) prophylaxis, which is prescribed for the vast majority of hospitalized patients.
Historically, interventions to prevent VTE have focused on increasing prescriptions of prophylaxis. At the Johns Hopkins Hospital, we implemented a mandatory clinical decision support tool in our computerized provider order entry system.[2] Following implementation of this tool, prescription of risk‐appropriate VTE prophylaxis dramatically increased for both medical and surgical patients.[3, 4, 5] These efforts were made with the implicit and incorrect assumption that prescribed medication doses will always be administered to patients, when in fact patient refusal is a leading cause of nonadministration. Studies of VTE prophylaxis administration have reported that 10% to 12% of doses are not administered to patients.[6] Alarmingly, it has been reported that among medically ill patients, between 10% and 30% of doses are not administered, with patient refusal as the most frequently documented reason.
The purpose of this study was to assess patient preferences regarding pharmacological VTE prophylaxis.
METHODS
Study Design
A sample of consecutive hospitalized patients on select medicine and surgical floors previously identified as low‐ and high‐performing units at our institution in regard to administration rates of pharmacologic VTE prophylaxis was assembled from a daily electronic report of patients prescribed pharmacological VTE prophylaxis (Allscripts Sunrise, Chicago, IL) from December 2012 to March 2013. These units were identified in a study conducted at our institution as the lowest‐ and highest‐performing units in regard to incidence of administration of ordered pharmacologic VTE prophylaxis. From this data analysis, we chose the 2 lowest‐performing and 2 highest‐performing units on the medical and surgical service. To be eligible for this study, patients had to have an active order for 1 of the following VTE prophylaxis regimens: unfractionated heparin 5000 units or 7500 units administered subcutaneously every 8 or 12 hours, enoxaparin 30 mg administered subcutaneously every 12 hours or 40 mg administered subcutaneously every 24 hours. Participants had to be at least 18 years of age and hospitalized for at least 2 days on their respective units. Patients who were nonEnglish speaking, those previously enrolled in this study, or those unable to provide consent were excluded from the study.
Data Collection
Demographic information was collected, including patient‐reported education level. To determine their preference for VTE prophylaxis, patients were provided a survey, which included being asked, Would you prefer a pill or a shot to prevent blood clots, if they both worked equally well. The survey was created by the study team to collect information from patients regarding their baseline knowledge of VTE and preference regarding pharmacologic prophylaxis. Additional data included the patient's education level to determine potential association with preference. The survey was verbally administered by 1 investigator (A.W.) to all patients. Patients were asked to explain their rationale for their stated preference in regard to VTE prophylaxis. Patient rationale was subsequently coded to allow for uniformity among patient responses based on patterns in responses. Our electronic medication record allows us to identify patients who refused their medication through nursing documentation. Patients with documented refusal of ordered pharmacologic VTE prophylaxis were asked about the rationale for their refusal. This study was approved by the Johns Hopkins Medicine Institutional Review Board.
Statistical Analysis
Quantitative data from the surveys were analyzed using Minitab (Minitab Inc., State College, PA). A [2] test analysis was performed for categorical data, as appropriate. A P value <0.05 was considered to be statistically significant.
RESULTS
Quantitative Results
We interviewed patients regarding their preferred route of administration of VTE prophylaxis. Overall, 339 patients were screened for this study. Sixty patients were not eligible to participate. Forty‐seven were unable to provide consent, and 13 were nonEnglish speaking. Of the 269 remaining eligible patients, 227 (84.4%) consented to participate.
Baseline demographics of the participants are presented in Table 1, categorized on the basis of their preferred route of administration for VTE prophylaxis. A majority of patients indicated a preference for an oral formulation of pharmacologic VTE prophylaxis. There was no association between education level or service type on preference. Preference for an oral formulation was largely influenced by patient‐reported pain and bruising associated with subcutaneous administration (Table 2). A substantial majority of patients reporting a preference for a subcutaneous formulation and emphasized a belief that this route was associated with a faster onset of action. Among patients who preferred an oral formulation (n=137), 71 patients (51.8%) were documented as having refused at least 1 dose of ordered VTE prophylaxis. Patients who preferred a subcutaneous route of VTE prophylaxis were less likely to refuse prophylaxis, with only 22 patients (35.5%) having a documented refusal of at least 1 dose (P<0.0001).
| Enteral, n=137 | Parenteral, n=62 | No Preference, n=28 | |
|---|---|---|---|
| |||
| Age, y, mean ( SD) | 49.5 (14.7) | 51.7 (16.1) | 48.9 (14.6) |
| Male, n (%) | 74 (54.0) | 38 (61.3) | 15 (53.6) |
| Race n (%) | |||
| Caucasian | 81 (59.1) | 31 (50.0) | 14 (50.0) |
| African American | 50 (36.5) | 28 (45.2) | 14 (50.0) |
| Education level, n (%) | |||
| High school or less | 46 (33.6) | 27 (43.5) | 14 (50.0) |
| College | 68 (49.6) | 21 (33.9) | 9 (32.1) |
| Advanced degree | 10 (7.3) | 8 (12.9) | 2 (7.1) |
| Unable to obtain | 13 (9.5) | 6 (9.7) | 3 (10.8) |
| Past history of VTE, n (%) | 12 (8.8) | 9 (14.5) | 2 (7.1) |
| Type of unit, n (%) | |||
| Medical | 59 (43.1) | 24 (38.7) | 17 (60.7) |
| Surgical | 78 (56.9) | 38 (61.3) | 11 (39.3) |
| Documented refusal of ordered prophylaxis, n (%) | 71 (51.8) | 20 (32.3) | 9 (32.1) |
| Length of hospital stay prior to inclusion in study, d, median (IQR) | 4.0 (3.07.0) | 3.0 (3.05.0) | 4.0 (2.05.0) |
| Patients preferring enteral route, n (%) | 137 (60.4) |
| Dislike of needles | 41 (30.0) |
| Pain from injection | 38 (27.7) |
| Ease of use | 18 (13.1) |
| Bruising from injection | 9 (6.6) |
| Other/no rationale | 31 (22.6) |
| Patients preferring injection route, n (%) | 62 (27.5) |
| Faster onset of action | 25 (40.3) |
| Pill burden | 11 (17.7) |
| Ease of use | 9 (14.5) |
| Other/no rationale | 17 (27.5) |
| Patients with no preference, n (%) | 28 (12.4) |
DISCUSSION
Using a mixed‐methods approach, we report the first survey evaluating patient preferences regarding pharmacologic VTE prophylaxis. We found that a majority of patients preferred an oral route of administration. Nevertheless, a substantial number of patients favored a subcutaneous route of administration believing it to be associated with a faster onset of action. Of interest, patients favoring subcutaneous injections were significantly less likely to refuse doses of ordered VTE prophylaxis. Given that all patients were prescribed a subcutaneous form of VTE prophylaxis, matching patient preference to VTE prophylaxis prescription could potentially increase adherence and reduce patient refusal of ordered prophylaxis. Considering the large number of patients who preferred an oral route of administration, the availability of an oral formulation may potentially result in improved adherence to inpatient VTE prophylaxis.
Our findings have significant implications for healthcare providers, and for patient safety and quality‐improvement researchers. VTE prophylaxis is an important patient‐safety practice, particularly for medically ill patients, which is believed to be underprescribed.[7] Recent studies have demonstrated that a significant number of doses of VTE prophylaxis are not administered, primarily due to patient refusal.[6] Our data indicate that tailoring the route of prophylaxis administration to patient preference may represent a feasible strategy to improve VTE prophylaxis administration rates. Recently, several target‐specific oral anticoagulants (TSOACs) have been approved for a variety of clinical indications, and all have been investigated for VTE prophylaxis.[7, 8, 9, 10, 11, 12, 13, 14, 15] However, no agent is currently US Food & Drug Administration (FDA) approved for primary prevention of VTE, although apixaban and rivaroxaban are FDA approved for VTE prevention in joint replacement.[13, 14] Although in some instances these TSOACs were noted to demonstrate only equivalent efficacy to standard subcutaneous forms of VTE prophylaxis, our data suggest that perhaps in some patients, use of these agents may result in better outcomes due to improved adherence to therapy due to a preferred oral route of administration. We think this hypothesis warrants further investigation.
Our study also underscores the importance of considering patient preferences when caring for patients as emphasized by the 2012 ACCP guidelines.[1] Our results indicate that consideration of patient preferences may lead to better patient care and better outcomes. Interestingly, there were no differences in preference based on education level or the type of service to which the patient was admitted. Clarification of uninformed opinions regarding the rationale for preference may also lead to more informed decisions by patients.
This study has a number of limitations. We only included patients on the internal medicine and general surgical services. It is possible that patients on other specialty services may have different opinions regarding prophylaxis that were not captured in our sample. Similarly, our sample size was limited, and approximately 15% of potential subjects did not participate. We do believe that our population is reflective of our institution based upon our previously published evaluation of multiple hospital units and the inclusion of low‐ and high‐performing units on both the medical and surgical services. Nevertheless, we believe that much more investigation of patient perspectives on VTE prophylaxis needs to be done to inform decision making, including the impact of patient preferences on VTE‐related outcomes. Additionally, we did not evaluate potential predictors of preference including admission diagnosis and duration of hospital length of stay.
In conclusion, we conducted a mixed‐methods analysis of patient preferences regarding pharmacologic VTE prophylaxis. Matching patient preference to ordered VTE prophylaxis may increase adherence to ordered prophylaxis. In this era of increasingly patient‐centered healthcare and expanding options for VTE prophylaxis, we believe information on patient preferences will be helpful to tailoring options for prevention and treatment.
ACKNOWLEDGMENTS
Disclosures: Dr. Haut is the primary investigator of the Mentored Clinician Scientist Development Award K08 1K08HS017952‐01 from the Agency for Healthcare Research and Quality entitled Does Screening Variability Make DVT an Unreliable Quality Measure of Trauma Care? Dr. Haut receives royalties from Lippincott, Williams, & Wilkins for a book he coauthored (Avoiding Common ICU Errors). He has received honoraria for various speaking engagements regarding clinical, quality, and safety topics and has given expert witness testimony in various medical malpractice cases. Dr. Streiff has received research funding from Sanofi‐Aventis and Bristol‐Myers Squibb; honoraria for Continuing Medial Education lectures from Sanofi‐Aventis and Ortho‐McNeil; consulted for Sanofi‐Aventis, Eisai, Daiichi‐Sankyo, and Janssen HealthCare; and has given expert witness testimony in various medical malpractice cases. Mr. Lau, Drs. Haut, Streiff, and Shermock are supported by a contract from the Patient‐Centered Outcomes Research Institute titled Preventing Venous Thromboembolism: Empowering Patients and Enabling Patient‐Centered Care via Health Information Technology (CE‐12‐11‐4489). Ms. Hobson has given expert witness testimony in various medical malpractice cases. All others have no relevant funding or conflicts of interest to report.
- , , , et al. Patient values and preferences in decision making for antithrombotic therapy: a systematic review. Chest. 2012;141(2):e1S–e23S.
- , , , et al. Lessons from the Johns Hopkins Multi‐Disciplinary Venous Thromboembolism (VTE) Prevention Collaborative. BMJ. 2012;344:e3935.
- , , , et al. Impact of a venous thromboembolism (VTE) prophylaxis “smart order set”: improved compliance, fewer events. Am J Hematol. 2013;88(7):545–549.
- , , , et al. Improved prophylaxis and decreased preventable harm with a mandatory computerized clinical decision support tool for venous thromboembolism (VTE) prophylaxis in trauma patients. Arch Surg. 2012;147(10):901–907.
- , , , , . Linking processes and outcomes: a key strategy to prevent and report harm from venous thromboembolism in surgical patients. JAMA Surg. 2013;148(3):299–300.
- , , , et al. Patterns of non‐administration of ordered doses of venous thromboembolism prophylaxis: implications for intervention strategies. PLoS One. 2013;8(6):e66311.
- , , , et al. Venous thromboembolism risk and prophylaxis in the acute hospital care setting (ENDORSE study): a multinational cross‐sectional study. Lancet. 2008;371:387–394.
- , , , et al. Rivaroxaban versus enoxaparin for thromboprophylaxis after hip arthroplasty. N Engl J Med. 2008;358:2765–2775.
- , , , et al. Rivaroxaban versus enoxaparin for thromboprophylaxis after total knee arthoplasty. N Engl J Med. 2008;358:2776–2786.
- , , , , , . Apixaban or enoxaparin for thromboprophylaxis after knee replacement. N Engl J Med. 2009;361:594–604.
- , , , , , . Apixaban versus enoxaparin for thromboprophylaxis after knee replacement (ADVANCE‐2): a randomized double‐blind trial. Lancet. 2010;275:807–815.
- , , , et al. Rivaroxaban for the prevention of venous thromboembolism after hip or knee arthroplasty. Pooled analysis of four studies. Thromb Haemost. 2011;105:444–453.
- , , , et al. Apixaban versus enoxaparin for thromboprophylaxis in medically ill patients. N Engl J Med. 2011;365:2167–2177.
- , , , et al. Efficacy and safety of thromboprophylaxis with low‐molecular‐weight heparin or rivaroxaban in hip and knee replacement surgery: findings from the ORTHO‐TEP registry. Thromb Haemost. 2013;109:154–163.
- , , , et al. Rivaroxaban for thromboprophylaxis in acutely ill medical patients. N Engl J Med. 2013;368:513–523.
The 2012 American College of Chest Physicians (ACCP) guidelines on antithrombotic and thrombolytic therapy conducted a systematic review focusing on patient values and preferences regarding antithrombotic therapy, including thromboprophylaxis.[1] They found that patient values and preferences are highly variable and should be considered when developing future clinical practice guidelines. Notably, there were no studies evaluating patient preferences for venous thromboembolism (VTE) prophylaxis, which is prescribed for the vast majority of hospitalized patients.
Historically, interventions to prevent VTE have focused on increasing prescriptions of prophylaxis. At the Johns Hopkins Hospital, we implemented a mandatory clinical decision support tool in our computerized provider order entry system.[2] Following implementation of this tool, prescription of risk‐appropriate VTE prophylaxis dramatically increased for both medical and surgical patients.[3, 4, 5] These efforts were made with the implicit and incorrect assumption that prescribed medication doses will always be administered to patients, when in fact patient refusal is a leading cause of nonadministration. Studies of VTE prophylaxis administration have reported that 10% to 12% of doses are not administered to patients.[6] Alarmingly, it has been reported that among medically ill patients, between 10% and 30% of doses are not administered, with patient refusal as the most frequently documented reason.
The purpose of this study was to assess patient preferences regarding pharmacological VTE prophylaxis.
METHODS
Study Design
A sample of consecutive hospitalized patients on select medicine and surgical floors previously identified as low‐ and high‐performing units at our institution in regard to administration rates of pharmacologic VTE prophylaxis was assembled from a daily electronic report of patients prescribed pharmacological VTE prophylaxis (Allscripts Sunrise, Chicago, IL) from December 2012 to March 2013. These units were identified in a study conducted at our institution as the lowest‐ and highest‐performing units in regard to incidence of administration of ordered pharmacologic VTE prophylaxis. From this data analysis, we chose the 2 lowest‐performing and 2 highest‐performing units on the medical and surgical service. To be eligible for this study, patients had to have an active order for 1 of the following VTE prophylaxis regimens: unfractionated heparin 5000 units or 7500 units administered subcutaneously every 8 or 12 hours, enoxaparin 30 mg administered subcutaneously every 12 hours or 40 mg administered subcutaneously every 24 hours. Participants had to be at least 18 years of age and hospitalized for at least 2 days on their respective units. Patients who were nonEnglish speaking, those previously enrolled in this study, or those unable to provide consent were excluded from the study.
Data Collection
Demographic information was collected, including patient‐reported education level. To determine their preference for VTE prophylaxis, patients were provided a survey, which included being asked, Would you prefer a pill or a shot to prevent blood clots, if they both worked equally well. The survey was created by the study team to collect information from patients regarding their baseline knowledge of VTE and preference regarding pharmacologic prophylaxis. Additional data included the patient's education level to determine potential association with preference. The survey was verbally administered by 1 investigator (A.W.) to all patients. Patients were asked to explain their rationale for their stated preference in regard to VTE prophylaxis. Patient rationale was subsequently coded to allow for uniformity among patient responses based on patterns in responses. Our electronic medication record allows us to identify patients who refused their medication through nursing documentation. Patients with documented refusal of ordered pharmacologic VTE prophylaxis were asked about the rationale for their refusal. This study was approved by the Johns Hopkins Medicine Institutional Review Board.
Statistical Analysis
Quantitative data from the surveys were analyzed using Minitab (Minitab Inc., State College, PA). A [2] test analysis was performed for categorical data, as appropriate. A P value <0.05 was considered to be statistically significant.
RESULTS
Quantitative Results
We interviewed patients regarding their preferred route of administration of VTE prophylaxis. Overall, 339 patients were screened for this study. Sixty patients were not eligible to participate. Forty‐seven were unable to provide consent, and 13 were nonEnglish speaking. Of the 269 remaining eligible patients, 227 (84.4%) consented to participate.
Baseline demographics of the participants are presented in Table 1, categorized on the basis of their preferred route of administration for VTE prophylaxis. A majority of patients indicated a preference for an oral formulation of pharmacologic VTE prophylaxis. There was no association between education level or service type on preference. Preference for an oral formulation was largely influenced by patient‐reported pain and bruising associated with subcutaneous administration (Table 2). A substantial majority of patients reporting a preference for a subcutaneous formulation and emphasized a belief that this route was associated with a faster onset of action. Among patients who preferred an oral formulation (n=137), 71 patients (51.8%) were documented as having refused at least 1 dose of ordered VTE prophylaxis. Patients who preferred a subcutaneous route of VTE prophylaxis were less likely to refuse prophylaxis, with only 22 patients (35.5%) having a documented refusal of at least 1 dose (P<0.0001).
| Enteral, n=137 | Parenteral, n=62 | No Preference, n=28 | |
|---|---|---|---|
| |||
| Age, y, mean ( SD) | 49.5 (14.7) | 51.7 (16.1) | 48.9 (14.6) |
| Male, n (%) | 74 (54.0) | 38 (61.3) | 15 (53.6) |
| Race n (%) | |||
| Caucasian | 81 (59.1) | 31 (50.0) | 14 (50.0) |
| African American | 50 (36.5) | 28 (45.2) | 14 (50.0) |
| Education level, n (%) | |||
| High school or less | 46 (33.6) | 27 (43.5) | 14 (50.0) |
| College | 68 (49.6) | 21 (33.9) | 9 (32.1) |
| Advanced degree | 10 (7.3) | 8 (12.9) | 2 (7.1) |
| Unable to obtain | 13 (9.5) | 6 (9.7) | 3 (10.8) |
| Past history of VTE, n (%) | 12 (8.8) | 9 (14.5) | 2 (7.1) |
| Type of unit, n (%) | |||
| Medical | 59 (43.1) | 24 (38.7) | 17 (60.7) |
| Surgical | 78 (56.9) | 38 (61.3) | 11 (39.3) |
| Documented refusal of ordered prophylaxis, n (%) | 71 (51.8) | 20 (32.3) | 9 (32.1) |
| Length of hospital stay prior to inclusion in study, d, median (IQR) | 4.0 (3.07.0) | 3.0 (3.05.0) | 4.0 (2.05.0) |
| Patients preferring enteral route, n (%) | 137 (60.4) |
| Dislike of needles | 41 (30.0) |
| Pain from injection | 38 (27.7) |
| Ease of use | 18 (13.1) |
| Bruising from injection | 9 (6.6) |
| Other/no rationale | 31 (22.6) |
| Patients preferring injection route, n (%) | 62 (27.5) |
| Faster onset of action | 25 (40.3) |
| Pill burden | 11 (17.7) |
| Ease of use | 9 (14.5) |
| Other/no rationale | 17 (27.5) |
| Patients with no preference, n (%) | 28 (12.4) |
DISCUSSION
Using a mixed‐methods approach, we report the first survey evaluating patient preferences regarding pharmacologic VTE prophylaxis. We found that a majority of patients preferred an oral route of administration. Nevertheless, a substantial number of patients favored a subcutaneous route of administration believing it to be associated with a faster onset of action. Of interest, patients favoring subcutaneous injections were significantly less likely to refuse doses of ordered VTE prophylaxis. Given that all patients were prescribed a subcutaneous form of VTE prophylaxis, matching patient preference to VTE prophylaxis prescription could potentially increase adherence and reduce patient refusal of ordered prophylaxis. Considering the large number of patients who preferred an oral route of administration, the availability of an oral formulation may potentially result in improved adherence to inpatient VTE prophylaxis.
Our findings have significant implications for healthcare providers, and for patient safety and quality‐improvement researchers. VTE prophylaxis is an important patient‐safety practice, particularly for medically ill patients, which is believed to be underprescribed.[7] Recent studies have demonstrated that a significant number of doses of VTE prophylaxis are not administered, primarily due to patient refusal.[6] Our data indicate that tailoring the route of prophylaxis administration to patient preference may represent a feasible strategy to improve VTE prophylaxis administration rates. Recently, several target‐specific oral anticoagulants (TSOACs) have been approved for a variety of clinical indications, and all have been investigated for VTE prophylaxis.[7, 8, 9, 10, 11, 12, 13, 14, 15] However, no agent is currently US Food & Drug Administration (FDA) approved for primary prevention of VTE, although apixaban and rivaroxaban are FDA approved for VTE prevention in joint replacement.[13, 14] Although in some instances these TSOACs were noted to demonstrate only equivalent efficacy to standard subcutaneous forms of VTE prophylaxis, our data suggest that perhaps in some patients, use of these agents may result in better outcomes due to improved adherence to therapy due to a preferred oral route of administration. We think this hypothesis warrants further investigation.
Our study also underscores the importance of considering patient preferences when caring for patients as emphasized by the 2012 ACCP guidelines.[1] Our results indicate that consideration of patient preferences may lead to better patient care and better outcomes. Interestingly, there were no differences in preference based on education level or the type of service to which the patient was admitted. Clarification of uninformed opinions regarding the rationale for preference may also lead to more informed decisions by patients.
This study has a number of limitations. We only included patients on the internal medicine and general surgical services. It is possible that patients on other specialty services may have different opinions regarding prophylaxis that were not captured in our sample. Similarly, our sample size was limited, and approximately 15% of potential subjects did not participate. We do believe that our population is reflective of our institution based upon our previously published evaluation of multiple hospital units and the inclusion of low‐ and high‐performing units on both the medical and surgical services. Nevertheless, we believe that much more investigation of patient perspectives on VTE prophylaxis needs to be done to inform decision making, including the impact of patient preferences on VTE‐related outcomes. Additionally, we did not evaluate potential predictors of preference including admission diagnosis and duration of hospital length of stay.
In conclusion, we conducted a mixed‐methods analysis of patient preferences regarding pharmacologic VTE prophylaxis. Matching patient preference to ordered VTE prophylaxis may increase adherence to ordered prophylaxis. In this era of increasingly patient‐centered healthcare and expanding options for VTE prophylaxis, we believe information on patient preferences will be helpful to tailoring options for prevention and treatment.
ACKNOWLEDGMENTS
Disclosures: Dr. Haut is the primary investigator of the Mentored Clinician Scientist Development Award K08 1K08HS017952‐01 from the Agency for Healthcare Research and Quality entitled Does Screening Variability Make DVT an Unreliable Quality Measure of Trauma Care? Dr. Haut receives royalties from Lippincott, Williams, & Wilkins for a book he coauthored (Avoiding Common ICU Errors). He has received honoraria for various speaking engagements regarding clinical, quality, and safety topics and has given expert witness testimony in various medical malpractice cases. Dr. Streiff has received research funding from Sanofi‐Aventis and Bristol‐Myers Squibb; honoraria for Continuing Medial Education lectures from Sanofi‐Aventis and Ortho‐McNeil; consulted for Sanofi‐Aventis, Eisai, Daiichi‐Sankyo, and Janssen HealthCare; and has given expert witness testimony in various medical malpractice cases. Mr. Lau, Drs. Haut, Streiff, and Shermock are supported by a contract from the Patient‐Centered Outcomes Research Institute titled Preventing Venous Thromboembolism: Empowering Patients and Enabling Patient‐Centered Care via Health Information Technology (CE‐12‐11‐4489). Ms. Hobson has given expert witness testimony in various medical malpractice cases. All others have no relevant funding or conflicts of interest to report.
- , , , et al. Patient values and preferences in decision making for antithrombotic therapy: a systematic review. Chest. 2012;141(2):e1S–e23S.
- , , , et al. Lessons from the Johns Hopkins Multi‐Disciplinary Venous Thromboembolism (VTE) Prevention Collaborative. BMJ. 2012;344:e3935.
- , , , et al. Impact of a venous thromboembolism (VTE) prophylaxis “smart order set”: improved compliance, fewer events. Am J Hematol. 2013;88(7):545–549.
- , , , et al. Improved prophylaxis and decreased preventable harm with a mandatory computerized clinical decision support tool for venous thromboembolism (VTE) prophylaxis in trauma patients. Arch Surg. 2012;147(10):901–907.
- , , , , . Linking processes and outcomes: a key strategy to prevent and report harm from venous thromboembolism in surgical patients. JAMA Surg. 2013;148(3):299–300.
- , , , et al. Patterns of non‐administration of ordered doses of venous thromboembolism prophylaxis: implications for intervention strategies. PLoS One. 2013;8(6):e66311.
- , , , et al. Venous thromboembolism risk and prophylaxis in the acute hospital care setting (ENDORSE study): a multinational cross‐sectional study. Lancet. 2008;371:387–394.
- , , , et al. Rivaroxaban versus enoxaparin for thromboprophylaxis after hip arthroplasty. N Engl J Med. 2008;358:2765–2775.
- , , , et al. Rivaroxaban versus enoxaparin for thromboprophylaxis after total knee arthoplasty. N Engl J Med. 2008;358:2776–2786.
- , , , , , . Apixaban or enoxaparin for thromboprophylaxis after knee replacement. N Engl J Med. 2009;361:594–604.
- , , , , , . Apixaban versus enoxaparin for thromboprophylaxis after knee replacement (ADVANCE‐2): a randomized double‐blind trial. Lancet. 2010;275:807–815.
- , , , et al. Rivaroxaban for the prevention of venous thromboembolism after hip or knee arthroplasty. Pooled analysis of four studies. Thromb Haemost. 2011;105:444–453.
- , , , et al. Apixaban versus enoxaparin for thromboprophylaxis in medically ill patients. N Engl J Med. 2011;365:2167–2177.
- , , , et al. Efficacy and safety of thromboprophylaxis with low‐molecular‐weight heparin or rivaroxaban in hip and knee replacement surgery: findings from the ORTHO‐TEP registry. Thromb Haemost. 2013;109:154–163.
- , , , et al. Rivaroxaban for thromboprophylaxis in acutely ill medical patients. N Engl J Med. 2013;368:513–523.
Thromboprophylaxis in Patients with HIV
Patients with human immunodeficiency virus (HIV) are at a 2‐ to 10‐fold greater risk for venous thromboembolism (VTE) compared with the general population.[1] Although antiphospholipid antibodies and protein S deficiency have often been cited as reasons for the thrombophilia associated with HIV, previous studies have also documented an increased risk of VTE with declining CD4+ cell count.[2, 3, 4, 5, 6, 7, 8] Worsening immune function places HIV patients at increased risk for opportunistic and nonopportunistic infections and malignancies, all independently associated with an increased risk of VTE.[5, 9, 10, 11, 12] Although increasing use of antiretroviral therapy has greatly decreased these sequelae, these complications of HIV infection are associated with an increased frequency of hospitalization.[13, 14, 15, 16] HIV infection and associated inflammation has been implicated in cardiovascular conditions such as cardiomyopathy, pulmonary hypertension, and myocardial infarction.[17, 18] Additionally, progression of HIV infection appears to influence T‐cell activation and differentiation in a manner that leads to early immunosenescence in infected individuals.[19, 20]
VTE prophylaxis is effective.[21] Virtually all efforts to decrease VTE have been focused on improving the prescription of prophylaxis with varying degrees of success.[22] These interventions have been employed with the tacit assumption that medication prescribed for inpatients will always be administered. However, at our institution, recent research has demonstrated that a significant proportion of prescribed thromboprophylaxis doses are not administered to hospitalized patients.[23] Refusal by the patient or a family member was the most commonly documented reason for dose nonadministration. In addition, the rate of thromboprophylaxis nonadministration varied greatly between nursing units with distinct patient populations. We hypothesized that nonadministration of VTE prophylaxis may be more common in patients with HIV, and this phenomenon may contribute to their increased risk for VTE.
The purpose of this study was to determine if the proportion of nonadministered thromboprophylaxis is greater among hospitalized patients with HIV and to characterize documented reasons for dose nonadministration.
METHODS
This study was conducted at The Johns Hopkins Hospital (JHH), a large, urban, academic medical center in Baltimore, Maryland. This single‐center retrospective cohort study utilized an existing dataset containing dose administration data extracted from an electronic medication administration record (eMAR). This dataset included information for all prescribed doses of thromboprophylaxis (heparin 5000 U subcutaneously every 8 or 12 hours, heparin 7500 U subcutaneously every 12 hours, enoxaparin 30 mg subcutaneously every 12 hours, or enoxaparin 40 mg subcutaneously daily) for patients hospitalized on medicine units at JHH from November 2007 to December 2008. This time period follows the implementation of an electronic order set for VTE prophylaxis.[24, 25] Data available for each dose included drug name, dose, frequency, patient demographics, and whether or not the dose was administered. Each dose not administered included a reason for nonadministration, which was chosen from a dropdown menu of responses on the eMAR by the nurse at the time the dose was due. A separate electronic report was obtained from an internal administrative database, which identified all patients within the dose administration dataset who had the International Classification of Diseases, 9th Revision code 042 (HIV diagnosis). A report identifying patient history numbers with matching diagnostic code for HIV was appended to the dose administration dataset using a relational database (Microsoft Access; Microsoft Corp., Redmond, WA) prior to analysis. The dose administration data were obtained previously for a separate analysis.[23] Approval for this study was granted from the institutional review board of Johns Hopkins Medicine.
Our analytic plan included comparisons between patients with and without HIV on a dose, patient, and unit level. As JHH operates a nursing unit dedicated to the inpatient care of patients with HIV, we included analyses of dose characteristics between this unit and other medicine units. It should be noted that patients without a diagnosis of HIV are sometimes cared for on this unit. Therefore, the electronic medical record for each patient without the diagnosis code for HIV hospitalized on this unit was reviewed to determine HIV status. An analysis was performed comparing visit identification numbers with diagnosis codes to identify potential seroconversions during the study period. Although we planned to compare nonadministration and documented refusal of doses on the unit level, a lack of patients with HIV on a number of units limited our ability to perform these analyses.
Statistical Analysis
The percent of doses not administered was calculated as the number of doses not administered divided by the number of doses prescribed. Likewise, the percent of prescribed doses documented as refused was calculated as the number of prescribed doses documented as refused divided by the number of doses prescribed. For each comparison, an odds ratio (OR) with 95% confidence interval (CI) was reported. Univariate and multivariate regression analyses were performed to assess the relationship between patient factors and dose nonadministration and documented refusal, respectively. Generalized estimating equations (GEE) using a logit link and an exchangeable correlation structure were used in these analyses. The GEE technique was used to account for within‐individual correlation of administration and documented refusal status.
Categorical data were compared using the two‐sided [2] test. Parametric and nonparametric continuous data were compared using the Student t test and Mann‐Whitney U test, respectively. A P value of <0.05 was considered statistically significant for all analyses. Analyses were performed using Minitab 15 (Minitab Inc., State College, PA) and Stata (StataCorp, College Station, TX).
RESULTS
During the 8‐month study period, 42,870 doses of thromboprophylaxis were prescribed during 4947 patient admissions to 13 individual medicine units. Overall, the diagnosis code for HIV was present in 12% of patient visits. The proportion of nonadministered doses per unit ranged from 6% to 27%, whereas the number of doses prescribed per unit ranged from 34 to 7301.
Patient characteristics were described on the visit level (Table 1). Patients with HIV were significantly younger, more often male and black, and had a longer length of stay compared with patients without HIV. Patients hospitalized on the HIV care unit had similar characteristics to the overall population of patients with HIV. It should be noted that not all patients cared for on this unit had a diagnosis of HIV, as patients from other medicine services are sometimes cared for in this location.
| Patients Without HIV | Patients With HIV | P | |
|---|---|---|---|
| |||
| Visits, n | 4,364 | 583 | N/A |
| Male, n (%) | 2,039 (47) | 370 (64) | <0.001 |
| Mean ageSD, y | 5618 | 469 | <0.001 |
| Race, n (%) | |||
| African American | 2,603 (60) | 522 (90) | <0.001 |
| Caucasian | 1,610 (37) | 53 (9) | <0.001 |
| Asian, Pacific Islander, other | 151 (4) | 8 (1) | 0.006 |
| Median length of stay (IQR), d | 3 (15) | 4 (27) | 0.002 |
| Marital status, n (%) | |||
| Single | 2,051 (47) | 471 (81) | <0.001 |
| Married | 1,405 (32) | 71 (12) | <0.001 |
| Widowed | 486 (11) | 10 (1) | <0.001 |
| Divorced | 402 (9) | 28 (5) | <0.001 |
| Separated | 33 (1) | 3 (1) | 0.607 |
| Unknown | 5 (0) | 0 (0) | 0.465 |
| Payor, n (%) | |||
| Medicare | 1,771 (41) | 133 (23) | <0.001 |
| Medicaid | 1,343 (31) | 392 (67) | <0.001 |
| Commercial | 1,181 (27) | 43 (7) | <0.001 |
| Other including self‐pay | 69 (1) | 15 (3) | 0.087 |
Overall, 17% of prescribed prophylaxis doses were not administered. A greater proportion of prescribed doses were not administered to patients with HIV compared with patients without HIV (23.5% vs 16.1%, OR: 1.59, 95% CI: 1.49‐1.70, P<0.001) (Table 2). Using a GEE and univariate regression, HIV diagnosis was associated with nonadministration of doses (OR: 1.37, 95% CI: 1.17‐1.60, P<0.001) (Table 3). Race, age, length of stay, and drug (heparin vs enoxaparin) were each associated with nonadministration. There was no significant association between nonadministration and sex, marital status, or payor. When stratified by nursing unit, there was substantial variation in the proportion of nonadministered doses between units. Within each unit, the proportion of doses not administered varied when stratified by HIV status. For example, on unit A, the proportion of doses not administered was greater for patients with HIV compared with patients without HIV (33.3% vs 12.9%, OR: 3.38, 95% CI: 2.61 to 4.37, P<0.001) (Figure 1). However, on unit K, the proportion of doses not administered to patients with HIV was 2‐fold less than in patients without HIV (7.2% vs 14.3%, OR: 0.47, 95% CI: 0.30‐0.74, P<0.001). Unit‐level analysis was not possible in regression models due to drastic imbalance in the prevalence of HIV across units. When comparing doses prescribed in the HIV care unit to all other medicine units, the proportion not administered (23.9% vs 16.3%, OR: 1.61, 95% CI: 1.49‐1.73, P<0.001) closely resembled the values seen when comparing patients with and without HIV hospital wide (23.5% vs 16.1%). However, when doses on the HIV care unit were stratified by HIV status, the doses not administered were 2‐fold greater, as a proportion, for patients with HIV compared with those without HIV (26.4% vs 13.1%, OR: 2.39, 95% CI: 1.93‐2.96, P<0.001).
| Doses Prescribed | Doses Not Administered (% of Doses Prescribed) | Doses Documented as Refused (% of All Doses Prescribed) | |
|---|---|---|---|
| |||
| All patients with HIV | 5,681 | 1,334 (23.5%)a | 935 (16.5%)a |
| All patients without HIV | 37,189 | 6,005 (16.1%) | 3,935 (10.6%) |
| HIV care unit | 4,452 | 1,063 (23.9%)a | 709 (15.9%)a |
| All other units | 38,418 | 6,276 (16.3%) | 4,161 (10.8%) |
| HIV care unit: patients with HIV | 3,602 | 952 (26.4%)a | 651 (18.1%)a |
| HIV care unit: patients without HIV | 850 | 111 (13.1%) | 58 (6.8%) |
| All other units: patients with HIV | 2,079 | 382 (18.4%)b | 284 (13.7%)a |
| All other units: patients without HIV | 36,339 | 5,894 (16.2%) | 3,877 (10.7%) |
| Nonadministered, n (%) | P | Documented as Refused, n (%) | P | |
|---|---|---|---|---|
| ||||
| Race | 0.001 | 0.072 | ||
| African American | 2,601 (17.8) | 1,708 (11.7) | ||
| Caucasian | 4,379 (16.4) | 2,922 (10.9) | ||
| Asian, Pacific Islander, other | 359 (23.4) | 240 (15.6) | ||
| HIV status | <0.001 | 0.002 | ||
| Negative | 6,005 (16.2) | 3,935 (10.6) | ||
| Positive | 1,344 (23.5) | 935 (16.5) | ||
| Age, y | <0.001 | <0.001 | ||
| 19 | 59 (20.6) | 44 (15.3) | ||
| 2029 | 1,260 (33.8) | 1,000 (26.8) | ||
| 3039 | 1,088 (28.1) | 845 (21.8) | ||
| 4049 | 1,628 (21.0) | 1,104 (14.2) | ||
| 5059 | 1,493 (16.1) | 953 (10.3) | ||
| 6069 | 900 (12.6) | 515 (7.2) | ||
| 7079 | 571 (9.6) | 250 (4.2) | ||
| 8089 | 252 (6.2) | 95 (2.3) | ||
| 90 | 88 (11.5) | 84 (8.4) | ||
| Sex | 0.372 | 0.919 | ||
| Male | 3,689 (17.3) | 2,392 (11.2) | ||
| Female | 3,650 (17.0) | 2,478 (11.5) | ||
| Drug | <0.001 | <0.001 | ||
| Heparin | 6,833 (18.4) | 4,515 (12.2) | ||
| Enoxaparin | 506 (8.9) | 355 (6.2) | ||
| Length of stay, d | <0.001 | <0.001 | ||
| 01 | 446 (24.3) | 282 (15.4) | ||
| 23 | 1,463 (19.4) | 971 (12.9) | ||
| 47 | 2,332 (18.9) | 1,620 (13.1) | ||
| 8 | 3,098 (14.6) | 1,997 (9.4) | ||
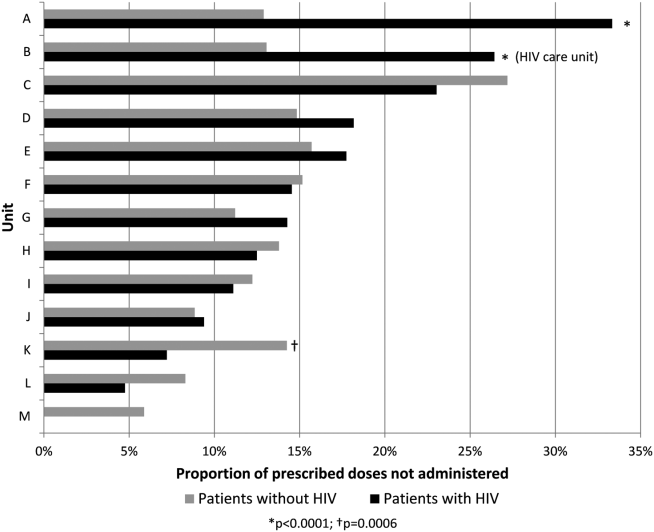
The results of the multivariate regression analyses with GEE are displayed in Table 4. HIV diagnosis, non‐African American race, and heparin (as compared with enoxaparin) were associated with increased likelihood of nonadministration. Increasing age and increasing length of stay were associated with decreased likelihood of nonadministration by a small but significant amount.
| OR of Nonadministration | 95% CI, P | OR of Documented Refusal | 95% CI, P | |
|---|---|---|---|---|
| ||||
| Race | ||||
| African American | 1.00 | Reference | 1.00 | Reference |
| Caucasian | 1.62 | 1.44‐1.81, <0.001 | 1.53 | 1.32‐1.77, <0.001 |
| Asian, Pacific Islander, Other | 1.54 | 1.19‐2.00, 0.001 | 1.48 | 1.07‐2.01, 0.019 |
| HIV status | ||||
| Negative | 1.00 | Reference | 1.00 | Reference |
| Positive | 1.21 | 1.001.45, 0.039 | 1.29 | 1.06‐1.56, 0.012 |
| Age, per year | 0.97 | 0.97‐0.98, <0.001 | 0.97 | 0.96‐0.97, <0.001 |
| Drug | ||||
| Heparin | 1.00 | Reference | 1.00 | Reference |
| Enoxaparin | 0.45 | 0.40‐0.51, <0.001 | 0.53 | 0.47‐0.61, <0.001 |
| Length of stay, per day | 0.991 | 0.987‐0.995, <0.001 | 0.989 | 0.983‐0.993, <0.001 |
The most commonly documented reason for nonadministration was refusal by the patient or family member (66% of all doses not administered). The second most common reason, patient condition not appropriate, accounted for an additional 10% of doses. Across all nursing units, the proportion of prescribed doses that were documented as refused was significantly greater for patients with HIV compared with patients without HIV (16.5% vs 10.6%, OR: 1.66, 95% CI: 1.54‐1.80, P<0.0001) (Table 2). Using the GEE and multivariate regression, HIV diagnosis, non‐African American race, and heparin were associated with increased risk of documented dose refusal. Age and length of stay were inversely related to the likelihood of documented dose refusal. When all administered doses were excluded from the analysis, the association between these variables and documented dose refusal were not as strong. Age and length of stay remained significantly inversely related; however, the other factors were no longer significantly positively associated with documented dose refusal.
Within the HIV care unit, the proportion of prescribed doses documented as refused was greater for patients with HIV compared with patients without HIV (18.1% vs 6.8%, OR: 3.01, 95% CI: 2.28‐3.99, P<0.0001). For all other medicine units, the proportion of nonadministered doses documented as refused was also greater for patients with HIV compared with patients without HIV (13.7% vs 10.7%, OR: 1.32, 95% CI: 1.16‐1.51, P<0.0001).
DISCUSSION
We have identified that nonadministration of thromboprophylaxis was more common among patients with HIV at our institution. Substantial variation in the proportion of doses not administered existed on the nursing unit level, as well as within each unit when stratified by HIV status. This disparity in dose administration was observed on the HIV care unit as well, as the proportion not administered was about 2‐fold greater for patients with HIV compared with those without HIV. Documented dose refusal appeared to account for the majority of nonadministered doses in our cohort. Our analysis also demonstrated that HIV diagnosis is significantly associated with both dose nonadministration and documented dose refusal at our institution.
Medication refusal is a well‐recognized phenomenon among hospitalized patients. A recent study of medication administration in hospitalized patients in the United Kingdom noted that refusal accounted for about 45% of omitted doses.[26] Fanikos et al. also found that documented refusal of doses contributed significantly to the overall number of VTE prophylaxis doses not administered to patients.[27] In our study, the proportion of nonadministered doses documented as refused by the patient or family member was significantly greater in patients with HIV than in patients without HIV across all units. Interestingly, the difference was greater on the HIV care unit when doses were stratified by HIV status. This observation leads us to hypothesize that specific hospital care environments may influence dose nonadministration and refusal rates among our patient population.
Based on regression analyses, increasing age and length of stay were associated with a decreased likelihood of any particular dose not being administered and with any particular dose being documented as refused. It is important to note that our GEE did not take into account date or time of each dose, and therefore we cannot make conclusions as to the likelihood of dose nonadministration or refusal of doses in relation to each other on a time scale. One cannot assume that a dose due later in a hospital course was more or less likely to be given than a dose due on the first hospital day. Although we did not expect these findings, one can hypothesize that patients who are older or have longer stays may be perceived to have more severe illness, and therefore greater need for prophylaxis, from nursing staff and others involved in their care. The associations were small but significant and warrant future investigation.
To our knowledge, this is the first investigation comparing the proportion of nonadministered doses of thromboprophylaxis between patients with and without HIV. Our data show that nonadministered doses and refused doses of thromboprophylaxis are more frequent among patients with HIV. In addition, we noted that nonadministration was more common on the dedicated HIV care unit compared with other units. We cannot currently offer a clear explanation for the disparity observed between units, and more specifically, within the HIV care unit. However, it is possible that a unique culture of care and provider‐specific factors may contribute.
Our study was limited by a number of factors. Seroconversion among patients during the study period was possible; however, our analysis revealed only 2 instances among nearly 4000 unique patients. A more significant limitation was the level of analysis allowed by the dataset. We examined dose characteristics on a dose and unit level, but the ability to analyze doses based on the prescriber and nurse level may have provided valuable insight into the specific reasons behind the observations presented here. Additionally, the specific unit assigned to a given dose in our dataset represented the discharge location for the corresponding patient, making it possible that some amount of nonadministered doses may be attributed to the incorrect unit. However, we do not believe that unit‐to‐unit transfers would be frequent enough to influence the overall results. In addition, we did not link nonadministration of thromboprophylaxis with VTE events, as these data were not present in the current dataset. Although this is a limitation of the current study, we believe that the notion that missed doses of thromboprophylaxis place patients at higher risk for VTE is plausible, as the efficacy of thromboprophylaxis is well established.[28, 29, 30] It is important to note that the reason for nonadministration selected by the nurse on the eMAR may not always represent the only reason or even the true reason for dose nonadministration. It is possible that dose refusal may be over‐represented in our sample, in part due to inaccurate documentation. Recent investigations at JHH have identified varying attitudes on the part of the patient and the nurse regarding thromboprophylaxis. A questionnaire and interview of patients showed a large knowledge gap regarding thromboprophylaxis, with many individuals unable to explain its role or significance in their medical care.[31] A common theme was also observed in a survey of nurses regarding VTE prophylaxis: doses were sometimes considered optional for reasons such as ambulation status, perceived severity of illness, or reason for hospitalization. Some nurses also reported that after an initial refused dose, they may continue to document subsequent doses as refused, sometimes without offering the dose to the patient.[32] As variation in practice was observed between individual nurses, it is also likely that the culture of care may vary between units, influencing thromboprophylaxis nonadministration rates as well as documentation of doses as refused. The dose‐level data used for the GEE analyses did not include date and time of administration, which limited the ability of the GEE to more completely account for autocorrelation.
To further investigate the findings of this and related studies, we intend to more closely analyze data at multiple levels with the goal of identifying an appropriate and feasible target for intervention. Additionally, further investigation should be performed with the goal of determining the relationship between decreased exposure to thromboprophylaxis and VTE. However, as patients with HIV appear to be at increased risk of VTE, ensuring that thromboprophylaxis is delivered appropriately and consistently should be an important goal for all who provide care to this population.
- , , , , . Venous thromboembolism in patients with HIV/AIDS: a case‐control study. J Acquir Immune Defic Syndr. 2008;48(3):310–314.
- , , . AIDS and thrombosis: retrospective study of 131 HIV‐infected patients. AIDS Patient Care STDS. 2001;15(6):311–320.
- , , , et al. HIV and risk of venous thromboembolism: a Danish nationwide population‐based cohort study. HIV Med. 2011;12(4):202–210.
- , , , . Epidemiology of thrombosis in HIV‐infected individuals. The adult/adolescent spectrum of HIV disease project. AIDS. 2000;14(3):321–324.
- , , . Thrombotic complications in patients infected with HIV in the era of highly active antiretroviral therapy: a case series. Clin Infect Dis. 2004;39(8):1214–1222.
- , , . Circulating coagulation inhibitors in the acquired immunodeficiency syndrome. Ann Intern Med. 1986;104(2):175–180.
- , . The pathogenesis of the antiphospholipid syndrome. N Engl J Med. 2013;368(11):1033–1044.
- , , , . Acquired protein C and protein S deficiency in HIV‐infected patients. Clin Appl Thromb Hemost. 2003;9(4):325–331.
- , , , et al. Antiphospholipid syndrome associated with cytomegalovirus infection: case report and review. Clin Infect Dis. 1997;24(2):197–200.
- , . Viral infections and antiphospholipid antibodies. Semin Arthritis Rheum. 2002;31(4):256–263.
- , . AIDS‐defining and non‐AIDS‐defining malignancies: cancer occurrence in the antiretroviral therapy era. Curr Opin Oncol. 2007;19(5):446–451.
- , , , , . Pathogenesis, clinical and laboratory aspects of thrombosis in cancer. J Thromb Thrombolysis. 2007;24(1):29–38.
- , , , et al. Patterns of diagnoses in hospital admissions in a multistate cohort of HIV‐positive adults in 2001. Med Care. 2005;43(9 suppl):III3–III14.
- , , , et al. Opportunistic infections as causes of death in HIV‐infected patients in the HAART era in France. Scand J Infect Dis. 2005;37(6‐7):482–487.
- , , , et al. Rates of hospitalizations and associated diagnoses in a large multisite cohort of HIV patients in the United States, 1994–2005. AIDS. 2008;22(11):1345–1354.
- , , . Hospitalizations for metabolic conditions, opportunistic infections, and injection drug use among HIV patients: trends between 1996 and 2000 in 12 states. J Acquir Immune Defic Syndr. 2005;40(5):609–616.
- , , , , , . Cardiovascular disease in HIV infection. Am Heart J. 2006;151:1147–1155.
- , , , et al. Epidemiological evidence for cardiovascular disease in HIV‐infected patients and relationship to highly active antiretroviral therapy. Circulation. 2008;118(2):e29–e35.
- , , , et al. Immune activation and CD8+ T‐cell differentiation towards senescence in HIV‐1 infection. PLoS Biol. 2004;2(2):E20.
- , , , , . CD4 T cell depletion is linked directly to immune activation in the pathogenesis of HIV‐1 and HIV‐2 but only indirectly to the viral load. J Immunol. 2002;169(6):3400–3406.
- , . Thromboprophylaxis in nonsurgical patients. Hematology Am Soc Hematol Educ Program. 2012;2012:631–637.
- , . Practices to prevent venous thromboembolism [published online ahead of print May 24, 2013]. BMJ Qual Saf. doi:10.1136/bmjqs‐2012‐001782.
- , , , et al. Patterns of non‐administration of ordered doses of venous thromboembolism prophylaxis: implications for novel intervention strategies. PLoS One. 2013;8(6):e66311.
- , , , et al. Lessons from The Johns Hopkins multi‐disciplinary venous thromboembolism (VTE) prevention collaborative. BMJ. 2012;344:e3935.
- , , , et al. Impact of a venous thromboembolism prophylaxis “smart order set”: improved compliance, fewer events [published online ahead of print April 4, 2013]. Am J Hematol. doi: 10.1002/ajh.23450.
- , , . Dose omissions in hospitalized patients in a UK hospital: an analysis of the relative contribution of adverse drug reactions. Drug Saf. 2012;35(8):677–683.
- , , , et al. Adherence to pharmacological thromboprophylaxis orders in hospitalized patients. Am J Med. 2010;123(6):536–541.
- , , , et al. A comparison of enoxaparin with placebo for the prevention of venous thromboembolism in acutely ill medical patients. Prophylaxis in medical patients with enoxaparin study group. N Engl J Med. 1999;341(11):793–800.
- , , , et al. Randomized, placebo‐controlled trial of dalteparin for the prevention of venous thromboembolism in acutely ill medical patients. Circulation. 2004;110(7):874–879.
- , , , et al. Efficacy and safety of fondaparinux for the prevention of venous thromboembolism in older acute medical patients: randomised placebo controlled trial. BMJ. 2006;332(7537):325–329.
- , , , et al. Patient perspectives on pharmacological venous thromboembolism prophylaxis at The Johns Hopkins Hospital. J Thromb Thrombolysis. 2013;35(3):416.
- , , , et al. Culture of care and documented patient refusal of pharmacologic venous thromboembolism prophylaxis. J Thromb Thrombolysis. 2011;31(3):367–400.
Patients with human immunodeficiency virus (HIV) are at a 2‐ to 10‐fold greater risk for venous thromboembolism (VTE) compared with the general population.[1] Although antiphospholipid antibodies and protein S deficiency have often been cited as reasons for the thrombophilia associated with HIV, previous studies have also documented an increased risk of VTE with declining CD4+ cell count.[2, 3, 4, 5, 6, 7, 8] Worsening immune function places HIV patients at increased risk for opportunistic and nonopportunistic infections and malignancies, all independently associated with an increased risk of VTE.[5, 9, 10, 11, 12] Although increasing use of antiretroviral therapy has greatly decreased these sequelae, these complications of HIV infection are associated with an increased frequency of hospitalization.[13, 14, 15, 16] HIV infection and associated inflammation has been implicated in cardiovascular conditions such as cardiomyopathy, pulmonary hypertension, and myocardial infarction.[17, 18] Additionally, progression of HIV infection appears to influence T‐cell activation and differentiation in a manner that leads to early immunosenescence in infected individuals.[19, 20]
VTE prophylaxis is effective.[21] Virtually all efforts to decrease VTE have been focused on improving the prescription of prophylaxis with varying degrees of success.[22] These interventions have been employed with the tacit assumption that medication prescribed for inpatients will always be administered. However, at our institution, recent research has demonstrated that a significant proportion of prescribed thromboprophylaxis doses are not administered to hospitalized patients.[23] Refusal by the patient or a family member was the most commonly documented reason for dose nonadministration. In addition, the rate of thromboprophylaxis nonadministration varied greatly between nursing units with distinct patient populations. We hypothesized that nonadministration of VTE prophylaxis may be more common in patients with HIV, and this phenomenon may contribute to their increased risk for VTE.
The purpose of this study was to determine if the proportion of nonadministered thromboprophylaxis is greater among hospitalized patients with HIV and to characterize documented reasons for dose nonadministration.
METHODS
This study was conducted at The Johns Hopkins Hospital (JHH), a large, urban, academic medical center in Baltimore, Maryland. This single‐center retrospective cohort study utilized an existing dataset containing dose administration data extracted from an electronic medication administration record (eMAR). This dataset included information for all prescribed doses of thromboprophylaxis (heparin 5000 U subcutaneously every 8 or 12 hours, heparin 7500 U subcutaneously every 12 hours, enoxaparin 30 mg subcutaneously every 12 hours, or enoxaparin 40 mg subcutaneously daily) for patients hospitalized on medicine units at JHH from November 2007 to December 2008. This time period follows the implementation of an electronic order set for VTE prophylaxis.[24, 25] Data available for each dose included drug name, dose, frequency, patient demographics, and whether or not the dose was administered. Each dose not administered included a reason for nonadministration, which was chosen from a dropdown menu of responses on the eMAR by the nurse at the time the dose was due. A separate electronic report was obtained from an internal administrative database, which identified all patients within the dose administration dataset who had the International Classification of Diseases, 9th Revision code 042 (HIV diagnosis). A report identifying patient history numbers with matching diagnostic code for HIV was appended to the dose administration dataset using a relational database (Microsoft Access; Microsoft Corp., Redmond, WA) prior to analysis. The dose administration data were obtained previously for a separate analysis.[23] Approval for this study was granted from the institutional review board of Johns Hopkins Medicine.
Our analytic plan included comparisons between patients with and without HIV on a dose, patient, and unit level. As JHH operates a nursing unit dedicated to the inpatient care of patients with HIV, we included analyses of dose characteristics between this unit and other medicine units. It should be noted that patients without a diagnosis of HIV are sometimes cared for on this unit. Therefore, the electronic medical record for each patient without the diagnosis code for HIV hospitalized on this unit was reviewed to determine HIV status. An analysis was performed comparing visit identification numbers with diagnosis codes to identify potential seroconversions during the study period. Although we planned to compare nonadministration and documented refusal of doses on the unit level, a lack of patients with HIV on a number of units limited our ability to perform these analyses.
Statistical Analysis
The percent of doses not administered was calculated as the number of doses not administered divided by the number of doses prescribed. Likewise, the percent of prescribed doses documented as refused was calculated as the number of prescribed doses documented as refused divided by the number of doses prescribed. For each comparison, an odds ratio (OR) with 95% confidence interval (CI) was reported. Univariate and multivariate regression analyses were performed to assess the relationship between patient factors and dose nonadministration and documented refusal, respectively. Generalized estimating equations (GEE) using a logit link and an exchangeable correlation structure were used in these analyses. The GEE technique was used to account for within‐individual correlation of administration and documented refusal status.
Categorical data were compared using the two‐sided [2] test. Parametric and nonparametric continuous data were compared using the Student t test and Mann‐Whitney U test, respectively. A P value of <0.05 was considered statistically significant for all analyses. Analyses were performed using Minitab 15 (Minitab Inc., State College, PA) and Stata (StataCorp, College Station, TX).
RESULTS
During the 8‐month study period, 42,870 doses of thromboprophylaxis were prescribed during 4947 patient admissions to 13 individual medicine units. Overall, the diagnosis code for HIV was present in 12% of patient visits. The proportion of nonadministered doses per unit ranged from 6% to 27%, whereas the number of doses prescribed per unit ranged from 34 to 7301.
Patient characteristics were described on the visit level (Table 1). Patients with HIV were significantly younger, more often male and black, and had a longer length of stay compared with patients without HIV. Patients hospitalized on the HIV care unit had similar characteristics to the overall population of patients with HIV. It should be noted that not all patients cared for on this unit had a diagnosis of HIV, as patients from other medicine services are sometimes cared for in this location.
| Patients Without HIV | Patients With HIV | P | |
|---|---|---|---|
| |||
| Visits, n | 4,364 | 583 | N/A |
| Male, n (%) | 2,039 (47) | 370 (64) | <0.001 |
| Mean ageSD, y | 5618 | 469 | <0.001 |
| Race, n (%) | |||
| African American | 2,603 (60) | 522 (90) | <0.001 |
| Caucasian | 1,610 (37) | 53 (9) | <0.001 |
| Asian, Pacific Islander, other | 151 (4) | 8 (1) | 0.006 |
| Median length of stay (IQR), d | 3 (15) | 4 (27) | 0.002 |
| Marital status, n (%) | |||
| Single | 2,051 (47) | 471 (81) | <0.001 |
| Married | 1,405 (32) | 71 (12) | <0.001 |
| Widowed | 486 (11) | 10 (1) | <0.001 |
| Divorced | 402 (9) | 28 (5) | <0.001 |
| Separated | 33 (1) | 3 (1) | 0.607 |
| Unknown | 5 (0) | 0 (0) | 0.465 |
| Payor, n (%) | |||
| Medicare | 1,771 (41) | 133 (23) | <0.001 |
| Medicaid | 1,343 (31) | 392 (67) | <0.001 |
| Commercial | 1,181 (27) | 43 (7) | <0.001 |
| Other including self‐pay | 69 (1) | 15 (3) | 0.087 |
Overall, 17% of prescribed prophylaxis doses were not administered. A greater proportion of prescribed doses were not administered to patients with HIV compared with patients without HIV (23.5% vs 16.1%, OR: 1.59, 95% CI: 1.49‐1.70, P<0.001) (Table 2). Using a GEE and univariate regression, HIV diagnosis was associated with nonadministration of doses (OR: 1.37, 95% CI: 1.17‐1.60, P<0.001) (Table 3). Race, age, length of stay, and drug (heparin vs enoxaparin) were each associated with nonadministration. There was no significant association between nonadministration and sex, marital status, or payor. When stratified by nursing unit, there was substantial variation in the proportion of nonadministered doses between units. Within each unit, the proportion of doses not administered varied when stratified by HIV status. For example, on unit A, the proportion of doses not administered was greater for patients with HIV compared with patients without HIV (33.3% vs 12.9%, OR: 3.38, 95% CI: 2.61 to 4.37, P<0.001) (Figure 1). However, on unit K, the proportion of doses not administered to patients with HIV was 2‐fold less than in patients without HIV (7.2% vs 14.3%, OR: 0.47, 95% CI: 0.30‐0.74, P<0.001). Unit‐level analysis was not possible in regression models due to drastic imbalance in the prevalence of HIV across units. When comparing doses prescribed in the HIV care unit to all other medicine units, the proportion not administered (23.9% vs 16.3%, OR: 1.61, 95% CI: 1.49‐1.73, P<0.001) closely resembled the values seen when comparing patients with and without HIV hospital wide (23.5% vs 16.1%). However, when doses on the HIV care unit were stratified by HIV status, the doses not administered were 2‐fold greater, as a proportion, for patients with HIV compared with those without HIV (26.4% vs 13.1%, OR: 2.39, 95% CI: 1.93‐2.96, P<0.001).
| Doses Prescribed | Doses Not Administered (% of Doses Prescribed) | Doses Documented as Refused (% of All Doses Prescribed) | |
|---|---|---|---|
| |||
| All patients with HIV | 5,681 | 1,334 (23.5%)a | 935 (16.5%)a |
| All patients without HIV | 37,189 | 6,005 (16.1%) | 3,935 (10.6%) |
| HIV care unit | 4,452 | 1,063 (23.9%)a | 709 (15.9%)a |
| All other units | 38,418 | 6,276 (16.3%) | 4,161 (10.8%) |
| HIV care unit: patients with HIV | 3,602 | 952 (26.4%)a | 651 (18.1%)a |
| HIV care unit: patients without HIV | 850 | 111 (13.1%) | 58 (6.8%) |
| All other units: patients with HIV | 2,079 | 382 (18.4%)b | 284 (13.7%)a |
| All other units: patients without HIV | 36,339 | 5,894 (16.2%) | 3,877 (10.7%) |
| Nonadministered, n (%) | P | Documented as Refused, n (%) | P | |
|---|---|---|---|---|
| ||||
| Race | 0.001 | 0.072 | ||
| African American | 2,601 (17.8) | 1,708 (11.7) | ||
| Caucasian | 4,379 (16.4) | 2,922 (10.9) | ||
| Asian, Pacific Islander, other | 359 (23.4) | 240 (15.6) | ||
| HIV status | <0.001 | 0.002 | ||
| Negative | 6,005 (16.2) | 3,935 (10.6) | ||
| Positive | 1,344 (23.5) | 935 (16.5) | ||
| Age, y | <0.001 | <0.001 | ||
| 19 | 59 (20.6) | 44 (15.3) | ||
| 2029 | 1,260 (33.8) | 1,000 (26.8) | ||
| 3039 | 1,088 (28.1) | 845 (21.8) | ||
| 4049 | 1,628 (21.0) | 1,104 (14.2) | ||
| 5059 | 1,493 (16.1) | 953 (10.3) | ||
| 6069 | 900 (12.6) | 515 (7.2) | ||
| 7079 | 571 (9.6) | 250 (4.2) | ||
| 8089 | 252 (6.2) | 95 (2.3) | ||
| 90 | 88 (11.5) | 84 (8.4) | ||
| Sex | 0.372 | 0.919 | ||
| Male | 3,689 (17.3) | 2,392 (11.2) | ||
| Female | 3,650 (17.0) | 2,478 (11.5) | ||
| Drug | <0.001 | <0.001 | ||
| Heparin | 6,833 (18.4) | 4,515 (12.2) | ||
| Enoxaparin | 506 (8.9) | 355 (6.2) | ||
| Length of stay, d | <0.001 | <0.001 | ||
| 01 | 446 (24.3) | 282 (15.4) | ||
| 23 | 1,463 (19.4) | 971 (12.9) | ||
| 47 | 2,332 (18.9) | 1,620 (13.1) | ||
| 8 | 3,098 (14.6) | 1,997 (9.4) | ||
The results of the multivariate regression analyses with GEE are displayed in Table 4. HIV diagnosis, non‐African American race, and heparin (as compared with enoxaparin) were associated with increased likelihood of nonadministration. Increasing age and increasing length of stay were associated with decreased likelihood of nonadministration by a small but significant amount.
| OR of Nonadministration | 95% CI, P | OR of Documented Refusal | 95% CI, P | |
|---|---|---|---|---|
| ||||
| Race | ||||
| African American | 1.00 | Reference | 1.00 | Reference |
| Caucasian | 1.62 | 1.44‐1.81, <0.001 | 1.53 | 1.32‐1.77, <0.001 |
| Asian, Pacific Islander, Other | 1.54 | 1.19‐2.00, 0.001 | 1.48 | 1.07‐2.01, 0.019 |
| HIV status | ||||
| Negative | 1.00 | Reference | 1.00 | Reference |
| Positive | 1.21 | 1.001.45, 0.039 | 1.29 | 1.06‐1.56, 0.012 |
| Age, per year | 0.97 | 0.97‐0.98, <0.001 | 0.97 | 0.96‐0.97, <0.001 |
| Drug | ||||
| Heparin | 1.00 | Reference | 1.00 | Reference |
| Enoxaparin | 0.45 | 0.40‐0.51, <0.001 | 0.53 | 0.47‐0.61, <0.001 |
| Length of stay, per day | 0.991 | 0.987‐0.995, <0.001 | 0.989 | 0.983‐0.993, <0.001 |
The most commonly documented reason for nonadministration was refusal by the patient or family member (66% of all doses not administered). The second most common reason, patient condition not appropriate, accounted for an additional 10% of doses. Across all nursing units, the proportion of prescribed doses that were documented as refused was significantly greater for patients with HIV compared with patients without HIV (16.5% vs 10.6%, OR: 1.66, 95% CI: 1.54‐1.80, P<0.0001) (Table 2). Using the GEE and multivariate regression, HIV diagnosis, non‐African American race, and heparin were associated with increased risk of documented dose refusal. Age and length of stay were inversely related to the likelihood of documented dose refusal. When all administered doses were excluded from the analysis, the association between these variables and documented dose refusal were not as strong. Age and length of stay remained significantly inversely related; however, the other factors were no longer significantly positively associated with documented dose refusal.
Within the HIV care unit, the proportion of prescribed doses documented as refused was greater for patients with HIV compared with patients without HIV (18.1% vs 6.8%, OR: 3.01, 95% CI: 2.28‐3.99, P<0.0001). For all other medicine units, the proportion of nonadministered doses documented as refused was also greater for patients with HIV compared with patients without HIV (13.7% vs 10.7%, OR: 1.32, 95% CI: 1.16‐1.51, P<0.0001).
DISCUSSION
We have identified that nonadministration of thromboprophylaxis was more common among patients with HIV at our institution. Substantial variation in the proportion of doses not administered existed on the nursing unit level, as well as within each unit when stratified by HIV status. This disparity in dose administration was observed on the HIV care unit as well, as the proportion not administered was about 2‐fold greater for patients with HIV compared with those without HIV. Documented dose refusal appeared to account for the majority of nonadministered doses in our cohort. Our analysis also demonstrated that HIV diagnosis is significantly associated with both dose nonadministration and documented dose refusal at our institution.
Medication refusal is a well‐recognized phenomenon among hospitalized patients. A recent study of medication administration in hospitalized patients in the United Kingdom noted that refusal accounted for about 45% of omitted doses.[26] Fanikos et al. also found that documented refusal of doses contributed significantly to the overall number of VTE prophylaxis doses not administered to patients.[27] In our study, the proportion of nonadministered doses documented as refused by the patient or family member was significantly greater in patients with HIV than in patients without HIV across all units. Interestingly, the difference was greater on the HIV care unit when doses were stratified by HIV status. This observation leads us to hypothesize that specific hospital care environments may influence dose nonadministration and refusal rates among our patient population.
Based on regression analyses, increasing age and length of stay were associated with a decreased likelihood of any particular dose not being administered and with any particular dose being documented as refused. It is important to note that our GEE did not take into account date or time of each dose, and therefore we cannot make conclusions as to the likelihood of dose nonadministration or refusal of doses in relation to each other on a time scale. One cannot assume that a dose due later in a hospital course was more or less likely to be given than a dose due on the first hospital day. Although we did not expect these findings, one can hypothesize that patients who are older or have longer stays may be perceived to have more severe illness, and therefore greater need for prophylaxis, from nursing staff and others involved in their care. The associations were small but significant and warrant future investigation.
To our knowledge, this is the first investigation comparing the proportion of nonadministered doses of thromboprophylaxis between patients with and without HIV. Our data show that nonadministered doses and refused doses of thromboprophylaxis are more frequent among patients with HIV. In addition, we noted that nonadministration was more common on the dedicated HIV care unit compared with other units. We cannot currently offer a clear explanation for the disparity observed between units, and more specifically, within the HIV care unit. However, it is possible that a unique culture of care and provider‐specific factors may contribute.
Our study was limited by a number of factors. Seroconversion among patients during the study period was possible; however, our analysis revealed only 2 instances among nearly 4000 unique patients. A more significant limitation was the level of analysis allowed by the dataset. We examined dose characteristics on a dose and unit level, but the ability to analyze doses based on the prescriber and nurse level may have provided valuable insight into the specific reasons behind the observations presented here. Additionally, the specific unit assigned to a given dose in our dataset represented the discharge location for the corresponding patient, making it possible that some amount of nonadministered doses may be attributed to the incorrect unit. However, we do not believe that unit‐to‐unit transfers would be frequent enough to influence the overall results. In addition, we did not link nonadministration of thromboprophylaxis with VTE events, as these data were not present in the current dataset. Although this is a limitation of the current study, we believe that the notion that missed doses of thromboprophylaxis place patients at higher risk for VTE is plausible, as the efficacy of thromboprophylaxis is well established.[28, 29, 30] It is important to note that the reason for nonadministration selected by the nurse on the eMAR may not always represent the only reason or even the true reason for dose nonadministration. It is possible that dose refusal may be over‐represented in our sample, in part due to inaccurate documentation. Recent investigations at JHH have identified varying attitudes on the part of the patient and the nurse regarding thromboprophylaxis. A questionnaire and interview of patients showed a large knowledge gap regarding thromboprophylaxis, with many individuals unable to explain its role or significance in their medical care.[31] A common theme was also observed in a survey of nurses regarding VTE prophylaxis: doses were sometimes considered optional for reasons such as ambulation status, perceived severity of illness, or reason for hospitalization. Some nurses also reported that after an initial refused dose, they may continue to document subsequent doses as refused, sometimes without offering the dose to the patient.[32] As variation in practice was observed between individual nurses, it is also likely that the culture of care may vary between units, influencing thromboprophylaxis nonadministration rates as well as documentation of doses as refused. The dose‐level data used for the GEE analyses did not include date and time of administration, which limited the ability of the GEE to more completely account for autocorrelation.
To further investigate the findings of this and related studies, we intend to more closely analyze data at multiple levels with the goal of identifying an appropriate and feasible target for intervention. Additionally, further investigation should be performed with the goal of determining the relationship between decreased exposure to thromboprophylaxis and VTE. However, as patients with HIV appear to be at increased risk of VTE, ensuring that thromboprophylaxis is delivered appropriately and consistently should be an important goal for all who provide care to this population.
- , , , , . Venous thromboembolism in patients with HIV/AIDS: a case‐control study. J Acquir Immune Defic Syndr. 2008;48(3):310–314.
- , , . AIDS and thrombosis: retrospective study of 131 HIV‐infected patients. AIDS Patient Care STDS. 2001;15(6):311–320.
- , , , et al. HIV and risk of venous thromboembolism: a Danish nationwide population‐based cohort study. HIV Med. 2011;12(4):202–210.
- , , , . Epidemiology of thrombosis in HIV‐infected individuals. The adult/adolescent spectrum of HIV disease project. AIDS. 2000;14(3):321–324.
- , , . Thrombotic complications in patients infected with HIV in the era of highly active antiretroviral therapy: a case series. Clin Infect Dis. 2004;39(8):1214–1222.
- , , . Circulating coagulation inhibitors in the acquired immunodeficiency syndrome. Ann Intern Med. 1986;104(2):175–180.
- , . The pathogenesis of the antiphospholipid syndrome. N Engl J Med. 2013;368(11):1033–1044.
- , , , . Acquired protein C and protein S deficiency in HIV‐infected patients. Clin Appl Thromb Hemost. 2003;9(4):325–331.
- , , , et al. Antiphospholipid syndrome associated with cytomegalovirus infection: case report and review. Clin Infect Dis. 1997;24(2):197–200.
- , . Viral infections and antiphospholipid antibodies. Semin Arthritis Rheum. 2002;31(4):256–263.
- , . AIDS‐defining and non‐AIDS‐defining malignancies: cancer occurrence in the antiretroviral therapy era. Curr Opin Oncol. 2007;19(5):446–451.
- , , , , . Pathogenesis, clinical and laboratory aspects of thrombosis in cancer. J Thromb Thrombolysis. 2007;24(1):29–38.
- , , , et al. Patterns of diagnoses in hospital admissions in a multistate cohort of HIV‐positive adults in 2001. Med Care. 2005;43(9 suppl):III3–III14.
- , , , et al. Opportunistic infections as causes of death in HIV‐infected patients in the HAART era in France. Scand J Infect Dis. 2005;37(6‐7):482–487.
- , , , et al. Rates of hospitalizations and associated diagnoses in a large multisite cohort of HIV patients in the United States, 1994–2005. AIDS. 2008;22(11):1345–1354.
- , , . Hospitalizations for metabolic conditions, opportunistic infections, and injection drug use among HIV patients: trends between 1996 and 2000 in 12 states. J Acquir Immune Defic Syndr. 2005;40(5):609–616.
- , , , , , . Cardiovascular disease in HIV infection. Am Heart J. 2006;151:1147–1155.
- , , , et al. Epidemiological evidence for cardiovascular disease in HIV‐infected patients and relationship to highly active antiretroviral therapy. Circulation. 2008;118(2):e29–e35.
- , , , et al. Immune activation and CD8+ T‐cell differentiation towards senescence in HIV‐1 infection. PLoS Biol. 2004;2(2):E20.
- , , , , . CD4 T cell depletion is linked directly to immune activation in the pathogenesis of HIV‐1 and HIV‐2 but only indirectly to the viral load. J Immunol. 2002;169(6):3400–3406.
- , . Thromboprophylaxis in nonsurgical patients. Hematology Am Soc Hematol Educ Program. 2012;2012:631–637.
- , . Practices to prevent venous thromboembolism [published online ahead of print May 24, 2013]. BMJ Qual Saf. doi:10.1136/bmjqs‐2012‐001782.
- , , , et al. Patterns of non‐administration of ordered doses of venous thromboembolism prophylaxis: implications for novel intervention strategies. PLoS One. 2013;8(6):e66311.
- , , , et al. Lessons from The Johns Hopkins multi‐disciplinary venous thromboembolism (VTE) prevention collaborative. BMJ. 2012;344:e3935.
- , , , et al. Impact of a venous thromboembolism prophylaxis “smart order set”: improved compliance, fewer events [published online ahead of print April 4, 2013]. Am J Hematol. doi: 10.1002/ajh.23450.
- , , . Dose omissions in hospitalized patients in a UK hospital: an analysis of the relative contribution of adverse drug reactions. Drug Saf. 2012;35(8):677–683.
- , , , et al. Adherence to pharmacological thromboprophylaxis orders in hospitalized patients. Am J Med. 2010;123(6):536–541.
- , , , et al. A comparison of enoxaparin with placebo for the prevention of venous thromboembolism in acutely ill medical patients. Prophylaxis in medical patients with enoxaparin study group. N Engl J Med. 1999;341(11):793–800.
- , , , et al. Randomized, placebo‐controlled trial of dalteparin for the prevention of venous thromboembolism in acutely ill medical patients. Circulation. 2004;110(7):874–879.
- , , , et al. Efficacy and safety of fondaparinux for the prevention of venous thromboembolism in older acute medical patients: randomised placebo controlled trial. BMJ. 2006;332(7537):325–329.
- , , , et al. Patient perspectives on pharmacological venous thromboembolism prophylaxis at The Johns Hopkins Hospital. J Thromb Thrombolysis. 2013;35(3):416.
- , , , et al. Culture of care and documented patient refusal of pharmacologic venous thromboembolism prophylaxis. J Thromb Thrombolysis. 2011;31(3):367–400.
© 2014 Society of Hospital Medicine
