User login
The Johns Hopkins VTE Collaborative
Venous thromboembolism (VTE), which encompasses deep venous thrombosis and pulmonary embolism, is an important cause of preventable morbidity and mortality.[1] Each year it is estimated as many as 600,000 American's suffer VTE and as many as 100,000 die.[2] Consequently, patient safety and healthcare quality, accrediting organizations such as The Joint Commission, and federal agencies such as the Centers for Disease Control and Prevention and Agency for Healthcare Research and Quality (AHRQ) have made VTE prevention a priority.[3, 4, 5]
Despite widespread recognition that VTE prophylaxis is an important patient safety measure, poor performance is common. The ENDORSE (Epidemiologic International Day for the Evaluation of Patients at Risk for Venous Thromboembolism in the Acute Hospital Care Setting) study of over 68,000 hospitalized patients in 32 countries noted only 58.5% of surgical patients and 39.5% medical patients received American College of Chest Physicians (ACCP) guideline‐appropriate VTE prophylaxis.[6] In 2005, an audit of the surgical services at The Johns Hopkins Hospital found that only 33% of 322 randomly selected patients were prescribed prophylaxis consistent with the ACCP guidelines.
Achieving defect‐free VTE prevention requires attention to each step in the process: (1) assessment of both VTE and bleeding risk, (2) prescription of risk‐appropriate VTE prophylaxis, and (3) administration of risk‐appropriate VTE prophylaxis. In 2005, to improve our VTE prevention performance at Johns Hopkins Hospital, the Center for Innovations organized a VTE Collaborative of 2 physicians, 1 nurse, and 1 pharmacist dedicated to VTE quality improvement. Since then, the group has grown dramatically, adding a clinical informatics expert and numerous other members and coming under the auspices of The Armstrong Institute for Patient Safety. Recognizing that many, though not all, VTEs are potentially preventable,[7, 8] the mission of the Johns Hopkins VTE Collaborative is to ensure that all hospitalized patients receive risk‐appropriate, best‐practice VTE prophylaxis. This article chronicles the innovative strategies that the Johns Hopkins VTE Collaborative has employed over the past decade to improve our hospital's performance in VTE prevention (Table 1).
|
| Strategies to improve VTE prophylaxis ordering |
| Paper‐based patient risk assessment forms (before computer order entry) |
| Mandatory evidence‐based specialty‐specific computer clinical decision support smart order sets |
| Group data and competitions |
| 1‐on‐1 provider feedback |
| Pay for performance |
| Individualized feedback with resident scorecards |
| Strategies to improve VTE prophylaxis administration |
| Identification of missed doses as a major contributor to preventable VTE |
| Identification of physician, nurse and patient contributors to missed doses |
| Collaboration with patients to create patient‐centered educational materials |
| Novel web‐based module for nursing education |
| Real‐time missed doses alert |
| Targeted 1‐on‐1 patient education |
ENSURING EVERY PATIENT IS PRESCRIBED RISK‐APPROPRIATE PROPHYLAXIS
With the support of hospital leadership, the VTE Collaborative held a series of events in 2005 with medical and surgical providers to review the current evidence supporting VTE prophylaxis and achieve consensus on appropriate practice based upon the 2004 ACCP VTE Prophylaxis Guideline. The result was the development of 5 evidence‐based, paper VTE prophylaxis order sets that guided the ordering provider on the assessment of VTE and bleeding risk and facilitated the selection of risk‐appropriate VTE prophylaxis. Because there were no validated VTE or bleeding risk assessment tools at the time we developed our order sets, we used specialty‐specific VTE risk factors derived from the 2004 ACCP Guideline. To identify patients inappropriate for pharmacologic prophylaxis, we used exclusion criteria derived from contemporary randomized clinical trials of pharmacologic prophylaxis in the target populations (ie, active bleeding, abnormal activated partial thromboplastin time not due to a lupus inhibitor) or mutually agreed upon thresholds after discussion with individual provider groups (platelet count <50,000/L). On the Johns Hopkins Hospital inpatient acute rehabilitation unit, introduction of the paper order sets increased adherence with ACCP guidelines from 27% to 98% (P < 0.0001) and reduced symptomatic VTE from 49 per 1000 admissions to 8 per 1000 admissions (P = 0.0001).[9] This study demonstrated that paper order sets used consistently by a dedicated group of providers can result in sustained improvements in practice. Paper order sets remain a low‐tech, easy‐to‐implement strategy that can be applied in any healthcare setting. Other services also saw improvements in risk‐appropriate prophylaxis prescription. In a follow‐up cross‐sectional analysis of the surgical services at Johns Hopkins, we found that appropriate VTE prophylaxis prescription improved from 33% to 62% in a sample of 226 patients. Unfortunately, paper order sets had several disadvantages including (1) the inherent difficulty of making them a mandatory part of the admission or transfer process, (2) their existence outside the usual clinical workflow, and (3) the labor‐ and time‐intensive data collection that made it difficult to provide credible, timely performance reports to providers and leadership.
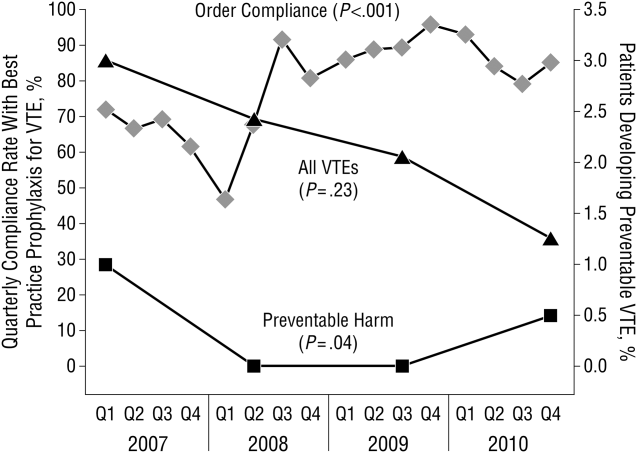
These disadvantages and our adoption of a computerized provider order entry system prompted us to pursue the development and implementation of mandatory, evidence‐based, specialty‐specific computerized clinical decision support (CCDS) VTE prophylaxis order sets. Using the Translating Research Into Practice approach to quality improvement,[10] we collaborated with providers to design 16 different evidence‐based specialty‐specific CCDS VTE order sets. These CCDS VTE order sets, which are imbedded in the specialty‐specific admission and transfer order sets, assist providers in assessing patients' VTE and bleeding risk factors and provide evidence‐based risk‐appropriate VTE prophylaxis (see Supporting Figure 1 in the online version of this article). Individual patient data are saved in an administrative database and can be easily aggregated for research analyses and quality improvement/performance reporting. A detailed discussion of our strategy for change is discussed in Streiff et al.[11] Because pharmacologic prophylaxis is not appropriate for every patient, and not all VTE are preventable, even with perfect prophylaxis, the goals of our collaborative are to ensure that every patient is ordered VTE prophylaxis consistent with their risk profile (risk‐appropriate prophylaxis) and to eliminate preventable episodes of VTE (VTE that occurs in the setting of suboptimal prophylaxis). In a prepost quasi‐experimental study of 1599 trauma patients, the CCDS VTE order set increased risk‐appropriate prophylaxis prescription from 66.2% to 84.4% (P < .001) and reduced the incidence of potentially preventable harm from VTE from 1% to 0.17% (P = 0.04) (Figure 1).[12] On the medical service, the CCDS VTE order set improved risk‐appropriate VTE prophylaxis prescription from 65.6% to 90.1% (P < 0.0001) and reduced the incidence of potentially preventable harm attributable to VTE from 1.1% to 0% (P = 0.001). There was no increase in major bleeding (International Society of Thrombosis and Hemostasis definition: hemoglobin decline of 2 grams/dL or transfusion of 2 or more units of blood or bleeding into a critical organ such as brain, gastrointestinal tract, or eye) postorder set implementation (0.3% vs 0.1%, P = 0.625) or all‐cause mortality (1.3% vs 2.0%, P = 0.285).[13]
These order sets demonstrated that CCDS tools can lead to significant improvements in prescribing practices and reductions in preventable harm from VTE without increasing the risk of major bleeding complications. In addition to improving the quality of care, the order sets also improved the consistency of care. In a retrospective analysis, we found that implementation of CCDS VTE order sets eliminated racial disparities in prescribing practices. In the preimplementation group, risk‐appropriate VTE prophylaxis was prescribed for 70.1% of black patients and 56.6% of white patients on the trauma service (P = 0.025) and 69.5% of black patients and 61.7% of white patients on the medical service (P = 0.015). After implementation of the CCDS VTE order sets, care improved for all patients such that the previously observed disparities were eliminated (trauma service 84.5% vs 85.5%, P = 0.99 and medical service 91.8% vs 88.0%, P = 0.082).[14] These data indicate that standardizing care can potentially eliminate disparities in clinical practice.
Although implementation of mandatory evidence‐based, specialty‐specific CDSS VTE order sets led to substantial improvements in VTE prophylaxis ordering, high performance was not uniform across our institution. On the medical service, substantial disparities in adherence to order set recommendations existed. On the housestaff services, over 90% of patients consistently received risk‐appropriate VTE prophylaxis compared with only 85% on the hospitalist service. Examination of individual provider performance found that some providers only ordered risk‐appropriate prophylaxis 50% of the time, whereas others were doing so 98% of the time. To address this disparity, we conducted a retrospective analysis of a prospective performance improvement project conducted on the Johns Hopkins Hospitalist service studying the impact of individualized hospitalist attending feedback on VTE prevention practices. During the preintervention period (January 2009December 2010), guideline‐adherent VTE prophylaxis was ordered for 86% (95% confidence interval [CI]: 85%‐88%) of patients. Six months after initiation of direct face‐to‐face provider feedback (January 2011June 2011), guideline‐adherent VTE prophylaxis rates rose to 90% (95% CI: 88‐93). Subsequently (July 2011December 2012), a pay‐for‐performance (P4P) initiative was added to direct face‐to‐face provider feedback. During the P4P initiative, provider incentive per relative value unit (RVU) was progressively increased with increasing performance on provision of risk‐appropriate VTE prophylaxis (adherence <80% = no bonus to $0.50 per RVU for adherence 95%). During this period, prescription of guideline‐adherent prophylaxis rose to 94% (95% CI: 93%‐96%).[15] These initiatives transformed the hospitalist unit from a consistently low‐performance unit to a high‐performance unit.
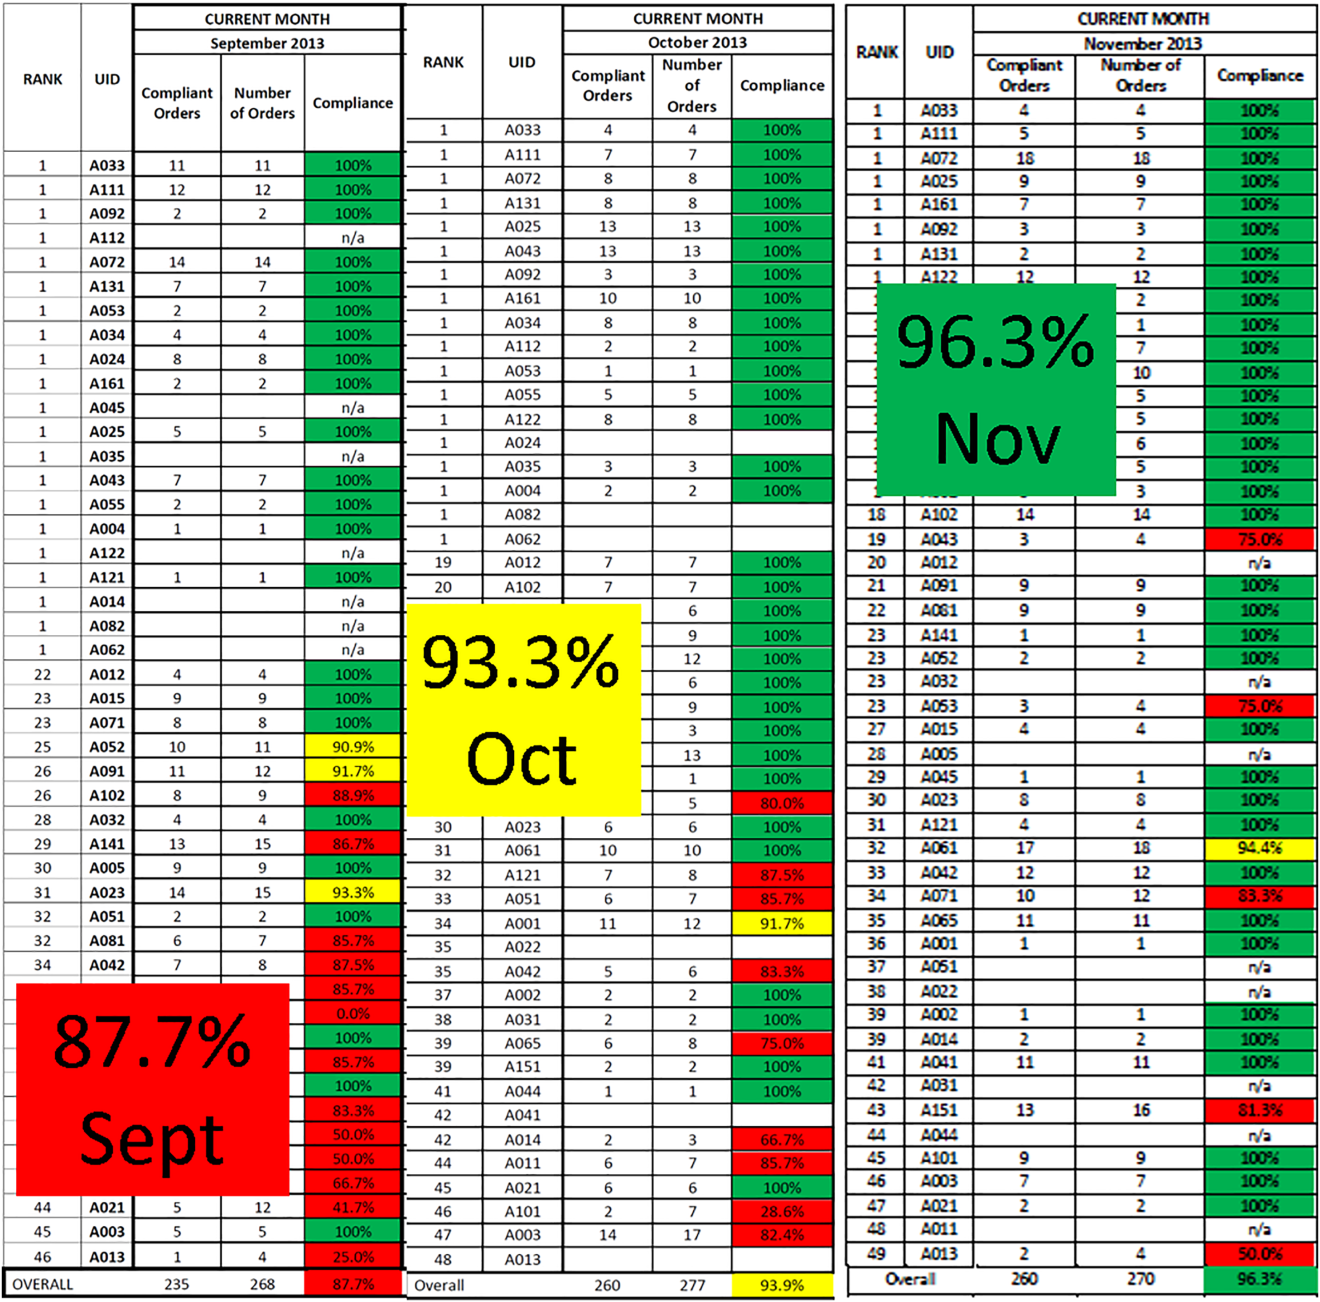
Similar findings were noted on the trauma service. Although the original plan was to provide feedback to attending trauma surgeons, that plan changed when we found that performance was driven entirely by resident practice; residents write the VTE prophylaxis orders, which is then attributed to attending performance. Resident performance varied widely; 42 of 75 (56%) residents on the trauma service ordered risk‐appropriate prophylaxis for 100% of their patients. In contrast, 7 (9.3%) residents never ordered optimal prophylaxis for any of their patients.[16] To motivate all residents to prescribe optimal prophylaxis, we developed an individualized resident VTE prophylaxis scorecard (Figure 2). This prospective cohort study of 2420 patients and 49 general surgery residents compared resident VTE prophylaxis performance on the general surgery service during 3 periods: period 1 (baseline, July 2013September 2013), period 2 (surgery resident scorecard, October 2013December 2013), period 3 (resident scorecard plus individualized 1‐on‐1 coaching, January 2014March 2014). At baseline, 89.4% of patients were prescribed appropriate VTE prophylaxis, and only 45% of residents prescribed risk‐appropriate prophylaxis for all their patients. During the scorecard period, 95.4% of patients were prescribed risk‐appropriate VTE prophylaxis (P < 0.001). During the scorecard plus coaching period, risk‐appropriate prophylaxis rose to 96.4%. These prescribing practice changes were durable. During the 15 months prior to issuing scorecards, 88.0% of patients (3718/4226) were prescribed risk‐appropriate prophylaxis. After implementation, 95.8% of patients (3799/3966) were prescribed risk‐appropriate prophylaxis (P < 0.001) (see Supporting Figure 2 in the online version of this article). During the baseline period, 7 of 865 patients (0.81%) had a VTE during their hospital stay, of which 3 (0.35%) were potentially preventable. In contrast, none of the 3 of 784 patients who suffered VTE during the postimplementation period had a potentially preventable event (0.35% vs 0%, P = 0.046).[17] These studies demonstrate that providing physicians with their own specific data can be a powerful tool for performance improvement that may be applicable to many other quality and safety measures. Our group recently received funding from the AHRQ to scale this work to other residents, nurse practitioners, physician assistants, and attending physicians (1R01HS024547, Individualized Performance Feedback on Venous Thromboembolism Prevention Practice).
IMPROVING VTE PROPHYLAXIS ADMINISTRATION
Ordering VTE prophylaxis does not ensure its administration. We conducted a retrospective review of electronic administration records of 10,526 consecutive patients admitted over a 7‐month period at The Johns Hopkins Hospital. Twelve percent of the over 100,000 ordered doses of VTE prophylaxis were not administered, and the proportion of nonadministered doses on individual floors varied 5‐fold from 5.4% to 26.9%. The proportion of nonadministered doses was significantly higher on medical floors compared with all other services (17.5% vs 8.1%, odds ratio [OR]: 2.1 [95% CI: 2.0‐2.2]). Patient or family member refusal was the most common cause for nonadministered doses of VTE prophylaxis accounting for 59% of all missed doses. Eight percent of patients missed more than half their prescribed doses, and 5% of patients missed over 75% of ordered doses of VTE prophylaxis. Consistent with the Pareto principle, over 80% of the missed doses of prophylaxis were accounted for by just 20% of the patients.[18] A retrospective analysis of hospital‐acquired VTE at Johns Hopkins found that 39% of events occurred in patients who missed 1 or more doses of appropriate VTE prophylaxis.[19] Louis et al. noted that nonadministration of 1 dose of VTE prophylaxis was associated with a significant increase in risk for hospital acquired VTE.[20] These data indicate the need for more aggressive interventions to reduce missed doses to improve VTE prevention.
To fully understand the root causes of VTE prophylaxis non‐administration, we conducted a series of studies examining each of the participants in the VTE prevention care pathway, physicians, nurses, and patients. In a survey of 122 resident physicians, we found significant differences in clinical practice between medicine and surgery residents. Medicine residents were more likely to believe that VTE prophylaxis was overprescribed, and that it was appropriate for nurses to make judgement calls about whether patients needed the prophylaxis that was prescribed.[21] In a mixed methods study that included a written survey and qualitative observations of nursing practice, we found that some nurses presented pharmacologic VTE prophylaxis injections as optional to patients. Furthermore, nurses on units where nonadministration was higher were more likely to believe that VTE prophylaxis was prescribed for patients unnecessarily, and that they could use their clinical judgement to determine when it was appropriate to omit doses of pharmacologic prophylaxis.[22] Our team also examined patient preferences in regard to VTE prophylaxis. In a survey of 227 consecutive medical and surgical inpatients, we found that 60% of patients would prefer an oral route of administration if available. Patients with a preference for a parenteral route of administration (27.5%) were less likely to refuse prophylaxis (37.5% vs 51.3%, P < 0.0001).[23] These findings underscore the fact that unit culture, nursing attitudes and beliefs, and patient preferences have an important influence on medication administration, and that nursepatient communication is an important target for modifying adherence.
PATIENT‐CENTERED APPROACHES TO IMPROVE VTE PROPHYLAXIS ADMINISTRATION
To address nurse‐ and patient‐related factors that influence VTE prophylaxis administration, we applied for and received a Patient Centered Outcomes Research Institute contract to develop patient‐centered interventions to engage and empower patients to take an active role in their preventive care. To achieve these aims, we partnered with 3 national patient advocacy organizations, the National Blood Clot Alliance, the North American Thrombosis Forum, and ClotCare, as well as our local Johns Hopkins Patient and Family Advisory Council. Using a modified Delphi method, we engaged patient stakeholders from the 4 collaborating organizations to build consensus on patient‐centered VTE education methods. Input from this Delphi assessment was used to build educational materials including paper brochures published in 8 different languages and a 10‐minute educational video filmed by an Oscar‐winning documentary director featuring both clinicians and patients relating their VTE experience and the importance of VTE prevention.[24] These educational materials are available for public use (
ENGAGING TRAINEES IN MULTIDISCIPLINARY PATIENT SAFETY/QUALITY IMPROVEMENT INITIATIVES
Trainees from many healthcare‐related disciplines have played a critical role in our quest to improve VTE prevention. Over the past 10 years, we have mentored countless medical students, public health graduate students, nursing students, residents, and postdoctoral fellows in research projects that have resulted in numerous high‐quality publications. Trainees have helped to dispel staff concerns about patient falls in connection of intermittent pneumatic compression devices,[25] identify the weaknesses of current publicly reported VTE measures,[26, 27, 28, 29] identify opportunities to improve VTE prevention practices within clinical specialties,[30, 31, 32] define the role of surveillance bias in VTE outcomes reporting,[33, 34, 35] discover and fully explore the important problem of missed doses of VTE prophylaxis,[18, 21, 22, 23, 36] and summarize knowledge about VTE prevention via systematic reviews and meta‐analyses.[37, 38, 39] These collaborations have been a classic win‐win. The mentees learn critical skills while growing their curriculum vitae with contributions to the literature, allowing them to progress in their careers (ie, obtain a residency match, faculty positions). The faculty have leveraged this work to obtain over $3 million in extramural funding to develop interventions to study and improve the quality of VTE preventive care for hospitalized patients.
In healthcare, we have not yet achieved defect‐free VTE prevention; however, we have a better understanding of the path to accomplishing this goal. In this article we describe our goal of zero harm from VTE and our learning journey to realize that goal. Although the journey never ends, a critical ingredient to the success of our program has been the multidisciplinary nature of our VTE collaborative team. The combination of expertise from medicine, surgery, nursing, pharmacy, clinical informatics, and public health has facilitated the development of innovative strategies to improve VTE prevention that integrate seamlessly into clinical workflow. The approach used for VTE can be applied to eliminate other types of harms.
Disclosures
Mr. Lau, Dr. Streiff, and Dr. Haut are supported by a grant from the Agency for Healthcare Research and Quality (1R01HS024547) titled Individualized Performance Feedback on Venous Thromboembolism Prevention Practice and a contract from the Patient‐Centered Outcomes Research Institute titled Preventing Venous Thromboembolism: Empowering Patients and Enabling Patient‐Centered Care via Health Information Technology (CE‐12‐11‐4489). Mr. Lau is supported by the Institute for Excellence in Education Berkheimer Faculty Education Scholar Grant and a contract (AD‐1306‐03980) from the Patient‐Centered Outcomes Research Institute titled Patient Centered Approaches to Collect Sexual Orientation/Gender Identity Information in the Emergency Department. Ms. Hobson has given expert witness testimony in various medical malpractice cases. Dr. Streiff has received research funding from Portola and Janssen; consulted for Bio2Medical, CSL Behring, Merck, and Janssen HealthCare; and has given expert witness testimony in various medical malpractice cases. Dr. Haut receives royalties from Lippincott, Williams, and Wilkins for a book titled Avoiding Common ICU Errors. Dr. Haut is a paid consultant and speaker for the Preventing Avoidable Venous ThromboembolismEvery Patient, Every Time VHA/Vizient IMPERATIV Advantage Performance Improvement Collaborative. Dr. Haut is a paid consultant and speaker for the Illinois Surgical Quality Improvement Collaborative. All other authors report no disclosures.
- , . Thromboprophylaxis in nonsurgical patients. Hematology Am Soc Hematol Educ Program. 2012;2012:631–637.
- Office of the Surgeon General (US); National Heart, Lung, and Blood Institute (US). The Surgeon General's Call to Action to Prevent Deep Vein Thrombosis and Pulmonary Embolism. Rockville, MD: Office of the Surgeon General; 2008.
- , . Prevention of venous thromboembolism: brief update review. In: Making Health Care Safer II: An Updated Critical Analysis of the Evidence for Patient Safety Practices. Rockville, MD: Agency for Healthcare Research and Quality; 2013.
- , , , et al. The top patient safety strategies that can be encouraged for adoption now. Ann Intern Med. 2013;158:365–368.
- , . Practices to prevent venous thromboembolism: a brief review. BMJ Qual Saf. 2014;23:187–195.
- , , , et al. Venous thromboembolism risk and prophylaxis in the acute hospital care setting (ENDORSE study): a multinational cross‐sectional study. Lancet. 2008;371:387–394.
- , . The CMS ruling on venous thromboembolism after total knee or hip arthroplasty: weighing risks and benefits. JAMA. 2009;301:1063–1065.
- , , , et al. ICD‐9 code‐based venous thromboembolism performance targets fail to measure up. Am J Med Qual. 2016;31(5):448–453.
- , , , , . Evidence‐based venous thromboembolism prophylaxis is associated with a six‐fold decrease in numbers of symptomatic venous thromboembolisms in rehabilitation inpatients. PM R. 2011;3:1111–1115.e1.
- , , . Translating evidence into practice: a model for large scale knowledge translation. BMJ. 2008;337:a1714.
- , , , et al. Lessons from the Johns Hopkins Multi‐Disciplinary Venous Thromboembolism (VTE) Prevention Collaborative. BMJ. 2012;344:e3935.
- , , , et al. Improved prophylaxis and decreased rates of preventable harm with the use of a mandatory computerized clinical decision support tool for prophylaxis for venous thromboembolism in trauma. Arch Surg. 2012;147:901–907.
- , , , et al. Impact of a venous thromboembolism prophylaxis “smart order set”: improved compliance, fewer events. Am J Hematol. 2013;88(7):545–549.
- , , , et al. Eliminating health care disparities with mandatory clinical decision support: the venous thromboembolism (VTE) example. Med Care. 2015;53:18–24.
- , , , et al. Use of provider‐level dashboards and pay‐for‐performance in venous thromboembolism prophylaxis. J Hosp Med. 2015;10:172–178.
- , , , , , . Attending physician performance measure scores and resident physicians' ordering practices. JAMA Surg. 2015;150:813–814.
- , , , et al. Individualized performance feedback to surgical residents improves appropriate venous thromboembolism prophylaxis prescription and reduces potentially preventable VTE: a prospective cohort study [published online November 25, 2015]. Ann Surg. doi: 10.1097/SLA.0000000000001512.
- , , , et al. Patterns of non‐administration of ordered doses of venous thromboembolism prophylaxis: implications for novel intervention strategies. PLoS One. 2013;8:e66311.
- , , , et al. Preventability of hospital‐acquired venous thromboembolism. JAMA Surg. 2015;150(9):912–915.
- , , , et al. Correlation of missed doses of enoxaparin with increased incidence of deep vein thrombosis in trauma and general surgery patients. JAMA Surg. 2014;149:365–370.
- , , , et al. Prescriber knowledge and attitudes regarding non‐administration of prescribed pharmacologic venous thromboembolism prophylaxis [published online May 21, 2016]. J Thromb Thrombolysis. doi:10.1007/s11239-016-1378-8.
- , , , et al. Hidden barriers to delivery of pharmacological venous thromboembolism prophylaxis: the role of nursing beliefs and practices. J Patient Saf. 2016;12:63–68.
- , , , et al. Patient preferences regarding pharmacologic venous thromboembolism prophylaxis. J Hosp Med. 2015;10:108–111.
- , , , et al. Patient preferences for receiving education on venous thromboembolism prevention—a survey of stakeholder organizations. PLoS One. 2016;11:e0152084.
- , , , , , . Are sequential compression devices commonly associated with in‐hospital falls? A myth‐busters review using the patient safety net database. J Patient Saf. 2011;7:77–79.
- , , , , . No association between hospital‐reported perioperative venous thromboembolism prophylaxis and outcome rates in publicly reported data. JAMA Surg. 2014;149:400–401.
- , , , , . Linking processes and outcomes: a key strategy to prevent and report harm from venous thromboembolism in surgical patients. JAMA Surg. 2013;148:299–300.
- , , , et al. Hazards of benchmarking complications with the National Trauma Data Bank: numerators in search of denominators. J Trauma. 2008;64:273–277; discussion 277–279.
- , , , et al. Is the meaningful use venous thromboembolism VTE‐6 measure meaningful? A retrospective analysis of one hospital's VTE‐6 cases. Jt Comm J Qual Patient Saf. 2016;42(9):410–416.
- , , , et al. Is venous thromboembolism in colorectal surgery patients preventable or inevitable? One institution's experience. J Am Coll Surg. 2013;216:395–401.e1.
- , , , et al. Venous thromboembolic prophylaxis after a hepatic resection: patterns of care among liver surgeons. HPB (Oxford). 2014;16:892–898.
- , , , et al. Defining incidence and risk factors of venous thromboembolism after hepatectomy. J Gastrointest Surg. 2014;18:1116–1124.
- , , , et al. Can increased incidence of deep vein thrombosis (DVT) be used as a marker of quality of care in the absence of standardized screening? The potential effect of surveillance bias on reported DVT rates after trauma. J Trauma. 2007;63:1132–1135; discussion 1135–1137.
- , . Surveillance bias in outcomes reporting. JAMA. 2011;305:2462–2463.
- , , , et al. Surveillance bias and deep vein thrombosis in the national trauma data bank: the more we look, the more we find. J Trauma. 2008;64:932–936; discussion 936–937.
- , , , et al. Nonadministration of thromboprophylaxis in hospitalized patients with HIV: a missed opportunity for prevention? J Hosp Med. 2014;9:215–220.
- , , , et al. Pharmacologic and mechanical prophylaxis of venous thromboembolism among special populations. Comparative effectiveness review No. 116. Prepared by the Johns Hopkins University Evidence‐based Practice Center under Contract No. 290‐2007‐10061‐I.) AHRQ Publication No. 13‐EHC082–1. Rockville, MD: Agency for Healthcare Research and Quality; 2013.
- , , , et al. Pharmacologic and mechanical strategies for preventing venous thromboembolism after bariatric surgery: a systematic review and meta‐analysis. JAMA Surg. 2013;148:675–686.
- , , , et al. The effectiveness of prophylactic inferior vena cava filters in trauma patients: a systematic review and meta‐analysis. JAMA Surg. 2014;149:194–202.
Venous thromboembolism (VTE), which encompasses deep venous thrombosis and pulmonary embolism, is an important cause of preventable morbidity and mortality.[1] Each year it is estimated as many as 600,000 American's suffer VTE and as many as 100,000 die.[2] Consequently, patient safety and healthcare quality, accrediting organizations such as The Joint Commission, and federal agencies such as the Centers for Disease Control and Prevention and Agency for Healthcare Research and Quality (AHRQ) have made VTE prevention a priority.[3, 4, 5]
Despite widespread recognition that VTE prophylaxis is an important patient safety measure, poor performance is common. The ENDORSE (Epidemiologic International Day for the Evaluation of Patients at Risk for Venous Thromboembolism in the Acute Hospital Care Setting) study of over 68,000 hospitalized patients in 32 countries noted only 58.5% of surgical patients and 39.5% medical patients received American College of Chest Physicians (ACCP) guideline‐appropriate VTE prophylaxis.[6] In 2005, an audit of the surgical services at The Johns Hopkins Hospital found that only 33% of 322 randomly selected patients were prescribed prophylaxis consistent with the ACCP guidelines.
Achieving defect‐free VTE prevention requires attention to each step in the process: (1) assessment of both VTE and bleeding risk, (2) prescription of risk‐appropriate VTE prophylaxis, and (3) administration of risk‐appropriate VTE prophylaxis. In 2005, to improve our VTE prevention performance at Johns Hopkins Hospital, the Center for Innovations organized a VTE Collaborative of 2 physicians, 1 nurse, and 1 pharmacist dedicated to VTE quality improvement. Since then, the group has grown dramatically, adding a clinical informatics expert and numerous other members and coming under the auspices of The Armstrong Institute for Patient Safety. Recognizing that many, though not all, VTEs are potentially preventable,[7, 8] the mission of the Johns Hopkins VTE Collaborative is to ensure that all hospitalized patients receive risk‐appropriate, best‐practice VTE prophylaxis. This article chronicles the innovative strategies that the Johns Hopkins VTE Collaborative has employed over the past decade to improve our hospital's performance in VTE prevention (Table 1).
|
| Strategies to improve VTE prophylaxis ordering |
| Paper‐based patient risk assessment forms (before computer order entry) |
| Mandatory evidence‐based specialty‐specific computer clinical decision support smart order sets |
| Group data and competitions |
| 1‐on‐1 provider feedback |
| Pay for performance |
| Individualized feedback with resident scorecards |
| Strategies to improve VTE prophylaxis administration |
| Identification of missed doses as a major contributor to preventable VTE |
| Identification of physician, nurse and patient contributors to missed doses |
| Collaboration with patients to create patient‐centered educational materials |
| Novel web‐based module for nursing education |
| Real‐time missed doses alert |
| Targeted 1‐on‐1 patient education |
ENSURING EVERY PATIENT IS PRESCRIBED RISK‐APPROPRIATE PROPHYLAXIS
With the support of hospital leadership, the VTE Collaborative held a series of events in 2005 with medical and surgical providers to review the current evidence supporting VTE prophylaxis and achieve consensus on appropriate practice based upon the 2004 ACCP VTE Prophylaxis Guideline. The result was the development of 5 evidence‐based, paper VTE prophylaxis order sets that guided the ordering provider on the assessment of VTE and bleeding risk and facilitated the selection of risk‐appropriate VTE prophylaxis. Because there were no validated VTE or bleeding risk assessment tools at the time we developed our order sets, we used specialty‐specific VTE risk factors derived from the 2004 ACCP Guideline. To identify patients inappropriate for pharmacologic prophylaxis, we used exclusion criteria derived from contemporary randomized clinical trials of pharmacologic prophylaxis in the target populations (ie, active bleeding, abnormal activated partial thromboplastin time not due to a lupus inhibitor) or mutually agreed upon thresholds after discussion with individual provider groups (platelet count <50,000/L). On the Johns Hopkins Hospital inpatient acute rehabilitation unit, introduction of the paper order sets increased adherence with ACCP guidelines from 27% to 98% (P < 0.0001) and reduced symptomatic VTE from 49 per 1000 admissions to 8 per 1000 admissions (P = 0.0001).[9] This study demonstrated that paper order sets used consistently by a dedicated group of providers can result in sustained improvements in practice. Paper order sets remain a low‐tech, easy‐to‐implement strategy that can be applied in any healthcare setting. Other services also saw improvements in risk‐appropriate prophylaxis prescription. In a follow‐up cross‐sectional analysis of the surgical services at Johns Hopkins, we found that appropriate VTE prophylaxis prescription improved from 33% to 62% in a sample of 226 patients. Unfortunately, paper order sets had several disadvantages including (1) the inherent difficulty of making them a mandatory part of the admission or transfer process, (2) their existence outside the usual clinical workflow, and (3) the labor‐ and time‐intensive data collection that made it difficult to provide credible, timely performance reports to providers and leadership.
These disadvantages and our adoption of a computerized provider order entry system prompted us to pursue the development and implementation of mandatory, evidence‐based, specialty‐specific computerized clinical decision support (CCDS) VTE prophylaxis order sets. Using the Translating Research Into Practice approach to quality improvement,[10] we collaborated with providers to design 16 different evidence‐based specialty‐specific CCDS VTE order sets. These CCDS VTE order sets, which are imbedded in the specialty‐specific admission and transfer order sets, assist providers in assessing patients' VTE and bleeding risk factors and provide evidence‐based risk‐appropriate VTE prophylaxis (see Supporting Figure 1 in the online version of this article). Individual patient data are saved in an administrative database and can be easily aggregated for research analyses and quality improvement/performance reporting. A detailed discussion of our strategy for change is discussed in Streiff et al.[11] Because pharmacologic prophylaxis is not appropriate for every patient, and not all VTE are preventable, even with perfect prophylaxis, the goals of our collaborative are to ensure that every patient is ordered VTE prophylaxis consistent with their risk profile (risk‐appropriate prophylaxis) and to eliminate preventable episodes of VTE (VTE that occurs in the setting of suboptimal prophylaxis). In a prepost quasi‐experimental study of 1599 trauma patients, the CCDS VTE order set increased risk‐appropriate prophylaxis prescription from 66.2% to 84.4% (P < .001) and reduced the incidence of potentially preventable harm from VTE from 1% to 0.17% (P = 0.04) (Figure 1).[12] On the medical service, the CCDS VTE order set improved risk‐appropriate VTE prophylaxis prescription from 65.6% to 90.1% (P < 0.0001) and reduced the incidence of potentially preventable harm attributable to VTE from 1.1% to 0% (P = 0.001). There was no increase in major bleeding (International Society of Thrombosis and Hemostasis definition: hemoglobin decline of 2 grams/dL or transfusion of 2 or more units of blood or bleeding into a critical organ such as brain, gastrointestinal tract, or eye) postorder set implementation (0.3% vs 0.1%, P = 0.625) or all‐cause mortality (1.3% vs 2.0%, P = 0.285).[13]
These order sets demonstrated that CCDS tools can lead to significant improvements in prescribing practices and reductions in preventable harm from VTE without increasing the risk of major bleeding complications. In addition to improving the quality of care, the order sets also improved the consistency of care. In a retrospective analysis, we found that implementation of CCDS VTE order sets eliminated racial disparities in prescribing practices. In the preimplementation group, risk‐appropriate VTE prophylaxis was prescribed for 70.1% of black patients and 56.6% of white patients on the trauma service (P = 0.025) and 69.5% of black patients and 61.7% of white patients on the medical service (P = 0.015). After implementation of the CCDS VTE order sets, care improved for all patients such that the previously observed disparities were eliminated (trauma service 84.5% vs 85.5%, P = 0.99 and medical service 91.8% vs 88.0%, P = 0.082).[14] These data indicate that standardizing care can potentially eliminate disparities in clinical practice.
Although implementation of mandatory evidence‐based, specialty‐specific CDSS VTE order sets led to substantial improvements in VTE prophylaxis ordering, high performance was not uniform across our institution. On the medical service, substantial disparities in adherence to order set recommendations existed. On the housestaff services, over 90% of patients consistently received risk‐appropriate VTE prophylaxis compared with only 85% on the hospitalist service. Examination of individual provider performance found that some providers only ordered risk‐appropriate prophylaxis 50% of the time, whereas others were doing so 98% of the time. To address this disparity, we conducted a retrospective analysis of a prospective performance improvement project conducted on the Johns Hopkins Hospitalist service studying the impact of individualized hospitalist attending feedback on VTE prevention practices. During the preintervention period (January 2009December 2010), guideline‐adherent VTE prophylaxis was ordered for 86% (95% confidence interval [CI]: 85%‐88%) of patients. Six months after initiation of direct face‐to‐face provider feedback (January 2011June 2011), guideline‐adherent VTE prophylaxis rates rose to 90% (95% CI: 88‐93). Subsequently (July 2011December 2012), a pay‐for‐performance (P4P) initiative was added to direct face‐to‐face provider feedback. During the P4P initiative, provider incentive per relative value unit (RVU) was progressively increased with increasing performance on provision of risk‐appropriate VTE prophylaxis (adherence <80% = no bonus to $0.50 per RVU for adherence 95%). During this period, prescription of guideline‐adherent prophylaxis rose to 94% (95% CI: 93%‐96%).[15] These initiatives transformed the hospitalist unit from a consistently low‐performance unit to a high‐performance unit.
Similar findings were noted on the trauma service. Although the original plan was to provide feedback to attending trauma surgeons, that plan changed when we found that performance was driven entirely by resident practice; residents write the VTE prophylaxis orders, which is then attributed to attending performance. Resident performance varied widely; 42 of 75 (56%) residents on the trauma service ordered risk‐appropriate prophylaxis for 100% of their patients. In contrast, 7 (9.3%) residents never ordered optimal prophylaxis for any of their patients.[16] To motivate all residents to prescribe optimal prophylaxis, we developed an individualized resident VTE prophylaxis scorecard (Figure 2). This prospective cohort study of 2420 patients and 49 general surgery residents compared resident VTE prophylaxis performance on the general surgery service during 3 periods: period 1 (baseline, July 2013September 2013), period 2 (surgery resident scorecard, October 2013December 2013), period 3 (resident scorecard plus individualized 1‐on‐1 coaching, January 2014March 2014). At baseline, 89.4% of patients were prescribed appropriate VTE prophylaxis, and only 45% of residents prescribed risk‐appropriate prophylaxis for all their patients. During the scorecard period, 95.4% of patients were prescribed risk‐appropriate VTE prophylaxis (P < 0.001). During the scorecard plus coaching period, risk‐appropriate prophylaxis rose to 96.4%. These prescribing practice changes were durable. During the 15 months prior to issuing scorecards, 88.0% of patients (3718/4226) were prescribed risk‐appropriate prophylaxis. After implementation, 95.8% of patients (3799/3966) were prescribed risk‐appropriate prophylaxis (P < 0.001) (see Supporting Figure 2 in the online version of this article). During the baseline period, 7 of 865 patients (0.81%) had a VTE during their hospital stay, of which 3 (0.35%) were potentially preventable. In contrast, none of the 3 of 784 patients who suffered VTE during the postimplementation period had a potentially preventable event (0.35% vs 0%, P = 0.046).[17] These studies demonstrate that providing physicians with their own specific data can be a powerful tool for performance improvement that may be applicable to many other quality and safety measures. Our group recently received funding from the AHRQ to scale this work to other residents, nurse practitioners, physician assistants, and attending physicians (1R01HS024547, Individualized Performance Feedback on Venous Thromboembolism Prevention Practice).
IMPROVING VTE PROPHYLAXIS ADMINISTRATION
Ordering VTE prophylaxis does not ensure its administration. We conducted a retrospective review of electronic administration records of 10,526 consecutive patients admitted over a 7‐month period at The Johns Hopkins Hospital. Twelve percent of the over 100,000 ordered doses of VTE prophylaxis were not administered, and the proportion of nonadministered doses on individual floors varied 5‐fold from 5.4% to 26.9%. The proportion of nonadministered doses was significantly higher on medical floors compared with all other services (17.5% vs 8.1%, odds ratio [OR]: 2.1 [95% CI: 2.0‐2.2]). Patient or family member refusal was the most common cause for nonadministered doses of VTE prophylaxis accounting for 59% of all missed doses. Eight percent of patients missed more than half their prescribed doses, and 5% of patients missed over 75% of ordered doses of VTE prophylaxis. Consistent with the Pareto principle, over 80% of the missed doses of prophylaxis were accounted for by just 20% of the patients.[18] A retrospective analysis of hospital‐acquired VTE at Johns Hopkins found that 39% of events occurred in patients who missed 1 or more doses of appropriate VTE prophylaxis.[19] Louis et al. noted that nonadministration of 1 dose of VTE prophylaxis was associated with a significant increase in risk for hospital acquired VTE.[20] These data indicate the need for more aggressive interventions to reduce missed doses to improve VTE prevention.
To fully understand the root causes of VTE prophylaxis non‐administration, we conducted a series of studies examining each of the participants in the VTE prevention care pathway, physicians, nurses, and patients. In a survey of 122 resident physicians, we found significant differences in clinical practice between medicine and surgery residents. Medicine residents were more likely to believe that VTE prophylaxis was overprescribed, and that it was appropriate for nurses to make judgement calls about whether patients needed the prophylaxis that was prescribed.[21] In a mixed methods study that included a written survey and qualitative observations of nursing practice, we found that some nurses presented pharmacologic VTE prophylaxis injections as optional to patients. Furthermore, nurses on units where nonadministration was higher were more likely to believe that VTE prophylaxis was prescribed for patients unnecessarily, and that they could use their clinical judgement to determine when it was appropriate to omit doses of pharmacologic prophylaxis.[22] Our team also examined patient preferences in regard to VTE prophylaxis. In a survey of 227 consecutive medical and surgical inpatients, we found that 60% of patients would prefer an oral route of administration if available. Patients with a preference for a parenteral route of administration (27.5%) were less likely to refuse prophylaxis (37.5% vs 51.3%, P < 0.0001).[23] These findings underscore the fact that unit culture, nursing attitudes and beliefs, and patient preferences have an important influence on medication administration, and that nursepatient communication is an important target for modifying adherence.
PATIENT‐CENTERED APPROACHES TO IMPROVE VTE PROPHYLAXIS ADMINISTRATION
To address nurse‐ and patient‐related factors that influence VTE prophylaxis administration, we applied for and received a Patient Centered Outcomes Research Institute contract to develop patient‐centered interventions to engage and empower patients to take an active role in their preventive care. To achieve these aims, we partnered with 3 national patient advocacy organizations, the National Blood Clot Alliance, the North American Thrombosis Forum, and ClotCare, as well as our local Johns Hopkins Patient and Family Advisory Council. Using a modified Delphi method, we engaged patient stakeholders from the 4 collaborating organizations to build consensus on patient‐centered VTE education methods. Input from this Delphi assessment was used to build educational materials including paper brochures published in 8 different languages and a 10‐minute educational video filmed by an Oscar‐winning documentary director featuring both clinicians and patients relating their VTE experience and the importance of VTE prevention.[24] These educational materials are available for public use (
ENGAGING TRAINEES IN MULTIDISCIPLINARY PATIENT SAFETY/QUALITY IMPROVEMENT INITIATIVES
Trainees from many healthcare‐related disciplines have played a critical role in our quest to improve VTE prevention. Over the past 10 years, we have mentored countless medical students, public health graduate students, nursing students, residents, and postdoctoral fellows in research projects that have resulted in numerous high‐quality publications. Trainees have helped to dispel staff concerns about patient falls in connection of intermittent pneumatic compression devices,[25] identify the weaknesses of current publicly reported VTE measures,[26, 27, 28, 29] identify opportunities to improve VTE prevention practices within clinical specialties,[30, 31, 32] define the role of surveillance bias in VTE outcomes reporting,[33, 34, 35] discover and fully explore the important problem of missed doses of VTE prophylaxis,[18, 21, 22, 23, 36] and summarize knowledge about VTE prevention via systematic reviews and meta‐analyses.[37, 38, 39] These collaborations have been a classic win‐win. The mentees learn critical skills while growing their curriculum vitae with contributions to the literature, allowing them to progress in their careers (ie, obtain a residency match, faculty positions). The faculty have leveraged this work to obtain over $3 million in extramural funding to develop interventions to study and improve the quality of VTE preventive care for hospitalized patients.
In healthcare, we have not yet achieved defect‐free VTE prevention; however, we have a better understanding of the path to accomplishing this goal. In this article we describe our goal of zero harm from VTE and our learning journey to realize that goal. Although the journey never ends, a critical ingredient to the success of our program has been the multidisciplinary nature of our VTE collaborative team. The combination of expertise from medicine, surgery, nursing, pharmacy, clinical informatics, and public health has facilitated the development of innovative strategies to improve VTE prevention that integrate seamlessly into clinical workflow. The approach used for VTE can be applied to eliminate other types of harms.
Disclosures
Mr. Lau, Dr. Streiff, and Dr. Haut are supported by a grant from the Agency for Healthcare Research and Quality (1R01HS024547) titled Individualized Performance Feedback on Venous Thromboembolism Prevention Practice and a contract from the Patient‐Centered Outcomes Research Institute titled Preventing Venous Thromboembolism: Empowering Patients and Enabling Patient‐Centered Care via Health Information Technology (CE‐12‐11‐4489). Mr. Lau is supported by the Institute for Excellence in Education Berkheimer Faculty Education Scholar Grant and a contract (AD‐1306‐03980) from the Patient‐Centered Outcomes Research Institute titled Patient Centered Approaches to Collect Sexual Orientation/Gender Identity Information in the Emergency Department. Ms. Hobson has given expert witness testimony in various medical malpractice cases. Dr. Streiff has received research funding from Portola and Janssen; consulted for Bio2Medical, CSL Behring, Merck, and Janssen HealthCare; and has given expert witness testimony in various medical malpractice cases. Dr. Haut receives royalties from Lippincott, Williams, and Wilkins for a book titled Avoiding Common ICU Errors. Dr. Haut is a paid consultant and speaker for the Preventing Avoidable Venous ThromboembolismEvery Patient, Every Time VHA/Vizient IMPERATIV Advantage Performance Improvement Collaborative. Dr. Haut is a paid consultant and speaker for the Illinois Surgical Quality Improvement Collaborative. All other authors report no disclosures.
- , . Thromboprophylaxis in nonsurgical patients. Hematology Am Soc Hematol Educ Program. 2012;2012:631–637.
- Office of the Surgeon General (US); National Heart, Lung, and Blood Institute (US). The Surgeon General's Call to Action to Prevent Deep Vein Thrombosis and Pulmonary Embolism. Rockville, MD: Office of the Surgeon General; 2008.
- , . Prevention of venous thromboembolism: brief update review. In: Making Health Care Safer II: An Updated Critical Analysis of the Evidence for Patient Safety Practices. Rockville, MD: Agency for Healthcare Research and Quality; 2013.
- , , , et al. The top patient safety strategies that can be encouraged for adoption now. Ann Intern Med. 2013;158:365–368.
- , . Practices to prevent venous thromboembolism: a brief review. BMJ Qual Saf. 2014;23:187–195.
- , , , et al. Venous thromboembolism risk and prophylaxis in the acute hospital care setting (ENDORSE study): a multinational cross‐sectional study. Lancet. 2008;371:387–394.
- , . The CMS ruling on venous thromboembolism after total knee or hip arthroplasty: weighing risks and benefits. JAMA. 2009;301:1063–1065.
- , , , et al. ICD‐9 code‐based venous thromboembolism performance targets fail to measure up. Am J Med Qual. 2016;31(5):448–453.
- , , , , . Evidence‐based venous thromboembolism prophylaxis is associated with a six‐fold decrease in numbers of symptomatic venous thromboembolisms in rehabilitation inpatients. PM R. 2011;3:1111–1115.e1.
- , , . Translating evidence into practice: a model for large scale knowledge translation. BMJ. 2008;337:a1714.
- , , , et al. Lessons from the Johns Hopkins Multi‐Disciplinary Venous Thromboembolism (VTE) Prevention Collaborative. BMJ. 2012;344:e3935.
- , , , et al. Improved prophylaxis and decreased rates of preventable harm with the use of a mandatory computerized clinical decision support tool for prophylaxis for venous thromboembolism in trauma. Arch Surg. 2012;147:901–907.
- , , , et al. Impact of a venous thromboembolism prophylaxis “smart order set”: improved compliance, fewer events. Am J Hematol. 2013;88(7):545–549.
- , , , et al. Eliminating health care disparities with mandatory clinical decision support: the venous thromboembolism (VTE) example. Med Care. 2015;53:18–24.
- , , , et al. Use of provider‐level dashboards and pay‐for‐performance in venous thromboembolism prophylaxis. J Hosp Med. 2015;10:172–178.
- , , , , , . Attending physician performance measure scores and resident physicians' ordering practices. JAMA Surg. 2015;150:813–814.
- , , , et al. Individualized performance feedback to surgical residents improves appropriate venous thromboembolism prophylaxis prescription and reduces potentially preventable VTE: a prospective cohort study [published online November 25, 2015]. Ann Surg. doi: 10.1097/SLA.0000000000001512.
- , , , et al. Patterns of non‐administration of ordered doses of venous thromboembolism prophylaxis: implications for novel intervention strategies. PLoS One. 2013;8:e66311.
- , , , et al. Preventability of hospital‐acquired venous thromboembolism. JAMA Surg. 2015;150(9):912–915.
- , , , et al. Correlation of missed doses of enoxaparin with increased incidence of deep vein thrombosis in trauma and general surgery patients. JAMA Surg. 2014;149:365–370.
- , , , et al. Prescriber knowledge and attitudes regarding non‐administration of prescribed pharmacologic venous thromboembolism prophylaxis [published online May 21, 2016]. J Thromb Thrombolysis. doi:10.1007/s11239-016-1378-8.
- , , , et al. Hidden barriers to delivery of pharmacological venous thromboembolism prophylaxis: the role of nursing beliefs and practices. J Patient Saf. 2016;12:63–68.
- , , , et al. Patient preferences regarding pharmacologic venous thromboembolism prophylaxis. J Hosp Med. 2015;10:108–111.
- , , , et al. Patient preferences for receiving education on venous thromboembolism prevention—a survey of stakeholder organizations. PLoS One. 2016;11:e0152084.
- , , , , , . Are sequential compression devices commonly associated with in‐hospital falls? A myth‐busters review using the patient safety net database. J Patient Saf. 2011;7:77–79.
- , , , , . No association between hospital‐reported perioperative venous thromboembolism prophylaxis and outcome rates in publicly reported data. JAMA Surg. 2014;149:400–401.
- , , , , . Linking processes and outcomes: a key strategy to prevent and report harm from venous thromboembolism in surgical patients. JAMA Surg. 2013;148:299–300.
- , , , et al. Hazards of benchmarking complications with the National Trauma Data Bank: numerators in search of denominators. J Trauma. 2008;64:273–277; discussion 277–279.
- , , , et al. Is the meaningful use venous thromboembolism VTE‐6 measure meaningful? A retrospective analysis of one hospital's VTE‐6 cases. Jt Comm J Qual Patient Saf. 2016;42(9):410–416.
- , , , et al. Is venous thromboembolism in colorectal surgery patients preventable or inevitable? One institution's experience. J Am Coll Surg. 2013;216:395–401.e1.
- , , , et al. Venous thromboembolic prophylaxis after a hepatic resection: patterns of care among liver surgeons. HPB (Oxford). 2014;16:892–898.
- , , , et al. Defining incidence and risk factors of venous thromboembolism after hepatectomy. J Gastrointest Surg. 2014;18:1116–1124.
- , , , et al. Can increased incidence of deep vein thrombosis (DVT) be used as a marker of quality of care in the absence of standardized screening? The potential effect of surveillance bias on reported DVT rates after trauma. J Trauma. 2007;63:1132–1135; discussion 1135–1137.
- , . Surveillance bias in outcomes reporting. JAMA. 2011;305:2462–2463.
- , , , et al. Surveillance bias and deep vein thrombosis in the national trauma data bank: the more we look, the more we find. J Trauma. 2008;64:932–936; discussion 936–937.
- , , , et al. Nonadministration of thromboprophylaxis in hospitalized patients with HIV: a missed opportunity for prevention? J Hosp Med. 2014;9:215–220.
- , , , et al. Pharmacologic and mechanical prophylaxis of venous thromboembolism among special populations. Comparative effectiveness review No. 116. Prepared by the Johns Hopkins University Evidence‐based Practice Center under Contract No. 290‐2007‐10061‐I.) AHRQ Publication No. 13‐EHC082–1. Rockville, MD: Agency for Healthcare Research and Quality; 2013.
- , , , et al. Pharmacologic and mechanical strategies for preventing venous thromboembolism after bariatric surgery: a systematic review and meta‐analysis. JAMA Surg. 2013;148:675–686.
- , , , et al. The effectiveness of prophylactic inferior vena cava filters in trauma patients: a systematic review and meta‐analysis. JAMA Surg. 2014;149:194–202.
© 2016 Society of Hospital Medicine

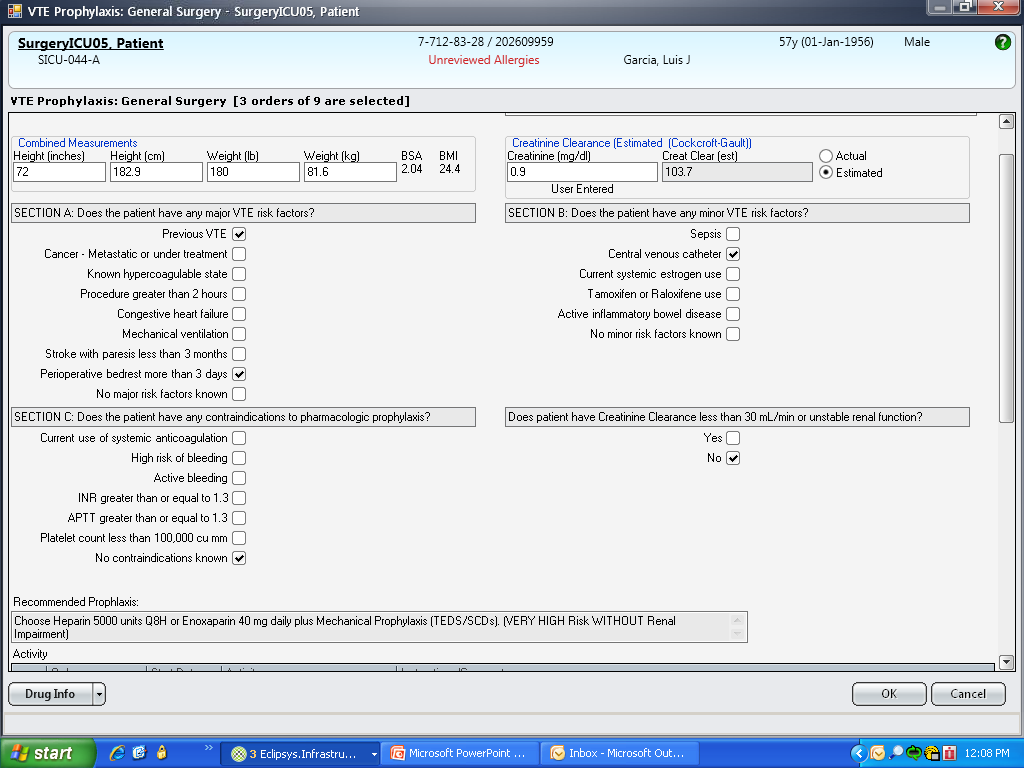
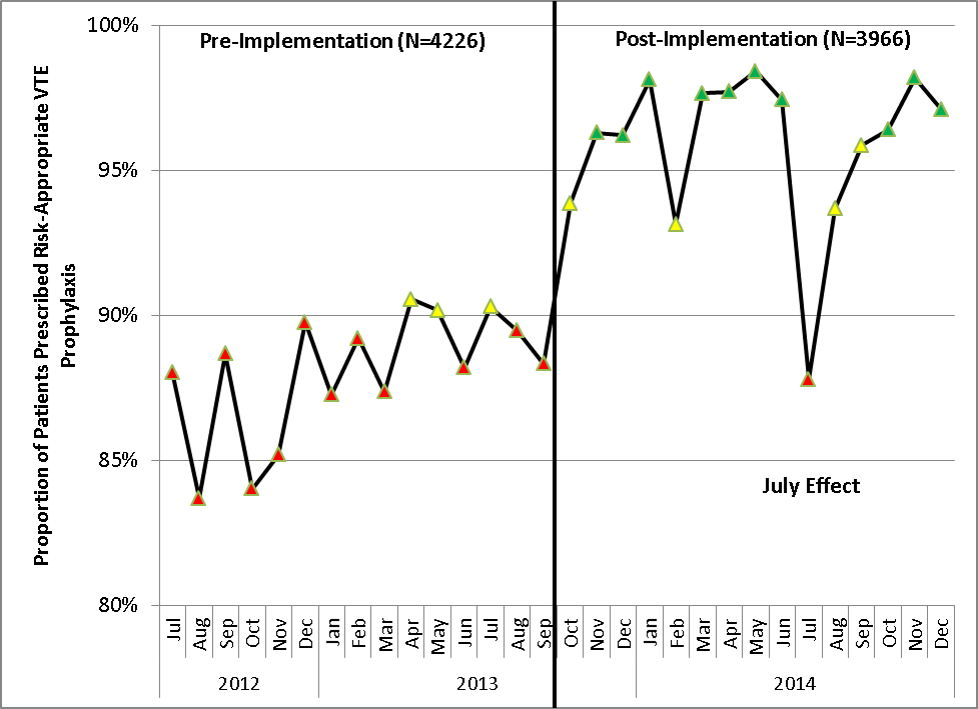
ICU Characteristics in Michigan
Organization of physician services in intensive care units (ICUs) varies widely and influences mortality, morbidity, and costs of care. Intensive care provided by intensivists in a high‐intensity physician staffing model, in which intensivists are the sole attending physicians or consult on all patients, has been associated with desirable outcomes such as decreased length of stay, resource utilization, and mortality.1‐4 As a result, higher intensity ICU models have been recommended by various healthcare agencies, including the National Quality Forum and the Leapfrog Group.5‐7
One national survey indicated that 47% of ICUs surveyed had some intensivist coverage and only 4% of intensive care units met Leapfrog high‐intensity model standards.8 However, only one‐third of ICUs responded to this survey, smaller ICUs were overrepresented, and the survey may not have reflected the influence of newer policy initiatives because it was conducted in 1997. Though the attributes by which intensivists improve patient outcomes is unknown, researchers have suggested it is by having a knowledgeable physician present in the ICU, having a physician communicate with other clinicians and families, and by having a physician who manages the ICU by writing policies and procedures and administrative activities.9
Results have been conflicting as patients managed by intensivists have also been found to have an increased mortality, particularly when managed on an elective consultation basis in an open ICU, where patient orders are written by several physician specialties.10, 11 Alternative ICU staffing models, such as the use of hospitalists, have been utilized to compensate for the intensivist workforce shortage. Hospitalists often provide ICU care, although they are seldom board‐certified in critical care. Hospitalist care has been shown to provide clinical and efficiency benefits such as decreased length of hospital stay.12‐14
Understanding the manner in which critical care is currently delivered, particularly the utilization of intensivist and nonintensivist care providers, can provide insights into subsequent allocation of a limited intensivist workforce as nonintensivist care providers such as hospitalists become more available. To understand how intensivists and other practitioners, such as hospitalists, deliver critical care in Michigan, we performed a cross‐sectional survey of Michigan hospitals participating in the Keystone ICU project, a statewide quality‐improvement initiative.
Methods
The hospitals involved and the methods of Keystone ICU have been published previously.15 The Keystone ICU project is a collaborative quality improvement initiative first organized in October 2003 by the Michigan Health and Hospitals Association (MHA) Keystone Center for Patient Safety and Quality. At its inception, 103 ICUs voluntarily agreed to participate in Keystone ICU and reported data representing 85% of ICU beds in Michigan. Nonparticipating hospitals (n = 37) were smaller, 79% having fewer than 100 beds, many of which did not have ICUs. All ICUs from the 72 hospitals participating in the Keystone ICU project as of July 2005 were asked to complete surveys as part of ongoing data collection.
Keystone ICU sought to improve safety culture, increase adherence to evidence‐based practices among patients receiving mechanical ventilation, and reduce central lineassociated bloodstream infections and ventilator‐associated pneumonia through a number of interventions. Keystone also encouraged teams to standardize their physician staffing, and presented teams with evidence regarding the benefits of ICU physician staffing. Because many of the ICUs were small and believed it was not practical to staff their ICUs with intensivists, Keystone encouraged ICUs to create as many of the attributes of intensivist staffing as possible: having someone present who is knowledgeable, able to manage at the unit level, and who communicates well with clinicians and families.9 As part of this project, we developed a survey to describe the physician staffing in Michigan ICUs. Additional elements of the survey sought to ascertain how medical decision‐making occurred, which decisions were made by what types of clinicians, and who performed various procedures in the ICU.
Survey Development
The survey for this study was developed based on expert opinion and on previous work by the research team (A.D.A., P.J.P., S.A.F.). The survey was pilot tested in a small group of non‐Michigan hospitals and found to be understandable and readable. The survey was then revised and disseminated to all hospitals participating in the Keystone ICU project. Construct validity was determined by review of literature and discussion with the research team (A.D.A., P.J.P., S.A.F., R.C.H.). Content validity was determined by the pilot test, which included interviews with the individuals who pilot‐tested the survey. The survey sought to describe the organization of ICU physician services (including both intensivist and nonintensivist). A copy of the survey is available upon request.
Survey Protocol
Surveys were sent by e‐mail to the official nurse and/or physician project leader at each site in July 2005 from contact information provided by MHA. Another copy of the survey was emailed to ICUs that did not respond to the initial survey after 3 months and, if needed, a third survey was sent at 6 months with a follow‐up telephone call by 1 of the investigators (R.C.H.). The completed surveys were returned to MHA for compilation and analysis. The research project was reviewed by the University of Michigan Institutional Review Board and determined to be exempt from ongoing IRB review per federal exemption category 45 CFR 46.101.(b). The funder was not involved in the design of the study, collection, analysis, and interpretation of the data, or the decision to approve publication of the finished manuscript.
Statistical Analysis
Survey respondents were first characterized using simple univariable and bivariable methods. When appropriate, groups were compared based on chi‐square, Mann‐Whitney U test, or t test. Additionally, a series of multivariable analyses was performed, which sought to understand structural factors associated with the presence of higher‐intensity models, as well as use of hospitalists or intensivists. Results of the multivariate analysis are reported as odds ratios (ORs) and 95% confidence intervals (CIs). The critical region was defined as an alpha of 0.05. Statistical analysis was performed using SAS (version 9.1; SAS Institute, Inc., Cary, NC).
Results
Response Rate
Ninety‐seven responses were received, including at least 1 response from every Keystone ICU hospital located in Michigan. Because our goal was to describe the organization of ICU physician services in non‐Federal hospitals, 1 Michigan VA hospital was eliminated from further consideration. Four hospitals with more than 1 ICU, which delivered care identically in all of their ICUs, provided 1 response and were counted as 1 site. As a result, 96 survey responses representing 115 ICUs in 72 Michigan hospitals were each counted as 1 site in the analysis. This included responses from ICUs not included in earlier analyses, which joined Keystone ICU after earlier work had been underway.15
Baseline Demographics
The mean (standard deviation [SD]) hospital size represented in the survey was 280 (22) beds, with a median of 249 (range, 40‐1031) beds. The mean size (SD) of the ICU was 13.3 (7.0) beds, median 12 beds, range 4 to 42 beds. There were 16 ICUs dedicated exclusively to the care of medicine patients, 14 dedicated surgical units, 8 dedicated cardiac ICUs, and 3 dedicated Neuro ICUs. The remainder had a mixed patient population. Seventy‐one ICUs (74%) cared for medical patients, 69 (72%) cared for surgical patients, 64 (67%) cared for cardiac patients, and 52 (53%) cared for neurological patients.
ICU Staffing Models
To better understand the role of intensivists in critical care delivery in Michigan, we examined differences in sites where patients are managed as closed sites exclusively by intensivists (closed ICU sites) in comparison to ICUs that had multiple attending specialties (open ICU sites). In addition, ICU sites where intensivists made most clinical decisionsa circumstance likely reflecting a high‐intensity staffing model of care5were compared with ICUs sites where decision‐making was made by nonintensivists or was shared (Table 1). Twenty‐four of 96 (25%) ICU sites were closed, and only intensivists served as the attending of record. Hospitals with closed ICUs or in which intensivists made most clinical decisions were larger and had larger ICUs than sites with open ICUs or with nonintensivist decision‐making (P < 0.05). These 24 closed sites represented 17 of 72 hospitals (24%), with the remainder of hospitals (76%) not having closed ICUs. Intensivists participated in rounds in 43 of 72 sites (60%) that were not closed. House officer participation in the care of ICU patients was not related to the presence or absence of intensivists (2 = 0.04; P = 0.847), although the average size of hospitals with house officers was larger than those without house officers (P < 0.0001).
| Closed ICUs (n = 24) [n (%)] | Open ICUs (n = 72) [n (%)] | Intensivist Decision‐making (n = 30) [n (%)] | Shared Decision‐making (n = 31) [n (%)] | Nonintensivist Decision‐making (n = 34) [n (%)] | |
|---|---|---|---|---|---|
| |||||
| ICU beds (mean SD) | 21.8 15.3* | 15.2 13.0* | 21.3 18.7* | 19.2 13.4 | 10.5 5.2* |
| Hospital beds (mean SD) | 489.8 295.3* | 326.3 222.6* | 460.8 222.3* | 408.6 259.7 | 247.8 230.0* |
| Nonintensivist attendings | |||||
| Hospitalist | 34 (47.2) | 9 (30) | 14 (45.1) | 13 (38.2) | |
| Primary care physician | 55 (76.4) | 11 (36.7) | 23 (74.2) | 27 (79.4) | |
| Cardiologist | 54 (75) | 10 (33.3) | 25 (80.6) | 23 (67.6) | |
| Pulmonologist | 34 (47.2) | 9 (30) | 15 (48.3) | 15 (44.1) | |
| Other IM specialist | 48 (66.7) | 11 (36.7) | 25 (80.6) | 17 (50) | |
| Surgeon | 59 (81.9) | 14 (46.7) | 25 (80.6) | 27 (79.4) | |
| Critical care board certification (% of attending physicians) | (n = 28) | (n = 31) | (n = 33) | ||
| 100 | 11 (45.8) | 7 (10.1) | 11 (39.3) | 6 (19.4) | 0 (0) |
| 75 | 3 (12.5) | 6 (8.7) | 7 (25.0) | 2 (6.5) | 0 (0) |
| 50 | 2 (8.3) | 4 (5.8) | 3 (10.7) | 2 (6.5) | 1 (3.0) |
| <50 | 8 (33.3) | 52 (75.4) | 7 (25.0) | 21 (67.7) | 32 (97.0) |
| ICU administration | |||||
| ICU director financial support | 18 (75.0) | 49 (68.1) | 25 (83.3) | 23 (74.2) | 18 (52.9) |
| Meeting with ICU team | 21 (87.5) | 56 (77.8) | 26 (86.7) | 27 (87.1) | 23 (67.7) |
| M&M sessions | 9 (37.5) | 33 (45.8) | 16 (53.3) | 12 (38.7) | 14 (41.2) |
Multivariate analysis determined that the presence of hospitalists serving as attending physicians was strongly associated with an open ICU (OR = 12.2; 95%CI = 2.5‐60.2), as was the absence of intensivists at the site (OR = 12.2; 95%CI = 1.4‐105.8), while ICU and hospital size were not associated. When the analyses were limited to hospitals with intensivists (n = 69), decision‐making by intensivists was not associated with ICU or hospital size (OR = 1.0; 95%CI = 1.0‐1.0); or whether hospitalists acted as attendings (OR = 0.7; 95%CI = 0.2‐2.0).
Board Certification and ICU Administration
Only 18 sites (20%) acknowledged that 100% of their ICU attending physicians were board‐certified in critical care, with nearly two‐thirds of sites having fewer than 50% critical‐care board‐certified attending physicians (Table 1). The medical director of the ICU met for an administrative meeting with the ICU team of nurses, respiratory therapists, and other personnel on a regular (ie, at least quarterly) basis at 77 sites (80%) and held regular morbidity and mortality sessions to discuss ICU care with other physicians who work in the ICU at 43 sites (45%). The majority of sites (n = 67; 70%) provided salary support for the ICU medical director.
Critical‐care board‐certification was more common at sites with closed ICUs and at sites where decision‐making was performed by intensivists (P < 0.001). However, board‐certification was not uniform in closed ICUs (100% certification = 46%, >50% certification = 67%) or in ICUs where intensivists made most decisions (100% certification = 39%, >50% certification = 75%).
Hospitals in which hospitalists served as attending physicians were less likely to have 50% or greater critical‐care board‐certification in their ICU (OR = 0.13; 95%CI = 0.03‐0.50). ICU size, hospital size, and years in practice were not associated with critical‐care board‐certification. Hospital size, ICU size, and the presence of intensivists or hospitalists were not associated with whether the medical director receives support from the hospital.
Physician Extenders
Nineteen sites (20%) reported the utilization of advanced practice nurses; 15 sites (16%) reported use of physician assistants; and 7 sites (7%) reported use of both advance practice nurses and physician assistants to provide intensive care. Physician extenders were not more likely to work in closed ICUs (10/24) than in open ICUs (14/72) (2 = 3.63; P = 0.57).
Of the 27 sites reporting use of advanced practice nurses or physician assistants, the role of physician extenders was described as being similar to physicians in 8 sites (30%), somewhat autonomous but with limitations in 18 (67%), and in a role closer to a ward clerk or assistant in 1 site (4%). The activities of physician extenders included writing orders at 24 of these 27 sites (89%); writing progress notes at 25 sites (92%); communicating with consultants at 24 (89%) and with primary care physicians at 22 sites (82%); and coordinating discharge plans at 20 sites (74%). Physician extenders rounded alone at 16 sites (33%).
Clinical Activities
Intensivists participated in daily rounds at most sites (n = 67; 70%). Nonintensivists served as attending of record in 72 (75%) sites. Nonintensivist physicians participating in daily patient rounds were: surgeons (n = 66; 68% of sites), primary care physicians (n = 61; 64%), nonpulmonary internal medicine specialists (n = 53; 55%), cardiologists (n = 58; 60%), non‐critical‐care pulmonologists (n = 39; 41%), and hospitalists (n = 36; 38%). Intensivists were the primary decision‐makers at 30 sites (31%), nonintensivists at 34 (35%), and decision making was shared at 31 (32%).
At more than one‐half of sites, decisions regarding mechanical ventilation, the use of sedatives or paralytics, and the choice of vasopressor agents were made by intensivists, with other decisionssuch as the decision to call consultants, choice of antibiotics, or family meetingsshared between intensivists and nonintensivists more than 40% of the time (Table 2). During regular working hours, invasive procedures were performed by multiple clinicians, including house officers, intensivists, surgeons, and anesthesiologists and were not the province of any particular type of clinician (Table 3).
| Decision‐making | |||
|---|---|---|---|
| Intensivist n (%) | Nonintensivist n (%) | Shared n (%) | |
| |||
| Ventilator management | 62 (66.7) | 24 (25.8) | 7 (7.5) |
| Choice of ventilator weaning strategies | 64 (68.8) | 24 (25.8) | 5 (5.4) |
| Decision to extubate | 63 (68.5) | 24 (26.1) | 5 (5.4) |
| Choice of sedation or paralytic agents | 56 (65.1) | 24 (27.9) | 6 (7.0) |
| Choice of vasopressor agents | 47 (51.1) | 25 (27.1) | 20 (21.7) |
| Decision to call other consultants (eg, cardiology, infectious diseases) | 19 (20.4) | 31 (33.3) | 43 (46.2) |
| Choices related to more general medical management (eg, antibiotics, diabetes management) | 30 (32.2) | 25 (26.9) | 38 (40.1) |
| Family meetings, code status discussions | 26 (28.6) | 26 (28.6) | 39 (42.8) |
| Procedure | Hospitalist n (%) | Intensivist n (%) | Surgeon n (%) | Anesthesiologist n (%) | House Officer or Other MD n (%) | Other non‐MD n (%) |
|---|---|---|---|---|---|---|
| Arterial line placement | 15 (15.6) | 50 (52.1) | 40 (41.7) | 31 (32.3) | 59 (61.4) | 7 (7.3) |
| Femoral venous line placement | 14 (14.6) | 54 (56.3) | 42 (43.8) | 17 (17.7) | 55 (57.3) | 4 (4.2) |
| Subclavian or internal jugular line placement | 14 (14.6) | 54 (56.2) | 47 (49.0) | 25 (26.0) | 62 (64.6) | 5 (5.2) |
| Pulmonary artery catheterization | 8 (8.3) | 56 (58.3) | 24 (25.0) | 21 (21.9) | 54 (56.2) | 2 (2.1) |
| Intubation | 14 (14.6) | 47 (49.0) | 14 (14.6) | 74 (77.1) | 42 (43.8) | 15 (15.6) |
| Bronchoscopy | 2 (2.1) | 67 (69.8) | 17 (17.7) | 5 (5.2) | 29 (30.2) | 0 (0) |
Regardless of the staffing model employed, the majority of sites (88%) provided care on a call‐based, rather than shift‐based system. Nighttime admissions and cross‐coverage issues were handled by house officers at more than one‐third of sites, with nonintensivist house physicians performing these tasks at 15% of sites (Table 4). Intensivists managed cross‐coverage issues by telephone at 29% of sites, and saw new admissions in person after hours at 8% of sites. Intensivists did not deliver care in scheduled shifts at any of these sites.
| Care Provider | Nighttime Admissions n (%) | Cross‐coverage n (%) |
|---|---|---|
| ||
| Emergency room physician | 13 (13.5) | 8 (8.3) |
| House physician | 15 (15.6) | 17 (17.7) |
| House officer | 42 (43.8) | 37 (38.5) |
| ICU nurse | 5 (5.2) | 10 (10.4) |
| PA or NP | 8 (8.3) | 5 (5.2) |
| Intensivist in person | 8 (8.3) | |
| Intensivist by telephone | 28 (29.2) | |
| Other | 9 (9.4) | 9 (9.4) |
Discussion
As all Keystone ICU participating sites responded to the questionnaire, we believe these results to be representative of critical care practice in the state of Michigan at the present time. Michigan ICU staffing structures are variable. Only a minority (25%) of Michigan Keystone ICU sites operated in an environment where intensivists are the only attending physicians of record. Although intensivists rounded in 60% of sites not utilizing a closed model, 75% of sites had nonintensivist attending physicians, with primary care physicians and hospitalists commonly providing ICU services. The utilization of hospitalists to provide critical care services was found in the absence of intensivists, regardless of hospital or ICU size.
Closed ICUs were seen in larger hospitals and in larger ICUs. This finding is similar to data obtained on a national level.8‐16 A high‐intensity model of care was also uncommon, although decision‐making was at least shared between intensivists and nonintensivists at two‐thirds of sites. These findings are in keeping with the observation that intensivist‐directed care advocated by the Leapfrog Group has not been widely implemented,17 including in Michigan, a regional rollout leader for the Leapfrog Group.
Fewer ICUs reported utilizing a nonintensivist model than was reported in the survey by Angus et al.,8 where approximately one‐half of ICUs delivered care in this manner. This survey was performed in 1997, prior to the launch of the Leapfrog Group effort, and may have reflected a relative over representation of smaller, general ICUs. Our study is the first statewide analysis of critical care practices in the postLeapfrog Group era. Our finding that an array of approaches to critical care delivery existed in Michigan, even when intensivists rounded on patients, is similar to that found among Leapfrog‐compliant hospitals sampled from several regions of the United States.18
Other than intensivists, surgeons, primary care, and hospitalist physicians provided care in Michigan ICUs. The hospitalist movement is relatively new.19 However, in our survey 37.5% of sites had hospitalists serving as attending physicians. Although the closed ICU model was more prevalent in larger ICUs and hospitals, the use of a hospitalist model to staff ICUs was not related to hospital size, but was instead a function of whether or not intensivists were present in a given setting. In lieu of a projected shortage of intensivists, we believe this confirms the crucial role that hospitalists will play in the provision of critical care services in the future.
The attributes of intensivist care that led to improved outcomes in previous studies1‐4 are unknown. To the extent that the involvement of intensivists on an elective rather than mandatory consultative basis may explain the higher mortality found in 1 recent study,1011 we hypothesize that having a knowledgeable physician present who communicates with clinicians and families and manages at the unit level is an important factor leading to improved outcomes. While hospitalists can have these attributes, their knowledge of specific critical care therapies and technologies may vary with the extent of their ICU training and experience. Further research should seek to quantify the attributes by which intensivists are associated with improved outcomes and seek ways to foster those attributes among hospitalists who participate in critical care delivery. Central to this will be ensuring that training programs ensure competency in critical care therapies and technologies among hospitalists and other non‐ICU physicians.
We recognize several limitations in this study. First, the validity of the survey may introduce misclassification of ICU staffing. However, the survey instrument was informed by previously‐validated instruments and experts in ICU physician staffing and hospitalist care. Second, we did not link variation in staffing to outcomes. While such analysis is important, it is beyond the scope of this survey. Third, our study was conducted in 1 state and the results may not be generalizable across the United States. Nevertheless, Michigan is a large state with a diverse array of hospitals, and as our study sample broadly represented this diversity, we believe our results are likely to be generalizable.
In conclusion, few ICUs in Michigan are closed and many utilize nonintensivist critical‐care providers such as hospitalists, primary care providers, and physician extenders to deliver clinical care. Our findings have significant implications for future efforts at a national level that involve the training of hospitalists and their acceptance as critical care practitioners. We suggest future research involving intensive care delivery focus on the feasibility of training sufficient hospitalists to satisfy a growing need for critical care that cannot be filled by intensivists, along with strategic planning to insure the model of care provided is commensurate with the complexity of illness. Although this approach appears to be occurring in Michigan on an ad hoc basis, we believe coordination between larger, intensivist‐run ICUs and smaller, nonintensivist‐run ICUs should be formalized in order to optimize the delivery of intensive care.25
- ,,, et al.;the members of the American College of Critical Care Medicine Task Force on Models for the Definition of an Intensivist and the Practice of Critical Care Medicine. Critical care delivery in the intensive care unit: defining clinical roles and the best practice model.Crit Care Med.2001;29;2007–2019.
- ,,, et al.Effects of organizational change in the medical intensive care unit of a teaching hospital: a comparison of “open” and “closed” formats.JAMA.1996;276:24–31.
- ,,, et al.A “closed” medical intensive care unit (MICU) improves resource utilization when compared with an “open” MICU.Am J Respir Crit Care Med.1998;157:1468–1473.
- ,,, et al.Effects of an organized critical care service on outcomes and resource utilization: a cohort study.Crit Care Med.1999;27:270–274.
- ,,,,,.Physician staffing patterns and clinical outcomes in critically ill patients.JAMA.2002;288:2151–2162.
- Leapfrog Group. Leapfrog Group Factsheet: ICU physician staffing (IPS). Available at: http://www.leapfroggroup.org/media/file/Leapfrog‐ICU_ Physician_Staffing_Fact_Sheet.pdf. Accessed June 2009.
- National Quality Forum. Safe Practices for Better Healthcare. Available at: http://www.qualityforum.org/pdf/reports/safe_practices.pdf. Accessed June 2009.
- ,,,,,; on behalf of the Committee on Manpower for Pulmonary and Critical Care Societies (COMPACCS).Critical care delivery in the United States: distribution of services and compliance with Leapfrog recommendations.Crit Care Med.2006;34:1016–1024.
- ,,, et al.Team care: beyond open and closed intensive care units.Curr Opin Crit Care.2006;12:604–608.
- ,,,,,.Association between critical care physician management and patient mortality in the intensive care unit.Ann Intern Med.2008;148:801–809.
- ,.Are intensivists safe?Ann Intern Med.2008;148:877–878.
- ,,,,,.Implementation of a voluntary hospitalist service at a community teaching hospital: improved clinical efficiency and patient outcomes.Ann Intern Med.2002;137:859–865.
- ,,, et al.Effects of physician experience on costs and outcomes on an academic general medicine service: results of a trial of hospitalists.Ann Intern Med.2002;137:866–874.
- ,,,,,.Outcomes of care by hospitalists, general internists and family physicians.N Engl J Med.2007;357:2589–2600.
- ,,, et al.An intervention to decrease catheter‐related bloodstream infections in the ICU.N Engl J Med.2006;355:2725–2732.
- ,,, et al.Descriptive analysis of critical care units in the United States.Crit Care Med.1992;20:846–863.
- .Leapfrog and critical care: evidence‐ and reality‐based intensive care for the 21st century.Am J Med.2004;116:188–193.
- ,,,,.The organization of intensive care unit physician services.Crit Care Med.2007;35:2256–2261.
- ,.The evolution of the hospitalist movement in the USA.Clin Med.2002;2:327–330.
- ,,, et al.Guidelines on critical care services and personnel: recommendations based on a system of categorization of three levels of care.Crit Care Med.2003;31:2677–2683.
Organization of physician services in intensive care units (ICUs) varies widely and influences mortality, morbidity, and costs of care. Intensive care provided by intensivists in a high‐intensity physician staffing model, in which intensivists are the sole attending physicians or consult on all patients, has been associated with desirable outcomes such as decreased length of stay, resource utilization, and mortality.1‐4 As a result, higher intensity ICU models have been recommended by various healthcare agencies, including the National Quality Forum and the Leapfrog Group.5‐7
One national survey indicated that 47% of ICUs surveyed had some intensivist coverage and only 4% of intensive care units met Leapfrog high‐intensity model standards.8 However, only one‐third of ICUs responded to this survey, smaller ICUs were overrepresented, and the survey may not have reflected the influence of newer policy initiatives because it was conducted in 1997. Though the attributes by which intensivists improve patient outcomes is unknown, researchers have suggested it is by having a knowledgeable physician present in the ICU, having a physician communicate with other clinicians and families, and by having a physician who manages the ICU by writing policies and procedures and administrative activities.9
Results have been conflicting as patients managed by intensivists have also been found to have an increased mortality, particularly when managed on an elective consultation basis in an open ICU, where patient orders are written by several physician specialties.10, 11 Alternative ICU staffing models, such as the use of hospitalists, have been utilized to compensate for the intensivist workforce shortage. Hospitalists often provide ICU care, although they are seldom board‐certified in critical care. Hospitalist care has been shown to provide clinical and efficiency benefits such as decreased length of hospital stay.12‐14
Understanding the manner in which critical care is currently delivered, particularly the utilization of intensivist and nonintensivist care providers, can provide insights into subsequent allocation of a limited intensivist workforce as nonintensivist care providers such as hospitalists become more available. To understand how intensivists and other practitioners, such as hospitalists, deliver critical care in Michigan, we performed a cross‐sectional survey of Michigan hospitals participating in the Keystone ICU project, a statewide quality‐improvement initiative.
Methods
The hospitals involved and the methods of Keystone ICU have been published previously.15 The Keystone ICU project is a collaborative quality improvement initiative first organized in October 2003 by the Michigan Health and Hospitals Association (MHA) Keystone Center for Patient Safety and Quality. At its inception, 103 ICUs voluntarily agreed to participate in Keystone ICU and reported data representing 85% of ICU beds in Michigan. Nonparticipating hospitals (n = 37) were smaller, 79% having fewer than 100 beds, many of which did not have ICUs. All ICUs from the 72 hospitals participating in the Keystone ICU project as of July 2005 were asked to complete surveys as part of ongoing data collection.
Keystone ICU sought to improve safety culture, increase adherence to evidence‐based practices among patients receiving mechanical ventilation, and reduce central lineassociated bloodstream infections and ventilator‐associated pneumonia through a number of interventions. Keystone also encouraged teams to standardize their physician staffing, and presented teams with evidence regarding the benefits of ICU physician staffing. Because many of the ICUs were small and believed it was not practical to staff their ICUs with intensivists, Keystone encouraged ICUs to create as many of the attributes of intensivist staffing as possible: having someone present who is knowledgeable, able to manage at the unit level, and who communicates well with clinicians and families.9 As part of this project, we developed a survey to describe the physician staffing in Michigan ICUs. Additional elements of the survey sought to ascertain how medical decision‐making occurred, which decisions were made by what types of clinicians, and who performed various procedures in the ICU.
Survey Development
The survey for this study was developed based on expert opinion and on previous work by the research team (A.D.A., P.J.P., S.A.F.). The survey was pilot tested in a small group of non‐Michigan hospitals and found to be understandable and readable. The survey was then revised and disseminated to all hospitals participating in the Keystone ICU project. Construct validity was determined by review of literature and discussion with the research team (A.D.A., P.J.P., S.A.F., R.C.H.). Content validity was determined by the pilot test, which included interviews with the individuals who pilot‐tested the survey. The survey sought to describe the organization of ICU physician services (including both intensivist and nonintensivist). A copy of the survey is available upon request.
Survey Protocol
Surveys were sent by e‐mail to the official nurse and/or physician project leader at each site in July 2005 from contact information provided by MHA. Another copy of the survey was emailed to ICUs that did not respond to the initial survey after 3 months and, if needed, a third survey was sent at 6 months with a follow‐up telephone call by 1 of the investigators (R.C.H.). The completed surveys were returned to MHA for compilation and analysis. The research project was reviewed by the University of Michigan Institutional Review Board and determined to be exempt from ongoing IRB review per federal exemption category 45 CFR 46.101.(b). The funder was not involved in the design of the study, collection, analysis, and interpretation of the data, or the decision to approve publication of the finished manuscript.
Statistical Analysis
Survey respondents were first characterized using simple univariable and bivariable methods. When appropriate, groups were compared based on chi‐square, Mann‐Whitney U test, or t test. Additionally, a series of multivariable analyses was performed, which sought to understand structural factors associated with the presence of higher‐intensity models, as well as use of hospitalists or intensivists. Results of the multivariate analysis are reported as odds ratios (ORs) and 95% confidence intervals (CIs). The critical region was defined as an alpha of 0.05. Statistical analysis was performed using SAS (version 9.1; SAS Institute, Inc., Cary, NC).
Results
Response Rate
Ninety‐seven responses were received, including at least 1 response from every Keystone ICU hospital located in Michigan. Because our goal was to describe the organization of ICU physician services in non‐Federal hospitals, 1 Michigan VA hospital was eliminated from further consideration. Four hospitals with more than 1 ICU, which delivered care identically in all of their ICUs, provided 1 response and were counted as 1 site. As a result, 96 survey responses representing 115 ICUs in 72 Michigan hospitals were each counted as 1 site in the analysis. This included responses from ICUs not included in earlier analyses, which joined Keystone ICU after earlier work had been underway.15
Baseline Demographics
The mean (standard deviation [SD]) hospital size represented in the survey was 280 (22) beds, with a median of 249 (range, 40‐1031) beds. The mean size (SD) of the ICU was 13.3 (7.0) beds, median 12 beds, range 4 to 42 beds. There were 16 ICUs dedicated exclusively to the care of medicine patients, 14 dedicated surgical units, 8 dedicated cardiac ICUs, and 3 dedicated Neuro ICUs. The remainder had a mixed patient population. Seventy‐one ICUs (74%) cared for medical patients, 69 (72%) cared for surgical patients, 64 (67%) cared for cardiac patients, and 52 (53%) cared for neurological patients.
ICU Staffing Models
To better understand the role of intensivists in critical care delivery in Michigan, we examined differences in sites where patients are managed as closed sites exclusively by intensivists (closed ICU sites) in comparison to ICUs that had multiple attending specialties (open ICU sites). In addition, ICU sites where intensivists made most clinical decisionsa circumstance likely reflecting a high‐intensity staffing model of care5were compared with ICUs sites where decision‐making was made by nonintensivists or was shared (Table 1). Twenty‐four of 96 (25%) ICU sites were closed, and only intensivists served as the attending of record. Hospitals with closed ICUs or in which intensivists made most clinical decisions were larger and had larger ICUs than sites with open ICUs or with nonintensivist decision‐making (P < 0.05). These 24 closed sites represented 17 of 72 hospitals (24%), with the remainder of hospitals (76%) not having closed ICUs. Intensivists participated in rounds in 43 of 72 sites (60%) that were not closed. House officer participation in the care of ICU patients was not related to the presence or absence of intensivists (2 = 0.04; P = 0.847), although the average size of hospitals with house officers was larger than those without house officers (P < 0.0001).
| Closed ICUs (n = 24) [n (%)] | Open ICUs (n = 72) [n (%)] | Intensivist Decision‐making (n = 30) [n (%)] | Shared Decision‐making (n = 31) [n (%)] | Nonintensivist Decision‐making (n = 34) [n (%)] | |
|---|---|---|---|---|---|
| |||||
| ICU beds (mean SD) | 21.8 15.3* | 15.2 13.0* | 21.3 18.7* | 19.2 13.4 | 10.5 5.2* |
| Hospital beds (mean SD) | 489.8 295.3* | 326.3 222.6* | 460.8 222.3* | 408.6 259.7 | 247.8 230.0* |
| Nonintensivist attendings | |||||
| Hospitalist | 34 (47.2) | 9 (30) | 14 (45.1) | 13 (38.2) | |
| Primary care physician | 55 (76.4) | 11 (36.7) | 23 (74.2) | 27 (79.4) | |
| Cardiologist | 54 (75) | 10 (33.3) | 25 (80.6) | 23 (67.6) | |
| Pulmonologist | 34 (47.2) | 9 (30) | 15 (48.3) | 15 (44.1) | |
| Other IM specialist | 48 (66.7) | 11 (36.7) | 25 (80.6) | 17 (50) | |
| Surgeon | 59 (81.9) | 14 (46.7) | 25 (80.6) | 27 (79.4) | |
| Critical care board certification (% of attending physicians) | (n = 28) | (n = 31) | (n = 33) | ||
| 100 | 11 (45.8) | 7 (10.1) | 11 (39.3) | 6 (19.4) | 0 (0) |
| 75 | 3 (12.5) | 6 (8.7) | 7 (25.0) | 2 (6.5) | 0 (0) |
| 50 | 2 (8.3) | 4 (5.8) | 3 (10.7) | 2 (6.5) | 1 (3.0) |
| <50 | 8 (33.3) | 52 (75.4) | 7 (25.0) | 21 (67.7) | 32 (97.0) |
| ICU administration | |||||
| ICU director financial support | 18 (75.0) | 49 (68.1) | 25 (83.3) | 23 (74.2) | 18 (52.9) |
| Meeting with ICU team | 21 (87.5) | 56 (77.8) | 26 (86.7) | 27 (87.1) | 23 (67.7) |
| M&M sessions | 9 (37.5) | 33 (45.8) | 16 (53.3) | 12 (38.7) | 14 (41.2) |
Multivariate analysis determined that the presence of hospitalists serving as attending physicians was strongly associated with an open ICU (OR = 12.2; 95%CI = 2.5‐60.2), as was the absence of intensivists at the site (OR = 12.2; 95%CI = 1.4‐105.8), while ICU and hospital size were not associated. When the analyses were limited to hospitals with intensivists (n = 69), decision‐making by intensivists was not associated with ICU or hospital size (OR = 1.0; 95%CI = 1.0‐1.0); or whether hospitalists acted as attendings (OR = 0.7; 95%CI = 0.2‐2.0).
Board Certification and ICU Administration
Only 18 sites (20%) acknowledged that 100% of their ICU attending physicians were board‐certified in critical care, with nearly two‐thirds of sites having fewer than 50% critical‐care board‐certified attending physicians (Table 1). The medical director of the ICU met for an administrative meeting with the ICU team of nurses, respiratory therapists, and other personnel on a regular (ie, at least quarterly) basis at 77 sites (80%) and held regular morbidity and mortality sessions to discuss ICU care with other physicians who work in the ICU at 43 sites (45%). The majority of sites (n = 67; 70%) provided salary support for the ICU medical director.
Critical‐care board‐certification was more common at sites with closed ICUs and at sites where decision‐making was performed by intensivists (P < 0.001). However, board‐certification was not uniform in closed ICUs (100% certification = 46%, >50% certification = 67%) or in ICUs where intensivists made most decisions (100% certification = 39%, >50% certification = 75%).
Hospitals in which hospitalists served as attending physicians were less likely to have 50% or greater critical‐care board‐certification in their ICU (OR = 0.13; 95%CI = 0.03‐0.50). ICU size, hospital size, and years in practice were not associated with critical‐care board‐certification. Hospital size, ICU size, and the presence of intensivists or hospitalists were not associated with whether the medical director receives support from the hospital.
Physician Extenders
Nineteen sites (20%) reported the utilization of advanced practice nurses; 15 sites (16%) reported use of physician assistants; and 7 sites (7%) reported use of both advance practice nurses and physician assistants to provide intensive care. Physician extenders were not more likely to work in closed ICUs (10/24) than in open ICUs (14/72) (2 = 3.63; P = 0.57).
Of the 27 sites reporting use of advanced practice nurses or physician assistants, the role of physician extenders was described as being similar to physicians in 8 sites (30%), somewhat autonomous but with limitations in 18 (67%), and in a role closer to a ward clerk or assistant in 1 site (4%). The activities of physician extenders included writing orders at 24 of these 27 sites (89%); writing progress notes at 25 sites (92%); communicating with consultants at 24 (89%) and with primary care physicians at 22 sites (82%); and coordinating discharge plans at 20 sites (74%). Physician extenders rounded alone at 16 sites (33%).
Clinical Activities
Intensivists participated in daily rounds at most sites (n = 67; 70%). Nonintensivists served as attending of record in 72 (75%) sites. Nonintensivist physicians participating in daily patient rounds were: surgeons (n = 66; 68% of sites), primary care physicians (n = 61; 64%), nonpulmonary internal medicine specialists (n = 53; 55%), cardiologists (n = 58; 60%), non‐critical‐care pulmonologists (n = 39; 41%), and hospitalists (n = 36; 38%). Intensivists were the primary decision‐makers at 30 sites (31%), nonintensivists at 34 (35%), and decision making was shared at 31 (32%).
At more than one‐half of sites, decisions regarding mechanical ventilation, the use of sedatives or paralytics, and the choice of vasopressor agents were made by intensivists, with other decisionssuch as the decision to call consultants, choice of antibiotics, or family meetingsshared between intensivists and nonintensivists more than 40% of the time (Table 2). During regular working hours, invasive procedures were performed by multiple clinicians, including house officers, intensivists, surgeons, and anesthesiologists and were not the province of any particular type of clinician (Table 3).
| Decision‐making | |||
|---|---|---|---|
| Intensivist n (%) | Nonintensivist n (%) | Shared n (%) | |
| |||
| Ventilator management | 62 (66.7) | 24 (25.8) | 7 (7.5) |
| Choice of ventilator weaning strategies | 64 (68.8) | 24 (25.8) | 5 (5.4) |
| Decision to extubate | 63 (68.5) | 24 (26.1) | 5 (5.4) |
| Choice of sedation or paralytic agents | 56 (65.1) | 24 (27.9) | 6 (7.0) |
| Choice of vasopressor agents | 47 (51.1) | 25 (27.1) | 20 (21.7) |
| Decision to call other consultants (eg, cardiology, infectious diseases) | 19 (20.4) | 31 (33.3) | 43 (46.2) |
| Choices related to more general medical management (eg, antibiotics, diabetes management) | 30 (32.2) | 25 (26.9) | 38 (40.1) |
| Family meetings, code status discussions | 26 (28.6) | 26 (28.6) | 39 (42.8) |
| Procedure | Hospitalist n (%) | Intensivist n (%) | Surgeon n (%) | Anesthesiologist n (%) | House Officer or Other MD n (%) | Other non‐MD n (%) |
|---|---|---|---|---|---|---|
| Arterial line placement | 15 (15.6) | 50 (52.1) | 40 (41.7) | 31 (32.3) | 59 (61.4) | 7 (7.3) |
| Femoral venous line placement | 14 (14.6) | 54 (56.3) | 42 (43.8) | 17 (17.7) | 55 (57.3) | 4 (4.2) |
| Subclavian or internal jugular line placement | 14 (14.6) | 54 (56.2) | 47 (49.0) | 25 (26.0) | 62 (64.6) | 5 (5.2) |
| Pulmonary artery catheterization | 8 (8.3) | 56 (58.3) | 24 (25.0) | 21 (21.9) | 54 (56.2) | 2 (2.1) |
| Intubation | 14 (14.6) | 47 (49.0) | 14 (14.6) | 74 (77.1) | 42 (43.8) | 15 (15.6) |
| Bronchoscopy | 2 (2.1) | 67 (69.8) | 17 (17.7) | 5 (5.2) | 29 (30.2) | 0 (0) |
Regardless of the staffing model employed, the majority of sites (88%) provided care on a call‐based, rather than shift‐based system. Nighttime admissions and cross‐coverage issues were handled by house officers at more than one‐third of sites, with nonintensivist house physicians performing these tasks at 15% of sites (Table 4). Intensivists managed cross‐coverage issues by telephone at 29% of sites, and saw new admissions in person after hours at 8% of sites. Intensivists did not deliver care in scheduled shifts at any of these sites.
| Care Provider | Nighttime Admissions n (%) | Cross‐coverage n (%) |
|---|---|---|
| ||
| Emergency room physician | 13 (13.5) | 8 (8.3) |
| House physician | 15 (15.6) | 17 (17.7) |
| House officer | 42 (43.8) | 37 (38.5) |
| ICU nurse | 5 (5.2) | 10 (10.4) |
| PA or NP | 8 (8.3) | 5 (5.2) |
| Intensivist in person | 8 (8.3) | |
| Intensivist by telephone | 28 (29.2) | |
| Other | 9 (9.4) | 9 (9.4) |
Discussion
As all Keystone ICU participating sites responded to the questionnaire, we believe these results to be representative of critical care practice in the state of Michigan at the present time. Michigan ICU staffing structures are variable. Only a minority (25%) of Michigan Keystone ICU sites operated in an environment where intensivists are the only attending physicians of record. Although intensivists rounded in 60% of sites not utilizing a closed model, 75% of sites had nonintensivist attending physicians, with primary care physicians and hospitalists commonly providing ICU services. The utilization of hospitalists to provide critical care services was found in the absence of intensivists, regardless of hospital or ICU size.
Closed ICUs were seen in larger hospitals and in larger ICUs. This finding is similar to data obtained on a national level.8‐16 A high‐intensity model of care was also uncommon, although decision‐making was at least shared between intensivists and nonintensivists at two‐thirds of sites. These findings are in keeping with the observation that intensivist‐directed care advocated by the Leapfrog Group has not been widely implemented,17 including in Michigan, a regional rollout leader for the Leapfrog Group.
Fewer ICUs reported utilizing a nonintensivist model than was reported in the survey by Angus et al.,8 where approximately one‐half of ICUs delivered care in this manner. This survey was performed in 1997, prior to the launch of the Leapfrog Group effort, and may have reflected a relative over representation of smaller, general ICUs. Our study is the first statewide analysis of critical care practices in the postLeapfrog Group era. Our finding that an array of approaches to critical care delivery existed in Michigan, even when intensivists rounded on patients, is similar to that found among Leapfrog‐compliant hospitals sampled from several regions of the United States.18
Other than intensivists, surgeons, primary care, and hospitalist physicians provided care in Michigan ICUs. The hospitalist movement is relatively new.19 However, in our survey 37.5% of sites had hospitalists serving as attending physicians. Although the closed ICU model was more prevalent in larger ICUs and hospitals, the use of a hospitalist model to staff ICUs was not related to hospital size, but was instead a function of whether or not intensivists were present in a given setting. In lieu of a projected shortage of intensivists, we believe this confirms the crucial role that hospitalists will play in the provision of critical care services in the future.
The attributes of intensivist care that led to improved outcomes in previous studies1‐4 are unknown. To the extent that the involvement of intensivists on an elective rather than mandatory consultative basis may explain the higher mortality found in 1 recent study,1011 we hypothesize that having a knowledgeable physician present who communicates with clinicians and families and manages at the unit level is an important factor leading to improved outcomes. While hospitalists can have these attributes, their knowledge of specific critical care therapies and technologies may vary with the extent of their ICU training and experience. Further research should seek to quantify the attributes by which intensivists are associated with improved outcomes and seek ways to foster those attributes among hospitalists who participate in critical care delivery. Central to this will be ensuring that training programs ensure competency in critical care therapies and technologies among hospitalists and other non‐ICU physicians.
We recognize several limitations in this study. First, the validity of the survey may introduce misclassification of ICU staffing. However, the survey instrument was informed by previously‐validated instruments and experts in ICU physician staffing and hospitalist care. Second, we did not link variation in staffing to outcomes. While such analysis is important, it is beyond the scope of this survey. Third, our study was conducted in 1 state and the results may not be generalizable across the United States. Nevertheless, Michigan is a large state with a diverse array of hospitals, and as our study sample broadly represented this diversity, we believe our results are likely to be generalizable.
In conclusion, few ICUs in Michigan are closed and many utilize nonintensivist critical‐care providers such as hospitalists, primary care providers, and physician extenders to deliver clinical care. Our findings have significant implications for future efforts at a national level that involve the training of hospitalists and their acceptance as critical care practitioners. We suggest future research involving intensive care delivery focus on the feasibility of training sufficient hospitalists to satisfy a growing need for critical care that cannot be filled by intensivists, along with strategic planning to insure the model of care provided is commensurate with the complexity of illness. Although this approach appears to be occurring in Michigan on an ad hoc basis, we believe coordination between larger, intensivist‐run ICUs and smaller, nonintensivist‐run ICUs should be formalized in order to optimize the delivery of intensive care.25
- ,,, et al.;the members of the American College of Critical Care Medicine Task Force on Models for the Definition of an Intensivist and the Practice of Critical Care Medicine. Critical care delivery in the intensive care unit: defining clinical roles and the best practice model.Crit Care Med.2001;29;2007–2019.
- ,,, et al.Effects of organizational change in the medical intensive care unit of a teaching hospital: a comparison of “open” and “closed” formats.JAMA.1996;276:24–31.
- ,,, et al.A “closed” medical intensive care unit (MICU) improves resource utilization when compared with an “open” MICU.Am J Respir Crit Care Med.1998;157:1468–1473.
- ,,, et al.Effects of an organized critical care service on outcomes and resource utilization: a cohort study.Crit Care Med.1999;27:270–274.
- ,,,,,.Physician staffing patterns and clinical outcomes in critically ill patients.JAMA.2002;288:2151–2162.
- Leapfrog Group. Leapfrog Group Factsheet: ICU physician staffing (IPS). Available at: http://www.leapfroggroup.org/media/file/Leapfrog‐ICU_ Physician_Staffing_Fact_Sheet.pdf. Accessed June 2009.
- National Quality Forum. Safe Practices for Better Healthcare. Available at: http://www.qualityforum.org/pdf/reports/safe_practices.pdf. Accessed June 2009.
- ,,,,,; on behalf of the Committee on Manpower for Pulmonary and Critical Care Societies (COMPACCS).Critical care delivery in the United States: distribution of services and compliance with Leapfrog recommendations.Crit Care Med.2006;34:1016–1024.
- ,,, et al.Team care: beyond open and closed intensive care units.Curr Opin Crit Care.2006;12:604–608.
- ,,,,,.Association between critical care physician management and patient mortality in the intensive care unit.Ann Intern Med.2008;148:801–809.
- ,.Are intensivists safe?Ann Intern Med.2008;148:877–878.
- ,,,,,.Implementation of a voluntary hospitalist service at a community teaching hospital: improved clinical efficiency and patient outcomes.Ann Intern Med.2002;137:859–865.
- ,,, et al.Effects of physician experience on costs and outcomes on an academic general medicine service: results of a trial of hospitalists.Ann Intern Med.2002;137:866–874.
- ,,,,,.Outcomes of care by hospitalists, general internists and family physicians.N Engl J Med.2007;357:2589–2600.
- ,,, et al.An intervention to decrease catheter‐related bloodstream infections in the ICU.N Engl J Med.2006;355:2725–2732.
- ,,, et al.Descriptive analysis of critical care units in the United States.Crit Care Med.1992;20:846–863.
- .Leapfrog and critical care: evidence‐ and reality‐based intensive care for the 21st century.Am J Med.2004;116:188–193.
- ,,,,.The organization of intensive care unit physician services.Crit Care Med.2007;35:2256–2261.
- ,.The evolution of the hospitalist movement in the USA.Clin Med.2002;2:327–330.
- ,,, et al.Guidelines on critical care services and personnel: recommendations based on a system of categorization of three levels of care.Crit Care Med.2003;31:2677–2683.
Copyright © 2010 Society of Hospital Medicine