User login
Impact of Displaying Inpatient Pharmaceutical Costs at the Time of Order Entry: Lessons From a Tertiary Care Center
Secondary to rising healthcare costs in the United States, broad efforts are underway to identify and reduce waste in the health system.1,2 A recent systematic review exhibited that many physicians inaccurately estimate the cost of medications.3 Raising awareness of medication costs among prescribers is one potential way to promote high-value care.
Some evidence suggests that cost transparency may help prescribers understand how medication orders drive costs. In a previous study carried out at the Johns Hopkins Hospital, fee data were displayed to providers for diagnostic laboratory tests.4 An 8.6% decrease (95% confidence interval [CI], –8.99% to –8.19%) in test ordering was observed when costs were displayed vs a 5.6% increase (95% CI, 4.90% to 6.39%) in ordering when costs were not displayed during a 6-month intervention period (P < 0.001). Conversely, a similar study that investigated the impact of cost transparency on inpatient imaging utilization did not demonstrate a significant influence of cost display.5 This suggests that cost transparency may work in some areas of care but not in others. A systematic review that investigated price-display interventions for imaging, laboratory studies, and medications reported 10 studies that demonstrated a statistically significant decrease in expenditures without an effect on patient safety.6
Informing prescribers of institution-specific medication costs within and between drug classes may enable the selection of less expensive, therapeutically equivalent drugs. Prior studies investigating the effect of medication cost display were conducted in a variety of patient care settings, including ambulatory clinics,7 urgent care centers,8 and operating rooms,9,10 with some yielding positive results in terms of ordering and cost11,12 and others having no impact.13,14 Currently, there is little evidence specifically addressing the effect of cost display for medications in the inpatient setting.
As part of an institutional initiative to control pharmaceutical expenditures, informational messaging for several high-cost drugs was initiated at our tertiary care hospital in April 2015. The goal of our study was to assess the effect of these medication cost messages on ordering practices. We hypothesized that the display of inpatient pharmaceutical costs at the time of order entry would result in a reduction in ordering.
METHODS
Setting, Intervention, and Participants
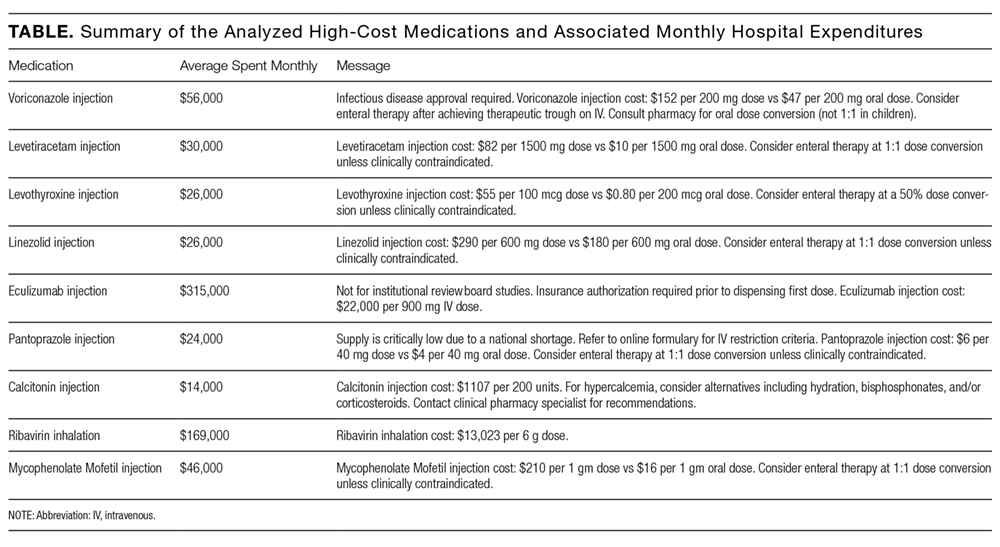
As part of an effort to educate prescribers about the high cost of medications, 9 intravenous (IV) medications were selected by the Johns Hopkins Hospital Pharmacy and Therapeutics Committee as targets for drug cost messaging. The intention of the committee was to implement a rapid, low-cost, proof-of-concept, quality-improvement project that was not designed as prospective research. Representatives from the pharmacy and clinicians from relevant clinical areas participated in preimplementation discussions to help identify medications that were subjectively felt to be overused at our institution and potentially modifiable through provider education. The criteria for selecting drug targets included a variety of factors, such as medications infrequently ordered but representing a significant cost per dose (eg, eculizumab and ribavirin), frequently ordered medications with less expensive substitutes (eg, linezolid and voriconazole), and high-cost medications without direct therapeutic alternatives (eg, calcitonin). From April 10, 2015, to October 5, 2015, the computerized Provider Order Entry System (cPOE), Sunrise Clinical Manager (Allscripts Corporation, Chicago, IL), displayed the cost for targeted medications. Seven of the medication alerts also included a reasonable therapeutic alternative and its cost. There were no restrictions placed on ordering; prescribers were able to choose the high-cost medications at their discretion.
Despite the fact that this initiative was not designed as a research project, we felt it was important to formally evaluate the impact of the drug cost messaging effort to inform future quality-improvement interventions. Each medication was compared to its preintervention baseline utilization dating back to January 1, 2013. For the 7 medications with alternatives offered, we also analyzed use of the suggested alternative during these time periods.
Data Sources and Measurement
Our study utilized data obtained from the pharmacy order verification system and the cPOE database. Data were collected over a period of 143 weeks from January 1, 2013, to October 5, 2015, to allow for a baseline period (January 1, 2013, to April 9, 2015) and an intervention period (April 10, 2015, to October 5, 2015). Data elements extracted included drug characteristics (dosage form, route, cost, strength, name, and quantity), patient characteristics (race, gender, and age), clinical setting (facility location, inpatient or outpatient), and billing information (provider name, doses dispensed from pharmacy, order number, revenue or procedure code, record number, date of service, and unique billing number) for each admission. Using these elements, we generated the following 8 variables to use in our analyses: week, month, period identifier, drug name, dosage form, weekly orders, weekly patient days, and number of weekly orders per 10,000 patient days. Average wholesale price (AWP), referred to as medication cost in this manuscript, was used to report all drug costs in all associated cost calculations. While the actual cost of acquisition and price charged to the patient may vary based on several factors, including manufacturer and payer, we chose to use AWP as a generalizable estimate of the cost of acquisition of the drug for the hospital.
Variables
“Week” and “month” were defined as the week and month of our study, respectively. The “period identifier” was a binary variable that identified the time period before and after the intervention. “Weekly orders” was defined as the total number of new orders placed per week for each specified drug included in our study. For example, if a patient received 2 discrete, new orders for a medication in a given week, 2 orders would be counted toward the “weekly orders” variable. “Patient days,” defined as the total number of patients treated at our facility, was summated for each week of our study to yield “weekly patient days.” To derive the “number of weekly orders per 10,000 patient days,” we divided weekly orders by weekly patient days and multiplied the resultant figure by 10,000.
Statistical Analysis

Segmented regression, a form of interrupted time series analysis, is a quasi-experimental design that was used to determine the immediate and sustained effects of the drug cost messages on the rate of medication ordering.15-17 The model enabled the use of comparison groups (alternative medications, as described above) to enhance internal validity.
In time series data, outcomes may not be independent over time. Autocorrelation of the error terms can arise when outcomes are more similar at time points closer together than outcomes at time points further apart. Failure to account for autocorrelation of the error terms may lead to underestimated standard errors. The presence of autocorrelation, assessed by calculating the Durbin-Watson statistic, was significant among our data. To adjust for this, we employed a Prais-Winsten estimation to adjust the error term (εt) calculated in our models.
Two segmented linear regression models were used to estimate trends in ordering before and after the intervention. The presence or absence of a comparator drug determined which model was to be used. When only single medications were under study, as in the case of eculizumab and calcitonin, our regression model was as follows:
Yt = (β0) + (β1)(Timet) + (β2)(Interventiont) + (β3)(Post-Intervention Timet) + (εt)
In our single-drug model, Yt denoted the number of orders per 10,000 patient days at week “t”; Timet was a continuous variable that indicated the number of weeks prior to or after the study intervention (April 10, 2015) and ranged from –116 to 27 weeks. Post-Intervention Timet was a continuous variable that denoted the number of weeks since the start of the intervention and is coded as zero for all time periods prior to the intervention. β0 was the estimated baseline number of orders per 10,000 patient days at the beginning of the study. β1 is the trend of orders per 10,000 patient days per week during the preintervention period; β2 represents an estimate of the change in the number of orders per 10,000 patient days immediately after the intervention; β3 denotes the difference between preintervention and postintervention slopes; and εt is the “error term,” which represents autocorrelation and random variability of the data.
As mentioned previously, alternative dosage forms of 7 medications included in our study were utilized as comparison groups. In these instances (when multiple drugs were included in our analyses), the following regression model was applied:
Y t = ( β 0 ) + ( β 1 )(Time t ) + ( β 2 )(Intervention t ) + ( β 3 )(Post-Intervention Time t ) + ( β 4 )(Cohort) + ( β 5 )(Cohort)(Time t ) + ( β 6 )(Cohort)(Intervention t ) + ( β 7 )(Cohort)(Post-Intervention Time t ) + ( ε t )
Here, 3 coefficients were added (β4-β7) to describe an additional cohort of orders. Cohort, a binary indicator variable, held a value of either 0 or 1 when the model was used to describe the treatment or comparison group, respectively. The coefficients β4-β7 described the treatment group, and β0-β3 described the comparison group. β4 was the difference in the number of baseline orders per 10,000 patient days between treatment and comparison groups; Β5 represented the difference between the estimated ordering trends of treatment and comparison groups; and Β6 indicated the difference in immediate changes in the number of orders per 10,000 patient days in the 2 groups following the intervention.
The number of orders per week was recorded for each medicine, which enabled a large number of data points to be included in our analyses. This allowed for more accurate and stable estimates to be made in our regression model. A total of 143 data points were collected for each study group, 116 before and 27 following each intervention.
All analyses were conducted by using STATA version 13.1 (StataCorp LP, College Station, TX).
RESULTS

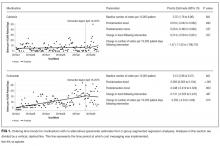
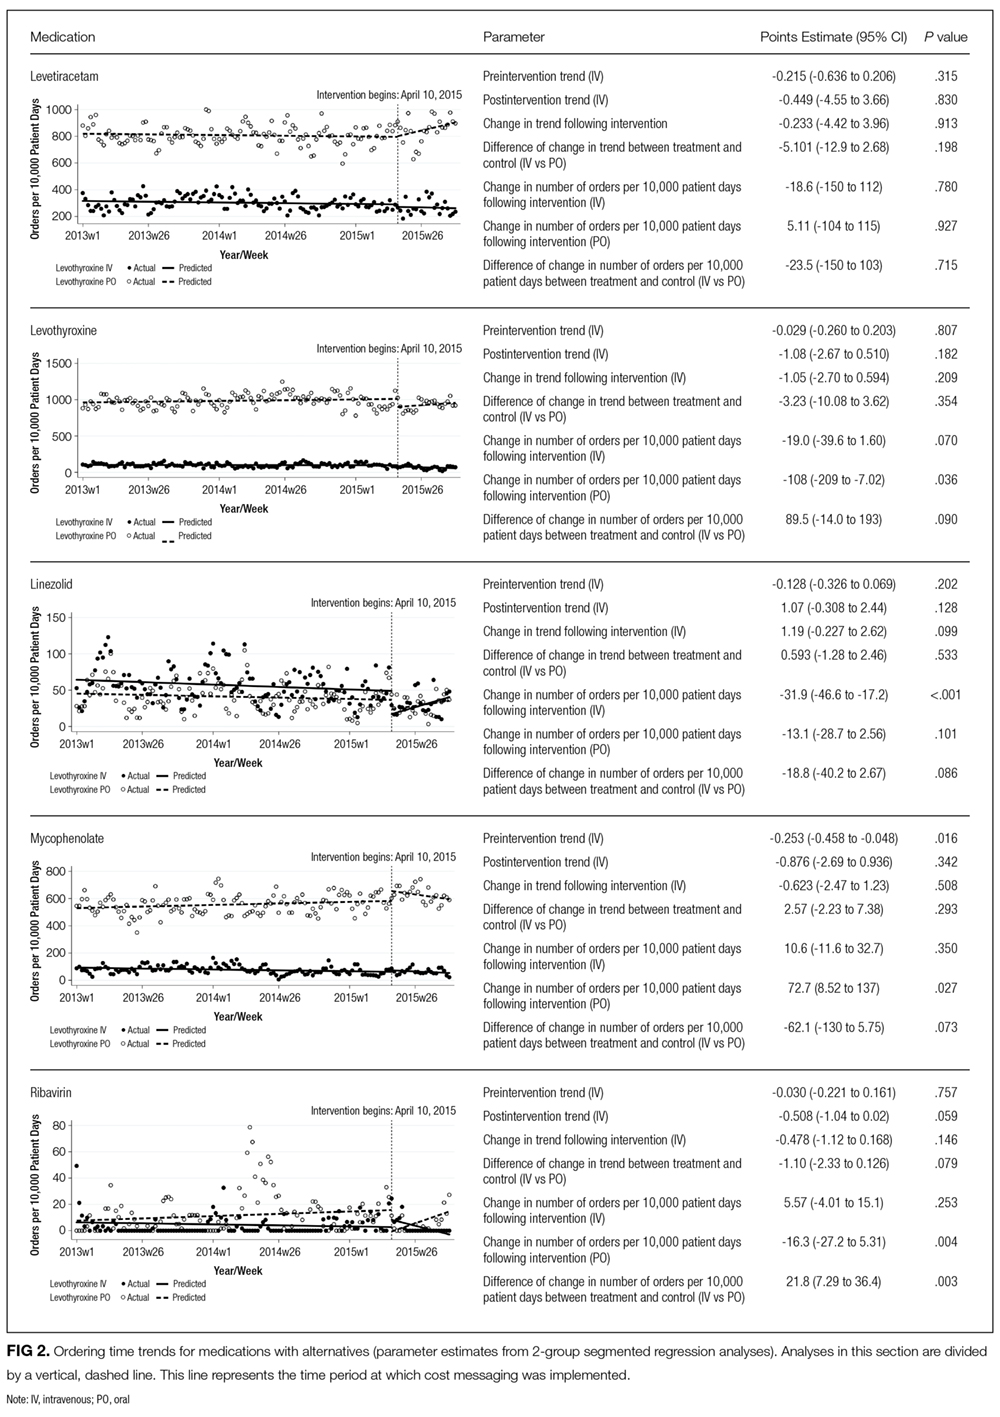
Initial results pertaining to 9 IV medications were examined (Table). Following the implementation of cost messaging, no significant changes were observed in order frequency or trend for IV formulations of eculizumab, calcitonin, levetiracetam, linezolid, mycophenolate, ribavirin, voriconazole, and levothyroxine (Figures 1 and 2). However, a significant decrease in the number of oral ribavirin orders (Figure 2), the control group for the IV form, was observed (–16.3 orders per 10,000 patient days; P = .004; 95% CI, –27.2 to –5.31).
DISCUSSION
Our results suggest that the passive strategy of displaying cost alone was not effective in altering prescriber ordering patterns for the selected medications. This may be due to a lack of awareness regarding direct financial impact on the patient, importance of costs in medical decision-making, or a perceived lack of alternatives or suitability of recommended alternatives. These results may prove valuable to hospital and pharmacy leadership as they develop strategies to curb medication expense.
Changes observed in IV pantoprazole ordering are instructive. Due to a national shortage, the IV form of this medication underwent a restriction, which required approval by the pharmacy prior to dispensing. This restriction was instituted independently of our study and led to a 73% decrease from usage rates prior to policy implementation (Figure 3). Ordering was restricted according to defined criteria for IV use. The restriction did not apply to oral pantoprazole, and no significant change in ordering of the oral formulation was noted during the evaluated period (Figure 3).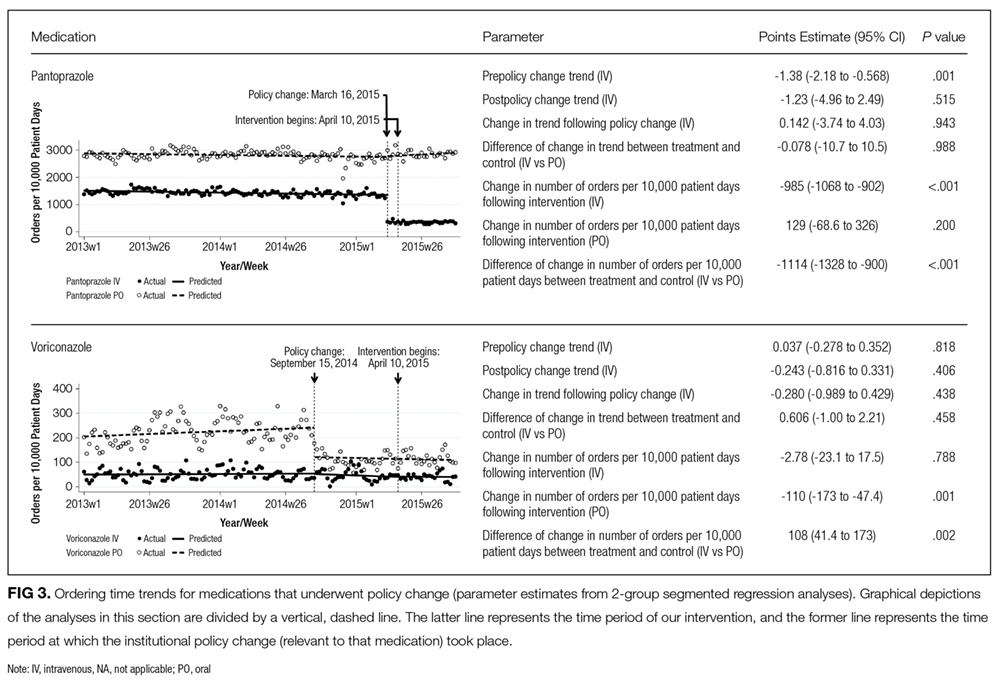
The dramatic effect of policy changes, as observed with pantoprazole and voriconazole, suggests that a more active strategy may have a greater impact on prescriber behavior when it comes to medication ordering in the inpatient setting. It also highlights several potential sources of confounding that may introduce bias to cost-transparency studies.
This study has multiple limitations. First, as with all observational study designs, causation cannot be drawn with certainty from our results. While we were able to compare medications to their preintervention baselines, the data could have been impacted by longitudinal or seasonal trends in medication ordering, which may have been impacted by seasonal variability in disease prevalence, changes in resistance patterns, and annual cycling of house staff in an academic medical center. While there appear to be potential seasonal patterns regarding prescribing patterns for some of the medications included in this analysis, we also believe the linear regressions capture the overall trends in prescribing adequately. Nonstationarity, or trends in the mean and variance of the outcome that are not related to the intervention, may introduce bias in the interpretation of our findings. However, we believe the parameters included in our models, namely the immediate change in the intercept following the intervention and the change in the trend of the rate of prescribing over time from pre- to postintervention, provide substantial protections from faulty interpretation. Our models are limited to the extent that these parameters do not account for nonstationarity. Additionally, we did not collect data on dosing frequency or duration of treatment, which would have been dependent on factors that are not readily quantified, such as indication, clinical rationale, or patient response. Thus, we were not able to evaluate the impact of the intervention on these factors.
Although intended to enhance internal validity, comparison groups were also subject to external influence. For example, we observed a significant, short-lived rise in oral ribavirin (a control medication) ordering during the preintervention baseline period that appeared to be independent of our intervention and may speak to the unaccounted-for longitudinal variability detailed above.
Finally, the clinical indication and setting may be important. Previous studies performed at the same hospital with price displays showed a reduction in laboratory ordering but no change in imaging.18,19 One might speculate that ordering fewer laboratory tests is viewed by providers as eliminating waste rather than choosing a less expensive option to accomplish the same diagnostic task at hand. Therapeutics may be more similar to radiology tests, because patients presumably need the treatment and often do not have the option of simply not ordering without a concerted effort to reevaluate the treatment plan. Additionally, in a tertiary care teaching center such as ours, a junior clinician, oftentimes at the behest of a more senior colleague, enters most orders. In an environment in which the ordering prescriber has more autonomy or when the order is driven by a junior practitioner rather than an attending (such as daily laboratories), results may be different. Additionally, institutions that incentivize prescribers directly to practice cost-conscious care may experience different results from similar interventions.
We conclude that, in the case of medication cost messaging, a strategy of displaying cost information alone was insufficient to affect prescriber ordering behavior. Coupling cost transparency with educational interventions and active stewardship to impact clinical practice is worthy of further study.
Disclosures: The authors state that there were no external sponsors for this work. The Johns Hopkins Hospital and University “funded” this work by paying the salaries of the authors. The author team maintained independence and made all decisions regarding the study design, data collection, data analysis, interpretation of results, writing of the research report, and decision to submit it for publication. Dr. Shermock had full access to all the study data and takes responsibility for the integrity of the data and accuracy of the data analysis.
1. Berwick DM, Hackbarth AD. Eliminating Waste in US Health Care. JAMA. 2012;307(14):1513-1516. PubMed
2. PricewaterhouseCoopers’ Health Research Institute. The Price of Excess: Identifying Waste in Healthcare Spending. http://www.pwc.com/us/en/healthcare/publications/the-price-of-excess.html. Accessed June 17, 2015.
3. Allan GM, Lexchin J, Wiebe N. Physician awareness of drug cost: a systematic review. PLoS Med. 2007;4(9):e283. PubMed
4. Feldman LS, Shihab HM, Thiemann D, et al. Impact of providing fee data on laboratory test ordering: a controlled clinical trial. JAMA Intern Med. 2013;173(10):903-908. PubMed
5. Durand DJ, Feldman LS, Lewin JS, Brotman DJ. Provider cost transparency alone has no impact on inpatient imaging utilization. J Am Coll Radiol. 2013;10(2):108-113. PubMed
6. Silvestri MT, Bongiovanni TR, Glover JG, Gross CP. Impact of price display on provider ordering: A systematic review. J Hosp Med. 2016;11(1):65-76. PubMed
7. Ornstein SM, MacFarlane LL, Jenkins RG, Pan Q, Wager KA. Medication cost information in a computer-based patient record system. Impact on prescribing in a family medicine clinical practice. Arch Fam Med. 1999;8(2):118-121. PubMed
8. Guterman JJ, Chernof BA, Mares B, Gross-Schulman SG, Gan PG, Thomas D. Modifying provider behavior: A low-tech approach to pharmaceutical ordering. J Gen Intern Med. 2002;17(10):792-796. PubMed
9. McNitt JD, Bode ET, Nelson RE. Long-term pharmaceutical cost reduction using a data management system. Anesth Analg. 1998;87(4):837-842. PubMed
10. Horrow JC, Rosenberg H. Price stickers do not alter drug usage. Can J Anaesth. 1994;41(11):1047-1052. PubMed
11. Guterman JJ, Chernof BA, Mares B, Gross-Schulman SG, Gan PG, Thomas D. Modifying provider behavior: A low-tech approach to pharmaceutical ordering. J Gen Intern Med. 2002;17(10):792-796. PubMed
12. McNitt JD, Bode ET, Nelson RE. Long-term pharmaceutical cost reduction using a data management system. Anesth Analg. 1998;87(4):837-842. PubMed
13. Ornstein SM, MacFarlane LL, Jenkins RG, Pan Q, Wager KA. Medication cost information in a computer-based patient record system. Impact on prescribing in a family medicine clinical practice. Arch Fam Med. 1999;8(2):118-121. PubMed
14. Horrow JC, Rosenberg H. Price stickers do not alter drug usage. Can J Anaesth. 1994;41(11):1047-1052. PubMed
15. Jandoc R, Burden AM, Mamdani M, Levesque LE, Cadarette SM. Interrupted time series analysis in drug utilization research is increasing: Systematic review and recommendations. J Clin Epidemiol. 2015;68(8):950-56. PubMed
16. Linden A. Conducting interrupted time-series analysis for single- and multiple-group comparisons. Stata J. 2015;15(2):480-500.
17. Linden A, Adams JL. Applying a propensity score-based weighting model to interrupted time series data: improving causal inference in programme evaluation. J Eval Clin Pract. 2011;17(6):1231-1238. PubMed
18. Feldman LS, Shihab HM, Thiemann D, et al. Impact of providing fee data on laboratory test ordering: a controlled clinical trial. JAMA Intern Med. 2013;173(10):903-908. PubMed
19. Durand DJ, Feldman LS, Lewin JS, Brotman DJ. Provider cost transparency alone has no impact on inpatient imaging utilization. J Am Coll Radiol. 2013;10(2):108-113. PubMed
Secondary to rising healthcare costs in the United States, broad efforts are underway to identify and reduce waste in the health system.1,2 A recent systematic review exhibited that many physicians inaccurately estimate the cost of medications.3 Raising awareness of medication costs among prescribers is one potential way to promote high-value care.
Some evidence suggests that cost transparency may help prescribers understand how medication orders drive costs. In a previous study carried out at the Johns Hopkins Hospital, fee data were displayed to providers for diagnostic laboratory tests.4 An 8.6% decrease (95% confidence interval [CI], –8.99% to –8.19%) in test ordering was observed when costs were displayed vs a 5.6% increase (95% CI, 4.90% to 6.39%) in ordering when costs were not displayed during a 6-month intervention period (P < 0.001). Conversely, a similar study that investigated the impact of cost transparency on inpatient imaging utilization did not demonstrate a significant influence of cost display.5 This suggests that cost transparency may work in some areas of care but not in others. A systematic review that investigated price-display interventions for imaging, laboratory studies, and medications reported 10 studies that demonstrated a statistically significant decrease in expenditures without an effect on patient safety.6
Informing prescribers of institution-specific medication costs within and between drug classes may enable the selection of less expensive, therapeutically equivalent drugs. Prior studies investigating the effect of medication cost display were conducted in a variety of patient care settings, including ambulatory clinics,7 urgent care centers,8 and operating rooms,9,10 with some yielding positive results in terms of ordering and cost11,12 and others having no impact.13,14 Currently, there is little evidence specifically addressing the effect of cost display for medications in the inpatient setting.
As part of an institutional initiative to control pharmaceutical expenditures, informational messaging for several high-cost drugs was initiated at our tertiary care hospital in April 2015. The goal of our study was to assess the effect of these medication cost messages on ordering practices. We hypothesized that the display of inpatient pharmaceutical costs at the time of order entry would result in a reduction in ordering.
METHODS
Setting, Intervention, and Participants
As part of an effort to educate prescribers about the high cost of medications, 9 intravenous (IV) medications were selected by the Johns Hopkins Hospital Pharmacy and Therapeutics Committee as targets for drug cost messaging. The intention of the committee was to implement a rapid, low-cost, proof-of-concept, quality-improvement project that was not designed as prospective research. Representatives from the pharmacy and clinicians from relevant clinical areas participated in preimplementation discussions to help identify medications that were subjectively felt to be overused at our institution and potentially modifiable through provider education. The criteria for selecting drug targets included a variety of factors, such as medications infrequently ordered but representing a significant cost per dose (eg, eculizumab and ribavirin), frequently ordered medications with less expensive substitutes (eg, linezolid and voriconazole), and high-cost medications without direct therapeutic alternatives (eg, calcitonin). From April 10, 2015, to October 5, 2015, the computerized Provider Order Entry System (cPOE), Sunrise Clinical Manager (Allscripts Corporation, Chicago, IL), displayed the cost for targeted medications. Seven of the medication alerts also included a reasonable therapeutic alternative and its cost. There were no restrictions placed on ordering; prescribers were able to choose the high-cost medications at their discretion.
Despite the fact that this initiative was not designed as a research project, we felt it was important to formally evaluate the impact of the drug cost messaging effort to inform future quality-improvement interventions. Each medication was compared to its preintervention baseline utilization dating back to January 1, 2013. For the 7 medications with alternatives offered, we also analyzed use of the suggested alternative during these time periods.
Data Sources and Measurement
Our study utilized data obtained from the pharmacy order verification system and the cPOE database. Data were collected over a period of 143 weeks from January 1, 2013, to October 5, 2015, to allow for a baseline period (January 1, 2013, to April 9, 2015) and an intervention period (April 10, 2015, to October 5, 2015). Data elements extracted included drug characteristics (dosage form, route, cost, strength, name, and quantity), patient characteristics (race, gender, and age), clinical setting (facility location, inpatient or outpatient), and billing information (provider name, doses dispensed from pharmacy, order number, revenue or procedure code, record number, date of service, and unique billing number) for each admission. Using these elements, we generated the following 8 variables to use in our analyses: week, month, period identifier, drug name, dosage form, weekly orders, weekly patient days, and number of weekly orders per 10,000 patient days. Average wholesale price (AWP), referred to as medication cost in this manuscript, was used to report all drug costs in all associated cost calculations. While the actual cost of acquisition and price charged to the patient may vary based on several factors, including manufacturer and payer, we chose to use AWP as a generalizable estimate of the cost of acquisition of the drug for the hospital.
Variables
“Week” and “month” were defined as the week and month of our study, respectively. The “period identifier” was a binary variable that identified the time period before and after the intervention. “Weekly orders” was defined as the total number of new orders placed per week for each specified drug included in our study. For example, if a patient received 2 discrete, new orders for a medication in a given week, 2 orders would be counted toward the “weekly orders” variable. “Patient days,” defined as the total number of patients treated at our facility, was summated for each week of our study to yield “weekly patient days.” To derive the “number of weekly orders per 10,000 patient days,” we divided weekly orders by weekly patient days and multiplied the resultant figure by 10,000.
Statistical Analysis
Segmented regression, a form of interrupted time series analysis, is a quasi-experimental design that was used to determine the immediate and sustained effects of the drug cost messages on the rate of medication ordering.15-17 The model enabled the use of comparison groups (alternative medications, as described above) to enhance internal validity.
In time series data, outcomes may not be independent over time. Autocorrelation of the error terms can arise when outcomes are more similar at time points closer together than outcomes at time points further apart. Failure to account for autocorrelation of the error terms may lead to underestimated standard errors. The presence of autocorrelation, assessed by calculating the Durbin-Watson statistic, was significant among our data. To adjust for this, we employed a Prais-Winsten estimation to adjust the error term (εt) calculated in our models.
Two segmented linear regression models were used to estimate trends in ordering before and after the intervention. The presence or absence of a comparator drug determined which model was to be used. When only single medications were under study, as in the case of eculizumab and calcitonin, our regression model was as follows:
Yt = (β0) + (β1)(Timet) + (β2)(Interventiont) + (β3)(Post-Intervention Timet) + (εt)
In our single-drug model, Yt denoted the number of orders per 10,000 patient days at week “t”; Timet was a continuous variable that indicated the number of weeks prior to or after the study intervention (April 10, 2015) and ranged from –116 to 27 weeks. Post-Intervention Timet was a continuous variable that denoted the number of weeks since the start of the intervention and is coded as zero for all time periods prior to the intervention. β0 was the estimated baseline number of orders per 10,000 patient days at the beginning of the study. β1 is the trend of orders per 10,000 patient days per week during the preintervention period; β2 represents an estimate of the change in the number of orders per 10,000 patient days immediately after the intervention; β3 denotes the difference between preintervention and postintervention slopes; and εt is the “error term,” which represents autocorrelation and random variability of the data.
As mentioned previously, alternative dosage forms of 7 medications included in our study were utilized as comparison groups. In these instances (when multiple drugs were included in our analyses), the following regression model was applied:
Y t = ( β 0 ) + ( β 1 )(Time t ) + ( β 2 )(Intervention t ) + ( β 3 )(Post-Intervention Time t ) + ( β 4 )(Cohort) + ( β 5 )(Cohort)(Time t ) + ( β 6 )(Cohort)(Intervention t ) + ( β 7 )(Cohort)(Post-Intervention Time t ) + ( ε t )
Here, 3 coefficients were added (β4-β7) to describe an additional cohort of orders. Cohort, a binary indicator variable, held a value of either 0 or 1 when the model was used to describe the treatment or comparison group, respectively. The coefficients β4-β7 described the treatment group, and β0-β3 described the comparison group. β4 was the difference in the number of baseline orders per 10,000 patient days between treatment and comparison groups; Β5 represented the difference between the estimated ordering trends of treatment and comparison groups; and Β6 indicated the difference in immediate changes in the number of orders per 10,000 patient days in the 2 groups following the intervention.
The number of orders per week was recorded for each medicine, which enabled a large number of data points to be included in our analyses. This allowed for more accurate and stable estimates to be made in our regression model. A total of 143 data points were collected for each study group, 116 before and 27 following each intervention.
All analyses were conducted by using STATA version 13.1 (StataCorp LP, College Station, TX).
RESULTS
Initial results pertaining to 9 IV medications were examined (Table). Following the implementation of cost messaging, no significant changes were observed in order frequency or trend for IV formulations of eculizumab, calcitonin, levetiracetam, linezolid, mycophenolate, ribavirin, voriconazole, and levothyroxine (Figures 1 and 2). However, a significant decrease in the number of oral ribavirin orders (Figure 2), the control group for the IV form, was observed (–16.3 orders per 10,000 patient days; P = .004; 95% CI, –27.2 to –5.31).
DISCUSSION
Our results suggest that the passive strategy of displaying cost alone was not effective in altering prescriber ordering patterns for the selected medications. This may be due to a lack of awareness regarding direct financial impact on the patient, importance of costs in medical decision-making, or a perceived lack of alternatives or suitability of recommended alternatives. These results may prove valuable to hospital and pharmacy leadership as they develop strategies to curb medication expense.
Changes observed in IV pantoprazole ordering are instructive. Due to a national shortage, the IV form of this medication underwent a restriction, which required approval by the pharmacy prior to dispensing. This restriction was instituted independently of our study and led to a 73% decrease from usage rates prior to policy implementation (Figure 3). Ordering was restricted according to defined criteria for IV use. The restriction did not apply to oral pantoprazole, and no significant change in ordering of the oral formulation was noted during the evaluated period (Figure 3).
The dramatic effect of policy changes, as observed with pantoprazole and voriconazole, suggests that a more active strategy may have a greater impact on prescriber behavior when it comes to medication ordering in the inpatient setting. It also highlights several potential sources of confounding that may introduce bias to cost-transparency studies.
This study has multiple limitations. First, as with all observational study designs, causation cannot be drawn with certainty from our results. While we were able to compare medications to their preintervention baselines, the data could have been impacted by longitudinal or seasonal trends in medication ordering, which may have been impacted by seasonal variability in disease prevalence, changes in resistance patterns, and annual cycling of house staff in an academic medical center. While there appear to be potential seasonal patterns regarding prescribing patterns for some of the medications included in this analysis, we also believe the linear regressions capture the overall trends in prescribing adequately. Nonstationarity, or trends in the mean and variance of the outcome that are not related to the intervention, may introduce bias in the interpretation of our findings. However, we believe the parameters included in our models, namely the immediate change in the intercept following the intervention and the change in the trend of the rate of prescribing over time from pre- to postintervention, provide substantial protections from faulty interpretation. Our models are limited to the extent that these parameters do not account for nonstationarity. Additionally, we did not collect data on dosing frequency or duration of treatment, which would have been dependent on factors that are not readily quantified, such as indication, clinical rationale, or patient response. Thus, we were not able to evaluate the impact of the intervention on these factors.
Although intended to enhance internal validity, comparison groups were also subject to external influence. For example, we observed a significant, short-lived rise in oral ribavirin (a control medication) ordering during the preintervention baseline period that appeared to be independent of our intervention and may speak to the unaccounted-for longitudinal variability detailed above.
Finally, the clinical indication and setting may be important. Previous studies performed at the same hospital with price displays showed a reduction in laboratory ordering but no change in imaging.18,19 One might speculate that ordering fewer laboratory tests is viewed by providers as eliminating waste rather than choosing a less expensive option to accomplish the same diagnostic task at hand. Therapeutics may be more similar to radiology tests, because patients presumably need the treatment and often do not have the option of simply not ordering without a concerted effort to reevaluate the treatment plan. Additionally, in a tertiary care teaching center such as ours, a junior clinician, oftentimes at the behest of a more senior colleague, enters most orders. In an environment in which the ordering prescriber has more autonomy or when the order is driven by a junior practitioner rather than an attending (such as daily laboratories), results may be different. Additionally, institutions that incentivize prescribers directly to practice cost-conscious care may experience different results from similar interventions.
We conclude that, in the case of medication cost messaging, a strategy of displaying cost information alone was insufficient to affect prescriber ordering behavior. Coupling cost transparency with educational interventions and active stewardship to impact clinical practice is worthy of further study.
Disclosures: The authors state that there were no external sponsors for this work. The Johns Hopkins Hospital and University “funded” this work by paying the salaries of the authors. The author team maintained independence and made all decisions regarding the study design, data collection, data analysis, interpretation of results, writing of the research report, and decision to submit it for publication. Dr. Shermock had full access to all the study data and takes responsibility for the integrity of the data and accuracy of the data analysis.
1. Berwick DM, Hackbarth AD. Eliminating Waste in US Health Care. JAMA. 2012;307(14):1513-1516. PubMed
2. PricewaterhouseCoopers’ Health Research Institute. The Price of Excess: Identifying Waste in Healthcare Spending. http://www.pwc.com/us/en/healthcare/publications/the-price-of-excess.html. Accessed June 17, 2015.
3. Allan GM, Lexchin J, Wiebe N. Physician awareness of drug cost: a systematic review. PLoS Med. 2007;4(9):e283. PubMed
4. Feldman LS, Shihab HM, Thiemann D, et al. Impact of providing fee data on laboratory test ordering: a controlled clinical trial. JAMA Intern Med. 2013;173(10):903-908. PubMed
5. Durand DJ, Feldman LS, Lewin JS, Brotman DJ. Provider cost transparency alone has no impact on inpatient imaging utilization. J Am Coll Radiol. 2013;10(2):108-113. PubMed
6. Silvestri MT, Bongiovanni TR, Glover JG, Gross CP. Impact of price display on provider ordering: A systematic review. J Hosp Med. 2016;11(1):65-76. PubMed
7. Ornstein SM, MacFarlane LL, Jenkins RG, Pan Q, Wager KA. Medication cost information in a computer-based patient record system. Impact on prescribing in a family medicine clinical practice. Arch Fam Med. 1999;8(2):118-121. PubMed
8. Guterman JJ, Chernof BA, Mares B, Gross-Schulman SG, Gan PG, Thomas D. Modifying provider behavior: A low-tech approach to pharmaceutical ordering. J Gen Intern Med. 2002;17(10):792-796. PubMed
9. McNitt JD, Bode ET, Nelson RE. Long-term pharmaceutical cost reduction using a data management system. Anesth Analg. 1998;87(4):837-842. PubMed
10. Horrow JC, Rosenberg H. Price stickers do not alter drug usage. Can J Anaesth. 1994;41(11):1047-1052. PubMed
11. Guterman JJ, Chernof BA, Mares B, Gross-Schulman SG, Gan PG, Thomas D. Modifying provider behavior: A low-tech approach to pharmaceutical ordering. J Gen Intern Med. 2002;17(10):792-796. PubMed
12. McNitt JD, Bode ET, Nelson RE. Long-term pharmaceutical cost reduction using a data management system. Anesth Analg. 1998;87(4):837-842. PubMed
13. Ornstein SM, MacFarlane LL, Jenkins RG, Pan Q, Wager KA. Medication cost information in a computer-based patient record system. Impact on prescribing in a family medicine clinical practice. Arch Fam Med. 1999;8(2):118-121. PubMed
14. Horrow JC, Rosenberg H. Price stickers do not alter drug usage. Can J Anaesth. 1994;41(11):1047-1052. PubMed
15. Jandoc R, Burden AM, Mamdani M, Levesque LE, Cadarette SM. Interrupted time series analysis in drug utilization research is increasing: Systematic review and recommendations. J Clin Epidemiol. 2015;68(8):950-56. PubMed
16. Linden A. Conducting interrupted time-series analysis for single- and multiple-group comparisons. Stata J. 2015;15(2):480-500.
17. Linden A, Adams JL. Applying a propensity score-based weighting model to interrupted time series data: improving causal inference in programme evaluation. J Eval Clin Pract. 2011;17(6):1231-1238. PubMed
18. Feldman LS, Shihab HM, Thiemann D, et al. Impact of providing fee data on laboratory test ordering: a controlled clinical trial. JAMA Intern Med. 2013;173(10):903-908. PubMed
19. Durand DJ, Feldman LS, Lewin JS, Brotman DJ. Provider cost transparency alone has no impact on inpatient imaging utilization. J Am Coll Radiol. 2013;10(2):108-113. PubMed
© 2017 Society of Hospital Medicine
Routine Replacement of Peripheral Intravenous Catheters
The “Things We Do for No Reason” (TWDFNR) series reviews practices which have become common parts of hospital care but which may provide little value to our patients. Practices reviewed in the TWDFNR series do not represent “black and white” conclusions or clinical practice standards, but are meant as a starting place for research and active discussions among hospitalists and patients. We invite you to be part of that discussion. https://www.choosingwisely.org/

Hospitals and health systems worldwide have adopted policies for routine replacement of peripheral intravenous catheters (PIVCs) at prespecified time intervals (range, 48-96 hours). This practice accounts for a large number of PIVC reinsertions and places a significant cost burden on the healthcare infrastructure. The authors of this article examine the evidence that has been used to support this practice.
CASE PRESENTATION
A 67-year-old man with metastatic lung cancer presents to a hospital for pain control and “failure to thrive.” In the emergency department, a left antecubital peripheral intravenous catheter (PIVC) is placed. On admission, a prerenal acute kidney injury is noted. During the patient’s entire hospitalization, normal saline with parenteral hydromorphone is administered. On hospital day 4, the pain is still not adequately controlled, and the intravenous opioid is continued. On morning rounds, an intern notes that the PIVC is functioning well, and there are no signs of irritation. However, the nursing staff reminds the team that the PIVC should be changed because it has been in place for 4 days and is “due for replacement.” The patient does not want to receive another skin puncture for routine venous access. Does the PIVC need to be replaced, per routine?
WHY YOU MIGHT THINK ROUTINE PIVC REPLACEMENT IS HELPFUL
PIVC placement is easily the most common procedure performed in the United States. An estimated 200 million PIVCs are placed each year.1 Given the number of inpatient hospital stays per year in the United States alone—more than 37 million1,2—data regarding the care, maintenance, and complications of PIVCs are essential to the healthcare infrastructure.
The recommendation to routinely replace PIVCs dates to 1981, when the Centers for Disease Control and Prevention3 (CDC) issued a guideline that calls for replacing PIVCs every 24 to 48 hours. Most of the data and studies that established that recommendation originated in the 1970s, when catheters varied in length and material, and precise definitions of complications, such as phlebitis—localized vein inflammation characterized by pain, erythema, tenderness, swelling, and a palpable cord4,5—were not standardized across trials. Research at the time suggested higher rates of complications from IVCs dwelling longer than 48 to 72 hours. The latest (2011) CDC guidelines6,7 softened the recommendation but still concluded, “There is no need to replace peripheral catheters more frequently than every 72-96 hours.”
The 2011 recommendation6,7 is based on findings of a 1983 prospective observational study,8 a 1991 randomized controlled trial (RCT),9 and a 1998 prospective observational study.2 The 1983 and 1991 studies found higher rates of PIVC complications after day 2 of cannulation.8,9 The 1998 study found no increase in the rate of complications after day 3 of catheterization, and its authors, recommending a reevaluation of the need to routinely replace PIVCs, wrote, “[The] hazard for catheter-related complications, phlebitis, catheter-related infections, and mechanical complications did not increase during prolonged catheterization.”2
Results of RCTs conducted by Barker et al.10 (2004) and Nishanth et al.11 (2009) supported the claim that routine replacement of PIVCs leads to lower rates of thrombophlebitis. Nishanth et al. also included site pain and cannula dislodgement in their definition of phlebitis. Neither study compared blood stream infection rates, but both found higher rates of phlebitis between day 2.5 and day 3. However, Cochrane reviewers Webster et al.12 questioned the findings of these 2 trials, given their missing data and possibly biased results and conclusions. In the Barker study, patient numbers (screened, eligible, dropout) were unclear; each patient group was unbalanced; protocol deviations were not reported (possibly a result of incomplete data reporting or inappropriate randomization); and varied definitions of phlebitis were allowed, which may have resulted in more events being included. In the Nishanth study, the 100% phlebitis rate for the clinically indicated replacement group seemed extreme, which suggested confounding by an unknown bias or chance. Last, both samples were small: 47 patients (Barker) and 42 patients (Nishanth). Given all these concerns, the 2 trials were excluded from the Cochrane meta-analysis on the subject.12
In the 1980s and early 1990s, routine removal and exchange of PIVCs were supported by limited evidence. Current well-designed trial data cast doubt on the need for such a practice.
WHY YOU SHOULD NOT ROUTINELY REPLACE PIVCs
According to the CDC,6,7 the issue of routine PIVC replacement remains unresolved: “No recommendation is made regarding replacement of peripheral catheters in adults only when clinically indicated.”
Whereas earlier data showed a higher risk of complications with longer dwelling IVs, the majority of contemporary data has failed to support this conclusion. The recent (2015) Cochrane meta-analysis comparing routine with clinically indicated IVC replacement found “no evidence to support changing catheters every 72-96 hours.”12 Of the 7 studies that fulfilled the criteria for qualitative analysis, only 5 were included (the studies by Barker et al.10 and Nishanth et al.11 were excluded). The included studies assessed the endpoints of catheter-related blood stream infection (CRBSI), phlebitis, phlebitis per device-days, mortality, cost, and infiltration. Statistically significant differences were found only for cost (favoring clinically indicated replacement) and infiltration (occurring less with routine replacement).
The largest and most robust RCT in the meta-analysis12 was conducted by Rickard et al.13 (2012). Their nonblinded, intention-to-treat study of 3283 patients used concealed allocation to randomly assign patients to either clinically indicated or routine PIVC replacement in order to evaluate a primary endpoint, phlebitis. Secondary endpoints were CRBSI, venous port infection, IVC tip colonization, infusion failure, number of IVCs needed per patient, IV therapy duration, cost, and mortality. Need for PIVC replacement was methodically monitored (Table) with extensive nursing education and interrater validation. The study found no difference in the groups’ phlebitis rates; the rate was 7% for both routine and clinically indicated replacement (13.08% and 13.11%, respectively, adjusted for phlebitis per 1000 IVC days). In addition, there was no difference in the secondary outcome measures, except cost and number of catheters used, both of which favored clinically indicated replacement. The most serious complication, CRBSI, occurred at essentially the same rate in the 2 replacement arms: 0.11% (routine) and 0% (clinically indicated). Per-patient cost for the entire course of treatment was A$69.24 in the routine group and A$61.66 in the clinically indicated group; the difference was A$7.58 (P < 0.0001). Mean number of catheters used was 1.9 in the routine group and 1.7 in the clinically indicated group; the difference was 0.21 catheter per patient for the treatment course (P < 0.0001). Overall, the study found no important difference in significant outcomes between the 2 study arms.

The other 4 studies in the meta-analysis12 duplicated these results, with none finding a higher rate of major adverse events.14-17 All 4 showed virtually equivalent rates of phlebitis, the primary outcome; 3 also examined the secondary outcome measure of blood stream infection, and results were similar, with identical rates of complications. Only 1 trial identified any bloodstream infections (1 per group).15 The meta-analysis did find that routine catheter replacement resulted in less catheter infiltration.
Most of the data on PIVC exchange involves phlebitis and other local complications. A prospective study by Stuart et al.18 and commentary by Collignon et al.19 underscore the need for further research targeting blood stream infections (sepsis and severe sepsis in particular) as a primary outcome. Blood stream infections, especially those related to PIVC use, are rare entities overall, with most recent data yielding an estimated rate of 0.5 per 1000 catheter-days.20 Given this epidemiologic finding, researchers trying to acquire meaningful data on PIVC-related blood stream infections and subsequent complications would need to have tens of thousands of patients in routine and clinically indicated replacement arms to sufficiently power their studies.20 As they are infeasible, such trials cannot be found in the scientific literature.
Stuart et al.18 tried addressing the question. Prospectively examining more than 5 million occupied-bed days and the incidence of bloodstream infections by type of intravascular device over a 5-year period, they found that 137 (23.5%) of 583 healthcare-associated Staphylococcus aureus bacteremia (SAB) cases were attributed to PIVC use. PIVC insertions were performed equally (39.6%) in emergency departments and medical wards. About 45% of PIVCs remained in place 4 days or longer. Stuart et al. noted the “significant issue of PIVC-associated SAB” and favored routine removal of PIVCs within 96 hours (4 days). However, 55% of patients in their PIVC-related SAB group had the device in place less than 4 days. In addition, overall incidence of SAB was low: 0.3 per 10,000 occupied-bed days. Further, their study did not adjust device-specific SAB incidence for frequency of device use. For example, the rate of healthcare-acquired SAB was 19.7% for central venous catheters and 23.5% for PIVCs, despite PIVCs being used significantly more often than central lines. Device-specific adjustments would show a vastly different absolute risk of SAB in relation to individual devices. Nevertheless, the overall benefit of and need for routine PIVC replacement must be questioned. The percentage of PIVC-associated SAB in their study and the need for more research in this area should be noted. Given current information, their study and others in the literature underscore the need for selective use, appropriate maintenance, and timely removal of PIVCs.
Pure clinical outcomes are important, but procedural costs are as well. Clinically indicated replacement helps patients avoid an unpleasant procedure and saves money.21 If one third of the 37 million annual inpatient admissions require a PIVC for more than 3 days, then a strategy of “replacement when clinically indicated” could prevent almost 2.5 million unnecessary PIVC insertions each year. Equipment cost savings combined with savings of nearly 1 million staff hours could yield an estimated $400 million in savings over a 5-year period.22 Given current data suggesting no harm from clinically indicated PIVC replacement and clear evidence that routine replacement increases needle sticks and costs, it seems time to end the practice of routine PIVC replacement.
RECOMMENDATIONS
Compared with clinically indicated catheter replacement, routine replacement in the absence of a clinical indication (eg, infiltration, phlebitis, infection) provides no added benefit. Studies have consistently found that rates of phlebitis and SAB are not affected by scheduled replacement, though the largest RCT may not have been powered to show a difference in SAB. The present authors’ recommendations for PIVC care are:
- Scrutinize each patient’s need for PIVCs and remove each PIVC as soon as possible.
- Do not make routine replacement of otherwise well-functioning, well-appearing clinically necessary PIVCs the standard of care.
- Regularly examine PIVC sites for signs and symptoms of infection.
- Remove a PIVC immediately on recognition of any clinical sign of a complication (eg, infiltration, phlebitis, localized infection, blood stream infection) and replace the PIVC only if there is a clinical need.
- If replacing PIVCs on a clinical basis, establish protocols for frequency of evaluation for complications; these protocols might mirror those from prior studies (Table).10,22
- Replace as soon as possible any PIVC inserted during an urgent or emergent situation in which proper insertion technique could not be guaranteed.
- Conduct real-world observational studies to ensure that the switch to clinically driven replacement is safe and develop standardized definitions of complications.
Given the literature findings and the preceding recommendations, the authors conclude that the patient in the case example does not need routine PIVC replacement. His PIVC may remain in place as long as evaluation for local complications is routinely and methodically performed and the device is removed as soon as it is deemed unnecessary (transition to oral opioid therapy).
CONCLUSION
The long-standing practice of routinely replacing PIVCs every 72 to 96 hours during a hospital stay does not affect any meaningful clinical outcome. Specifically, data do not show that routine replacement prevents phlebitis or blood stream infections. Furthermore, routine PIVC replacement increases patient discomfort, uses resources unnecessarily, and raises hospital costs. Most of the PIVC research has involved phlebitis and other local complications; more research on PIVC use and bloodstream infections is needed. Given the findings in the current literature, routine PIVC replacement should be considered a Thing We Do For No Reason.
Disclosure
Nothing to report.
Do you think this is a low-value practice? Is this truly a “Thing We Do for No Reason”? Share what you do in your practice and join in the conversation online by retweeting it on Twitter (#TWDFNR) and liking it on Facebook. We invite you to propose ideas for other “Things We Do for No Reason” topics by emailing TWDFNR@hospitalmedicine.org.
1. Mermel LA, Allon M, Bouza E, et al. Clinical practice guidelines for the diagnosis and management of intravascular catheter-related infection: 2009 update by the Infectious Diseases Society of America. Clin Infect Dis. 2009;49(1):1-45. PubMed
2. Bregenzer T, Conen D, Sakmann P, Widmer AF. Is routine replacement of peripheral intravenous catheters necessary? Arch Intern Med. 1998;158(2):151-156. PubMed
3. Centers for Disease Control Working Group. Guidelines for prevention of intravenous therapy-related infections. Infect Control. 1981;3:62-79.
4. Hershey CO, Tomford JW, McLaren CE, Porter DK, Cohen DI. The natural history of intravenous catheter-associated phlebitis. Arch Intern Med. 1984;144(7):1373-1375. PubMed
5. Widmer AF. IV-related infections. In: Wenzel RP, ed. Prevention and Control of Nosocomial Infections. 3rd ed. Baltimore, MD: Williams & Wilkins; 1997:556-579.
6. O’Grady NP, Alexander M, Burns LA, et al; Healthcare Infection Control Practices Advisory Committee (HICPAC). Guidelines for the Prevention of Intravascular Catheter-Related Infections, 2011. Centers for Disease Control and Prevention website. http://www.cdc.gov/hicpac/pdf/guidelines/bsi-guidelines-2011.pdf. Published April 1, 2011. Accessed November 5, 2016. PubMed
7. O’Grady NP, Alexander M, Burns LA, et al; Healthcare Infection Control Practices Advisory Committee (HICPAC). Guidelines for the prevention of intravascular catheter-related infections. Clin Infect Dis. 2011;52(9):e162-e193. PubMed
8. Rhode Island Nosocomial Infection Consortium; Tager IB, Ginsberg MB, Ellis SE, et al. An epidemiologic study of the risks associated with peripheral intravenous catheters. Am J Epidemiol. 1983;118(6):839-851. PubMed
9. Maki DG, Ringer M. Risk factors for infusion-related phlebitis with small peripheral venous catheters. A randomized controlled trial. Ann Intern Med. 1991;114(10):845-854. PubMed
10. Barker P, Anderson AD, MacFie J. Randomised clinical trial of elective re-siting of intravenous cannulae. Ann R Coll Surg Engl. 2004;86(4):281-283. PubMed
11. Nishanth S, Sivaram G, Kalayarasan R, Kate V, Ananthakrishnan N. Does elective re-siting of intravenous cannulae decrease peripheral thrombophlebitis? A randomized controlled study. Int Med J India. 2009;22(2):60-62. PubMed
12. Webster J, Osborne S, Rickard CM, New K. Clinically-indicated replacement versus routine replacement of peripheral venous catheters. Cochrane Database Syst Rev. 2015;(8):CD007798. PubMed
13. Rickard CM, Webster J, Wallis MC, et al. Routine versus clinically indicated replacement of peripheral intravenous catheters: a randomised controlled equivalence trial. Lancet. 2012;380(9847):1066-1074. PubMed
14. Webster J, Lloyd S, Hopkins T, Osborne S, Yaxley M. Developing a Research base for Intravenous Peripheral cannula re-sites (DRIP trial). A randomised controlled trial of hospital in-patients. Int J Nurs Stud. 2007;44(5):664-671. PubMed
15. Webster J, Clarke S, Paterson D, et al. Routine care of peripheral intravenous catheters versus clinically indicated replacement: randomised controlled trial. BMJ. 2008;337:a339. PubMed
16. Van Donk P, Rickard CM, McGrail MR, Doolan G. Routine replacement versus clinical monitoring of peripheral intravenous catheters in a regional hospital in the home program: a randomized controlled trial. Infect Control Hosp Epidemiol. 2009;30(9):915-917. PubMed
17. Rickard CM, McCann D, Munnings J, McGrail MR. Routine resite of peripheral intravenous devices every 3 days did not reduce complications compared with clinically indicated resite: a randomised controlled trial. BMC Med. 2010;8:53. PubMed
18. Stuart RL, Cameron DR, Scott C, et al. Peripheral intravenous catheter-associated Staphylococcus aureus bacteraemia: more than 5 years of prospective data from two tertiary health services. Med J Aust. 2013;198(10):551-553. PubMed
19. Collignon PJ, Kimber FJ, Beckingham WD, Roberts JL. Prevention of peripheral intravenous catheter-related bloodstream infections: the need for routine replacement [letter]. Med J Aust. 2013;199(11):750-751. PubMed
20. Maki DG, Kluger DM, Crnich CJ. The risk of bloodstream infection in adults with different intravascular devices: a systematic review of 200 published prospective studies. Mayo Clin Proc. 2006:81(9):1159-1171. PubMed
21. Tuffaha HW, Rickard CM, Webster J, et al. Cost-effectiveness analysis of clinically indicated versus routine replacement of peripheral intravenous catheters. Appl Health Econ Health Policy. 2014;12(1):51-58. PubMed
22. Rickard CM, Webster J, Playford EG. Prevention of peripheral intravenous catheter-related bloodstream infections: the need for a new focus. Med J Aust. 2013;198(10):519-520. PubMed
The “Things We Do for No Reason” (TWDFNR) series reviews practices which have become common parts of hospital care but which may provide little value to our patients. Practices reviewed in the TWDFNR series do not represent “black and white” conclusions or clinical practice standards, but are meant as a starting place for research and active discussions among hospitalists and patients. We invite you to be part of that discussion. https://www.choosingwisely.org/
Hospitals and health systems worldwide have adopted policies for routine replacement of peripheral intravenous catheters (PIVCs) at prespecified time intervals (range, 48-96 hours). This practice accounts for a large number of PIVC reinsertions and places a significant cost burden on the healthcare infrastructure. The authors of this article examine the evidence that has been used to support this practice.
CASE PRESENTATION
A 67-year-old man with metastatic lung cancer presents to a hospital for pain control and “failure to thrive.” In the emergency department, a left antecubital peripheral intravenous catheter (PIVC) is placed. On admission, a prerenal acute kidney injury is noted. During the patient’s entire hospitalization, normal saline with parenteral hydromorphone is administered. On hospital day 4, the pain is still not adequately controlled, and the intravenous opioid is continued. On morning rounds, an intern notes that the PIVC is functioning well, and there are no signs of irritation. However, the nursing staff reminds the team that the PIVC should be changed because it has been in place for 4 days and is “due for replacement.” The patient does not want to receive another skin puncture for routine venous access. Does the PIVC need to be replaced, per routine?
WHY YOU MIGHT THINK ROUTINE PIVC REPLACEMENT IS HELPFUL
PIVC placement is easily the most common procedure performed in the United States. An estimated 200 million PIVCs are placed each year.1 Given the number of inpatient hospital stays per year in the United States alone—more than 37 million1,2—data regarding the care, maintenance, and complications of PIVCs are essential to the healthcare infrastructure.
The recommendation to routinely replace PIVCs dates to 1981, when the Centers for Disease Control and Prevention3 (CDC) issued a guideline that calls for replacing PIVCs every 24 to 48 hours. Most of the data and studies that established that recommendation originated in the 1970s, when catheters varied in length and material, and precise definitions of complications, such as phlebitis—localized vein inflammation characterized by pain, erythema, tenderness, swelling, and a palpable cord4,5—were not standardized across trials. Research at the time suggested higher rates of complications from IVCs dwelling longer than 48 to 72 hours. The latest (2011) CDC guidelines6,7 softened the recommendation but still concluded, “There is no need to replace peripheral catheters more frequently than every 72-96 hours.”
The 2011 recommendation6,7 is based on findings of a 1983 prospective observational study,8 a 1991 randomized controlled trial (RCT),9 and a 1998 prospective observational study.2 The 1983 and 1991 studies found higher rates of PIVC complications after day 2 of cannulation.8,9 The 1998 study found no increase in the rate of complications after day 3 of catheterization, and its authors, recommending a reevaluation of the need to routinely replace PIVCs, wrote, “[The] hazard for catheter-related complications, phlebitis, catheter-related infections, and mechanical complications did not increase during prolonged catheterization.”2
Results of RCTs conducted by Barker et al.10 (2004) and Nishanth et al.11 (2009) supported the claim that routine replacement of PIVCs leads to lower rates of thrombophlebitis. Nishanth et al. also included site pain and cannula dislodgement in their definition of phlebitis. Neither study compared blood stream infection rates, but both found higher rates of phlebitis between day 2.5 and day 3. However, Cochrane reviewers Webster et al.12 questioned the findings of these 2 trials, given their missing data and possibly biased results and conclusions. In the Barker study, patient numbers (screened, eligible, dropout) were unclear; each patient group was unbalanced; protocol deviations were not reported (possibly a result of incomplete data reporting or inappropriate randomization); and varied definitions of phlebitis were allowed, which may have resulted in more events being included. In the Nishanth study, the 100% phlebitis rate for the clinically indicated replacement group seemed extreme, which suggested confounding by an unknown bias or chance. Last, both samples were small: 47 patients (Barker) and 42 patients (Nishanth). Given all these concerns, the 2 trials were excluded from the Cochrane meta-analysis on the subject.12
In the 1980s and early 1990s, routine removal and exchange of PIVCs were supported by limited evidence. Current well-designed trial data cast doubt on the need for such a practice.
WHY YOU SHOULD NOT ROUTINELY REPLACE PIVCs
According to the CDC,6,7 the issue of routine PIVC replacement remains unresolved: “No recommendation is made regarding replacement of peripheral catheters in adults only when clinically indicated.”
Whereas earlier data showed a higher risk of complications with longer dwelling IVs, the majority of contemporary data has failed to support this conclusion. The recent (2015) Cochrane meta-analysis comparing routine with clinically indicated IVC replacement found “no evidence to support changing catheters every 72-96 hours.”12 Of the 7 studies that fulfilled the criteria for qualitative analysis, only 5 were included (the studies by Barker et al.10 and Nishanth et al.11 were excluded). The included studies assessed the endpoints of catheter-related blood stream infection (CRBSI), phlebitis, phlebitis per device-days, mortality, cost, and infiltration. Statistically significant differences were found only for cost (favoring clinically indicated replacement) and infiltration (occurring less with routine replacement).
The largest and most robust RCT in the meta-analysis12 was conducted by Rickard et al.13 (2012). Their nonblinded, intention-to-treat study of 3283 patients used concealed allocation to randomly assign patients to either clinically indicated or routine PIVC replacement in order to evaluate a primary endpoint, phlebitis. Secondary endpoints were CRBSI, venous port infection, IVC tip colonization, infusion failure, number of IVCs needed per patient, IV therapy duration, cost, and mortality. Need for PIVC replacement was methodically monitored (Table) with extensive nursing education and interrater validation. The study found no difference in the groups’ phlebitis rates; the rate was 7% for both routine and clinically indicated replacement (13.08% and 13.11%, respectively, adjusted for phlebitis per 1000 IVC days). In addition, there was no difference in the secondary outcome measures, except cost and number of catheters used, both of which favored clinically indicated replacement. The most serious complication, CRBSI, occurred at essentially the same rate in the 2 replacement arms: 0.11% (routine) and 0% (clinically indicated). Per-patient cost for the entire course of treatment was A$69.24 in the routine group and A$61.66 in the clinically indicated group; the difference was A$7.58 (P < 0.0001). Mean number of catheters used was 1.9 in the routine group and 1.7 in the clinically indicated group; the difference was 0.21 catheter per patient for the treatment course (P < 0.0001). Overall, the study found no important difference in significant outcomes between the 2 study arms.
The other 4 studies in the meta-analysis12 duplicated these results, with none finding a higher rate of major adverse events.14-17 All 4 showed virtually equivalent rates of phlebitis, the primary outcome; 3 also examined the secondary outcome measure of blood stream infection, and results were similar, with identical rates of complications. Only 1 trial identified any bloodstream infections (1 per group).15 The meta-analysis did find that routine catheter replacement resulted in less catheter infiltration.
Most of the data on PIVC exchange involves phlebitis and other local complications. A prospective study by Stuart et al.18 and commentary by Collignon et al.19 underscore the need for further research targeting blood stream infections (sepsis and severe sepsis in particular) as a primary outcome. Blood stream infections, especially those related to PIVC use, are rare entities overall, with most recent data yielding an estimated rate of 0.5 per 1000 catheter-days.20 Given this epidemiologic finding, researchers trying to acquire meaningful data on PIVC-related blood stream infections and subsequent complications would need to have tens of thousands of patients in routine and clinically indicated replacement arms to sufficiently power their studies.20 As they are infeasible, such trials cannot be found in the scientific literature.
Stuart et al.18 tried addressing the question. Prospectively examining more than 5 million occupied-bed days and the incidence of bloodstream infections by type of intravascular device over a 5-year period, they found that 137 (23.5%) of 583 healthcare-associated Staphylococcus aureus bacteremia (SAB) cases were attributed to PIVC use. PIVC insertions were performed equally (39.6%) in emergency departments and medical wards. About 45% of PIVCs remained in place 4 days or longer. Stuart et al. noted the “significant issue of PIVC-associated SAB” and favored routine removal of PIVCs within 96 hours (4 days). However, 55% of patients in their PIVC-related SAB group had the device in place less than 4 days. In addition, overall incidence of SAB was low: 0.3 per 10,000 occupied-bed days. Further, their study did not adjust device-specific SAB incidence for frequency of device use. For example, the rate of healthcare-acquired SAB was 19.7% for central venous catheters and 23.5% for PIVCs, despite PIVCs being used significantly more often than central lines. Device-specific adjustments would show a vastly different absolute risk of SAB in relation to individual devices. Nevertheless, the overall benefit of and need for routine PIVC replacement must be questioned. The percentage of PIVC-associated SAB in their study and the need for more research in this area should be noted. Given current information, their study and others in the literature underscore the need for selective use, appropriate maintenance, and timely removal of PIVCs.
Pure clinical outcomes are important, but procedural costs are as well. Clinically indicated replacement helps patients avoid an unpleasant procedure and saves money.21 If one third of the 37 million annual inpatient admissions require a PIVC for more than 3 days, then a strategy of “replacement when clinically indicated” could prevent almost 2.5 million unnecessary PIVC insertions each year. Equipment cost savings combined with savings of nearly 1 million staff hours could yield an estimated $400 million in savings over a 5-year period.22 Given current data suggesting no harm from clinically indicated PIVC replacement and clear evidence that routine replacement increases needle sticks and costs, it seems time to end the practice of routine PIVC replacement.
RECOMMENDATIONS
Compared with clinically indicated catheter replacement, routine replacement in the absence of a clinical indication (eg, infiltration, phlebitis, infection) provides no added benefit. Studies have consistently found that rates of phlebitis and SAB are not affected by scheduled replacement, though the largest RCT may not have been powered to show a difference in SAB. The present authors’ recommendations for PIVC care are:
- Scrutinize each patient’s need for PIVCs and remove each PIVC as soon as possible.
- Do not make routine replacement of otherwise well-functioning, well-appearing clinically necessary PIVCs the standard of care.
- Regularly examine PIVC sites for signs and symptoms of infection.
- Remove a PIVC immediately on recognition of any clinical sign of a complication (eg, infiltration, phlebitis, localized infection, blood stream infection) and replace the PIVC only if there is a clinical need.
- If replacing PIVCs on a clinical basis, establish protocols for frequency of evaluation for complications; these protocols might mirror those from prior studies (Table).10,22
- Replace as soon as possible any PIVC inserted during an urgent or emergent situation in which proper insertion technique could not be guaranteed.
- Conduct real-world observational studies to ensure that the switch to clinically driven replacement is safe and develop standardized definitions of complications.
Given the literature findings and the preceding recommendations, the authors conclude that the patient in the case example does not need routine PIVC replacement. His PIVC may remain in place as long as evaluation for local complications is routinely and methodically performed and the device is removed as soon as it is deemed unnecessary (transition to oral opioid therapy).
CONCLUSION
The long-standing practice of routinely replacing PIVCs every 72 to 96 hours during a hospital stay does not affect any meaningful clinical outcome. Specifically, data do not show that routine replacement prevents phlebitis or blood stream infections. Furthermore, routine PIVC replacement increases patient discomfort, uses resources unnecessarily, and raises hospital costs. Most of the PIVC research has involved phlebitis and other local complications; more research on PIVC use and bloodstream infections is needed. Given the findings in the current literature, routine PIVC replacement should be considered a Thing We Do For No Reason.
Disclosure
Nothing to report.
Do you think this is a low-value practice? Is this truly a “Thing We Do for No Reason”? Share what you do in your practice and join in the conversation online by retweeting it on Twitter (#TWDFNR) and liking it on Facebook. We invite you to propose ideas for other “Things We Do for No Reason” topics by emailing TWDFNR@hospitalmedicine.org.
1. Mermel LA, Allon M, Bouza E, et al. Clinical practice guidelines for the diagnosis and management of intravascular catheter-related infection: 2009 update by the Infectious Diseases Society of America. Clin Infect Dis. 2009;49(1):1-45. PubMed
2. Bregenzer T, Conen D, Sakmann P, Widmer AF. Is routine replacement of peripheral intravenous catheters necessary? Arch Intern Med. 1998;158(2):151-156. PubMed
3. Centers for Disease Control Working Group. Guidelines for prevention of intravenous therapy-related infections. Infect Control. 1981;3:62-79.
4. Hershey CO, Tomford JW, McLaren CE, Porter DK, Cohen DI. The natural history of intravenous catheter-associated phlebitis. Arch Intern Med. 1984;144(7):1373-1375. PubMed
5. Widmer AF. IV-related infections. In: Wenzel RP, ed. Prevention and Control of Nosocomial Infections. 3rd ed. Baltimore, MD: Williams & Wilkins; 1997:556-579.
6. O’Grady NP, Alexander M, Burns LA, et al; Healthcare Infection Control Practices Advisory Committee (HICPAC). Guidelines for the Prevention of Intravascular Catheter-Related Infections, 2011. Centers for Disease Control and Prevention website. http://www.cdc.gov/hicpac/pdf/guidelines/bsi-guidelines-2011.pdf. Published April 1, 2011. Accessed November 5, 2016. PubMed
7. O’Grady NP, Alexander M, Burns LA, et al; Healthcare Infection Control Practices Advisory Committee (HICPAC). Guidelines for the prevention of intravascular catheter-related infections. Clin Infect Dis. 2011;52(9):e162-e193. PubMed
8. Rhode Island Nosocomial Infection Consortium; Tager IB, Ginsberg MB, Ellis SE, et al. An epidemiologic study of the risks associated with peripheral intravenous catheters. Am J Epidemiol. 1983;118(6):839-851. PubMed
9. Maki DG, Ringer M. Risk factors for infusion-related phlebitis with small peripheral venous catheters. A randomized controlled trial. Ann Intern Med. 1991;114(10):845-854. PubMed
10. Barker P, Anderson AD, MacFie J. Randomised clinical trial of elective re-siting of intravenous cannulae. Ann R Coll Surg Engl. 2004;86(4):281-283. PubMed
11. Nishanth S, Sivaram G, Kalayarasan R, Kate V, Ananthakrishnan N. Does elective re-siting of intravenous cannulae decrease peripheral thrombophlebitis? A randomized controlled study. Int Med J India. 2009;22(2):60-62. PubMed
12. Webster J, Osborne S, Rickard CM, New K. Clinically-indicated replacement versus routine replacement of peripheral venous catheters. Cochrane Database Syst Rev. 2015;(8):CD007798. PubMed
13. Rickard CM, Webster J, Wallis MC, et al. Routine versus clinically indicated replacement of peripheral intravenous catheters: a randomised controlled equivalence trial. Lancet. 2012;380(9847):1066-1074. PubMed
14. Webster J, Lloyd S, Hopkins T, Osborne S, Yaxley M. Developing a Research base for Intravenous Peripheral cannula re-sites (DRIP trial). A randomised controlled trial of hospital in-patients. Int J Nurs Stud. 2007;44(5):664-671. PubMed
15. Webster J, Clarke S, Paterson D, et al. Routine care of peripheral intravenous catheters versus clinically indicated replacement: randomised controlled trial. BMJ. 2008;337:a339. PubMed
16. Van Donk P, Rickard CM, McGrail MR, Doolan G. Routine replacement versus clinical monitoring of peripheral intravenous catheters in a regional hospital in the home program: a randomized controlled trial. Infect Control Hosp Epidemiol. 2009;30(9):915-917. PubMed
17. Rickard CM, McCann D, Munnings J, McGrail MR. Routine resite of peripheral intravenous devices every 3 days did not reduce complications compared with clinically indicated resite: a randomised controlled trial. BMC Med. 2010;8:53. PubMed
18. Stuart RL, Cameron DR, Scott C, et al. Peripheral intravenous catheter-associated Staphylococcus aureus bacteraemia: more than 5 years of prospective data from two tertiary health services. Med J Aust. 2013;198(10):551-553. PubMed
19. Collignon PJ, Kimber FJ, Beckingham WD, Roberts JL. Prevention of peripheral intravenous catheter-related bloodstream infections: the need for routine replacement [letter]. Med J Aust. 2013;199(11):750-751. PubMed
20. Maki DG, Kluger DM, Crnich CJ. The risk of bloodstream infection in adults with different intravascular devices: a systematic review of 200 published prospective studies. Mayo Clin Proc. 2006:81(9):1159-1171. PubMed
21. Tuffaha HW, Rickard CM, Webster J, et al. Cost-effectiveness analysis of clinically indicated versus routine replacement of peripheral intravenous catheters. Appl Health Econ Health Policy. 2014;12(1):51-58. PubMed
22. Rickard CM, Webster J, Playford EG. Prevention of peripheral intravenous catheter-related bloodstream infections: the need for a new focus. Med J Aust. 2013;198(10):519-520. PubMed
© 2017 Society of Hospital Medicine
Shellfish Allergies and CT Scans
The Things We Do for No Reason (TWDFNR) series reviews practices which have become common parts of hospital care but which may provide little value to our patients. Practices reviewed in the TWDFNR series do not represent black and white conclusions or clinical practice standards, but are meant as a starting place for research and active discussions among hospitalists and patients. We invite you to be part of that discussion. https://www.choosingwisely.org/

A 55‐year‐old patient with a history of chronic obstructive pulmonary disease and diabetes mellitus presented to the emergency room with acute shortness of breath and right leg swelling that began 1 week after lumbar disk surgery. The emergency department team decides against ordering a chest CT scan with contrast to evaluate for a possible pulmonary embolism after noting that the patient's allergies include shellfish, which cause urticaria and facial edema. A ventilation‐perfusion scan reveals heterogeneous perfusion defects consistent with an intermediate probability (20%80%) for pulmonary embolism. The treating physicians consider starting the patient on a steroid regimen to prepare him for a CT scan with IV contrast, while presumptively anticoagulating the patient for 24 hours in order for the steroids to provide maximal protective effect before obtaining the scan. Should a history of shellfish allergy affect decision making regarding whether to administer IV contrast?
WHY YOU MIGHT THINK ASKING ABOUT SHELLFISH ALLERGIES BEFORE PERFORMING CONTRAST‐ENHANCED CT SCANS IS HELPFUL
Fish and shellfish contain iodine, and allergic reactions to seafood are quite common, with a prevalence ranging anywhere between 2% and 6% of the population.[1] As a result, patients with suspected shellfish allergies are often told by providers that they are allergic to iodine. In 1 study, nearly 92% of patients presenting to a pediatrics clinic with a suspected seafood or shellfish allergy cited iodine as the culprit.[2] As contrast‐enhanced CT scans utilize a variety of iodine‐based agents, patients are often told to avoid CT scans with iodinated contrast agents or receive corticosteroid/antihistamine premedications prior to undergoing CT scans to mitigate potentially life‐threatening allergic reactions. A survey of radiologists and interventional cardiologists revealed that 65.3% and 88.9%, respectively, asked about seafood or shellfish allergies prior to administering contrast enhanced CT scans, and 34.7% and 50.0%, respectively, stated that they would withhold contrast media or recommend premedication with corticosteroid/antihistamines for patients with seafood or shellfish allergy.[2]
WHY ASKING ABOUT SHELLFISH ALLERGIES BEFORE IV CONTRAST CT SCANS DOES NOT REDUCE THE RISK OF CONTRAST REACTIONS
What Causes Allergic‐Like Reactions to Fish and Shellfish?
Allergic reactions are inappropriate or exaggerated immune response (hypersensitivity reaction). Four types of hypersensitivity reactions have been described (type IIV)[3]; allergic reactions mediated by immunoglobulin E (IgE) represent type I hypersensitivity reactions.
Although fish and shellfish contain iodine, so too do a wide variety of commonly consumed foods (eg, yogurt, milk, bread). In addition, our bodies contain and require sufficient quantities of iodine for basic functions, making immune reactions to such an essential ingredient of life unlikely. Instead, fish and shellfish contain proteins (parvalbumin and tropomyosins, respectively), which act as the major allergens, not iodine.[4]
What Causes Reactions to IV Contrast Media?
Around the world, tens of millions of injections occur every year for contrast‐enhanced scans.[5] Reactions to IV contrast media are not uncommon, occurring anywhere between 0.6% and 17% of the time, with severe reactions occurring between 0.02% and 0.5% of the time.[6] Higher reaction rates were associated with the use of higher‐osmolarity contrast agents. A review of research studies found a lower rate of reactions to IV contrast in eras in which low‐osmolarity agents were exclusively used (0.2% after 1991) versus eras in which high‐osmolarity agents were exclusively used (7.0% between 1985 and 1986).[7]
Reactions to contrast include allergic‐like reactions as well as a variety of other reactions (eg, arrhythmias, vasovagal reactions, flushing), which are thought to be related to the dose and concentration of contrast media.[8]
Allergic‐like, or anaphylactoid, reactions related to contrast are largely thought to have a fundamentally different molecular mechanism than true classic allergic reactions. Anaphylactoid reactions are caused by direct release of histamine into the bloodstream in response to interacting with chemicals. These reactions are not related to or mediated by IgE antibodies and do not require prior exposure.
True classic allergic reactions, on the other hand, are mediated by IgE antibodies in which initial exposure to an allergen (antigen) is followed by subsequent exposure and production of IgE antibodies.[9] The allergenIgE antibody complex causes the degranulation of mast cells and basophils, leading to the release of histamines.
Reactions to IV contrast are likely related to some component of the contrast media instead of the iodine itself. It is thought that the majority of these reactions are anaphylactoid reactions instead of true classic allergic reactions, given that IgE antibodies are not consistently elevated in patients who exhibit these reactions.[8] Nevertheless, the symptoms of these 2 types of reactions (anaphylactoid and allergic reactions) are similar and require comparable treatment to prevent life‐threatening anaphylaxis.
What Are the Major Risk Factors for Allergic‐Like Contrast Reactions?
Previous studies on risk factors for allergic‐like contrast reactions suggest that the strongest predictor of future contrast reactions is a history of prior contrast reaction (5‐fold higher risk), with an estimated 10% to 35% recurrence risk of contrast reactions.[8] Patients with a history of atopy, asthma, and food allergies (including seafood) are at approximately 2 to 3 times greater risk of contrast reactions.[9]
Do Shellfish Allergies Place Patients at Higher Risk for Contrast Reactions Than Other Allergies?
In 1 of the few studies evaluating seafood allergies specifically, Witten et al. compared the frequency of contrast reactions in patients with histories of seafood allergy, food allergy, asthma, hay fever, hives, and contrast medium.[10] Using their results, we compared the frequency of reactions in patients with histories of seafood allergy (6.3%, 4/64) to patients with any other type of allergy or atopic state (9.2%, 212/2304) and found no statistically significant differences (P = 0.418). Similarly, Shehadi evaluated seafood as well as asthma, hay fever, common medications (eg, penicillin, aspirin, morphine), and others.[11] A reanalysis of the results found no statistically significant differences comparing the frequencies of contrast reactions in patients with seafood allergy (15.0%) compared with other allergens (eggs, milk and chocolate, 14.6%; general allergies, 13.1%; fruit allergies, 12.9%; asthma, 11.2%; P values ranging between 0.2 and 0.6).[6] Overall, the results suggest that patients with seafood allergy are at no higher risk for having a contrast reaction compared with patients with other food allergies or other forms of atopy.
Additionally, seafood and other food allergies should be distinguished from food intolerances in which the ingestion of histamine‐rich materials in conjunction with histamine inhibitors (drugs or alcohol) leads to symptoms that can mimic allergic‐like reactions (urticaria, pruritus, diarrhea, asthma).[12]
What Do the Guidelines Recommend?
For patients who require IV contrast media for CT scans, the American Academy of Allergy, Asthma, and Immunology recommends not routinely ordering lowiso‐osmolar radiocontrast media or pretreating with corticosteroids and antihistamines for patients with a history of seafood allergy.[13] The American College of Radiology recommends pretreatment with corticosteroids only for those patients who have previously experienced moderate to severe reactions to IV contrast.[8]
WHAT YOU SHOULD DO INSTEAD: ASK ABOUT PRIOR CONTRAST REACTIONS BEFORE ADMINISTERING CONTRAST
When a patient presents for a contrast‐enhanced CT scan, patients should be asked if they have experienced reactions to contrast and the severity and type of the associated reactions. Providers and support staff should not ask specifically about shellfish allergies, as they have not been found to be associated with an elevated risk of contrast reactions compared with other allergens. Although all allergies seem to increase the likelihood of having a reaction to contrast, only a history of previous contrast reactions will prompt a change in management. Asking specifically about seafood allergies before performing an IV contrast CT scan is a Thing We Do for No Reason.
RECOMMENDATIONS
- Before performing contrast‐enhanced CT scans, patients should be asked if they have experienced reactions to IV contrast. There is no reason for providers and support staff to specifically inquire about seafood allergies.
- Patients with seafood and other food allergies do not require premedication prior to CT scans. Seafood and other food allergies do not represent contraindications to obtaining contrast‐enhanced CT scans and should not prompt a change in management.
Disclosures
The authors do not have any relevant financial disclosures to report.
Do you think this is a low‐value practice? Is this truly a Thing We Do for No Reason? Share what you do in your practice and join in the conversation online by retweeting it on Twitter (#TWDFNR) and liking It on Facebook. We invite you to propose ideas for other Things We Do for No Reason topics by emailing TWDFNR@hospitalmedicine.org
The Things We Do for No Reason (TWDFNR) series reviews practices which have become common parts of hospital care but which may provide little value to our patients. Practices reviewed in the TWDFNR series do not represent black and white conclusions or clinical practice standards, but are meant as a starting place for research and active discussions among hospitalists and patients. We invite you to be part of that discussion. https://www.choosingwisely.org/
A 55‐year‐old patient with a history of chronic obstructive pulmonary disease and diabetes mellitus presented to the emergency room with acute shortness of breath and right leg swelling that began 1 week after lumbar disk surgery. The emergency department team decides against ordering a chest CT scan with contrast to evaluate for a possible pulmonary embolism after noting that the patient's allergies include shellfish, which cause urticaria and facial edema. A ventilation‐perfusion scan reveals heterogeneous perfusion defects consistent with an intermediate probability (20%80%) for pulmonary embolism. The treating physicians consider starting the patient on a steroid regimen to prepare him for a CT scan with IV contrast, while presumptively anticoagulating the patient for 24 hours in order for the steroids to provide maximal protective effect before obtaining the scan. Should a history of shellfish allergy affect decision making regarding whether to administer IV contrast?
WHY YOU MIGHT THINK ASKING ABOUT SHELLFISH ALLERGIES BEFORE PERFORMING CONTRAST‐ENHANCED CT SCANS IS HELPFUL
Fish and shellfish contain iodine, and allergic reactions to seafood are quite common, with a prevalence ranging anywhere between 2% and 6% of the population.[1] As a result, patients with suspected shellfish allergies are often told by providers that they are allergic to iodine. In 1 study, nearly 92% of patients presenting to a pediatrics clinic with a suspected seafood or shellfish allergy cited iodine as the culprit.[2] As contrast‐enhanced CT scans utilize a variety of iodine‐based agents, patients are often told to avoid CT scans with iodinated contrast agents or receive corticosteroid/antihistamine premedications prior to undergoing CT scans to mitigate potentially life‐threatening allergic reactions. A survey of radiologists and interventional cardiologists revealed that 65.3% and 88.9%, respectively, asked about seafood or shellfish allergies prior to administering contrast enhanced CT scans, and 34.7% and 50.0%, respectively, stated that they would withhold contrast media or recommend premedication with corticosteroid/antihistamines for patients with seafood or shellfish allergy.[2]
WHY ASKING ABOUT SHELLFISH ALLERGIES BEFORE IV CONTRAST CT SCANS DOES NOT REDUCE THE RISK OF CONTRAST REACTIONS
What Causes Allergic‐Like Reactions to Fish and Shellfish?
Allergic reactions are inappropriate or exaggerated immune response (hypersensitivity reaction). Four types of hypersensitivity reactions have been described (type IIV)[3]; allergic reactions mediated by immunoglobulin E (IgE) represent type I hypersensitivity reactions.
Although fish and shellfish contain iodine, so too do a wide variety of commonly consumed foods (eg, yogurt, milk, bread). In addition, our bodies contain and require sufficient quantities of iodine for basic functions, making immune reactions to such an essential ingredient of life unlikely. Instead, fish and shellfish contain proteins (parvalbumin and tropomyosins, respectively), which act as the major allergens, not iodine.[4]
What Causes Reactions to IV Contrast Media?
Around the world, tens of millions of injections occur every year for contrast‐enhanced scans.[5] Reactions to IV contrast media are not uncommon, occurring anywhere between 0.6% and 17% of the time, with severe reactions occurring between 0.02% and 0.5% of the time.[6] Higher reaction rates were associated with the use of higher‐osmolarity contrast agents. A review of research studies found a lower rate of reactions to IV contrast in eras in which low‐osmolarity agents were exclusively used (0.2% after 1991) versus eras in which high‐osmolarity agents were exclusively used (7.0% between 1985 and 1986).[7]
Reactions to contrast include allergic‐like reactions as well as a variety of other reactions (eg, arrhythmias, vasovagal reactions, flushing), which are thought to be related to the dose and concentration of contrast media.[8]
Allergic‐like, or anaphylactoid, reactions related to contrast are largely thought to have a fundamentally different molecular mechanism than true classic allergic reactions. Anaphylactoid reactions are caused by direct release of histamine into the bloodstream in response to interacting with chemicals. These reactions are not related to or mediated by IgE antibodies and do not require prior exposure.
True classic allergic reactions, on the other hand, are mediated by IgE antibodies in which initial exposure to an allergen (antigen) is followed by subsequent exposure and production of IgE antibodies.[9] The allergenIgE antibody complex causes the degranulation of mast cells and basophils, leading to the release of histamines.
Reactions to IV contrast are likely related to some component of the contrast media instead of the iodine itself. It is thought that the majority of these reactions are anaphylactoid reactions instead of true classic allergic reactions, given that IgE antibodies are not consistently elevated in patients who exhibit these reactions.[8] Nevertheless, the symptoms of these 2 types of reactions (anaphylactoid and allergic reactions) are similar and require comparable treatment to prevent life‐threatening anaphylaxis.
What Are the Major Risk Factors for Allergic‐Like Contrast Reactions?
Previous studies on risk factors for allergic‐like contrast reactions suggest that the strongest predictor of future contrast reactions is a history of prior contrast reaction (5‐fold higher risk), with an estimated 10% to 35% recurrence risk of contrast reactions.[8] Patients with a history of atopy, asthma, and food allergies (including seafood) are at approximately 2 to 3 times greater risk of contrast reactions.[9]
Do Shellfish Allergies Place Patients at Higher Risk for Contrast Reactions Than Other Allergies?
In 1 of the few studies evaluating seafood allergies specifically, Witten et al. compared the frequency of contrast reactions in patients with histories of seafood allergy, food allergy, asthma, hay fever, hives, and contrast medium.[10] Using their results, we compared the frequency of reactions in patients with histories of seafood allergy (6.3%, 4/64) to patients with any other type of allergy or atopic state (9.2%, 212/2304) and found no statistically significant differences (P = 0.418). Similarly, Shehadi evaluated seafood as well as asthma, hay fever, common medications (eg, penicillin, aspirin, morphine), and others.[11] A reanalysis of the results found no statistically significant differences comparing the frequencies of contrast reactions in patients with seafood allergy (15.0%) compared with other allergens (eggs, milk and chocolate, 14.6%; general allergies, 13.1%; fruit allergies, 12.9%; asthma, 11.2%; P values ranging between 0.2 and 0.6).[6] Overall, the results suggest that patients with seafood allergy are at no higher risk for having a contrast reaction compared with patients with other food allergies or other forms of atopy.
Additionally, seafood and other food allergies should be distinguished from food intolerances in which the ingestion of histamine‐rich materials in conjunction with histamine inhibitors (drugs or alcohol) leads to symptoms that can mimic allergic‐like reactions (urticaria, pruritus, diarrhea, asthma).[12]
What Do the Guidelines Recommend?
For patients who require IV contrast media for CT scans, the American Academy of Allergy, Asthma, and Immunology recommends not routinely ordering lowiso‐osmolar radiocontrast media or pretreating with corticosteroids and antihistamines for patients with a history of seafood allergy.[13] The American College of Radiology recommends pretreatment with corticosteroids only for those patients who have previously experienced moderate to severe reactions to IV contrast.[8]
WHAT YOU SHOULD DO INSTEAD: ASK ABOUT PRIOR CONTRAST REACTIONS BEFORE ADMINISTERING CONTRAST
When a patient presents for a contrast‐enhanced CT scan, patients should be asked if they have experienced reactions to contrast and the severity and type of the associated reactions. Providers and support staff should not ask specifically about shellfish allergies, as they have not been found to be associated with an elevated risk of contrast reactions compared with other allergens. Although all allergies seem to increase the likelihood of having a reaction to contrast, only a history of previous contrast reactions will prompt a change in management. Asking specifically about seafood allergies before performing an IV contrast CT scan is a Thing We Do for No Reason.
RECOMMENDATIONS
- Before performing contrast‐enhanced CT scans, patients should be asked if they have experienced reactions to IV contrast. There is no reason for providers and support staff to specifically inquire about seafood allergies.
- Patients with seafood and other food allergies do not require premedication prior to CT scans. Seafood and other food allergies do not represent contraindications to obtaining contrast‐enhanced CT scans and should not prompt a change in management.
Disclosures
The authors do not have any relevant financial disclosures to report.
Do you think this is a low‐value practice? Is this truly a Thing We Do for No Reason? Share what you do in your practice and join in the conversation online by retweeting it on Twitter (#TWDFNR) and liking It on Facebook. We invite you to propose ideas for other Things We Do for No Reason topics by emailing TWDFNR@hospitalmedicine.org
© 2015 Society of Hospital Medicine
Carotid Artery Ultrasound for Syncope
The Things We Do for No Reason (TWDFNR) series reviews practices which have become common parts of hospital care but which may provide little value to our patients. Practices reviewed in the TWDFNR series do not represent black and white conclusions or clinical practice standards, but are meant as a starting place for research and active discussions among hospitalists and patients. We invite you to be part of that discussion. https://www.choosingwisely.org/

CASE PRESENTATION
A 66‐year‐old man with a history of hypertension is hospitalized for a transient loss of consciousness while shopping at a farmers market with his wife on a hot summer day. He recalls feeling lightheaded seconds before he lost consciousness. He had no chest pain, diaphoresis, dyspnea, shaking movements, slurred speech, or head trauma. He felt mildly fatigued following the episode, but has since returned to his baseline. Physical examination, including a thorough cardiac and neurological examination, is normal. The hospitalist ponders whether to order a carotid artery ultrasound as part of a syncope evaluation.
BRIEF OVERVIEW
Syncope is defined as a rapid onset loss of consciousness of short duration as a result of global cerebral hypoperfusion with loss of postural tone, which is followed by spontaneous and complete recovery.[1] This definition describes syncope as a symptom rather than a disease. The challenge for providers is to determine the etiology of the syncope along with its attendant risk of morbidity and mortality. Given the wide variety of etiologies and concern over potentially missing an important etiology, diagnostic testing can become elaborate, expensive, and frequently low yield.
In the adult population, it is believed that approximately 35% of individuals will experience a syncopal episode in their lifetime.[2] As a result, syncope accounts for 1% to 3% of all emergency department visits and 1% to 6% of hospital admissions from emergency departments in the United States.[3, 4] The incidence and rate of hospitalization increase with age, as does the risk of mortality.[5, 6] There are 3 main types of syncope: cardiac, neurocardiogenic (vasovagal), and orthostatic. The presence of associated signs or symptoms with the syncope helps to differentiate the type and complexity of the syncope, while helping guide the diagnostic evaluation. Simple syncope is defined as the absence of focal neurological deficits or other signs or symptoms suggestive of transient ischemic attack (TIA) or cerebrovascular accident (CVA).[7] A differential diagnosis for a transient loss of consciousness that includes TIA and CVA will prompt a very different evaluation.
WHY YOU MIGHT THINK ORDERING CAROTID ARTERY ULTRASOUNDS FOR SYNCOPE EVALUATION ARE HELPFUL
Carotid artery ultrasounds are used to assess the extracranial carotid arteries for the presence of stenosis and to determine the direction of blood flow. The use of carotid artery ultrasound as a diagnostic tool in the evaluation of syncope can be traced to multiple articles from the 1980s. These articles noted the utility of screening patients with dizziness, lightheadedness, or syncope using carotid artery ultrasound due to possible decreased flow in the carotid artery circulation affecting cerebral perfusion.[8, 9] An association was noted between these symptoms and the presence of carotid artery stenosis. Further, a 1997 position paper from the American College of Physicians recommended that carotid artery or transcranial ultrasonography be reserved for syncope patients with carotid artery bruits or a history of neurovascular signs or symptoms.[10] More recent studies reveal carotid artery ultrasounds are still being performed regularly in syncope patients. In 2 studies evaluating syncope in the elderly, approximately 13% to 16% of syncope patients had a carotid artery ultrasound performed in an effort to identify an etiology.[7, 11]
Additionally, practitioners sometimes choose to perform carotid artery ultrasound in the evaluation of carotid sinus hypersensitivity. The carotid artery ultrasound can assess for the presence of stenosis or atheroma prior to performing carotid sinus massage, although the rate of persistent neurological complications from carotid sinus massage is estimated to occur in 1:1000 patients.[12]
WHY THERE IS NO REASON TO ORDER CAROTID ARTERY ULTRASOUNDS FOR THE EVALUATION OF SIMPLE SYNCOPE
Carotid artery ultrasounds are unlikely to determine the etiology of the syncope. We should expect a high‐value test to reveal an etiology for the syncope episodes at a significant rate. In the 2009 study by Mendu et al. at YaleNew Haven Hospital, 267 ultrasounds were performed on 2106 syncope admissions of high‐risk elderly patients (1920 total patients).[11] Of the 267 ultrasounds, only 2 of the tests (0.8%) helped to determine an etiology. Although 46% of the ultrasounds had abnormal findings, the measuring stick for these studies should be whether they uncover the etiology for syncope, not whether they find other unrelated vascular disease. In contrast, performing postural blood pressures helped to determine an etiology 15% to 21% of the time, depending on the criteria used to define an abnormal drop in postural blood pressures.
Similarly, in the 2005 study by Schnipper et al. at Massachusetts General Hospital, only 140 of 4199 adult patients (3.3%) who presented as either inpatients or outpatients for syncope or presyncope were referred for neurovascular testing.[13] Carotid artery ultrasound was performed in 109 of these patients, and the study neurologist could invoke cerebrovascular lesions as potential factors for syncope in only 2 patients, both of whom had syncope and focal neurologic symptoms. Moreover, both of the patients had severe cardiovascular disease (severe ischemic cardiomyopathy with complete heart block following coronary bypass surgery in 1 and aortic stenosis with decreased left ventricular ejection fraction in the other). It is quite possible that the ultrasounds did not find the etiology for any of the 140 high‐risk patients with syncope in the study.
In addition, the 2014 study by Scott et al. at Brigham and Women's Hospital analyzed carotid artery duplex ultrasounds performed on 313 inpatients and outpatients with syncope over a 5‐year period, excluding those with focal neurological deficits or carotid bruits.[7] Although 48 of the 313 patients (15.4%) were diagnosed with carotid stenosis of greater than 50%, the carotid artery ultrasound did not reveal a causal diagnosis in any patients. On the other hand, 7 patients had a change in medical management, and 1 patient underwent carotid endarterectomy following the carotid artery ultrasound, which was incidental to what prompted the evaluation.
Mendu et al. calculated the cost per test affecting the diagnosis or management of syncope (although diagnosis is the only important parameter). The cost per test was calculated as the charge per test multiplied by the cost‐to‐charge ratio of 0.34, based on the 2007 YaleNew Haven Hospital cost‐to‐charge ratio.[11] For carotid artery ultrasound, the cost per test was $19,580 to affect diagnosis or management as compared to $23 to $33 for postural blood pressures. Combining these findings with the results from the Schnipper et al. and Scott et al. articles, where carotid artery ultrasounds may not have found the cause of syncope in any of the patients, it seems clear that obtaining a carotid artery ultrasound in the evaluation of simple syncope is a low‐value proposition.
Many low‐value tests, like carotid artery ultrasounds, suffer from both upfront costs, as calculated in the Mendu et al. study, and downstream costs triggered by the testing itself. Performing carotid artery ultrasounds in elderly high‐risk syncope populations is likely to reveal asymptomatic carotid artery vascular disease, which may lead to more unwarranted testing or treatments in light of the initial indication for the test. In the Mendu et al. article, 122 (46%) of the 267 carotid artery ultrasounds performed on elderly patients admitted with syncope were abnormal. Abnormal findings were defined as any abnormality that was not seen on prior testing as written in the test reports. Similarly, Schnipper et al. found that 40% of the 140 highly selected patients had mild‐to‐severe carotid vascular disease.
National guideline recommendations are aligned with these findings. The National Institute for Health and Clinical Excellence Guideline for the Management of Transient Loss of Consciousness does not include carotid artery ultrasound in the summary of clinical recommendations.[14] Furthermore, the American Academy of Neurology Choosing Wisely campaign's recommendation 2 is: Do not perform imaging of the carotid arteries for simple syncope without other neurologic symptoms.[15]
WHAT YOU SHOULD DO INSTEAD: CHECK POSTURAL BLOOD PRESSURES
As is true for most of medicine, greater focus should be paid to the history and physical examination during the initial evaluation of the patient with syncope. Take great care to determine which patients have a history or symptoms concerning for neurologic or cardiac etiologies. Use this information to guide further diagnostic testing. Additionally, orthostatic testing is too often overlooked as an important diagnostic study. As described in the Mendu et al. study, orthostatic testing is inexpensive and effective, helping to determine an etiology 15% to 21% of the time. Carotid artery ultrasounds should be reserved for those patients with transient or permanent focal neurological symptoms.
RECOMMENDATIONS
- In patients suspected of syncope in the absence of other neurologic symptoms, carotid artery ultrasound should not be included in the diagnostic evaluation.
- Utilize postural blood pressures in the initial evaluation of syncope as an inexpensive and high‐value component of the physical examination.
- For patients with acute neurological findings in the setting of possible syncope, evaluate the patient for stroke.
- Use the history and physical examination to guide further evaluation.
CONCLUSION
Carotid artery ultrasounds should not be used to evaluate the cause of syncope in an effort to find incident symptomatic carotid vascular disease. Carotid artery ultrasounds rarely help determine the etiology of the syncopal episode and are more likely to find asymptomatic carotid vascular disease in the elderly population. The identification of carotid vascular disease can lead to further inappropriate testing and treatments unrelated to the indication for testing.
Acknowledgment
Disclosure: Nothing to report.
Do you think this is a low‐value practice? Is this truly a Thing We Do for No Reason? Share what you do in your practice and join in the conversation online by retweeting it on Twitter (#TWDFNR) and liking it on Facebook. We invite you to propose ideas for other Things We Do for No Reason topics by emailing TWDFNR@hospitalmedicine.org.
- . Syncope. N Engl J Med. 2000;313(25):1856–1862.
- , , , , , . Lifetime cumulative incidence of syncope in the general population: a study of 549 Dutch subjects aged 35–60 years. J Cardiovasc Electrophysiol. 2006;17(11):1172–1176.
- . Evaluation and management of patients with syncope. JAMA. 1992;268(18):2553–2560.
- , , . Characteristics and admission patterns of patients presenting with syncope to U.S. emergency departments, 1992 to 2000. Acad Emerg Med. 2004;11:1029–1034.
- , . An approach to the evaluation and management of syncope in adults. BMJ. 2010;340:c880.
- , , , et al. Incidence and prognosis of syncope. N Engl J Med. 2002;347(12):878–885.
- , , , , . Choosing wisely for syncope: low‐value carotid ultrasound use. J Am Heart Assoc. 2014;3(4):e001063.
- , , . Hemodynamics of the carotid‐artery circulation in the elderly “dizzy” patient. J Am Geriatr Soc. 1981;29(9):402–406.
- . Clinical applications of noninvasive carotid artery testing. J Am Coll Cardiol. 1985;5(1):137–148.
- , , , , , . Diagnosing syncope. Part 2: unexplained syncope. Clinical efficacy assessment project of the American College of Physicians. Ann Intern Med. 1997;127(1):76–86.
- , , , , . Yield of diagnostic tests in evaluating syncopal episodes in older patients. Arch Intern Med. 2009;169(14):1299–1305.
- , , , , , . Complications of carotid sinus massage—a prospective series of older patients. Age Ageing. 2000;29(5):413–417.
- , , , . Diagnostic yield and utility of neurovascular ultrasonography in the evaluation of patients with syncope. Mayo Clin Proc. 2005;80(4):480–488.
- , , , et al. Transient Loss of Consciousness (‘Blackouts’) Management in Adults and Young People. NICE Clinical Guidelines, No. 109. London, UK: National Clinical Guideline Centre for Acute and Chronic Conditions, Royal College of Physicians; 2010.
- , , , et al. The American Academy of Neurology's top five choosing wisely recommendations. Neurology. 2013;81(11):1004–1011.
The Things We Do for No Reason (TWDFNR) series reviews practices which have become common parts of hospital care but which may provide little value to our patients. Practices reviewed in the TWDFNR series do not represent black and white conclusions or clinical practice standards, but are meant as a starting place for research and active discussions among hospitalists and patients. We invite you to be part of that discussion. https://www.choosingwisely.org/
CASE PRESENTATION
A 66‐year‐old man with a history of hypertension is hospitalized for a transient loss of consciousness while shopping at a farmers market with his wife on a hot summer day. He recalls feeling lightheaded seconds before he lost consciousness. He had no chest pain, diaphoresis, dyspnea, shaking movements, slurred speech, or head trauma. He felt mildly fatigued following the episode, but has since returned to his baseline. Physical examination, including a thorough cardiac and neurological examination, is normal. The hospitalist ponders whether to order a carotid artery ultrasound as part of a syncope evaluation.
BRIEF OVERVIEW
Syncope is defined as a rapid onset loss of consciousness of short duration as a result of global cerebral hypoperfusion with loss of postural tone, which is followed by spontaneous and complete recovery.[1] This definition describes syncope as a symptom rather than a disease. The challenge for providers is to determine the etiology of the syncope along with its attendant risk of morbidity and mortality. Given the wide variety of etiologies and concern over potentially missing an important etiology, diagnostic testing can become elaborate, expensive, and frequently low yield.
In the adult population, it is believed that approximately 35% of individuals will experience a syncopal episode in their lifetime.[2] As a result, syncope accounts for 1% to 3% of all emergency department visits and 1% to 6% of hospital admissions from emergency departments in the United States.[3, 4] The incidence and rate of hospitalization increase with age, as does the risk of mortality.[5, 6] There are 3 main types of syncope: cardiac, neurocardiogenic (vasovagal), and orthostatic. The presence of associated signs or symptoms with the syncope helps to differentiate the type and complexity of the syncope, while helping guide the diagnostic evaluation. Simple syncope is defined as the absence of focal neurological deficits or other signs or symptoms suggestive of transient ischemic attack (TIA) or cerebrovascular accident (CVA).[7] A differential diagnosis for a transient loss of consciousness that includes TIA and CVA will prompt a very different evaluation.
WHY YOU MIGHT THINK ORDERING CAROTID ARTERY ULTRASOUNDS FOR SYNCOPE EVALUATION ARE HELPFUL
Carotid artery ultrasounds are used to assess the extracranial carotid arteries for the presence of stenosis and to determine the direction of blood flow. The use of carotid artery ultrasound as a diagnostic tool in the evaluation of syncope can be traced to multiple articles from the 1980s. These articles noted the utility of screening patients with dizziness, lightheadedness, or syncope using carotid artery ultrasound due to possible decreased flow in the carotid artery circulation affecting cerebral perfusion.[8, 9] An association was noted between these symptoms and the presence of carotid artery stenosis. Further, a 1997 position paper from the American College of Physicians recommended that carotid artery or transcranial ultrasonography be reserved for syncope patients with carotid artery bruits or a history of neurovascular signs or symptoms.[10] More recent studies reveal carotid artery ultrasounds are still being performed regularly in syncope patients. In 2 studies evaluating syncope in the elderly, approximately 13% to 16% of syncope patients had a carotid artery ultrasound performed in an effort to identify an etiology.[7, 11]
Additionally, practitioners sometimes choose to perform carotid artery ultrasound in the evaluation of carotid sinus hypersensitivity. The carotid artery ultrasound can assess for the presence of stenosis or atheroma prior to performing carotid sinus massage, although the rate of persistent neurological complications from carotid sinus massage is estimated to occur in 1:1000 patients.[12]
WHY THERE IS NO REASON TO ORDER CAROTID ARTERY ULTRASOUNDS FOR THE EVALUATION OF SIMPLE SYNCOPE
Carotid artery ultrasounds are unlikely to determine the etiology of the syncope. We should expect a high‐value test to reveal an etiology for the syncope episodes at a significant rate. In the 2009 study by Mendu et al. at YaleNew Haven Hospital, 267 ultrasounds were performed on 2106 syncope admissions of high‐risk elderly patients (1920 total patients).[11] Of the 267 ultrasounds, only 2 of the tests (0.8%) helped to determine an etiology. Although 46% of the ultrasounds had abnormal findings, the measuring stick for these studies should be whether they uncover the etiology for syncope, not whether they find other unrelated vascular disease. In contrast, performing postural blood pressures helped to determine an etiology 15% to 21% of the time, depending on the criteria used to define an abnormal drop in postural blood pressures.
Similarly, in the 2005 study by Schnipper et al. at Massachusetts General Hospital, only 140 of 4199 adult patients (3.3%) who presented as either inpatients or outpatients for syncope or presyncope were referred for neurovascular testing.[13] Carotid artery ultrasound was performed in 109 of these patients, and the study neurologist could invoke cerebrovascular lesions as potential factors for syncope in only 2 patients, both of whom had syncope and focal neurologic symptoms. Moreover, both of the patients had severe cardiovascular disease (severe ischemic cardiomyopathy with complete heart block following coronary bypass surgery in 1 and aortic stenosis with decreased left ventricular ejection fraction in the other). It is quite possible that the ultrasounds did not find the etiology for any of the 140 high‐risk patients with syncope in the study.
In addition, the 2014 study by Scott et al. at Brigham and Women's Hospital analyzed carotid artery duplex ultrasounds performed on 313 inpatients and outpatients with syncope over a 5‐year period, excluding those with focal neurological deficits or carotid bruits.[7] Although 48 of the 313 patients (15.4%) were diagnosed with carotid stenosis of greater than 50%, the carotid artery ultrasound did not reveal a causal diagnosis in any patients. On the other hand, 7 patients had a change in medical management, and 1 patient underwent carotid endarterectomy following the carotid artery ultrasound, which was incidental to what prompted the evaluation.
Mendu et al. calculated the cost per test affecting the diagnosis or management of syncope (although diagnosis is the only important parameter). The cost per test was calculated as the charge per test multiplied by the cost‐to‐charge ratio of 0.34, based on the 2007 YaleNew Haven Hospital cost‐to‐charge ratio.[11] For carotid artery ultrasound, the cost per test was $19,580 to affect diagnosis or management as compared to $23 to $33 for postural blood pressures. Combining these findings with the results from the Schnipper et al. and Scott et al. articles, where carotid artery ultrasounds may not have found the cause of syncope in any of the patients, it seems clear that obtaining a carotid artery ultrasound in the evaluation of simple syncope is a low‐value proposition.
Many low‐value tests, like carotid artery ultrasounds, suffer from both upfront costs, as calculated in the Mendu et al. study, and downstream costs triggered by the testing itself. Performing carotid artery ultrasounds in elderly high‐risk syncope populations is likely to reveal asymptomatic carotid artery vascular disease, which may lead to more unwarranted testing or treatments in light of the initial indication for the test. In the Mendu et al. article, 122 (46%) of the 267 carotid artery ultrasounds performed on elderly patients admitted with syncope were abnormal. Abnormal findings were defined as any abnormality that was not seen on prior testing as written in the test reports. Similarly, Schnipper et al. found that 40% of the 140 highly selected patients had mild‐to‐severe carotid vascular disease.
National guideline recommendations are aligned with these findings. The National Institute for Health and Clinical Excellence Guideline for the Management of Transient Loss of Consciousness does not include carotid artery ultrasound in the summary of clinical recommendations.[14] Furthermore, the American Academy of Neurology Choosing Wisely campaign's recommendation 2 is: Do not perform imaging of the carotid arteries for simple syncope without other neurologic symptoms.[15]
WHAT YOU SHOULD DO INSTEAD: CHECK POSTURAL BLOOD PRESSURES
As is true for most of medicine, greater focus should be paid to the history and physical examination during the initial evaluation of the patient with syncope. Take great care to determine which patients have a history or symptoms concerning for neurologic or cardiac etiologies. Use this information to guide further diagnostic testing. Additionally, orthostatic testing is too often overlooked as an important diagnostic study. As described in the Mendu et al. study, orthostatic testing is inexpensive and effective, helping to determine an etiology 15% to 21% of the time. Carotid artery ultrasounds should be reserved for those patients with transient or permanent focal neurological symptoms.
RECOMMENDATIONS
- In patients suspected of syncope in the absence of other neurologic symptoms, carotid artery ultrasound should not be included in the diagnostic evaluation.
- Utilize postural blood pressures in the initial evaluation of syncope as an inexpensive and high‐value component of the physical examination.
- For patients with acute neurological findings in the setting of possible syncope, evaluate the patient for stroke.
- Use the history and physical examination to guide further evaluation.
CONCLUSION
Carotid artery ultrasounds should not be used to evaluate the cause of syncope in an effort to find incident symptomatic carotid vascular disease. Carotid artery ultrasounds rarely help determine the etiology of the syncopal episode and are more likely to find asymptomatic carotid vascular disease in the elderly population. The identification of carotid vascular disease can lead to further inappropriate testing and treatments unrelated to the indication for testing.
Acknowledgment
Disclosure: Nothing to report.
Do you think this is a low‐value practice? Is this truly a Thing We Do for No Reason? Share what you do in your practice and join in the conversation online by retweeting it on Twitter (#TWDFNR) and liking it on Facebook. We invite you to propose ideas for other Things We Do for No Reason topics by emailing TWDFNR@hospitalmedicine.org.
- . Syncope. N Engl J Med. 2000;313(25):1856–1862.
- , , , , , . Lifetime cumulative incidence of syncope in the general population: a study of 549 Dutch subjects aged 35–60 years. J Cardiovasc Electrophysiol. 2006;17(11):1172–1176.
- . Evaluation and management of patients with syncope. JAMA. 1992;268(18):2553–2560.
- , , . Characteristics and admission patterns of patients presenting with syncope to U.S. emergency departments, 1992 to 2000. Acad Emerg Med. 2004;11:1029–1034.
- , . An approach to the evaluation and management of syncope in adults. BMJ. 2010;340:c880.
- , , , et al. Incidence and prognosis of syncope. N Engl J Med. 2002;347(12):878–885.
- , , , , . Choosing wisely for syncope: low‐value carotid ultrasound use. J Am Heart Assoc. 2014;3(4):e001063.
- , , . Hemodynamics of the carotid‐artery circulation in the elderly “dizzy” patient. J Am Geriatr Soc. 1981;29(9):402–406.
- . Clinical applications of noninvasive carotid artery testing. J Am Coll Cardiol. 1985;5(1):137–148.
- , , , , , . Diagnosing syncope. Part 2: unexplained syncope. Clinical efficacy assessment project of the American College of Physicians. Ann Intern Med. 1997;127(1):76–86.
- , , , , . Yield of diagnostic tests in evaluating syncopal episodes in older patients. Arch Intern Med. 2009;169(14):1299–1305.
- , , , , , . Complications of carotid sinus massage—a prospective series of older patients. Age Ageing. 2000;29(5):413–417.
- , , , . Diagnostic yield and utility of neurovascular ultrasonography in the evaluation of patients with syncope. Mayo Clin Proc. 2005;80(4):480–488.
- , , , et al. Transient Loss of Consciousness (‘Blackouts’) Management in Adults and Young People. NICE Clinical Guidelines, No. 109. London, UK: National Clinical Guideline Centre for Acute and Chronic Conditions, Royal College of Physicians; 2010.
- , , , et al. The American Academy of Neurology's top five choosing wisely recommendations. Neurology. 2013;81(11):1004–1011.
© 2015 Society of Hospital Medicine
Serum and Red Blood Cell Folate Testing
The Things We Do for No Reason (TWDFNR) series reviews practices which have become common parts of hospital care but which may provide little value to our patients. Practices reviewed in the TWDFNR series do not represent black and white conclusions or clinical practice standards, but are meant as a starting place for research and active discussions among hospitalists and patients. We invite you to be part of that discussion. https://www.choosingwisely.org/

CASE PRESENTATION
A 65‐year‐old man is admitted with pneumonia. Review of the medical record reveals a persistent macrocytic anemia (hematocrit 29%, hemoglobin 9.3 g/dL, mean corpuscular volume [MCV] 105 fL) with a low reticulocyte count and normal peripheral blood smear. The provider contemplates ordering a serum folate or red blood cell (RBC) folate test to workup the persistent macrocytic anemia.
BACKGROUND
Folate is a water‐soluble B vitamin essential for the synthesis of DNA and for converting homocysteine to methionine. Folate deficiency is causally linked with both neural tube defects and megaloblastic anemia. Low levels of folate are associated with cardiovascular disease, colon cancer, neuropathy, depression, hypercoagulability, and cognitive decline, though there is a paucity of evidence showing causation or risk reduction with folate supplementation.[1] In patients with inadequate folate intake, the earliest sign is a decline in serum folate levels, followed by a fall in RBC folate levels. Only weeks later do macrocytosis, megaloblastic bone marrow, and finally anemia occur.[2] Given that humans are unable to synthesize folate and are therefore dependent on dietary sources, those with inadequate intake or absorption are at risk of folate deficiency.
WHY FOLATE TESTING IS ORDERED
In hospitalized patients, the most common indication for folate testing is anemia, either with or without macrocytosis.[3, 4] Given that at least 10% to 15% of hospitalized patients are anemic,[5, 6] it is unsurprising that folate testing is frequently performed. Despite the link between folate deficiency and megaloblastic anemia, >85% of patients evaluated for folate deficiency have normocytic or microcytic anemia.[3, 4] In addition, a study found that 30% of all folate testing was performed not as part of an anemia workup but in the evaluation of other comorbidities (eg, dementia and altered mental status) that are not causally linked to folate deficiency.[7]
WHY THERE IS NO REASON TO ORDER FOLATE TESTING
There are 2 reasons why testing hospitalized patients for folate deficiency does not contribute value: (1) the poor characteristics of the tests used and (2) the low prevalence of folate deficiency in the postfortification era.
There is no accepted gold standard for the diagnosis of folate deficiency, though biological assays are considered more accurate than the now more commonly used protein binding assays.[8] The lack of a gold standard limits the ability to fully quantify the sensitivity and specificity of either serum or RBC folate testing, though falsely low and high serum folate results can be seen. Falsely low serum levels (false positives) are found with heavy alcohol use and with certain anticonvulsant or antineoplastic drug use.[9] The low levels in these patients indicate low serum folate but do not necessarily reflect tissue stores. Serum folate levels may fall rapidly within a few days of the start of low dietary folate intake, resulting in low serum folate levels that also do not represent true folate deficiency.[10] On the other hand, intake of folatethrough a meal or ingestion of an oral supplementdirectly preceding evaluation of serum folate can lead to falsely elevated levels (false negatives).[10]
Although RBC folate reflects body stores and is largely unaffected by diet, the available tests also lack sensitivity and specificity.[11] Furthermore, serum folate levels and RBC folate levels correlate well.[12] Because RBC folate testing is more expensive than serum folate testing, has results that correlate well with serum folate testing, and is without significantly better test characteristics, there is no added value to using RBC folate testing as compared to serum folate testing.
In addition to the issues with available diagnostic tests, numerous studies now indicate that the rate of folate deficiency in the United States is exceptionally low. This is largely driven by the United States Food and Drug Administration's mandate that all grain products be fortified with 0.14 mg of folic acid per gram of grains.[13] Fortification has been overwhelmingly successful at increasing folic acid intake[14, 15] and reducing the incidence of neural tube defects.[16] Although the serum and RBC folate tests are prone to inaccuracies for an individual patient, population trends postfortification, coupled with the data on intake and rates of neural tube defects, make a strong argument that the prevalence of deficiency has decreased dramatically.
Similar to these population‐based trends, studies of hospital‐based laboratories have shown a marked decrease in the rate of low serum and RBC folate levels, making for a very low pretest probability for folate deficiency (Table 1). Even before fortification had been fully implemented, a study of outpatients and inpatients cared for at 3 hospitals in Denver, Colorado in 1996 found that just 1.9% of patients had low serum folate levels and 4.4% had low RBC folate levels.[17] A retrospective study of 26,662 patients in 1998 showed a rate of serum deficiency (<2.7 ng/mL) of 0.3%.[18] The authors also found that despite a decline in rate of serum deficiency from 1.3% to 0.3% between 1994 and 1998, the total number of serum folate tests performed increased by 84%. A similar study found just 0.4% of 1007 patients with low serum folate levels (<3.0 ng/mL).[7] Parallel results have been seen in other countries after implementation of folate fortification with a cohort of 2154 Canadian patients reporting low serum folate (<6.8 nmol/L) and RBC folate (<417 nmol/L) levels in just 0.5% and 0.7% of patients, respectively.[19]
| Author, Study Year | Year of Testing | Country | Population | Serum Folate | Red Blood Cell Folate | ||||
|---|---|---|---|---|---|---|---|---|---|
| Patients (n) | Samples (n) | Low (%) | Patients (n) | Samples (n) | Low (%) | ||||
| Latif et al., [4] | 2001 | United States | Inpatient/outpatient | 4,315 | 4,689 | 1.6 | 1,215 | 1,335 | 1.2 |
| Shojania et al., 2010[19] | 2001 | Canada | Inpatient/outpatient | 2,154 | 0.5 | 560 | 0.7 | ||
| Ashraf et al., [7] | 2002 | United States | Inpatient/outpatient | 980 | 1,007 | 0.4 | |||
| Gudgeon et al., 2014[20] | 2010 | Canada | Inpatient | 2,563 | 0.2 | ||||
| Theisen‐Toupal et al., [3] | 2011 | United States | Inpatient/emergency department | 1,944 | 2,093 | 0.1 | |||
Few studies have looked exclusively at hospitalized and emergency room patients. In an evaluation of 2093 serum folate tests performed on hospitalized or emergency room patients (98.1% of whom were admitted) in 2011, only 2 (0.1%) deficient levels (<3 ng/mL) were identified, 1 of which was associated with a macrocytic anemia.[3] A similar study of RBC folate levels in 2562 patients at 3 Canadian hospitals found just 4 (0.16%) levels to be low (<254 nmol/L), only 1 of which was associated with macrocytic anemia.[20]
When examining only patients with macrocytic anemia, the rates of folate deficiency are only slightly higher than the general population. As noted above, each of the 2 studies of inpatients uncovered just 1 patient with macrocytic anemia and concomitant low serum or RBC folate levels.[3, 20] Other studies reveal rates of serum folate deficiency in patients with macrocytic anemia and macrocytosis of 2.8%[7] and 1%,[21] respectively, and RBC folate deficiency rates in patients with macrocytosis of 1.8%.[22] Patients with extreme macrocytosis (MCV >130) represent 1 subset of patients with a high pretest probability of low serum folate, with 1 study reporting low levels in 37% of patients.[23]
Despite the relatively inexpensive cost per serum and RBC folate test, expenses per test that result in an abnormally low level are significant. As the pretest probability for folate deficiency is extremely low, tests must be ordered on a large number of patients to find 1 patient with levels suggesting deficiency. For example, a study found that an institution charged $151 per serum folate test, which amounted to $158,000 per deficient result.[3] The institutional cost was <$2.00 per serum folate test and <$2093 per deficient result. Another study reported the institutional cost of RBC folate to be $12.54 per test and $8035 per deficient result.[20] The charges and costs are institution specific and will vary. However, in light of the low pretest probability of testing, any expense associated with these tests represents low value.
WHAT YOU SHOULD DO INSTEAD
The clinician in our case presentation is facing a common scenarioa patient with persistent anemia without a known etiology. The treatment of suspected or confirmed folate deficiency includes improving diet or adding a folic acid supplement, a low‐cost (as little $0.01 per tablet) intervention. Furthermore, other at‐risk patients (eg, those with sickle cell disease, alcoholism, or malabsorption) may be candidates for long‐term supplementation regardless of serum folate and/or RBC folate testing results.
Folate deficiency in patients living in the United States and Canada is exceedingly rare, making the pretest probability of testing low. Furthermore, even patients with typical hematologic characteristics for folate deficiency (anemia and macrocytosis) are unlikely to have folate deficiency. Importantly, there are no nonhematologic indications to test for folate deficiency, and testing those patients, just as in the general population, yields an extremely low rate of folate deficiency. The tests themselves are unreliable and inaccurate, and fortunately, treatment is cheap, easy to administer, and can be done empirically. In other words, testing for folate deficiency is a Thing We Do for No Reason.
RECOMMENDATIONS
In patients suspected of having folate deficiency or who are at high risk of folate deficiency (eg, diet poor in folate‐rich or folic acid fortified foods), treat with a diet containing folate or folic acid fortified foods and/or a supplement containing 400 to 1000 g of folic acid. Approximately 1 to 2 weeks following initiation of treatment, a complete blood count should be performed to evaluate for an appropriate increase in hematocrit/hemoglobin and decrease in MCV.[24] Once a full hematologic response is seen, treatment beyond this time is not required unless the cause (eg, malnutrition) persists.
Serum folate and RBC folate tests should not be routinely ordered. Even in those with macrocytic anemia, the pretest probability of folate deficiency remains low. Although testing may suggest a folate deficiency, it is still more likely there is another cause for the patient's anemia. This places providers at risk for premature closure. For patients such as the one presented in the case presentation, obtaining B12 levels is of greater importance, given the higher prevalence and the risks of untreated deficiency.
For patients in whom the pretest probability of folate deficiency is high (eg, those with an MCV >130), obtain fasting serum folate levels on samples taken before supplementation has begun or a diet administered.
Disclosures
Dr. Feldman is a consultant to Maven Medical, LLC. Maven Medical is a healthcare software startup.
Do you think this is a low‐value practice? Is this truly a Thing We Do for No Reason? Share what you do in your practice and join in the conversation online by retweeting it on Twitter (#TWDFNR) and Liking It on Facebook. We invite you to propose ideas for other Things We Do for No Reason topics by emailing TWDFNR@hospitalmedicine.org.
- Folic acid: nutritional biochemistry, molecular biology, and role in disease processes. Mol Genet Metab. 2000;71(1‐2):121–138.
- Experimental nutritional folate deficiency in man. Trans Assoc Am Physicians. 1962;75:307–320.
- , , Utility, charge, and cost of inpatient and emergency department serum folate testing. J Hosp Med. 2013;8(2):91–95.
- , , , Is there a role for folate determinations in current clinical practice in the USA? Clin Lab Haematol. 2004;26(6):379–383.
- , , , , Prevalence and impact of anemia in hospitalized patients. South Med J. 2013;106(3):202–206.
- Healthcare Cost and Utilization Project (HCUP). HCUP facts and figures: statistics on hospital‐based care in the United States, 2009. Rockville, MD: Agency for Healthcare Research and Quality; 2011.
- , , Clinical utility of folic acid testing for patients with anemia or dementia. J Gen Intern Med. 2008;23(6):824–826.
- Utility of measuring serum or red blood cell folate in the era of folate fortification of flour. Clin Biochem. 2014;47(7‐8):533–538.
- Kelley's Textbook of Internal Medicine. Philadelphia, PA: Lippincott Williams 2000.
- Problems in the diagnosis and investigation of megaloblastic anemia. Can Med Assoc J. 1980;122(9):999–1004.
- Laboratory diagnosis of vitamin B12 and folate deficiency: a guide for the primary care physician. Arch Intern Med. 1999;159(12):1289–1298.
- , Erythrocyte folate levels: a clinical study. Am J Hematol. 1991;36(2):116–21.
- US Food and Drug Administration. Food standards: amendments of standards of identity for enriched grain products to require addition of folic acid. Fed Regist. 1996;61:8781–8797.
- , Effect of food fortification on folic acid intake in the United States. Am J Clin Nutr. 2003;77(1):221–225.
- , , , , , Folic acid intake from fortification in United States exceeds predictions. J Nutr. 2002;132(9):2792–2798.
- , , , , Impact of folic acid fortification of the US food supply on the occurrence of neural tube defects. JAMA. 2001;285(23):2981–2986.
- , Lack of clinical utility of folate levels in the evaluation of macrocytosis or anemia. Am J Med. 2001;110(2):88–90.
- , , , Trends in serum folate after food fortification. Lancet. 1999;354(9182):915–916.
- , Ordering folate assays is no longer justified for investigation of anemias, in folic acid fortified countries. BMC Res Notes. 2010;3:22.
- , Folate testing in hospital inpatients. Am J Med. 2015;128(1):56–59.
- , , , , Etiology and diagnostic evaluation of macrocytosis. Am J Med Sci. 2000;319(6):343–352.
- , , Diminished need for folate measurements among indigent populations in the post folic acid supplementation era. Arch Pathol Lab Med. 2007;131(3):477–480.
- , , , et al. Etiologies and diagnostic work‐up of extreme macrocytosis defined by an erythrocyte mean corpuscular volume over 130°fL: s study of 109 patients. Am J Hematol. 2014;89(6):665–666.
- , , , et al. Best practice in primary care pathology: review 1. J Clin Pathol. 2005;58(10):1016–1024.
The Things We Do for No Reason (TWDFNR) series reviews practices which have become common parts of hospital care but which may provide little value to our patients. Practices reviewed in the TWDFNR series do not represent black and white conclusions or clinical practice standards, but are meant as a starting place for research and active discussions among hospitalists and patients. We invite you to be part of that discussion. https://www.choosingwisely.org/
CASE PRESENTATION
A 65‐year‐old man is admitted with pneumonia. Review of the medical record reveals a persistent macrocytic anemia (hematocrit 29%, hemoglobin 9.3 g/dL, mean corpuscular volume [MCV] 105 fL) with a low reticulocyte count and normal peripheral blood smear. The provider contemplates ordering a serum folate or red blood cell (RBC) folate test to workup the persistent macrocytic anemia.
BACKGROUND
Folate is a water‐soluble B vitamin essential for the synthesis of DNA and for converting homocysteine to methionine. Folate deficiency is causally linked with both neural tube defects and megaloblastic anemia. Low levels of folate are associated with cardiovascular disease, colon cancer, neuropathy, depression, hypercoagulability, and cognitive decline, though there is a paucity of evidence showing causation or risk reduction with folate supplementation.[1] In patients with inadequate folate intake, the earliest sign is a decline in serum folate levels, followed by a fall in RBC folate levels. Only weeks later do macrocytosis, megaloblastic bone marrow, and finally anemia occur.[2] Given that humans are unable to synthesize folate and are therefore dependent on dietary sources, those with inadequate intake or absorption are at risk of folate deficiency.
WHY FOLATE TESTING IS ORDERED
In hospitalized patients, the most common indication for folate testing is anemia, either with or without macrocytosis.[3, 4] Given that at least 10% to 15% of hospitalized patients are anemic,[5, 6] it is unsurprising that folate testing is frequently performed. Despite the link between folate deficiency and megaloblastic anemia, >85% of patients evaluated for folate deficiency have normocytic or microcytic anemia.[3, 4] In addition, a study found that 30% of all folate testing was performed not as part of an anemia workup but in the evaluation of other comorbidities (eg, dementia and altered mental status) that are not causally linked to folate deficiency.[7]
WHY THERE IS NO REASON TO ORDER FOLATE TESTING
There are 2 reasons why testing hospitalized patients for folate deficiency does not contribute value: (1) the poor characteristics of the tests used and (2) the low prevalence of folate deficiency in the postfortification era.
There is no accepted gold standard for the diagnosis of folate deficiency, though biological assays are considered more accurate than the now more commonly used protein binding assays.[8] The lack of a gold standard limits the ability to fully quantify the sensitivity and specificity of either serum or RBC folate testing, though falsely low and high serum folate results can be seen. Falsely low serum levels (false positives) are found with heavy alcohol use and with certain anticonvulsant or antineoplastic drug use.[9] The low levels in these patients indicate low serum folate but do not necessarily reflect tissue stores. Serum folate levels may fall rapidly within a few days of the start of low dietary folate intake, resulting in low serum folate levels that also do not represent true folate deficiency.[10] On the other hand, intake of folatethrough a meal or ingestion of an oral supplementdirectly preceding evaluation of serum folate can lead to falsely elevated levels (false negatives).[10]
Although RBC folate reflects body stores and is largely unaffected by diet, the available tests also lack sensitivity and specificity.[11] Furthermore, serum folate levels and RBC folate levels correlate well.[12] Because RBC folate testing is more expensive than serum folate testing, has results that correlate well with serum folate testing, and is without significantly better test characteristics, there is no added value to using RBC folate testing as compared to serum folate testing.
In addition to the issues with available diagnostic tests, numerous studies now indicate that the rate of folate deficiency in the United States is exceptionally low. This is largely driven by the United States Food and Drug Administration's mandate that all grain products be fortified with 0.14 mg of folic acid per gram of grains.[13] Fortification has been overwhelmingly successful at increasing folic acid intake[14, 15] and reducing the incidence of neural tube defects.[16] Although the serum and RBC folate tests are prone to inaccuracies for an individual patient, population trends postfortification, coupled with the data on intake and rates of neural tube defects, make a strong argument that the prevalence of deficiency has decreased dramatically.
Similar to these population‐based trends, studies of hospital‐based laboratories have shown a marked decrease in the rate of low serum and RBC folate levels, making for a very low pretest probability for folate deficiency (Table 1). Even before fortification had been fully implemented, a study of outpatients and inpatients cared for at 3 hospitals in Denver, Colorado in 1996 found that just 1.9% of patients had low serum folate levels and 4.4% had low RBC folate levels.[17] A retrospective study of 26,662 patients in 1998 showed a rate of serum deficiency (<2.7 ng/mL) of 0.3%.[18] The authors also found that despite a decline in rate of serum deficiency from 1.3% to 0.3% between 1994 and 1998, the total number of serum folate tests performed increased by 84%. A similar study found just 0.4% of 1007 patients with low serum folate levels (<3.0 ng/mL).[7] Parallel results have been seen in other countries after implementation of folate fortification with a cohort of 2154 Canadian patients reporting low serum folate (<6.8 nmol/L) and RBC folate (<417 nmol/L) levels in just 0.5% and 0.7% of patients, respectively.[19]
| Author, Study Year | Year of Testing | Country | Population | Serum Folate | Red Blood Cell Folate | ||||
|---|---|---|---|---|---|---|---|---|---|
| Patients (n) | Samples (n) | Low (%) | Patients (n) | Samples (n) | Low (%) | ||||
| Latif et al., [4] | 2001 | United States | Inpatient/outpatient | 4,315 | 4,689 | 1.6 | 1,215 | 1,335 | 1.2 |
| Shojania et al., 2010[19] | 2001 | Canada | Inpatient/outpatient | 2,154 | 0.5 | 560 | 0.7 | ||
| Ashraf et al., [7] | 2002 | United States | Inpatient/outpatient | 980 | 1,007 | 0.4 | |||
| Gudgeon et al., 2014[20] | 2010 | Canada | Inpatient | 2,563 | 0.2 | ||||
| Theisen‐Toupal et al., [3] | 2011 | United States | Inpatient/emergency department | 1,944 | 2,093 | 0.1 | |||
Few studies have looked exclusively at hospitalized and emergency room patients. In an evaluation of 2093 serum folate tests performed on hospitalized or emergency room patients (98.1% of whom were admitted) in 2011, only 2 (0.1%) deficient levels (<3 ng/mL) were identified, 1 of which was associated with a macrocytic anemia.[3] A similar study of RBC folate levels in 2562 patients at 3 Canadian hospitals found just 4 (0.16%) levels to be low (<254 nmol/L), only 1 of which was associated with macrocytic anemia.[20]
When examining only patients with macrocytic anemia, the rates of folate deficiency are only slightly higher than the general population. As noted above, each of the 2 studies of inpatients uncovered just 1 patient with macrocytic anemia and concomitant low serum or RBC folate levels.[3, 20] Other studies reveal rates of serum folate deficiency in patients with macrocytic anemia and macrocytosis of 2.8%[7] and 1%,[21] respectively, and RBC folate deficiency rates in patients with macrocytosis of 1.8%.[22] Patients with extreme macrocytosis (MCV >130) represent 1 subset of patients with a high pretest probability of low serum folate, with 1 study reporting low levels in 37% of patients.[23]
Despite the relatively inexpensive cost per serum and RBC folate test, expenses per test that result in an abnormally low level are significant. As the pretest probability for folate deficiency is extremely low, tests must be ordered on a large number of patients to find 1 patient with levels suggesting deficiency. For example, a study found that an institution charged $151 per serum folate test, which amounted to $158,000 per deficient result.[3] The institutional cost was <$2.00 per serum folate test and <$2093 per deficient result. Another study reported the institutional cost of RBC folate to be $12.54 per test and $8035 per deficient result.[20] The charges and costs are institution specific and will vary. However, in light of the low pretest probability of testing, any expense associated with these tests represents low value.
WHAT YOU SHOULD DO INSTEAD
The clinician in our case presentation is facing a common scenarioa patient with persistent anemia without a known etiology. The treatment of suspected or confirmed folate deficiency includes improving diet or adding a folic acid supplement, a low‐cost (as little $0.01 per tablet) intervention. Furthermore, other at‐risk patients (eg, those with sickle cell disease, alcoholism, or malabsorption) may be candidates for long‐term supplementation regardless of serum folate and/or RBC folate testing results.
Folate deficiency in patients living in the United States and Canada is exceedingly rare, making the pretest probability of testing low. Furthermore, even patients with typical hematologic characteristics for folate deficiency (anemia and macrocytosis) are unlikely to have folate deficiency. Importantly, there are no nonhematologic indications to test for folate deficiency, and testing those patients, just as in the general population, yields an extremely low rate of folate deficiency. The tests themselves are unreliable and inaccurate, and fortunately, treatment is cheap, easy to administer, and can be done empirically. In other words, testing for folate deficiency is a Thing We Do for No Reason.
RECOMMENDATIONS
In patients suspected of having folate deficiency or who are at high risk of folate deficiency (eg, diet poor in folate‐rich or folic acid fortified foods), treat with a diet containing folate or folic acid fortified foods and/or a supplement containing 400 to 1000 g of folic acid. Approximately 1 to 2 weeks following initiation of treatment, a complete blood count should be performed to evaluate for an appropriate increase in hematocrit/hemoglobin and decrease in MCV.[24] Once a full hematologic response is seen, treatment beyond this time is not required unless the cause (eg, malnutrition) persists.
Serum folate and RBC folate tests should not be routinely ordered. Even in those with macrocytic anemia, the pretest probability of folate deficiency remains low. Although testing may suggest a folate deficiency, it is still more likely there is another cause for the patient's anemia. This places providers at risk for premature closure. For patients such as the one presented in the case presentation, obtaining B12 levels is of greater importance, given the higher prevalence and the risks of untreated deficiency.
For patients in whom the pretest probability of folate deficiency is high (eg, those with an MCV >130), obtain fasting serum folate levels on samples taken before supplementation has begun or a diet administered.
Disclosures
Dr. Feldman is a consultant to Maven Medical, LLC. Maven Medical is a healthcare software startup.
Do you think this is a low‐value practice? Is this truly a Thing We Do for No Reason? Share what you do in your practice and join in the conversation online by retweeting it on Twitter (#TWDFNR) and Liking It on Facebook. We invite you to propose ideas for other Things We Do for No Reason topics by emailing TWDFNR@hospitalmedicine.org.
- Folic acid: nutritional biochemistry, molecular biology, and role in disease processes. Mol Genet Metab. 2000;71(1‐2):121–138.
- Experimental nutritional folate deficiency in man. Trans Assoc Am Physicians. 1962;75:307–320.
- , , Utility, charge, and cost of inpatient and emergency department serum folate testing. J Hosp Med. 2013;8(2):91–95.
- , , , Is there a role for folate determinations in current clinical practice in the USA? Clin Lab Haematol. 2004;26(6):379–383.
- , , , , Prevalence and impact of anemia in hospitalized patients. South Med J. 2013;106(3):202–206.
- Healthcare Cost and Utilization Project (HCUP). HCUP facts and figures: statistics on hospital‐based care in the United States, 2009. Rockville, MD: Agency for Healthcare Research and Quality; 2011.
- , , Clinical utility of folic acid testing for patients with anemia or dementia. J Gen Intern Med. 2008;23(6):824–826.
- Utility of measuring serum or red blood cell folate in the era of folate fortification of flour. Clin Biochem. 2014;47(7‐8):533–538.
- Kelley's Textbook of Internal Medicine. Philadelphia, PA: Lippincott Williams 2000.
- Problems in the diagnosis and investigation of megaloblastic anemia. Can Med Assoc J. 1980;122(9):999–1004.
- Laboratory diagnosis of vitamin B12 and folate deficiency: a guide for the primary care physician. Arch Intern Med. 1999;159(12):1289–1298.
- , Erythrocyte folate levels: a clinical study. Am J Hematol. 1991;36(2):116–21.
- US Food and Drug Administration. Food standards: amendments of standards of identity for enriched grain products to require addition of folic acid. Fed Regist. 1996;61:8781–8797.
- , Effect of food fortification on folic acid intake in the United States. Am J Clin Nutr. 2003;77(1):221–225.
- , , , , , Folic acid intake from fortification in United States exceeds predictions. J Nutr. 2002;132(9):2792–2798.
- , , , , Impact of folic acid fortification of the US food supply on the occurrence of neural tube defects. JAMA. 2001;285(23):2981–2986.
- , Lack of clinical utility of folate levels in the evaluation of macrocytosis or anemia. Am J Med. 2001;110(2):88–90.
- , , , Trends in serum folate after food fortification. Lancet. 1999;354(9182):915–916.
- , Ordering folate assays is no longer justified for investigation of anemias, in folic acid fortified countries. BMC Res Notes. 2010;3:22.
- , Folate testing in hospital inpatients. Am J Med. 2015;128(1):56–59.
- , , , , Etiology and diagnostic evaluation of macrocytosis. Am J Med Sci. 2000;319(6):343–352.
- , , Diminished need for folate measurements among indigent populations in the post folic acid supplementation era. Arch Pathol Lab Med. 2007;131(3):477–480.
- , , , et al. Etiologies and diagnostic work‐up of extreme macrocytosis defined by an erythrocyte mean corpuscular volume over 130°fL: s study of 109 patients. Am J Hematol. 2014;89(6):665–666.
- , , , et al. Best practice in primary care pathology: review 1. J Clin Pathol. 2005;58(10):1016–1024.
© 2015 Society of Hospital Medicine
Things We Do for No Reason/
In this issue of the Journal of Hospital Medicine, we introduce a new recurring feature, Choosing Wisely: Things We Do for No Reason. The series is based on a talk I have delivered for the past 4 years at the annual national meeting of the Society of Hospital Medicine, in which I highlight 4 diagnostic tests, therapies, or other clinical practices that are commonly performed even though they are of low value to our inpatients.
There are many reasons hospitalists order unnecessary tests or treatments, or employ unhelpful clinical practices. Unnecessary testing may occur when we are not familiar with the test itselfthe actual costs of the test, the operating characteristics of the test, or the evidence supporting its usefulness in specific situations. Some tests are ordered unnecessarily because we cannot retrieve usable results from a different hospital or even our own electronic medical records. We may order tests or treatments due to patient expectations, a perceived need to practice defensively, or economic incentives.
Finally, we may simply order tests because of our uncertainty in the absence of data or simply because they are traditional practices (the way we've always done it). Physicians often order tests and treatments and institute clinical practices learned in residency or fellowship training.[1, 2] Local norms and practices influence physician behavior.
We created Things We Do for No Reason (TWDFNR) as a platform for provocative discussions of practices that have become common parts of hospital care but have limited supporting evidence, or even have evidence refuting or justifiably challenging their value. Each article in TWDFNR will describe why the test, treatment, or other clinical practice is commonly employed, why it may not be of high value, in what circumstances it may actually be valuable, and what conclusions can be drawn from the evidence provided. TWDFNR pieces are not systematic reviews or meta‐analyses and do not represent black and white conclusions or clinical practice standards; they are meant as a starting place for research and active discussions among hospitalists and patients.
In many respects, the Choosing Wisely: Things We Do for No Reason series is an extension of the Choosing Wisely campaign created by the American Board of Internal Medicine Foundation. Like Choosing Wisely, we are focusing on individual tests, treatments, and other clinical practices that are not beneficial and are potentially harmful to patients. Practices discussed may not cause significant physical or financial harm at the time they are used, but they may have significant downstream effects.
The Choosing Wisely campaign has brilliantly identified 5 important hospital medicine low‐value practices, and we hope to identify many more. We hope this series will serve as a grassroots effort to uncover more Choosing Wisely‐type practices. As institutions create their own high‐value care committees, the Choosing Wisely: Things We Do for No Reason series can provide possible agenda items, or provide the opportunity for sites to carry out analyses of their own practices to see whether any of the TWDFNR topics provide local opportunities for implementing higher‐value practices.
Although we do not believe that reducing the low‐value practices that will appear in TWDFNR will, alone, solve our wasteful practices, we hope that highlighting them will remind individuals, institutions, and systems that targeting low‐value practices is a responsibility that we all must embrace. We accept that not everyone will agree that the practices we present are low value, but the conversation is important to have. We invite you to take part in the Choosing Wisely: Things We Do for No Reason conversation. Let us know whether you think the practices highlighted are low value or whether you disagree with the conclusions. We welcome unsolicited proposals for series topics submitted as a 500‐word prcis. Send us your prcis or ideas on low‐value adult or pediatric patient practices that we should highlight in this series by emailing us at twdfnr@hospitalmedicine.org.
Disclosure: Nothing to report.
- , , , . The association between residency training and internists' ability to practice conservatively. JAMA Intern Med. 2014;174:1640–1648.
- , , , , . Spending patterns in region of residency training and subsequent expenditures for care provided by practicing physicians for Medicare beneficiaries. JAMA. 2014;312:2385–2393.
In this issue of the Journal of Hospital Medicine, we introduce a new recurring feature, Choosing Wisely: Things We Do for No Reason. The series is based on a talk I have delivered for the past 4 years at the annual national meeting of the Society of Hospital Medicine, in which I highlight 4 diagnostic tests, therapies, or other clinical practices that are commonly performed even though they are of low value to our inpatients.
There are many reasons hospitalists order unnecessary tests or treatments, or employ unhelpful clinical practices. Unnecessary testing may occur when we are not familiar with the test itselfthe actual costs of the test, the operating characteristics of the test, or the evidence supporting its usefulness in specific situations. Some tests are ordered unnecessarily because we cannot retrieve usable results from a different hospital or even our own electronic medical records. We may order tests or treatments due to patient expectations, a perceived need to practice defensively, or economic incentives.
Finally, we may simply order tests because of our uncertainty in the absence of data or simply because they are traditional practices (the way we've always done it). Physicians often order tests and treatments and institute clinical practices learned in residency or fellowship training.[1, 2] Local norms and practices influence physician behavior.
We created Things We Do for No Reason (TWDFNR) as a platform for provocative discussions of practices that have become common parts of hospital care but have limited supporting evidence, or even have evidence refuting or justifiably challenging their value. Each article in TWDFNR will describe why the test, treatment, or other clinical practice is commonly employed, why it may not be of high value, in what circumstances it may actually be valuable, and what conclusions can be drawn from the evidence provided. TWDFNR pieces are not systematic reviews or meta‐analyses and do not represent black and white conclusions or clinical practice standards; they are meant as a starting place for research and active discussions among hospitalists and patients.
In many respects, the Choosing Wisely: Things We Do for No Reason series is an extension of the Choosing Wisely campaign created by the American Board of Internal Medicine Foundation. Like Choosing Wisely, we are focusing on individual tests, treatments, and other clinical practices that are not beneficial and are potentially harmful to patients. Practices discussed may not cause significant physical or financial harm at the time they are used, but they may have significant downstream effects.
The Choosing Wisely campaign has brilliantly identified 5 important hospital medicine low‐value practices, and we hope to identify many more. We hope this series will serve as a grassroots effort to uncover more Choosing Wisely‐type practices. As institutions create their own high‐value care committees, the Choosing Wisely: Things We Do for No Reason series can provide possible agenda items, or provide the opportunity for sites to carry out analyses of their own practices to see whether any of the TWDFNR topics provide local opportunities for implementing higher‐value practices.
Although we do not believe that reducing the low‐value practices that will appear in TWDFNR will, alone, solve our wasteful practices, we hope that highlighting them will remind individuals, institutions, and systems that targeting low‐value practices is a responsibility that we all must embrace. We accept that not everyone will agree that the practices we present are low value, but the conversation is important to have. We invite you to take part in the Choosing Wisely: Things We Do for No Reason conversation. Let us know whether you think the practices highlighted are low value or whether you disagree with the conclusions. We welcome unsolicited proposals for series topics submitted as a 500‐word prcis. Send us your prcis or ideas on low‐value adult or pediatric patient practices that we should highlight in this series by emailing us at twdfnr@hospitalmedicine.org.
Disclosure: Nothing to report.
- , , , . The association between residency training and internists' ability to practice conservatively. JAMA Intern Med. 2014;174:1640–1648.
- , , , , . Spending patterns in region of residency training and subsequent expenditures for care provided by practicing physicians for Medicare beneficiaries. JAMA. 2014;312:2385–2393.
Perioperative statins: More than lipid-lowering?
Soon, the checklist for internists seeing patients about to undergo surgery may include prescribing one of the lipid-lowering hydroxymethylglutaryl-CoA reductase inhibitors, also called statins.
Statins? Not long ago, we were debating whether patients who take statins should stop taking them before surgery, based on the manufacturers’ recommendations.1 The discussion, however, has changed to whether patients who have never received a statin should be started on one before surgery to provide immediate prophylaxis against cardiac morbidity, and how much harm long-term statin users face if these drugs are withheld perioperatively.
The evidence is still very preliminary and based mostly on studies in animals and retrospective studies in people. However, an expanding body of indirect evidence suggests that these drugs are beneficial in this situation.
In this review, we discuss the mechanisms by which statins may protect the heart in the short term, drawing on data from animal and human studies of acute myocardial infarction, and we review the current (albeit limited) data from the perioperative setting.
FEW INTERVENTIONS DECREASE RISK
Each year, approximately 50,000 patients suffer a perioperative cardiovascular event; the incidence of myocardial infarction during or after noncardiac surgery is 2% to 3%.2 The primary goal of preoperative cardiovascular risk assessment is to predict and avert these events.
But short of canceling surgery, few interventions have been found to reduce a patient’s risk. For example, a landmark study in 2004 cast doubt on the efficacy of preoperative coronary revascularization.3 Similarly, although early studies of beta-blockers were promising4,5 and although most internists prescribe these drugs before surgery, more recent studies have cast doubt on their efficacy, particularly in patients at low risk undergoing intermediate-risk (rather than vascular) surgery.6–8
This changing clinical landscape has prompted a search for new strategies for perioperative risk-reduction. Several recent studies have placed statins in the spotlight.
POTENTIAL MECHANISMS OF SHORT-TERM BENEFIT
Statins have been proven to save lives when used long-term, but how could this class of drugs, designed to prevent the accumulation of arterial plaques by lowering low-density lipoprotein cholesterol (LDL-C) levels, have any short-term impact on operative outcomes? Although LDL-C reduction is the principal mechanism of action of statins, not all of the benefit can be ascribed to this mechanism.9 The answer may lie in their “pleiotropic” effects—ie, actions other than LDL-C reduction.
The more immediate pleiotropic effects of statins in the proinflammatory and prothrombotic environment of the perioperative period are thought to include improved endothelial function (both antithrombotic function and vasomotor function in response to ischemic stress), enhanced stability of atherosclerotic plaques, decreased oxidative stress, and decreased vascular inflammation.10–12
EVIDENCE FROM ANIMAL STUDIES
Experiments in animals suggest that statins, given shortly before or after a cardiovascular event, confer benefit before any changes in LDL-C are measurable.
Lefer et al13 found that simvastatin (Zocor), given 18 hours before an ischemic episode in rats, blunted the inflammatory response in cardiac reperfusion injury. Not only was reperfusion injury significantly less in the hearts of the rats that received simvastatin than in the saline control group, but the simvastatin-treated hearts also expressed fewer neutrophil adhesion molecules such as P-selectin, and they had more basal release of nitric oxide, the potent endothelial-derived vasodilator with antithrombotic, anti-inflammatory, and antiproliferative effects.14 These results suggest that statins may improve endothelial function acutely, particularly during ischemic stress.
Osborne et al15 fed rabbits a cholesterol-rich diet plus either lovastatin (Mevacor) or placebo. After 2 weeks, the rabbits underwent either surgery to induce a myocardial infarction or a sham procedure. Regardless of the pretreatment, biopsies of the aorta did not reveal any atherosclerosis; yet the lovastatin-treated rabbits sustained less myocardial ischemic damage and they had more endothelium-mediated vasodilatation.
Statin therapy also may improve cerebral ischemia outcomes in animal models.14,16
Sironi et al16 induced strokes in rats by occluding the middle cerebral artery. The rats received either simvastatin or vehicle for 3 days before the stroke or immediately afterwards. Even though simvastatin did not have enough time to affect the total cholesterol level, rats treated with simvastatin had smaller infarcts (as measured by magnetic resonance imaging) and produced more nitric oxide.
Comment. Taken together, these studies offer tantalizing evidence that statins have short-term, beneficial nonlipid effects and may reduce not only the likelihood of an ischemic event, but—should one occur—the degree of tissue damage that ensues.
EFFECTS OF STATINS IN ACUTE CORONARY SYNDROME
The National Registry of Myocardial Infarction17 is a prospective, observational database of all patients with acute myocardial infarction admitted to 1,230 participating hospitals throughout the United States. In an analysis from this cohort, patients were divided into four groups: those receiving statins before and after admission, those receiving statins only before admission, those receiving statins only after admission, and those who never received statins.
Compared with those who never received statins, fewer patients who received them both before and after admission died while in the hospital (unadjusted odds ratio 0.23, 95% confidence interval [CI] 0.22–0.25), and the odds ratio for those who received statins for the first time was 0.31 (95% CI 0.29–0.33). Patients who stopped receiving a statin on admission were more likely to die than were patients who never received statins (odds ratio 1.09, 95% CI 1.03–1.15). These trends held true even when adjustments were made for potential confounding factors.
Comment. Unmeasured confounding factors (such as the inability to take pills due to altered mental status or the different practice styles of the providers who chose to discontinue statins) might have affected the results. Nevertheless, these results suggest that the protective effects of statins stop almost immediately when these drugs are discontinued, and that there may even be an adverse “rebound” effect when patients who have been taking these drugs for a long time stop taking them temporarily.
The Platelet Receptor Inhibition in Ischemic Syndrome Management trial,18 in a subgroup analysis, had nearly identical findings. In the main part of this trial, patients with coronary artery disease and chest pain at rest or accelerating pain in the last 24 hours were randomized to receive tirofiban (Aggrastat) or heparin. Complete data on statin use were available for 1,616 (50%) of the 3,232 patients in this trial, and the rate of the primary end point (death, myocardial infarction, or recurrent ischemia) was analyzed on the basis of statin therapy in this subgroup.
Comment. Together, these data lead to the conclusion that, when admitted for either acute myocardial infarction or acute coronary syndrome, patients already receiving statins should not have them stopped, and those who had not been receiving statins should receive them immediately. The safety of these medications in the acute setting appears excellent: in the Myocardial Ischemia Reduction With Acute Cholesterol Lowering (MIRACL)12 and the Pravastatin or Atorvastatin Evaluation and Infection Therapy (PROVE-IT)11 trials, fewer than 5% of statin-treated patients had transient elevations in transaminase levels, and no cases of rhabdomyolysis were reported.
PERIOPERATIVE STATIN STUDIES
The data on perioperative statin use are mostly observational and retrospective and fall into essentially four surgical categories: coronary artery bypass grafting (CABG), carotid endarterectomy,19,20 noncardiac vascular surgery, and major noncardiac surgery. Two meta-analyses have also evaluated the data.21,22 The only randomized controlled trial (performed by Durazzo et al23) was small and was carried out at a single center in vascular surgery patients, and the event rate was low.
Current recommendations from the National Cholesterol Education Program (NCEP)24 say that patients who need CABG, have peripheral arterial disease, have an abdominal aortic aneurysm, or have cerebrovascular disease should already be on a statin to achieve an LDL-C goal level of less than 100 mg/dL, with an optional goal of less than 70 mg/dL, independent of surgery.
Since not all patients who should be on statins are actually on them, questions arise:
- Is it important (and safe) to start statin treatment preoperatively?
- Will patients with cardiovascular risk factors but without known cardiovascular disease benefit from statins perioperatively?
Noncardiac vascular surgery
Multiple retrospective studies have evaluated the effect of statins in patients undergoing major noncardiac vascular surgery.25–32
Kertai et al25 evaluated 570 patients in Holland who underwent elective open surgery for infrarenal abdominal aortic aneurysms between 1991 and 2001, looking for an association between statin use and the incidence of perioperative death from myocardial infarction. Only 162 of the 570 patients had been on long-term statin therapy before the surgery. The use of statins was only one of many known baseline characteristics that were significantly different between the two groups, including age, body mass index, known coronary artery disease, and use of angiotensin-converting enzyme inhibitors and beta-blockers. In univariate analysis, statins appeared to be protective: 6 (3.7%) of the patients in the statin group died of a myocardial infarction, compared with 45 (11%) of those in the nostatin group. A multivariate analysis yielded similar findings, with an odds ratio of 0.24 (95% CI 0.11–0.54).
Ward et al27 performed a very similar retrospective study, with similar findings. In 446 patients who underwent surgery for infrarenal abdominal aortic aneurysm, statin therapy was associated with a significantly lower incidence of the combined end point of death, myocardial infarction, stroke, and major peripheral vascular complications, with an adjusted odds ratio of 0.36 (95% CI 0.14–0.93).
Poldermans et al26 noted similar findings in a case-control study of noncardiac vascular surgery patients. Statin users had a much lower perioperative risk of death than did nonusers, with an adjusted odds ratio of 0.22 (95% CI 0.10–0.47).
O’Neil-Callahan et al,28 in a cohort study, found that statin users had fewer perioperative cardiac complications, with an adjusted odds ratio of 0.49 (95% CI 0.28–0.84, P = .009).
Dogma of withdrawing statins before major surgery is challenged
Le Manach et al33 reviewed the outcomes for all patients of a single hospital in Paris who underwent nonemergency infrarenal aortic procedures between January 2001 and December 2004. In January 2004, the hospital instituted guidelines to ensure that patients on statins continue taking them up to the evening before surgery and that statins be restarted on the first postoperative day (via nasogastric tube if necessary). Before 2004, there had been no specific guidelines, and patients on statins did not receive them for a median of 4 days postoperatively. Types of procedures were similar during the two time periods, as were the rates of beta-blocker use, preoperative revascularization, venous thromboembolism prophylaxis, and perioperative blood pressure control. After surgery, topononin I levels were measured in all patients as surveillance for cardiac events, and were defined as elevated when greater than 0.2 ng/mL.
Compared with patients not on statins at all, those treated with statins continuously throughout the perioperative period (after January 2004) had a lower rate of elevated troponin (relative risk 0.38). In contrast, those who had their statins transiently discontinued perioperatively (prior to 2004) had troponin elevations more often than those who had never been treated (relative risk 2.1). This suggested an over fivefold risk reduction (P < .001) conferred by not discontinuing statins in the immediate postoperative period. This finding was maintained after multivariate adjustment: statin withdrawal was associated with a 2.9-fold (95% CI 1.6–5.5) increase in the risk of cardiac enzyme elevations postoperatively. No fewer deaths were noted, but the study was not powered to detect a mortality difference.
Comment. Although secular trends cannot be entirely discounted as contributing to these findings, the prompt increase in cardiac events after just 4 days of statin withdrawal adds to the growing body of evidence suggesting that statin discontinuation can have harmful acute effects. It also brings up the question: Can starting statins benefit patients in the same time period?
Should statins be started before vascular surgery?
Schouten et al32 evaluated the effects of newly started or continued statin treatment in patients undergoing major elective vascular surgery. Patients were screened before surgery and started on statins if they were not already receiving them and their total cholesterol levels were elevated; new users received the medication for about 40 days before surgery. Of the 981 screened patients, 44 (5%) were newly started on statins and 182 (19%) were continued on their therapy. Perioperative death or myocardial infarction occurred in 22 (8.8%) of the statin users and 111 (14.7%) of the nonusers, a statistically significant difference. Temporary discontinuation (median 1 day) of statins in this study due to the inability to take an oral medication did not appear to affect the likelihood of a myocardial infarction.
Durazzo et al23 performed a single-center, randomized, prospective, placebo-controlled, double-blind clinical trial of atorvastatin (Lipitor) 20 mg daily vs placebo in 100 patients undergoing noncardiac arterial vascular surgery. Patients were excluded if they had previously used medications to treat dyslipidemia, recently had a cardiovascular event, or had contraindications to statin treatment such as a baseline creatinine level greater than 2.0 mg/dL or severe hepatic disease. The intervention group received atorvastatin starting at least 2 weeks before surgery for a total of 45 days. Patients were then continued or started on a statin after surgery if their LDL-C level was greater than 100 mg/dL. Beta-blocker use was recommended “on the basis of current guidelines.”
One month after surgery, the LDL-C level was statistically significantly lower in the atorvastatin group. Since most patients did not continue or start statin therapy after the 45-day treatment period, the LDL-C levels were not statistically different at 3 and 6 months after surgery.
At 6 months, the rate of the primary end point (death from cardiovascular causes, nonfatal acute myocardial infarction, ischemic stroke, or unstable angina) was 26.0% in the placebo group and 8.0% in the atorvastatin group, a statistically significant difference. Three patients in the atorvastatin group had cardiac events in the first 10 days after surgery, compared with 11 patients in the placebo group. Thirteen of the 17 total cardiac events took place within 10 days after surgery.
One of the atorvastatin patients developed rhabdomyolysis and elevated aminotransferase levels.
Major noncardiac surgery
Lindenauer et al2 performed a retrospective cohort study of surgical patients who were at least 18 years old and survived beyond the second hospital day. Patients were divided into a group receiving any form of lipid-lowering treatment (of whom more than 90% were taking statins) and a group that had never never received a lipid-lowering drug or only started one on the third day of the hospitalization or later. The period of study was from January 1, 2000, to December 31, 2001.
In all, 780,591 patients from 329 hospitals throughout the United States were included, of whom only 77,082 (9.9%) received lipid-lowering therapy. Eight percent of the patients underwent vascular surgery. Not surprisingly, the treated patients were more likely to have a history of hypertension, diabetes, ischemic heart disease, or hyperlipidemia. They also were more likely to have a vascular procedure performed, to have two or more cardiac risk factors (high-risk surgery, ischemic heart disease, congestive heart failure, cerebrovascular disease, renal insufficiency, or diabetes mellitus), and to be treated with beta-blockers and angiotensin-converting enzyme inhibitors, but they were less likely to have high-risk and emergency surgery performed.
The primary end point, perioperative death, occurred in 2.13% of the treated patients and 3.05% of the nontreated group. Compared with the rate in a propensity-matched cohort, the odds ratio adjusted for unbalanced covariates was 0.62 (95% CI 0.58–0.67) in favor of lipid treatment. Stratification by cardiac risk index revealed a number needed to treat of 186 for those with no risk factors, 60 for those with two risk factors, and 30 for those with four or more risk factors.
Unfortunately, this analysis was not able to take into account whether and for how long patients were receiving lipid-lowering therapy before hospitalization. It therefore does not answer the questions of whether starting lipid-lowering therapy before surgery is beneficial or whether stopping it is harmful. It also does not shed light on whether perioperative lipid-lowering increases the risk of rhabdomyolysis or liver disease.
Carotid endarterectomy
Two recent retrospective cohort studies evaluated the outcomes in patients undergoing carotid endarterectomy.19,20
Kennedy et al19 found that patients on a statin at the time of admission who had symptomatic carotid disease had lower rates of inhospital death (adjusted odds ratio 0.24, 95% CI 0.06–0.91) and ischemic stroke or death (adjusted odds ratio 0.55, 95% CI 0.31–0.97). However, cardiac outcomes among these symptomatic patients were not significantly improved (odds ratio 0.82, 95% CI 0.45–1.50), nor was there benefit for asymptomatic patients, raising the possibility that the positive findings were due to chance or that patients at lower baseline risk for vascular events may have less benefit.
McGirt et al20 performed a similar study; they did not, however, distinguish whether patients had symptomatic vs asymptomatic carotid disease. The 30-day risk of perioperative stroke was lower in patients treated with a statin, with an odds ratio of 0.41 (95% CI 0.18–0.93); the odds ratio for death was 0.21 (95% CI 0.05–0.96). Cardiac outcomes were not significantly affected.
Coronary artery bypass graft surgery
According to the NCEP recommendations, nearly all patients undergoing CABG should already be on a statin before surgery since they all have known coronary artery disease. Multiple observational studies have offered confirmatory evidence that statins are beneficial in this setting.34–38
Liakopoulos et al39 evaluated whether the anti-inflammatory effects of statins may, in part, account for their beneficial effect in the perioperative period. The authors prospectively matched 18 patients who were taking statins and were referred for elective CABG with 18 patients who were not prescribed statins previously. The only major measured baseline characteristic that differed between the two groups was a statistically significantly lower LDL-C level in the statin group. The operative characteristics did not differ, and cytokine levels at baseline were similar.
Tumor necrosis factor alpha levels increased significantly in the control group but did not change significantly in the statin group. Interleukin 8 increased in both groups by a similar amount. Interleukin 6 (the major inducer of C-reactive protein) increased from baseline in both groups but did not increase nearly as much in the statin group as in the control group; the intergroup difference was statistically significant. The anti-inflammatory cytokine interleukin 10 increased minimally from baseline in the control group, while the statin group’s levels increased significantly above baseline and those of the control group.
Christenson40 also found that inflammatory markers were improved with pre-CABG statin treatment in a small randomized trial in which patients received simvastatin 20 mg 4 weeks prior to CABG surgery vs no statin. Interestingly, far fewer statin-treated patients developed thrombocytosis (platelet count > 400 × 109/L) than did control patients (3% vs 81%, P < .0001).
RISKS OF PERIOPERATIVE STATINS
The risks associated with statin therapy in general appear low, but specific perioperative risks have not been well studied.
Baigent et al,41 in a meta-analysis of randomized trials of nonperioperative statin therapy, found that rhabdomyolysis occurred in 9 (0.023%) of 39,884 patients receiving statins vs 6 (0.015%) of the 39,817 controls, with a number needed to harm of 12,500. Moreover, the rates of nonvascular death and cancer did not increase. It is plausible that the risk is somewhat greater in the perioperative setting but is likely not enough to outweigh the potential benefits, especially since the risk of ischemic vascular events is particularly high then.
Some of the perioperative studies cited above specifically addressed potential risks. For example, in the study by Schouten et al,32 mild creatine kinase elevations were more common in the statin-treated group, but the incidence of moderate and severe creatine kinase elevations did not differ significantly. No case of rhabdomyolysis occurred, and length of surgery was the only predictor of myopathy. MIRACL and PROVE-IT revealed similar safety profiles; aminotransferase levels normalized when statins were stopped, and no cases of rhabdomyolysis occurred.11,12 In the vascular surgery study by Durazzo et al,23 1 (2%) of the 50 atorvastatin-treated patients developed both rhabdomyolysis and elevated aminotransferase levels that prompted discontinuation of the statin.
Overall, the observational studies do not indicate that statin continuation or treatment is harmful in perioperative patients. However, these studies did not specifically evaluate patients with acute insults from surgery such as sepsis, renal failure, or hepatitis. It is unknown what effect statin therapy would have in those patients and whether statins should be selectively discontinued in patients who develop major hepatic, musculoskeletal, or renal complications after surgery.
OUR RECOMMENDATIONS
Before CABG or vascular surgery
Given the NCEP recommendations, existing primary and secondary prevention studies, observational studies of CABG and noncardiac vascular surgery patients, and the one randomized trial of vascular surgery patients, data support the use of statins in nearly all patients undergoing cardiac or vascular surgery. We advocate starting statins in the perioperative period to take advantage of their rapid-acting pleiotropic effects, and continuing them long-term to take advantage of their lipid-lowering effects. This recommendation is in line with the recently released American College of Cardiology/American Heart Association (ACC/AHA) 2007 perioperative guidelines that state “for patients undergoing vascular surgery with or without clinical risk factors, statin use is reasonable.”42
Although the ideal time to start statins is not certain, the study by Durazzo et al23 suggests that they should be started at least 2 weeks before surgery if possible. Moreover, patients already taking statins should definitely not have their statins discontinued if at all possible.
Before major nonvascular surgery
For patients undergoing major nonvascular (intermediate-risk) surgery, physicians should first ascertain if the patient has an indication for statin therapy based on current nonsurgical lipid level recommendations. However, even if there is no clear indication for statin therapy based on NCEP guidelines, we endorse the recently released ACC/AHA perioperative guidelines that state that statin therapy can be considered in patients with a risk factor who are undergoing intermediate-risk procedures. Moreover, we wholeheartedly support the ACC/AHA’s strongest recommendation that patients who are already receiving statins and are undergoing noncardiac surgery should not have their statins discontinued.
When to discontinue statins?
The risk of harm overall appears to be minimal and certainly less than the likelihood of benefit. It is reasonable to observe patients postoperatively for adverse clinical events that may increase the risk of perioperative statin treatment, such as acute renal failure, hepatic failure, or sepsis, but whether statins should be stopped in patients with these complications remains unknown; we advocate individualizing the decision.
More studies needed
We need more data on whether moderate-risk patients undergoing moderate-risk surgery benefit from perioperative statin therapy, when therapy should be started, whether therapy should be started on the day of surgery if it was not started earlier, which statin and what doses are optimal, how long therapy should be continued, and what degree of risk is associated with perioperative statin therapy.
Fortunately, important data should be forthcoming in the next few years: the Dutch Echocardiographic Cardiac Risk Evaluation Applying Stress Echocardiography (DECREASE-IV) study43 is a 4-year two-by-two factorial placebo-controlled study evaluating the use of fluvastatin (Lescol) and bisoprolol (Zebeta, a beta-blocker) separately and together in patients who are older than 40 years, are undergoing elective noncardiac surgery, have an estimated risk of cardiovascular death of more than 1%, have not used statins previously, and do not have elevated cholesterol.
- Grant PJ, Kedia N. Should statins be discontinued preoperatively? IMPACT consults. Proceedings of the 2nd Annual Cleveland Clinic Perioperative Medicine Summit. Cleve Clin J Med 2006; 73 Electronic suppl 1:S9–S10.
- Lindenauer PK, Pekow P, Wang K, Gutierrez B, Benjamin EM. Lipid-lowering therapy and in-hospital mortality following major noncardiac surgery. JAMA 2004; 291:2092–2099.
- McFalls EO, Ward HB, Moritz TE, et al. Coronary-artery revascularization before elective major vascular surgery. N Engl J Med 2004; 351:2795–2804.
- Mangano DT, Layug EL, Wallace A, Tateo I. Effect of atenolol on mortality and cardiovascular morbidity after noncardiac surgery. Multicenter Study of Perioperative Ischemia Research Group. N Engl J Med 1996; 335:1713–1720.
- Poldermans D, Boersma E, Bax JJ, et al. The effect of bisoprolol on perioperative mortality and myocardial infarction in high-risk patients undergoing vascular surgery. Dutch Echocardiographic Cardiac Risk Evaluation Applying Stress Echocardiography Study Group. N Engl J Med 1999; 341:1789–1794.
- Brady AR, Gibbs JS, Greenhalgh RM, Powell JT, Sydes MR. Perioperative beta-blockade (POBBLE) for patients undergoing infrarenal vascular surgery: results of a randomized double-blind controlled trial. J Vasc Surg 2005; 41:602–609.
- Juul AB, Wetterslev J, Gluud C, et al. Effect of perioperative beta blockade in patients with diabetes undergoing major non-cardiac surgery: randomised placebo controlled, blinded multicentre trial. BMJ 2006; 332:1482.
- Yang H, Raymer K, Butler R, Parlow J, Roberts R. The effects of perioperative beta-blockade: results of the Metoprolol after Vascular Surgery (MaVS) study, a randomized controlled trial. Am Heart J 2006; 152:983–990.
- Ridker PM, Cannon CP, Morrow D, et al. C-reactive protein levels and outcomes after statin therapy. N Engl J Med 2005; 352:20–28.
- Ito MK, Talbert RL, Tsimikas S. Statin-associated pleiotropy: possible beneficial effects beyond cholesterol reduction. Pharmacotherapy 2006; 26:85S–97S.
- Cannon CP, Braunwald E, McCabe CH, et al. Intensive versus moderate lipid lowering with statins after acute coronary syndromes. N Engl J Med 2004; 350:1495–1504.
- Schwartz GG, Olsson AG, Ezekowitz MD, et al. Effects of atorvastatin on early recurrent ischemic events in acute coronary syndromes: the MIRACL study: a randomized controlled trial. JAMA 2001; 285:1711–1718.
- Lefer AM, Campbell B, Shin YK, Scalia R, Hayward R, Lefer DJ. Simvastatin preserves the ischemic-reperfused myocardium in normocholesterolemic rat hearts. Circulation 1999; 100:178–184.
- Endres M, Laufs U, Liao JK, Moskowitz MA. Targeting eNOS for stroke protection. Trends Neurosci 2004; 27:283–289.
- Osborne JA, Lento PH, Siegfried MR, Stahl GL, Fusman B, Lefer AM. Cardiovascular effects of acute hypercholesterolemia in rabbits. Reversal with lovastatin treatment. J Clin Invest 1989; 83:465–473.
- Sironi L, Cimino M, Guerrini U, et al. Treatment with statins after induction of focal ischemia in rats reduces the extent of brain damage. Arterioscler Thromb Vasc Biol 2003; 23:322–327.
- Fonarow GC, Wright RS, Spencer FA, et al. Effect of statin use within the first 24 hours of admission for acute myocardial infarction on early morbidity and mortality. Am J Cardiol 2005; 96:611–616.
- Heeschen C, Hamm CW, Laufs U, Snapinn S, Bohm M, White HD. Withdrawal of statins increases event rates in patients with acute coronary syndromes. Circulation 2002; 105:1446–1452.
- Kennedy J, Quan H, Buchan AM, Ghali WA, Feasby TE. Statins are associated with better outcomes after carotid endarterectomy in symptomatic patients. Stroke 2005; 36:2072–2076.
- McGirt MJ, Perler BA, Brooke BS, et al. 3-hydroxy-3-methylglutaryl coenzyme A reductase inhibitors reduce the risk of perioperative stroke and mortality after carotid endarterectomy. J Vasc Surg 2005; 42:829–836.
- Hindler K, Shaw AD, Samuels J, Fulton S, Collard CD, Riedel B. Improved postoperative outcomes associated with preoperative statin therapy. Anesthesiology 2006; 105:1260–1272.
- Kapoor AS, Kanji H, Buckingham J, Devereaux PJ, McAlister FA. Strength of evidence for perioperative use of statins to reduce cardiovascular risk: systematic review of controlled studies. BMJ 2006; 333:1149.
- Durazzo AE, Machado FS, Ikeoka DT, et al. Reduction in cardiovascular events after vascular surgery with atorvastatin: a randomized trial. J Vasc Surg 2004; 39:967–975.
- Grundy SM, Cleeman JI, Merz CN, et al. Implications of recent clinical trials for the National Cholesterol Education Program Adult Treatment Panel III guidelines. Circulation 2004; 110:227–239.
- Kertai MD, Boersma E, Westerhout CM, et al. A combination of statins and beta-blockers is independently associated with a reduction in the incidence of perioperative mortality and nonfatal myocardial infarction in patients undergoing abdominal aortic aneurysm surgery. Eur J Vasc Endovasc Surg 2004; 28:343–352.
- Poldermans D, Bax JJ, Kertai MD, et al. Statins are associated with a reduced incidence of perioperative mortality in patients undergoing major noncardiac vascular surgery. Circulation 2003; 107:1848–1851.
- Ward RP, Leeper NJ, Kirkpatrick JN, Lang RM, Sorrentino MJ, Williams KA. The effect of preoperative statin therapy on cardiovascular outcomes in patients undergoing infrainguinal vascular surgery. Int J Cardiol 2005; 104:264–268.
- O’Neil-Callahan K, Katsimaglis G, Tepper MR, et al. Statins decrease perioperative cardiac complications in patients undergoing non-cardiac vascular surgery: the Statins for Risk Reduction in Surgery (StaRRS) study. J Am Coll Cardiol 2005; 45:336–342.
- Abbruzzese TA, Havens J, Belkin M, et al. Statin therapy is associated with improved patency of autogenous infrainguinal bypass grafts. J Vasc Surg 2004; 39:1178–1185.
- Boersma E, Poldermans D, Bax JJ, et al. Predictors of cardiac events after major vascular surgery: role of clinical characteristics, dobutamine echocardiography, and beta-blocker therapy. JAMA 2001; 285:1865–1873.
- Landesberg G, Mosseri M, Wolf YG, et al. Preoperative thallium scanning, selective coronary revascularization, and long-term survival after major vascular surgery. Circulation 2003; 108:177–183.
- Schouten O, Kertai MD, Bax JJ, et al. Safety of perioperative statin use in high-risk patients undergoing major vascular surgery. Am J Cardiol 2005; 95:658–660.
- Le Manach Y, Godet G, Coriat P, et al. The impact of postoperative discontinuation or continuation of chronic statin therapy on cardiac outcome after major vascular surgery. Anesth Analg 2007; 104:1326–1333.
- Ali IS, Buth KJ. Preoperative statin use and outcomes following cardiac surgery. Int J Cardiol 2005; 103:12–18.
- Clark LL, Ikonomidis JS, Crawford FA, et al. Preoperative statin treatment is associated with reduced postoperative mortality and morbidity in patients undergoing cardiac surgery: an 8-year retrospective cohort study. J Thorac Cardiovasc Surg 2006; 131:679–685.
- Pan W, Pintar T, Anton J, Lee VV, Vaughn WK, Collard CD. Statins are associated with a reduced incidence of perioperative mortality after coronary artery bypass graft surgery. Circulation 2004; 110(suppl 2):II45–II49.
- Pascual DA, Arribas JM, Tornel PL, et al. Preoperative statin therapy and troponin T predict early complications of coronary artery surgery. Ann Thorac Surg 2006; 81:78–83.
- Dotani MI, Elnicki DM, Jain AC, Gibson CM. Effect of preoperative statin therapy and cardiac outcomes after coronary artery bypass grafting. Am J Cardiol 2000; 86:1128–1130.
- Liakopoulos OJ, Dorge H, Schmitto JD, Nagorsnik U, Grabedunkel J, Schoendube FA. Effects of preoperative statin therapy on cytokines after cardiac surgery. Thorac Cardiovasc Surg 2006; 54:250–254.
- Christenson JT. Preoperative lipid-control with simvastatin reduces the risk of postoperative thrombocytosis and thrombotic complications following CABG. Eur J Cardiothorac Surg 1999; 15:394–399.
- Baigent C, Keech A, Kearney PM, et al. Efficacy and safety of cholesterol-lowering treatment: prospective meta-analysis of data from 90,056 participants in 14 randomised trials of statins. Lancet 2005; 366:1267–1278.
- Fleisher LA, Beckman JA, Brown KA, et al. ACC/AHA 2007 Guidelines on Perioperative Cardiovascular Evaluation and Care for Noncardiac Surgery. A Report of the American College of Cardiology/American Heart Association Task Force on Practice Guidelines (Writing Committee to Revise the 2002 Guidelines on Perioperative Cardiovascular Evaluation for Noncardiac Surgery). Circulation 2007; 116:e418–e499.
- Schouten O, Poldermans D, Visser L, et al. Fluvastatin and bisoprolol for the reduction of perioperative cardiac mortality and morbidity in high-risk patients undergoing non-cardiac surgery: rationale and design of the DECREASE-IV study. Am Heart J 2004; 148:1047–1052.
- Amar D, Zhang H, Heerdt PM, Park B, Fleisher M, Thaler HT. Statin use is associated with a reduction in atrial fibrillation after noncardiac thoracic surgery independent of C-reactive protein. Chest 2005; 128:3421–3427.
Soon, the checklist for internists seeing patients about to undergo surgery may include prescribing one of the lipid-lowering hydroxymethylglutaryl-CoA reductase inhibitors, also called statins.
Statins? Not long ago, we were debating whether patients who take statins should stop taking them before surgery, based on the manufacturers’ recommendations.1 The discussion, however, has changed to whether patients who have never received a statin should be started on one before surgery to provide immediate prophylaxis against cardiac morbidity, and how much harm long-term statin users face if these drugs are withheld perioperatively.
The evidence is still very preliminary and based mostly on studies in animals and retrospective studies in people. However, an expanding body of indirect evidence suggests that these drugs are beneficial in this situation.
In this review, we discuss the mechanisms by which statins may protect the heart in the short term, drawing on data from animal and human studies of acute myocardial infarction, and we review the current (albeit limited) data from the perioperative setting.
FEW INTERVENTIONS DECREASE RISK
Each year, approximately 50,000 patients suffer a perioperative cardiovascular event; the incidence of myocardial infarction during or after noncardiac surgery is 2% to 3%.2 The primary goal of preoperative cardiovascular risk assessment is to predict and avert these events.
But short of canceling surgery, few interventions have been found to reduce a patient’s risk. For example, a landmark study in 2004 cast doubt on the efficacy of preoperative coronary revascularization.3 Similarly, although early studies of beta-blockers were promising4,5 and although most internists prescribe these drugs before surgery, more recent studies have cast doubt on their efficacy, particularly in patients at low risk undergoing intermediate-risk (rather than vascular) surgery.6–8
This changing clinical landscape has prompted a search for new strategies for perioperative risk-reduction. Several recent studies have placed statins in the spotlight.
POTENTIAL MECHANISMS OF SHORT-TERM BENEFIT
Statins have been proven to save lives when used long-term, but how could this class of drugs, designed to prevent the accumulation of arterial plaques by lowering low-density lipoprotein cholesterol (LDL-C) levels, have any short-term impact on operative outcomes? Although LDL-C reduction is the principal mechanism of action of statins, not all of the benefit can be ascribed to this mechanism.9 The answer may lie in their “pleiotropic” effects—ie, actions other than LDL-C reduction.
The more immediate pleiotropic effects of statins in the proinflammatory and prothrombotic environment of the perioperative period are thought to include improved endothelial function (both antithrombotic function and vasomotor function in response to ischemic stress), enhanced stability of atherosclerotic plaques, decreased oxidative stress, and decreased vascular inflammation.10–12
EVIDENCE FROM ANIMAL STUDIES
Experiments in animals suggest that statins, given shortly before or after a cardiovascular event, confer benefit before any changes in LDL-C are measurable.
Lefer et al13 found that simvastatin (Zocor), given 18 hours before an ischemic episode in rats, blunted the inflammatory response in cardiac reperfusion injury. Not only was reperfusion injury significantly less in the hearts of the rats that received simvastatin than in the saline control group, but the simvastatin-treated hearts also expressed fewer neutrophil adhesion molecules such as P-selectin, and they had more basal release of nitric oxide, the potent endothelial-derived vasodilator with antithrombotic, anti-inflammatory, and antiproliferative effects.14 These results suggest that statins may improve endothelial function acutely, particularly during ischemic stress.
Osborne et al15 fed rabbits a cholesterol-rich diet plus either lovastatin (Mevacor) or placebo. After 2 weeks, the rabbits underwent either surgery to induce a myocardial infarction or a sham procedure. Regardless of the pretreatment, biopsies of the aorta did not reveal any atherosclerosis; yet the lovastatin-treated rabbits sustained less myocardial ischemic damage and they had more endothelium-mediated vasodilatation.
Statin therapy also may improve cerebral ischemia outcomes in animal models.14,16
Sironi et al16 induced strokes in rats by occluding the middle cerebral artery. The rats received either simvastatin or vehicle for 3 days before the stroke or immediately afterwards. Even though simvastatin did not have enough time to affect the total cholesterol level, rats treated with simvastatin had smaller infarcts (as measured by magnetic resonance imaging) and produced more nitric oxide.
Comment. Taken together, these studies offer tantalizing evidence that statins have short-term, beneficial nonlipid effects and may reduce not only the likelihood of an ischemic event, but—should one occur—the degree of tissue damage that ensues.
EFFECTS OF STATINS IN ACUTE CORONARY SYNDROME
The National Registry of Myocardial Infarction17 is a prospective, observational database of all patients with acute myocardial infarction admitted to 1,230 participating hospitals throughout the United States. In an analysis from this cohort, patients were divided into four groups: those receiving statins before and after admission, those receiving statins only before admission, those receiving statins only after admission, and those who never received statins.
Compared with those who never received statins, fewer patients who received them both before and after admission died while in the hospital (unadjusted odds ratio 0.23, 95% confidence interval [CI] 0.22–0.25), and the odds ratio for those who received statins for the first time was 0.31 (95% CI 0.29–0.33). Patients who stopped receiving a statin on admission were more likely to die than were patients who never received statins (odds ratio 1.09, 95% CI 1.03–1.15). These trends held true even when adjustments were made for potential confounding factors.
Comment. Unmeasured confounding factors (such as the inability to take pills due to altered mental status or the different practice styles of the providers who chose to discontinue statins) might have affected the results. Nevertheless, these results suggest that the protective effects of statins stop almost immediately when these drugs are discontinued, and that there may even be an adverse “rebound” effect when patients who have been taking these drugs for a long time stop taking them temporarily.
The Platelet Receptor Inhibition in Ischemic Syndrome Management trial,18 in a subgroup analysis, had nearly identical findings. In the main part of this trial, patients with coronary artery disease and chest pain at rest or accelerating pain in the last 24 hours were randomized to receive tirofiban (Aggrastat) or heparin. Complete data on statin use were available for 1,616 (50%) of the 3,232 patients in this trial, and the rate of the primary end point (death, myocardial infarction, or recurrent ischemia) was analyzed on the basis of statin therapy in this subgroup.
Comment. Together, these data lead to the conclusion that, when admitted for either acute myocardial infarction or acute coronary syndrome, patients already receiving statins should not have them stopped, and those who had not been receiving statins should receive them immediately. The safety of these medications in the acute setting appears excellent: in the Myocardial Ischemia Reduction With Acute Cholesterol Lowering (MIRACL)12 and the Pravastatin or Atorvastatin Evaluation and Infection Therapy (PROVE-IT)11 trials, fewer than 5% of statin-treated patients had transient elevations in transaminase levels, and no cases of rhabdomyolysis were reported.
PERIOPERATIVE STATIN STUDIES
The data on perioperative statin use are mostly observational and retrospective and fall into essentially four surgical categories: coronary artery bypass grafting (CABG), carotid endarterectomy,19,20 noncardiac vascular surgery, and major noncardiac surgery. Two meta-analyses have also evaluated the data.21,22 The only randomized controlled trial (performed by Durazzo et al23) was small and was carried out at a single center in vascular surgery patients, and the event rate was low.
Current recommendations from the National Cholesterol Education Program (NCEP)24 say that patients who need CABG, have peripheral arterial disease, have an abdominal aortic aneurysm, or have cerebrovascular disease should already be on a statin to achieve an LDL-C goal level of less than 100 mg/dL, with an optional goal of less than 70 mg/dL, independent of surgery.
Since not all patients who should be on statins are actually on them, questions arise:
- Is it important (and safe) to start statin treatment preoperatively?
- Will patients with cardiovascular risk factors but without known cardiovascular disease benefit from statins perioperatively?
Noncardiac vascular surgery
Multiple retrospective studies have evaluated the effect of statins in patients undergoing major noncardiac vascular surgery.25–32
Kertai et al25 evaluated 570 patients in Holland who underwent elective open surgery for infrarenal abdominal aortic aneurysms between 1991 and 2001, looking for an association between statin use and the incidence of perioperative death from myocardial infarction. Only 162 of the 570 patients had been on long-term statin therapy before the surgery. The use of statins was only one of many known baseline characteristics that were significantly different between the two groups, including age, body mass index, known coronary artery disease, and use of angiotensin-converting enzyme inhibitors and beta-blockers. In univariate analysis, statins appeared to be protective: 6 (3.7%) of the patients in the statin group died of a myocardial infarction, compared with 45 (11%) of those in the nostatin group. A multivariate analysis yielded similar findings, with an odds ratio of 0.24 (95% CI 0.11–0.54).
Ward et al27 performed a very similar retrospective study, with similar findings. In 446 patients who underwent surgery for infrarenal abdominal aortic aneurysm, statin therapy was associated with a significantly lower incidence of the combined end point of death, myocardial infarction, stroke, and major peripheral vascular complications, with an adjusted odds ratio of 0.36 (95% CI 0.14–0.93).
Poldermans et al26 noted similar findings in a case-control study of noncardiac vascular surgery patients. Statin users had a much lower perioperative risk of death than did nonusers, with an adjusted odds ratio of 0.22 (95% CI 0.10–0.47).
O’Neil-Callahan et al,28 in a cohort study, found that statin users had fewer perioperative cardiac complications, with an adjusted odds ratio of 0.49 (95% CI 0.28–0.84, P = .009).
Dogma of withdrawing statins before major surgery is challenged
Le Manach et al33 reviewed the outcomes for all patients of a single hospital in Paris who underwent nonemergency infrarenal aortic procedures between January 2001 and December 2004. In January 2004, the hospital instituted guidelines to ensure that patients on statins continue taking them up to the evening before surgery and that statins be restarted on the first postoperative day (via nasogastric tube if necessary). Before 2004, there had been no specific guidelines, and patients on statins did not receive them for a median of 4 days postoperatively. Types of procedures were similar during the two time periods, as were the rates of beta-blocker use, preoperative revascularization, venous thromboembolism prophylaxis, and perioperative blood pressure control. After surgery, topononin I levels were measured in all patients as surveillance for cardiac events, and were defined as elevated when greater than 0.2 ng/mL.
Compared with patients not on statins at all, those treated with statins continuously throughout the perioperative period (after January 2004) had a lower rate of elevated troponin (relative risk 0.38). In contrast, those who had their statins transiently discontinued perioperatively (prior to 2004) had troponin elevations more often than those who had never been treated (relative risk 2.1). This suggested an over fivefold risk reduction (P < .001) conferred by not discontinuing statins in the immediate postoperative period. This finding was maintained after multivariate adjustment: statin withdrawal was associated with a 2.9-fold (95% CI 1.6–5.5) increase in the risk of cardiac enzyme elevations postoperatively. No fewer deaths were noted, but the study was not powered to detect a mortality difference.
Comment. Although secular trends cannot be entirely discounted as contributing to these findings, the prompt increase in cardiac events after just 4 days of statin withdrawal adds to the growing body of evidence suggesting that statin discontinuation can have harmful acute effects. It also brings up the question: Can starting statins benefit patients in the same time period?
Should statins be started before vascular surgery?
Schouten et al32 evaluated the effects of newly started or continued statin treatment in patients undergoing major elective vascular surgery. Patients were screened before surgery and started on statins if they were not already receiving them and their total cholesterol levels were elevated; new users received the medication for about 40 days before surgery. Of the 981 screened patients, 44 (5%) were newly started on statins and 182 (19%) were continued on their therapy. Perioperative death or myocardial infarction occurred in 22 (8.8%) of the statin users and 111 (14.7%) of the nonusers, a statistically significant difference. Temporary discontinuation (median 1 day) of statins in this study due to the inability to take an oral medication did not appear to affect the likelihood of a myocardial infarction.
Durazzo et al23 performed a single-center, randomized, prospective, placebo-controlled, double-blind clinical trial of atorvastatin (Lipitor) 20 mg daily vs placebo in 100 patients undergoing noncardiac arterial vascular surgery. Patients were excluded if they had previously used medications to treat dyslipidemia, recently had a cardiovascular event, or had contraindications to statin treatment such as a baseline creatinine level greater than 2.0 mg/dL or severe hepatic disease. The intervention group received atorvastatin starting at least 2 weeks before surgery for a total of 45 days. Patients were then continued or started on a statin after surgery if their LDL-C level was greater than 100 mg/dL. Beta-blocker use was recommended “on the basis of current guidelines.”
One month after surgery, the LDL-C level was statistically significantly lower in the atorvastatin group. Since most patients did not continue or start statin therapy after the 45-day treatment period, the LDL-C levels were not statistically different at 3 and 6 months after surgery.
At 6 months, the rate of the primary end point (death from cardiovascular causes, nonfatal acute myocardial infarction, ischemic stroke, or unstable angina) was 26.0% in the placebo group and 8.0% in the atorvastatin group, a statistically significant difference. Three patients in the atorvastatin group had cardiac events in the first 10 days after surgery, compared with 11 patients in the placebo group. Thirteen of the 17 total cardiac events took place within 10 days after surgery.
One of the atorvastatin patients developed rhabdomyolysis and elevated aminotransferase levels.
Major noncardiac surgery
Lindenauer et al2 performed a retrospective cohort study of surgical patients who were at least 18 years old and survived beyond the second hospital day. Patients were divided into a group receiving any form of lipid-lowering treatment (of whom more than 90% were taking statins) and a group that had never never received a lipid-lowering drug or only started one on the third day of the hospitalization or later. The period of study was from January 1, 2000, to December 31, 2001.
In all, 780,591 patients from 329 hospitals throughout the United States were included, of whom only 77,082 (9.9%) received lipid-lowering therapy. Eight percent of the patients underwent vascular surgery. Not surprisingly, the treated patients were more likely to have a history of hypertension, diabetes, ischemic heart disease, or hyperlipidemia. They also were more likely to have a vascular procedure performed, to have two or more cardiac risk factors (high-risk surgery, ischemic heart disease, congestive heart failure, cerebrovascular disease, renal insufficiency, or diabetes mellitus), and to be treated with beta-blockers and angiotensin-converting enzyme inhibitors, but they were less likely to have high-risk and emergency surgery performed.
The primary end point, perioperative death, occurred in 2.13% of the treated patients and 3.05% of the nontreated group. Compared with the rate in a propensity-matched cohort, the odds ratio adjusted for unbalanced covariates was 0.62 (95% CI 0.58–0.67) in favor of lipid treatment. Stratification by cardiac risk index revealed a number needed to treat of 186 for those with no risk factors, 60 for those with two risk factors, and 30 for those with four or more risk factors.
Unfortunately, this analysis was not able to take into account whether and for how long patients were receiving lipid-lowering therapy before hospitalization. It therefore does not answer the questions of whether starting lipid-lowering therapy before surgery is beneficial or whether stopping it is harmful. It also does not shed light on whether perioperative lipid-lowering increases the risk of rhabdomyolysis or liver disease.
Carotid endarterectomy
Two recent retrospective cohort studies evaluated the outcomes in patients undergoing carotid endarterectomy.19,20
Kennedy et al19 found that patients on a statin at the time of admission who had symptomatic carotid disease had lower rates of inhospital death (adjusted odds ratio 0.24, 95% CI 0.06–0.91) and ischemic stroke or death (adjusted odds ratio 0.55, 95% CI 0.31–0.97). However, cardiac outcomes among these symptomatic patients were not significantly improved (odds ratio 0.82, 95% CI 0.45–1.50), nor was there benefit for asymptomatic patients, raising the possibility that the positive findings were due to chance or that patients at lower baseline risk for vascular events may have less benefit.
McGirt et al20 performed a similar study; they did not, however, distinguish whether patients had symptomatic vs asymptomatic carotid disease. The 30-day risk of perioperative stroke was lower in patients treated with a statin, with an odds ratio of 0.41 (95% CI 0.18–0.93); the odds ratio for death was 0.21 (95% CI 0.05–0.96). Cardiac outcomes were not significantly affected.
Coronary artery bypass graft surgery
According to the NCEP recommendations, nearly all patients undergoing CABG should already be on a statin before surgery since they all have known coronary artery disease. Multiple observational studies have offered confirmatory evidence that statins are beneficial in this setting.34–38
Liakopoulos et al39 evaluated whether the anti-inflammatory effects of statins may, in part, account for their beneficial effect in the perioperative period. The authors prospectively matched 18 patients who were taking statins and were referred for elective CABG with 18 patients who were not prescribed statins previously. The only major measured baseline characteristic that differed between the two groups was a statistically significantly lower LDL-C level in the statin group. The operative characteristics did not differ, and cytokine levels at baseline were similar.
Tumor necrosis factor alpha levels increased significantly in the control group but did not change significantly in the statin group. Interleukin 8 increased in both groups by a similar amount. Interleukin 6 (the major inducer of C-reactive protein) increased from baseline in both groups but did not increase nearly as much in the statin group as in the control group; the intergroup difference was statistically significant. The anti-inflammatory cytokine interleukin 10 increased minimally from baseline in the control group, while the statin group’s levels increased significantly above baseline and those of the control group.
Christenson40 also found that inflammatory markers were improved with pre-CABG statin treatment in a small randomized trial in which patients received simvastatin 20 mg 4 weeks prior to CABG surgery vs no statin. Interestingly, far fewer statin-treated patients developed thrombocytosis (platelet count > 400 × 109/L) than did control patients (3% vs 81%, P < .0001).
RISKS OF PERIOPERATIVE STATINS
The risks associated with statin therapy in general appear low, but specific perioperative risks have not been well studied.
Baigent et al,41 in a meta-analysis of randomized trials of nonperioperative statin therapy, found that rhabdomyolysis occurred in 9 (0.023%) of 39,884 patients receiving statins vs 6 (0.015%) of the 39,817 controls, with a number needed to harm of 12,500. Moreover, the rates of nonvascular death and cancer did not increase. It is plausible that the risk is somewhat greater in the perioperative setting but is likely not enough to outweigh the potential benefits, especially since the risk of ischemic vascular events is particularly high then.
Some of the perioperative studies cited above specifically addressed potential risks. For example, in the study by Schouten et al,32 mild creatine kinase elevations were more common in the statin-treated group, but the incidence of moderate and severe creatine kinase elevations did not differ significantly. No case of rhabdomyolysis occurred, and length of surgery was the only predictor of myopathy. MIRACL and PROVE-IT revealed similar safety profiles; aminotransferase levels normalized when statins were stopped, and no cases of rhabdomyolysis occurred.11,12 In the vascular surgery study by Durazzo et al,23 1 (2%) of the 50 atorvastatin-treated patients developed both rhabdomyolysis and elevated aminotransferase levels that prompted discontinuation of the statin.
Overall, the observational studies do not indicate that statin continuation or treatment is harmful in perioperative patients. However, these studies did not specifically evaluate patients with acute insults from surgery such as sepsis, renal failure, or hepatitis. It is unknown what effect statin therapy would have in those patients and whether statins should be selectively discontinued in patients who develop major hepatic, musculoskeletal, or renal complications after surgery.
OUR RECOMMENDATIONS
Before CABG or vascular surgery
Given the NCEP recommendations, existing primary and secondary prevention studies, observational studies of CABG and noncardiac vascular surgery patients, and the one randomized trial of vascular surgery patients, data support the use of statins in nearly all patients undergoing cardiac or vascular surgery. We advocate starting statins in the perioperative period to take advantage of their rapid-acting pleiotropic effects, and continuing them long-term to take advantage of their lipid-lowering effects. This recommendation is in line with the recently released American College of Cardiology/American Heart Association (ACC/AHA) 2007 perioperative guidelines that state “for patients undergoing vascular surgery with or without clinical risk factors, statin use is reasonable.”42
Although the ideal time to start statins is not certain, the study by Durazzo et al23 suggests that they should be started at least 2 weeks before surgery if possible. Moreover, patients already taking statins should definitely not have their statins discontinued if at all possible.
Before major nonvascular surgery
For patients undergoing major nonvascular (intermediate-risk) surgery, physicians should first ascertain if the patient has an indication for statin therapy based on current nonsurgical lipid level recommendations. However, even if there is no clear indication for statin therapy based on NCEP guidelines, we endorse the recently released ACC/AHA perioperative guidelines that state that statin therapy can be considered in patients with a risk factor who are undergoing intermediate-risk procedures. Moreover, we wholeheartedly support the ACC/AHA’s strongest recommendation that patients who are already receiving statins and are undergoing noncardiac surgery should not have their statins discontinued.
When to discontinue statins?
The risk of harm overall appears to be minimal and certainly less than the likelihood of benefit. It is reasonable to observe patients postoperatively for adverse clinical events that may increase the risk of perioperative statin treatment, such as acute renal failure, hepatic failure, or sepsis, but whether statins should be stopped in patients with these complications remains unknown; we advocate individualizing the decision.
More studies needed
We need more data on whether moderate-risk patients undergoing moderate-risk surgery benefit from perioperative statin therapy, when therapy should be started, whether therapy should be started on the day of surgery if it was not started earlier, which statin and what doses are optimal, how long therapy should be continued, and what degree of risk is associated with perioperative statin therapy.
Fortunately, important data should be forthcoming in the next few years: the Dutch Echocardiographic Cardiac Risk Evaluation Applying Stress Echocardiography (DECREASE-IV) study43 is a 4-year two-by-two factorial placebo-controlled study evaluating the use of fluvastatin (Lescol) and bisoprolol (Zebeta, a beta-blocker) separately and together in patients who are older than 40 years, are undergoing elective noncardiac surgery, have an estimated risk of cardiovascular death of more than 1%, have not used statins previously, and do not have elevated cholesterol.
- Grant PJ, Kedia N. Should statins be discontinued preoperatively? IMPACT consults. Proceedings of the 2nd Annual Cleveland Clinic Perioperative Medicine Summit. Cleve Clin J Med 2006; 73 Electronic suppl 1:S9–S10.
- Lindenauer PK, Pekow P, Wang K, Gutierrez B, Benjamin EM. Lipid-lowering therapy and in-hospital mortality following major noncardiac surgery. JAMA 2004; 291:2092–2099.
- McFalls EO, Ward HB, Moritz TE, et al. Coronary-artery revascularization before elective major vascular surgery. N Engl J Med 2004; 351:2795–2804.
- Mangano DT, Layug EL, Wallace A, Tateo I. Effect of atenolol on mortality and cardiovascular morbidity after noncardiac surgery. Multicenter Study of Perioperative Ischemia Research Group. N Engl J Med 1996; 335:1713–1720.
- Poldermans D, Boersma E, Bax JJ, et al. The effect of bisoprolol on perioperative mortality and myocardial infarction in high-risk patients undergoing vascular surgery. Dutch Echocardiographic Cardiac Risk Evaluation Applying Stress Echocardiography Study Group. N Engl J Med 1999; 341:1789–1794.
- Brady AR, Gibbs JS, Greenhalgh RM, Powell JT, Sydes MR. Perioperative beta-blockade (POBBLE) for patients undergoing infrarenal vascular surgery: results of a randomized double-blind controlled trial. J Vasc Surg 2005; 41:602–609.
- Juul AB, Wetterslev J, Gluud C, et al. Effect of perioperative beta blockade in patients with diabetes undergoing major non-cardiac surgery: randomised placebo controlled, blinded multicentre trial. BMJ 2006; 332:1482.
- Yang H, Raymer K, Butler R, Parlow J, Roberts R. The effects of perioperative beta-blockade: results of the Metoprolol after Vascular Surgery (MaVS) study, a randomized controlled trial. Am Heart J 2006; 152:983–990.
- Ridker PM, Cannon CP, Morrow D, et al. C-reactive protein levels and outcomes after statin therapy. N Engl J Med 2005; 352:20–28.
- Ito MK, Talbert RL, Tsimikas S. Statin-associated pleiotropy: possible beneficial effects beyond cholesterol reduction. Pharmacotherapy 2006; 26:85S–97S.
- Cannon CP, Braunwald E, McCabe CH, et al. Intensive versus moderate lipid lowering with statins after acute coronary syndromes. N Engl J Med 2004; 350:1495–1504.
- Schwartz GG, Olsson AG, Ezekowitz MD, et al. Effects of atorvastatin on early recurrent ischemic events in acute coronary syndromes: the MIRACL study: a randomized controlled trial. JAMA 2001; 285:1711–1718.
- Lefer AM, Campbell B, Shin YK, Scalia R, Hayward R, Lefer DJ. Simvastatin preserves the ischemic-reperfused myocardium in normocholesterolemic rat hearts. Circulation 1999; 100:178–184.
- Endres M, Laufs U, Liao JK, Moskowitz MA. Targeting eNOS for stroke protection. Trends Neurosci 2004; 27:283–289.
- Osborne JA, Lento PH, Siegfried MR, Stahl GL, Fusman B, Lefer AM. Cardiovascular effects of acute hypercholesterolemia in rabbits. Reversal with lovastatin treatment. J Clin Invest 1989; 83:465–473.
- Sironi L, Cimino M, Guerrini U, et al. Treatment with statins after induction of focal ischemia in rats reduces the extent of brain damage. Arterioscler Thromb Vasc Biol 2003; 23:322–327.
- Fonarow GC, Wright RS, Spencer FA, et al. Effect of statin use within the first 24 hours of admission for acute myocardial infarction on early morbidity and mortality. Am J Cardiol 2005; 96:611–616.
- Heeschen C, Hamm CW, Laufs U, Snapinn S, Bohm M, White HD. Withdrawal of statins increases event rates in patients with acute coronary syndromes. Circulation 2002; 105:1446–1452.
- Kennedy J, Quan H, Buchan AM, Ghali WA, Feasby TE. Statins are associated with better outcomes after carotid endarterectomy in symptomatic patients. Stroke 2005; 36:2072–2076.
- McGirt MJ, Perler BA, Brooke BS, et al. 3-hydroxy-3-methylglutaryl coenzyme A reductase inhibitors reduce the risk of perioperative stroke and mortality after carotid endarterectomy. J Vasc Surg 2005; 42:829–836.
- Hindler K, Shaw AD, Samuels J, Fulton S, Collard CD, Riedel B. Improved postoperative outcomes associated with preoperative statin therapy. Anesthesiology 2006; 105:1260–1272.
- Kapoor AS, Kanji H, Buckingham J, Devereaux PJ, McAlister FA. Strength of evidence for perioperative use of statins to reduce cardiovascular risk: systematic review of controlled studies. BMJ 2006; 333:1149.
- Durazzo AE, Machado FS, Ikeoka DT, et al. Reduction in cardiovascular events after vascular surgery with atorvastatin: a randomized trial. J Vasc Surg 2004; 39:967–975.
- Grundy SM, Cleeman JI, Merz CN, et al. Implications of recent clinical trials for the National Cholesterol Education Program Adult Treatment Panel III guidelines. Circulation 2004; 110:227–239.
- Kertai MD, Boersma E, Westerhout CM, et al. A combination of statins and beta-blockers is independently associated with a reduction in the incidence of perioperative mortality and nonfatal myocardial infarction in patients undergoing abdominal aortic aneurysm surgery. Eur J Vasc Endovasc Surg 2004; 28:343–352.
- Poldermans D, Bax JJ, Kertai MD, et al. Statins are associated with a reduced incidence of perioperative mortality in patients undergoing major noncardiac vascular surgery. Circulation 2003; 107:1848–1851.
- Ward RP, Leeper NJ, Kirkpatrick JN, Lang RM, Sorrentino MJ, Williams KA. The effect of preoperative statin therapy on cardiovascular outcomes in patients undergoing infrainguinal vascular surgery. Int J Cardiol 2005; 104:264–268.
- O’Neil-Callahan K, Katsimaglis G, Tepper MR, et al. Statins decrease perioperative cardiac complications in patients undergoing non-cardiac vascular surgery: the Statins for Risk Reduction in Surgery (StaRRS) study. J Am Coll Cardiol 2005; 45:336–342.
- Abbruzzese TA, Havens J, Belkin M, et al. Statin therapy is associated with improved patency of autogenous infrainguinal bypass grafts. J Vasc Surg 2004; 39:1178–1185.
- Boersma E, Poldermans D, Bax JJ, et al. Predictors of cardiac events after major vascular surgery: role of clinical characteristics, dobutamine echocardiography, and beta-blocker therapy. JAMA 2001; 285:1865–1873.
- Landesberg G, Mosseri M, Wolf YG, et al. Preoperative thallium scanning, selective coronary revascularization, and long-term survival after major vascular surgery. Circulation 2003; 108:177–183.
- Schouten O, Kertai MD, Bax JJ, et al. Safety of perioperative statin use in high-risk patients undergoing major vascular surgery. Am J Cardiol 2005; 95:658–660.
- Le Manach Y, Godet G, Coriat P, et al. The impact of postoperative discontinuation or continuation of chronic statin therapy on cardiac outcome after major vascular surgery. Anesth Analg 2007; 104:1326–1333.
- Ali IS, Buth KJ. Preoperative statin use and outcomes following cardiac surgery. Int J Cardiol 2005; 103:12–18.
- Clark LL, Ikonomidis JS, Crawford FA, et al. Preoperative statin treatment is associated with reduced postoperative mortality and morbidity in patients undergoing cardiac surgery: an 8-year retrospective cohort study. J Thorac Cardiovasc Surg 2006; 131:679–685.
- Pan W, Pintar T, Anton J, Lee VV, Vaughn WK, Collard CD. Statins are associated with a reduced incidence of perioperative mortality after coronary artery bypass graft surgery. Circulation 2004; 110(suppl 2):II45–II49.
- Pascual DA, Arribas JM, Tornel PL, et al. Preoperative statin therapy and troponin T predict early complications of coronary artery surgery. Ann Thorac Surg 2006; 81:78–83.
- Dotani MI, Elnicki DM, Jain AC, Gibson CM. Effect of preoperative statin therapy and cardiac outcomes after coronary artery bypass grafting. Am J Cardiol 2000; 86:1128–1130.
- Liakopoulos OJ, Dorge H, Schmitto JD, Nagorsnik U, Grabedunkel J, Schoendube FA. Effects of preoperative statin therapy on cytokines after cardiac surgery. Thorac Cardiovasc Surg 2006; 54:250–254.
- Christenson JT. Preoperative lipid-control with simvastatin reduces the risk of postoperative thrombocytosis and thrombotic complications following CABG. Eur J Cardiothorac Surg 1999; 15:394–399.
- Baigent C, Keech A, Kearney PM, et al. Efficacy and safety of cholesterol-lowering treatment: prospective meta-analysis of data from 90,056 participants in 14 randomised trials of statins. Lancet 2005; 366:1267–1278.
- Fleisher LA, Beckman JA, Brown KA, et al. ACC/AHA 2007 Guidelines on Perioperative Cardiovascular Evaluation and Care for Noncardiac Surgery. A Report of the American College of Cardiology/American Heart Association Task Force on Practice Guidelines (Writing Committee to Revise the 2002 Guidelines on Perioperative Cardiovascular Evaluation for Noncardiac Surgery). Circulation 2007; 116:e418–e499.
- Schouten O, Poldermans D, Visser L, et al. Fluvastatin and bisoprolol for the reduction of perioperative cardiac mortality and morbidity in high-risk patients undergoing non-cardiac surgery: rationale and design of the DECREASE-IV study. Am Heart J 2004; 148:1047–1052.
- Amar D, Zhang H, Heerdt PM, Park B, Fleisher M, Thaler HT. Statin use is associated with a reduction in atrial fibrillation after noncardiac thoracic surgery independent of C-reactive protein. Chest 2005; 128:3421–3427.
KEY POINTS
- Experiments in animals suggest that statins, given shortly before or after a cardiovascular event, confer benefit before any changes in lipids are measurable.
- Retrospective and prospective studies indicate that patients with either acute myocardial infarction or acute coronary syndrome who are already receiving statins should not have them stopped, and those who had not been receiving statins should receive them immediately.
- Most patients undergoing coronary artery bypass grafting or noncardiac vascular surgery should already be receiving a statin. These drugs can also be considered in patients undergoing intermediate-risk nonvascular surgery. Patients who have been receiving statins prior to surgery should not have them stopped for surgery.
Solifenacin‐Induced Small Bowel Pseudo‐Obstruction
Solfenacin succinate, an antimuscarinic agent, is approved for the treatment of overactive bladder and described as well tolerated in the elderly.1 We present the case of solifenacin‐induced small bowel pseudo‐obstruction in an 89‐year‐old woman.
FINDINGS
An 89‐year‐old woman with untreated stage 0 chronic lymphocytic leukemia and a history of stage III colorectal cancer treated with hemicolectomy and adjuvant capecitabine in 2003 was admitted to Johns Hopkins Hospital in 2006. She reported feeling dehydrated, nauseated, and constipated, with decreased output from her colostomy. She also noted no urine output for 4 days and felt that she had to urinate, but I can't. This coincided with a decrease in fluid intake. She denied fevers, chills, abdominal pain, or loss of appetite. While waiting to be seen in the emergency department, the patient was finally able to urinate.
She had no evidence of colon cancer recurrence, with a normal postoperative positron‐emission tomography (PET) scan in 2003, colonoscopy in 2005, and screening computerized tomography (CT) scan in 2005. She also had a history of well‐controlled hypertension and hypothyroidism, hyperlipidemia, chemotherapy‐induced neuropathy, and anxiety.
Her home medication regimen included solifenacin 5 mg once daily (started 10 days prior to her admission) for bladder overactivity, buspirone 5 mg 3 times a day, metoprolol 25 mg twice a day, pantoprazole 40 mg once daily, levothyroxine 100 g once daily, lisinopril/hydrochlorathiazide 20 mg/25 mg twice daily, gabapentin 300 mg twice a day, and fenofibrate 145 mg nightly.
The patient appeared nontoxic. Her exam was remarkable only for hypoactive bowel sounds and mild diffuse abdominal tenderness without distension or peritoneal signs. A Foley catheter was placed, and her postvoid residual was only 50 cc of urine. Her admission serum blood urea nitrogen and creatinine were 90 and 3.4 mg/dL, respectively, as compared with 18 and 0.8 mg/dL 2 months prior to presentation. A CT scan of the abdomen (Figure 1) revealed multiple dilated loops of small bowel with a transition point at the left lower quadrant ostomy site, consistent with a small bowel obstruction. A PET scan revealed no evidence of malignancy. A renal ultrasound showed no evidence of obstruction.

With cessation of solifenacin and lisinopril/hydrochlorothiazide and hydration with normal saline, her constipation resolved, as did her acute renal failure and perception of urinary retention. She began to tolerate a regular diet after 4 days of hospitalization, and her colostomy output normalized. At follow‐up 8 months after admission, her creatinine was 0.8 mg/dL, and a screening abdominal CT showed complete resolution of the small bowel obstruction.
DISCUSSION
We believe that this patient developed small bowel pseudo‐obstruction as well the feeling of urinary retention because of treatment with solifenacin, an antimuscarinic agent approved for the treatment of bladder overactivity. Her acute renal failure was a result of prerenal azotemia. This particular patient was at increased risk for developing antimuscarinic‐induced bowel obstruction because of her previous surgery and exposure to chemotherapy.
In the 4 randomized trials cited in the prescribing information for solifenacin,2 only 189 patients of the 1811 who received the active drug were greater than 75 years old. Healthy elderly patients ranging from 64 to 78 years of age (mean 68.0 years) who received 2 weeks of treatment with solifenacin 5 and 10 mg had a mean AUC024 that was approximately 20% higher than that of younger subjects.3 In the 4 12‐week double‐blind clinical trials in which 1158 patients were treated with solifenacin 10 mg, there were 3 serious intestinal adverse events: 1 patient had a fecal impaction, 1 patient had a colonic obstruction, and 1 patient had an intestinal obstruction.2 Patients receiving solifenacin 5 and 10 mg were more likely to experience constipation than those receiving placebo (5.4%, 13.4%, and 2.9%, respectively).2 Given the dearth of clinical data on patients greater than 75 years old, the effects of age on the pharmacokinetics, the higher likelihood of bowel pathology in the elderly, the increased risk of solifenacin‐induced side effects in the elderly as reported in the pooled analysis of patients at least 65 years old,4 and the small clinical benefit of solifenacin,46 physicians should seriously consider whether the benefits of solifenacin outweigh both the known and the possible risks. 0
| Patients in safety analysis (n) | Constipation, n (%) | Micturition/24 hours | ||||||||
|---|---|---|---|---|---|---|---|---|---|---|
| Placebo | 5 mg | 10 mg | Placebo | 5 mg | 10 mg | Baseline | Mean decrease from baseline | |||
| Placebo | 5 mg | 10 mg | ||||||||
| ||||||||||
| Chapple et al.6* | 267 | 279 | 268 | 5 (1.9) | 20 (7.2) | 21 (7.8) | 12.0812.32 | 1.2 | 2.19 | 2.61 |
| Cardozo et al.4* | 301 | 299 | 307 | 6 (2.0) | 11 (3.7) | 28 (9.1) | 12.0512.31 | 1.59 | 2.37 | 2.81 |
| Wagg3 | 422 | 192 | 431 | 18 (4.3) | 18 (9.4) | 78 (18.1) | 11.611.7 | 1.1 | 2.0 | 2.5 |
- .Solifenacin provides effective antimuscarinic therapy for the complete management of overactive bladder.Expert Opin Pharmacother.2006;7:2421–2434.
- Yamanouchi Pharma America, Inc.United States prescribing information for solifenacin succinate (Vesicare®), November2004.
- ,,,,.Effect of age on the pharmacokinetics of solifenacin in men and women.Int J Clin Pharmacol Ther.2005;43:227–238.
- ,,.Efficacy and tolerability of solifenacin in elderly subjects with overactive bladder syndrome: a pooled analysis.Am J Geriatr Pharmacother.2006;4(1):14–24.
- ,,, et al.Randomized, double‐blind placebo controlled trial of the once daily antimuscarinic agent solifenacin succinate in patients with overactive bladder.J Urol.2004;172(5 Pt 1):1919–1924.
- ,,, et al.Randomized, double‐blind placebo‐ and tolterodine‐controlled trial of the once‐daily antimuscarinic agent solifenacin in patients with symptomatic overactive bladder.BJU Int.2004;93:303–310.
Solfenacin succinate, an antimuscarinic agent, is approved for the treatment of overactive bladder and described as well tolerated in the elderly.1 We present the case of solifenacin‐induced small bowel pseudo‐obstruction in an 89‐year‐old woman.
FINDINGS
An 89‐year‐old woman with untreated stage 0 chronic lymphocytic leukemia and a history of stage III colorectal cancer treated with hemicolectomy and adjuvant capecitabine in 2003 was admitted to Johns Hopkins Hospital in 2006. She reported feeling dehydrated, nauseated, and constipated, with decreased output from her colostomy. She also noted no urine output for 4 days and felt that she had to urinate, but I can't. This coincided with a decrease in fluid intake. She denied fevers, chills, abdominal pain, or loss of appetite. While waiting to be seen in the emergency department, the patient was finally able to urinate.
She had no evidence of colon cancer recurrence, with a normal postoperative positron‐emission tomography (PET) scan in 2003, colonoscopy in 2005, and screening computerized tomography (CT) scan in 2005. She also had a history of well‐controlled hypertension and hypothyroidism, hyperlipidemia, chemotherapy‐induced neuropathy, and anxiety.
Her home medication regimen included solifenacin 5 mg once daily (started 10 days prior to her admission) for bladder overactivity, buspirone 5 mg 3 times a day, metoprolol 25 mg twice a day, pantoprazole 40 mg once daily, levothyroxine 100 g once daily, lisinopril/hydrochlorathiazide 20 mg/25 mg twice daily, gabapentin 300 mg twice a day, and fenofibrate 145 mg nightly.
The patient appeared nontoxic. Her exam was remarkable only for hypoactive bowel sounds and mild diffuse abdominal tenderness without distension or peritoneal signs. A Foley catheter was placed, and her postvoid residual was only 50 cc of urine. Her admission serum blood urea nitrogen and creatinine were 90 and 3.4 mg/dL, respectively, as compared with 18 and 0.8 mg/dL 2 months prior to presentation. A CT scan of the abdomen (Figure 1) revealed multiple dilated loops of small bowel with a transition point at the left lower quadrant ostomy site, consistent with a small bowel obstruction. A PET scan revealed no evidence of malignancy. A renal ultrasound showed no evidence of obstruction.
With cessation of solifenacin and lisinopril/hydrochlorothiazide and hydration with normal saline, her constipation resolved, as did her acute renal failure and perception of urinary retention. She began to tolerate a regular diet after 4 days of hospitalization, and her colostomy output normalized. At follow‐up 8 months after admission, her creatinine was 0.8 mg/dL, and a screening abdominal CT showed complete resolution of the small bowel obstruction.
DISCUSSION
We believe that this patient developed small bowel pseudo‐obstruction as well the feeling of urinary retention because of treatment with solifenacin, an antimuscarinic agent approved for the treatment of bladder overactivity. Her acute renal failure was a result of prerenal azotemia. This particular patient was at increased risk for developing antimuscarinic‐induced bowel obstruction because of her previous surgery and exposure to chemotherapy.
In the 4 randomized trials cited in the prescribing information for solifenacin,2 only 189 patients of the 1811 who received the active drug were greater than 75 years old. Healthy elderly patients ranging from 64 to 78 years of age (mean 68.0 years) who received 2 weeks of treatment with solifenacin 5 and 10 mg had a mean AUC024 that was approximately 20% higher than that of younger subjects.3 In the 4 12‐week double‐blind clinical trials in which 1158 patients were treated with solifenacin 10 mg, there were 3 serious intestinal adverse events: 1 patient had a fecal impaction, 1 patient had a colonic obstruction, and 1 patient had an intestinal obstruction.2 Patients receiving solifenacin 5 and 10 mg were more likely to experience constipation than those receiving placebo (5.4%, 13.4%, and 2.9%, respectively).2 Given the dearth of clinical data on patients greater than 75 years old, the effects of age on the pharmacokinetics, the higher likelihood of bowel pathology in the elderly, the increased risk of solifenacin‐induced side effects in the elderly as reported in the pooled analysis of patients at least 65 years old,4 and the small clinical benefit of solifenacin,46 physicians should seriously consider whether the benefits of solifenacin outweigh both the known and the possible risks. 0
| Patients in safety analysis (n) | Constipation, n (%) | Micturition/24 hours | ||||||||
|---|---|---|---|---|---|---|---|---|---|---|
| Placebo | 5 mg | 10 mg | Placebo | 5 mg | 10 mg | Baseline | Mean decrease from baseline | |||
| Placebo | 5 mg | 10 mg | ||||||||
| ||||||||||
| Chapple et al.6* | 267 | 279 | 268 | 5 (1.9) | 20 (7.2) | 21 (7.8) | 12.0812.32 | 1.2 | 2.19 | 2.61 |
| Cardozo et al.4* | 301 | 299 | 307 | 6 (2.0) | 11 (3.7) | 28 (9.1) | 12.0512.31 | 1.59 | 2.37 | 2.81 |
| Wagg3 | 422 | 192 | 431 | 18 (4.3) | 18 (9.4) | 78 (18.1) | 11.611.7 | 1.1 | 2.0 | 2.5 |
- .Solifenacin provides effective antimuscarinic therapy for the complete management of overactive bladder.Expert Opin Pharmacother.2006;7:2421–2434.
- Yamanouchi Pharma America, Inc.United States prescribing information for solifenacin succinate (Vesicare®), November2004.
- ,,,,.Effect of age on the pharmacokinetics of solifenacin in men and women.Int J Clin Pharmacol Ther.2005;43:227–238.
- ,,.Efficacy and tolerability of solifenacin in elderly subjects with overactive bladder syndrome: a pooled analysis.Am J Geriatr Pharmacother.2006;4(1):14–24.
- ,,, et al.Randomized, double‐blind placebo controlled trial of the once daily antimuscarinic agent solifenacin succinate in patients with overactive bladder.J Urol.2004;172(5 Pt 1):1919–1924.
- ,,, et al.Randomized, double‐blind placebo‐ and tolterodine‐controlled trial of the once‐daily antimuscarinic agent solifenacin in patients with symptomatic overactive bladder.BJU Int.2004;93:303–310.