User login
Although potentially life saving, blood‐product transfusion is costly and associated with transfusion‐related adverse events, including death on rare occasions. Studies in varied patient populations have demonstrated that a restrictive red blood cell transfusion strategy reduces the number of transfusion‐related adverse effects and can result in improved short‐term survival.[1, 2, 3] In 2011, more than 20 million blood products were transfused in the United States, which resulted in more than 50,000 transfusion‐related adverse reactions (0.24%).[4] With a mean cost of greater than $50 per unit of plasma and $500 per unit of apheresis platelets,[4] the cost of blood transfusion is well in excess of $1 billion per year. Blood‐product transfusion is the most frequent inpatient procedure,[5] and inpatient blood‐product transfusion contributes to the bulk of transfusions nationwide. To study the utilization of blood‐product transfusion in the inpatient population, we studied the temporal trend of inpatient blood‐product transfusions in the United States from 2002 to 2011 using data from the Nationwide Inpatient Sample (NIS), Healthcare Cost and Utilization Project, Agency for Healthcare Research and Quality.[4] The NIS, the largest inpatient care database in the United States, includes approximately a 20% stratified sample of US community hospital admissions and is weighted at discharge level to permit population‐level estimates.[6] We utilized this database to identify the total number of blood‐product transfusions and discharges between 2002 and 2011. We calculated the rate of all blood‐product transfusions, which include packed red blood cell, platelets, and other blood components, using the International Classification of DiseasesNinth Revision, Clinical Modification Procedural Clinical Classification Software code 222.[7] Trend analysis and calculation of average annual percent change were done using the Joinpoint Regression Program version 4.0.4 (National Cancer Institute, Bethesda, MD).[8] This software uses trend data and calculates the best fit lines to create the simplest joinpoint model that the data allow. The model can be expressed as a figure where several different multisegmented trend lines are connected together at the joinpoints. Trend over a fixed prespecified interval was computed as average annual percent change, and the Monte Carlo permutation method was used to test for apparent change in the trends.[9, 10] The study was exempted by the institutional review board of the University of Nebraska Medical Center.
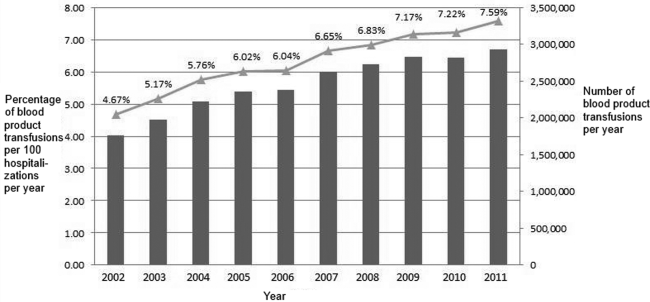
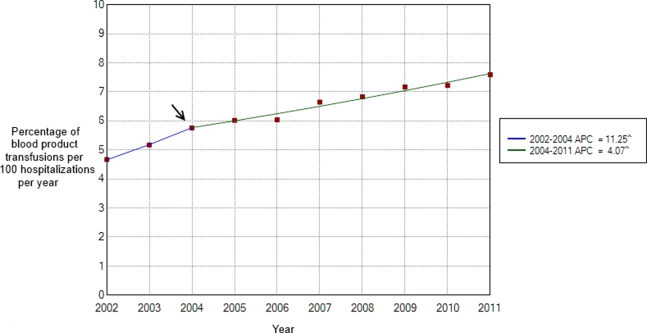
Between 2002 and 2011, there were a total of 24,641,581 blood‐product transfusions among 389,761,571 hospitalizations. The rate of transfusion per 100 hospitalizations increased by 2.9% from 2002 to 2011 (4.6% in 2002 [n=1,767,111] to 7.5% in 2011 [n=2,929,312]) (Figure 1). The average annual percent change from 2002 to 2011 was 5.6% (95% confidence interval [CI]: 3.7‐7.6), which was statistically significant at P<0.05. A statistically significant change in trend (joinpoint) was observed in 2004. The annual percent change was 11.2% (95% CI: 0.323.4) from 2002 to 2004 and 4.1% (95% CI: 3.05.1) from 2004 to 2011, both of which were statistically significant at P<0.05 (Figure 2).
Our study demonstrates an overall increasing trend in the inpatient blood‐product transfusions over the past decade. However, the rate of increase seems to have slowed down since 2004. The National Blood Collection and Utilization Survey[4] demonstrated a decrease of 11.6% in the total number of all components transfused in the United States between 2008 and 2011. Our data are different from the survey, which also included blood transfusions in outpatient settings, emergency departments, and pediatric patients. The rising proportion of aging population with multiple comorbidities and cancers, increases in hematopoietic stem cell/solid organ transplants and chemotherapy, as well as widespread availability of blood products presumably contributed to the continued increase observed in our inpatient data after 2004. Nevertheless, the declining trend in the rate of the increased blood‐product transfusion usage seen after 2004 is encouraging. Increased awareness of restrictive transfusion strategy, coupled with efforts by professional bodies to improve the adoption of restrictive strategies, is most likely responsible for this.[3, 11, 12] As the clinical classification software procedure code 222 lumps together all the different types of blood products, we were unable to study the transfusion trend among each different type of blood products. In conclusion, further efforts need to be directed at increasing the awareness of clinicians, especially hospitalists, about the benefits of a restrictive transfusion policy and decreasing the rate of blood product use in the inpatient service. Furthermore, studies elaborating the patient population who are being transfused and the factors influencing the transfusion trends can provide useful insights to optimize blood‐product utilization and control resource consumption.
Disclosure
Nothing to report.
- , , . Outcomes using lower vs higher hemoglobin thresholds for red blood cell transfusion. JAMA. 2013;309(1):83–84.
- , , , et al. Transfusion strategies for acute upper gastrointestinal bleeding. N Engl J Med. 2013;368(1):11–21.
- , , , . Evidence review: periprocedural use of blood products. J Hosp Med. 2013;8(11):647–652.
- The 2011 National Blood Collection and Utilization Survey Report. Washington, DC: U.S. Department of Health and Human Services, Office of the Assistant Secretary for Health; 2013.
- , , , et al. HCUP facts and figures: statistics on hospital‐based care in the United States. 2009. Agency for Healthcare Research and Quality, Rockville, MD. Available at: http://www.hcup‐us.ahrq.gov/reports.jsp. Accessed January 2, 2014.
- HCUP Nationwide Inpatient Sample (NIS). Healthcare Cost and Utilization Project. 2009–2011. Agency for Healthcare Research and Quality, Rockville, MD. Available at: www.hcup‐us.ahrq.gov/nisoverview.jsp. Accessed December 15, 2013.
- HCUP Clinical Classifications Software (CCS) for ICD‐9‐CM. Healthcare Cost and Utilization Project. 2009–2011. Agency for Healthcare Research and Quality, Rockville, MD. Available at: www.hcup‐us.ahrq.gov/toolssoftware/ccs/ccs.jsp. Accessed December 15, 2013.
- Joinpoint Regression Program, Version 4.0.4, December, 2014. Statistical Methodology and Applications Branch, Surveillance Research Program, National Cancer Institute. Available at: https://surveillance.cancer.gov/joinpoint/download. Accessed December 25, 2013.
- , , , , . Estimating average annual per cent change in trend analysis. Stat Med. 2009;28(29):3670–3682.
- , , , . Permutation tests for joinpoint regression with applications to cancer rates. Stat Med. 2000;19(3):335–351.
- , , , et al. Choosing wisely in adult hospital medicine: five opportunities for improved healthcare value. J Hosp Med. 2013;8(9):486–492.
- , , , . Patient‐centered blood management. J Hosp Med. 2014;9(1):60–65.
Although potentially life saving, blood‐product transfusion is costly and associated with transfusion‐related adverse events, including death on rare occasions. Studies in varied patient populations have demonstrated that a restrictive red blood cell transfusion strategy reduces the number of transfusion‐related adverse effects and can result in improved short‐term survival.[1, 2, 3] In 2011, more than 20 million blood products were transfused in the United States, which resulted in more than 50,000 transfusion‐related adverse reactions (0.24%).[4] With a mean cost of greater than $50 per unit of plasma and $500 per unit of apheresis platelets,[4] the cost of blood transfusion is well in excess of $1 billion per year. Blood‐product transfusion is the most frequent inpatient procedure,[5] and inpatient blood‐product transfusion contributes to the bulk of transfusions nationwide. To study the utilization of blood‐product transfusion in the inpatient population, we studied the temporal trend of inpatient blood‐product transfusions in the United States from 2002 to 2011 using data from the Nationwide Inpatient Sample (NIS), Healthcare Cost and Utilization Project, Agency for Healthcare Research and Quality.[4] The NIS, the largest inpatient care database in the United States, includes approximately a 20% stratified sample of US community hospital admissions and is weighted at discharge level to permit population‐level estimates.[6] We utilized this database to identify the total number of blood‐product transfusions and discharges between 2002 and 2011. We calculated the rate of all blood‐product transfusions, which include packed red blood cell, platelets, and other blood components, using the International Classification of DiseasesNinth Revision, Clinical Modification Procedural Clinical Classification Software code 222.[7] Trend analysis and calculation of average annual percent change were done using the Joinpoint Regression Program version 4.0.4 (National Cancer Institute, Bethesda, MD).[8] This software uses trend data and calculates the best fit lines to create the simplest joinpoint model that the data allow. The model can be expressed as a figure where several different multisegmented trend lines are connected together at the joinpoints. Trend over a fixed prespecified interval was computed as average annual percent change, and the Monte Carlo permutation method was used to test for apparent change in the trends.[9, 10] The study was exempted by the institutional review board of the University of Nebraska Medical Center.
Between 2002 and 2011, there were a total of 24,641,581 blood‐product transfusions among 389,761,571 hospitalizations. The rate of transfusion per 100 hospitalizations increased by 2.9% from 2002 to 2011 (4.6% in 2002 [n=1,767,111] to 7.5% in 2011 [n=2,929,312]) (Figure 1). The average annual percent change from 2002 to 2011 was 5.6% (95% confidence interval [CI]: 3.7‐7.6), which was statistically significant at P<0.05. A statistically significant change in trend (joinpoint) was observed in 2004. The annual percent change was 11.2% (95% CI: 0.323.4) from 2002 to 2004 and 4.1% (95% CI: 3.05.1) from 2004 to 2011, both of which were statistically significant at P<0.05 (Figure 2).
Our study demonstrates an overall increasing trend in the inpatient blood‐product transfusions over the past decade. However, the rate of increase seems to have slowed down since 2004. The National Blood Collection and Utilization Survey[4] demonstrated a decrease of 11.6% in the total number of all components transfused in the United States between 2008 and 2011. Our data are different from the survey, which also included blood transfusions in outpatient settings, emergency departments, and pediatric patients. The rising proportion of aging population with multiple comorbidities and cancers, increases in hematopoietic stem cell/solid organ transplants and chemotherapy, as well as widespread availability of blood products presumably contributed to the continued increase observed in our inpatient data after 2004. Nevertheless, the declining trend in the rate of the increased blood‐product transfusion usage seen after 2004 is encouraging. Increased awareness of restrictive transfusion strategy, coupled with efforts by professional bodies to improve the adoption of restrictive strategies, is most likely responsible for this.[3, 11, 12] As the clinical classification software procedure code 222 lumps together all the different types of blood products, we were unable to study the transfusion trend among each different type of blood products. In conclusion, further efforts need to be directed at increasing the awareness of clinicians, especially hospitalists, about the benefits of a restrictive transfusion policy and decreasing the rate of blood product use in the inpatient service. Furthermore, studies elaborating the patient population who are being transfused and the factors influencing the transfusion trends can provide useful insights to optimize blood‐product utilization and control resource consumption.
Disclosure
Nothing to report.
- , , . Outcomes using lower vs higher hemoglobin thresholds for red blood cell transfusion. JAMA. 2013;309(1):83–84.
- , , , et al. Transfusion strategies for acute upper gastrointestinal bleeding. N Engl J Med. 2013;368(1):11–21.
- , , , . Evidence review: periprocedural use of blood products. J Hosp Med. 2013;8(11):647–652.
- The 2011 National Blood Collection and Utilization Survey Report. Washington, DC: U.S. Department of Health and Human Services, Office of the Assistant Secretary for Health; 2013.
- , , , et al. HCUP facts and figures: statistics on hospital‐based care in the United States. 2009. Agency for Healthcare Research and Quality, Rockville, MD. Available at: http://www.hcup‐us.ahrq.gov/reports.jsp. Accessed January 2, 2014.
- HCUP Nationwide Inpatient Sample (NIS). Healthcare Cost and Utilization Project. 2009–2011. Agency for Healthcare Research and Quality, Rockville, MD. Available at: www.hcup‐us.ahrq.gov/nisoverview.jsp. Accessed December 15, 2013.
- HCUP Clinical Classifications Software (CCS) for ICD‐9‐CM. Healthcare Cost and Utilization Project. 2009–2011. Agency for Healthcare Research and Quality, Rockville, MD. Available at: www.hcup‐us.ahrq.gov/toolssoftware/ccs/ccs.jsp. Accessed December 15, 2013.
- Joinpoint Regression Program, Version 4.0.4, December, 2014. Statistical Methodology and Applications Branch, Surveillance Research Program, National Cancer Institute. Available at: https://surveillance.cancer.gov/joinpoint/download. Accessed December 25, 2013.
- , , , , . Estimating average annual per cent change in trend analysis. Stat Med. 2009;28(29):3670–3682.
- , , , . Permutation tests for joinpoint regression with applications to cancer rates. Stat Med. 2000;19(3):335–351.
- , , , et al. Choosing wisely in adult hospital medicine: five opportunities for improved healthcare value. J Hosp Med. 2013;8(9):486–492.
- , , , . Patient‐centered blood management. J Hosp Med. 2014;9(1):60–65.
