User login
Medical and economic burden of heparin-induced thrombocytopenia: A retrospective nationwide inpatient sample (NIS) study
Each year, approximately one-third of all hospitalized medical and surgical patients in the United States (about 12 million patients) are exposed to heparin products for the prevention or treatment of thromboembolism.1 Although generally safe, heparin can trigger an immune response in which platelet factor 4–heparin complexes set off an antibody-mediated cascade that can result in heparin-induced thrombocytopenia (HIT) and paradoxical arterial and venous thromboses, or heparin-induced thrombocytopenia with thrombosis (HITT). The incidence of HIT appears to be significantly higher with the more immunogenic unfractionated heparin (UFH) (2%-3% if treated for ≥5 days) than with low-molecular-weight heparin (LMWH) (0.2%-0.6%)2 and is significantly higher in postoperative patients (1%-5%) than in medical patients.3 Older patients and female patients, especially those who undergo surgery, are thought to be at higher risk.4 Progression from HIT to HITT can occur in up to 50% of surgical patients,5 and HITT can significantly increase mortality.4
In the United States, LMWH use has increased 5-fold since 2000—an increase attributed to the 2010 release of generic enoxaparin.6 As US hospitals switch from UFH to LMWH with its significantly lower risk of HIT, up-to-date HIT incidence data may help physicians and payers better understand the impact of the disorder on mortality and hospital length of stay (LOS) for medical patients and subsets of surgical patients and subsequently direct screening efforts to those at highest risk. Therefore, in the present study, we used national data to determine the latest incidence and economic implications of HIT overall and for high-risk surgical groups.
METHODS
In this study, we analyzed data from the Nationwide Inpatient Sample (NIS) database, part of the Healthcare Cost and Utilization Project (HCUP) of the Agency for Healthcare Research and Quality (AHRQ). The period studied was 2009-2011. We used International Classification of Diseases, Ninth Revision, Clinical Modification (ICD-9-CM) code 289.84, introduced in 2009, to identify patients who were at least 18 years old and had a primary or secondary diagnosis of HIT. Validated Clinical Classifications Software (CCS) was used to identify those who underwent cardiac, vascular, or orthopedic surgery, and ICD-9-CM codes for various thromboses were used to identify those with HITT (Supplemental Figure, Supplemental Table 1). Baseline patient and hospital characteristics were compared using the Pearson’s Chi-square test for categorical variables and the Student t test for continuous variables (2-sided P < 0.05 for statistical significance) (Table 1). We calculated the incidence of HIT overall and for the 3 surgical subgroups and compared the cohorts on their mean hospital LOS, mean hospital charge, and in-hospital mortality (Table 2).

Statistical analysis was performed with Stata Version 13.1 (Stata Corp, College Station, TX). Survey commands were used to account for the complex survey design in NIS. Reading Health System’s Institutional Review Board determined that our study protocol was exempt.
RESULTS
Of 98,636,364 hospitalizations, 72,515 (0.07%) involved HIT. There were no significant differences in the annual incidence of HIT during the study period (0.06% in 2009, 0.05% in 2010, 0.06% in 2011).

Regarding HIT, the death rate was 4-fold higher for patients with the disorder (9.63%) than for those without it (2.19%); hospital LOS and costs were significantly higher, too (Table 2). In addition, in-hospital mortality was higher (P < 0.001) for patients with HITT (12.28%) than for patients with HIT without thrombosis (8.24%); HITT patients’ hospital LOS and costs were higher as well. In patients who had cardiac, vascular, or orthopedic surgery, development of HIT was also associated with significantly higher in-hospital mortality, mean hospital LOS, and mean hospital charge. In patients with HITT, deep vein thrombosis (DVT) and pulmonary embolism represented the majority of reported cases (Supplemental Table 2). However, in patients who had cardiac surgery, acute arterial thromboses of coronary and cerebral vessels were more common.
DISCUSSION
In this national database survey, the overall incidence of HIT during the study period 2009-2011 was 0.07%, or 1 in 1350 hospitalized patients. Although earlier studies reported rates as high as 5% for high-risk subgroups of surgical patients,7 our data are more in line with more recently reported rates: about 0.02% for hospital admissions8 and from less than 0.1% to 0.4% for patients who received heparin.9 Older studies, which predominantly involved postoperative patients and were conducted when UFH often was the first-line heparin product used, may account for higher rates relative to ours. Of the 3 types of surgeries we evaluated, cardiac surgery had the highest HIT rate (0.5%), consistent with other studies.4 The higher HIT/HITT rates found for larger urban hospitals in our study might be attributable to increased awareness and testing, availability of hematology consultation, and higher risk of heparin use in this setting, where patients are sicker and cases and procedures more complicated.
Age was an important determinant of HIT risk in our study and in similar large-database series.4 Whether increased UFH use in the elderly (because of age or kidney disease) was a causative factor in this finding is unknown. In our study, although men and women had a nearly equal incidence of HIT, women had a significantly higher risk of HIT after both cardiac surgery and vascular surgery. Immune-mediated mechanisms that are more common in females may play a causative role in these settings.10
Our study results showed HIT associated with increased hospital LOS and an almost 4-fold increase in inpatient mortality and costs. The increased economic burden in HIT cases may be driven by the diagnostic work-up cost and expensive alternative anticoagulation.11,12 Similarly, compared with HIT without thrombosis, HITT was associated with significantly increased hospital LOS (3.7 days), total hospital charge ($64,279) and mortality (49% increase, to 12.2% from 8.2%), consistent with prior studies.13 In addition, 34.1% (24,704) of our HIT patients developed at least 1 thrombotic complication, with venous thromboses more common than arterial thromboses, as previously reported.13 Lower extremity DVT was the most common thrombosis in orthopedic and vascular surgery. However, in cardiac surgery, acute coronary occlusion was the most common thrombotic complication. We postulate that the difference stems from the increased propensity of HIT-related thrombosis to occur in areas of vascular injury.14
The strengths of our study include its large size, which increases the generalizability of its results and avoids the biases inherent in small, single-center studies. As with any administrative dataset, the NIS may include coding errors related to underdiagnosis and overdiagnosis (eg, a HIT/HITT diagnosis carried forward from prior episodes). In our study, we inferred the HITT diagnosis in HIT cases with a vascular complication, but we could have missed HIT cases that had not been coded for vascular complications, and we could have overassociated vascular complications that had predated HIT and been treated with heparin. Although HIT and HITT were associated with worse clinical outcomes and increased hospital LOS, it is possible patients who were hospitalized longer had more opportunities for heparin use, and this exposure led to HIT or HITT. The lack of details regarding prior heparin use, including type of heparin (UFH or LMWH), prevented us from inferring the actual risks of individual heparin products.
In conclusion, in cardiac, vascular, and orthopedic surgery, HIT and especially HITT can significantly increase hospital LOS, inpatient costs, and mortality. Lower extremity DVT and acute coronary artery occlusion are the most common thrombotic complications in these cases. HIT screening strategies that incorporate platelet counts are recommended only in patients at highest risk (>1%), according to the most recent American College of Chest Physicians guidelines, but this recommendation was made on the basis of the high cost of alternative anticoagulants. Given our more recent data regarding the very high costs of HIT and especially HITT, screening strategies with platelet counts may prove more cost-effective. Recent genome-wide studies that found higher rates of HIT in patients with T-cell death–associated gene 8 (TDAG8) may help explain sex differences in postoperative patients and identify patients at highest risk so alternative anticoagulants can be used.15
Disclosures
This study was funded by the Reading Health System (grant RHS0010). Dr. Bhatt is supported by the Physician-Scientist Training Program (grant 2015-2016), College of Medicine, University of Nebraska Medical Center. The other authors report no financial conflicts of interest.
1. Fahey VA. Heparin-induced thrombocytopenia. J Vasc Nurs. 1995;13(4):112-116. PubMed
2. TE, Greinacher A. Heparin-induced thrombocytopenia and cardiac surgery. Ann Thorac Surg. 2003;76(6):2121-2131.
3. Junqueira DR, Perini E, Penholati RR, Carvalho MG. Unfractionated heparin versus low molecular weight heparin for avoiding heparin-induced thrombocytopenia in postoperative patients. Cochrane Database Syst Rev. 2012;(9):CD007557. PubMed
4. Seigerman M, Cavallaro P, Itagaki S, Chung I, Chikwe J. Incidence and outcomes of heparin-induced thrombocytopenia in patients undergoing cardiac surgery in North America: an analysis of the Nationwide Inpatient Sample. J Cardiothorac Vasc Anesth. 2014;28(1):98-102. PubMed
5. Greinacher A. Heparin-induced thrombocytopenia. N Engl J Med. 2015;373(3):252-261. PubMed
6. Grabowski HG, Guha R, Salgado M. Regulatory and cost barriers are likely to limit biosimilar development and expected savings in the near future. Health Aff (Millwood). 2014;33(6):1048-1057. PubMed
7. Prandoni P, Siragusa S, Girolami B, Fabris F; BELZONI Investigators Group. The incidence of heparin-induced thrombocytopenia in medical patients treated with low-molecular-weight heparin: a prospective cohort study. Blood. 2005;106(9):3049-3054. PubMed
8. Jenkins I, Helmons PJ, Martin-Armstrong LM, Montazeri ME, Renvall M. High rates of venous thromboembolism prophylaxis did not increase the incidence of heparin-induced thrombocytopenia. Jt Comm J Qual Patient Saf. 2011;37(4):163-169. PubMed
9. Zhou A, Winkler A, Emamifar A, et al. Is the incidence of heparin-induced thrombocytopenia affected by the increased use of heparin for VTE prophylaxis? Chest. 2012;142(5):1175-1178. PubMed
10. Warkentin TE, Sheppard JA, Sigouin CS, Kohlmann T, Eichler P, Greinacher A. Gender imbalance and risk factor interactions in heparin-induced thrombocytopenia. Blood. 2006;108(9):2937-2941. PubMed
11. Baroletti S, Piovella C, Fanikos J, Labreche M, Lin J, Goldhaber SZ. Heparin-induced thrombocytopenia (HIT): clinical and economic outcomes. Thromb Haemost. 2008;100(6):1130-1135. PubMed
12. Smythe MA, Koerber JM, Fitzgerald M, Mattson JC. The financial impact of heparin-induced thrombocytopenia. Chest. 2008;134(3):568-573. PubMed
13. Nand S, Wong W, Yuen B, Yetter A, Schmulbach E, Gross Fisher S. Heparin-induced thrombocytopenia with thrombosis: Incidence, analysis of risk factors, and clinical outcomes in 108 consecutive patients treated at a single institution. Am J Hematol. 1997;56(1):12-16. PubMed
14. Hong AP, Cook DJ, Sigouin CS, Warkentin TE. Central venous catheters and upper-extremity deep-vein thrombosis complicating immune heparin-induced thrombocytopenia. Blood. 2003;101(8):3049-3051. PubMed
15. Karnes JH, Cronin RM, Rollin J, et al. A genome-wide association study of heparin-induced thrombocytopenia using an electronic medical record. Thromb Haemost. 2015;113(4):772-781. PubMed
Each year, approximately one-third of all hospitalized medical and surgical patients in the United States (about 12 million patients) are exposed to heparin products for the prevention or treatment of thromboembolism.1 Although generally safe, heparin can trigger an immune response in which platelet factor 4–heparin complexes set off an antibody-mediated cascade that can result in heparin-induced thrombocytopenia (HIT) and paradoxical arterial and venous thromboses, or heparin-induced thrombocytopenia with thrombosis (HITT). The incidence of HIT appears to be significantly higher with the more immunogenic unfractionated heparin (UFH) (2%-3% if treated for ≥5 days) than with low-molecular-weight heparin (LMWH) (0.2%-0.6%)2 and is significantly higher in postoperative patients (1%-5%) than in medical patients.3 Older patients and female patients, especially those who undergo surgery, are thought to be at higher risk.4 Progression from HIT to HITT can occur in up to 50% of surgical patients,5 and HITT can significantly increase mortality.4
In the United States, LMWH use has increased 5-fold since 2000—an increase attributed to the 2010 release of generic enoxaparin.6 As US hospitals switch from UFH to LMWH with its significantly lower risk of HIT, up-to-date HIT incidence data may help physicians and payers better understand the impact of the disorder on mortality and hospital length of stay (LOS) for medical patients and subsets of surgical patients and subsequently direct screening efforts to those at highest risk. Therefore, in the present study, we used national data to determine the latest incidence and economic implications of HIT overall and for high-risk surgical groups.
METHODS
In this study, we analyzed data from the Nationwide Inpatient Sample (NIS) database, part of the Healthcare Cost and Utilization Project (HCUP) of the Agency for Healthcare Research and Quality (AHRQ). The period studied was 2009-2011. We used International Classification of Diseases, Ninth Revision, Clinical Modification (ICD-9-CM) code 289.84, introduced in 2009, to identify patients who were at least 18 years old and had a primary or secondary diagnosis of HIT. Validated Clinical Classifications Software (CCS) was used to identify those who underwent cardiac, vascular, or orthopedic surgery, and ICD-9-CM codes for various thromboses were used to identify those with HITT (Supplemental Figure, Supplemental Table 1). Baseline patient and hospital characteristics were compared using the Pearson’s Chi-square test for categorical variables and the Student t test for continuous variables (2-sided P < 0.05 for statistical significance) (Table 1). We calculated the incidence of HIT overall and for the 3 surgical subgroups and compared the cohorts on their mean hospital LOS, mean hospital charge, and in-hospital mortality (Table 2).
Statistical analysis was performed with Stata Version 13.1 (Stata Corp, College Station, TX). Survey commands were used to account for the complex survey design in NIS. Reading Health System’s Institutional Review Board determined that our study protocol was exempt.
RESULTS
Of 98,636,364 hospitalizations, 72,515 (0.07%) involved HIT. There were no significant differences in the annual incidence of HIT during the study period (0.06% in 2009, 0.05% in 2010, 0.06% in 2011).
Regarding HIT, the death rate was 4-fold higher for patients with the disorder (9.63%) than for those without it (2.19%); hospital LOS and costs were significantly higher, too (Table 2). In addition, in-hospital mortality was higher (P < 0.001) for patients with HITT (12.28%) than for patients with HIT without thrombosis (8.24%); HITT patients’ hospital LOS and costs were higher as well. In patients who had cardiac, vascular, or orthopedic surgery, development of HIT was also associated with significantly higher in-hospital mortality, mean hospital LOS, and mean hospital charge. In patients with HITT, deep vein thrombosis (DVT) and pulmonary embolism represented the majority of reported cases (Supplemental Table 2). However, in patients who had cardiac surgery, acute arterial thromboses of coronary and cerebral vessels were more common.
DISCUSSION
In this national database survey, the overall incidence of HIT during the study period 2009-2011 was 0.07%, or 1 in 1350 hospitalized patients. Although earlier studies reported rates as high as 5% for high-risk subgroups of surgical patients,7 our data are more in line with more recently reported rates: about 0.02% for hospital admissions8 and from less than 0.1% to 0.4% for patients who received heparin.9 Older studies, which predominantly involved postoperative patients and were conducted when UFH often was the first-line heparin product used, may account for higher rates relative to ours. Of the 3 types of surgeries we evaluated, cardiac surgery had the highest HIT rate (0.5%), consistent with other studies.4 The higher HIT/HITT rates found for larger urban hospitals in our study might be attributable to increased awareness and testing, availability of hematology consultation, and higher risk of heparin use in this setting, where patients are sicker and cases and procedures more complicated.
Age was an important determinant of HIT risk in our study and in similar large-database series.4 Whether increased UFH use in the elderly (because of age or kidney disease) was a causative factor in this finding is unknown. In our study, although men and women had a nearly equal incidence of HIT, women had a significantly higher risk of HIT after both cardiac surgery and vascular surgery. Immune-mediated mechanisms that are more common in females may play a causative role in these settings.10
Our study results showed HIT associated with increased hospital LOS and an almost 4-fold increase in inpatient mortality and costs. The increased economic burden in HIT cases may be driven by the diagnostic work-up cost and expensive alternative anticoagulation.11,12 Similarly, compared with HIT without thrombosis, HITT was associated with significantly increased hospital LOS (3.7 days), total hospital charge ($64,279) and mortality (49% increase, to 12.2% from 8.2%), consistent with prior studies.13 In addition, 34.1% (24,704) of our HIT patients developed at least 1 thrombotic complication, with venous thromboses more common than arterial thromboses, as previously reported.13 Lower extremity DVT was the most common thrombosis in orthopedic and vascular surgery. However, in cardiac surgery, acute coronary occlusion was the most common thrombotic complication. We postulate that the difference stems from the increased propensity of HIT-related thrombosis to occur in areas of vascular injury.14
The strengths of our study include its large size, which increases the generalizability of its results and avoids the biases inherent in small, single-center studies. As with any administrative dataset, the NIS may include coding errors related to underdiagnosis and overdiagnosis (eg, a HIT/HITT diagnosis carried forward from prior episodes). In our study, we inferred the HITT diagnosis in HIT cases with a vascular complication, but we could have missed HIT cases that had not been coded for vascular complications, and we could have overassociated vascular complications that had predated HIT and been treated with heparin. Although HIT and HITT were associated with worse clinical outcomes and increased hospital LOS, it is possible patients who were hospitalized longer had more opportunities for heparin use, and this exposure led to HIT or HITT. The lack of details regarding prior heparin use, including type of heparin (UFH or LMWH), prevented us from inferring the actual risks of individual heparin products.
In conclusion, in cardiac, vascular, and orthopedic surgery, HIT and especially HITT can significantly increase hospital LOS, inpatient costs, and mortality. Lower extremity DVT and acute coronary artery occlusion are the most common thrombotic complications in these cases. HIT screening strategies that incorporate platelet counts are recommended only in patients at highest risk (>1%), according to the most recent American College of Chest Physicians guidelines, but this recommendation was made on the basis of the high cost of alternative anticoagulants. Given our more recent data regarding the very high costs of HIT and especially HITT, screening strategies with platelet counts may prove more cost-effective. Recent genome-wide studies that found higher rates of HIT in patients with T-cell death–associated gene 8 (TDAG8) may help explain sex differences in postoperative patients and identify patients at highest risk so alternative anticoagulants can be used.15
Disclosures
This study was funded by the Reading Health System (grant RHS0010). Dr. Bhatt is supported by the Physician-Scientist Training Program (grant 2015-2016), College of Medicine, University of Nebraska Medical Center. The other authors report no financial conflicts of interest.
1. Fahey VA. Heparin-induced thrombocytopenia. J Vasc Nurs. 1995;13(4):112-116. PubMed
2. TE, Greinacher A. Heparin-induced thrombocytopenia and cardiac surgery. Ann Thorac Surg. 2003;76(6):2121-2131.
3. Junqueira DR, Perini E, Penholati RR, Carvalho MG. Unfractionated heparin versus low molecular weight heparin for avoiding heparin-induced thrombocytopenia in postoperative patients. Cochrane Database Syst Rev. 2012;(9):CD007557. PubMed
4. Seigerman M, Cavallaro P, Itagaki S, Chung I, Chikwe J. Incidence and outcomes of heparin-induced thrombocytopenia in patients undergoing cardiac surgery in North America: an analysis of the Nationwide Inpatient Sample. J Cardiothorac Vasc Anesth. 2014;28(1):98-102. PubMed
5. Greinacher A. Heparin-induced thrombocytopenia. N Engl J Med. 2015;373(3):252-261. PubMed
6. Grabowski HG, Guha R, Salgado M. Regulatory and cost barriers are likely to limit biosimilar development and expected savings in the near future. Health Aff (Millwood). 2014;33(6):1048-1057. PubMed
7. Prandoni P, Siragusa S, Girolami B, Fabris F; BELZONI Investigators Group. The incidence of heparin-induced thrombocytopenia in medical patients treated with low-molecular-weight heparin: a prospective cohort study. Blood. 2005;106(9):3049-3054. PubMed
8. Jenkins I, Helmons PJ, Martin-Armstrong LM, Montazeri ME, Renvall M. High rates of venous thromboembolism prophylaxis did not increase the incidence of heparin-induced thrombocytopenia. Jt Comm J Qual Patient Saf. 2011;37(4):163-169. PubMed
9. Zhou A, Winkler A, Emamifar A, et al. Is the incidence of heparin-induced thrombocytopenia affected by the increased use of heparin for VTE prophylaxis? Chest. 2012;142(5):1175-1178. PubMed
10. Warkentin TE, Sheppard JA, Sigouin CS, Kohlmann T, Eichler P, Greinacher A. Gender imbalance and risk factor interactions in heparin-induced thrombocytopenia. Blood. 2006;108(9):2937-2941. PubMed
11. Baroletti S, Piovella C, Fanikos J, Labreche M, Lin J, Goldhaber SZ. Heparin-induced thrombocytopenia (HIT): clinical and economic outcomes. Thromb Haemost. 2008;100(6):1130-1135. PubMed
12. Smythe MA, Koerber JM, Fitzgerald M, Mattson JC. The financial impact of heparin-induced thrombocytopenia. Chest. 2008;134(3):568-573. PubMed
13. Nand S, Wong W, Yuen B, Yetter A, Schmulbach E, Gross Fisher S. Heparin-induced thrombocytopenia with thrombosis: Incidence, analysis of risk factors, and clinical outcomes in 108 consecutive patients treated at a single institution. Am J Hematol. 1997;56(1):12-16. PubMed
14. Hong AP, Cook DJ, Sigouin CS, Warkentin TE. Central venous catheters and upper-extremity deep-vein thrombosis complicating immune heparin-induced thrombocytopenia. Blood. 2003;101(8):3049-3051. PubMed
15. Karnes JH, Cronin RM, Rollin J, et al. A genome-wide association study of heparin-induced thrombocytopenia using an electronic medical record. Thromb Haemost. 2015;113(4):772-781. PubMed
© 2017 Society of Hospital Medicine
Trends in Blood‐Product Transfusion
Although potentially life saving, blood‐product transfusion is costly and associated with transfusion‐related adverse events, including death on rare occasions. Studies in varied patient populations have demonstrated that a restrictive red blood cell transfusion strategy reduces the number of transfusion‐related adverse effects and can result in improved short‐term survival.[1, 2, 3] In 2011, more than 20 million blood products were transfused in the United States, which resulted in more than 50,000 transfusion‐related adverse reactions (0.24%).[4] With a mean cost of greater than $50 per unit of plasma and $500 per unit of apheresis platelets,[4] the cost of blood transfusion is well in excess of $1 billion per year. Blood‐product transfusion is the most frequent inpatient procedure,[5] and inpatient blood‐product transfusion contributes to the bulk of transfusions nationwide. To study the utilization of blood‐product transfusion in the inpatient population, we studied the temporal trend of inpatient blood‐product transfusions in the United States from 2002 to 2011 using data from the Nationwide Inpatient Sample (NIS), Healthcare Cost and Utilization Project, Agency for Healthcare Research and Quality.[4] The NIS, the largest inpatient care database in the United States, includes approximately a 20% stratified sample of US community hospital admissions and is weighted at discharge level to permit population‐level estimates.[6] We utilized this database to identify the total number of blood‐product transfusions and discharges between 2002 and 2011. We calculated the rate of all blood‐product transfusions, which include packed red blood cell, platelets, and other blood components, using the International Classification of DiseasesNinth Revision, Clinical Modification Procedural Clinical Classification Software code 222.[7] Trend analysis and calculation of average annual percent change were done using the Joinpoint Regression Program version 4.0.4 (National Cancer Institute, Bethesda, MD).[8] This software uses trend data and calculates the best fit lines to create the simplest joinpoint model that the data allow. The model can be expressed as a figure where several different multisegmented trend lines are connected together at the joinpoints. Trend over a fixed prespecified interval was computed as average annual percent change, and the Monte Carlo permutation method was used to test for apparent change in the trends.[9, 10] The study was exempted by the institutional review board of the University of Nebraska Medical Center.
Between 2002 and 2011, there were a total of 24,641,581 blood‐product transfusions among 389,761,571 hospitalizations. The rate of transfusion per 100 hospitalizations increased by 2.9% from 2002 to 2011 (4.6% in 2002 [n=1,767,111] to 7.5% in 2011 [n=2,929,312]) (Figure 1). The average annual percent change from 2002 to 2011 was 5.6% (95% confidence interval [CI]: 3.7‐7.6), which was statistically significant at P<0.05. A statistically significant change in trend (joinpoint) was observed in 2004. The annual percent change was 11.2% (95% CI: 0.323.4) from 2002 to 2004 and 4.1% (95% CI: 3.05.1) from 2004 to 2011, both of which were statistically significant at P<0.05 (Figure 2).
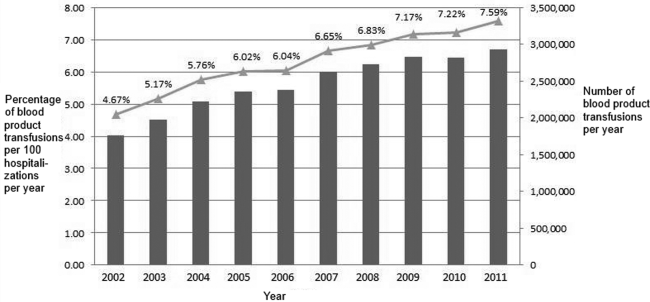
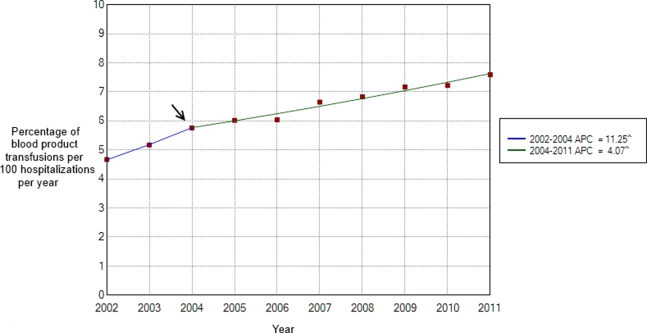
Our study demonstrates an overall increasing trend in the inpatient blood‐product transfusions over the past decade. However, the rate of increase seems to have slowed down since 2004. The National Blood Collection and Utilization Survey[4] demonstrated a decrease of 11.6% in the total number of all components transfused in the United States between 2008 and 2011. Our data are different from the survey, which also included blood transfusions in outpatient settings, emergency departments, and pediatric patients. The rising proportion of aging population with multiple comorbidities and cancers, increases in hematopoietic stem cell/solid organ transplants and chemotherapy, as well as widespread availability of blood products presumably contributed to the continued increase observed in our inpatient data after 2004. Nevertheless, the declining trend in the rate of the increased blood‐product transfusion usage seen after 2004 is encouraging. Increased awareness of restrictive transfusion strategy, coupled with efforts by professional bodies to improve the adoption of restrictive strategies, is most likely responsible for this.[3, 11, 12] As the clinical classification software procedure code 222 lumps together all the different types of blood products, we were unable to study the transfusion trend among each different type of blood products. In conclusion, further efforts need to be directed at increasing the awareness of clinicians, especially hospitalists, about the benefits of a restrictive transfusion policy and decreasing the rate of blood product use in the inpatient service. Furthermore, studies elaborating the patient population who are being transfused and the factors influencing the transfusion trends can provide useful insights to optimize blood‐product utilization and control resource consumption.
Disclosure
Nothing to report.
- , , . Outcomes using lower vs higher hemoglobin thresholds for red blood cell transfusion. JAMA. 2013;309(1):83–84.
- , , , et al. Transfusion strategies for acute upper gastrointestinal bleeding. N Engl J Med. 2013;368(1):11–21.
- , , , . Evidence review: periprocedural use of blood products. J Hosp Med. 2013;8(11):647–652.
- The 2011 National Blood Collection and Utilization Survey Report. Washington, DC: U.S. Department of Health and Human Services, Office of the Assistant Secretary for Health; 2013.
- , , , et al. HCUP facts and figures: statistics on hospital‐based care in the United States. 2009. Agency for Healthcare Research and Quality, Rockville, MD. Available at: http://www.hcup‐us.ahrq.gov/reports.jsp. Accessed January 2, 2014.
- HCUP Nationwide Inpatient Sample (NIS). Healthcare Cost and Utilization Project. 2009–2011. Agency for Healthcare Research and Quality, Rockville, MD. Available at: www.hcup‐us.ahrq.gov/nisoverview.jsp. Accessed December 15, 2013.
- HCUP Clinical Classifications Software (CCS) for ICD‐9‐CM. Healthcare Cost and Utilization Project. 2009–2011. Agency for Healthcare Research and Quality, Rockville, MD. Available at: www.hcup‐us.ahrq.gov/toolssoftware/ccs/ccs.jsp. Accessed December 15, 2013.
- Joinpoint Regression Program, Version 4.0.4, December, 2014. Statistical Methodology and Applications Branch, Surveillance Research Program, National Cancer Institute. Available at: https://surveillance.cancer.gov/joinpoint/download. Accessed December 25, 2013.
- , , , , . Estimating average annual per cent change in trend analysis. Stat Med. 2009;28(29):3670–3682.
- , , , . Permutation tests for joinpoint regression with applications to cancer rates. Stat Med. 2000;19(3):335–351.
- , , , et al. Choosing wisely in adult hospital medicine: five opportunities for improved healthcare value. J Hosp Med. 2013;8(9):486–492.
- , , , . Patient‐centered blood management. J Hosp Med. 2014;9(1):60–65.
Although potentially life saving, blood‐product transfusion is costly and associated with transfusion‐related adverse events, including death on rare occasions. Studies in varied patient populations have demonstrated that a restrictive red blood cell transfusion strategy reduces the number of transfusion‐related adverse effects and can result in improved short‐term survival.[1, 2, 3] In 2011, more than 20 million blood products were transfused in the United States, which resulted in more than 50,000 transfusion‐related adverse reactions (0.24%).[4] With a mean cost of greater than $50 per unit of plasma and $500 per unit of apheresis platelets,[4] the cost of blood transfusion is well in excess of $1 billion per year. Blood‐product transfusion is the most frequent inpatient procedure,[5] and inpatient blood‐product transfusion contributes to the bulk of transfusions nationwide. To study the utilization of blood‐product transfusion in the inpatient population, we studied the temporal trend of inpatient blood‐product transfusions in the United States from 2002 to 2011 using data from the Nationwide Inpatient Sample (NIS), Healthcare Cost and Utilization Project, Agency for Healthcare Research and Quality.[4] The NIS, the largest inpatient care database in the United States, includes approximately a 20% stratified sample of US community hospital admissions and is weighted at discharge level to permit population‐level estimates.[6] We utilized this database to identify the total number of blood‐product transfusions and discharges between 2002 and 2011. We calculated the rate of all blood‐product transfusions, which include packed red blood cell, platelets, and other blood components, using the International Classification of DiseasesNinth Revision, Clinical Modification Procedural Clinical Classification Software code 222.[7] Trend analysis and calculation of average annual percent change were done using the Joinpoint Regression Program version 4.0.4 (National Cancer Institute, Bethesda, MD).[8] This software uses trend data and calculates the best fit lines to create the simplest joinpoint model that the data allow. The model can be expressed as a figure where several different multisegmented trend lines are connected together at the joinpoints. Trend over a fixed prespecified interval was computed as average annual percent change, and the Monte Carlo permutation method was used to test for apparent change in the trends.[9, 10] The study was exempted by the institutional review board of the University of Nebraska Medical Center.
Between 2002 and 2011, there were a total of 24,641,581 blood‐product transfusions among 389,761,571 hospitalizations. The rate of transfusion per 100 hospitalizations increased by 2.9% from 2002 to 2011 (4.6% in 2002 [n=1,767,111] to 7.5% in 2011 [n=2,929,312]) (Figure 1). The average annual percent change from 2002 to 2011 was 5.6% (95% confidence interval [CI]: 3.7‐7.6), which was statistically significant at P<0.05. A statistically significant change in trend (joinpoint) was observed in 2004. The annual percent change was 11.2% (95% CI: 0.323.4) from 2002 to 2004 and 4.1% (95% CI: 3.05.1) from 2004 to 2011, both of which were statistically significant at P<0.05 (Figure 2).
Our study demonstrates an overall increasing trend in the inpatient blood‐product transfusions over the past decade. However, the rate of increase seems to have slowed down since 2004. The National Blood Collection and Utilization Survey[4] demonstrated a decrease of 11.6% in the total number of all components transfused in the United States between 2008 and 2011. Our data are different from the survey, which also included blood transfusions in outpatient settings, emergency departments, and pediatric patients. The rising proportion of aging population with multiple comorbidities and cancers, increases in hematopoietic stem cell/solid organ transplants and chemotherapy, as well as widespread availability of blood products presumably contributed to the continued increase observed in our inpatient data after 2004. Nevertheless, the declining trend in the rate of the increased blood‐product transfusion usage seen after 2004 is encouraging. Increased awareness of restrictive transfusion strategy, coupled with efforts by professional bodies to improve the adoption of restrictive strategies, is most likely responsible for this.[3, 11, 12] As the clinical classification software procedure code 222 lumps together all the different types of blood products, we were unable to study the transfusion trend among each different type of blood products. In conclusion, further efforts need to be directed at increasing the awareness of clinicians, especially hospitalists, about the benefits of a restrictive transfusion policy and decreasing the rate of blood product use in the inpatient service. Furthermore, studies elaborating the patient population who are being transfused and the factors influencing the transfusion trends can provide useful insights to optimize blood‐product utilization and control resource consumption.
Disclosure
Nothing to report.
- , , . Outcomes using lower vs higher hemoglobin thresholds for red blood cell transfusion. JAMA. 2013;309(1):83–84.
- , , , et al. Transfusion strategies for acute upper gastrointestinal bleeding. N Engl J Med. 2013;368(1):11–21.
- , , , . Evidence review: periprocedural use of blood products. J Hosp Med. 2013;8(11):647–652.
- The 2011 National Blood Collection and Utilization Survey Report. Washington, DC: U.S. Department of Health and Human Services, Office of the Assistant Secretary for Health; 2013.
- , , , et al. HCUP facts and figures: statistics on hospital‐based care in the United States. 2009. Agency for Healthcare Research and Quality, Rockville, MD. Available at: http://www.hcup‐us.ahrq.gov/reports.jsp. Accessed January 2, 2014.
- HCUP Nationwide Inpatient Sample (NIS). Healthcare Cost and Utilization Project. 2009–2011. Agency for Healthcare Research and Quality, Rockville, MD. Available at: www.hcup‐us.ahrq.gov/nisoverview.jsp. Accessed December 15, 2013.
- HCUP Clinical Classifications Software (CCS) for ICD‐9‐CM. Healthcare Cost and Utilization Project. 2009–2011. Agency for Healthcare Research and Quality, Rockville, MD. Available at: www.hcup‐us.ahrq.gov/toolssoftware/ccs/ccs.jsp. Accessed December 15, 2013.
- Joinpoint Regression Program, Version 4.0.4, December, 2014. Statistical Methodology and Applications Branch, Surveillance Research Program, National Cancer Institute. Available at: https://surveillance.cancer.gov/joinpoint/download. Accessed December 25, 2013.
- , , , , . Estimating average annual per cent change in trend analysis. Stat Med. 2009;28(29):3670–3682.
- , , , . Permutation tests for joinpoint regression with applications to cancer rates. Stat Med. 2000;19(3):335–351.
- , , , et al. Choosing wisely in adult hospital medicine: five opportunities for improved healthcare value. J Hosp Med. 2013;8(9):486–492.
- , , , . Patient‐centered blood management. J Hosp Med. 2014;9(1):60–65.
