User login
Reimbursement for hospitals and physicians is increasingly tied to performance.1 Bundled payments, for example, require hospitals to share risk for patient outcomes. Medicare bundled payments are becoming mandatory for some surgical and medical conditions, including joint replacement, acute myocardial infarction, and coronary artery bypass graft surgery.2 Value-based payment is anticipated to become the norm as Medicare and private payers strive to control costs and improve outcomes. Although value-based reimbursement for hospitals targets hospital-level costs and outcomes, we know that variations at the level of individual providers explain a considerable proportion of variation in utilization and outcomes.3 However, physicians often lack awareness of their own practice patterns and relative costs, and successful participation in new payment models may require an investment by hospitals in the infrastructure needed to measure and provide feedback on performance to individual providers to affect their behavior.4,5
Electronic health record (EHR)-based reports or “dashboards” have been proposed as one potential tool to provide individualized feedback on provider performance.6 Individual provider performance profiles (IPPs) offer the potential to provide peer comparisons that may adjust individual behavior by correcting misperceptions about norms.7 Behavioral economic theory suggests that individual performance data, if combined with information on peer behavior and normative goals, may be effective in changing behavior.8 Several studies have reported the effects of specific efforts to use IPPs, showing that such reports can improve care in certain clinical areas. For example, individual provider dashboards have been associated with better outcomes for hospitalized patients, such as increased compliance with recommendations for prophylaxis of venous thromboembolism, although evidence in other areas of practice is mixed.9,10 A randomized controlled trial of peer comparison feedback reduced inappropriate antibiotic prescribing for upper respiratory infections by 11% among internists.11
Despite the promise of individualized feedback to optimize behavior, however, little has been reported on trends in the use of IPPs on a population level. It is unknown whether their use is common or rare, or what hospital characteristics are associated with adoption. Such information would help guide future efforts to promote IPP use and understand its effect on practice. We used data from a nationally representative survey of US hospitals to examine the use of individual provider-level performance profiles.
METHODS
We used data from the American Hospital Association (AHA) Annual Survey Information Technology (IT) Supplement, which asked respondents to indicate whether they have used electronic clinical data from the EHR or other electronic system in their hospital to create IPPs. The AHA survey is sent annually to all US operating hospitals. Survey results are supplemented by data from the AHA registration database, US Census Bureau, hospital accrediting bodies, and other organizations. The AHA IT supplement is also sent yearly to each hospital’s chief executive officer, who assigns it to the most knowledgeable person in the institution to complete.12
We linked data on IPP use to AHA Annual Survey responses on hospital characteristics for all general adult and pediatric hospitals. Multivariable logistic regression was used to model the odds of individual provider performance profile use as a function of hospital characteristics, including ownership (nonprofit, for profit, or government), geographic region, teaching versus nonteaching status, rural versus urban location, size, expenditures per bed, proportion of patient days covered by Medicaid, and risk-sharing models of reimbursement (participation in a health maintenance organization or bundled payments program). Variables were chosen a priori to account for important characteristics of US hospitals (eg, size, teaching status, and geographic location). These were combined with variables representing risk-sharing arrangements based on the hypothesis that hospitals whose payments are at greater risk would be more likely to invest in tracking provider performance. We eliminated any variable with an item nonresponse rate greater than 15%, which resulted in elimination of 2 variables representing hospital revenue from capitated payments and any risk-sharing arrangement, respectively. All other variables had item nonresponse rates of 0%, except for 4.7% item nonresponse for the bundled payments variable.
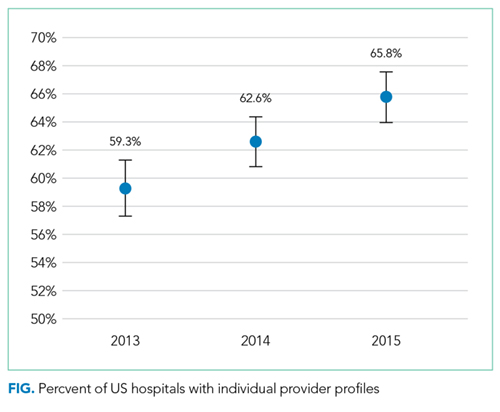
We also measured the trend in individual provider performance report use between 2013 and 2015 by estimating the linear probability between IPP use and year. A P value less than .05 was considered statistically significant.
Because past work has demonstrated nonresponse bias in the AHA Survey and IT Supplement, we performed additional analyses using nonresponsive weights based on hospital characteristics. Weighting methodology was based on prior work with the AHA and AHA IT surveys.13,14 Weighting exploits the fact that a number of hospital characteristics are derived from sources outside the survey and thus are available for both respondents and nonrespondents. We created nonresponse weights based on a logistic regression model of survey response as a function of hospital characteristics (ownership, size, teaching status, systems membership, critical access hospital, and geographic region). Our findings were similar for weighted and nonweighted models and nonweighted estimates are presented throughout.
The University of Pennsylvania Institutional Review Board exempted this study from review. Analyses were performed using Stata statistical software, version 14.0 (StataCorp, College Station, TX).
RESULTS
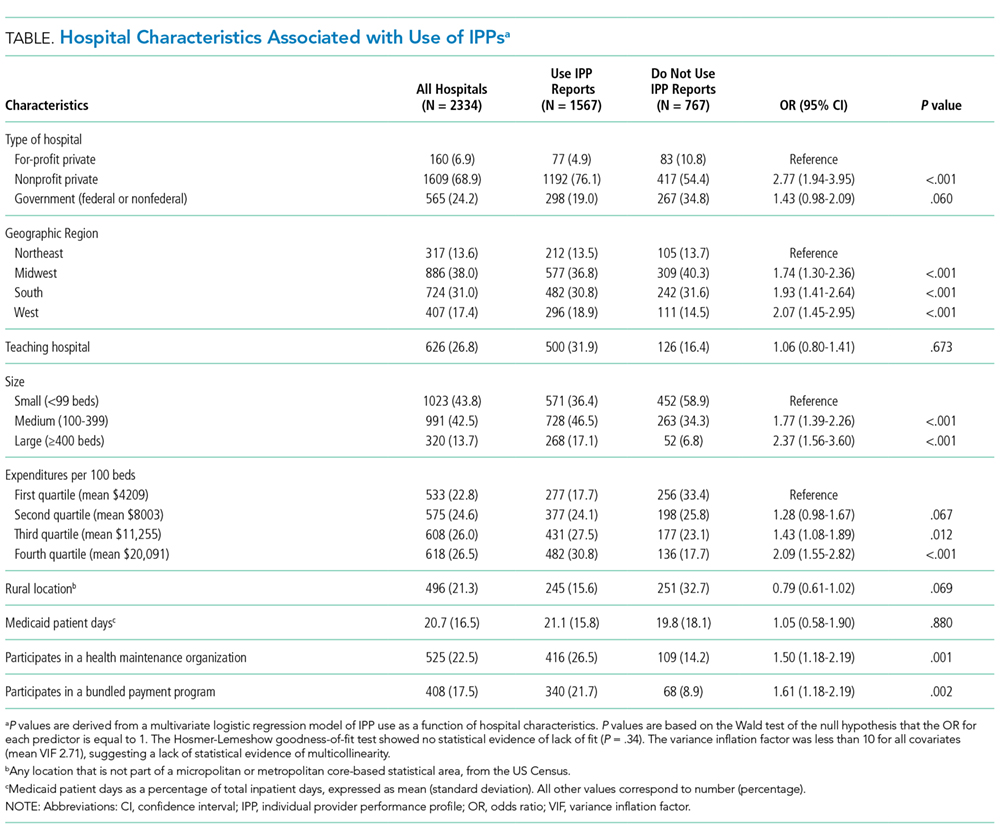
The table shows the association between hospital characteristics and the odds of individual provider performance report use. Report use was associated with nonprofit status (odds ratio [OR], 2.77; 95% confidence interval [CI], 1.94-3.95; P < .01) compared to for-profit, large hospital size (OR, 2.37; 95% CI, 1.56-3.60; P < .01) compared to small size, highest (OR, 2.09; 95% CI, 1.55-2.82; P < .01) and second highest (OR, 1.43; 95% CI, 1.08-1.89; P = .01) quartiles of bed-adjusted expenditures compared to the bottom quartile, and West geographic region compared to Northeast (OR, 2.07; 95% CI, 1.45-2.95; P < .01). Individual provider performance use was also independently associated with participation in a health maintenance organization (OR, 1.50; 95% CI, 1.17-1.90; P < .01) or bundled payment program (OR, 1.61; 95% CI, 1.18-2.19; P < .01), controlling for other covariates. Adjustment for nonresponse bias did not change any coefficients by more than 10% (supplementary Table).
DISCUSSION
The Medicare Access and Children Health Insurance Program Reauthorization Act is accelerating the shift from quantity based toward value-based reimbursement. The proficient adoption of IT by healthcare providers has been cited as an important factor in adapting to new payment models.15 Physicians, and in particular hospitalists, who practice in an inpatient environment, may not directly access financial incentives aimed to adapt performance for value-based reimbursement. They may also have difficulty assessing their performance relative to peers and longitudinally over time. Individualized EHR-based provider-level performance reports offer 1 option for hospitals to measure performance and provide comparative feedback at the individual physician level. Our findings show that, in fact, a majority of US hospitals have made investments in the infrastructure necessary to create such profiles.
Nevertheless, a third of the hospitals surveyed have not adopted individualized provider performance profiles. If meeting efficiency and outcomes goals for value-based payments necessitates changes to individual provider behavior, those hospitals may be less well positioned to benefit from value-based payment models that incentivize hospitals for efficiency and outcomes. Furthermore, while we observe widespread adoption of individual performance profiles, it is unclear whether those were used to provide feedback to providers, and if so, how the feedback provided may influence its effect on behavior. Behavioral economics theory suggests, for example, that publicly reporting performance compared to peers provides stronger incentives for behavior change than “blinded” personalized reports.16
Our study has important limitations. We cannot exclude the possibility that unmeasured variables help explain individual provider performance adoption. These omitted variables may confound the association between hospital characteristics and individual provider performance adoption observed in this study. We were also unable to establish causality between bundled payments and individual provider performance profile use. For instance, hospitals may elect to make investments in IT infrastructure to enable individual provider performance profile adoption in anticipation of bundled payment reforms. Alternatively, the availability of IPPs may have led hospitals to enter bundled payments reimbursement arrangements. In addition, we are unable to describe how individual provider performance use affects physician practice or healthcare delivery more broadly. Finally, we are also unable to account for other sources of performance data. For example, some physician may receive data from their physician practice groups.
Our study suggests several avenues for future research. First, more work is needed to understand why certain types of hospitals are more likely to use IPPs. Our findings indicate that IPP use may be partly a function of hospital size and resources. However, other factors not measured here may play an important role as well, such as institutional culture. Institutions with a focus on informatics and strong IT leadership may be more likely to use their EHR to monitor performance. Second, further research should explore in greater depth how profiles are used. Future research should evaluate, for example, how hospitals are using behavioral economic principles, such as peer comparison, to motivate behavior change, and if such techniques have successfully influenced practice and patient outcomes. Ultimately, multicentered, randomized evaluations of IPP use may be necessary to understand their risks and evaluate their effect on patient outcomes. This work is necessary to inform policy and practice as hospitals transition from fee-for-service to value-based reimbursement.
In sum, we observed increasing adoption of individualized electronic provider performance profiles by US hospitals from 2013 to 2015. Hospitals that did not use IPPs were more likely to be small, for profit, and less likely to participate in bundled payment programs. Those hospitals may be less well positioned to track provider performance and implement incentives for provider behavior changes needed to meet targets for value-based reimbursement.
Disclosure
Dr. Rolnick is a consultant to Tuple Health, Inc. and was a part-time employee of Acumen, LLC outside the submitted work. Dr. Ryskina has nothing to disclose.
1. Hussey PS, Liu JL, White C. The Medicare Access And CHIP Reauthorization Act: effects On Medicare payment policy and spending. Health Aff. 2017;36(4):697-705. PubMed
2. Navathe AS, Song Z, Emanuel EJ. The next generation of episode-based payments. JAMA. 2017;317(23):2371-2372. PubMed
3. Tsugawa Y, Jha AK, Newhouse JP, Zaslavsky AM, Jena AB. Variation in physician spending and association with patient outcomes. JAMA Intern Med. 2017;177(5):675-682. PubMed
4. Saint S, Wiese J, Amory JK, et al. Are physicians aware of which of their patients have indwelling urinary catheters? Am J Med. 2000;109(6):476-480. PubMed
5. Saturno PJ, Palmer RH, Gascón JJ. Physician attitudes, self-estimated performance and actual compliance with locally peer-defined quality evaluation criteria. Int J Qual Health Care J Int Soc Qual Health Care. 1999;11(6):487-496. PubMed
6. Mehrotra A, Sorbero MES, Damberg CL. Using the lessons of behavioral economics to design more effective pay-for-performance programs. Am J Manag Care. 2010;16(7):497-503. PubMed
7. Emanuel EJ, Ubel PA, Kessler JB, et al. Using behavioral economics to design physician Incentives that deliver high-value care. Ann Intern Med. 2016;164(2):114-119. PubMed
8. Liao JM, Fleisher LA, Navathe AS. Increasing the value of social comparisons of physician performance using norms. JAMA. 2016;316(11):1151-1152. PubMed
9. Michtalik HJ, Carolan HT, Haut ER, et al. Use of provider-level dashboards and pay-for-performance in venous thromboembolism prophylaxis. J Hosp Med. 2015;10(3):172-178. PubMed
10. Kurtzman G, Dine J, Epstein A, et al. Internal medicine resident engagement with a laboratory utilization dashboard: mixed methods study. J Hosp Med. 12(9):743-746. PubMed
11. Linder JA, Schnipper JL, Tsurikova R, et al. Electronic health record feedback to improve antibiotic prescribing for acute respiratory infections. Am J Manag Care. 2010;16 (12 Suppl HIT):e311-e319. PubMed
12. Jha AK, DesRoches CM, Campbell EG, et al. Use of electronic health records in U.S. hospitals. N Engl J Med. 2009;360(16):1628-1638. PubMed
13. Walker DM, Mora AM, Scheck McAlearney A. Accountable care organization hospitals differ in health IT capabilities. Am J Manag Care. 2016;22(12):802-807. PubMed
14. Adler-Milstein J, DesRoches CM, Furukawa MF, et al. More than half of US hospitals have at least a basic EHR, but stage 2 criteria remain challenging for most. Health Aff 2014;33(9):1664-1671. PubMed
15. Porter ME. A strategy for health care reform—toward a value-based system. N Engl J Med. 2009;361(2):109-112. PubMed
16. Navathe AS, Emanuel EJ. Physician peer comparisons as a nonfinancial strategy to improve the value of care. JAMA. 2016;316(17):1759-1760. PubMed
Reimbursement for hospitals and physicians is increasingly tied to performance.1 Bundled payments, for example, require hospitals to share risk for patient outcomes. Medicare bundled payments are becoming mandatory for some surgical and medical conditions, including joint replacement, acute myocardial infarction, and coronary artery bypass graft surgery.2 Value-based payment is anticipated to become the norm as Medicare and private payers strive to control costs and improve outcomes. Although value-based reimbursement for hospitals targets hospital-level costs and outcomes, we know that variations at the level of individual providers explain a considerable proportion of variation in utilization and outcomes.3 However, physicians often lack awareness of their own practice patterns and relative costs, and successful participation in new payment models may require an investment by hospitals in the infrastructure needed to measure and provide feedback on performance to individual providers to affect their behavior.4,5
Electronic health record (EHR)-based reports or “dashboards” have been proposed as one potential tool to provide individualized feedback on provider performance.6 Individual provider performance profiles (IPPs) offer the potential to provide peer comparisons that may adjust individual behavior by correcting misperceptions about norms.7 Behavioral economic theory suggests that individual performance data, if combined with information on peer behavior and normative goals, may be effective in changing behavior.8 Several studies have reported the effects of specific efforts to use IPPs, showing that such reports can improve care in certain clinical areas. For example, individual provider dashboards have been associated with better outcomes for hospitalized patients, such as increased compliance with recommendations for prophylaxis of venous thromboembolism, although evidence in other areas of practice is mixed.9,10 A randomized controlled trial of peer comparison feedback reduced inappropriate antibiotic prescribing for upper respiratory infections by 11% among internists.11
Despite the promise of individualized feedback to optimize behavior, however, little has been reported on trends in the use of IPPs on a population level. It is unknown whether their use is common or rare, or what hospital characteristics are associated with adoption. Such information would help guide future efforts to promote IPP use and understand its effect on practice. We used data from a nationally representative survey of US hospitals to examine the use of individual provider-level performance profiles.
METHODS
We used data from the American Hospital Association (AHA) Annual Survey Information Technology (IT) Supplement, which asked respondents to indicate whether they have used electronic clinical data from the EHR or other electronic system in their hospital to create IPPs. The AHA survey is sent annually to all US operating hospitals. Survey results are supplemented by data from the AHA registration database, US Census Bureau, hospital accrediting bodies, and other organizations. The AHA IT supplement is also sent yearly to each hospital’s chief executive officer, who assigns it to the most knowledgeable person in the institution to complete.12
We linked data on IPP use to AHA Annual Survey responses on hospital characteristics for all general adult and pediatric hospitals. Multivariable logistic regression was used to model the odds of individual provider performance profile use as a function of hospital characteristics, including ownership (nonprofit, for profit, or government), geographic region, teaching versus nonteaching status, rural versus urban location, size, expenditures per bed, proportion of patient days covered by Medicaid, and risk-sharing models of reimbursement (participation in a health maintenance organization or bundled payments program). Variables were chosen a priori to account for important characteristics of US hospitals (eg, size, teaching status, and geographic location). These were combined with variables representing risk-sharing arrangements based on the hypothesis that hospitals whose payments are at greater risk would be more likely to invest in tracking provider performance. We eliminated any variable with an item nonresponse rate greater than 15%, which resulted in elimination of 2 variables representing hospital revenue from capitated payments and any risk-sharing arrangement, respectively. All other variables had item nonresponse rates of 0%, except for 4.7% item nonresponse for the bundled payments variable.
We also measured the trend in individual provider performance report use between 2013 and 2015 by estimating the linear probability between IPP use and year. A P value less than .05 was considered statistically significant.
Because past work has demonstrated nonresponse bias in the AHA Survey and IT Supplement, we performed additional analyses using nonresponsive weights based on hospital characteristics. Weighting methodology was based on prior work with the AHA and AHA IT surveys.13,14 Weighting exploits the fact that a number of hospital characteristics are derived from sources outside the survey and thus are available for both respondents and nonrespondents. We created nonresponse weights based on a logistic regression model of survey response as a function of hospital characteristics (ownership, size, teaching status, systems membership, critical access hospital, and geographic region). Our findings were similar for weighted and nonweighted models and nonweighted estimates are presented throughout.
The University of Pennsylvania Institutional Review Board exempted this study from review. Analyses were performed using Stata statistical software, version 14.0 (StataCorp, College Station, TX).
RESULTS
The table shows the association between hospital characteristics and the odds of individual provider performance report use. Report use was associated with nonprofit status (odds ratio [OR], 2.77; 95% confidence interval [CI], 1.94-3.95; P < .01) compared to for-profit, large hospital size (OR, 2.37; 95% CI, 1.56-3.60; P < .01) compared to small size, highest (OR, 2.09; 95% CI, 1.55-2.82; P < .01) and second highest (OR, 1.43; 95% CI, 1.08-1.89; P = .01) quartiles of bed-adjusted expenditures compared to the bottom quartile, and West geographic region compared to Northeast (OR, 2.07; 95% CI, 1.45-2.95; P < .01). Individual provider performance use was also independently associated with participation in a health maintenance organization (OR, 1.50; 95% CI, 1.17-1.90; P < .01) or bundled payment program (OR, 1.61; 95% CI, 1.18-2.19; P < .01), controlling for other covariates. Adjustment for nonresponse bias did not change any coefficients by more than 10% (supplementary Table).
DISCUSSION
The Medicare Access and Children Health Insurance Program Reauthorization Act is accelerating the shift from quantity based toward value-based reimbursement. The proficient adoption of IT by healthcare providers has been cited as an important factor in adapting to new payment models.15 Physicians, and in particular hospitalists, who practice in an inpatient environment, may not directly access financial incentives aimed to adapt performance for value-based reimbursement. They may also have difficulty assessing their performance relative to peers and longitudinally over time. Individualized EHR-based provider-level performance reports offer 1 option for hospitals to measure performance and provide comparative feedback at the individual physician level. Our findings show that, in fact, a majority of US hospitals have made investments in the infrastructure necessary to create such profiles.
Nevertheless, a third of the hospitals surveyed have not adopted individualized provider performance profiles. If meeting efficiency and outcomes goals for value-based payments necessitates changes to individual provider behavior, those hospitals may be less well positioned to benefit from value-based payment models that incentivize hospitals for efficiency and outcomes. Furthermore, while we observe widespread adoption of individual performance profiles, it is unclear whether those were used to provide feedback to providers, and if so, how the feedback provided may influence its effect on behavior. Behavioral economics theory suggests, for example, that publicly reporting performance compared to peers provides stronger incentives for behavior change than “blinded” personalized reports.16
Our study has important limitations. We cannot exclude the possibility that unmeasured variables help explain individual provider performance adoption. These omitted variables may confound the association between hospital characteristics and individual provider performance adoption observed in this study. We were also unable to establish causality between bundled payments and individual provider performance profile use. For instance, hospitals may elect to make investments in IT infrastructure to enable individual provider performance profile adoption in anticipation of bundled payment reforms. Alternatively, the availability of IPPs may have led hospitals to enter bundled payments reimbursement arrangements. In addition, we are unable to describe how individual provider performance use affects physician practice or healthcare delivery more broadly. Finally, we are also unable to account for other sources of performance data. For example, some physician may receive data from their physician practice groups.
Our study suggests several avenues for future research. First, more work is needed to understand why certain types of hospitals are more likely to use IPPs. Our findings indicate that IPP use may be partly a function of hospital size and resources. However, other factors not measured here may play an important role as well, such as institutional culture. Institutions with a focus on informatics and strong IT leadership may be more likely to use their EHR to monitor performance. Second, further research should explore in greater depth how profiles are used. Future research should evaluate, for example, how hospitals are using behavioral economic principles, such as peer comparison, to motivate behavior change, and if such techniques have successfully influenced practice and patient outcomes. Ultimately, multicentered, randomized evaluations of IPP use may be necessary to understand their risks and evaluate their effect on patient outcomes. This work is necessary to inform policy and practice as hospitals transition from fee-for-service to value-based reimbursement.
In sum, we observed increasing adoption of individualized electronic provider performance profiles by US hospitals from 2013 to 2015. Hospitals that did not use IPPs were more likely to be small, for profit, and less likely to participate in bundled payment programs. Those hospitals may be less well positioned to track provider performance and implement incentives for provider behavior changes needed to meet targets for value-based reimbursement.
Disclosure
Dr. Rolnick is a consultant to Tuple Health, Inc. and was a part-time employee of Acumen, LLC outside the submitted work. Dr. Ryskina has nothing to disclose.
1. Hussey PS, Liu JL, White C. The Medicare Access And CHIP Reauthorization Act: effects On Medicare payment policy and spending. Health Aff. 2017;36(4):697-705. PubMed
2. Navathe AS, Song Z, Emanuel EJ. The next generation of episode-based payments. JAMA. 2017;317(23):2371-2372. PubMed
3. Tsugawa Y, Jha AK, Newhouse JP, Zaslavsky AM, Jena AB. Variation in physician spending and association with patient outcomes. JAMA Intern Med. 2017;177(5):675-682. PubMed
4. Saint S, Wiese J, Amory JK, et al. Are physicians aware of which of their patients have indwelling urinary catheters? Am J Med. 2000;109(6):476-480. PubMed
5. Saturno PJ, Palmer RH, Gascón JJ. Physician attitudes, self-estimated performance and actual compliance with locally peer-defined quality evaluation criteria. Int J Qual Health Care J Int Soc Qual Health Care. 1999;11(6):487-496. PubMed
6. Mehrotra A, Sorbero MES, Damberg CL. Using the lessons of behavioral economics to design more effective pay-for-performance programs. Am J Manag Care. 2010;16(7):497-503. PubMed
7. Emanuel EJ, Ubel PA, Kessler JB, et al. Using behavioral economics to design physician Incentives that deliver high-value care. Ann Intern Med. 2016;164(2):114-119. PubMed
8. Liao JM, Fleisher LA, Navathe AS. Increasing the value of social comparisons of physician performance using norms. JAMA. 2016;316(11):1151-1152. PubMed
9. Michtalik HJ, Carolan HT, Haut ER, et al. Use of provider-level dashboards and pay-for-performance in venous thromboembolism prophylaxis. J Hosp Med. 2015;10(3):172-178. PubMed
10. Kurtzman G, Dine J, Epstein A, et al. Internal medicine resident engagement with a laboratory utilization dashboard: mixed methods study. J Hosp Med. 12(9):743-746. PubMed
11. Linder JA, Schnipper JL, Tsurikova R, et al. Electronic health record feedback to improve antibiotic prescribing for acute respiratory infections. Am J Manag Care. 2010;16 (12 Suppl HIT):e311-e319. PubMed
12. Jha AK, DesRoches CM, Campbell EG, et al. Use of electronic health records in U.S. hospitals. N Engl J Med. 2009;360(16):1628-1638. PubMed
13. Walker DM, Mora AM, Scheck McAlearney A. Accountable care organization hospitals differ in health IT capabilities. Am J Manag Care. 2016;22(12):802-807. PubMed
14. Adler-Milstein J, DesRoches CM, Furukawa MF, et al. More than half of US hospitals have at least a basic EHR, but stage 2 criteria remain challenging for most. Health Aff 2014;33(9):1664-1671. PubMed
15. Porter ME. A strategy for health care reform—toward a value-based system. N Engl J Med. 2009;361(2):109-112. PubMed
16. Navathe AS, Emanuel EJ. Physician peer comparisons as a nonfinancial strategy to improve the value of care. JAMA. 2016;316(17):1759-1760. PubMed
© 2018 Society of Hospital Medicine