User login
Critical Illness Outside the ICU
The likelihood of meaningful survival after cardiopulmonary arrest is low and even lower the longer the patient has been in the hospital[1, 2]; realization of this[3] played a major role in the development of rapid response teams (RRTs).[4] As noted elsewhere in this journal, the limited success of these teams[5, 6, 7] has inspired efforts to develop systems to identify patients at risk of deterioration much earlier.
Whereas a number of recent reports have described end‐of‐life care issues in the context of RRT operations,[8, 9, 10, 11, 12, 13, 14, 15, 16] descriptions of how one might incorporate respecting patient preferences into development of a response arm, particularly one meant to scale up to a multiple hospital system, are largely absent from the literature. In this article, we describe the implementation process for integrating palliative care and the honoring of patient choices, which we refer to as supportive care, with an automated early warning system (EWS) and an RRT.
The context of this work is a pilot project conducted at 2 community hospitals, the Kaiser Permanente Northern California (KPNC) Sacramento (200 beds) and South San Francisco (100 beds) medical centers. Our focus was to develop an approach that could serve as the basis for future dissemination to the remaining 19 KPNC hospitals, regardless of their size. Our work incorporated the Respecting Choices model,[17] which has been endorsed by KPNC for all its hospitals and clinics. We describe the workflow we developed to embed the supportive care team's (SCT) reactive and proactive components into the EWS response arm. We also provide a granular description of how our approach worked in practice, as evidenced by the combined patient and provider experiences captured in 5 vignettes as well as some preliminary data obtained by chart review
When patients arrive in the hospital, they may or may not have had a discussion about their care escalation and resuscitation preferences. As noted by Escobar and Dellinger[18] elsewhere in this issue of the Journal of Hospital Medicine, patients with documented restricted resuscitation preferences (eg, do not resuscitate [DNR] or partial code) at the time of admission to the hospital account for slightly more than half of the hospital deaths at 30 days after admission. In general, these stated preferences are honored.
Significant proportions of patients are unstable at the time of admission or have a significant underlying chronic illness burden predisposing them to unexpected deterioration. Often these patients lose decision‐making capacity when their condition worsens. We need to ensure we honor their wishes and identify the correct surrogate.
To make sure a patient's wishes are clear, we developed a workflow that included 2 components. One component is meant to ensure that patient preferences are honored following a EWS alert. This allows for contingencies, including the likelihood that a physician will not be available to discuss patient wishes due to clinical demands. Although it may appear that the role of the hospitalist is supplanted, in fact this is not the case. The only person who has authority to change a patient's code status is the hospitalist, and they always talk to the patient or their surrogate. The purpose of the teams described in this report is to provide backup, particularly in those instances where the hospitalist is tied up elsewhere (eg, the emergency department). Our workflows also facilitate the integration of the clinical with the palliative care response. The other component employs the EWS's ancillary elements (provision of a severity of illness score and longitudinal comorbidity score in real time) to screen patients who might need the SCT. This allows us to identify patients who are at high risk for deterioration in whom an alert has not yet been issued due to acute instability or comorbid burden (leading to high probability of unexpected deterioration) or both and who do not have stated goals of care and/or an identified surrogate.
IMPLEMENTATION APPROACH
We developed our workflow using the Institute for Healthcare Improvement's Plan‐Do‐Study‐Act approach.[19, 20] Our first finding was that most alerts did not require a rapid intervention by the SCT. Both sites reserved time in the SCT physicians' schedule and considered changing staffing levels (the smaller site only had funding for physician support 20 hours per week), but neither had to make such changes. One reason for this was that we increased social worker availability, particularly for off hours (to cover the contingency where an alert was issued in the middle of the night while the on‐call hospitalist was handling an admission in the emergency department). The second was that, as is described by Escobar et al.,[21] the EWS provides a risk of deterioration in the next 12 hours (as opposed to a code blue or regular RRT call, which indicate the need for immediate action) and provides an opportunity for spending time with patients without the constraints of an ongoing resuscitation.
We also found that of the patients who triggered an alert, approximately half would have been flagged for a palliative care referral using our own internal screening tool. Furthermore, having longitudinal comorbidity (Comorbidity Point Score, version 2 [COPS2]) and severity of illness (Laboratory‐Based Acute Physiology Score, version 2) scores[22] facilitated the identification of patients who needed review of their preferences with respect to escalation of care. Currently, our primary case‐finding criterion for proactive SCT consultation is a COPS2 >65, which is associated with a 10.8%, 30‐day mortality risk. Overall, the SCT was asked to see about 25% of patients in whom an alert was triggered.
The workflows we developed were employed at the first site to go live (South San Francisco, 7000 annual discharges, Figure 1) and then modified at Sacramento (14,000 annual discharges, Figure 2). Because the hospitals differ in several respects, from size and patient population to staffing, the workflows are slightly different.

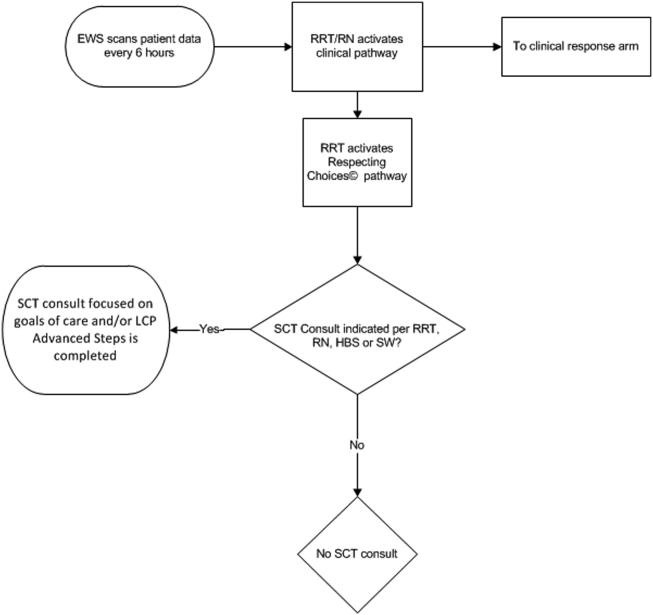
The EWS provides deterioration probabilities every 6 hours, and first responders (RRT nurses) intervene when this probability is 8%. The RRT nurse can activate the clinical response arm, the Respecting Choices pathway, or both. In South San Francisco, which lacked the resources to staff supportive care 24 hours a day/7 days a week, the RRT contacts a medical social worker (MSW) who performs an immediate record review. If this identifies something meriting urgent communication (eg, conflicting or absent information regarding a patient's surrogate), the MSW alerts the hospitalist. The MSW documents findings and ensures that a regular MSW consult occurs the next day. If the MSW feels the patient needs an SCT consult, the MSW alerts the team (this does not preclude a hospitalist or RRT nurse from initiating SCT consultation). At the Sacramento site, where the SCT team is staffed 24 hours a day/7 days a week, it is possible to bypass the MSW step. In addition, each morning the SCT reviews all alerts issued during the previous 24 hours to determine if an SCT consult is needed. In addition, the SCT also proactively reviews the COPS2 scores on all admissions to identify patients who could benefit from an SCT consult. Although surrogate identification and clarifying goals of care are essential, the SCT also helps patients in other ways, as is evident from the following case studies.
The major difference between the palliative care team and the SCT is that the SCT includes the inpatient social worker as part of the team. The SCT has a more focused role (its efforts center on aligning patient goals and priorities with the care that will actually be provided). In contrast, the palliative care team has other functions (eg, pain and symptom management) that are not necessarily associated with life care planning or the alert response.
Considerable overlap exists between patients who trigger an alert and those who would have met screening criteria established prior to EWS deployment. Although this is evolving, we can say that, in general, both sites are moving to an or criterion for involving the SCT (patient meets traditional criteria of the screening tool or triggers alert). Further, as KPNC begins adding more sites to the system, serious consideration is being given to only employing the COPS2 score as the primary screening criterion.
CASE STUDY 1: SURROGATE IDENTIFICATION
Mr. Smith, a 78‐year‐old man with congestive heart failure (CHF), atrial fibrillation, severe chronic obstructive pulmonary disease, and history of stroke, was admitted due to CHF exacerbation. The morning after admission, he experienced uncontrolled tachycardia associated with low oxygen saturation, triggering an alert. The hospitalist stabilized him and documented the treatment plan as follows: If worsening signs (shortness of breath/wheezing) or decreased saturation on current oxygen supplement, check chest film and arterial blood gas chest x‐ray/ arterial blood gas and call MD for possible bilevel positive airway pressure and repeating the echo. Intensive care unit (ICU) transfer as needed. According to his sister, his resuscitation preference was full code.
Given the new protocol instituted since the deployment of the EWS, the MSW reviewed the chart and found that the patient's sister, who lived locally and was the emergency contact, had been incorrectly identified as the surrogate. In a prior hospitalization, Mr. Smith had named his brother as his surrogate, as the patient felt strongly that his sister would not make good decisions for him. The following day, the SCT met with Mr. Smith, who articulated his desire to change his care directive to DNR. He also asked for a full palliative consult when his brother could come in (3 days later). During the consult, his brother learned, for the first time, exactly what heart failure was, and what to anticipate over the next months and years. The 2 brothers completed an advance directive granting Mr. Smith's brother a durable power of attorney including a request for a palliative approach to end‐stage illness. They also completed a physician order for life sustaining treatment, for DNR and limited intervention. Mr. Smith stated, When I go, I'm gone, and recalled that his mother and uncle had protracted illnesses, adding that I don't want to stay alive if I'm disabled like that.
In this example, the SCT was able to identify the correct surrogate and clarify the patient's resuscitation preference. Without SCT, if this patient had deteriorated unexpectedly, the sister would have insisted on treatment that was inconsistent with Mr. Smith's wishes. The interventions as a result of the alert also led the patient and his brother to begin discussing the medical goals of treatment openly and reach understanding about the patient's chronic and progressive conditions.
CASE STUDY 2: TRANSITION TO HOME‐BASED HOSPICE
Mr. North was a 71‐year‐old man admitted for sepsis due to pneumonia. He had a history of temporal arteritis, systemic lupus erythematosus, prostate cancer, squamous cell lung cancer, and chronic leg ulcers. Delirious at the time of admission, he triggered an alert at 6 am, shortly after admission to the ward. He was hypotensive and was transferred to the ICU.
The SCT reviewed the case and judged that he met criteria for consultation. His wife readily agreed to meet to discuss goals and plan of care. She had been taking care of him at home, and was overwhelmed by his physical needs as well as his worsening memory loss and agitation. She had not been able to bring him to the clinic for almost 2 years, and he had refused entry to the home health nurse. During the palliative consult, Mr. North was lucid enough to state his preference for comfort‐focused care, and his desire not to return to the hospital. Mrs. North accepted a plan for home hospice, with increased attendant care at home.
This case illustrates the benefit of the EWS in identifying patients whose chronic condition has progressed, and who would benefit from a palliative consult to clarify goals of care. Practice variation, the complexity of multiple medical problems, and the urgency of the acute presentation may obscure or delay the need for clarifying goals of care. A structured approach provided by the EWS workflow, as it did in this case, helps to ensure that these discussions are occurring with the appropriate patients at the appropriate times.
CASE STUDY 3: RESOLVING MD‐TO‐MD MISCOMMUNICATION
Mr. Joseph was an 89‐year‐old male hospitalized for a hip fracture. He had a history of atrial fibrillation, prostate cancer with bone metastases, radiation‐induced lung fibrosis, stroke, and advanced dementia. His initial admission order was DNR, but this was changed after surgery to full code and remained so. The next few days were relatively uneventful until the alert triggered. By then, the hospitalist attending him had changed 3 times. The social worker reviewed Mr. Joseph's records and determined that a palliative consult had taken place previously at another Kaiser Permanente facility, and that the prior code status was DNR. Although Mr. Joseph's admission care directive was DNR, this was switched to full code for surgery. However, the care directive was not changed back, nor was a discussion held to discuss his preference in case of a complication related to surgery. Meanwhile, he was having increasing respiratory problems due to aspiration and required noninvasive ventilation.
Consequently, the SCT reviewed the alerts from the previous 24 hours and determined that further investigation and discussion were required. When the hospitalist was called, the SCT discovered that the hospitalist had assumed the change to full code had been made by 1 of the previous attending physicians; he also informed the SCT that Mr. Joseph would likely need intubation. The SCT decided to go see the patient and, on approaching the room, saw Mr. Joseph's son waiting outside. The son was asked how things were going, and replied, We all knew that 1 day he would deteriorate, we just want to make sure he is comfortable. Clearly, the full code status did not reflect the Mr. Joseph's wishes, so this was clarified and the hospitalist was called immediately to change the care directive. The SCT met with the man's son and wife, educating them about aspiration and what to expect. They definitely wished a gentle approach for Mr. Joseph, and it was decided to continue current care, without escalation, until the morning. This was to allow the other son to be informed of his father's condition and to see if his status would improve. The next morning the SCT met with the family at the room, and the patient was placed on comfort measures.
This case illustrates 3 points. One, Mr. Joseph's status was changed to full code during surgery without addressing his preferences should he develop a complication during the postoperative period. Two, when the hospitalist saw the full code order in the electronic record, it was assumed someone else had had a discussion with the patient and his family. Lastly, although a social worker performed a chart review, the full picture only emerged after the entire SCT became involved. Therefore, even in the presence of an EWS with associated protocols, important details can be missed, highlighting the need to build redundancy into workflows.
CASE STUDY 4: RELUCTANCE TO INVOLVE PALLIATIVE CARE TEAM
Mrs. Wood, a bed‐bound 63‐year‐old with end‐stage heart failure, was admitted to the hospital with respiratory failure. She had met with a life care planning facilitator as well as a palliative physician previously but refused to discuss end‐of‐life options. She felt she would always do well and her husband felt the same way. During this admission a routine palliative referral was made, but she and her husband refused. The chaplain visited often and then the patient took a turn for the worse, triggering an alert and was transferred to the ICU.
The hospitalist did not feel a SCT consult was indicated based on prior discussions. However, the SCT reviewed the records and felt an intervention was needed. The patient, now obtunded, had worsening renal failure and required continuous pressor infusions. The chaplain spoke with Mr. Wood, who felt a consult was appropriate. Mrs. Wood was no longer able to make decisions, and her husband needed more information about what to expect. At the end of the discussion, he decided on comfort care, and his wife expired peacefully in the hospital.
This case illustrates that, although initially the primary attending may feel a palliative consult is not helpful and possibly detrimental to the patient's care under usual circumstances, decisions may change as the patient's condition changes. The EWS alert helped the SCT recognize the drastic change in the patient's condition and the need to support the patient's family. The family had been resistant, but the SCT was able to help the family transition to a palliative approach with its gentle contact and being clear about its role to provide support regardless of their decision.
CASE STUDY 5: ALERT FACILITATES TRANSITION TO OUTPATIENT PALLIATIVE CARE
Mr. Jones was an 82‐year‐old gentleman who had a recent episode of gastrointestinal bleeding while on vacation. He was transferred by air ambulance to the hospital and developed delirium and agitation. His evaluation revealed that he had polycythemia vera and a recently made diagnosis of mild dementia.
In this case, the SCT reviewed the chart not because of an alert, but because the hospitalist noted that Mr. Jones had a very high severity of illness score on admission. When the SCT arrived at Mr. Jones's room, 3 family members were present. His wife appeared to be very frail and was too emotional to make decisions. The children present at the bedside were new to the problems at hand but wanted to help. The SCT team educated the family about his current disease state, the general disease trajectory, and what to expect. They explored the patient's values and any indicators of what his care preference would be if he could communicate it. The SCT established a life care plan at that visit. Based upon Mr. Jones's own wishes and values, he was made DNR with limited interventions. He survived the hospitalization and was followed by the outpatient palliative care clinic as well as by hematology.
This case illustrates 2 facets: a high severity of illness score led to consultation even without an alert. Following this, the SCT could take on a taskarriving at a life care plan by exploring valuesthat is difficult and time consuming for a busy hospitalist. It also illustrates that patients may elect to obtain other options, in this case, outpatient palliative care.
FUTURE DIRECTIONS
Our team has also started a quantitative evaluation process. The major limitation we face in this effort is that, unlike physiologic or health services measures (eg, tachycardia, hospital length of stay, mortality), the key measures for assessing the quality of palliative and end‐of‐life care need to be extracted by manual chart review. Our approach is based on the palliative and end‐of‐life care measures endorsed by the National Quality Forum,[23] which are described in greater detail in the appendix. As is the case with other outcomes, and as described in the article by Escobar et al.,[21] we will be employing a difference‐in‐differences approach as well as multivariate matching[24, 25, 26] to evaluate effectiveness of the intervention. Because of the high costs of manual chart review, we will be reviewing randomly selected charts of patients who triggered an alert at the 2 pilot sites as well as matched comparison patient charts at the remaining 19 KPNC hospitals. Table 1 provides preliminary data we gathered to pilot the brief chart review instrument that will be used for evaluating changes in supportive care in the regional rollout. Data are from a randomly selected cohort of 150 patients who reached the alert threshold at the 2 pilot sites between November 13, 2013 and June 30, 2014. After removing 3 records with substantial missing data, we were able to find 146 matched patients at the remaining 19 KPNC hospitals during the same time period. Matched patients were selected from those patients who had a virtual alert based on retrospective data. Table 1 shows that, compared to the other KPNC hospitals, the quality of these 6 aspects of supportive care was better at the pilot sites.
| Hospital* | 1 | 2 | 1+2 combined | Remaining 19 | P (1) | P(2) | P(1+2) |
|---|---|---|---|---|---|---|---|
| |||||||
| N | 73 | 74 | 147 | 146 | |||
| Age (y) | 69.3 14.4 | 66.4 15.3 | 67.8 14.8 | 67.4 14.7 | 0.37 | 0.62 | 0.82 |
| Male (%) | 39 (53.4%) | 43 (58.1%) | 82 (55.8%) | 82 (56.2%) | 0.70 | 0.78 | 0.95 |
| Deterioration risk (%) | 20.0 14.3 | 17.4 11.6 | 18.7 13.0 | 18.8 13.6 | 0.54 | 0.44 | 0.94 |
| LAPS2 | 113 38 | 102 39 | 107 39 | 107 38 | 0.28 | 0.38 | 0.9 |
| COPS2 | 69 52 | 66 52 | 67 52 | 66 51 | 0.75 | 1.00 | 0.85 |
| Died (%)‖ | 17 (23.3%) | 15 (20.3%) | 32 (21.8%) | 24 (16.4%) | 0.22 | 0.48 | 0.25 |
| Agent identified prior | 28 (38.4%) | 18 (24.3%) | 46 (31.3%) | 21 (14.4%) | <0.001 | 0.07 | 0.001 |
| Agent identified after# | 46 (63.0%) | 39 (52.7%) | 85 (57.8%) | 28 (19.4%) | <0.001 | <0.001 | <0.001 |
| Updating within 24 hours** | 32 (43.8%) | 45 (60.8%) | 77 (52.4%) | 59 (40.4%) | 0.63 | 0.00 | 0.04 |
| Goals of care discussion | 20 (27.4%) | 37 (50.0%) | 57 (38.8%) | 32 (21.9%) | 0.37 | 0.001 | 0.002 |
| Palliative care consult | 19 (26.0%) | 49 (66.2%) | 68 (46.3%) | 35 (24.0%) | 0.74 | <0.001 | <0.001 |
| Spiritual support offered | 27 (37.0%) | 30 (40.5%) | 57 (38.8%) | 43 (29.4%) | 0.26 | 0.10 | 0.09 |
CONCLUSION
Although we continue to review our care processes, we feel that our overall effort has been successful. Nonetheless, it is important to consider a number of limitations to the generalizability of our approach. First, our work has taken place in the context of a highly integrated care delivery system where both information transfer as well as referral from the inpatient to the outpatient setting can occur easily. Second, because the pilot sites were among the first KPNC hospitals to begin implementing the Respecting Choices model, they undoubtedly had less ground to cover than hospitals beginning with less infrastructure. Third, because of resource limitations, our ability to capture process data is limited. Lastly, both sites were able to obtain resources to expand necessary coverage, which might not be possible in many settings.
In conclusion, we made a conscious decision to incorporate palliative care into the planning for the deployment of the alert system. Further, we made this decision explicit, informing all caregivers that providing palliative care that adheres to the Respecting Choices model would be essential. We have found that integration of the SCT, the EWS, and routine hospital operations can be achieved. Clinician and patient acceptance of the Respecting Choices component has been excellent. We consider 3 elements to be critical for this process, and these elements form an integral component of the expansion of the early warning system to the remaining 19 KPNC hospitals. The first is careful planning, which includes instructing RRT first responders on their role in the process of ensuring the respect of patient preferences. Second, having social workers available 24 hours a day/7 days a week as backup for busy hospitalists, is essential. Finally, as is described by Dummett et al.,[27] including reminders regarding patient preferences in the documentation process (by embedding it in an automated note template) is also very important.
Acknowledgements
The authors thank Dr. Michelle Caughey, Dr. Philip Madvig, Dr. Patricia Conolly, Ms. Barbara Crawford, and Ms. Melissa Stern for their administrative support, Dr. Tracy Lieu for reviewing the manuscript, and Ms. Rachel Lesser for formatting the manuscript.
Disclosures: This work was supported by a grant from the Gordon and Betty Moore Foundation (Early Detection, Prevention, and Mitigation of Impending Physiologic Deterioration in Hospitalized Patients Outside Intensive Care: Phase 3, pilot), The Permanente Medical Group, Inc., and Kaiser Foundation Hospitals, Inc. As part of our agreement with the Gordon and Betty Moore Foundation, we made a commitment to disseminate our findings in articles such as this one. However, the Foundation played no role in how we actually structured our articles, nor did they review or preapprove any of the manuscripts submitted as part of the dissemination component. None of the other sponsors had any involvement in our decision to submit this manuscript or in the determination of its contents. None of the authors have any conflicts of interest to declare of relevance to this work.
APPENDIX 1
Key measures to assess the quality of supportive care extracted by manual chart review
| Chart review question | Outcome desired | Outcome measured | Rationale for selecting this outcome |
Was the patient's decision‐maker documented following the alert? If yes: Time/date of documentation. | Timely identification and documentation of the patient's decision‐maker immediately following the alert | Whether the patient's decision‐maker was clearly identified and documented by a member of the treatment team (nurse, physician, and/or rapid response team) following the alert. This outcome is measured independently of whether the patient's decision‐maker was already documented prior to the alert. | Clear documentation facilitates the notification of a patient's family/decision‐maker in a timely manner to enhance communication and clinical decision‐making to make sure that the patient's wishes and preferences are honored. |
Was the patient's decision‐maker/family notified or was there an attempt to notify the patient's decision‐maker regarding the changes in the patient's condition following the alert? If yes: Time/date of notification/attempted contact. | Providing patient's family members/decision‐maker with an update in the patient's clinical condition following the alert | Whether the medical team notified or attempted to contact the patient's family/decision‐maker to provide an update in the patient's clinical condition following the alert. | Providing timely updates when a patient's clinical status changes enhances communication and helps to proactively involve patients and families in the decision‐making process. |
Was there a goals of care discussion following the alert? If yes: Time/date of discussion | To clarify and to honor individual patient's goals of care | Whether a goals of care discussion was initiated after the alert was issued. Criteria for Goals of Care discussion included any/all of the following:
| Goals of care discussions actively involve patients and families in the decision‐making process to ensure that their wishes and preferences are clearly documented and followed. |
| Was there a palliative care consultation during the patient's hospitalization? | To provide comprehensive supportive care to patients and their families/loved ones. | Whether palliative care was consulted during the patient's hospitalization | The palliative care team plays an important role in helping patients/families make decisions, providing support, and ensuring that patients symptoms are addressed and properly managed |
| Was spiritual support offered to the patient and/or their family/loved during the patient's hospitalization? | To offer and to provide spiritual support to patients and their families/loved ones | Whether the patient/family was offered spiritual support during the patient's hospitalization | Spiritual support has been recognized as an important aspect of quality EOL care |
APPENDIX 2
Respecting Choices, A Staged Approach to Advance Care Planning
Respecting Choices is a staged approach to advance care planning, where conversations begin when people are healthy and continue to occur throughout life.
Our Life Care Planning service consists ofthree distinct steps.
- My Values: First Steps is appropriate for all adults, but should definitely be initiated as a component of routine healthcare for those over the age of 55. The goals of First Steps are to motivate individuals to learn more about the importance of Life Care Planning, select a healthcare decision maker, and complete a basic written advance directive.
- My Choices: Next Steps is for patients with chronic, progressive illness who have begun to experience a decline in functional status or frequent hospitalizations. The goals of this stage of planning are to assist patients in understanding a) the progression of their illness, b) potential complications, and c) specific life‐sustaining treatments that may be required if their illness progresses. Understanding life‐sustaining treatments includes each treatment's benefits, burdens, and alternatives. With this understanding members will be better able to express what situations (e.g. complications or bad outcomes) would cause them to want to change their plan of care.Additionally, the individual's healthcare agent(s) and other loved ones are involved in the planning process so that they can be prepared to make decisions, if necessary, and to support the plan of care developed.
- My Care: Advanced Steps is intended for frail elders or others whose death in the next 12 months would not be surprising. It helps patients and their agent make specific and timely life‐sustaining treatment decisions that can be converted to medical orders to guide the actions of healthcare providers and be consistent with the goals of the individual.
(Reference:
APPENDIX 3
Pilot site Palliative Care Referral Criteria
Automatic palliative care consults for adults at Sacramento site are as follows:
- 30 day readmits or >3 ED or acute readmissions in past year for CHF or COPD that have no Advance Directive and are not followed by Chronic Care Management
- Aspiration
- CVA with poor prognosis for regaining independence
- Hip fracture patients not weight bearing on post‐operative day 2
- Code blue survivor
- Skilled Nursing Facility resident with sepsis and or dementia
- Active hospice patients
- Sepsis patients with 10 or more ICD codes in the problem list
Potential palliative care consults for adults at Sacramento pilot site are as follows:
- Morbid obesity complicated by organ damage (e.g., congestive heart failure, refractory liver disease, chronic renal disease)
- Severe chronic kidney disease and/or congestive heart failure with poor functional status (chair or bed bound)
- Patient with pre‐operative arteriovenous fistulas and poor functional status, congestive heart failure, or age>80
- End stage liver disease with declining functional status, poor odds of transplant
- Institute of Medicine of the National Academies. Dying in America: Improving Quality and Honoring Individual Preferences Near the End of Life. Washington, DC: Institute of Medicine of the National Academies; 2014.
- . Final chapter: Californians' attitudes and experiences with death and dying. California HealthCare Foundation website. Available at: http://www.chcf.org/publications/2012/02/final‐chapter‐death‐dying. Published February 2012. Accessed July 14, 2015.
- , . Predicting outcome of inhospital cardiopulmonary resuscitation. Crit Care Med. 1988;16(6):583–586.
- , , , , . The medical emergency team: a new strategy to identify and intervene in high‐risk surgical patients. Clin Intensive Care. 1995;6:269–272.
- , , . Rapid response teams—walk, don't run. JAMA. 2006;296(13):1645–1647.
- , , , , , . Rapid response systems: a systematic review. Crit Care Med. 2007;35(5):1238–1243.
- , . Rethinking rapid response teams. JAMA. 2010;304(12):1375–1376.
- , , , , , . The medical emergency team and end‐of‐life care: a pilot study. Crit Care Resusc. 2007;9(2):151–156.
- , , , , . The Medical Emergency Team System and not‐for‐resuscitation orders: results from the MERIT study. Resuscitation. 2008;79(3):391–397.
- , , , , , . Enhanced end‐of‐life care associated with deploying a rapid response team: a pilot study. J Hosp Med. 2009;4(7):449–452.
- , , , . A retrospective cohort study of the effect of medical emergency teams on documentation of advance care directives. Crit Care Resusc. 2011;13(3):167–174.
- , , , . Rapid response team calls to patients with a pre‐existing not for resuscitation order. Resuscitation. 2013;84(8):1035–1039.
- , , , et al. Changes in end of life care 5 years after the introduction of a rapid response team: a multicentre retrospective study. Resuscitation. 2013;84(10):1339–1344.
- , , , , . The medical emergency team call: a sentinel event that triggers goals of care discussion. Crit Care Med. 2014;42(2):322–327.
- , , , . Documentation of limitation of medical therapy at the time of a rapid response team call. Aust Health Rev. 2014;38(2):218–222.
- , , , et al. Medical emergency response in a sub‐acute hospital: improving the model of care for deteriorating patients. Aust Health Rev. 2014;38(2):169–176.
- Respecting Choices advance care planning. Available at: http://www.gundersenhealth.org/respecting‐choices. Gundersen Health System website. Accessed March 28, 2015.
- , . Early detection, prevention, and mitigation of critical illness outside intensive care settings. J Hosp Med. 2016;11:000–000.
- , , , , , . The Improvement Guide: A Practical Approach to Enhancing Organizational Performance. 2nd ed. San Francisco, CA: Jossey‐Bass; 2009.
- , , , , . Understanding the components of quality improvement collaboratives: a systematic literature review. Milbank Q. 2013;91(2):354–394.
- , , , et al. Piloting electronic medical record-based early detection of inpatient deterioration in community hospitals. J Hosp Med. 2016;11:000–000.
- , , , , . Risk‐adjusting hospital mortality using a comprehensive electronic record in an integrated healthcare delivery system. Med Care. 2013;51(5):446–453.
- Department of Health and Human Services. Palliative care and end‐of‐life care—a consensus report. National Quality Forum website. Available at: http://www.qualityforum.org/projects/palliative_care_and_end‐of‐life_care.aspx. Accessed April 1, 2015.
- , . Comparison of multivariate matching methods: structures, distances, and algorithms. J Comput Graph Stat. 1993;2(4):405–420.
- , , . A method/macro based on propensity score and Mahalanobis distance to reduce bias in treatment comparison in observational study: Eli Lilly working paper. Available at: http://www.lexjansen.com/pharmasug/2006/publichealthresearch/pr05.pdf. Accessed January 24, 2013.
- . Matching methods for causal inference: a review and a look forward. Stat Sci. 2010;25(1):1–21.
- , , , , , . Incorporating an early detection system into routine clinical practice in two community hospitals. J Hosp Med. 2016;11:000–000.
The likelihood of meaningful survival after cardiopulmonary arrest is low and even lower the longer the patient has been in the hospital[1, 2]; realization of this[3] played a major role in the development of rapid response teams (RRTs).[4] As noted elsewhere in this journal, the limited success of these teams[5, 6, 7] has inspired efforts to develop systems to identify patients at risk of deterioration much earlier.
Whereas a number of recent reports have described end‐of‐life care issues in the context of RRT operations,[8, 9, 10, 11, 12, 13, 14, 15, 16] descriptions of how one might incorporate respecting patient preferences into development of a response arm, particularly one meant to scale up to a multiple hospital system, are largely absent from the literature. In this article, we describe the implementation process for integrating palliative care and the honoring of patient choices, which we refer to as supportive care, with an automated early warning system (EWS) and an RRT.
The context of this work is a pilot project conducted at 2 community hospitals, the Kaiser Permanente Northern California (KPNC) Sacramento (200 beds) and South San Francisco (100 beds) medical centers. Our focus was to develop an approach that could serve as the basis for future dissemination to the remaining 19 KPNC hospitals, regardless of their size. Our work incorporated the Respecting Choices model,[17] which has been endorsed by KPNC for all its hospitals and clinics. We describe the workflow we developed to embed the supportive care team's (SCT) reactive and proactive components into the EWS response arm. We also provide a granular description of how our approach worked in practice, as evidenced by the combined patient and provider experiences captured in 5 vignettes as well as some preliminary data obtained by chart review
When patients arrive in the hospital, they may or may not have had a discussion about their care escalation and resuscitation preferences. As noted by Escobar and Dellinger[18] elsewhere in this issue of the Journal of Hospital Medicine, patients with documented restricted resuscitation preferences (eg, do not resuscitate [DNR] or partial code) at the time of admission to the hospital account for slightly more than half of the hospital deaths at 30 days after admission. In general, these stated preferences are honored.
Significant proportions of patients are unstable at the time of admission or have a significant underlying chronic illness burden predisposing them to unexpected deterioration. Often these patients lose decision‐making capacity when their condition worsens. We need to ensure we honor their wishes and identify the correct surrogate.
To make sure a patient's wishes are clear, we developed a workflow that included 2 components. One component is meant to ensure that patient preferences are honored following a EWS alert. This allows for contingencies, including the likelihood that a physician will not be available to discuss patient wishes due to clinical demands. Although it may appear that the role of the hospitalist is supplanted, in fact this is not the case. The only person who has authority to change a patient's code status is the hospitalist, and they always talk to the patient or their surrogate. The purpose of the teams described in this report is to provide backup, particularly in those instances where the hospitalist is tied up elsewhere (eg, the emergency department). Our workflows also facilitate the integration of the clinical with the palliative care response. The other component employs the EWS's ancillary elements (provision of a severity of illness score and longitudinal comorbidity score in real time) to screen patients who might need the SCT. This allows us to identify patients who are at high risk for deterioration in whom an alert has not yet been issued due to acute instability or comorbid burden (leading to high probability of unexpected deterioration) or both and who do not have stated goals of care and/or an identified surrogate.
IMPLEMENTATION APPROACH
We developed our workflow using the Institute for Healthcare Improvement's Plan‐Do‐Study‐Act approach.[19, 20] Our first finding was that most alerts did not require a rapid intervention by the SCT. Both sites reserved time in the SCT physicians' schedule and considered changing staffing levels (the smaller site only had funding for physician support 20 hours per week), but neither had to make such changes. One reason for this was that we increased social worker availability, particularly for off hours (to cover the contingency where an alert was issued in the middle of the night while the on‐call hospitalist was handling an admission in the emergency department). The second was that, as is described by Escobar et al.,[21] the EWS provides a risk of deterioration in the next 12 hours (as opposed to a code blue or regular RRT call, which indicate the need for immediate action) and provides an opportunity for spending time with patients without the constraints of an ongoing resuscitation.
We also found that of the patients who triggered an alert, approximately half would have been flagged for a palliative care referral using our own internal screening tool. Furthermore, having longitudinal comorbidity (Comorbidity Point Score, version 2 [COPS2]) and severity of illness (Laboratory‐Based Acute Physiology Score, version 2) scores[22] facilitated the identification of patients who needed review of their preferences with respect to escalation of care. Currently, our primary case‐finding criterion for proactive SCT consultation is a COPS2 >65, which is associated with a 10.8%, 30‐day mortality risk. Overall, the SCT was asked to see about 25% of patients in whom an alert was triggered.
The workflows we developed were employed at the first site to go live (South San Francisco, 7000 annual discharges, Figure 1) and then modified at Sacramento (14,000 annual discharges, Figure 2). Because the hospitals differ in several respects, from size and patient population to staffing, the workflows are slightly different.
The EWS provides deterioration probabilities every 6 hours, and first responders (RRT nurses) intervene when this probability is 8%. The RRT nurse can activate the clinical response arm, the Respecting Choices pathway, or both. In South San Francisco, which lacked the resources to staff supportive care 24 hours a day/7 days a week, the RRT contacts a medical social worker (MSW) who performs an immediate record review. If this identifies something meriting urgent communication (eg, conflicting or absent information regarding a patient's surrogate), the MSW alerts the hospitalist. The MSW documents findings and ensures that a regular MSW consult occurs the next day. If the MSW feels the patient needs an SCT consult, the MSW alerts the team (this does not preclude a hospitalist or RRT nurse from initiating SCT consultation). At the Sacramento site, where the SCT team is staffed 24 hours a day/7 days a week, it is possible to bypass the MSW step. In addition, each morning the SCT reviews all alerts issued during the previous 24 hours to determine if an SCT consult is needed. In addition, the SCT also proactively reviews the COPS2 scores on all admissions to identify patients who could benefit from an SCT consult. Although surrogate identification and clarifying goals of care are essential, the SCT also helps patients in other ways, as is evident from the following case studies.
The major difference between the palliative care team and the SCT is that the SCT includes the inpatient social worker as part of the team. The SCT has a more focused role (its efforts center on aligning patient goals and priorities with the care that will actually be provided). In contrast, the palliative care team has other functions (eg, pain and symptom management) that are not necessarily associated with life care planning or the alert response.
Considerable overlap exists between patients who trigger an alert and those who would have met screening criteria established prior to EWS deployment. Although this is evolving, we can say that, in general, both sites are moving to an or criterion for involving the SCT (patient meets traditional criteria of the screening tool or triggers alert). Further, as KPNC begins adding more sites to the system, serious consideration is being given to only employing the COPS2 score as the primary screening criterion.
CASE STUDY 1: SURROGATE IDENTIFICATION
Mr. Smith, a 78‐year‐old man with congestive heart failure (CHF), atrial fibrillation, severe chronic obstructive pulmonary disease, and history of stroke, was admitted due to CHF exacerbation. The morning after admission, he experienced uncontrolled tachycardia associated with low oxygen saturation, triggering an alert. The hospitalist stabilized him and documented the treatment plan as follows: If worsening signs (shortness of breath/wheezing) or decreased saturation on current oxygen supplement, check chest film and arterial blood gas chest x‐ray/ arterial blood gas and call MD for possible bilevel positive airway pressure and repeating the echo. Intensive care unit (ICU) transfer as needed. According to his sister, his resuscitation preference was full code.
Given the new protocol instituted since the deployment of the EWS, the MSW reviewed the chart and found that the patient's sister, who lived locally and was the emergency contact, had been incorrectly identified as the surrogate. In a prior hospitalization, Mr. Smith had named his brother as his surrogate, as the patient felt strongly that his sister would not make good decisions for him. The following day, the SCT met with Mr. Smith, who articulated his desire to change his care directive to DNR. He also asked for a full palliative consult when his brother could come in (3 days later). During the consult, his brother learned, for the first time, exactly what heart failure was, and what to anticipate over the next months and years. The 2 brothers completed an advance directive granting Mr. Smith's brother a durable power of attorney including a request for a palliative approach to end‐stage illness. They also completed a physician order for life sustaining treatment, for DNR and limited intervention. Mr. Smith stated, When I go, I'm gone, and recalled that his mother and uncle had protracted illnesses, adding that I don't want to stay alive if I'm disabled like that.
In this example, the SCT was able to identify the correct surrogate and clarify the patient's resuscitation preference. Without SCT, if this patient had deteriorated unexpectedly, the sister would have insisted on treatment that was inconsistent with Mr. Smith's wishes. The interventions as a result of the alert also led the patient and his brother to begin discussing the medical goals of treatment openly and reach understanding about the patient's chronic and progressive conditions.
CASE STUDY 2: TRANSITION TO HOME‐BASED HOSPICE
Mr. North was a 71‐year‐old man admitted for sepsis due to pneumonia. He had a history of temporal arteritis, systemic lupus erythematosus, prostate cancer, squamous cell lung cancer, and chronic leg ulcers. Delirious at the time of admission, he triggered an alert at 6 am, shortly after admission to the ward. He was hypotensive and was transferred to the ICU.
The SCT reviewed the case and judged that he met criteria for consultation. His wife readily agreed to meet to discuss goals and plan of care. She had been taking care of him at home, and was overwhelmed by his physical needs as well as his worsening memory loss and agitation. She had not been able to bring him to the clinic for almost 2 years, and he had refused entry to the home health nurse. During the palliative consult, Mr. North was lucid enough to state his preference for comfort‐focused care, and his desire not to return to the hospital. Mrs. North accepted a plan for home hospice, with increased attendant care at home.
This case illustrates the benefit of the EWS in identifying patients whose chronic condition has progressed, and who would benefit from a palliative consult to clarify goals of care. Practice variation, the complexity of multiple medical problems, and the urgency of the acute presentation may obscure or delay the need for clarifying goals of care. A structured approach provided by the EWS workflow, as it did in this case, helps to ensure that these discussions are occurring with the appropriate patients at the appropriate times.
CASE STUDY 3: RESOLVING MD‐TO‐MD MISCOMMUNICATION
Mr. Joseph was an 89‐year‐old male hospitalized for a hip fracture. He had a history of atrial fibrillation, prostate cancer with bone metastases, radiation‐induced lung fibrosis, stroke, and advanced dementia. His initial admission order was DNR, but this was changed after surgery to full code and remained so. The next few days were relatively uneventful until the alert triggered. By then, the hospitalist attending him had changed 3 times. The social worker reviewed Mr. Joseph's records and determined that a palliative consult had taken place previously at another Kaiser Permanente facility, and that the prior code status was DNR. Although Mr. Joseph's admission care directive was DNR, this was switched to full code for surgery. However, the care directive was not changed back, nor was a discussion held to discuss his preference in case of a complication related to surgery. Meanwhile, he was having increasing respiratory problems due to aspiration and required noninvasive ventilation.
Consequently, the SCT reviewed the alerts from the previous 24 hours and determined that further investigation and discussion were required. When the hospitalist was called, the SCT discovered that the hospitalist had assumed the change to full code had been made by 1 of the previous attending physicians; he also informed the SCT that Mr. Joseph would likely need intubation. The SCT decided to go see the patient and, on approaching the room, saw Mr. Joseph's son waiting outside. The son was asked how things were going, and replied, We all knew that 1 day he would deteriorate, we just want to make sure he is comfortable. Clearly, the full code status did not reflect the Mr. Joseph's wishes, so this was clarified and the hospitalist was called immediately to change the care directive. The SCT met with the man's son and wife, educating them about aspiration and what to expect. They definitely wished a gentle approach for Mr. Joseph, and it was decided to continue current care, without escalation, until the morning. This was to allow the other son to be informed of his father's condition and to see if his status would improve. The next morning the SCT met with the family at the room, and the patient was placed on comfort measures.
This case illustrates 3 points. One, Mr. Joseph's status was changed to full code during surgery without addressing his preferences should he develop a complication during the postoperative period. Two, when the hospitalist saw the full code order in the electronic record, it was assumed someone else had had a discussion with the patient and his family. Lastly, although a social worker performed a chart review, the full picture only emerged after the entire SCT became involved. Therefore, even in the presence of an EWS with associated protocols, important details can be missed, highlighting the need to build redundancy into workflows.
CASE STUDY 4: RELUCTANCE TO INVOLVE PALLIATIVE CARE TEAM
Mrs. Wood, a bed‐bound 63‐year‐old with end‐stage heart failure, was admitted to the hospital with respiratory failure. She had met with a life care planning facilitator as well as a palliative physician previously but refused to discuss end‐of‐life options. She felt she would always do well and her husband felt the same way. During this admission a routine palliative referral was made, but she and her husband refused. The chaplain visited often and then the patient took a turn for the worse, triggering an alert and was transferred to the ICU.
The hospitalist did not feel a SCT consult was indicated based on prior discussions. However, the SCT reviewed the records and felt an intervention was needed. The patient, now obtunded, had worsening renal failure and required continuous pressor infusions. The chaplain spoke with Mr. Wood, who felt a consult was appropriate. Mrs. Wood was no longer able to make decisions, and her husband needed more information about what to expect. At the end of the discussion, he decided on comfort care, and his wife expired peacefully in the hospital.
This case illustrates that, although initially the primary attending may feel a palliative consult is not helpful and possibly detrimental to the patient's care under usual circumstances, decisions may change as the patient's condition changes. The EWS alert helped the SCT recognize the drastic change in the patient's condition and the need to support the patient's family. The family had been resistant, but the SCT was able to help the family transition to a palliative approach with its gentle contact and being clear about its role to provide support regardless of their decision.
CASE STUDY 5: ALERT FACILITATES TRANSITION TO OUTPATIENT PALLIATIVE CARE
Mr. Jones was an 82‐year‐old gentleman who had a recent episode of gastrointestinal bleeding while on vacation. He was transferred by air ambulance to the hospital and developed delirium and agitation. His evaluation revealed that he had polycythemia vera and a recently made diagnosis of mild dementia.
In this case, the SCT reviewed the chart not because of an alert, but because the hospitalist noted that Mr. Jones had a very high severity of illness score on admission. When the SCT arrived at Mr. Jones's room, 3 family members were present. His wife appeared to be very frail and was too emotional to make decisions. The children present at the bedside were new to the problems at hand but wanted to help. The SCT team educated the family about his current disease state, the general disease trajectory, and what to expect. They explored the patient's values and any indicators of what his care preference would be if he could communicate it. The SCT established a life care plan at that visit. Based upon Mr. Jones's own wishes and values, he was made DNR with limited interventions. He survived the hospitalization and was followed by the outpatient palliative care clinic as well as by hematology.
This case illustrates 2 facets: a high severity of illness score led to consultation even without an alert. Following this, the SCT could take on a taskarriving at a life care plan by exploring valuesthat is difficult and time consuming for a busy hospitalist. It also illustrates that patients may elect to obtain other options, in this case, outpatient palliative care.
FUTURE DIRECTIONS
Our team has also started a quantitative evaluation process. The major limitation we face in this effort is that, unlike physiologic or health services measures (eg, tachycardia, hospital length of stay, mortality), the key measures for assessing the quality of palliative and end‐of‐life care need to be extracted by manual chart review. Our approach is based on the palliative and end‐of‐life care measures endorsed by the National Quality Forum,[23] which are described in greater detail in the appendix. As is the case with other outcomes, and as described in the article by Escobar et al.,[21] we will be employing a difference‐in‐differences approach as well as multivariate matching[24, 25, 26] to evaluate effectiveness of the intervention. Because of the high costs of manual chart review, we will be reviewing randomly selected charts of patients who triggered an alert at the 2 pilot sites as well as matched comparison patient charts at the remaining 19 KPNC hospitals. Table 1 provides preliminary data we gathered to pilot the brief chart review instrument that will be used for evaluating changes in supportive care in the regional rollout. Data are from a randomly selected cohort of 150 patients who reached the alert threshold at the 2 pilot sites between November 13, 2013 and June 30, 2014. After removing 3 records with substantial missing data, we were able to find 146 matched patients at the remaining 19 KPNC hospitals during the same time period. Matched patients were selected from those patients who had a virtual alert based on retrospective data. Table 1 shows that, compared to the other KPNC hospitals, the quality of these 6 aspects of supportive care was better at the pilot sites.
| Hospital* | 1 | 2 | 1+2 combined | Remaining 19 | P (1) | P(2) | P(1+2) |
|---|---|---|---|---|---|---|---|
| |||||||
| N | 73 | 74 | 147 | 146 | |||
| Age (y) | 69.3 14.4 | 66.4 15.3 | 67.8 14.8 | 67.4 14.7 | 0.37 | 0.62 | 0.82 |
| Male (%) | 39 (53.4%) | 43 (58.1%) | 82 (55.8%) | 82 (56.2%) | 0.70 | 0.78 | 0.95 |
| Deterioration risk (%) | 20.0 14.3 | 17.4 11.6 | 18.7 13.0 | 18.8 13.6 | 0.54 | 0.44 | 0.94 |
| LAPS2 | 113 38 | 102 39 | 107 39 | 107 38 | 0.28 | 0.38 | 0.9 |
| COPS2 | 69 52 | 66 52 | 67 52 | 66 51 | 0.75 | 1.00 | 0.85 |
| Died (%)‖ | 17 (23.3%) | 15 (20.3%) | 32 (21.8%) | 24 (16.4%) | 0.22 | 0.48 | 0.25 |
| Agent identified prior | 28 (38.4%) | 18 (24.3%) | 46 (31.3%) | 21 (14.4%) | <0.001 | 0.07 | 0.001 |
| Agent identified after# | 46 (63.0%) | 39 (52.7%) | 85 (57.8%) | 28 (19.4%) | <0.001 | <0.001 | <0.001 |
| Updating within 24 hours** | 32 (43.8%) | 45 (60.8%) | 77 (52.4%) | 59 (40.4%) | 0.63 | 0.00 | 0.04 |
| Goals of care discussion | 20 (27.4%) | 37 (50.0%) | 57 (38.8%) | 32 (21.9%) | 0.37 | 0.001 | 0.002 |
| Palliative care consult | 19 (26.0%) | 49 (66.2%) | 68 (46.3%) | 35 (24.0%) | 0.74 | <0.001 | <0.001 |
| Spiritual support offered | 27 (37.0%) | 30 (40.5%) | 57 (38.8%) | 43 (29.4%) | 0.26 | 0.10 | 0.09 |
CONCLUSION
Although we continue to review our care processes, we feel that our overall effort has been successful. Nonetheless, it is important to consider a number of limitations to the generalizability of our approach. First, our work has taken place in the context of a highly integrated care delivery system where both information transfer as well as referral from the inpatient to the outpatient setting can occur easily. Second, because the pilot sites were among the first KPNC hospitals to begin implementing the Respecting Choices model, they undoubtedly had less ground to cover than hospitals beginning with less infrastructure. Third, because of resource limitations, our ability to capture process data is limited. Lastly, both sites were able to obtain resources to expand necessary coverage, which might not be possible in many settings.
In conclusion, we made a conscious decision to incorporate palliative care into the planning for the deployment of the alert system. Further, we made this decision explicit, informing all caregivers that providing palliative care that adheres to the Respecting Choices model would be essential. We have found that integration of the SCT, the EWS, and routine hospital operations can be achieved. Clinician and patient acceptance of the Respecting Choices component has been excellent. We consider 3 elements to be critical for this process, and these elements form an integral component of the expansion of the early warning system to the remaining 19 KPNC hospitals. The first is careful planning, which includes instructing RRT first responders on their role in the process of ensuring the respect of patient preferences. Second, having social workers available 24 hours a day/7 days a week as backup for busy hospitalists, is essential. Finally, as is described by Dummett et al.,[27] including reminders regarding patient preferences in the documentation process (by embedding it in an automated note template) is also very important.
Acknowledgements
The authors thank Dr. Michelle Caughey, Dr. Philip Madvig, Dr. Patricia Conolly, Ms. Barbara Crawford, and Ms. Melissa Stern for their administrative support, Dr. Tracy Lieu for reviewing the manuscript, and Ms. Rachel Lesser for formatting the manuscript.
Disclosures: This work was supported by a grant from the Gordon and Betty Moore Foundation (Early Detection, Prevention, and Mitigation of Impending Physiologic Deterioration in Hospitalized Patients Outside Intensive Care: Phase 3, pilot), The Permanente Medical Group, Inc., and Kaiser Foundation Hospitals, Inc. As part of our agreement with the Gordon and Betty Moore Foundation, we made a commitment to disseminate our findings in articles such as this one. However, the Foundation played no role in how we actually structured our articles, nor did they review or preapprove any of the manuscripts submitted as part of the dissemination component. None of the other sponsors had any involvement in our decision to submit this manuscript or in the determination of its contents. None of the authors have any conflicts of interest to declare of relevance to this work.
APPENDIX 1
Key measures to assess the quality of supportive care extracted by manual chart review
| Chart review question | Outcome desired | Outcome measured | Rationale for selecting this outcome |
Was the patient's decision‐maker documented following the alert? If yes: Time/date of documentation. | Timely identification and documentation of the patient's decision‐maker immediately following the alert | Whether the patient's decision‐maker was clearly identified and documented by a member of the treatment team (nurse, physician, and/or rapid response team) following the alert. This outcome is measured independently of whether the patient's decision‐maker was already documented prior to the alert. | Clear documentation facilitates the notification of a patient's family/decision‐maker in a timely manner to enhance communication and clinical decision‐making to make sure that the patient's wishes and preferences are honored. |
Was the patient's decision‐maker/family notified or was there an attempt to notify the patient's decision‐maker regarding the changes in the patient's condition following the alert? If yes: Time/date of notification/attempted contact. | Providing patient's family members/decision‐maker with an update in the patient's clinical condition following the alert | Whether the medical team notified or attempted to contact the patient's family/decision‐maker to provide an update in the patient's clinical condition following the alert. | Providing timely updates when a patient's clinical status changes enhances communication and helps to proactively involve patients and families in the decision‐making process. |
Was there a goals of care discussion following the alert? If yes: Time/date of discussion | To clarify and to honor individual patient's goals of care | Whether a goals of care discussion was initiated after the alert was issued. Criteria for Goals of Care discussion included any/all of the following:
| Goals of care discussions actively involve patients and families in the decision‐making process to ensure that their wishes and preferences are clearly documented and followed. |
| Was there a palliative care consultation during the patient's hospitalization? | To provide comprehensive supportive care to patients and their families/loved ones. | Whether palliative care was consulted during the patient's hospitalization | The palliative care team plays an important role in helping patients/families make decisions, providing support, and ensuring that patients symptoms are addressed and properly managed |
| Was spiritual support offered to the patient and/or their family/loved during the patient's hospitalization? | To offer and to provide spiritual support to patients and their families/loved ones | Whether the patient/family was offered spiritual support during the patient's hospitalization | Spiritual support has been recognized as an important aspect of quality EOL care |
APPENDIX 2
Respecting Choices, A Staged Approach to Advance Care Planning
Respecting Choices is a staged approach to advance care planning, where conversations begin when people are healthy and continue to occur throughout life.
Our Life Care Planning service consists ofthree distinct steps.
- My Values: First Steps is appropriate for all adults, but should definitely be initiated as a component of routine healthcare for those over the age of 55. The goals of First Steps are to motivate individuals to learn more about the importance of Life Care Planning, select a healthcare decision maker, and complete a basic written advance directive.
- My Choices: Next Steps is for patients with chronic, progressive illness who have begun to experience a decline in functional status or frequent hospitalizations. The goals of this stage of planning are to assist patients in understanding a) the progression of their illness, b) potential complications, and c) specific life‐sustaining treatments that may be required if their illness progresses. Understanding life‐sustaining treatments includes each treatment's benefits, burdens, and alternatives. With this understanding members will be better able to express what situations (e.g. complications or bad outcomes) would cause them to want to change their plan of care.Additionally, the individual's healthcare agent(s) and other loved ones are involved in the planning process so that they can be prepared to make decisions, if necessary, and to support the plan of care developed.
- My Care: Advanced Steps is intended for frail elders or others whose death in the next 12 months would not be surprising. It helps patients and their agent make specific and timely life‐sustaining treatment decisions that can be converted to medical orders to guide the actions of healthcare providers and be consistent with the goals of the individual.
(Reference:
APPENDIX 3
Pilot site Palliative Care Referral Criteria
Automatic palliative care consults for adults at Sacramento site are as follows:
- 30 day readmits or >3 ED or acute readmissions in past year for CHF or COPD that have no Advance Directive and are not followed by Chronic Care Management
- Aspiration
- CVA with poor prognosis for regaining independence
- Hip fracture patients not weight bearing on post‐operative day 2
- Code blue survivor
- Skilled Nursing Facility resident with sepsis and or dementia
- Active hospice patients
- Sepsis patients with 10 or more ICD codes in the problem list
Potential palliative care consults for adults at Sacramento pilot site are as follows:
- Morbid obesity complicated by organ damage (e.g., congestive heart failure, refractory liver disease, chronic renal disease)
- Severe chronic kidney disease and/or congestive heart failure with poor functional status (chair or bed bound)
- Patient with pre‐operative arteriovenous fistulas and poor functional status, congestive heart failure, or age>80
- End stage liver disease with declining functional status, poor odds of transplant
- Institute of Medicine of the National Academies. Dying in America: Improving Quality and Honoring Individual Preferences Near the End of Life. Washington, DC: Institute of Medicine of the National Academies; 2014.
- . Final chapter: Californians' attitudes and experiences with death and dying. California HealthCare Foundation website. Available at: http://www.chcf.org/publications/2012/02/final‐chapter‐death‐dying. Published February 2012. Accessed July 14, 2015.
- , . Predicting outcome of inhospital cardiopulmonary resuscitation. Crit Care Med. 1988;16(6):583–586.
- , , , , . The medical emergency team: a new strategy to identify and intervene in high‐risk surgical patients. Clin Intensive Care. 1995;6:269–272.
- , , . Rapid response teams—walk, don't run. JAMA. 2006;296(13):1645–1647.
- , , , , , . Rapid response systems: a systematic review. Crit Care Med. 2007;35(5):1238–1243.
- , . Rethinking rapid response teams. JAMA. 2010;304(12):1375–1376.
- , , , , , . The medical emergency team and end‐of‐life care: a pilot study. Crit Care Resusc. 2007;9(2):151–156.
- , , , , . The Medical Emergency Team System and not‐for‐resuscitation orders: results from the MERIT study. Resuscitation. 2008;79(3):391–397.
- , , , , , . Enhanced end‐of‐life care associated with deploying a rapid response team: a pilot study. J Hosp Med. 2009;4(7):449–452.
- , , , . A retrospective cohort study of the effect of medical emergency teams on documentation of advance care directives. Crit Care Resusc. 2011;13(3):167–174.
- , , , . Rapid response team calls to patients with a pre‐existing not for resuscitation order. Resuscitation. 2013;84(8):1035–1039.
- , , , et al. Changes in end of life care 5 years after the introduction of a rapid response team: a multicentre retrospective study. Resuscitation. 2013;84(10):1339–1344.
- , , , , . The medical emergency team call: a sentinel event that triggers goals of care discussion. Crit Care Med. 2014;42(2):322–327.
- , , , . Documentation of limitation of medical therapy at the time of a rapid response team call. Aust Health Rev. 2014;38(2):218–222.
- , , , et al. Medical emergency response in a sub‐acute hospital: improving the model of care for deteriorating patients. Aust Health Rev. 2014;38(2):169–176.
- Respecting Choices advance care planning. Available at: http://www.gundersenhealth.org/respecting‐choices. Gundersen Health System website. Accessed March 28, 2015.
- , . Early detection, prevention, and mitigation of critical illness outside intensive care settings. J Hosp Med. 2016;11:000–000.
- , , , , , . The Improvement Guide: A Practical Approach to Enhancing Organizational Performance. 2nd ed. San Francisco, CA: Jossey‐Bass; 2009.
- , , , , . Understanding the components of quality improvement collaboratives: a systematic literature review. Milbank Q. 2013;91(2):354–394.
- , , , et al. Piloting electronic medical record-based early detection of inpatient deterioration in community hospitals. J Hosp Med. 2016;11:000–000.
- , , , , . Risk‐adjusting hospital mortality using a comprehensive electronic record in an integrated healthcare delivery system. Med Care. 2013;51(5):446–453.
- Department of Health and Human Services. Palliative care and end‐of‐life care—a consensus report. National Quality Forum website. Available at: http://www.qualityforum.org/projects/palliative_care_and_end‐of‐life_care.aspx. Accessed April 1, 2015.
- , . Comparison of multivariate matching methods: structures, distances, and algorithms. J Comput Graph Stat. 1993;2(4):405–420.
- , , . A method/macro based on propensity score and Mahalanobis distance to reduce bias in treatment comparison in observational study: Eli Lilly working paper. Available at: http://www.lexjansen.com/pharmasug/2006/publichealthresearch/pr05.pdf. Accessed January 24, 2013.
- . Matching methods for causal inference: a review and a look forward. Stat Sci. 2010;25(1):1–21.
- , , , , , . Incorporating an early detection system into routine clinical practice in two community hospitals. J Hosp Med. 2016;11:000–000.
© 2016 Society of Hospital Medicine
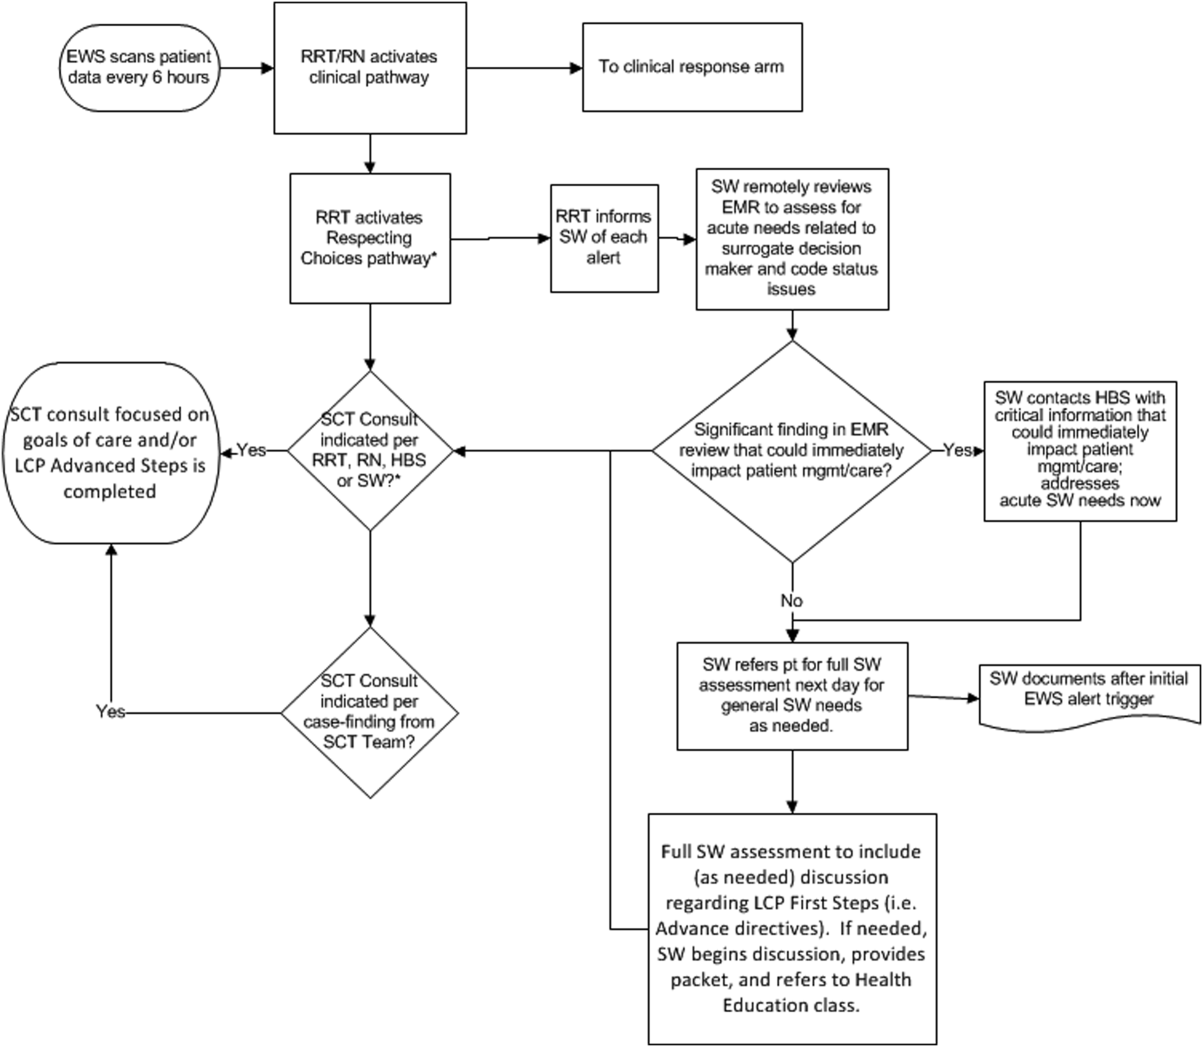
Detection of Physiologic Deterioration
Patients in general medicalsurgical wards who experience unplanned transfer to the intensive care unit (ICU) have increased mortality and morbidity.13 Using an externally validated methodology permitting assessment of illness severity and mortality risk among all hospitalized patients,4, 5 we recently documented observed‐to‐expected mortality ratios >3.0 and excess length of stay of 10 days among patients who experienced such transfers.6
It is possible to predict adverse outcomes among monitored patients (eg, patients in the ICU or undergoing continuous electronic monitoring).7, 8 However, prediction of unplanned transfers among medicalsurgical ward patients presents challenges. Data collection (vital signs and laboratory tests) is relatively infrequent. The event rate (3% of hospital admissions) is low, and the rate in narrow time periods (eg, 12 hours) is extremely low: a hospital with 4000 admissions per year might experience 1 unplanned transfer to the ICU every 3 days. Not surprisingly, performance of models suitable for predicting ward patients' need for intensive care within narrow time frames have been disappointing.9 The Modified Early Warning Score (MEWS), has a c‐statistic, or area under the receiver operator characteristic of 0.67,1012 and our own model incorporating 14 laboratory tests, but no vital signs, has excellent performance with respect to predicting inpatient mortality, but poor performance with respect to unplanned transfer.6
In this report, we describe the development and validation of a complex predictive model suitable for use with ward patients. Our objective for this work was to develop a predictive model based on clinical and physiologic data available in real time from a comprehensive electronic medical record (EMR), not a clinically intuitive, manually assigned tool. The outcome of interest was unplanned transfer from the ward to the ICU, or death on the ward in a patient who was full code. This model has been developed as part of a regional effort to decrease preventable mortality in the Northern California Kaiser Permanente Medical Care Program (KPMCP), an integrated healthcare delivery system with 22 hospitals.
MATERIALS AND METHODS
For additional details, see the Supporting Information, Appendices 112, in the online version of this article.
This project was approved by the KPMCP Institutional Board for the Protection of Human Subjects.
The Northern California KPMCP serves a total population of approximately 3.3 million members. All Northern California KPMCP hospitals and clinics employ the same information systems with a common medical record number and can track care covered by the plan but delivered elsewhere. Databases maintained by the KPMCP capture admission and discharge times, admission and discharge diagnoses and procedures (assigned by professional coders), bed histories permitting quantification of intra‐hospital transfers, inter‐hospital transfers, as well as the results of all inpatient and outpatient laboratory tests. In July 2006, the KPMCP began deployment of the EMR developed by Epic Systems Corporation (
Our setting consisted of 14 hospitals in which the KPHC inpatient EMR had been running for at least 3 months (the KPMCP Antioch, Fremont, Hayward, Manteca, Modesto, Roseville, Sacramento, Santa Clara, San Francisco, Santa Rosa, South Sacramento, South San Francisco, Santa Teresa, and Walnut Creek hospitals). We have described the general characteristics of KPMCP hospitals elsewhere.4, 6 Our initial study population consisted of all patients admitted to these hospitals who met the following criteria: hospitalization began from November 1, 2006 through December 31, 2009; initial hospitalization occurred at a Northern California KPMCP hospital (ie, for inter‐hospital transfers, the first hospital stay occurred within the KPMCP); age 18 years; hospitalization was not for childbirth; and KPHC had been operational at the hospital for at least 3 months.
Analytic Approach
The primary outcome for this study was transfer to the ICU after admission to the hospital among patients residing either in a general medicalsurgical ward (ward) or transitional care unit (TCU), or death in the ward or TCU in a patient who was full code at the time of death (ie, had the patient survived, s/he would have been transferred to the ICU). The unit of analysis for this study was a 12‐hour patient shift, which could begin with a 7 AM T0 (henceforth, day shift) or a 7 PM T0 (night shift); in other words, we aimed to predict the occurrence of an event within 12 hours of T0 using only data available prior to T0. A shift in which a patient experienced the primary study outcome is an event shift, while one in which a patient did not experience the primary outcome is a comparison shift. Using this approach, an individual patient record could consist of both event and comparison shifts, since some patients might have multiple unplanned transfers and some patients might have none. Our basic analytic approach consisted of creating a cohort of event and comparison shifts (10 comparison shifts were randomly selected for each event shift), splitting the cohort into a derivation dataset (50%) and validation dataset (50%), developing a model using the derivation dataset, then applying the coefficients of the derivation dataset to the validation dataset. Because some event shifts were excluded due to the minimum 4‐hour length‐of‐stay requirement, we also applied model coefficients to these excluded shifts and a set of randomly selected comparison shifts.
Since the purpose of these analyses was to develop models with maximal signal extraction from sparsely collected predictors, we did not block a time period after the T0 to allow for a reaction time to the alarm. Thus, since some events could occur immediately after the T0 (as can be seen in the Supporting Information, Appendices, in the online version of this article), our models would need to be run at intervals that are more frequent than 2 times a day.
Independent Variables
In addition to patients' age and sex, we tested the following candidate independent variables. Some of these variables are part of the KPMCP risk adjustment model4, 5 and were available electronically for all patients in the cohort. We grouped admission diagnoses into 44 broad diagnostic categories (primary conditions), and admission types into 4 groups (emergency medical, emergency surgical, elective medical, and elective surgical). We quantified patients' degree of physiologic derangement in the 72 hours preceding hospitalization with a Laboratory‐based Acute Physiology Score (LAPS) using 14 laboratory test results prior to hospitalization; we also tested individual laboratory test results obtained after admission to the hospital. We quantified patients' comorbid illness burden using a COmorbidity Point Score (COPS) based on patients' preexisting diagnoses over the 12‐month period preceding hospitalization.4 We extracted temperature, heart rate, respiratory rate, systolic blood pressure, diastolic blood pressure, oxygen saturation, and neurological status from the EMR. We also tested the following variables based on specific information extracted from the EMR: shock index (heart rate divided by systolic blood pressure)13; care directive status (patients were placed into 4 groups: full code, partial code, do not resuscitate [DNR], and no care directive in place); and a proxy for measured lactate (PML; anion gap/serum bicarbonate 100).1416 For comparison purposes, we also created a retrospective electronically assigned MEWS, which we refer to as the MEWS(re), and we assigned this score to patient records electronically using data from KP HealthConnect.
Statistical Methods
Analyses were performed in SAS 9.1, Stata 10, and R 2.12. Final validation was performed using SAS (SAS Institute Inc., Carey, North Carolina). Since we did not limit ourselves to traditional severity‐scoring approaches (eg, selecting the worst heart rate in a given time interval), but also included trend terms (eg, change in heart rate over the 24 hours preceding T0), the number of potential variables to test was very large. Detailed description of the statistical strategies employed for variable selection is provided in the Supporting Information, Appendices, in the online version of this article. Once variables were selected, our basic approach was to test a series of diagnosis‐specific logistic regression submodels using a variety of predictors that included vital signs, vital signs trends (eg, most recent heart rate minus earliest heart rate, heart rate over preceding 24 hours), and other above‐mentioned variables.
We assessed the ability of a submodel to correctly distinguish patients who died, from survivors, using the c‐statistic, as well as other metrics recommended by Cook.17 At the end of the modeling process, we pooled the results across all submodels. For vital signs, where the rate of missing data was <3%, we tested submodels in which we dropped shifts with missing data, as well as submodels in which we imputed missing vital signs to a normal value. For laboratory data, where the rate of missing data for a given shift was much greater, we employed a probabilistic imputation method that included consideration of when a laboratory test result became available.
RESULTS
During the study period, a total of 102,488 patients experienced 145,335 hospitalizations at the study hospitals. We removed 66 patients with 138 hospitalizations for data quality reasons, leaving us with our initial study sample of 102,422 patients whose characteristics are summarized in Table 1. Table 1, in which the unit of analysis is an individual patient, shows that patients who experienced the primary outcome were similar to those patients described in our previous report, in terms of their characteristics on admission as well as in experiencing excess morbidity and mortality.6
| Never Admitted to ICU | Direct Admit to ICU From ED | Unplanned Transfer to ICU* | Other ICU Admission | |
|---|---|---|---|---|
| ||||
| N | 89,269 | 5963 | 2880 | 4310 |
| Age (mean SD) | 61.26 18.62 | 62.25 18.13 | 66.12 16.20 | 64.45 15.91 |
| Male (n, %) | 37,228 (41.70%) | 3091 (51.84%) | 1416 (49.17%) | 2378 (55.17%) |
| LAPS (mean SD) | 13.02 15.79 | 32.72 24.85 | 24.83 21.53 | 11.79 18.16 |
| COPS(mean SD) | 67.25 51.42 | 73.88 57.42 | 86.33 59.33 | 78.44 52.49 |
| % Predicted mortality risk (mean SD) | 1.93% 3.98% | 7.69% 12.59% | 5.23% 7.70% | 3.66% 6.81% |
| Survived first hospitalization to discharge∥ | 88,479 (99.12%) | 5336 (89.49%) | 2316 (80.42%) | 4063 (94.27%) |
| Care order on admission | ||||
| Full code | 78,877 (88.36%) | 5198 (87.17%) | 2598 (90.21%) | 4097 (95.06%) |
| Partial code | 664 (0.74%) | 156 (2.62%) | 50 (1.74%) | 27 (0.63%) |
| Comfort care | 21 (0.02%) | 2 (0.03%) | 0 (0%) | 0 (0%) |
| DNR | 8227 (9.22%) | 539 (9.04%) | 219 (7.60%) | 161 (3.74%) |
| Comfort care and DNR | 229 (0.26%) | 9 (0.15%) | 2 (0.07%) | 2 (0.05%) |
| No order | 1251 (1.40%) | 59 (0.99%) | 11 (0.38%) | 23 (0.53%) |
| Admission diagnosis (n, %) | ||||
| Pneumonia | 2385 (2.67%) | 258 (4.33%) | 242 (8.40%) | 68 (1.58%) |
| Sepsis | 5822 (6.52%) | 503 (8.44%) | 279 (9.69%) | 169 (3.92%) |
| GI bleeding | 9938 (11.13%) | 616 (10.33%) | 333 (11.56%) | 290 (6.73%) |
| Cancer | 2845 (3.19%) | 14 (0.23%) | 95 (3.30%) | 492 (11.42%) |
| Total hospital length of stay (days SD) | 3.08 3.29 | 5.37 7.50 | 12.16 13.12 | 8.06 9.53 |
Figure 1shows how we developed the analysis cohort, by removing patients with a comfort‐care‐only order placed within 4 hours after admission (369 patients/744 hospitalizations) and patients who were never admitted to the ward or TCU (7,220/10,574). This left a cohort consisting of 94,833 patients who experienced 133,879 hospitalizations spanning a total of 1,079,062 shifts. We then removed shifts where: 1) a patient was not on the ward at the start of a shift, or was on the ward for <4 hours of a shift; 2) the patient had a comfort‐care order in place at the start of the shift; and 3) the patient died and was ineligible to be a case (the patient had a DNR order in place or died in the ICU). The final cohort eligible for sampling consisted of 846,907 shifts, which involved a total of 92,797 patients and 130,627 hospitalizations. There were a total of 4,036 event shifts, which included 3,224 where a patient was transferred from the ward to the ICU, 717 from the TCU to the ICU, and 95 where a patient died on the ward or TCU without a DNR order in place. We then randomly selected 39,782 comparison shifts. Thus, our final cohort for analysis included 4,036 event shifts (1,979 derivation/2,057 validation and 39,782 comparison shifts (19,509/20,273). As a secondary validation, we also applied model coefficients to the 429 event shifts excluded due to the <4‐hour length‐of‐stay requirement.
Table 2 compares event shifts with comparison shifts. In the 24 hours preceding ICU transfer, patients who were subsequently transferred had statistically significant, but not necessarily clinically significant, differences in terms of these variables. However, missing laboratory data were more common, ranging from 18% to 31% of all shifts (we did not incorporate laboratory tests where 35% of the shifts had missing data for that test).
| Predictor | Event Shifts | Comparison Shifts | P |
|---|---|---|---|
| |||
| Number | 4036 | 39,782 | |
| Age (mean SD) | 67.19 15.25 | 65.41 17.40 | <0.001 |
| Male (n, %) | 2007 (49.73%) | 17,709 (44.52%) | <0.001 |
| Day shift | 1364 (33.80%) | 17,714 (44.53%) | <0.001 |
| LAPS* | 27.89 22.10 | 20.49 20.16 | <0.001 |
| COPS | 116.33 72.31 | 100.81 68.44 | <0.001 |
| Full code (n, %) | 3496 (86.2%) | 32,156 (80.8%) | <0.001 |
| ICU shift during hospitalization | 3964 (98.22%) | 7197 (18.09%) | <0.001 |
| Unplanned transfer to ICU during hospitalization∥ | 353 (8.8%) | 1466 (3.7%) | <0.001 |
| Temperature (mean SD) | 98.15 (1.13) | 98.10 (0.85) | 0.009 |
| Heart rate (mean SD) | 90.30 (20.48) | 79.86 (5.27) | <0.001 |
| Respiratory rate (mean SD) | 20.36 (3.70) | 18.87 (1.79) | <0.001 |
| Systolic blood pressure (mean SD) | 123.65 (23.26) | 126.21 (19.88) | <0.001 |
| Diastolic blood pressure (mean SD) | 68.38 (14.49) | 69.46 (11.95) | <0.001 |
| Oxygen saturation (mean SD) | 95.72% (3.00) | 96.47 % (2.26) | <0.001 |
| MEWS(re) (mean SD) | 3.64 (2.02) | 2.34 (1.61) | <0.001 |
| % <5 | 74.86% | 92.79% | |
| % 5 | 25.14% | 7.21% | <0.001 |
| Proxy for measured lactate# (mean SD) | 36.85 (28.24) | 28.73 (16.74) | <0.001 |
| % Missing in 24 hr before start of shift** | 17.91% | 28.78% | <0.001 |
| Blood urea nitrogen (mean SD) | 32.03 (25.39) | 22.72 (18.9) | <0.001 |
| % Missing in 24 hr before start of shift | 19.67% | 20.90% | <0.001 |
| White blood cell count 1000 (mean SD) | 12.33 (11.42) | 9.83 (6.58) | <0.001 |
| % Missing in 24 hr before start of shift | 21.43% | 30.98% | <0.001 |
| Hematocrit (mean SD) | 33.08 (6.28) | 33.07 (5.25) | 0.978 |
| % Missing in 24 hr before start of shift | 19.87% | 29.55% | <0.001 |
After conducting multiple analyses using the derivation dataset, we developed 24 submodels, a compromise between our finding that primary‐condition‐specific models showed better performance and the fact that we had very few events among patients with certain primary conditions (eg, pericarditis/valvular heart disease), which forced us to create composite categories (eg, a category pooling patients with pericarditis, atherosclerosis, and peripheral vascular disease). Table 3 lists variables included in our final submodels.
| Variable | Description |
|---|---|
| |
| Directive status | Full code or not full code |
| LAPS* | Admission physiologic severity of illness score (continuous variable ranging from 0 to 256). Standardized and included as LAPS and LAPS squared |
| COPS | Comorbidity burden score (continuous variable ranging from 0 to 701). Standardized and included as COPS and COPS squared. |
| COPS status | Indicator for absent comorbidity data |
| LOS at T0 | Length of stay in the hospital (total time in hours) at the T0; standardized. |
| T0 time of day | 7 AM or 7 PM |
| Temperature | Worst (highest) temperature in 24 hr preceding T0; variability in temperature in 24 hr preceding T0. |
| Heart rate | Most recent heart rate in 24 hr preceding T0; variability in heart rate in 24 hr preceding T0. |
| Respiratory rate | Most recent respiratory rate in 24 hr preceding T0; worst (highest) respiratory rate in 24 hr preceding T0; variability in respiratory rate in 24 hr preceding T0. |
| Diastolic blood pressure | Most recent diastolic blood pressure in 24 hr preceding T0 transformed by subtracting 70 from the actual value and squaring the result. Any value above 2000 is subsequently then set to 2000, yielding a continuous variable ranging from 0 to 2000. |
| Systolic pressure | Variability in systolic blood pressure in 24 hr preceding T0. |
| Pulse oximetry | Worst (lowest) oxygen saturation in 24 hr preceding T0; variability in oxygen saturation in 24 hr preceding T0. |
| Neurological status | Most recent neurological status check in 24 hr preceding T0. |
| Laboratory tests | Blood urea nitrogen |
| Proxy for measured lactate = (anion gap serum bicarbonate) 100 | |
| Hematocrit | |
| Total white blood cell count | |
Table 4 summarizes key results in the validation dataset. Across all diagnoses, the MEWS(re) had c‐statistic of 0.709 (95% confidence interval, 0.6970.721) in the derivation dataset and 0.698 (0.6860.710) in the validation dataset. In the validation dataset, the MEWS(re) performed best among patients with a set of gastrointestinal diagnoses (c = 0.792; 0.7260.857) and worst among patients with congestive heart failure (0.541; 0.5000.620). In contrast, across all primary conditions, the EMR‐based models had a c‐statistic of 0.845 (0.8260.863) in the derivation dataset and 0.775 (0.7530.797) in the validation dataset. In the validation dataset, the EMR‐based models also performed best among patients with a set of gastrointestinal diagnoses (0.841; 0.7830.897) and worst among patients with congestive heart failure (0.683; 0.6100.755). A negative correlation (R = 0.63) was evident between the number of event shifts in a submodel and the drop in the c‐statistic seen in the validation dataset.
| No. of Shifts in Validation Dataset | c‐Statistic | |||
|---|---|---|---|---|
| Diagnoses Group* | Event | Comparison | MEWS(re) | EMR Model |
| ||||
| Acute myocardial infarction | 36 | 169 | 0.541 | 0.572 |
| Diseases of pulmonary circulation and cardiac dysrhythmias | 40 | 329 | 0.565 | 0.645 |
| Seizure disorders | 45 | 497 | 0.594 | 0.647 |
| Rule out myocardial infarction | 77 | 727 | 0.602 | 0.648 |
| Pneumonia | 163 | 847 | 0.741 | 0.801 |
| GI diagnoses, set A | 58 | 942 | 0.755 | 0.803 |
| GI diagnoses, set B∥ | 256 | 2,610 | 0.772 | 0.806 |
| GI diagnoses, set C | 46 | 520 | 0.792 | 0.841 |
| All diagnosis | 2,032 | 20,106 | 0.698 | 0.775 |
We also compared model performance when our datasets were restricted to 1 randomly selected observation per patient; in these analyses, the total number of event shifts was 3,647 and the number of comparison shifts was 29,052. The c‐statistic for the MEWS(re) in the derivation dataset was 0.709 (0.6940.725); in the validation dataset, it was 0.698 (0.6920.714). The corresponding values for the EMR‐based models were 0.856 (0.8350.877) and 0.780 (0.7560.804). We also tested models in which, instead of dropping shifts with missing vital signs, we imputed missing vital signs to their normal value. The c‐statistic for the EMR‐based model with imputed vital sign values was 0.842 (0.8230.861) in the derivation dataset and 0.773 (0.7520.794) in the validation dataset. Lastly, we applied model coefficients to a dataset consisting of 4,290 randomly selected comparison shifts plus the 429 shifts excluded because of the 4‐hour length‐of‐stay criterion. The c‐statistic for this analysis was 0.756 (0.7030.809).
As a general rule, the EMR‐based models were more than twice as efficient as the MEWS(re). For example, a MEWS(re) threshold of 6 as the trigger for an alarm would identify 15% of all transfers to the ICU, with 34.4 false alarms for each transfer; in contrast, using the EMR‐based approach to identify 15% of all transfers, there were 14.5 false alarms for each transfer. Applied to the entire KPMCP Northern California Region, using the MEWS(re), a total of 52 patients per day would need to be evaluated, but only 22 per day using the EMR‐based approach. If one employed a MEWS(re) threshold of 4, this would lead to identification of 44% of all transfers, with a ratio of 69 false alarms for each transfer; using the EMR, the ratio would be 34 to 1. Across the entire KPMCP, a total of 276 patients per day (or about 19.5 a day per hospital) would need to be evaluated using the MEWS(re), but only 136 (or about 9.5 per hospital per day) using the EMR.
DISCUSSION
Using data from a large hospital cohort, we have developed a predictive model suitable for use in non‐ICU populations cared for in integrated healthcare settings with fully automated EMRs. The overall performance of our model, which incorporates acute physiology, diagnosis, and longitudinal data, is superior to the predictive ability of a model that can be assigned manually. This is not surprising, given that scoring systems such as the MEWS make an explicit tradeoff losing information found in multiple variables in exchange for ease of manual assignment. Currently, the model described in this report is being implemented in a simulated environment, a final safety test prior to piloting real‐time provision of probability estimates to clinicians and nurses. Though not yet ready for real‐time use, it is reasonable for our model to be tested using the KPHC shadow server, since evaluation in a simulated environment constitutes a critical evaluation step prior to deployment for clinical use. We also anticipate further refinement and revalidation to occur as more inpatient data become available in the KPMCP and elsewhere.
A number of limitations to our approach must be emphasized. In developing our models, we determined that, while modeling by clinical condition was important, the study outcome was rare for some primary conditions. In these diagnostic groups, which accounted for 12.5% of the event shifts and 10.6% of the comparison shifts, the c‐statistic in the validation dataset was <0.70. Since all 22 KPMCP hospitals are now online and will generate an additional 150,000 adult hospitalizations per year, we expect to be able to correct this problem prior to deployment of these models for clinical use. Having additional data will permit us to improve model discrimination and thus decrease the evaluation‐to‐detection ratio. In future iterations of these models, more experimentation with grouping of International Classification of Diseases (ICD) codes may be required. The problem of grouping ICD codes is not an easy one to resolve, in that diagnoses in the grouping must share common pathophysiology while having a grouping with a sufficient number of adverse events for stable statistical models.
Ideally, it would have been desirable to employ a more objective measure of deterioration, since the decision to transfer a patient to the ICU is discretionary. However, we have found that key data points needed to define such a measure (eg, vital signs) are not consistently charted when a patient deterioratesthis is not surprising outside the research setting, given that nurses and physicians involved in a transfer may be focusing on caring for the patient rather than immediately charting. Given the complexities of end‐of‐life‐care decision‐making, we could not employ death as the outcome of interest. A related issue is that our model does not differentiate between reasons for needing transfer to the ICU, an issue recently discussed by Bapoje et al.18
Our model does not address an important issue raised by Bapoje et al18 and Litvak, Pronovost, and others,19, 20 namely, whether a patient should have been admitted to a non‐ICU setting in the first place. Our team is currently developing a model for doing exactly this (providing decision support for triage in the emergency department), but discussion of this methodology is outside the scope of this article.
Because of resource and data limitations, our model also does not include newborns, children, women admitted for childbirth, or patients transferred from non‐KPMCP hospitals. However, the approach described here could serve as a starting point for developing models for these other populations.
The generalizability of our model must also be considered. The Northern California KPMCP is unusual in having large electronic databases that include physiologic as well as longitudinal patient data. Many hospitals cannot take advantage of all the methods described here. However, the methods we employed could be modified for use by hospital systems in countries such as Great Britain and Canada, and entities such as the Veterans Administration Hospital System in the United States. The KPMCP population, an insured population with few barriers to access, is healthier than the general population, and some population subsets are underrepresented in our cohort. Practice patterns may also vary. Nonetheless, the model described here could serve as a good starting point for future collaborative studies, and it would be possible to develop models suitable for use by stand‐alone hospitals (eg, recalibrating so that one used a Charlson comorbidity21 score based on present on‐admission codes rather than the COPS).
The need for early detection of patient deterioration has played a major role in the development of rapid response teams, as well as scores such as the MEWS. In particular, entities such as the Institute for Healthcare Improvement have advocated the use of early warning systems.22 However, having a statistically robust model to support an early warning system is only part of the solution, and a number of new challenges must then be addressed. The first is actual electronic deployment. Existing inpatient EMRs were not designed with complex calculations in mind, and we anticipate that some degradation in performance will occur when we test our models using real‐time data capture. As Bapoje et al point out, simply having an alert may be insufficient, since not all transfers are preventable.18 Early warning systems also raise ethical issues (for example, what should be done if an alert leads a clinician to confront the fact that an end‐of‐life‐care discussion needs to occur?). From a research perspective, if one were to formally test the benefits of such models, it would be critical to define outcome measures other than death (which is strongly affected by end‐of‐life‐care decisions) or ICU transfer (which is often desirable).
In conclusion, we have developed an approach for predicting impending physiologic deterioration of hospitalized adults outside the ICU. Our approach illustrates how organizations can take maximal advantage of EMRs in a manner that exceeds meaningful use specifications.23, 24 Our study highlights the possibility of using fully automated EMR data for building and applying sophisticated statistical models in settings other than the highly monitored ICU without the need for additional equipment. It also expands the universe of severity scoring to one in which probability estimates are provided in real time and throughout an entire hospitalization. Model performance will undoubtedly improve over time, as more patient data become available. Although our approach has important limitations, it is suitable for testing using real‐time data in a simulated environment. Such testing would permit identification of unanticipated problems and quantification of the degradation of model performance due to real life factors, such as delays in vital signs charting or EMR system brownouts. It could also serve as the springboard for future collaborative studies, with a broader population base, in which the EMR becomes a tool for care, not just documentation.
Acknowledgements
We thank Ms Marla Gardner and Mr John Greene for their work in the development phase of this project. We are grateful to Brian Hoberman, Andrew Hwang, and Marc Flagg from the RIMS group; to Colin Stobbs, Sriram Thiruvenkatachari, and Sundeep Sood from KP IT, Inc; and to Dennis Andaya, Linda Gliner, and Cyndi Vasallo for their assistance with data‐quality audits. We are also grateful to Dr Philip Madvig, Dr Paul Feigenbaum, Dr Alan Whippy, Mr Gregory Adams, Ms Barbara Crawford, and Dr Marybeth Sharpe for their administrative support and encouragement; and to Dr Alan S. Go, Acting Director of the Kaiser Permanente Division of Research, for reviewing the manuscript.
- ,,,.Day of the week of intensive care admission and patient outcomes: a multisite regional evaluation.Med Care.2002;40(6):530–539.
- ,,, et al.The hospital mortality of patients admitted to the ICU on weekends.Chest.2004;126(4):1292–1298.
- ,,, et al.Mortality among patients admitted to intensive care units during weekday day shifts compared with “off” hours.Crit Care Med.2007;35(1):3–11.
- ,,,,,.Risk adjusting hospital inpatient mortality using automated inpatient, outpatient, and laboratory databases.Med Care.2008;46(3):232–239.
- ,,,.The Kaiser Permanente inpatient risk adjustment methodology was valid in an external patient population.J Clin Epidemiol.2010;63(7):798–803.
- ,,,,,.Intra‐hospital transfers to a higher level of care: contribution to total hospital and intensive care unit (ICU) mortality and length of stay (LOS).J Hosp Med.2011;6(2):74–80.
- ,,,,,.Multicentric study of monitoring alarms in the adult intensive care unit (ICU): a descriptive analysis.Intensive Care Med.1999;25(12):1360–1366.
- ,,,,.Integration of early physiological responses predicts later illness severity in preterm infants.Sci Transl Med.2010;2(48):48ra65.
- ,,.Reproducibility of physiological track‐and‐trigger warning systems for identifying at‐risk patients on the ward.Intensive Care Med.2007;33(4):619–624.
- ,,,.Validation of a Modified Early Warning Score in medical admissions.Q J Med.2001;94:521–526.
- ,,,,.Effect of introducing the Modified Early Warning score on clinical outcomes, cardio‐pulmonary arrests and intensive care utilisation in acute medical admissions.Anaesthesia.2003;58(8):797–802.
- MERIT Study Investigators.Introduction of the medical emergency team (MET) system: a cluster‐randomized controlled trial.Lancet.2005;365(9477):2091–2097.
- ,,,,,.Unplanned transfers to the intensive care unit: the role of the shock index.J Hosp Med.2010;5(8):460–465.
- .The delta (delta) gap: an approach to mixed acid‐base disorders.Ann Emerg Med.1990;19(11):1310–1313.
- .Acid‐base disorders: classification and management strategies.Am Fam Physician.1995;52(2):584–590.
- ,,,.Unmeasured anions in critically ill patients: can they predict mortality?Crit Care Med.2003;31(8):2131–2136.
- .Use and misuse of the receiver operating characteristic curve in risk prediction.Circulation.2007;115(7):928–935.
- ,,,.Unplanned transfers to a medical intensive care unit: causes and relationship to preventable errors in care.J Hosp Med.2011;6(2):68–72.
- ,.Rethinking rapid response teams.JAMA.2010;304(12):1375–1376.
- ,,.Rapid response teams—walk, don't run.JAMA.2006;296(13):1645–1647.
- ,,,.A new method of classifying prognostic comorbidity in longitudinal populations: development and validation.J Chronic Dis.1987;40:373–383.
- Institute for Healthcare Improvement.Early Warning Systems:The Next Level of Rapid Response.2011. http://www.ihi.org/IHI/Programs/AudioAndWebPrograms/ExpeditionEarlyWarningSystemsTheNextLevelofRapidResponse.htm?player=wmp. Accessed 4/6/11.
- .Assessing readiness for meeting meaningful use: identifying electronic health record functionality and measuring levels of adoption.AMIA Annu Symp Proc.2010;2010:66–70.
- Medicare and Medicaid Programs;Electronic Health Record Incentive Program. Final Rule.Fed Reg.2010;75(144):44313–44588.
Patients in general medicalsurgical wards who experience unplanned transfer to the intensive care unit (ICU) have increased mortality and morbidity.13 Using an externally validated methodology permitting assessment of illness severity and mortality risk among all hospitalized patients,4, 5 we recently documented observed‐to‐expected mortality ratios >3.0 and excess length of stay of 10 days among patients who experienced such transfers.6
It is possible to predict adverse outcomes among monitored patients (eg, patients in the ICU or undergoing continuous electronic monitoring).7, 8 However, prediction of unplanned transfers among medicalsurgical ward patients presents challenges. Data collection (vital signs and laboratory tests) is relatively infrequent. The event rate (3% of hospital admissions) is low, and the rate in narrow time periods (eg, 12 hours) is extremely low: a hospital with 4000 admissions per year might experience 1 unplanned transfer to the ICU every 3 days. Not surprisingly, performance of models suitable for predicting ward patients' need for intensive care within narrow time frames have been disappointing.9 The Modified Early Warning Score (MEWS), has a c‐statistic, or area under the receiver operator characteristic of 0.67,1012 and our own model incorporating 14 laboratory tests, but no vital signs, has excellent performance with respect to predicting inpatient mortality, but poor performance with respect to unplanned transfer.6
In this report, we describe the development and validation of a complex predictive model suitable for use with ward patients. Our objective for this work was to develop a predictive model based on clinical and physiologic data available in real time from a comprehensive electronic medical record (EMR), not a clinically intuitive, manually assigned tool. The outcome of interest was unplanned transfer from the ward to the ICU, or death on the ward in a patient who was full code. This model has been developed as part of a regional effort to decrease preventable mortality in the Northern California Kaiser Permanente Medical Care Program (KPMCP), an integrated healthcare delivery system with 22 hospitals.
MATERIALS AND METHODS
For additional details, see the Supporting Information, Appendices 112, in the online version of this article.
This project was approved by the KPMCP Institutional Board for the Protection of Human Subjects.
The Northern California KPMCP serves a total population of approximately 3.3 million members. All Northern California KPMCP hospitals and clinics employ the same information systems with a common medical record number and can track care covered by the plan but delivered elsewhere. Databases maintained by the KPMCP capture admission and discharge times, admission and discharge diagnoses and procedures (assigned by professional coders), bed histories permitting quantification of intra‐hospital transfers, inter‐hospital transfers, as well as the results of all inpatient and outpatient laboratory tests. In July 2006, the KPMCP began deployment of the EMR developed by Epic Systems Corporation (
Our setting consisted of 14 hospitals in which the KPHC inpatient EMR had been running for at least 3 months (the KPMCP Antioch, Fremont, Hayward, Manteca, Modesto, Roseville, Sacramento, Santa Clara, San Francisco, Santa Rosa, South Sacramento, South San Francisco, Santa Teresa, and Walnut Creek hospitals). We have described the general characteristics of KPMCP hospitals elsewhere.4, 6 Our initial study population consisted of all patients admitted to these hospitals who met the following criteria: hospitalization began from November 1, 2006 through December 31, 2009; initial hospitalization occurred at a Northern California KPMCP hospital (ie, for inter‐hospital transfers, the first hospital stay occurred within the KPMCP); age 18 years; hospitalization was not for childbirth; and KPHC had been operational at the hospital for at least 3 months.
Analytic Approach
The primary outcome for this study was transfer to the ICU after admission to the hospital among patients residing either in a general medicalsurgical ward (ward) or transitional care unit (TCU), or death in the ward or TCU in a patient who was full code at the time of death (ie, had the patient survived, s/he would have been transferred to the ICU). The unit of analysis for this study was a 12‐hour patient shift, which could begin with a 7 AM T0 (henceforth, day shift) or a 7 PM T0 (night shift); in other words, we aimed to predict the occurrence of an event within 12 hours of T0 using only data available prior to T0. A shift in which a patient experienced the primary study outcome is an event shift, while one in which a patient did not experience the primary outcome is a comparison shift. Using this approach, an individual patient record could consist of both event and comparison shifts, since some patients might have multiple unplanned transfers and some patients might have none. Our basic analytic approach consisted of creating a cohort of event and comparison shifts (10 comparison shifts were randomly selected for each event shift), splitting the cohort into a derivation dataset (50%) and validation dataset (50%), developing a model using the derivation dataset, then applying the coefficients of the derivation dataset to the validation dataset. Because some event shifts were excluded due to the minimum 4‐hour length‐of‐stay requirement, we also applied model coefficients to these excluded shifts and a set of randomly selected comparison shifts.
Since the purpose of these analyses was to develop models with maximal signal extraction from sparsely collected predictors, we did not block a time period after the T0 to allow for a reaction time to the alarm. Thus, since some events could occur immediately after the T0 (as can be seen in the Supporting Information, Appendices, in the online version of this article), our models would need to be run at intervals that are more frequent than 2 times a day.
Independent Variables
In addition to patients' age and sex, we tested the following candidate independent variables. Some of these variables are part of the KPMCP risk adjustment model4, 5 and were available electronically for all patients in the cohort. We grouped admission diagnoses into 44 broad diagnostic categories (primary conditions), and admission types into 4 groups (emergency medical, emergency surgical, elective medical, and elective surgical). We quantified patients' degree of physiologic derangement in the 72 hours preceding hospitalization with a Laboratory‐based Acute Physiology Score (LAPS) using 14 laboratory test results prior to hospitalization; we also tested individual laboratory test results obtained after admission to the hospital. We quantified patients' comorbid illness burden using a COmorbidity Point Score (COPS) based on patients' preexisting diagnoses over the 12‐month period preceding hospitalization.4 We extracted temperature, heart rate, respiratory rate, systolic blood pressure, diastolic blood pressure, oxygen saturation, and neurological status from the EMR. We also tested the following variables based on specific information extracted from the EMR: shock index (heart rate divided by systolic blood pressure)13; care directive status (patients were placed into 4 groups: full code, partial code, do not resuscitate [DNR], and no care directive in place); and a proxy for measured lactate (PML; anion gap/serum bicarbonate 100).1416 For comparison purposes, we also created a retrospective electronically assigned MEWS, which we refer to as the MEWS(re), and we assigned this score to patient records electronically using data from KP HealthConnect.
Statistical Methods
Analyses were performed in SAS 9.1, Stata 10, and R 2.12. Final validation was performed using SAS (SAS Institute Inc., Carey, North Carolina). Since we did not limit ourselves to traditional severity‐scoring approaches (eg, selecting the worst heart rate in a given time interval), but also included trend terms (eg, change in heart rate over the 24 hours preceding T0), the number of potential variables to test was very large. Detailed description of the statistical strategies employed for variable selection is provided in the Supporting Information, Appendices, in the online version of this article. Once variables were selected, our basic approach was to test a series of diagnosis‐specific logistic regression submodels using a variety of predictors that included vital signs, vital signs trends (eg, most recent heart rate minus earliest heart rate, heart rate over preceding 24 hours), and other above‐mentioned variables.
We assessed the ability of a submodel to correctly distinguish patients who died, from survivors, using the c‐statistic, as well as other metrics recommended by Cook.17 At the end of the modeling process, we pooled the results across all submodels. For vital signs, where the rate of missing data was <3%, we tested submodels in which we dropped shifts with missing data, as well as submodels in which we imputed missing vital signs to a normal value. For laboratory data, where the rate of missing data for a given shift was much greater, we employed a probabilistic imputation method that included consideration of when a laboratory test result became available.
RESULTS
During the study period, a total of 102,488 patients experienced 145,335 hospitalizations at the study hospitals. We removed 66 patients with 138 hospitalizations for data quality reasons, leaving us with our initial study sample of 102,422 patients whose characteristics are summarized in Table 1. Table 1, in which the unit of analysis is an individual patient, shows that patients who experienced the primary outcome were similar to those patients described in our previous report, in terms of their characteristics on admission as well as in experiencing excess morbidity and mortality.6
| Never Admitted to ICU | Direct Admit to ICU From ED | Unplanned Transfer to ICU* | Other ICU Admission | |
|---|---|---|---|---|
| ||||
| N | 89,269 | 5963 | 2880 | 4310 |
| Age (mean SD) | 61.26 18.62 | 62.25 18.13 | 66.12 16.20 | 64.45 15.91 |
| Male (n, %) | 37,228 (41.70%) | 3091 (51.84%) | 1416 (49.17%) | 2378 (55.17%) |
| LAPS (mean SD) | 13.02 15.79 | 32.72 24.85 | 24.83 21.53 | 11.79 18.16 |
| COPS(mean SD) | 67.25 51.42 | 73.88 57.42 | 86.33 59.33 | 78.44 52.49 |
| % Predicted mortality risk (mean SD) | 1.93% 3.98% | 7.69% 12.59% | 5.23% 7.70% | 3.66% 6.81% |
| Survived first hospitalization to discharge∥ | 88,479 (99.12%) | 5336 (89.49%) | 2316 (80.42%) | 4063 (94.27%) |
| Care order on admission | ||||
| Full code | 78,877 (88.36%) | 5198 (87.17%) | 2598 (90.21%) | 4097 (95.06%) |
| Partial code | 664 (0.74%) | 156 (2.62%) | 50 (1.74%) | 27 (0.63%) |
| Comfort care | 21 (0.02%) | 2 (0.03%) | 0 (0%) | 0 (0%) |
| DNR | 8227 (9.22%) | 539 (9.04%) | 219 (7.60%) | 161 (3.74%) |
| Comfort care and DNR | 229 (0.26%) | 9 (0.15%) | 2 (0.07%) | 2 (0.05%) |
| No order | 1251 (1.40%) | 59 (0.99%) | 11 (0.38%) | 23 (0.53%) |
| Admission diagnosis (n, %) | ||||
| Pneumonia | 2385 (2.67%) | 258 (4.33%) | 242 (8.40%) | 68 (1.58%) |
| Sepsis | 5822 (6.52%) | 503 (8.44%) | 279 (9.69%) | 169 (3.92%) |
| GI bleeding | 9938 (11.13%) | 616 (10.33%) | 333 (11.56%) | 290 (6.73%) |
| Cancer | 2845 (3.19%) | 14 (0.23%) | 95 (3.30%) | 492 (11.42%) |
| Total hospital length of stay (days SD) | 3.08 3.29 | 5.37 7.50 | 12.16 13.12 | 8.06 9.53 |
Figure 1shows how we developed the analysis cohort, by removing patients with a comfort‐care‐only order placed within 4 hours after admission (369 patients/744 hospitalizations) and patients who were never admitted to the ward or TCU (7,220/10,574). This left a cohort consisting of 94,833 patients who experienced 133,879 hospitalizations spanning a total of 1,079,062 shifts. We then removed shifts where: 1) a patient was not on the ward at the start of a shift, or was on the ward for <4 hours of a shift; 2) the patient had a comfort‐care order in place at the start of the shift; and 3) the patient died and was ineligible to be a case (the patient had a DNR order in place or died in the ICU). The final cohort eligible for sampling consisted of 846,907 shifts, which involved a total of 92,797 patients and 130,627 hospitalizations. There were a total of 4,036 event shifts, which included 3,224 where a patient was transferred from the ward to the ICU, 717 from the TCU to the ICU, and 95 where a patient died on the ward or TCU without a DNR order in place. We then randomly selected 39,782 comparison shifts. Thus, our final cohort for analysis included 4,036 event shifts (1,979 derivation/2,057 validation and 39,782 comparison shifts (19,509/20,273). As a secondary validation, we also applied model coefficients to the 429 event shifts excluded due to the <4‐hour length‐of‐stay requirement.
Table 2 compares event shifts with comparison shifts. In the 24 hours preceding ICU transfer, patients who were subsequently transferred had statistically significant, but not necessarily clinically significant, differences in terms of these variables. However, missing laboratory data were more common, ranging from 18% to 31% of all shifts (we did not incorporate laboratory tests where 35% of the shifts had missing data for that test).
| Predictor | Event Shifts | Comparison Shifts | P |
|---|---|---|---|
| |||
| Number | 4036 | 39,782 | |
| Age (mean SD) | 67.19 15.25 | 65.41 17.40 | <0.001 |
| Male (n, %) | 2007 (49.73%) | 17,709 (44.52%) | <0.001 |
| Day shift | 1364 (33.80%) | 17,714 (44.53%) | <0.001 |
| LAPS* | 27.89 22.10 | 20.49 20.16 | <0.001 |
| COPS | 116.33 72.31 | 100.81 68.44 | <0.001 |
| Full code (n, %) | 3496 (86.2%) | 32,156 (80.8%) | <0.001 |
| ICU shift during hospitalization | 3964 (98.22%) | 7197 (18.09%) | <0.001 |
| Unplanned transfer to ICU during hospitalization∥ | 353 (8.8%) | 1466 (3.7%) | <0.001 |
| Temperature (mean SD) | 98.15 (1.13) | 98.10 (0.85) | 0.009 |
| Heart rate (mean SD) | 90.30 (20.48) | 79.86 (5.27) | <0.001 |
| Respiratory rate (mean SD) | 20.36 (3.70) | 18.87 (1.79) | <0.001 |
| Systolic blood pressure (mean SD) | 123.65 (23.26) | 126.21 (19.88) | <0.001 |
| Diastolic blood pressure (mean SD) | 68.38 (14.49) | 69.46 (11.95) | <0.001 |
| Oxygen saturation (mean SD) | 95.72% (3.00) | 96.47 % (2.26) | <0.001 |
| MEWS(re) (mean SD) | 3.64 (2.02) | 2.34 (1.61) | <0.001 |
| % <5 | 74.86% | 92.79% | |
| % 5 | 25.14% | 7.21% | <0.001 |
| Proxy for measured lactate# (mean SD) | 36.85 (28.24) | 28.73 (16.74) | <0.001 |
| % Missing in 24 hr before start of shift** | 17.91% | 28.78% | <0.001 |
| Blood urea nitrogen (mean SD) | 32.03 (25.39) | 22.72 (18.9) | <0.001 |
| % Missing in 24 hr before start of shift | 19.67% | 20.90% | <0.001 |
| White blood cell count 1000 (mean SD) | 12.33 (11.42) | 9.83 (6.58) | <0.001 |
| % Missing in 24 hr before start of shift | 21.43% | 30.98% | <0.001 |
| Hematocrit (mean SD) | 33.08 (6.28) | 33.07 (5.25) | 0.978 |
| % Missing in 24 hr before start of shift | 19.87% | 29.55% | <0.001 |
After conducting multiple analyses using the derivation dataset, we developed 24 submodels, a compromise between our finding that primary‐condition‐specific models showed better performance and the fact that we had very few events among patients with certain primary conditions (eg, pericarditis/valvular heart disease), which forced us to create composite categories (eg, a category pooling patients with pericarditis, atherosclerosis, and peripheral vascular disease). Table 3 lists variables included in our final submodels.
| Variable | Description |
|---|---|
| |
| Directive status | Full code or not full code |
| LAPS* | Admission physiologic severity of illness score (continuous variable ranging from 0 to 256). Standardized and included as LAPS and LAPS squared |
| COPS | Comorbidity burden score (continuous variable ranging from 0 to 701). Standardized and included as COPS and COPS squared. |
| COPS status | Indicator for absent comorbidity data |
| LOS at T0 | Length of stay in the hospital (total time in hours) at the T0; standardized. |
| T0 time of day | 7 AM or 7 PM |
| Temperature | Worst (highest) temperature in 24 hr preceding T0; variability in temperature in 24 hr preceding T0. |
| Heart rate | Most recent heart rate in 24 hr preceding T0; variability in heart rate in 24 hr preceding T0. |
| Respiratory rate | Most recent respiratory rate in 24 hr preceding T0; worst (highest) respiratory rate in 24 hr preceding T0; variability in respiratory rate in 24 hr preceding T0. |
| Diastolic blood pressure | Most recent diastolic blood pressure in 24 hr preceding T0 transformed by subtracting 70 from the actual value and squaring the result. Any value above 2000 is subsequently then set to 2000, yielding a continuous variable ranging from 0 to 2000. |
| Systolic pressure | Variability in systolic blood pressure in 24 hr preceding T0. |
| Pulse oximetry | Worst (lowest) oxygen saturation in 24 hr preceding T0; variability in oxygen saturation in 24 hr preceding T0. |
| Neurological status | Most recent neurological status check in 24 hr preceding T0. |
| Laboratory tests | Blood urea nitrogen |
| Proxy for measured lactate = (anion gap serum bicarbonate) 100 | |
| Hematocrit | |
| Total white blood cell count | |
Table 4 summarizes key results in the validation dataset. Across all diagnoses, the MEWS(re) had c‐statistic of 0.709 (95% confidence interval, 0.6970.721) in the derivation dataset and 0.698 (0.6860.710) in the validation dataset. In the validation dataset, the MEWS(re) performed best among patients with a set of gastrointestinal diagnoses (c = 0.792; 0.7260.857) and worst among patients with congestive heart failure (0.541; 0.5000.620). In contrast, across all primary conditions, the EMR‐based models had a c‐statistic of 0.845 (0.8260.863) in the derivation dataset and 0.775 (0.7530.797) in the validation dataset. In the validation dataset, the EMR‐based models also performed best among patients with a set of gastrointestinal diagnoses (0.841; 0.7830.897) and worst among patients with congestive heart failure (0.683; 0.6100.755). A negative correlation (R = 0.63) was evident between the number of event shifts in a submodel and the drop in the c‐statistic seen in the validation dataset.
| No. of Shifts in Validation Dataset | c‐Statistic | |||
|---|---|---|---|---|
| Diagnoses Group* | Event | Comparison | MEWS(re) | EMR Model |
| ||||
| Acute myocardial infarction | 36 | 169 | 0.541 | 0.572 |
| Diseases of pulmonary circulation and cardiac dysrhythmias | 40 | 329 | 0.565 | 0.645 |
| Seizure disorders | 45 | 497 | 0.594 | 0.647 |
| Rule out myocardial infarction | 77 | 727 | 0.602 | 0.648 |
| Pneumonia | 163 | 847 | 0.741 | 0.801 |
| GI diagnoses, set A | 58 | 942 | 0.755 | 0.803 |
| GI diagnoses, set B∥ | 256 | 2,610 | 0.772 | 0.806 |
| GI diagnoses, set C | 46 | 520 | 0.792 | 0.841 |
| All diagnosis | 2,032 | 20,106 | 0.698 | 0.775 |
We also compared model performance when our datasets were restricted to 1 randomly selected observation per patient; in these analyses, the total number of event shifts was 3,647 and the number of comparison shifts was 29,052. The c‐statistic for the MEWS(re) in the derivation dataset was 0.709 (0.6940.725); in the validation dataset, it was 0.698 (0.6920.714). The corresponding values for the EMR‐based models were 0.856 (0.8350.877) and 0.780 (0.7560.804). We also tested models in which, instead of dropping shifts with missing vital signs, we imputed missing vital signs to their normal value. The c‐statistic for the EMR‐based model with imputed vital sign values was 0.842 (0.8230.861) in the derivation dataset and 0.773 (0.7520.794) in the validation dataset. Lastly, we applied model coefficients to a dataset consisting of 4,290 randomly selected comparison shifts plus the 429 shifts excluded because of the 4‐hour length‐of‐stay criterion. The c‐statistic for this analysis was 0.756 (0.7030.809).
As a general rule, the EMR‐based models were more than twice as efficient as the MEWS(re). For example, a MEWS(re) threshold of 6 as the trigger for an alarm would identify 15% of all transfers to the ICU, with 34.4 false alarms for each transfer; in contrast, using the EMR‐based approach to identify 15% of all transfers, there were 14.5 false alarms for each transfer. Applied to the entire KPMCP Northern California Region, using the MEWS(re), a total of 52 patients per day would need to be evaluated, but only 22 per day using the EMR‐based approach. If one employed a MEWS(re) threshold of 4, this would lead to identification of 44% of all transfers, with a ratio of 69 false alarms for each transfer; using the EMR, the ratio would be 34 to 1. Across the entire KPMCP, a total of 276 patients per day (or about 19.5 a day per hospital) would need to be evaluated using the MEWS(re), but only 136 (or about 9.5 per hospital per day) using the EMR.
DISCUSSION
Using data from a large hospital cohort, we have developed a predictive model suitable for use in non‐ICU populations cared for in integrated healthcare settings with fully automated EMRs. The overall performance of our model, which incorporates acute physiology, diagnosis, and longitudinal data, is superior to the predictive ability of a model that can be assigned manually. This is not surprising, given that scoring systems such as the MEWS make an explicit tradeoff losing information found in multiple variables in exchange for ease of manual assignment. Currently, the model described in this report is being implemented in a simulated environment, a final safety test prior to piloting real‐time provision of probability estimates to clinicians and nurses. Though not yet ready for real‐time use, it is reasonable for our model to be tested using the KPHC shadow server, since evaluation in a simulated environment constitutes a critical evaluation step prior to deployment for clinical use. We also anticipate further refinement and revalidation to occur as more inpatient data become available in the KPMCP and elsewhere.
A number of limitations to our approach must be emphasized. In developing our models, we determined that, while modeling by clinical condition was important, the study outcome was rare for some primary conditions. In these diagnostic groups, which accounted for 12.5% of the event shifts and 10.6% of the comparison shifts, the c‐statistic in the validation dataset was <0.70. Since all 22 KPMCP hospitals are now online and will generate an additional 150,000 adult hospitalizations per year, we expect to be able to correct this problem prior to deployment of these models for clinical use. Having additional data will permit us to improve model discrimination and thus decrease the evaluation‐to‐detection ratio. In future iterations of these models, more experimentation with grouping of International Classification of Diseases (ICD) codes may be required. The problem of grouping ICD codes is not an easy one to resolve, in that diagnoses in the grouping must share common pathophysiology while having a grouping with a sufficient number of adverse events for stable statistical models.
Ideally, it would have been desirable to employ a more objective measure of deterioration, since the decision to transfer a patient to the ICU is discretionary. However, we have found that key data points needed to define such a measure (eg, vital signs) are not consistently charted when a patient deterioratesthis is not surprising outside the research setting, given that nurses and physicians involved in a transfer may be focusing on caring for the patient rather than immediately charting. Given the complexities of end‐of‐life‐care decision‐making, we could not employ death as the outcome of interest. A related issue is that our model does not differentiate between reasons for needing transfer to the ICU, an issue recently discussed by Bapoje et al.18
Our model does not address an important issue raised by Bapoje et al18 and Litvak, Pronovost, and others,19, 20 namely, whether a patient should have been admitted to a non‐ICU setting in the first place. Our team is currently developing a model for doing exactly this (providing decision support for triage in the emergency department), but discussion of this methodology is outside the scope of this article.
Because of resource and data limitations, our model also does not include newborns, children, women admitted for childbirth, or patients transferred from non‐KPMCP hospitals. However, the approach described here could serve as a starting point for developing models for these other populations.
The generalizability of our model must also be considered. The Northern California KPMCP is unusual in having large electronic databases that include physiologic as well as longitudinal patient data. Many hospitals cannot take advantage of all the methods described here. However, the methods we employed could be modified for use by hospital systems in countries such as Great Britain and Canada, and entities such as the Veterans Administration Hospital System in the United States. The KPMCP population, an insured population with few barriers to access, is healthier than the general population, and some population subsets are underrepresented in our cohort. Practice patterns may also vary. Nonetheless, the model described here could serve as a good starting point for future collaborative studies, and it would be possible to develop models suitable for use by stand‐alone hospitals (eg, recalibrating so that one used a Charlson comorbidity21 score based on present on‐admission codes rather than the COPS).
The need for early detection of patient deterioration has played a major role in the development of rapid response teams, as well as scores such as the MEWS. In particular, entities such as the Institute for Healthcare Improvement have advocated the use of early warning systems.22 However, having a statistically robust model to support an early warning system is only part of the solution, and a number of new challenges must then be addressed. The first is actual electronic deployment. Existing inpatient EMRs were not designed with complex calculations in mind, and we anticipate that some degradation in performance will occur when we test our models using real‐time data capture. As Bapoje et al point out, simply having an alert may be insufficient, since not all transfers are preventable.18 Early warning systems also raise ethical issues (for example, what should be done if an alert leads a clinician to confront the fact that an end‐of‐life‐care discussion needs to occur?). From a research perspective, if one were to formally test the benefits of such models, it would be critical to define outcome measures other than death (which is strongly affected by end‐of‐life‐care decisions) or ICU transfer (which is often desirable).
In conclusion, we have developed an approach for predicting impending physiologic deterioration of hospitalized adults outside the ICU. Our approach illustrates how organizations can take maximal advantage of EMRs in a manner that exceeds meaningful use specifications.23, 24 Our study highlights the possibility of using fully automated EMR data for building and applying sophisticated statistical models in settings other than the highly monitored ICU without the need for additional equipment. It also expands the universe of severity scoring to one in which probability estimates are provided in real time and throughout an entire hospitalization. Model performance will undoubtedly improve over time, as more patient data become available. Although our approach has important limitations, it is suitable for testing using real‐time data in a simulated environment. Such testing would permit identification of unanticipated problems and quantification of the degradation of model performance due to real life factors, such as delays in vital signs charting or EMR system brownouts. It could also serve as the springboard for future collaborative studies, with a broader population base, in which the EMR becomes a tool for care, not just documentation.
Acknowledgements
We thank Ms Marla Gardner and Mr John Greene for their work in the development phase of this project. We are grateful to Brian Hoberman, Andrew Hwang, and Marc Flagg from the RIMS group; to Colin Stobbs, Sriram Thiruvenkatachari, and Sundeep Sood from KP IT, Inc; and to Dennis Andaya, Linda Gliner, and Cyndi Vasallo for their assistance with data‐quality audits. We are also grateful to Dr Philip Madvig, Dr Paul Feigenbaum, Dr Alan Whippy, Mr Gregory Adams, Ms Barbara Crawford, and Dr Marybeth Sharpe for their administrative support and encouragement; and to Dr Alan S. Go, Acting Director of the Kaiser Permanente Division of Research, for reviewing the manuscript.
- ,,,.Day of the week of intensive care admission and patient outcomes: a multisite regional evaluation.Med Care.2002;40(6):530–539.
- ,,, et al.The hospital mortality of patients admitted to the ICU on weekends.Chest.2004;126(4):1292–1298.
- ,,, et al.Mortality among patients admitted to intensive care units during weekday day shifts compared with “off” hours.Crit Care Med.2007;35(1):3–11.
- ,,,,,.Risk adjusting hospital inpatient mortality using automated inpatient, outpatient, and laboratory databases.Med Care.2008;46(3):232–239.
- ,,,.The Kaiser Permanente inpatient risk adjustment methodology was valid in an external patient population.J Clin Epidemiol.2010;63(7):798–803.
- ,,,,,.Intra‐hospital transfers to a higher level of care: contribution to total hospital and intensive care unit (ICU) mortality and length of stay (LOS).J Hosp Med.2011;6(2):74–80.
- ,,,,,.Multicentric study of monitoring alarms in the adult intensive care unit (ICU): a descriptive analysis.Intensive Care Med.1999;25(12):1360–1366.
- ,,,,.Integration of early physiological responses predicts later illness severity in preterm infants.Sci Transl Med.2010;2(48):48ra65.
- ,,.Reproducibility of physiological track‐and‐trigger warning systems for identifying at‐risk patients on the ward.Intensive Care Med.2007;33(4):619–624.
- ,,,.Validation of a Modified Early Warning Score in medical admissions.Q J Med.2001;94:521–526.
- ,,,,.Effect of introducing the Modified Early Warning score on clinical outcomes, cardio‐pulmonary arrests and intensive care utilisation in acute medical admissions.Anaesthesia.2003;58(8):797–802.
- MERIT Study Investigators.Introduction of the medical emergency team (MET) system: a cluster‐randomized controlled trial.Lancet.2005;365(9477):2091–2097.
- ,,,,,.Unplanned transfers to the intensive care unit: the role of the shock index.J Hosp Med.2010;5(8):460–465.
- .The delta (delta) gap: an approach to mixed acid‐base disorders.Ann Emerg Med.1990;19(11):1310–1313.
- .Acid‐base disorders: classification and management strategies.Am Fam Physician.1995;52(2):584–590.
- ,,,.Unmeasured anions in critically ill patients: can they predict mortality?Crit Care Med.2003;31(8):2131–2136.
- .Use and misuse of the receiver operating characteristic curve in risk prediction.Circulation.2007;115(7):928–935.
- ,,,.Unplanned transfers to a medical intensive care unit: causes and relationship to preventable errors in care.J Hosp Med.2011;6(2):68–72.
- ,.Rethinking rapid response teams.JAMA.2010;304(12):1375–1376.
- ,,.Rapid response teams—walk, don't run.JAMA.2006;296(13):1645–1647.
- ,,,.A new method of classifying prognostic comorbidity in longitudinal populations: development and validation.J Chronic Dis.1987;40:373–383.
- Institute for Healthcare Improvement.Early Warning Systems:The Next Level of Rapid Response.2011. http://www.ihi.org/IHI/Programs/AudioAndWebPrograms/ExpeditionEarlyWarningSystemsTheNextLevelofRapidResponse.htm?player=wmp. Accessed 4/6/11.
- .Assessing readiness for meeting meaningful use: identifying electronic health record functionality and measuring levels of adoption.AMIA Annu Symp Proc.2010;2010:66–70.
- Medicare and Medicaid Programs;Electronic Health Record Incentive Program. Final Rule.Fed Reg.2010;75(144):44313–44588.
Copyright © 2012 Society of Hospital Medicine
