User login
Baby Boomer HCV Screening and Care
INTRODUCTION
The baby boomer generation, born from 1945 to 1965, accounts for 75% of the estimated 2.7 to 3.9 million persons with chronic hepatitis C virus (HCV) infection in the US.[1, 2, 3] Most HCV‐infected baby boomers do not know that they are infected.[4] With the advent of better‐tolerated, more‐effective therapies to treat chronic HCV infection,[5] and to reduce rates of complications such as cirrhosis, liver failure, and hepatocellular carcinoma,[6] universal 1‐time screening of baby boomers has been endorsed by the Centers for Disease Control and Prevention (CDC) and the United States Preventive Services Task Force.[1, 7] Hospitalized baby boomers may offer an important target for HCV screening. Our group conducted an anonymous HCV seroprevalence study of nearly 800 patients on general medicine and trauma services of 2 Philadelphia hospitals, and found that 8% had undiagnosed HCV infection, and 8% had diagnosed HCV. [8]
Little is known about barriers and facilitators to implementation of universal HCV screening of baby boomers. Lessons from implementing HIV screening offer a useful guide.[9] First, limited clinician knowledge and confusion about screening guidelines necessitated convenient, well‐designed educational programs.[10] Second, burdensome consent procedures were reduced by opt‐out consent for screening supplemented by patient education.[9] Third, electronic medical record (EMR) algorithms minimized burdens on staff by efficiently identifying and flagging eligible persons for screening.[11] Fourth, ancillary staff support for patient education and linkage to follow‐up care increased screening rates compared with usual care by physicians/staff.[11] Finally, routine human immunodeficiency virus (HIV) testing of inpatients increased rates of diagnosis, especially compared with physician referral systems.[12]
This article describes how HIV screening strategies informed the development in a baby boomer HCV screening and linkage to a care program in a safety‐net hospital serving a majority Hispanic population. We report results of the first 14 months of the screening program and linkage to care for chronically HCV‐infected persons after a minimum 10 months follow‐up. We also estimate costs for program implementation and maintenance to inform hospital administrators, healthcare policymakers, and clinicians about resources that may be required to effectively screen hospitalized baby boomers for HCV.
METHODS
Study Setting
The HCV baby boomer screening program was pilot tested in November 2012 and launched December 1, 2012 in a 498‐bed academic‐affiliated hospital of a healthcare system serving the indigent population of South Texas.
Project Development Phase
From October 1, 2012 to November 30, 2012, project infrastructure development and provider/staff education were conducted. A half‐hour PowerPoint lecture (in person or online) was developed about HCV epidemiology, birth‐cohort HCV screening guidelines, newer treatment modalities, and screening program components. Lectures were delivered to departmental chairs at the affiliated medical school, departmental grand rounds, and the hospital's nursing supervisors. One‐on‐one informational meetings were also held with hospital administrators and staff.
With the hospital's information technology team, screens were developed to identify eligible baby boomers from up to 7 years of previous inpatient and outpatient encounters in the EMR from: birth year (19451965) and no prior diagnosis of HCV infection (070.41, 070.44, 070.51, 070.54, 070.7x, V02.62) or any type of completed test for HCV. The algorithm also excluded patients admitted to psychiatry due to lack of decision‐making capacity or patients with a poor prognosis such as metastatic cancer. An audit of 100 consecutive excluded patients identified all as legitimate.
A new laboratory order for HCV screening was developed by laboratory administrators and pathology faculty for an anti‐HCV antibody test followed by reflex HCV RNA testing for positive results per CDC recommendations.[13] The anti‐HCV test was performed on serum or ethylenediaminetetraacetic acid plasma using the Advia Centaur HCV Assay (Bayer HealthCare LLC, Tarrytown, NY). This assay has excellent sensitivity (99.9%) and specificity (97.5%).[14, 15] The HCV RNA assay was performed using quantitative real‐time polymerase chain reaction (PCR) using the COBAS AmpliPrep/COBAS TaqMan HCV test (Roche Molecular Systems, Pleasanton, CA). Use of plasma preparation tubes (PPTs) (BD Vacutainer PPT tubes; Becton, Dickinson and Co., Franklin Lakes, NJ) permitted both anti‐HCV antibody and HCV PCR testing to be performed on the same specimen when anti‐HCV antibody was detected, eliminating a second blood draw for the PCR test. For patients eligible for screening, an EMR algorithm was created to add an HCV screening order to over 50 different admission order sets.
To educate patients newly diagnosed with HCV infection, we developed an interactive, low‐literacy, educational program in Spanish and English for an electronic tablet device that addressed: HCV epidemiology, transmission prevention, factors that can accelerate chronic HCV infection, and management/treatment strategies. At several points in the program, the patient needed to answer questions correctly to continue. The tablet retained responses linked to a study identification about alcohol consumption, history of past and current illicit drug use, sexual risk behavior, and offered risk reduction messages. The tablet content and presentation reflected suggestions by Hispanic patient‐reviewers about cultural appropriateness and comprehension.
Project Implementation and Maintenance Phase
We report implementation of the program from December 1, 2012 to January 31, 2014. An automated EMR report classified all baby boomers admitted in the previous 24 hours as: (1) eligible with pending screening test order, (2) eligible without an order, (3) ineligible due to prior HCV test or diagnosis, or (4) ineligible due to comorbidity (eg, metastatic cancer). For approximately one‐third of eligible patients, a study team member placed an order after review of the daily admission report because the order had not been automatically placed.
Admitting nurses initially asked for consent from eligible patients for HCV screening, but this was ultimately deemed too onerous a task along with all of their other duties. We then instituted opt‐out consent with patient education about testing and opportunities to refuse via posters placed throughout the hospital and flyers in admission packets. A bilingual HCV counselor provided HCV screening test results to all patients. She counseled patients who screened positive for HCV with the educational program on an electronic tablet and developed a follow‐up care plan.
A bilingual promotora (community health worker) contacted patients newly diagnosed with chronic HCV infection after hospital discharge to address the following: obtaining insurance, access to primary care and HCV specialty care, scheduling appointments, and treatment for alcohol problems or drug abuse. After obtaining signed consent, the promotora sent test results and recommendations for follow‐up care (eg, hepatitis A and B immunization) to a designated outpatient physician and reminded patients about appointments and pending tests. The promotora received training in motivational interviewing skills to engage patients with needed care including alcohol treatment.
Study Data
A summary report was developed from the EMR with demographic, insurance, clinical, and HCV screening data for all admitted baby boomers. For patients diagnosed with chronic HCV infection, the promotora obtained data about follow‐up HCV care through December 10, 2014 from the EMR, outside provider records, and patient reports.
Study Variables
The 2 outcome measures were a positive anti‐HCV antibody test and positive HCV RNA test. Insurance status was categorized as insured (private, public, Veterans Administration, Department of Defense) or uninsured (self‐pay or county‐based financial assistance program). Problem drinking was identified from International Classification of Diseases, Ninth Revision, Clinical Modification codes for the admission, notes by clinicians describing alcohol abuse/dependence, or quantity/frequency meeting National Institute on Alcohol Abuse and Alcoholism criteria for alcohol problems of >14 drinks/week or >4 drinks/day for men and >7 drinks per week or >3 drinks per day for women.[16]
Implementation costs included informatics support, mobile app development, other patient educational materials, costs of screening tests for uninsured, and 0.3 full‐time equivalent (FTE) of a clinician for half a year. Maintenance costs included salaries for the study team, HCV testing costs, and postage.
Analysis
Demographics by HCV antibody test results are compared using [2] tests or Student t tests as appropriate. Among persons with a positive HCV antibody test, HCV RNA results are similarly compared. This implementation project was approved by the University of Texas Health Science Center at San Antonio Institutional Review Board (HSC20130033N).
RESULTS
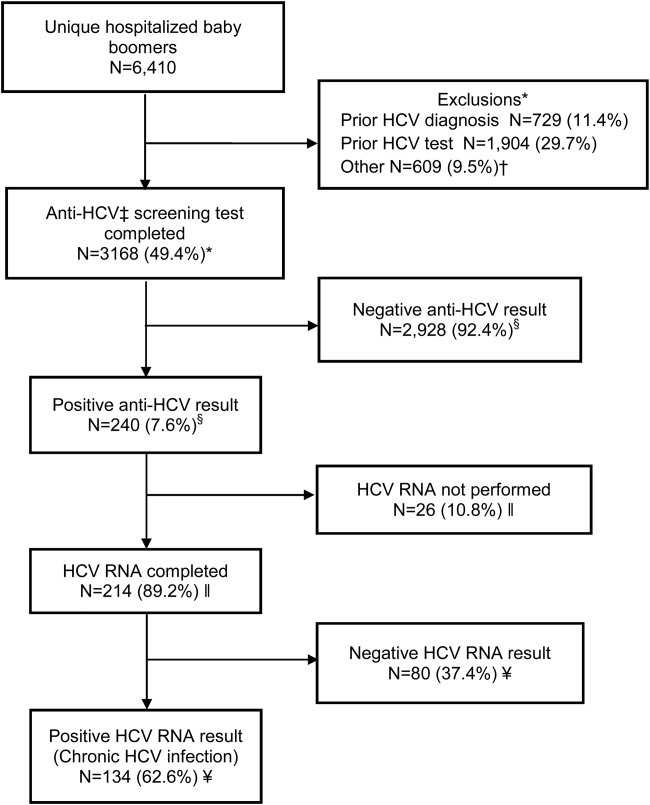
Within 14 months, 6410 unique baby boomers were admitted with a mean age 56.4 years (standard deviation [SD] 5.7), 55.9% men, 59.1% Hispanic, 8.2% nonwhite, and 46.7% uninsured (Table 1). Among admitted patients, 729 (11.4%) had a previous HCV diagnosis and 1904 (29.7%) had been tested for HCV (Figure 1). Anti‐HCV antibody testing was completed for 3168 (49.4% of all admitted patients and 83.9% of never‐tested patients). After exclusions such as significant comorbidity or psychiatric admission, 95% of eligible persons were tested. Of screened patients, 240 (7.6%) were positive; these patients were significantly younger (P<0.0001) and more likely to be men (P<0.0001) and uninsured (P=0.002) (Table 1). Notably, 10% of men were anti‐HCV positive versus 4% of women. In this predominantly Hispanic cohort, no significant difference appeared by race‐ethnicity, but African Americans had a higher prevalence (10.4%) than other groups.
| Characteristic | All Screened Patients, No. | Anti‐HCV Antibody‐Positive Patients, No. (Row %) | P Value* |
|---|---|---|---|
| |||
| Overall | 3,168 | Total=240 (7.6) | |
| Age, mean (SD) | 57.0 (5.7) | 54.8 (5.0) | <0.0001 |
| Sex | |||
| Men | 1,771 | 185 (10.4) | <0.0001 |
| Women | 1,397 | 55 (3.9) | |
| Race | |||
| Non‐Hispanic white | 1,036 | 86 (8.3) | 0.12 |
| Hispanic | 1,872 | 134 (7.2) | |
| African American | 163 | 17 (10.4) | |
| Other | 97 | 3 (3.1) | |
| Insurance | |||
| Insured | 1,740 | 109 (6.3) | 0.002 |
| Uninsured | 1,428 | 131 (9.2) | |
HCV RNA testing was completed for 214 (89.2%) anti‐HCVpositive patients, of whom 134 (62.6%) had detectable RNA, indicating chronic HCV infection (Figure 1). Overall, 4.2% of all eligible patients tested for HCV were chronically infected. No characteristics were significantly associated with chronic HCV, but persons with chronic infection tended to be younger, uninsured, and African American (Table 2).
| Characteristics | All HCV RNA‐Tested Patients, No. | HCV RNA‐Positive Patients, No. (Row %) | P Value* |
|---|---|---|---|
| |||
| Overall | 214 | 134 (62.6) | |
| Age, y, mean (SD) | 54.6 (5.0) | 54.2 (5.1) | 0.09 |
| Sex | |||
| Men | 165 | 106 (64.2) | 0.37 |
| Women | 49 | 28 (57.1) | |
| Race | |||
| Non‐Hispanic white | 78 | 49 (62.8) | 0.65 |
| Hispanic | 118 | 73 (61.8) | |
| African American | 15 | 11 (73.3) | |
| Other | 3 | 1 (33.3) | |
| Insurance | |||
| Insured | 92 | 52 (56.5) | 0.11 |
| Uninsured | 122 | 82 (67.2) | |
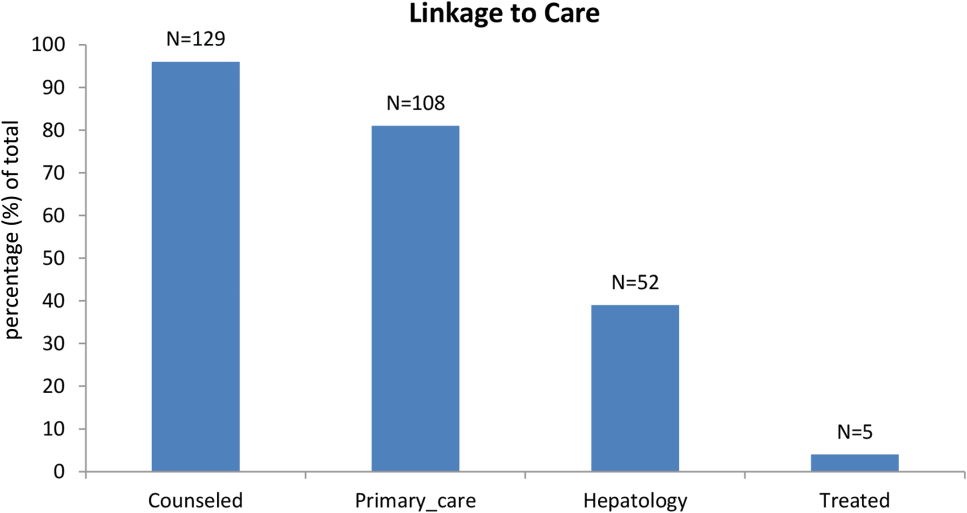
Among patients with chronic HCV infection, 129 (96.3%) were counseled and follow‐up plans developed (Figure 2). By December 10, 2014, 108 (80.6%) patients had received follow‐up primary care, and 52 (38.8%) had care from a hepatologist. Five had initiated HCV‐specific treatment, but many others were awaiting approval for compassionate drug programs offering direct‐acting antivirals. Barriers to care included 82 (61.2%) uninsured, 45 (34%) problem drinkers, 22 (16%) homeless, and 25 (18.6%) incarcerated (not shown). The promotora addressed these issues by visiting homes or homeless shelters, assistance with obtaining county‐based or other types of insurance, offering alcohol risk‐reduction counseling, linking patients to alcohol‐treatment programs, and communicating with the county jail about follow‐up care.
Most of the developmental costs for the program were dedicated to developing EMR programs (Table 3). An optional cost was for the development of the tablet educational program about HCV. In regard to maintenance costs for the first 14 months, the majority was to support the program faculty, counseling/case management, and a nurse practitioner who helped with ordering tests. We also estimated costs for testing uninsured patients (45% of HCV antibody tested, 57% of HCV PCR tested, per Tables 1 and 2, respectively), as they must be borne by the hospital.
| Program Component | Monthly ($) | Total ($) |
|---|---|---|
| ||
| Development phase (2 months prior to start) | ||
| Personnel | ||
| Faculty physicians (0.3 FTE salary+benefits) | 6,641 | 13,282 |
| Role: Development educational materials, provider education, and pilot testing | ||
| Technology | ||
| Development of eligibility screen and order sets for electronic medical record | 41,171 | |
| HCV counseling educational program for tabletdevelopment and pilot testing (optional) | 15,000 | |
| Patient educational materials (posters, flyers) | 400 | |
| Total for development phase | 69,853 | |
| Maintenance phase (14 months) | ||
| Personnel | ||
| Faculty physicians (0.3 FTE, salary+benefits) | 6,641 | 92,974 |
| Role: Coordinate with hospital staff and faculty, liaison with laboratory, supervise study team, review all identified cases for eligibility and management plans | ||
| Inpatient counselor and outpatient case management (2 FTE, salary+benefits) | 6,343 | 88,802 |
| Role: Inpatient and outpatient counseling of HCV Ab+patients and facilitation of follow‐up care for patients with chronic HCV infection | ||
| Nurse practitioner ($35/hour @ 10 hours/month) | 350 | 4,900 |
| Role: Review daily list of admitted baby boomers and manually order HCV screening test for those missed by the automated order | ||
| Postage | 10 | 140 |
| Laboratory costs for uninsured (based on % in cohort) | ||
| HCV antibody in plasma preparation tubes ($13.41/test 1,423) | 19,082 | |
| HCV RNA PCR ($87.96/test 122) | 10,731 | |
| Total for maintenance phase | 216,629 | |
| Total program costs | 286,482 | |
DISCUSSION
Implementation of universal HCV screening and linkage to care for hospitalized baby boomers utilizes a multicomponent infrastructure that reflects lessons learned from similar HIV programs. Use of an EMR algorithm to identify eligible patients and programs to automatically order HCV screening was a linchpin of our high testing rate and averted testing those who did not require screening. Of all 6410 baby boomers admitted to our safety‐net hospital, the EMR screen identified over 40% as ineligible due to prior diagnosis of HCV infection or prior HCV tests. Most of the additional 609 patients who were not tested were excluded due to comorbidities or admission to psychiatry. Overall, the EMR programs, tests ordered by the team, and opt‐out screening with education resulted in screening 95% of eligible patients. However, this program carries substantial costs, nearly $300,000 for the first 2 years, for unreimbursed services in this safety‐net hospital. The new guidelines for HCV screening[1, 2] are not accompanied by financial support either for program implementation or for screening and linkage to care for the uninsured, creating significant financial hurdles to achieve guideline compliance within already overtaxed public healthcare systems.
The infrastructure implemented in this hospital succeeded in achieving a higher rate of HCV screening of baby boomers than reported by other programs. In an emergency department in Birmingham, Alabama, a screening program for baby boomers tested 66% of 2325 persons who were HCV‐unaware.[17] In an outpatient clinic for men who have sex with men, only 54% of 1329 patients were screened for HCV.[18]
Among 3168 screened patients in our cohort, 7.6% were anti‐HCV antibody positive, which is over twice the prevalence of 3.5% (95% confidence interval: 2.2%‐4.8%) for anti‐HCVpositive tests in baby boomers based on National Health and Nutrition Examination Survey (NHANES) data from 2001 to 2010.[19] However, the Alabama emergency department study found that 11% of tested patients were anti‐HCV positive.[17] Although that study lacked race‐ethnicity data for half of the subjects, among those with this information, 13% of black and 7% of white subjects tested anti‐HCV positive. Compared with the Alabama study, the anti‐HCV prevalence in our cohort was somewhat lower for blacks (10.4%) but higher for non‐Hispanic whites (8.3%). Hispanics in our cohort had the lowest anti‐HCV prevalence (7.2%), whereas the Alabama study did not report this figure. National studies also find that the prevalence of anti‐HCVpositive results is twice as high for blacks compared with non‐Hispanic whites and Hispanics, and nearly twice as high for men compared with women.[19] In our cohort, the proportion of men with anti‐HCVpositive results was nearly 3 times that for women.
Diagnosis of chronic HCV infection requires 2 tests, similar to performing a Western blot test after a positive enzyme‐linked immunoassay for HIV. In a Veterans Affairs study, only 64% of patients with a positive anti‐HCV antibody test had a HCV RNA performed when reflex testing was not performed, and patients had to come in for a second test versus >90% of patients in sites that offer reflex testing.[20] At a somewhat increased price due to using more expensive PPTs ($96/100 PPT tubes vs $6.50/100 for serum red top tubes), both tests were performed on the same blood sample, resulting in 89% of anti‐HCV antibody‐positive patients being tested for HCV RNA.
Overall, 62% of patients in our cohort with a positive anti‐HCV antibody test had HCV RNA detected (viremic) compared with 71% of persons aged 20 years in an NHANES study from 2003 to 2010.[21] Several factors may contribute to this lower rate of chronic infection. In a study of HCV seropositive blood donors, Hispanics and non‐Hispanic whites were significantly more likely to have spontaneously cleared HCV infection than Asians and non‐Hispanic blacks.[22] Spontaneous clearance of HCV has also been associated with younger age at infection and HCV genotype 1.[23] Poorly understood genetic factors may also play a role.[24] The high rate of HCV clearance in our cohort reinforces the need to perform HCV RNA testing.
Overall, 4.2% of our cohort had chronic HCV infection. According to CDC estimates from 1999 to 2008 NHANES data, 2.74 million (3.25%) of 84.2 million US baby boomers have been infected with HCV, and 2.04 million (2.4%) have chronic infection.[1] Therefore, our safety‐net cohort of never‐tested baby boomers had over twice the prevalence of chronic HCV infection than the national estimate for this age group. This high proportion of chronic HCV may reflect our predominantly low‐income patient population. An analysis conducted by Milliman, Inc. using 2010 data estimated that half of all persons with undiagnosed HCV infection are uninsured.[25] This finding reinforces the need to conduct HCV screening in acute‐care settings such as hospitals, because the uninsured have poor access to ambulatory care.
Our chronic HCV‐infected cohort had many barriers to follow‐up care because most were uninsured and 15% were homeless. Our counselors addressed socioeconomic barriers to care[26] and concerns about the disease.[27] Many patients also had problem drinking based on either self‐report or documented in the medical record. Even moderate alcohol use may increase the risk of overall and liver‐related mortality from chronic HCV infection,[28] so our team offered brief alcohol counseling and partnered with healthcare providers and local Alcoholics Anonymous programs to offer support.
We linked 80% of newly diagnosed patients to primary care or hepatology providers, aided by a county‐level financial assistance program for healthcare services for uninsured residents, but it still required patients to pay out of pocket for care. Access to newer, highly effective, all‐oral therapy treatment[5] was slowed while awaiting US Food and Drug Administration approval in the first year of this project, then treatment provided only after lengthy applications to drug company assistance programs with priority given to persons with compensated cirrhosis.
Our project raises serious concerns for policymakers and payers. Should universal baby boomer HCV testing be undertaken without taking into account the financial and personnel resources required to implement this screening program or the substantial expenditures necessary to treat chronically infected persons? Although the Centers for Medicaid and Medicare Services pay for HCV screening costs,[29] our hospital had to cover costs for uninsured persons. Admittedly, Texas has the highest proportion of residents who are uninsured in the nation, but even in other states, Medicaid and other insurance programs are wrestling with how to deal with the high cost of HCV therapy.[30]
We acknowledge several limitations of this project. First, it was undertaken in only 1 hospital. Yet, our challenges and solutions are likely to be applicable to other hospitals nationally, especially those serving vulnerable populations. Second, patients in our cohort were usually admitted for comorbidities that needed to be managed before HCV infection could be addressed. However, persons with a poor prognosis, such as metastatic cancer, were excluded. We did not attempt to exclude other persons with serious comorbidities such as congestive heart failure, because the guidelines do not currently recommend this, and there may be benefits for patients, their families, and providers from knowing that an individual is chronically HCV infected even if they are not eligible to be treated. Third, the cost of the program was supported in part by a grant and would otherwise have to be borne by the hospital. Fourth, the EMR used by our hospital allows hundreds of admission order sets to be created and made automated order entry hard to implement. This is unlikely to be the situation in other hospitals using different types of EMRs.
It remains to be seen whether safety‐net hospitals with populations at greater risk of HCV infection can afford to support HCV testing and linkage to care. In view of several cost‐effectiveness studies that find screening and treating chronic HCV‐infected baby boomers cost‐effective within standard thresholds,[31, 32, 33] it may be important for policymakers and payers to consider lessons from HIV programs. Because HIV‐infected persons could not afford life‐saving medication, vigorous advocacy efforts led to legislation approving the Ryan White program in 1990 to fill gaps in HIV care that were not covered by other sources of support.[34] HCV infection is the most common blood‐borne infection in the nation, with potentially devastating consequences if ignored, but the underlying premise that universal HCV testing will save lives is in question if most of the individuals who are diagnosed with chronic HCV are low income, uninsured, or underinsured with limited access to curative medications. A rigorous public policy debate regarding both the merits of screening and the availability of treatment to those who are diagnosed is essential to the success of these programs.
Disclosure
Funding for this study was received from the Centers for Disease Control and Prevention CDC PS12‐1209PPHF12. The authors report no conflicts of interest.
- , , , , , Centers for Disease Control and Prevention. Recommendations for the identification of chronic hepatitis C virus infection among persons born during 1945–1965. MMWR Recomm Rep. 2012;61:1–32.
- 2. Centers for Disease Control and Prevention. Vital signs: evaluation of hepatitis C virus infection testing and reporting–eight U.S. sites, 2005‐2011. MMWR Morb Mortal Wkly Rep. 2013;62:357–361.
- , , , , Hepatitis C virus infection in USA: an estimate of true prevalence. Liver Int. 2011;31:1090–1101.
- Institute of Medicine. Hepatitis and liver cancer: a national strategy for prevention and control of hepatitis B and C. Washington, DC: The National Academies Press; 2010.
- , Current and future therapies for hepatitis C virus infection. N Engl J Med. 2013;368:1907–1917.
- , , , et al. Increasing prevalence of HCC and cirrhosis in patients with chronic hepatitis C virus infection. Gastroenterology. 2011;140:1182–1188.
- U.S. Preventive Services Task Force. Screening for hepatitis C virus infection in adults: U.S. Preventive Services Task Force recommendation statement. Ann Intern Med. 2013;159:349–357.
- , , Undiagnosed hepatitis C on the general medicine and trauma services of two urban hospitals. J Infect. 2009;59:62–69.
- U.S. Preventive Services Task Force. Screening for HIV: U.S. Preventive Services Task Force recommendation statement. Ann Intern Med. 2013;159:51–60.
- , , , et al. Factors affecting clinician educator encouragement of routine HIV testing among trainees. J Gen Intern Med. 2012;27:839–844.
- , , , et al. Counselor‐versus provider‐based HIV screening in the emergency department: Results from the universal screening for HIV infection in the emergency room (USHER) randomized controlled trial. Ann Emerg Med. 2011;58:S126–S132.e1–4.
- , , Approaching the CDC's guidelines on the HIV testing of inpatients: physician‐referral versus nonreferral‐based testing. AIDS Patient Care STDS. 2006;20:311–317.
- Centers for Disease Control and Prevention (CDC). Testing for HCV infection: an update of guidance for clinicians and laboratorians. MMWR Morb Mortal Wkly Rep. 2013;62:362–365.
- Advia Centaur Assay Manual. Malvern, PA: Siemens Medical Solutions Diagnostics; Pub# 07063235, Rev. C, 2005‐01.
- , , , Comparison of the ADVIA Centaur and Abbott AxSYM immunoassay systems for a routine diagnostic virology laboratory. J Clin Virol. 2004;30:S11–S15.
- National Institute on Alcohol Abuse and Alcoholism. Drinking levels defined. Available at: http://www.niaaa.nih.gov/alcohol‐health/overview‐alcohol‐consumption/moderate‐binge‐drinking. Accessed June 12, 2014.
- , , , et al. Unrecognized chronic hepatitis C virus infection among baby boomers in the emergency department. Hepatology. 2015;61:776–782.
- , , , et al. Low rates of hepatitis screening and vaccination of HIV‐infected MSM in HIV clinics. Sex Transm Dis. 2012;39:349–353.
- , , , , , The changing epidemiology of hepatitis C virus infection in the United States: National Health and Nutrition Examination Survey 2001 through 2010. J Hepatol. 2014;60:691–698.
- , , , , Viral RNA testing in hepatitis C antibody‐positive veterans. Am J Prev Med. 2009;36:235–238.
- , , , et al. Chronic hepatitis C virus infection in the United States: National Health and Nutrition Examination Survey 2003 to 2010. Ann Intern Med. 2014;160:293–300.
- , , , et al. NHLBI Retrovirus Epidemiology Donor Study (REDS) Group. Correlates of hepatitis C virus (HCV) RNA negativity among HCV‐seropositive blood donors. Transfusion. 2006;46:469–475.
- , , , , , Spontaneous loss of hepatitis C virus RNA from serum is associated with genotype 1 and younger age at exposure. J Med Virol. 2011;83:1338–1344.
- , , , et al. Genetics of spontaneous clearance of hepatitis C virus infection: a complex topic with much to learn. Hepatology. 2014;60:2127–2128.
- , , , Health care reform and hepatitis C: a convergence of risk and opportunity. Available at: http://us.milliman.com/uploadedFiles/insight/2013/convergence‐of‐risk‐and‐opportunity.pdf. Accessed February 5, 2015.
- , , , Hepatitis C testing, infection, and linkage to care among racial and ethnic minorities in the United States, 2009‐2010. Am J Public Health. 2013;103:112–119.
- , Barriers to hepatitis C treatment. Liver Int. 2012;32:151–156.
- , , , , Moderate, excessive or heavy alcohol consumption: Each is significantly associated with increased mortality in patients with chronic hepatitis C. Aliment Pharmacol Ther. 2013;37:703–709.
- Centers for Medicare and Medicaid Services. Proposed decision memo for screening for hepatitis c virus (HCV) in adults (CAG‐00436N). Available at: http://www.cms.gov/medicare-coverage-database/details/nca-proposed-decision-memo.aspx?NCAId=272. Accessed June 2, 2014.
- , Therapy for hepatitis C—the costs of success. N Engl J Med. 2014;370:1552–1553.
- , , , et al. Economic model of a birth cohort screening program for hepatitis C. Hepatology. 2012;55:1344–1355.
- , , , Cost‐effectiveness analysis of risk‐factor guided and birth‐cohort screening for chronic hepatitis C infection in the United States. PLoS One. 2013;8:e58975.
- , , , et al. The cost‐effectiveness of birth‐cohort screening for hepatitis C antibody in U.S. primary care settings. Ann Intern Med. 2012;156:263–270.
- U.S. Department of Health and Human Services. Health Resources and Services Administration: HIV/AIDS programs. Available at: http://hab.hrsa.gov/abouthab/legislation.html. Accessed April 8, 2015.
INTRODUCTION
The baby boomer generation, born from 1945 to 1965, accounts for 75% of the estimated 2.7 to 3.9 million persons with chronic hepatitis C virus (HCV) infection in the US.[1, 2, 3] Most HCV‐infected baby boomers do not know that they are infected.[4] With the advent of better‐tolerated, more‐effective therapies to treat chronic HCV infection,[5] and to reduce rates of complications such as cirrhosis, liver failure, and hepatocellular carcinoma,[6] universal 1‐time screening of baby boomers has been endorsed by the Centers for Disease Control and Prevention (CDC) and the United States Preventive Services Task Force.[1, 7] Hospitalized baby boomers may offer an important target for HCV screening. Our group conducted an anonymous HCV seroprevalence study of nearly 800 patients on general medicine and trauma services of 2 Philadelphia hospitals, and found that 8% had undiagnosed HCV infection, and 8% had diagnosed HCV. [8]
Little is known about barriers and facilitators to implementation of universal HCV screening of baby boomers. Lessons from implementing HIV screening offer a useful guide.[9] First, limited clinician knowledge and confusion about screening guidelines necessitated convenient, well‐designed educational programs.[10] Second, burdensome consent procedures were reduced by opt‐out consent for screening supplemented by patient education.[9] Third, electronic medical record (EMR) algorithms minimized burdens on staff by efficiently identifying and flagging eligible persons for screening.[11] Fourth, ancillary staff support for patient education and linkage to follow‐up care increased screening rates compared with usual care by physicians/staff.[11] Finally, routine human immunodeficiency virus (HIV) testing of inpatients increased rates of diagnosis, especially compared with physician referral systems.[12]
This article describes how HIV screening strategies informed the development in a baby boomer HCV screening and linkage to a care program in a safety‐net hospital serving a majority Hispanic population. We report results of the first 14 months of the screening program and linkage to care for chronically HCV‐infected persons after a minimum 10 months follow‐up. We also estimate costs for program implementation and maintenance to inform hospital administrators, healthcare policymakers, and clinicians about resources that may be required to effectively screen hospitalized baby boomers for HCV.
METHODS
Study Setting
The HCV baby boomer screening program was pilot tested in November 2012 and launched December 1, 2012 in a 498‐bed academic‐affiliated hospital of a healthcare system serving the indigent population of South Texas.
Project Development Phase
From October 1, 2012 to November 30, 2012, project infrastructure development and provider/staff education were conducted. A half‐hour PowerPoint lecture (in person or online) was developed about HCV epidemiology, birth‐cohort HCV screening guidelines, newer treatment modalities, and screening program components. Lectures were delivered to departmental chairs at the affiliated medical school, departmental grand rounds, and the hospital's nursing supervisors. One‐on‐one informational meetings were also held with hospital administrators and staff.
With the hospital's information technology team, screens were developed to identify eligible baby boomers from up to 7 years of previous inpatient and outpatient encounters in the EMR from: birth year (19451965) and no prior diagnosis of HCV infection (070.41, 070.44, 070.51, 070.54, 070.7x, V02.62) or any type of completed test for HCV. The algorithm also excluded patients admitted to psychiatry due to lack of decision‐making capacity or patients with a poor prognosis such as metastatic cancer. An audit of 100 consecutive excluded patients identified all as legitimate.
A new laboratory order for HCV screening was developed by laboratory administrators and pathology faculty for an anti‐HCV antibody test followed by reflex HCV RNA testing for positive results per CDC recommendations.[13] The anti‐HCV test was performed on serum or ethylenediaminetetraacetic acid plasma using the Advia Centaur HCV Assay (Bayer HealthCare LLC, Tarrytown, NY). This assay has excellent sensitivity (99.9%) and specificity (97.5%).[14, 15] The HCV RNA assay was performed using quantitative real‐time polymerase chain reaction (PCR) using the COBAS AmpliPrep/COBAS TaqMan HCV test (Roche Molecular Systems, Pleasanton, CA). Use of plasma preparation tubes (PPTs) (BD Vacutainer PPT tubes; Becton, Dickinson and Co., Franklin Lakes, NJ) permitted both anti‐HCV antibody and HCV PCR testing to be performed on the same specimen when anti‐HCV antibody was detected, eliminating a second blood draw for the PCR test. For patients eligible for screening, an EMR algorithm was created to add an HCV screening order to over 50 different admission order sets.
To educate patients newly diagnosed with HCV infection, we developed an interactive, low‐literacy, educational program in Spanish and English for an electronic tablet device that addressed: HCV epidemiology, transmission prevention, factors that can accelerate chronic HCV infection, and management/treatment strategies. At several points in the program, the patient needed to answer questions correctly to continue. The tablet retained responses linked to a study identification about alcohol consumption, history of past and current illicit drug use, sexual risk behavior, and offered risk reduction messages. The tablet content and presentation reflected suggestions by Hispanic patient‐reviewers about cultural appropriateness and comprehension.
Project Implementation and Maintenance Phase
We report implementation of the program from December 1, 2012 to January 31, 2014. An automated EMR report classified all baby boomers admitted in the previous 24 hours as: (1) eligible with pending screening test order, (2) eligible without an order, (3) ineligible due to prior HCV test or diagnosis, or (4) ineligible due to comorbidity (eg, metastatic cancer). For approximately one‐third of eligible patients, a study team member placed an order after review of the daily admission report because the order had not been automatically placed.
Admitting nurses initially asked for consent from eligible patients for HCV screening, but this was ultimately deemed too onerous a task along with all of their other duties. We then instituted opt‐out consent with patient education about testing and opportunities to refuse via posters placed throughout the hospital and flyers in admission packets. A bilingual HCV counselor provided HCV screening test results to all patients. She counseled patients who screened positive for HCV with the educational program on an electronic tablet and developed a follow‐up care plan.
A bilingual promotora (community health worker) contacted patients newly diagnosed with chronic HCV infection after hospital discharge to address the following: obtaining insurance, access to primary care and HCV specialty care, scheduling appointments, and treatment for alcohol problems or drug abuse. After obtaining signed consent, the promotora sent test results and recommendations for follow‐up care (eg, hepatitis A and B immunization) to a designated outpatient physician and reminded patients about appointments and pending tests. The promotora received training in motivational interviewing skills to engage patients with needed care including alcohol treatment.
Study Data
A summary report was developed from the EMR with demographic, insurance, clinical, and HCV screening data for all admitted baby boomers. For patients diagnosed with chronic HCV infection, the promotora obtained data about follow‐up HCV care through December 10, 2014 from the EMR, outside provider records, and patient reports.
Study Variables
The 2 outcome measures were a positive anti‐HCV antibody test and positive HCV RNA test. Insurance status was categorized as insured (private, public, Veterans Administration, Department of Defense) or uninsured (self‐pay or county‐based financial assistance program). Problem drinking was identified from International Classification of Diseases, Ninth Revision, Clinical Modification codes for the admission, notes by clinicians describing alcohol abuse/dependence, or quantity/frequency meeting National Institute on Alcohol Abuse and Alcoholism criteria for alcohol problems of >14 drinks/week or >4 drinks/day for men and >7 drinks per week or >3 drinks per day for women.[16]
Implementation costs included informatics support, mobile app development, other patient educational materials, costs of screening tests for uninsured, and 0.3 full‐time equivalent (FTE) of a clinician for half a year. Maintenance costs included salaries for the study team, HCV testing costs, and postage.
Analysis
Demographics by HCV antibody test results are compared using [2] tests or Student t tests as appropriate. Among persons with a positive HCV antibody test, HCV RNA results are similarly compared. This implementation project was approved by the University of Texas Health Science Center at San Antonio Institutional Review Board (HSC20130033N).
RESULTS
Within 14 months, 6410 unique baby boomers were admitted with a mean age 56.4 years (standard deviation [SD] 5.7), 55.9% men, 59.1% Hispanic, 8.2% nonwhite, and 46.7% uninsured (Table 1). Among admitted patients, 729 (11.4%) had a previous HCV diagnosis and 1904 (29.7%) had been tested for HCV (Figure 1). Anti‐HCV antibody testing was completed for 3168 (49.4% of all admitted patients and 83.9% of never‐tested patients). After exclusions such as significant comorbidity or psychiatric admission, 95% of eligible persons were tested. Of screened patients, 240 (7.6%) were positive; these patients were significantly younger (P<0.0001) and more likely to be men (P<0.0001) and uninsured (P=0.002) (Table 1). Notably, 10% of men were anti‐HCV positive versus 4% of women. In this predominantly Hispanic cohort, no significant difference appeared by race‐ethnicity, but African Americans had a higher prevalence (10.4%) than other groups.
| Characteristic | All Screened Patients, No. | Anti‐HCV Antibody‐Positive Patients, No. (Row %) | P Value* |
|---|---|---|---|
| |||
| Overall | 3,168 | Total=240 (7.6) | |
| Age, mean (SD) | 57.0 (5.7) | 54.8 (5.0) | <0.0001 |
| Sex | |||
| Men | 1,771 | 185 (10.4) | <0.0001 |
| Women | 1,397 | 55 (3.9) | |
| Race | |||
| Non‐Hispanic white | 1,036 | 86 (8.3) | 0.12 |
| Hispanic | 1,872 | 134 (7.2) | |
| African American | 163 | 17 (10.4) | |
| Other | 97 | 3 (3.1) | |
| Insurance | |||
| Insured | 1,740 | 109 (6.3) | 0.002 |
| Uninsured | 1,428 | 131 (9.2) | |
HCV RNA testing was completed for 214 (89.2%) anti‐HCVpositive patients, of whom 134 (62.6%) had detectable RNA, indicating chronic HCV infection (Figure 1). Overall, 4.2% of all eligible patients tested for HCV were chronically infected. No characteristics were significantly associated with chronic HCV, but persons with chronic infection tended to be younger, uninsured, and African American (Table 2).
| Characteristics | All HCV RNA‐Tested Patients, No. | HCV RNA‐Positive Patients, No. (Row %) | P Value* |
|---|---|---|---|
| |||
| Overall | 214 | 134 (62.6) | |
| Age, y, mean (SD) | 54.6 (5.0) | 54.2 (5.1) | 0.09 |
| Sex | |||
| Men | 165 | 106 (64.2) | 0.37 |
| Women | 49 | 28 (57.1) | |
| Race | |||
| Non‐Hispanic white | 78 | 49 (62.8) | 0.65 |
| Hispanic | 118 | 73 (61.8) | |
| African American | 15 | 11 (73.3) | |
| Other | 3 | 1 (33.3) | |
| Insurance | |||
| Insured | 92 | 52 (56.5) | 0.11 |
| Uninsured | 122 | 82 (67.2) | |
Among patients with chronic HCV infection, 129 (96.3%) were counseled and follow‐up plans developed (Figure 2). By December 10, 2014, 108 (80.6%) patients had received follow‐up primary care, and 52 (38.8%) had care from a hepatologist. Five had initiated HCV‐specific treatment, but many others were awaiting approval for compassionate drug programs offering direct‐acting antivirals. Barriers to care included 82 (61.2%) uninsured, 45 (34%) problem drinkers, 22 (16%) homeless, and 25 (18.6%) incarcerated (not shown). The promotora addressed these issues by visiting homes or homeless shelters, assistance with obtaining county‐based or other types of insurance, offering alcohol risk‐reduction counseling, linking patients to alcohol‐treatment programs, and communicating with the county jail about follow‐up care.
Most of the developmental costs for the program were dedicated to developing EMR programs (Table 3). An optional cost was for the development of the tablet educational program about HCV. In regard to maintenance costs for the first 14 months, the majority was to support the program faculty, counseling/case management, and a nurse practitioner who helped with ordering tests. We also estimated costs for testing uninsured patients (45% of HCV antibody tested, 57% of HCV PCR tested, per Tables 1 and 2, respectively), as they must be borne by the hospital.
| Program Component | Monthly ($) | Total ($) |
|---|---|---|
| ||
| Development phase (2 months prior to start) | ||
| Personnel | ||
| Faculty physicians (0.3 FTE salary+benefits) | 6,641 | 13,282 |
| Role: Development educational materials, provider education, and pilot testing | ||
| Technology | ||
| Development of eligibility screen and order sets for electronic medical record | 41,171 | |
| HCV counseling educational program for tabletdevelopment and pilot testing (optional) | 15,000 | |
| Patient educational materials (posters, flyers) | 400 | |
| Total for development phase | 69,853 | |
| Maintenance phase (14 months) | ||
| Personnel | ||
| Faculty physicians (0.3 FTE, salary+benefits) | 6,641 | 92,974 |
| Role: Coordinate with hospital staff and faculty, liaison with laboratory, supervise study team, review all identified cases for eligibility and management plans | ||
| Inpatient counselor and outpatient case management (2 FTE, salary+benefits) | 6,343 | 88,802 |
| Role: Inpatient and outpatient counseling of HCV Ab+patients and facilitation of follow‐up care for patients with chronic HCV infection | ||
| Nurse practitioner ($35/hour @ 10 hours/month) | 350 | 4,900 |
| Role: Review daily list of admitted baby boomers and manually order HCV screening test for those missed by the automated order | ||
| Postage | 10 | 140 |
| Laboratory costs for uninsured (based on % in cohort) | ||
| HCV antibody in plasma preparation tubes ($13.41/test 1,423) | 19,082 | |
| HCV RNA PCR ($87.96/test 122) | 10,731 | |
| Total for maintenance phase | 216,629 | |
| Total program costs | 286,482 | |
DISCUSSION
Implementation of universal HCV screening and linkage to care for hospitalized baby boomers utilizes a multicomponent infrastructure that reflects lessons learned from similar HIV programs. Use of an EMR algorithm to identify eligible patients and programs to automatically order HCV screening was a linchpin of our high testing rate and averted testing those who did not require screening. Of all 6410 baby boomers admitted to our safety‐net hospital, the EMR screen identified over 40% as ineligible due to prior diagnosis of HCV infection or prior HCV tests. Most of the additional 609 patients who were not tested were excluded due to comorbidities or admission to psychiatry. Overall, the EMR programs, tests ordered by the team, and opt‐out screening with education resulted in screening 95% of eligible patients. However, this program carries substantial costs, nearly $300,000 for the first 2 years, for unreimbursed services in this safety‐net hospital. The new guidelines for HCV screening[1, 2] are not accompanied by financial support either for program implementation or for screening and linkage to care for the uninsured, creating significant financial hurdles to achieve guideline compliance within already overtaxed public healthcare systems.
The infrastructure implemented in this hospital succeeded in achieving a higher rate of HCV screening of baby boomers than reported by other programs. In an emergency department in Birmingham, Alabama, a screening program for baby boomers tested 66% of 2325 persons who were HCV‐unaware.[17] In an outpatient clinic for men who have sex with men, only 54% of 1329 patients were screened for HCV.[18]
Among 3168 screened patients in our cohort, 7.6% were anti‐HCV antibody positive, which is over twice the prevalence of 3.5% (95% confidence interval: 2.2%‐4.8%) for anti‐HCVpositive tests in baby boomers based on National Health and Nutrition Examination Survey (NHANES) data from 2001 to 2010.[19] However, the Alabama emergency department study found that 11% of tested patients were anti‐HCV positive.[17] Although that study lacked race‐ethnicity data for half of the subjects, among those with this information, 13% of black and 7% of white subjects tested anti‐HCV positive. Compared with the Alabama study, the anti‐HCV prevalence in our cohort was somewhat lower for blacks (10.4%) but higher for non‐Hispanic whites (8.3%). Hispanics in our cohort had the lowest anti‐HCV prevalence (7.2%), whereas the Alabama study did not report this figure. National studies also find that the prevalence of anti‐HCVpositive results is twice as high for blacks compared with non‐Hispanic whites and Hispanics, and nearly twice as high for men compared with women.[19] In our cohort, the proportion of men with anti‐HCVpositive results was nearly 3 times that for women.
Diagnosis of chronic HCV infection requires 2 tests, similar to performing a Western blot test after a positive enzyme‐linked immunoassay for HIV. In a Veterans Affairs study, only 64% of patients with a positive anti‐HCV antibody test had a HCV RNA performed when reflex testing was not performed, and patients had to come in for a second test versus >90% of patients in sites that offer reflex testing.[20] At a somewhat increased price due to using more expensive PPTs ($96/100 PPT tubes vs $6.50/100 for serum red top tubes), both tests were performed on the same blood sample, resulting in 89% of anti‐HCV antibody‐positive patients being tested for HCV RNA.
Overall, 62% of patients in our cohort with a positive anti‐HCV antibody test had HCV RNA detected (viremic) compared with 71% of persons aged 20 years in an NHANES study from 2003 to 2010.[21] Several factors may contribute to this lower rate of chronic infection. In a study of HCV seropositive blood donors, Hispanics and non‐Hispanic whites were significantly more likely to have spontaneously cleared HCV infection than Asians and non‐Hispanic blacks.[22] Spontaneous clearance of HCV has also been associated with younger age at infection and HCV genotype 1.[23] Poorly understood genetic factors may also play a role.[24] The high rate of HCV clearance in our cohort reinforces the need to perform HCV RNA testing.
Overall, 4.2% of our cohort had chronic HCV infection. According to CDC estimates from 1999 to 2008 NHANES data, 2.74 million (3.25%) of 84.2 million US baby boomers have been infected with HCV, and 2.04 million (2.4%) have chronic infection.[1] Therefore, our safety‐net cohort of never‐tested baby boomers had over twice the prevalence of chronic HCV infection than the national estimate for this age group. This high proportion of chronic HCV may reflect our predominantly low‐income patient population. An analysis conducted by Milliman, Inc. using 2010 data estimated that half of all persons with undiagnosed HCV infection are uninsured.[25] This finding reinforces the need to conduct HCV screening in acute‐care settings such as hospitals, because the uninsured have poor access to ambulatory care.
Our chronic HCV‐infected cohort had many barriers to follow‐up care because most were uninsured and 15% were homeless. Our counselors addressed socioeconomic barriers to care[26] and concerns about the disease.[27] Many patients also had problem drinking based on either self‐report or documented in the medical record. Even moderate alcohol use may increase the risk of overall and liver‐related mortality from chronic HCV infection,[28] so our team offered brief alcohol counseling and partnered with healthcare providers and local Alcoholics Anonymous programs to offer support.
We linked 80% of newly diagnosed patients to primary care or hepatology providers, aided by a county‐level financial assistance program for healthcare services for uninsured residents, but it still required patients to pay out of pocket for care. Access to newer, highly effective, all‐oral therapy treatment[5] was slowed while awaiting US Food and Drug Administration approval in the first year of this project, then treatment provided only after lengthy applications to drug company assistance programs with priority given to persons with compensated cirrhosis.
Our project raises serious concerns for policymakers and payers. Should universal baby boomer HCV testing be undertaken without taking into account the financial and personnel resources required to implement this screening program or the substantial expenditures necessary to treat chronically infected persons? Although the Centers for Medicaid and Medicare Services pay for HCV screening costs,[29] our hospital had to cover costs for uninsured persons. Admittedly, Texas has the highest proportion of residents who are uninsured in the nation, but even in other states, Medicaid and other insurance programs are wrestling with how to deal with the high cost of HCV therapy.[30]
We acknowledge several limitations of this project. First, it was undertaken in only 1 hospital. Yet, our challenges and solutions are likely to be applicable to other hospitals nationally, especially those serving vulnerable populations. Second, patients in our cohort were usually admitted for comorbidities that needed to be managed before HCV infection could be addressed. However, persons with a poor prognosis, such as metastatic cancer, were excluded. We did not attempt to exclude other persons with serious comorbidities such as congestive heart failure, because the guidelines do not currently recommend this, and there may be benefits for patients, their families, and providers from knowing that an individual is chronically HCV infected even if they are not eligible to be treated. Third, the cost of the program was supported in part by a grant and would otherwise have to be borne by the hospital. Fourth, the EMR used by our hospital allows hundreds of admission order sets to be created and made automated order entry hard to implement. This is unlikely to be the situation in other hospitals using different types of EMRs.
It remains to be seen whether safety‐net hospitals with populations at greater risk of HCV infection can afford to support HCV testing and linkage to care. In view of several cost‐effectiveness studies that find screening and treating chronic HCV‐infected baby boomers cost‐effective within standard thresholds,[31, 32, 33] it may be important for policymakers and payers to consider lessons from HIV programs. Because HIV‐infected persons could not afford life‐saving medication, vigorous advocacy efforts led to legislation approving the Ryan White program in 1990 to fill gaps in HIV care that were not covered by other sources of support.[34] HCV infection is the most common blood‐borne infection in the nation, with potentially devastating consequences if ignored, but the underlying premise that universal HCV testing will save lives is in question if most of the individuals who are diagnosed with chronic HCV are low income, uninsured, or underinsured with limited access to curative medications. A rigorous public policy debate regarding both the merits of screening and the availability of treatment to those who are diagnosed is essential to the success of these programs.
Disclosure
Funding for this study was received from the Centers for Disease Control and Prevention CDC PS12‐1209PPHF12. The authors report no conflicts of interest.
- , , , , , Centers for Disease Control and Prevention. Recommendations for the identification of chronic hepatitis C virus infection among persons born during 1945–1965. MMWR Recomm Rep. 2012;61:1–32.
- 2. Centers for Disease Control and Prevention. Vital signs: evaluation of hepatitis C virus infection testing and reporting–eight U.S. sites, 2005‐2011. MMWR Morb Mortal Wkly Rep. 2013;62:357–361.
- , , , , Hepatitis C virus infection in USA: an estimate of true prevalence. Liver Int. 2011;31:1090–1101.
- Institute of Medicine. Hepatitis and liver cancer: a national strategy for prevention and control of hepatitis B and C. Washington, DC: The National Academies Press; 2010.
- , Current and future therapies for hepatitis C virus infection. N Engl J Med. 2013;368:1907–1917.
- , , , et al. Increasing prevalence of HCC and cirrhosis in patients with chronic hepatitis C virus infection. Gastroenterology. 2011;140:1182–1188.
- U.S. Preventive Services Task Force. Screening for hepatitis C virus infection in adults: U.S. Preventive Services Task Force recommendation statement. Ann Intern Med. 2013;159:349–357.
- , , Undiagnosed hepatitis C on the general medicine and trauma services of two urban hospitals. J Infect. 2009;59:62–69.
- U.S. Preventive Services Task Force. Screening for HIV: U.S. Preventive Services Task Force recommendation statement. Ann Intern Med. 2013;159:51–60.
- , , , et al. Factors affecting clinician educator encouragement of routine HIV testing among trainees. J Gen Intern Med. 2012;27:839–844.
- , , , et al. Counselor‐versus provider‐based HIV screening in the emergency department: Results from the universal screening for HIV infection in the emergency room (USHER) randomized controlled trial. Ann Emerg Med. 2011;58:S126–S132.e1–4.
- , , Approaching the CDC's guidelines on the HIV testing of inpatients: physician‐referral versus nonreferral‐based testing. AIDS Patient Care STDS. 2006;20:311–317.
- Centers for Disease Control and Prevention (CDC). Testing for HCV infection: an update of guidance for clinicians and laboratorians. MMWR Morb Mortal Wkly Rep. 2013;62:362–365.
- Advia Centaur Assay Manual. Malvern, PA: Siemens Medical Solutions Diagnostics; Pub# 07063235, Rev. C, 2005‐01.
- , , , Comparison of the ADVIA Centaur and Abbott AxSYM immunoassay systems for a routine diagnostic virology laboratory. J Clin Virol. 2004;30:S11–S15.
- National Institute on Alcohol Abuse and Alcoholism. Drinking levels defined. Available at: http://www.niaaa.nih.gov/alcohol‐health/overview‐alcohol‐consumption/moderate‐binge‐drinking. Accessed June 12, 2014.
- , , , et al. Unrecognized chronic hepatitis C virus infection among baby boomers in the emergency department. Hepatology. 2015;61:776–782.
- , , , et al. Low rates of hepatitis screening and vaccination of HIV‐infected MSM in HIV clinics. Sex Transm Dis. 2012;39:349–353.
- , , , , , The changing epidemiology of hepatitis C virus infection in the United States: National Health and Nutrition Examination Survey 2001 through 2010. J Hepatol. 2014;60:691–698.
- , , , , Viral RNA testing in hepatitis C antibody‐positive veterans. Am J Prev Med. 2009;36:235–238.
- , , , et al. Chronic hepatitis C virus infection in the United States: National Health and Nutrition Examination Survey 2003 to 2010. Ann Intern Med. 2014;160:293–300.
- , , , et al. NHLBI Retrovirus Epidemiology Donor Study (REDS) Group. Correlates of hepatitis C virus (HCV) RNA negativity among HCV‐seropositive blood donors. Transfusion. 2006;46:469–475.
- , , , , , Spontaneous loss of hepatitis C virus RNA from serum is associated with genotype 1 and younger age at exposure. J Med Virol. 2011;83:1338–1344.
- , , , et al. Genetics of spontaneous clearance of hepatitis C virus infection: a complex topic with much to learn. Hepatology. 2014;60:2127–2128.
- , , , Health care reform and hepatitis C: a convergence of risk and opportunity. Available at: http://us.milliman.com/uploadedFiles/insight/2013/convergence‐of‐risk‐and‐opportunity.pdf. Accessed February 5, 2015.
- , , , Hepatitis C testing, infection, and linkage to care among racial and ethnic minorities in the United States, 2009‐2010. Am J Public Health. 2013;103:112–119.
- , Barriers to hepatitis C treatment. Liver Int. 2012;32:151–156.
- , , , , Moderate, excessive or heavy alcohol consumption: Each is significantly associated with increased mortality in patients with chronic hepatitis C. Aliment Pharmacol Ther. 2013;37:703–709.
- Centers for Medicare and Medicaid Services. Proposed decision memo for screening for hepatitis c virus (HCV) in adults (CAG‐00436N). Available at: http://www.cms.gov/medicare-coverage-database/details/nca-proposed-decision-memo.aspx?NCAId=272. Accessed June 2, 2014.
- , Therapy for hepatitis C—the costs of success. N Engl J Med. 2014;370:1552–1553.
- , , , et al. Economic model of a birth cohort screening program for hepatitis C. Hepatology. 2012;55:1344–1355.
- , , , Cost‐effectiveness analysis of risk‐factor guided and birth‐cohort screening for chronic hepatitis C infection in the United States. PLoS One. 2013;8:e58975.
- , , , et al. The cost‐effectiveness of birth‐cohort screening for hepatitis C antibody in U.S. primary care settings. Ann Intern Med. 2012;156:263–270.
- U.S. Department of Health and Human Services. Health Resources and Services Administration: HIV/AIDS programs. Available at: http://hab.hrsa.gov/abouthab/legislation.html. Accessed April 8, 2015.
© 2015 Society of Hospital Medicine

Opioid Risk Measure for Hospitalization
Longer term and higher doses of opioid analgesics (OAs) have been associated with multiple adverse outcomes such as loss of work, cognitive decline, and poor function.[1, 2, 3, 4] One of the most widely reported complications of opioid therapy is drug overdose.[5, 6, 7, 8, 9] In population‐based studies, daily morphine equivalent doses >100 mg have been associated with significantly increased risk of drug overdose.[5, 6, 7, 8, 9, 10] Among health maintenance organization (HMO) enrollees filling at least 2 prescriptions for opioids, our group reported that daily opioid doses 100 mg were associated with approximately threefold greater adjusted odds of drug overdose.[10] We also observed over a twofold increase in odds of drug overdose for lower daily doses of 50 to 99 mg if the patient also received a high total opioid dose (>1830 mg) over a 6‐month period. This analysis suggests that clinicians may need to monitor not only daily dose but also total dose of opioids to reduce the risk of drug overdose.
Yet drug overdose represents only a small subset of all hospitalizations for persons receiving long‐term or higher doses of opioids for noncancer pain. These patients have significant demand for urgent care services, including hospitalization, for diverse reasons such as adverse effects of opioids, underlying cause of chronic pain, and comorbidities such as mental health disorders.[11] In a cohort of elderly primary care patients who were high hospital utilizers, Freund and colleagues reported that chronic pain and depression were the most common conditions co‐occurring with their other comorbidities.[12] However, little is known about the association of opioid dose with the risk of all‐cause hospitalization for patients with noncancer pain.
In this article we examined hospitalizations for a national cohort of HMO enrollees with noncancer pain who filled at least 2 prescriptions for schedule II or III opioids over a 3.5‐year timeframe. This retrospective cohort analysis aims to identify clinically useful opioid dose measures for clinicians, administrators, and policymakers to use in identifying patients at increased risk of future hospitalization who may warrant interventions to reduce this risk.
METHODS
Study Sample
From Aetna administrative databases including enrollment files and paid claims for services, we identified 261,528 subjects aged 18 to 64 years who had at least 2 paid claims for schedule II or III noninjectable OA prescriptions from January 2009 through July 2012.[10] For individuals meeting these criteria, study cohort eligibility required at least 12 months of enrollment and complete data on demographics and OA prescriptions as well as clinical conditions from at least 1 encounter (see Supporting Information, Appendix 1, in the online version of this article).[10] We excluded subjects with a cancer diagnosis who have high hospital utilization and those younger than 45 years because of a higher likelihood of pregnancy‐related hospitalization. To afford sufficient observation time for outcomes, subjects with <12 months follow‐up after the first opioid prescription were excluded. The resultant study cohort totaled 87,688 subjects.
To capture the changing nature of medication utilization and clinical conditions in this longitudinal study, we divided the study timeframe into 6‐month intervals starting with the first opioid prescription and ending with the subject's last enrollment or end of the study (see Supporting Information, Appendix 2, in the online version of this article). Six‐month intervals were studied because this is the maximum duration of benefit from randomized trials of opioid therapy for noncancer pain.[13] This study was approved by the University of Texas Health Science Center at San Antonio's institutional review board.
Outcome Variables
Study outcomes were all‐cause hospitalization (binary) and hospital days (discrete) per 6‐month interval and were measured repeatedly for up to 6, 6‐month intervals.
Primary Independent Variables
We examined 2 opioid dose measures within a 6‐month interval and hospitalization outcomes in the next 6 months (see Supporting Information, Appendix 2, in the online version of this article). We did not examine OA use in the last 6 months of the study timeframe because subsequent hospitalization outcomes were not available. We defined the total morphine equivalent dose of OA prescriptions filled within a 6‐month interval based on the method used by Edlund et al.[14] and adapted by our group.[10] We also defined the daily dose of OAs that is a widely used metric used in chronic pain management guidelines.[10, 15]
To calculate the total opioid dose, all filled schedule II or III OA prescriptions (noninjectable formulations) were identified from claims for filled prescriptions for each 6‐month interval. The morphine equivalent dose for each opioid prescription was calculated from the number of pills dispensed multiplied by strength (in milligrams) and by a morphine equivalent conversion factor derived from several sources including published data,[16, 17] conversion tables from Internet sources, and drug information resources.[18, 19] A clinical pharmacist reviewed and finalized conversions. When an opioid prescription spanned two, 6‐month intervals, the dose was divided proportionate to time in each interval. The total dose for all opioid prescriptions within an interval was summed and categorized by quartile of nonzero total dose as: 1 to 190, 191 to 450, 451 to 1830, and >1830 mg.[10]
To calculate the daily opioid dose in each interval, the total dose was divided by total nonoverlapping days' supply covered by all prescriptions. The average daily dose was categorized as in other studies: 1 to 19, 20 to 49, 50 to 99, and 100 mg.[5, 6, 10] In each 6‐month interval, the percentage of days covered by filled prescriptions was calculated as total days' supply/180.
Other Independent Variables
Demographic data included age as of July 2012, sex, and US region. From available diagnosis codes for encounters, pain‐related conditions were identified including: back pain, other osteoarthritis, neuropathic pain, chronic pain unspecified, or chronic headache (International Classification of Diseases, Ninth Revision, Clinical Modification codes available from authors). Mental health/substance use disorders were similarly identified: anxiety or post‐traumatic stress disorder (PTSD), depression, psychosis, drug abuse, and alcohol abuse. Once a psychiatric condition or substance use disorder was diagnosed, it was considered to persist because these are usually not transient. We examined filled prescriptions for psychoactive drugs in 6‐month intervals including: benzodiazepines (i.e., clonazepam, alprazolam, lorazepam, diazepam, chlordiazepine, temazepam, flurazepam), antidepressants (i.e., selective serotonin reuptake inhibitors, serotonin and norepinephrine reuptake inhibitors, tricyclics [complete list available from authors]), and sedatives (i.e., zolpidem, eszopiclone). For these drugs, time‐varying variables were created as follows: benzodiazepines (0, 130, 3190, 91180 days), sedatives (0, 130, 3190, 91180 days), and antidepressants (0, 160, 61180 days). Categories for duration of antidepressants differed because a clinical response can take up to 6 to 8 weeks.
Statistical Analyses
Descriptive statistics were examined for study cohort characteristics. For the binary all‐cause hospitalization outcome, repeated measures logistic regression models were estimated using generalized estimating equations (GEE) to examine associations of daily opioid dose, total opioid dose, and their interaction with all‐cause hospitalization. The fully adjusted model includes demographics, chronic pain conditions, mental health conditions, substance use disorders, other psychoactive drugs, and current hospitalization (yes/no). For the hospital days per 6‐month outcome, a series of repeated measures Poisson regressions were estimated using the GEE approach.
In a post hoc sensitivity analysis, we examined the association of the percentage of days covered by prescribed opioids, categorized based on approximate quartiles and clinical judgment, with hospitalization among subjects with a high total dose (>1830 mg). For this analysis, we created a composite measure of opioid treatment for each 6‐month interval that has 6 categories: (1) none, (2) low total dose 1 to 1830 mg, (3) high total dose >1830 mg with 50% of days on opioids, (4) total dose >1830 mg with >50% to 75% of days on opioids, (5) total dose >1830 mg with >75% to 90% of days on opioids, and (6) total dose >1830 mg and >90% of days on opioids. Adjusted regression analyses described above were repeated for both outcomes and included this composite measure. All statistical tests were performed with a 2‐sided significance level of 0.05, and analyses were conducted using SAS version 9.3 (SAS Institute, Cary, NC).
RESULTS
Of 87,688 study subjects, 54.8% were women, and the mean age was 53.8 years (standard deviation [SD]=5.5). Nearly half of the cohort resided in Southern states (Table 1). In the baseline 6‐month interval, the most common chronic noncancer pain conditions were musculoskeletal involving large joint arthritis/arthralgia (38.4%) and back pain (28.2%). In regard to mental health and substance use conditions, both anxiety/PTSD and depression were diagnosed in approximately 7% of the cohort, whereas psychosis, and alcohol and other substance use disorders were each diagnosed in <2%. In the baseline interval, 12.7% of subjects were hospitalized. The majority of patients received a daily opioid dose of 20 to 49 mg, and the median total dose was 450 mg. The median percent of time exposed to opioids was 6.7% among all study subjects and 70% for those with a high total dose (>1830 mg).
In the 3 study years, an average of 12% of the cohort was hospitalized yearly (Table 2), or 1120 hospitalizations per 10,000 person‐years. Among those who were hospitalized, inpatient days averaged 6.5 (SD=8.5). The highest proportion of hospitalized subjects was 6.5%, occurring in the 6‐month interval immediately following the first opioid treatment interval. In subsequent 6‐month intervals, hospitalization rates were relatively stable, ranging from 5.2% to 6.1% (Table 2). As shown, future hospitalization rates increased monotonically, with increasing total or daily dose within each 6‐month interval.
| Characteristics | Total, N=87,688 |
|---|---|
| |
| Demographics | |
| Women, n (%) | 48,077 (54.8) |
| Age, mean (SD) | 53.8 (5.5) |
| US region, n (%) | |
| Midwest | 4,609 (5.3) |
| Northeast | 27,568 (31.4) |
| South | 40,767 (46.5) |
| West | 14,744 (16.8) |
| Clinical conditions, n (%)b | |
| Noncancer pain conditions | |
| Back pain | 24,767 (28.2) |
| Large joint arthritis, other musculoskeletalc | 33,689 (38.4) |
| Neuropathy | 1,519 (1.7) |
| Chronic pain (unspecified) | 3,229 (3.7) |
| Headache | 2,837 (3.2) |
| Mental health and substance use disorders | |
| Anxiety or post‐traumatic stress disorder | 6,006 (6.9) |
| Depression | 6,111 (7.0) |
| Psychosis | 1,259 (1.4) |
| Alcohol abuse | 877 (1.0) |
| Other substance abuse | 615 (0.7) |
| Current hospitalization, n (%) | 11,165 (12.7) |
| Opioid measures, n (%) | |
| Daily MED dose, mg | |
| 0 | |
| 119 | 9,870 (11.3) |
| 2049 | 50,050 (57.1) |
| 5099 | 21,188 (24.2) |
| 100 | 6,580 (7.5) |
| Total MED dose, mg | |
| 0 | |
| 1190 | 20,276 (23.1) |
| 191450 | 26,000 (29.7) |
| 4511,830 | 23,551 (26.9) |
| >1,830 | 17,861 (20.4) |
| Percent time exposed to opioid therapy, median (Q1, Q3) | |
| Among any total MED | 6.7 (2.8, 22.2) |
| Among total MED >1,830 mg | 70 (42.8, 93.9) |
| Subjects | 6‐Month Interval | |||||
|---|---|---|---|---|---|---|
| 1 (Baseline), N=87,688 | 2, N=65,835 | 3, N=46,041 | 4, N=31,550 | 5, N=18,915 | 6, N=3,502 | |
| ||||||
| Overall (%) | 6.5 | 5.9 | 5.9 | 5.4 | 5.2 | 6.1 |
| Opioid dose measure | ||||||
| Daily dose (%) | ||||||
| 0 mg | 4.8 | 4.4 | 4.0 | 3.6 | 3.2 | |
| 119 mg | 5.9 | 5.6 | 6.0 | 5.6 | 5.6 | 4.4 |
| 2049 mg | 6.2 | 6.5 | 7.1 | 6.6 | 6.1 | 6.1 |
| 5099 mg | 6.8 | 7.9 | 7.5 | 7.6 | 7.6 | 9.8 |
| 100 mg | 9.0 | 9.3 | 10.3 | 9.2 | 9.5 | 9.5 |
| Total dose (%) a | ||||||
| 0 mg | 4.8 | 4.4 | 4.0 | 3.6 | 3.2 | |
| 1190 mg | 5.5 | 4.7 | 5.0 | 4.1 | 4.0 | 2.7 |
| 191450 mg | 5.1 | 5.1 | 6.3 | 6.7 | 5.0 | 3.2 |
| 4511,830 mg | 6.5 | 7.4 | 7.9 | 7.2 | 7.1 | 7.0 |
| >1,830 mg | 9.8 | 9.6 | 9.6 | 8.9 | 8.8 | 9.0 |
In unadjusted analyses, a significant interaction between daily dose and total dose (P<0.001) revealed that, within each daily dose category, the odds of hospitalization differed by total dose (all P<0.05, Table 3). When the total dose was >1830 mg, the odds of future hospitalization rose monotonically with increasing daily dose (i.e., <20, 2049, 5099, 100 mg): 1.33, 1.84, 1.96, and 2.08 (P<0.05 for all comparisons vs no opioids). On the other hand, when the total dose was 450 mg or less, all daily dose categories including a very high daily dose (100 mg) were not associated with future hospitalization (all P>0.05 vs no opioids). When the total dose was 451 to 1830 mg, a nonlinear association with hospitalization appeared with higher odds for lower daily doses. For the outcome of hospital days per 6‐month interval, increasing daily dose was also associated with more hospital days per 6‐month interval when the total dose was high (>1830 mg), whereas for lower total doses, daily dose was weakly positive or even protective versus no opioids.
| All‐Cause Hospitalization (Yes/No), Odds Ratio (95% CI) | |||||
|---|---|---|---|---|---|
| Total Morphine Equivalent Dose, mg | Daily Morphine Equivalent Dose, mg | ||||
| 0 | 19 | 2049 | 5099 | 100 | |
| Hospital Days per 6‐Month, Incident Rate Ratio (95% CI) | |||||
| Total Morphine Equivalent Dose, mg | Daily Morphine Equivalent Dose, mg | ||||
| 0 | 119 | 2049 | 5099 | 100 | |
| |||||
| 0 | 1 | ||||
| 1190 | 1.06 (0.95‐1.19) | 1.01 (0.95‐1.08) | 1.07 (0.95‐1.19) | 0.73 (0.44‐1.21) | |
| 191450 | 1.08 (0.96‐1.22) | 1.03 (0.96‐1.10) | 0.99 (0.9‐1.10) | 0.88 (0.67‐1.15) | |
| 4511,830 | 1.34 (1.21‐1.48)a | 1.37 (1.28‐1.46)a | 1.16 (1.05‐1.27)a | 1.25 (0.98‐1.59) | |
| >1,830 | 1.33 (1.09‐1.62)a | 1.84 (1.73‐1.97)a | 1.96 (1.82‐2.11)a | 2.08 (1.93‐2.24)a | |
| 0 | 1 | ||||
| 1190 | 0.95 (0.79‐1.14) | 0.90 (0.82‐0.99)a | 1.03 (0.87‐1.23) | 0.63 (0.36‐1.12) | |
| 191450 | 0.92 (0.77‐1.10) | 0.93 (0.84‐1.02) | 0.79 (0.69‐0.91)a | 0.69 (0.49‐0.98)a | |
| 4511,830 | 1.31 (1.10‐1.57)a | 1.26 (1.13‐1.40)a | 1.01 (0.86‐1.19) | 0.99 (0.71‐1.37) | |
| >1,830 | 1.32 (0.93‐1.89) | 1.79 (1.60‐2.01)a | 1.76 (1.54‐2.01)a | 2.09 (1.85‐2.36)a | |
In the model adjusting for all covariates (Table 4), the interaction between total dose and daily dose was also significant (P=0.002). When the total dose was high (>1830 mg), the adjusted odds of future hospitalization were significantly increased by 35% to 44% for daily doses of 20 to 49 mg or greater versus no opioids (P<0.05 for all comparisons). When the total dose was <1830 mg, the majority of daily dose categories were not significantly associated with hospitalization. Similarly, in the fully adjusted analysis of hospital days, the number of inpatient days were increased by 28% to 48% when the total dose was >1830 mg and daily dose was >20 mg, but these associations were nonsignificant or protective when the total dose was lower.
| All‐Cause Hospitalization (Yes/No), Odds Ratio (95% CI) | |||||
|---|---|---|---|---|---|
| Total Morphine Equivalent Dose, mg | Daily Morphine Equivalent Dose, mg | ||||
| 0 | 119 | 2049 | 5099 | 100 | |
| Hospital Days per 6‐Month, Incident Rate Ratio (95% CI) | |||||
| Total Morphine Equivalent Dose, mg | Daily Morphine Equivalent Dose, mg | ||||
| 0 | 119 | 2049 | 5099 | 100 | |
| |||||
| 0 | 1 | ||||
| 1190 | 1.09 (0.97‐1.23) | 1.07 (1.001.14) | 1.12 (1.001.26)b | 0.75 (0.45‐1.23) | |
| 191450 | 1.00 (0.88‐1.13) | 0.99 (0.92‐1.06) | 0.97 (0.88‐1.08) | 0.87 (0.68‐1.12) | |
| 4511,830 | 1.16 (1.04‐1.29) | 1.14 (1.07‐1.22) | 0.94 (0.85‐1.03) | 1.08 (0.85‐1.35) | |
| >1,830 | 1.10 (0.90‐1.34) | 1.41 (1.32‐1.51) | 1.35 (1.25‐1.46) | 1.44 (1.34‐1.55) | |
| 0 | 1 | ||||
| 1190 | 0.97 (0.8‐1.18) | 0.94 (0.85‐1.04) | 1.06 (0.88‐1.27) | 0.60 (0.33‐1.1) | |
| 191450 | 0.85 (0.71‐1.02) | 0.88 (0.79‐0.98) | 0.75 (0.65‐0.86) | 0.65 (0.46‐0.92) | |
| 4511,830 | 1.16 (0.97‐1.4) | 1.09 (0.97‐1.22) | 0.83 (0.71‐0.98) | 0.81 (0.59‐1.13) | |
| >1,830 | 1.12 (0.77‐1.63) | 1.41 (1.25‐1.58) | 1.28 (1.12‐1.46) | 1.48 (1.29‐1.69) | |
In a sensitivity analysis, we examined the percentage of days covered by filled opioid prescriptions within a 6‐month interval for subjects receiving high‐dose therapy (Table 5). Compared with no opioid therapy, the adjusted odds of future hospitalization were 5% greater for low total opioid dose (11830 mg) and 21% greater for high total dose (>1830 mg) when the duration of treatment was shorter (50% of the 6‐month interval). However, the odds were increased by 41% to 51% for a high total dose (>1830 mg), with longer periods of treatment (>50% of the interval). For hospital days as the outcome, subjects with high total doses (>1830 mg) and longer periods of treatment (>50% of the interval) had 41% to 71% more hospital days per 6‐month interval than those with no opioid therapy.
| Opioid Analgesic Category | All‐Cause Hospitalization | Hospital Days per 6 Months |
|---|---|---|
| Odds Ratio (95% CI) | Incident Rate Ratio (95% CI) | |
| ||
| 0 mg | 1 | 1 |
| 11,830 mg | 1.05 (1.001.10)b | 0.94 (0.87‐1.01) |
| >1,830 mg and 50% days on opioids | 1.21 (1.11‐1.31)b | 1.10 (0.96‐1.26) |
| >1,830 mg and >50 to 75% days on opioids | 1.51 (1.40‐1.64)b | 1.45 (1.26‐1.67) |
| >1,830 mg and >75 to 90% days on opioids | 1.50 (1.38‐1.64)b | 1.71 (1.46‐1.99) |
| >1,830 mg and >90% days on opioids | 1.41 (1.31‐1.52)b | 1.41 (1.26‐1.58) |
DISCUSSION
In a national cohort of HMO enrollees who filled at least 2 prescriptions for OAs, 12% were hospitalized annually. Other studies of opioid users have focused on only a fraction of these hospitalizations. For example, a recent Agency for Healthcare Research and Quality study reported that the rate of hospitalization for complications from accidental or deliberate overuse of opioids more than doubled from 11.7/10,000 in 1993 to 29.5/10,000 in 2010.[20] However, in our cohort, the all‐cause hospitalization rate was 1120 per 10,000 person‐years, or over 40 times greater than the rate for complications from overuse of opioids. By comparison, hospitalization for heart failure was only 32.8/10,000 nationally in 2010.[21] Thus, our study confirms the significant demand for hospital care by patients treated with opioids. A novel finding of our study is that the total dose of prescriptions filled over 6 months is significantly associated with an increased risk of future hospitalization. When the total dose within 6 months was in the top quartile (>1830 mg in our cohort), the adjusted odds of future hospitalization ranged from 35% to 44% greater than no opioids for daily opioid doses above 20 mg/day. On the other hand, when the total dose was 1830 mg, the daily opioid dose was only weakly associated with future hospitalization. These associations were similar for hospital days per 6‐month interval as the outcome.
Edlund and colleagues examined the total dose of opioids in a national cohort of veterans with chronic noncancer pain who filled at least 1 opioid prescription.[22] In 2011, the 60th percentile for the total opioid dose for these veterans was 3610 mg within a year, which is roughly equivalent to our top quartile (1830 mg) over a 6‐month interval. These data support replicating our study in veterans to evaluate whether a similarly increased risk of hospitalization appears for those with high total opioid doses. In support of a concern among veterans, a population‐based, cross‐sectional study of hospitalized veterans reported a high rate of chronic opioid therapy (90 days) in the 6 months prior to hospitalization.[23]
Other studies have reported increased risk of hospitalization with chronic opioid therapy. Among 1045 patients followed up to 1‐year post‐transplantation, long‐term opioids were associated with up to a sixfold greater risk of at least 4 admissions within that year.[24] Among 13,127 Danish adults on opioid therapy, the odds of future hospitalization from injuries were increased by 74% for long‐term therapy and 46% for short‐term therapy versus no opioids and by threefold and 1.6‐fold, respectively, for hospitalization due to toxicity/poisoning.[9] However, none of these studies examined the dose of opioids.
In a sensitivity analysis, we found that when a subject received a high total opioid dose within 6 months, treatment for more than 50% of the interval (i.e., >3 months) was associated with a significantly increased risk of future hospitalization and significantly more hospital days. Because the strongest evidence for the benefit of opioids for chronic noncancer pain comes from trials of <3 months,[25] these data lend additional support to recommendations to minimize both dose and duration of opioid therapy.
Our study has several limitations. First, we did not assess the immediate risk of hospitalization after starting opioid therapy. Second, our outcome of hospitalization represents only 1 measure of risk. Thus, our data should not be regarded as supporting short‐term use of high‐dose opioids over 100 to 120 mg per day.[26] In an earlier study, we reported that either a high daily dose (100 mg) or a moderately high daily dose (5099 mg) plus a high total dose (>1830 mg) increased the risk of drug overdose.[10] Third, we could not examine the reason for hospitalizations in this analysis. Therefore, we cannot presume that opioid therapy caused these hospitalizations, but it likely serves as a proxy for other factors such as disability and mental health disorders that increase risk of hospitalization. However, we did adjust for pain conditions as well as mental health and substance abuse disorders that are known to increase the risk of hospitalization in other cohorts.[27, 28, 29, 30] In a national veterans study, the most common clinical conditions associated with long‐term opioid therapy were major depression and PTSD.[22] Last, we did also not consider the number of prescribers of opioids. In a Medicare study, 1 versus 4 prescribers of OAs increased patients' annual hospitalization rate from 1.6% to 4.8%, respectively.[31]
Although the total opioid dose categories observed for our study population may differ from those in other cohorts, these data offer additional evidence for clinicians to consider this measure when assessing risk for hospitalization, and among subjects on high total doses, the percentage of time on opioids offers an additional measure of risk. Because opioid users with noncancer pain are heavy consumers of healthcare services,32,33 public health benefits and reductions in costs of care may be substantial if opportunities can be identified to reduce hospital utilization by persons treated with higher doses of OAs.
Disclosures
The work on this project was supported by an intramural grant from the National Center for Research Resources and the National Center for Advancing Translational Sciences, National Institutes of Health, through Grant 1UL TR001120. The content is solely the responsibility of the authors and does not necessarily represent the official views of the NIH. The authors report no conflicts of interest.
- , , . Higher opioid doses predict poorer functional outcome in patients with chronic disabling occupational musculoskeletal disorders. J Bone Joint Surg Am. 2009;91:919–927.
- , , . Opioid therapy for nonspecific low back pain and the outcome of chronic work loss. Pain. 2009;142:194–201.
- , , , , , . The comparative safety of analgesics in older adults with arthritis. Arch Intern Med. 2010;170:1968–1976.
- , , , et al. Evidence of specific cognitive deficits in patients with chronic low back pain under long‐term substitution treatment of opioids. Pain Physician. 2014;17:9–20.
- , , , et al. Opioid prescriptions for chronic pain and overdose: a cohort study. Ann Intern Med. 2010;152:85–92.
- , , , et al. Association between opioid prescribing patterns and opioid overdose‐related deaths. JAMA. 2011;305:1315–1321.
- , , , , , . Trends in opioid use and dosing among socio‐economically disadvantaged patients. Open Med. 2011;5:e13–e22.
- , , , et al. A history of being prescribed controlled substances and risk of drug overdose death. Pain Med. 2012;13:87–95.
- , , , , . Chronic pain, opioid prescriptions and mortality in Denmark: a population‐based cohort study. Pain. 2014;155:2486–2490.
- , . Assessing risk for drug overdose in a national cohort: Role for both daily and total opioid dose [published online ahead of print December 5, 2015]? J Pain. doi: 10.1016/j.jpain.2014.11.007.
- Institute of Medicine (US) Committee on Advancing Pain Research, Care, and Education. Relieving pain in America: a blueprint for transforming prevention, care, education, and research. Available at: http://www.ncbi.nlm.nih.gov/books/NBK91497. Accessed December 12, 2014.
- , , , , . Patterns of multimorbidity in primary care patients at high risk of future hospitalization. Popul Health Manag. 2012;15:119–124.
- , , , et al. Long‐term opioid management for chronic noncancer pain. Cochrane Database Syst Rev. 2010;(1):CD006605.
- , , , , , . An analysis of heavy utilizers of opioids for chronic noncancer pain in the TROUP study. J Pain Symptom Manage. 2010;40:279–289.
- , , , et al. Opioid prescribing: a systematic review and critical appraisal of guidelines for chronic pain. Ann Intern Med. 2014;160:38–47.
- . The treatment of cancer pain. N Engl J Med. 1985;313:84–95.
- , , , , . Opioid rotation in the management of chronic pain: where is the evidence? Pain Pract. 2010;10:85–93.
- . Palliative Care Perspectives. New York, NY: Oxford University Press; 2003:36–74.
- Agency Medical Director's Group. Web‐based opioid dose calculator. Available at http://agencymeddirectors.wa.govmobile.html. Accessed April 7, 2014.
- Agency for Healthcare Research and Quality. Hospital inpatient utilization related to opioid overuse among adults, 1993–2012. Available at: http://www.hcup-us.ahrq.gov/reports/statbriefs/sb177-Hospitalizations-for-Opioid-Overuse.pdf. Accessed December 12, 2014.
- National Center for Health Statistics. Hospitalization for congestive heart failure: United States, 2000–2010. Available at: http://www.cdc.gov/nchs/data/databriefs/db108.htm#trends. Accessed December 12, 2014.
- , , , et al. Patterns of opioid use for chronic non‐cancer pain in the veterans health administration from 2009 to 2011. Pain. 2014;155:2337–2343.
- , , , , , . Prevalence and characteristics of hospitalized adults on chronic opioid therapy. J Hosp Med. 2014;9:82–87.
- , , , . Chronic opioid analgesic usage post‐kidney transplantation and clinical outcomes. Clin Transplant. 2014;28:1041–1046.
- , , , . A comparison between enriched and nonenriched enrollment randomized withdrawal trials of opioids for chronic noncancer pain. Pain Res Manag. 2011;16:337–351.
- , , , , . Redesigning delivery of opioids to optimize pain management, improve outcomes, and contain costs. Pain Med. 2013;14:36–42.
- , , , , . Interaction of age and opioid dependence on length of hospital stay for spine surgery patients. Psychol Rep. 2009;105:361–364.
- , , , et al. Sex, depression, and risk of hospitalization and mortality in chronic obstructive pulmonary disease. Arch Intern Med. 2007;167:2345–2353.
- , , , et al. Risk of fractures requiring hospitalization after an initial prescription for zolpidem, alprazolam, lorazepam, or diazepam in older adults. J Am Geriatr Soc. 2011;59:1883–1890.
- , , , et al. Relationship between potential opioid‐related adverse effects and hospital length of stay in patients receiving opioids after orthopedic surgery. Pharmacotherapy. 2012;32:502–514.
- , , , . Opioid prescribing by multiple providers in Medicare: Retrospective observational study of insurance claims. BMJ. 2014;348:g1393.
- , , , , , . Analgesic usage for low back pain: Impact on health care costs and service use. Spine (Phila Pa 1976). 2005;30:1075–1081.
- . Economic burden of prescription opioid misuse and abuse. J Manag Care Pharm. 2009;15:556–562.
Longer term and higher doses of opioid analgesics (OAs) have been associated with multiple adverse outcomes such as loss of work, cognitive decline, and poor function.[1, 2, 3, 4] One of the most widely reported complications of opioid therapy is drug overdose.[5, 6, 7, 8, 9] In population‐based studies, daily morphine equivalent doses >100 mg have been associated with significantly increased risk of drug overdose.[5, 6, 7, 8, 9, 10] Among health maintenance organization (HMO) enrollees filling at least 2 prescriptions for opioids, our group reported that daily opioid doses 100 mg were associated with approximately threefold greater adjusted odds of drug overdose.[10] We also observed over a twofold increase in odds of drug overdose for lower daily doses of 50 to 99 mg if the patient also received a high total opioid dose (>1830 mg) over a 6‐month period. This analysis suggests that clinicians may need to monitor not only daily dose but also total dose of opioids to reduce the risk of drug overdose.
Yet drug overdose represents only a small subset of all hospitalizations for persons receiving long‐term or higher doses of opioids for noncancer pain. These patients have significant demand for urgent care services, including hospitalization, for diverse reasons such as adverse effects of opioids, underlying cause of chronic pain, and comorbidities such as mental health disorders.[11] In a cohort of elderly primary care patients who were high hospital utilizers, Freund and colleagues reported that chronic pain and depression were the most common conditions co‐occurring with their other comorbidities.[12] However, little is known about the association of opioid dose with the risk of all‐cause hospitalization for patients with noncancer pain.
In this article we examined hospitalizations for a national cohort of HMO enrollees with noncancer pain who filled at least 2 prescriptions for schedule II or III opioids over a 3.5‐year timeframe. This retrospective cohort analysis aims to identify clinically useful opioid dose measures for clinicians, administrators, and policymakers to use in identifying patients at increased risk of future hospitalization who may warrant interventions to reduce this risk.
METHODS
Study Sample
From Aetna administrative databases including enrollment files and paid claims for services, we identified 261,528 subjects aged 18 to 64 years who had at least 2 paid claims for schedule II or III noninjectable OA prescriptions from January 2009 through July 2012.[10] For individuals meeting these criteria, study cohort eligibility required at least 12 months of enrollment and complete data on demographics and OA prescriptions as well as clinical conditions from at least 1 encounter (see Supporting Information, Appendix 1, in the online version of this article).[10] We excluded subjects with a cancer diagnosis who have high hospital utilization and those younger than 45 years because of a higher likelihood of pregnancy‐related hospitalization. To afford sufficient observation time for outcomes, subjects with <12 months follow‐up after the first opioid prescription were excluded. The resultant study cohort totaled 87,688 subjects.
To capture the changing nature of medication utilization and clinical conditions in this longitudinal study, we divided the study timeframe into 6‐month intervals starting with the first opioid prescription and ending with the subject's last enrollment or end of the study (see Supporting Information, Appendix 2, in the online version of this article). Six‐month intervals were studied because this is the maximum duration of benefit from randomized trials of opioid therapy for noncancer pain.[13] This study was approved by the University of Texas Health Science Center at San Antonio's institutional review board.
Outcome Variables
Study outcomes were all‐cause hospitalization (binary) and hospital days (discrete) per 6‐month interval and were measured repeatedly for up to 6, 6‐month intervals.
Primary Independent Variables
We examined 2 opioid dose measures within a 6‐month interval and hospitalization outcomes in the next 6 months (see Supporting Information, Appendix 2, in the online version of this article). We did not examine OA use in the last 6 months of the study timeframe because subsequent hospitalization outcomes were not available. We defined the total morphine equivalent dose of OA prescriptions filled within a 6‐month interval based on the method used by Edlund et al.[14] and adapted by our group.[10] We also defined the daily dose of OAs that is a widely used metric used in chronic pain management guidelines.[10, 15]
To calculate the total opioid dose, all filled schedule II or III OA prescriptions (noninjectable formulations) were identified from claims for filled prescriptions for each 6‐month interval. The morphine equivalent dose for each opioid prescription was calculated from the number of pills dispensed multiplied by strength (in milligrams) and by a morphine equivalent conversion factor derived from several sources including published data,[16, 17] conversion tables from Internet sources, and drug information resources.[18, 19] A clinical pharmacist reviewed and finalized conversions. When an opioid prescription spanned two, 6‐month intervals, the dose was divided proportionate to time in each interval. The total dose for all opioid prescriptions within an interval was summed and categorized by quartile of nonzero total dose as: 1 to 190, 191 to 450, 451 to 1830, and >1830 mg.[10]
To calculate the daily opioid dose in each interval, the total dose was divided by total nonoverlapping days' supply covered by all prescriptions. The average daily dose was categorized as in other studies: 1 to 19, 20 to 49, 50 to 99, and 100 mg.[5, 6, 10] In each 6‐month interval, the percentage of days covered by filled prescriptions was calculated as total days' supply/180.
Other Independent Variables
Demographic data included age as of July 2012, sex, and US region. From available diagnosis codes for encounters, pain‐related conditions were identified including: back pain, other osteoarthritis, neuropathic pain, chronic pain unspecified, or chronic headache (International Classification of Diseases, Ninth Revision, Clinical Modification codes available from authors). Mental health/substance use disorders were similarly identified: anxiety or post‐traumatic stress disorder (PTSD), depression, psychosis, drug abuse, and alcohol abuse. Once a psychiatric condition or substance use disorder was diagnosed, it was considered to persist because these are usually not transient. We examined filled prescriptions for psychoactive drugs in 6‐month intervals including: benzodiazepines (i.e., clonazepam, alprazolam, lorazepam, diazepam, chlordiazepine, temazepam, flurazepam), antidepressants (i.e., selective serotonin reuptake inhibitors, serotonin and norepinephrine reuptake inhibitors, tricyclics [complete list available from authors]), and sedatives (i.e., zolpidem, eszopiclone). For these drugs, time‐varying variables were created as follows: benzodiazepines (0, 130, 3190, 91180 days), sedatives (0, 130, 3190, 91180 days), and antidepressants (0, 160, 61180 days). Categories for duration of antidepressants differed because a clinical response can take up to 6 to 8 weeks.
Statistical Analyses
Descriptive statistics were examined for study cohort characteristics. For the binary all‐cause hospitalization outcome, repeated measures logistic regression models were estimated using generalized estimating equations (GEE) to examine associations of daily opioid dose, total opioid dose, and their interaction with all‐cause hospitalization. The fully adjusted model includes demographics, chronic pain conditions, mental health conditions, substance use disorders, other psychoactive drugs, and current hospitalization (yes/no). For the hospital days per 6‐month outcome, a series of repeated measures Poisson regressions were estimated using the GEE approach.
In a post hoc sensitivity analysis, we examined the association of the percentage of days covered by prescribed opioids, categorized based on approximate quartiles and clinical judgment, with hospitalization among subjects with a high total dose (>1830 mg). For this analysis, we created a composite measure of opioid treatment for each 6‐month interval that has 6 categories: (1) none, (2) low total dose 1 to 1830 mg, (3) high total dose >1830 mg with 50% of days on opioids, (4) total dose >1830 mg with >50% to 75% of days on opioids, (5) total dose >1830 mg with >75% to 90% of days on opioids, and (6) total dose >1830 mg and >90% of days on opioids. Adjusted regression analyses described above were repeated for both outcomes and included this composite measure. All statistical tests were performed with a 2‐sided significance level of 0.05, and analyses were conducted using SAS version 9.3 (SAS Institute, Cary, NC).
RESULTS
Of 87,688 study subjects, 54.8% were women, and the mean age was 53.8 years (standard deviation [SD]=5.5). Nearly half of the cohort resided in Southern states (Table 1). In the baseline 6‐month interval, the most common chronic noncancer pain conditions were musculoskeletal involving large joint arthritis/arthralgia (38.4%) and back pain (28.2%). In regard to mental health and substance use conditions, both anxiety/PTSD and depression were diagnosed in approximately 7% of the cohort, whereas psychosis, and alcohol and other substance use disorders were each diagnosed in <2%. In the baseline interval, 12.7% of subjects were hospitalized. The majority of patients received a daily opioid dose of 20 to 49 mg, and the median total dose was 450 mg. The median percent of time exposed to opioids was 6.7% among all study subjects and 70% for those with a high total dose (>1830 mg).
In the 3 study years, an average of 12% of the cohort was hospitalized yearly (Table 2), or 1120 hospitalizations per 10,000 person‐years. Among those who were hospitalized, inpatient days averaged 6.5 (SD=8.5). The highest proportion of hospitalized subjects was 6.5%, occurring in the 6‐month interval immediately following the first opioid treatment interval. In subsequent 6‐month intervals, hospitalization rates were relatively stable, ranging from 5.2% to 6.1% (Table 2). As shown, future hospitalization rates increased monotonically, with increasing total or daily dose within each 6‐month interval.
| Characteristics | Total, N=87,688 |
|---|---|
| |
| Demographics | |
| Women, n (%) | 48,077 (54.8) |
| Age, mean (SD) | 53.8 (5.5) |
| US region, n (%) | |
| Midwest | 4,609 (5.3) |
| Northeast | 27,568 (31.4) |
| South | 40,767 (46.5) |
| West | 14,744 (16.8) |
| Clinical conditions, n (%)b | |
| Noncancer pain conditions | |
| Back pain | 24,767 (28.2) |
| Large joint arthritis, other musculoskeletalc | 33,689 (38.4) |
| Neuropathy | 1,519 (1.7) |
| Chronic pain (unspecified) | 3,229 (3.7) |
| Headache | 2,837 (3.2) |
| Mental health and substance use disorders | |
| Anxiety or post‐traumatic stress disorder | 6,006 (6.9) |
| Depression | 6,111 (7.0) |
| Psychosis | 1,259 (1.4) |
| Alcohol abuse | 877 (1.0) |
| Other substance abuse | 615 (0.7) |
| Current hospitalization, n (%) | 11,165 (12.7) |
| Opioid measures, n (%) | |
| Daily MED dose, mg | |
| 0 | |
| 119 | 9,870 (11.3) |
| 2049 | 50,050 (57.1) |
| 5099 | 21,188 (24.2) |
| 100 | 6,580 (7.5) |
| Total MED dose, mg | |
| 0 | |
| 1190 | 20,276 (23.1) |
| 191450 | 26,000 (29.7) |
| 4511,830 | 23,551 (26.9) |
| >1,830 | 17,861 (20.4) |
| Percent time exposed to opioid therapy, median (Q1, Q3) | |
| Among any total MED | 6.7 (2.8, 22.2) |
| Among total MED >1,830 mg | 70 (42.8, 93.9) |
| Subjects | 6‐Month Interval | |||||
|---|---|---|---|---|---|---|
| 1 (Baseline), N=87,688 | 2, N=65,835 | 3, N=46,041 | 4, N=31,550 | 5, N=18,915 | 6, N=3,502 | |
| ||||||
| Overall (%) | 6.5 | 5.9 | 5.9 | 5.4 | 5.2 | 6.1 |
| Opioid dose measure | ||||||
| Daily dose (%) | ||||||
| 0 mg | 4.8 | 4.4 | 4.0 | 3.6 | 3.2 | |
| 119 mg | 5.9 | 5.6 | 6.0 | 5.6 | 5.6 | 4.4 |
| 2049 mg | 6.2 | 6.5 | 7.1 | 6.6 | 6.1 | 6.1 |
| 5099 mg | 6.8 | 7.9 | 7.5 | 7.6 | 7.6 | 9.8 |
| 100 mg | 9.0 | 9.3 | 10.3 | 9.2 | 9.5 | 9.5 |
| Total dose (%) a | ||||||
| 0 mg | 4.8 | 4.4 | 4.0 | 3.6 | 3.2 | |
| 1190 mg | 5.5 | 4.7 | 5.0 | 4.1 | 4.0 | 2.7 |
| 191450 mg | 5.1 | 5.1 | 6.3 | 6.7 | 5.0 | 3.2 |
| 4511,830 mg | 6.5 | 7.4 | 7.9 | 7.2 | 7.1 | 7.0 |
| >1,830 mg | 9.8 | 9.6 | 9.6 | 8.9 | 8.8 | 9.0 |
In unadjusted analyses, a significant interaction between daily dose and total dose (P<0.001) revealed that, within each daily dose category, the odds of hospitalization differed by total dose (all P<0.05, Table 3). When the total dose was >1830 mg, the odds of future hospitalization rose monotonically with increasing daily dose (i.e., <20, 2049, 5099, 100 mg): 1.33, 1.84, 1.96, and 2.08 (P<0.05 for all comparisons vs no opioids). On the other hand, when the total dose was 450 mg or less, all daily dose categories including a very high daily dose (100 mg) were not associated with future hospitalization (all P>0.05 vs no opioids). When the total dose was 451 to 1830 mg, a nonlinear association with hospitalization appeared with higher odds for lower daily doses. For the outcome of hospital days per 6‐month interval, increasing daily dose was also associated with more hospital days per 6‐month interval when the total dose was high (>1830 mg), whereas for lower total doses, daily dose was weakly positive or even protective versus no opioids.
| All‐Cause Hospitalization (Yes/No), Odds Ratio (95% CI) | |||||
|---|---|---|---|---|---|
| Total Morphine Equivalent Dose, mg | Daily Morphine Equivalent Dose, mg | ||||
| 0 | 19 | 2049 | 5099 | 100 | |
| Hospital Days per 6‐Month, Incident Rate Ratio (95% CI) | |||||
| Total Morphine Equivalent Dose, mg | Daily Morphine Equivalent Dose, mg | ||||
| 0 | 119 | 2049 | 5099 | 100 | |
| |||||
| 0 | 1 | ||||
| 1190 | 1.06 (0.95‐1.19) | 1.01 (0.95‐1.08) | 1.07 (0.95‐1.19) | 0.73 (0.44‐1.21) | |
| 191450 | 1.08 (0.96‐1.22) | 1.03 (0.96‐1.10) | 0.99 (0.9‐1.10) | 0.88 (0.67‐1.15) | |
| 4511,830 | 1.34 (1.21‐1.48)a | 1.37 (1.28‐1.46)a | 1.16 (1.05‐1.27)a | 1.25 (0.98‐1.59) | |
| >1,830 | 1.33 (1.09‐1.62)a | 1.84 (1.73‐1.97)a | 1.96 (1.82‐2.11)a | 2.08 (1.93‐2.24)a | |
| 0 | 1 | ||||
| 1190 | 0.95 (0.79‐1.14) | 0.90 (0.82‐0.99)a | 1.03 (0.87‐1.23) | 0.63 (0.36‐1.12) | |
| 191450 | 0.92 (0.77‐1.10) | 0.93 (0.84‐1.02) | 0.79 (0.69‐0.91)a | 0.69 (0.49‐0.98)a | |
| 4511,830 | 1.31 (1.10‐1.57)a | 1.26 (1.13‐1.40)a | 1.01 (0.86‐1.19) | 0.99 (0.71‐1.37) | |
| >1,830 | 1.32 (0.93‐1.89) | 1.79 (1.60‐2.01)a | 1.76 (1.54‐2.01)a | 2.09 (1.85‐2.36)a | |
In the model adjusting for all covariates (Table 4), the interaction between total dose and daily dose was also significant (P=0.002). When the total dose was high (>1830 mg), the adjusted odds of future hospitalization were significantly increased by 35% to 44% for daily doses of 20 to 49 mg or greater versus no opioids (P<0.05 for all comparisons). When the total dose was <1830 mg, the majority of daily dose categories were not significantly associated with hospitalization. Similarly, in the fully adjusted analysis of hospital days, the number of inpatient days were increased by 28% to 48% when the total dose was >1830 mg and daily dose was >20 mg, but these associations were nonsignificant or protective when the total dose was lower.
| All‐Cause Hospitalization (Yes/No), Odds Ratio (95% CI) | |||||
|---|---|---|---|---|---|
| Total Morphine Equivalent Dose, mg | Daily Morphine Equivalent Dose, mg | ||||
| 0 | 119 | 2049 | 5099 | 100 | |
| Hospital Days per 6‐Month, Incident Rate Ratio (95% CI) | |||||
| Total Morphine Equivalent Dose, mg | Daily Morphine Equivalent Dose, mg | ||||
| 0 | 119 | 2049 | 5099 | 100 | |
| |||||
| 0 | 1 | ||||
| 1190 | 1.09 (0.97‐1.23) | 1.07 (1.001.14) | 1.12 (1.001.26)b | 0.75 (0.45‐1.23) | |
| 191450 | 1.00 (0.88‐1.13) | 0.99 (0.92‐1.06) | 0.97 (0.88‐1.08) | 0.87 (0.68‐1.12) | |
| 4511,830 | 1.16 (1.04‐1.29) | 1.14 (1.07‐1.22) | 0.94 (0.85‐1.03) | 1.08 (0.85‐1.35) | |
| >1,830 | 1.10 (0.90‐1.34) | 1.41 (1.32‐1.51) | 1.35 (1.25‐1.46) | 1.44 (1.34‐1.55) | |
| 0 | 1 | ||||
| 1190 | 0.97 (0.8‐1.18) | 0.94 (0.85‐1.04) | 1.06 (0.88‐1.27) | 0.60 (0.33‐1.1) | |
| 191450 | 0.85 (0.71‐1.02) | 0.88 (0.79‐0.98) | 0.75 (0.65‐0.86) | 0.65 (0.46‐0.92) | |
| 4511,830 | 1.16 (0.97‐1.4) | 1.09 (0.97‐1.22) | 0.83 (0.71‐0.98) | 0.81 (0.59‐1.13) | |
| >1,830 | 1.12 (0.77‐1.63) | 1.41 (1.25‐1.58) | 1.28 (1.12‐1.46) | 1.48 (1.29‐1.69) | |
In a sensitivity analysis, we examined the percentage of days covered by filled opioid prescriptions within a 6‐month interval for subjects receiving high‐dose therapy (Table 5). Compared with no opioid therapy, the adjusted odds of future hospitalization were 5% greater for low total opioid dose (11830 mg) and 21% greater for high total dose (>1830 mg) when the duration of treatment was shorter (50% of the 6‐month interval). However, the odds were increased by 41% to 51% for a high total dose (>1830 mg), with longer periods of treatment (>50% of the interval). For hospital days as the outcome, subjects with high total doses (>1830 mg) and longer periods of treatment (>50% of the interval) had 41% to 71% more hospital days per 6‐month interval than those with no opioid therapy.
| Opioid Analgesic Category | All‐Cause Hospitalization | Hospital Days per 6 Months |
|---|---|---|
| Odds Ratio (95% CI) | Incident Rate Ratio (95% CI) | |
| ||
| 0 mg | 1 | 1 |
| 11,830 mg | 1.05 (1.001.10)b | 0.94 (0.87‐1.01) |
| >1,830 mg and 50% days on opioids | 1.21 (1.11‐1.31)b | 1.10 (0.96‐1.26) |
| >1,830 mg and >50 to 75% days on opioids | 1.51 (1.40‐1.64)b | 1.45 (1.26‐1.67) |
| >1,830 mg and >75 to 90% days on opioids | 1.50 (1.38‐1.64)b | 1.71 (1.46‐1.99) |
| >1,830 mg and >90% days on opioids | 1.41 (1.31‐1.52)b | 1.41 (1.26‐1.58) |
DISCUSSION
In a national cohort of HMO enrollees who filled at least 2 prescriptions for OAs, 12% were hospitalized annually. Other studies of opioid users have focused on only a fraction of these hospitalizations. For example, a recent Agency for Healthcare Research and Quality study reported that the rate of hospitalization for complications from accidental or deliberate overuse of opioids more than doubled from 11.7/10,000 in 1993 to 29.5/10,000 in 2010.[20] However, in our cohort, the all‐cause hospitalization rate was 1120 per 10,000 person‐years, or over 40 times greater than the rate for complications from overuse of opioids. By comparison, hospitalization for heart failure was only 32.8/10,000 nationally in 2010.[21] Thus, our study confirms the significant demand for hospital care by patients treated with opioids. A novel finding of our study is that the total dose of prescriptions filled over 6 months is significantly associated with an increased risk of future hospitalization. When the total dose within 6 months was in the top quartile (>1830 mg in our cohort), the adjusted odds of future hospitalization ranged from 35% to 44% greater than no opioids for daily opioid doses above 20 mg/day. On the other hand, when the total dose was 1830 mg, the daily opioid dose was only weakly associated with future hospitalization. These associations were similar for hospital days per 6‐month interval as the outcome.
Edlund and colleagues examined the total dose of opioids in a national cohort of veterans with chronic noncancer pain who filled at least 1 opioid prescription.[22] In 2011, the 60th percentile for the total opioid dose for these veterans was 3610 mg within a year, which is roughly equivalent to our top quartile (1830 mg) over a 6‐month interval. These data support replicating our study in veterans to evaluate whether a similarly increased risk of hospitalization appears for those with high total opioid doses. In support of a concern among veterans, a population‐based, cross‐sectional study of hospitalized veterans reported a high rate of chronic opioid therapy (90 days) in the 6 months prior to hospitalization.[23]
Other studies have reported increased risk of hospitalization with chronic opioid therapy. Among 1045 patients followed up to 1‐year post‐transplantation, long‐term opioids were associated with up to a sixfold greater risk of at least 4 admissions within that year.[24] Among 13,127 Danish adults on opioid therapy, the odds of future hospitalization from injuries were increased by 74% for long‐term therapy and 46% for short‐term therapy versus no opioids and by threefold and 1.6‐fold, respectively, for hospitalization due to toxicity/poisoning.[9] However, none of these studies examined the dose of opioids.
In a sensitivity analysis, we found that when a subject received a high total opioid dose within 6 months, treatment for more than 50% of the interval (i.e., >3 months) was associated with a significantly increased risk of future hospitalization and significantly more hospital days. Because the strongest evidence for the benefit of opioids for chronic noncancer pain comes from trials of <3 months,[25] these data lend additional support to recommendations to minimize both dose and duration of opioid therapy.
Our study has several limitations. First, we did not assess the immediate risk of hospitalization after starting opioid therapy. Second, our outcome of hospitalization represents only 1 measure of risk. Thus, our data should not be regarded as supporting short‐term use of high‐dose opioids over 100 to 120 mg per day.[26] In an earlier study, we reported that either a high daily dose (100 mg) or a moderately high daily dose (5099 mg) plus a high total dose (>1830 mg) increased the risk of drug overdose.[10] Third, we could not examine the reason for hospitalizations in this analysis. Therefore, we cannot presume that opioid therapy caused these hospitalizations, but it likely serves as a proxy for other factors such as disability and mental health disorders that increase risk of hospitalization. However, we did adjust for pain conditions as well as mental health and substance abuse disorders that are known to increase the risk of hospitalization in other cohorts.[27, 28, 29, 30] In a national veterans study, the most common clinical conditions associated with long‐term opioid therapy were major depression and PTSD.[22] Last, we did also not consider the number of prescribers of opioids. In a Medicare study, 1 versus 4 prescribers of OAs increased patients' annual hospitalization rate from 1.6% to 4.8%, respectively.[31]
Although the total opioid dose categories observed for our study population may differ from those in other cohorts, these data offer additional evidence for clinicians to consider this measure when assessing risk for hospitalization, and among subjects on high total doses, the percentage of time on opioids offers an additional measure of risk. Because opioid users with noncancer pain are heavy consumers of healthcare services,32,33 public health benefits and reductions in costs of care may be substantial if opportunities can be identified to reduce hospital utilization by persons treated with higher doses of OAs.
Disclosures
The work on this project was supported by an intramural grant from the National Center for Research Resources and the National Center for Advancing Translational Sciences, National Institutes of Health, through Grant 1UL TR001120. The content is solely the responsibility of the authors and does not necessarily represent the official views of the NIH. The authors report no conflicts of interest.
- , , . Higher opioid doses predict poorer functional outcome in patients with chronic disabling occupational musculoskeletal disorders. J Bone Joint Surg Am. 2009;91:919–927.
- , , . Opioid therapy for nonspecific low back pain and the outcome of chronic work loss. Pain. 2009;142:194–201.
- , , , , , . The comparative safety of analgesics in older adults with arthritis. Arch Intern Med. 2010;170:1968–1976.
- , , , et al. Evidence of specific cognitive deficits in patients with chronic low back pain under long‐term substitution treatment of opioids. Pain Physician. 2014;17:9–20.
- , , , et al. Opioid prescriptions for chronic pain and overdose: a cohort study. Ann Intern Med. 2010;152:85–92.
- , , , et al. Association between opioid prescribing patterns and opioid overdose‐related deaths. JAMA. 2011;305:1315–1321.
- , , , , , . Trends in opioid use and dosing among socio‐economically disadvantaged patients. Open Med. 2011;5:e13–e22.
- , , , et al. A history of being prescribed controlled substances and risk of drug overdose death. Pain Med. 2012;13:87–95.
- , , , , . Chronic pain, opioid prescriptions and mortality in Denmark: a population‐based cohort study. Pain. 2014;155:2486–2490.
- , . Assessing risk for drug overdose in a national cohort: Role for both daily and total opioid dose [published online ahead of print December 5, 2015]? J Pain. doi: 10.1016/j.jpain.2014.11.007.
- Institute of Medicine (US) Committee on Advancing Pain Research, Care, and Education. Relieving pain in America: a blueprint for transforming prevention, care, education, and research. Available at: http://www.ncbi.nlm.nih.gov/books/NBK91497. Accessed December 12, 2014.
- , , , , . Patterns of multimorbidity in primary care patients at high risk of future hospitalization. Popul Health Manag. 2012;15:119–124.
- , , , et al. Long‐term opioid management for chronic noncancer pain. Cochrane Database Syst Rev. 2010;(1):CD006605.
- , , , , , . An analysis of heavy utilizers of opioids for chronic noncancer pain in the TROUP study. J Pain Symptom Manage. 2010;40:279–289.
- , , , et al. Opioid prescribing: a systematic review and critical appraisal of guidelines for chronic pain. Ann Intern Med. 2014;160:38–47.
- . The treatment of cancer pain. N Engl J Med. 1985;313:84–95.
- , , , , . Opioid rotation in the management of chronic pain: where is the evidence? Pain Pract. 2010;10:85–93.
- . Palliative Care Perspectives. New York, NY: Oxford University Press; 2003:36–74.
- Agency Medical Director's Group. Web‐based opioid dose calculator. Available at http://agencymeddirectors.wa.govmobile.html. Accessed April 7, 2014.
- Agency for Healthcare Research and Quality. Hospital inpatient utilization related to opioid overuse among adults, 1993–2012. Available at: http://www.hcup-us.ahrq.gov/reports/statbriefs/sb177-Hospitalizations-for-Opioid-Overuse.pdf. Accessed December 12, 2014.
- National Center for Health Statistics. Hospitalization for congestive heart failure: United States, 2000–2010. Available at: http://www.cdc.gov/nchs/data/databriefs/db108.htm#trends. Accessed December 12, 2014.
- , , , et al. Patterns of opioid use for chronic non‐cancer pain in the veterans health administration from 2009 to 2011. Pain. 2014;155:2337–2343.
- , , , , , . Prevalence and characteristics of hospitalized adults on chronic opioid therapy. J Hosp Med. 2014;9:82–87.
- , , , . Chronic opioid analgesic usage post‐kidney transplantation and clinical outcomes. Clin Transplant. 2014;28:1041–1046.
- , , , . A comparison between enriched and nonenriched enrollment randomized withdrawal trials of opioids for chronic noncancer pain. Pain Res Manag. 2011;16:337–351.
- , , , , . Redesigning delivery of opioids to optimize pain management, improve outcomes, and contain costs. Pain Med. 2013;14:36–42.
- , , , , . Interaction of age and opioid dependence on length of hospital stay for spine surgery patients. Psychol Rep. 2009;105:361–364.
- , , , et al. Sex, depression, and risk of hospitalization and mortality in chronic obstructive pulmonary disease. Arch Intern Med. 2007;167:2345–2353.
- , , , et al. Risk of fractures requiring hospitalization after an initial prescription for zolpidem, alprazolam, lorazepam, or diazepam in older adults. J Am Geriatr Soc. 2011;59:1883–1890.
- , , , et al. Relationship between potential opioid‐related adverse effects and hospital length of stay in patients receiving opioids after orthopedic surgery. Pharmacotherapy. 2012;32:502–514.
- , , , . Opioid prescribing by multiple providers in Medicare: Retrospective observational study of insurance claims. BMJ. 2014;348:g1393.
- , , , , , . Analgesic usage for low back pain: Impact on health care costs and service use. Spine (Phila Pa 1976). 2005;30:1075–1081.
- . Economic burden of prescription opioid misuse and abuse. J Manag Care Pharm. 2009;15:556–562.
© 2015 Society of Hospital Medicine
Talking to patients about screening colonoscopy—where conversations fall short
- When talking to patients about screening colonoscopy, make clear their risk of colorectal cancer. Also, be sure they know about such commonly overlooked details as insurance/scheduling issues, dietary and medication changes before the procedure, a companion to drive afterward, and possible colonoscopy complications.
- Consider recommending supplemental information sources such as telephone calls, letters, e-mails, Web sites, or videotapes to help patients understand the need for screening colonoscopy.
Abstract
Background A physician’s recommendation is a powerful motivator for a patient to undergo colonoscopy for colorectal cancer screening, yet little is known about how physicians address this topic.
Methods We recruited 30 primary care physicians and physicians-in-training from 4 practices to counsel a “patient,” simulated by a researcher, regarding the need for screening colonoscopy. Audiotapes of the physician-patient encounters were transcribed. Preserving physician anonymity, we assessed each encounter for key informational points, positive or negative message framing, type of numeracy information, and use of colloquial or technical language.
Results Study physicians addressed a mean of 6.7 (standard deviation=1.8) of 13 key informational points. Most physicians (≥80%) discussed the benefits of colorectal cancer screening, the recognition of colonoscopy as a standard exploratory procedure, and the use of sedation. However, few (<20%) addressed the risks of colonoscopy, the nuances of scheduling, or the need for dietary and medication changes. Nearly all physicians (98%) used messages that focused on the positive aspects of screening (gain-framed messages), and many (67%) also used messages that focused on the risk of not screening (loss-framed messages). Numeracy information generally was expressed simply, but half of the physicians used statistical terms. Half used colloquial terms to describe the prep and procedure.
Conclusion Though most physicians used positive, simple terms to describe colonoscopy, they often omitted key information. Correcting for the areas of insufficient information found in our study—perhaps with supplementary educational sources—will help ensure that patients are adequately prepared for colonoscopy.
Colorectal cancer screening has the potential to reduce deaths from colorectal cancer by at least one third.1 Yet only half of eligible patients in the US who are age 50 or older have undergone screening.2 Patients often say they haven’t been screened because their physician didn’t recommend it.3-5
A physician’s recommendation is strongly predictive of whether a patient actually undergoes colorectal cancer screening, even after adjusting for multiple confounders.6-9 Yet several studies have found that, even after the physician has recommended or ordered an endoscopic study of the colon, many patients do not follow through.10-12 Successful completion of screening colonoscopy requires, in part, that a patient understand the need for the procedure and receive sufficient instruction about it. Thus, failure to undergo this test may reflect patient concerns or misunderstandings due to inadequate communication.13,14
In many settings, the primary care physician bears the responsibility for telling the patient about screening colonoscopy because the endoscopist meets the patient only at the time of the procedure. Supplementary educational programs can also play a role. Unfortunately, though, while these materials appear to reduce patient anxiety and increase adherence to screening recommendations,15-17 they are infrequently used.
Looking at physician communication with an eye toward improvement
Our goal in conducting this study was to evaluate the way in which physicians discuss the need for screening colonoscopy with their patients. Using a simulated patient scenario, we wanted to examine 4 dimensions of each discussion: completeness; type of messaging; type of numeracy information (ie, numerical and mathematical data); and use of colloquial vs technical language.
- Completeness reflected the number of key informational points addressed.
- Type of messaging focused on the use of loss- or gain-framed messages, both of which have been linked to increased patient intention to adopt a cancer prevention behavior or test.18-20 Gain-framed counseling emphasizes the positive aspects of screening; loss-framed, the risks of not screening.
- Type of numeracy information. Because poor numeracy skills are thought to impair the accuracy of patients’ perceptions of cancer risk,21 we categorized the type of numeracy information provided by physicians following an approach developed by Ahlers-Schmidt and colleagues.22
- Colloquial vs technical language. Because colonoscopy involves sensitive topics such as the bowels and feces, and because language choices may affect acceptance of care,23 we evaluated physicians’ use of terminology when describing the procedure.
We felt that by looking at these dimensions, we could help physicians to refine screening colonoscopy messages so that conversations with patients could be more clear, complete, and balanced.
Methods
13 key points regarding screening colonoscopy
We reviewed published literature and Internet sources to develop a preliminary list of topics a primary care physician could address when discussing colorectal cancer screening, especially screening colonoscopy. We used NLM Gateway and Medline databases and the following search terms: colonoscopy, patient education, patient instructions, guidelines, physician, colon cancer, counseling, and knowledge. A medical librarian directed the search. Despite having expert assistance, we did not find any publications that offered a peer-reviewed, validated list of topics to guide physicians’ discussions about screening colonoscopy.
We then conducted an Internet search using the terms colon cancer, colon cancer screening, colonoscopy, and colon cancer patient education. We categorized data from identified sites such as the American Gastroenterological Association, Up-to-Date, the American Cancer Society, and the National Library of Medicine, among others, into 13 common topics (TABLE 1). Three points addressed general information about colorectal cancer, and the rest dealt with colonoscopy specifically. A panel of 2 gastroenterologists and 3 internists from the same institution independently judged each item on the list for importance, relevance, and feasibility for discussion. Except for one panelist, all endorsed the need to address the 13 items.
TABLE 1
Percentage of physicians who covered key colorectal cancer screening points
| TOPIC | INFORMATIONAL POINT | PHYSICIANS ADDRESSING TOPIC (N=30), % |
|---|---|---|
| General colorectal prevention | ||
| 1. Standard preventive health care procedure | Recommended* as a standard screening test for those age 50 and older | 83 |
| 2. Value of screening | Can prevent cancer as well as detect cancer at a treatable stage | 83 |
| 3. Risk of colorectal cancer | Prevalence or incidence either nationally or regionally (family history)† | 43 |
| Specifics about colonoscopy | ||
| 4. Anesthesia | Sedation to reduce discomfort; risk information discussed or to be reviewed by anesthetist | 87 |
| 5. Gastrointestinal prep | Use of laxative, usual types used, and what patient can expect | 77 |
| 6. Abnormalities detected by colonoscopy | Finds growths (polyps) or cancer | 76 |
| 7. Description of procedure | Camera at the end of a flexible tube views the entire colon and tiny tweezers at the end sample or remove growths | 70 |
| 8. Follow-up after a negative test | Experts recommend screening after a negative test every 10 years | 67 |
| 9. Patient experience or knowledge‡ | Any personal or family/friend experience with colonoscopy or knowledge about the test | 64 |
| 10. Transportation | Another person must accompany the patient after procedure | 53 |
| 11. Insurance/scheduling | Insurance coverage, who arranges for the procedure, where test is performed | 13 |
| 12. Diet | Diet the day before and day of procedure, importance of hydration | 10 |
| 13. Risk of colonoscopy | Risk of bowel perforation or other complication | 10 |
| 14. Medications | Changes in medications for the procedure | 3 |
| *Recommendation by expert panels need not be specified. Physicians often just say, “We recommend.” | ||
| †Family history not necessary in this study because the patient was said to be at average risk for colorectal cancer. | ||
| ‡Point was not identified originally by the review and excluded from analysis. | ||
Physician sample
Of 135 providers practicing in 2 primary care and 1 geriatrics practice affiliated with the same urban academic medical center, we invited 30 physicians to participate. This sample was chosen to adequately represent female and minority physicians as well as physicians at different levels of training (TABLE 2). The physicians were invited to participate either by e-mail (N=19) or in person (N=11), and all invitees consented. Interviews were conducted alone in the physician’s office or in a practice conference room, and they were audiotaped with the physician’s consent.
Interviews lasted fewer than 15 minutes and did not intrude on patient care time. Study physicians read a vignette of a fictitious 51-year-old African American woman who was an established patient in their practice, without a family history of colon cancer but with arthritis and hypertension. We asked each physician to inform the patient (simulated by the interviewer) about colorectal cancer screening and colonoscopy, as well as the logistics of getting this test. To standardize the interaction, interviewers predefined the patient’s responses to questions. For example, if the physician asked about prior knowledge of colonoscopy, the simulated patient replied that she had none. Study physicians were not prompted in any way and, though not given time restrictions, all were brief and to the point.
TABLE 2
Study physician characteristics
| CHARACTERISTIC | PHYSICIANS WITH CHARACTERISTIC (N=30), % | INFORMATIONAL POINTS ADDRESSED,* MEAN (SD) |
|---|---|---|
| Total | 100 | 6.73 (1.84) |
| Gender | ||
| Female | 66 | 6.70 (1.89) |
| Male | 34 | 6.80 (1.81) |
| Race | ||
| White | 80 | 6.84 (1.80) |
| Non-white | 20 | 6.20 (2.17) |
| Level of training | ||
| Attending | 63 | 6.84 (1.98) |
| Trainee | 37 | 6.54 (1.63) |
| Specialty | ||
| General Internal Medicine | 90 | 6.89 (1.83) |
| Geriatrics | 10 | 5.33 (1.53) |
| * All comparisons P >.05 | ||
Analysis
Interview transcripts were anonymous, identified only by a study number. The 2 study investigators coded transcribed interviews independently as to whether physicians addressed the 13 informational points. Inter-rater concordance in coding was 90%. We also independently evaluated the interviews according to the use of gain- or loss-framed messages (eg, detecting colon polyps early before cancer develops vs colorectal cancer being the second most common cause of cancer death). We independently classified types of numeracy information provided into 15 categories.22 We also independently examined audiotaped transcripts for examples of colloquial terms/slang or technical language. Because we are unaware of a validated approach to characterizing a physician’s language in this manner, we asked a layperson for assistance in identifying colloquial/slang terms.
To determine whether there were predictors of a physician addressing more of the informational points than his or her peers, we examined bivariate associations of the following demographic and professional data: gender, race (white vs non-white), academic advancement (attending vs trainee), and specialty (general internist vs geriatrician).
We analyzed data using the Wilcoxon rank-sum test because the data were not normally distributed. We used SAS Statistical Software (SAS Institute, Cary, NC). The University of Pennsylvania Institutional Review Board approved the study. The project was supported by a grant from the Bach Fund of the Presbyterian Medical Center, University of Pennsylvania.
Results
How did the physicians talk to their patient?
The 30 study physicians were primarily women, one fifth were from under-represented minorities, and one third were either residents or fellows (TABLE 2). Of 13 key informational points endorsed by our physician panel (TABLE 1), the physician-subjects addressed a mean of 6.7 points (range, 3–10). Nearly all physician-subjects discussed the value of colorectal cancer screening, colonoscopy as a standard colorectal screening procedure, and sedation during the procedure. However, fewer than 20% addressed the following topics: insurance/scheduling, dietary changes, medication modification, and risks of colonoscopy. In this small sample, the number of topics mentioned did not differ significantly by physician characteristic (TABLE 2).
Two thirds of the physicians asked the simulated patient about her prior knowledge or experience with colonoscopy. Although this question was not among the original 13 informational points, it helped to guide the discussion by identifying specific preconceptions or prior knowledge of this test. Therefore, this post hoc 14th informational point was added to our list but not considered in our analyses.
Gain-framed messages used more than loss-framed messages
Nearly all physicians used gain-framed messages, and more than half also used loss-framed messages (TABLE 3). Only 1 physician offered only a loss-framed message. Overall, study physicians mentioned less than 2 gain- or loss-framed messages.
- The most common types of gain-framed messages were detecting cancer early, preventing cancer by taking out polyps, and screening at only a 10-year interval if the test result is negative.
- The most common loss-framed messages noted that colorectal cancer was the second most common cause of cancer death and that risk is increased with a family history of this cancer.
TABLE 3
Gain- and loss-framed messages and types of numeracy information used by study physicians
| TYPE OF MESSAGE OR NUMERACY | PHYSICIANS N (%) | OCCURRENCES IN INTERVIEWS, Total N (MEAN AMONG USERS, RANGE) |
|---|---|---|
| Message framing | ||
| Gain-framed | 29 (96) | 56 (1.9, 1–5) |
| Loss-framed | 20 (67) | 31 (1.6, 1–3) |
| Numeracy | ||
| Descriptive terms | 19 (63) | 36 (1.9, 1–3) |
| Statistical terms | 15 (50) | 30 (2.0, 1–5) |
| Temporal terms | 9 (30) | 11 (1.2, 1–2) |
| Proportions | 4 (13) | 5 (1.3, 1–2) |
| Fractions | 3 (10) | 3 (1.0, 1–1) |
Physicians avoided using numbers
Of the 15 types of numeracy information described by Ahlers-Schmit et al, our physicians used only 5. Nineteen physicians (63%) used descriptive terms such as “likely” or “increased,” and 15 (50%) used statistical concepts such as risk and second-most-common cause. Physicians avoided using numbers; 9 (30%) used temporal terms such as “early”; 4 (13%) cited a proportion; and only 3 (10%) used a fraction.
Colloquial language, or was it crude?
While reading the transcripts, we noted that some physicians used colloquial terms that could be regarded as crude. Other terms were probably too technical without an explanation. Some information was simply incorrect. We offer selected quotes to illustrate various types of language used.
About the prep:
- “Getting a colonoscopy is not the most fun experience…you have really bad diarrhea and you just empty out your guts.”
- “It’s basically Liquid Plumber for your bowels.”
- “Bowel prep…is kind of voluminous and associated with kind of massive bowel movements.”
- “Everybody hates the prep and you may be one of those and that’s just that.”
- “Generally you have to be up all night, sometimes, cleaning your bowels out.”
About the procedure:
- “It’s not the most comfortable screening exam in the world.”
- “It’s a test where they stick a lighted tube up your back-side.”
- “The stomach doctors put a camera up your bottom and look at the walls of your colon.”
- “They can go in with a microscope and look around and look at the colon itself.”
- “It’s a painless test.”
Word polyp is used, but not defined
Physicians often employed technical language when describing the pathology detected by colonoscopy. “Polyp” was mentioned by 20 physicians (67%) but rarely defined; “biopsy” by 5 (17%), and “lesion” by 6 (20%). Other technical terms were precancerous, symptomatic, and incapacitated.
Discussion
An informed patient is a willing patient
Our study physicians addressed only half of the 13 informational points, likely reflecting the time constraints of a typical office visit. Primary care physicians appear to expect that either the colonoscopist or other sources of information would fill in the gaps. As reported in several studies, unanswered questions can discourage patients from keeping their scheduled colonoscopy appointment.10,11 In one report of African-American church members, those with adequate knowledge about colorectal cancer screening were more likely to complete screening.24
Wolf and Becker suggested that discussions about cancer screening address 4 broad topics: the probability of developing the cancer, the operating characteristics of the screening test(s), the likelihood that screening will benefit the patient, and potential burdens of the test.25 Instead of a balanced and lengthy discussion, our study physicians generally emphasized the positives such as the value of avoiding colon cancer, the standard nature of this test, and the benefit of being sedated for the procedure. Thus, gain-framed messages about colorectal cancer were the norm for our study physicians.
Half of the physicians also offered loss-framed messages emphasizing the need to avoid the consequences of colorectal cancer and the increased threat associated with a family history of this malignancy. Research in mammography screening suggests that loss-framed messaging may be a more powerful motivator than gain-framed messaging,26 but it is not clear if this observation can be generalized to colorectal cancer screening.
Walking a fine line with the particulars of risk
Our study physicians rarely provided data on the probability of developing colorectal cancer. Physicians may avoid this topic because many patients have difficulty understanding information about the risk of colorectal cancer.11 In support of this approach, Lipkus and colleagues reported that various ways of informing patients about colorectal cancer risk did not affect their intention to be screened.27 Of concern, most of our physicians did not address the common misconception that colorectal cancer screening is unnecessary in the absence of symptoms.28
Overall, the level of numeracy information provided by study physicians required minimal patient understanding of mathematical and statistical concepts. Most information was descriptive, such as colonoscopy being “more thorough” than other tests. Though statistical concepts such as “risk” were often mentioned, few physicians offered probabilities or incidence data. Experts recommend providing such data,25 but Web sites have been criticized for offering excessive numerical cancer risk data.22 Therefore, physicians must walk a fine line between providing adequate information and offering data that require a high level of health numeracy for understanding.
6 key points physicians often overlook
Most physicians failed to mention dietary and medication changes, scheduling/insurance coverage issues, and risk of complications from colonoscopy. Nearly 60% failed to discuss the patient’s risk of colorectal cancer. Almost half did not mention the need for a companion to accompany the patient after the test. Scheduling challenges, in particular, are known to interfere with completing colonoscopy.11
Many neglect to describe the procedure
Thirty percent of physicians failed to describe the procedure itself, so it is not surprising that patients complain they have a poor understanding of test logistics.11,29,30 Denberg and colleagues have reported that mailing an informational brochure about colonoscopy can increase the number who keep their appointment.31
How language choices may affect understanding
Other researchers have identified additional patient barriers to colonoscopy, including fear of pain, concern for modesty, and desire to avoid the bowel prep.11,32 These concerns may be mitigated or heightened by the physician’s language. In our review of transcripts, physicians often used slang or colloquial language to describe the procedure, probably in an attempt to convey information in a familiar way. This language may be viewed as crude and potentially discouraging, but further research is needed to evaluate patient receptiveness to different ways of speaking about sensitive topics.
Additionally, physicians commonly used technical terms such as “polyp” and “biopsy” without explaining them. Technical language may increase racial disparities in adhering to scheduled colonoscopy. In a family medicine clinic, patients from minority groups had particular difficulty understanding medical terms and procedure names.28 Because little time is available for counseling about cancer screening tests, and because patients retain only a limited amount of information about procedures,33 supplementary informational sources are warranted.15-17,31 Options include brochures, telephone calls, letters, e-mails, Web site data, and videotapes, but it is unclear which sources optimally improve patient adherence to screening colonoscopy.34
Study limitations include simulated interaction
There were a number of limitations to this study. First, the investigators “simulated” the patient. Though study physicians were told to act as if they were speaking to a regular patient, they may still have unconsciously modified their usual approach to addressing this topic.
Second, we did not assess the effectiveness of these discussions in motivating actual patients to receive colonoscopy.
Other limitations included the following:
- We did not set a time period for these discussions, so they may have been even more limited in actual practice.
- We studied physicians from a single health care setting wherein colonoscopy appears to be the preferred approach to screen an average risk patient for colorectal cancer. In addition, in this health care system, this test is performed by a gastroenterologist, rather than a primary care physician.
- We did not determine whether patients regard our selected quotes as too colloquial or technical.
- This study did not address the important barrier of a physician forgetting to recommend colorectal cancer screening.35
Further research, next steps
Our study supports the hypothesis that physicians differ widely—but are generally deficient—when informing patients about screening colonoscopy. They generally emphasize the positives of colonoscopy and use terms that are colloquial, avoiding statistical concepts that may be hard for patients to understand. Future studies need to address the effectiveness of these approaches to discussing screening colonoscopy.
Given the central role of the primary care physician in motivating patients to undergo screening colonoscopy in a limited time period, it appears that additional supports are needed to supplement physician discussion about this important preventive care procedure.
Correspondence
Barbara J. Turner MD, MSEd, University of Pennsylvania, 1123 Blockley Hall/6021, 423 Guardian Drive, Philadelphia, PA 19104; bturner@mail.med.upenn.edu
1. Ries LA, Wingo PA, Miller DS, et al. The annual report to the nation on the status of cancer, 1973–1997, with a special section on colorectal cancer. Cancer 2000;88:2398-2424.
2. Centers for Disease Control and Prevention (CDC). Colorectal cancer test use among persons aged > or = 50 years—United States, 2001. MMWR Morb Mortal Wkly Rep 2003;52:193-196.
3. Wee CC, McCarthy EP, Phillips RS. Factors associated with colon cancer screening: the role of patient factors and physician counseling. Prev Med 2005;41:23-29.
4. Taylor V, Lessler D, Mertens K, et al. Colorectal cancer screening among African Americans: the importance of physician recommendations. J Natl Med Assoc 2003;95:806-812.
5. Brawarsky P, Brooks DR, Mucci LA, Wood PA. Effect of physician recommendation and patient adherence on rates of colorectal cancer testing. Cancer Detect Prevent 2004;28:260-268.
6. Holt WS, Jr. Factors affecting compliance with screening sigmoidoscopy. J Fam Pract 1991;32:585-589.
7. Brenes GA, Paskett ED. Predictors of stage of adoption for colorectal cancer screening. Prev Med 2000;31:410-416.
8. Myers RE, Turner B, Weinberg D, et al. Impact of a physician-oriented intervention on follow-up in colorectal cancer screening. Prev Med 2004;38:375-381.
9. Brawarsky P, Brooks DR, Mucci LA, Wood PA. Effect of physician recommendation and patient adherence on rates of colorectal cancer testing. Cancer Detect Prev 2004;28:260-268.
10. Turner BJ, Weiner M, Yang C, TenHave T. Predicting adherence to colonoscopy or flexible sigmoidoscopy on the basis of physician appointment-keeping behavior. Ann Intern Med 2004;140:528-532.
11. Denberg TD, Melhado TV, Coombes JM, et al. Predictors of nonadherence to screening colonoscopy. J Gen Intern Med 2005;20:989-995.
12. Kelly RB, Shank JC. Adherence to screening flexible sigmoidoscopy in asymptomatic patients. Med Care 1992;30:1029-1042.
13. Janz NK, Wren PA, Schottenfeld D, Guire KE. Colorectal cancer screening attitudes and behavior: a population-based study. Prev Med 2003;37:627-634.
14. US Preventive Services Task Force. Screening for colorectal cancer: recommendations and rationale. Ann Intern Med 2002;137:129-131.
15. Abuksis G, Mor M, Segal N, et al. A patient education program is cost-effective for preventing failure of endoscopic procedures in a gastroenterology department. Am J Gastroenterol 2001;96:1786-1790.
16. Pignone M, Harris R, Kinsinger L. Videotape-based decision aid for colon cancer screening. A randomized, controlled trial. Ann Intern Med 2000;13:761-769.
17. Wardle J, Williamson S, McCaffery K, et al. Increasing attendance at colorectal cancer screening: testing the efficacy of a mailed, psychoeducational intervention in a community sample of older adults. Health Psychol 2003;22:99-105.
18. Detweiler JB, Bedell BT, Salovey P, et al. Message framing and sunscreen use: gain-framed messages motivate beach-goers. Health Psychol 1999;18:189-196.
19. Banks SM, Salovey P, Greener S, et al. The effects of message framing on mammography utilization. Health Psychol 1995;14:178-184.
20. Rivers SE, Salovey P, Pizarro DA, et al. Message framing and pap test utilization among women attending a community health clinic. J Health Psychol 2005;10:65-77.
21. Davids SL, Schapira MM, McAuliffe TL, Nattinger AB. Predictors of pessimistic breast cancer risk perceptions in a primary care population. J Gen Intern Med 2004;19:310-315.
22. Ahlers-Schmidt CR, Golbeck AL, Paschal AM, et al. Breast cancer counts: numeracy in breast cancer information on the web. J Cancer Educ 2006;21:95-98.
23. Hodgson J, Hughes E, Lambert C. “SLANG”—Sensitive Language and the New Genetics—an exploratory study. J Genet Couns 2005;14:415-421.
24. Katz ML, James AS, Pignone MP, et al. Colorectal cancer screening among African American church members: a qualitative and quantitative study of patient-provider communication. BMC Public Health 2004;4:62.-
25. Wolf AM, Becker DM. Cancer screening and informed patient discussions. Truth and consequences. Arch Intern Med 1996;156:1069-1072.
26. Banks SM, Salovey P, Greener S, et al. The effects of message framing on mammography utilization. Health Psychol 1995;14:178-184.
27. Lipkus IM, Crawford Y, Fenn K, et al. Testing different formats for communicating colorectal cancer risk. J Health Commun 1999;4:311-324.
28. Shokar NK, Vernon SW, Weller SC. Cancer and colorectal cancer: knowledge, beliefs, and screening p of a diverse patient population. Fam Med 2005;37:341-347.
29. Katz ML, Ruzek SB, Miller SM, Legos P. Gender differences in patients needs and concerns to diagnostic tests for possible cancer. J Cancer Educ 2004;19:227-231.
30. Dube CE, Fuller BK, Rosen RK, et al. Men’s experiences of physical exams and cancer screening tests: a qualitative study. Prev Med 2005;40:628-635.
31. Denberg TD, Coombes JM, Byers TE, et al. Effect of a mailed brochure on appointment-keeping for screening colonoscopy: a randomized trial. Ann Intern Med 2006;145:895-900.
32. Harewood GC, Wiersema MJ, Melton LJ, 3rd. A prospective, controlled assessment of factors influencing acceptance of screening colonoscopy. Am J Gastroenterol 2002;97:3186-3194.
33. Godwin Y. Do they listen? A review of information retained by patients following consent for reduction mammoplasty. Br J Plastic Surgery 2000;53:121-125.
34. Greisinger A, Hawley ST, Bettencourt JL, et al. Primary care patients’ understanding of colorectal cancer screening. Cancer Detect Prev 2006;30:67-74.
35. Dulai GS, Farmer MM, Ganz PA, et al. Primary care physician perceptions of barriers to and facilitators of colorectal cancer screening in a managed care setting. Cancer 2004;100:1843-1852.
- When talking to patients about screening colonoscopy, make clear their risk of colorectal cancer. Also, be sure they know about such commonly overlooked details as insurance/scheduling issues, dietary and medication changes before the procedure, a companion to drive afterward, and possible colonoscopy complications.
- Consider recommending supplemental information sources such as telephone calls, letters, e-mails, Web sites, or videotapes to help patients understand the need for screening colonoscopy.
Abstract
Background A physician’s recommendation is a powerful motivator for a patient to undergo colonoscopy for colorectal cancer screening, yet little is known about how physicians address this topic.
Methods We recruited 30 primary care physicians and physicians-in-training from 4 practices to counsel a “patient,” simulated by a researcher, regarding the need for screening colonoscopy. Audiotapes of the physician-patient encounters were transcribed. Preserving physician anonymity, we assessed each encounter for key informational points, positive or negative message framing, type of numeracy information, and use of colloquial or technical language.
Results Study physicians addressed a mean of 6.7 (standard deviation=1.8) of 13 key informational points. Most physicians (≥80%) discussed the benefits of colorectal cancer screening, the recognition of colonoscopy as a standard exploratory procedure, and the use of sedation. However, few (<20%) addressed the risks of colonoscopy, the nuances of scheduling, or the need for dietary and medication changes. Nearly all physicians (98%) used messages that focused on the positive aspects of screening (gain-framed messages), and many (67%) also used messages that focused on the risk of not screening (loss-framed messages). Numeracy information generally was expressed simply, but half of the physicians used statistical terms. Half used colloquial terms to describe the prep and procedure.
Conclusion Though most physicians used positive, simple terms to describe colonoscopy, they often omitted key information. Correcting for the areas of insufficient information found in our study—perhaps with supplementary educational sources—will help ensure that patients are adequately prepared for colonoscopy.
Colorectal cancer screening has the potential to reduce deaths from colorectal cancer by at least one third.1 Yet only half of eligible patients in the US who are age 50 or older have undergone screening.2 Patients often say they haven’t been screened because their physician didn’t recommend it.3-5
A physician’s recommendation is strongly predictive of whether a patient actually undergoes colorectal cancer screening, even after adjusting for multiple confounders.6-9 Yet several studies have found that, even after the physician has recommended or ordered an endoscopic study of the colon, many patients do not follow through.10-12 Successful completion of screening colonoscopy requires, in part, that a patient understand the need for the procedure and receive sufficient instruction about it. Thus, failure to undergo this test may reflect patient concerns or misunderstandings due to inadequate communication.13,14
In many settings, the primary care physician bears the responsibility for telling the patient about screening colonoscopy because the endoscopist meets the patient only at the time of the procedure. Supplementary educational programs can also play a role. Unfortunately, though, while these materials appear to reduce patient anxiety and increase adherence to screening recommendations,15-17 they are infrequently used.
Looking at physician communication with an eye toward improvement
Our goal in conducting this study was to evaluate the way in which physicians discuss the need for screening colonoscopy with their patients. Using a simulated patient scenario, we wanted to examine 4 dimensions of each discussion: completeness; type of messaging; type of numeracy information (ie, numerical and mathematical data); and use of colloquial vs technical language.
- Completeness reflected the number of key informational points addressed.
- Type of messaging focused on the use of loss- or gain-framed messages, both of which have been linked to increased patient intention to adopt a cancer prevention behavior or test.18-20 Gain-framed counseling emphasizes the positive aspects of screening; loss-framed, the risks of not screening.
- Type of numeracy information. Because poor numeracy skills are thought to impair the accuracy of patients’ perceptions of cancer risk,21 we categorized the type of numeracy information provided by physicians following an approach developed by Ahlers-Schmidt and colleagues.22
- Colloquial vs technical language. Because colonoscopy involves sensitive topics such as the bowels and feces, and because language choices may affect acceptance of care,23 we evaluated physicians’ use of terminology when describing the procedure.
We felt that by looking at these dimensions, we could help physicians to refine screening colonoscopy messages so that conversations with patients could be more clear, complete, and balanced.
Methods
13 key points regarding screening colonoscopy
We reviewed published literature and Internet sources to develop a preliminary list of topics a primary care physician could address when discussing colorectal cancer screening, especially screening colonoscopy. We used NLM Gateway and Medline databases and the following search terms: colonoscopy, patient education, patient instructions, guidelines, physician, colon cancer, counseling, and knowledge. A medical librarian directed the search. Despite having expert assistance, we did not find any publications that offered a peer-reviewed, validated list of topics to guide physicians’ discussions about screening colonoscopy.
We then conducted an Internet search using the terms colon cancer, colon cancer screening, colonoscopy, and colon cancer patient education. We categorized data from identified sites such as the American Gastroenterological Association, Up-to-Date, the American Cancer Society, and the National Library of Medicine, among others, into 13 common topics (TABLE 1). Three points addressed general information about colorectal cancer, and the rest dealt with colonoscopy specifically. A panel of 2 gastroenterologists and 3 internists from the same institution independently judged each item on the list for importance, relevance, and feasibility for discussion. Except for one panelist, all endorsed the need to address the 13 items.
TABLE 1
Percentage of physicians who covered key colorectal cancer screening points
| TOPIC | INFORMATIONAL POINT | PHYSICIANS ADDRESSING TOPIC (N=30), % |
|---|---|---|
| General colorectal prevention | ||
| 1. Standard preventive health care procedure | Recommended* as a standard screening test for those age 50 and older | 83 |
| 2. Value of screening | Can prevent cancer as well as detect cancer at a treatable stage | 83 |
| 3. Risk of colorectal cancer | Prevalence or incidence either nationally or regionally (family history)† | 43 |
| Specifics about colonoscopy | ||
| 4. Anesthesia | Sedation to reduce discomfort; risk information discussed or to be reviewed by anesthetist | 87 |
| 5. Gastrointestinal prep | Use of laxative, usual types used, and what patient can expect | 77 |
| 6. Abnormalities detected by colonoscopy | Finds growths (polyps) or cancer | 76 |
| 7. Description of procedure | Camera at the end of a flexible tube views the entire colon and tiny tweezers at the end sample or remove growths | 70 |
| 8. Follow-up after a negative test | Experts recommend screening after a negative test every 10 years | 67 |
| 9. Patient experience or knowledge‡ | Any personal or family/friend experience with colonoscopy or knowledge about the test | 64 |
| 10. Transportation | Another person must accompany the patient after procedure | 53 |
| 11. Insurance/scheduling | Insurance coverage, who arranges for the procedure, where test is performed | 13 |
| 12. Diet | Diet the day before and day of procedure, importance of hydration | 10 |
| 13. Risk of colonoscopy | Risk of bowel perforation or other complication | 10 |
| 14. Medications | Changes in medications for the procedure | 3 |
| *Recommendation by expert panels need not be specified. Physicians often just say, “We recommend.” | ||
| †Family history not necessary in this study because the patient was said to be at average risk for colorectal cancer. | ||
| ‡Point was not identified originally by the review and excluded from analysis. | ||
Physician sample
Of 135 providers practicing in 2 primary care and 1 geriatrics practice affiliated with the same urban academic medical center, we invited 30 physicians to participate. This sample was chosen to adequately represent female and minority physicians as well as physicians at different levels of training (TABLE 2). The physicians were invited to participate either by e-mail (N=19) or in person (N=11), and all invitees consented. Interviews were conducted alone in the physician’s office or in a practice conference room, and they were audiotaped with the physician’s consent.
Interviews lasted fewer than 15 minutes and did not intrude on patient care time. Study physicians read a vignette of a fictitious 51-year-old African American woman who was an established patient in their practice, without a family history of colon cancer but with arthritis and hypertension. We asked each physician to inform the patient (simulated by the interviewer) about colorectal cancer screening and colonoscopy, as well as the logistics of getting this test. To standardize the interaction, interviewers predefined the patient’s responses to questions. For example, if the physician asked about prior knowledge of colonoscopy, the simulated patient replied that she had none. Study physicians were not prompted in any way and, though not given time restrictions, all were brief and to the point.
TABLE 2
Study physician characteristics
| CHARACTERISTIC | PHYSICIANS WITH CHARACTERISTIC (N=30), % | INFORMATIONAL POINTS ADDRESSED,* MEAN (SD) |
|---|---|---|
| Total | 100 | 6.73 (1.84) |
| Gender | ||
| Female | 66 | 6.70 (1.89) |
| Male | 34 | 6.80 (1.81) |
| Race | ||
| White | 80 | 6.84 (1.80) |
| Non-white | 20 | 6.20 (2.17) |
| Level of training | ||
| Attending | 63 | 6.84 (1.98) |
| Trainee | 37 | 6.54 (1.63) |
| Specialty | ||
| General Internal Medicine | 90 | 6.89 (1.83) |
| Geriatrics | 10 | 5.33 (1.53) |
| * All comparisons P >.05 | ||
Analysis
Interview transcripts were anonymous, identified only by a study number. The 2 study investigators coded transcribed interviews independently as to whether physicians addressed the 13 informational points. Inter-rater concordance in coding was 90%. We also independently evaluated the interviews according to the use of gain- or loss-framed messages (eg, detecting colon polyps early before cancer develops vs colorectal cancer being the second most common cause of cancer death). We independently classified types of numeracy information provided into 15 categories.22 We also independently examined audiotaped transcripts for examples of colloquial terms/slang or technical language. Because we are unaware of a validated approach to characterizing a physician’s language in this manner, we asked a layperson for assistance in identifying colloquial/slang terms.
To determine whether there were predictors of a physician addressing more of the informational points than his or her peers, we examined bivariate associations of the following demographic and professional data: gender, race (white vs non-white), academic advancement (attending vs trainee), and specialty (general internist vs geriatrician).
We analyzed data using the Wilcoxon rank-sum test because the data were not normally distributed. We used SAS Statistical Software (SAS Institute, Cary, NC). The University of Pennsylvania Institutional Review Board approved the study. The project was supported by a grant from the Bach Fund of the Presbyterian Medical Center, University of Pennsylvania.
Results
How did the physicians talk to their patient?
The 30 study physicians were primarily women, one fifth were from under-represented minorities, and one third were either residents or fellows (TABLE 2). Of 13 key informational points endorsed by our physician panel (TABLE 1), the physician-subjects addressed a mean of 6.7 points (range, 3–10). Nearly all physician-subjects discussed the value of colorectal cancer screening, colonoscopy as a standard colorectal screening procedure, and sedation during the procedure. However, fewer than 20% addressed the following topics: insurance/scheduling, dietary changes, medication modification, and risks of colonoscopy. In this small sample, the number of topics mentioned did not differ significantly by physician characteristic (TABLE 2).
Two thirds of the physicians asked the simulated patient about her prior knowledge or experience with colonoscopy. Although this question was not among the original 13 informational points, it helped to guide the discussion by identifying specific preconceptions or prior knowledge of this test. Therefore, this post hoc 14th informational point was added to our list but not considered in our analyses.
Gain-framed messages used more than loss-framed messages
Nearly all physicians used gain-framed messages, and more than half also used loss-framed messages (TABLE 3). Only 1 physician offered only a loss-framed message. Overall, study physicians mentioned less than 2 gain- or loss-framed messages.
- The most common types of gain-framed messages were detecting cancer early, preventing cancer by taking out polyps, and screening at only a 10-year interval if the test result is negative.
- The most common loss-framed messages noted that colorectal cancer was the second most common cause of cancer death and that risk is increased with a family history of this cancer.
TABLE 3
Gain- and loss-framed messages and types of numeracy information used by study physicians
| TYPE OF MESSAGE OR NUMERACY | PHYSICIANS N (%) | OCCURRENCES IN INTERVIEWS, Total N (MEAN AMONG USERS, RANGE) |
|---|---|---|
| Message framing | ||
| Gain-framed | 29 (96) | 56 (1.9, 1–5) |
| Loss-framed | 20 (67) | 31 (1.6, 1–3) |
| Numeracy | ||
| Descriptive terms | 19 (63) | 36 (1.9, 1–3) |
| Statistical terms | 15 (50) | 30 (2.0, 1–5) |
| Temporal terms | 9 (30) | 11 (1.2, 1–2) |
| Proportions | 4 (13) | 5 (1.3, 1–2) |
| Fractions | 3 (10) | 3 (1.0, 1–1) |
Physicians avoided using numbers
Of the 15 types of numeracy information described by Ahlers-Schmit et al, our physicians used only 5. Nineteen physicians (63%) used descriptive terms such as “likely” or “increased,” and 15 (50%) used statistical concepts such as risk and second-most-common cause. Physicians avoided using numbers; 9 (30%) used temporal terms such as “early”; 4 (13%) cited a proportion; and only 3 (10%) used a fraction.
Colloquial language, or was it crude?
While reading the transcripts, we noted that some physicians used colloquial terms that could be regarded as crude. Other terms were probably too technical without an explanation. Some information was simply incorrect. We offer selected quotes to illustrate various types of language used.
About the prep:
- “Getting a colonoscopy is not the most fun experience…you have really bad diarrhea and you just empty out your guts.”
- “It’s basically Liquid Plumber for your bowels.”
- “Bowel prep…is kind of voluminous and associated with kind of massive bowel movements.”
- “Everybody hates the prep and you may be one of those and that’s just that.”
- “Generally you have to be up all night, sometimes, cleaning your bowels out.”
About the procedure:
- “It’s not the most comfortable screening exam in the world.”
- “It’s a test where they stick a lighted tube up your back-side.”
- “The stomach doctors put a camera up your bottom and look at the walls of your colon.”
- “They can go in with a microscope and look around and look at the colon itself.”
- “It’s a painless test.”
Word polyp is used, but not defined
Physicians often employed technical language when describing the pathology detected by colonoscopy. “Polyp” was mentioned by 20 physicians (67%) but rarely defined; “biopsy” by 5 (17%), and “lesion” by 6 (20%). Other technical terms were precancerous, symptomatic, and incapacitated.
Discussion
An informed patient is a willing patient
Our study physicians addressed only half of the 13 informational points, likely reflecting the time constraints of a typical office visit. Primary care physicians appear to expect that either the colonoscopist or other sources of information would fill in the gaps. As reported in several studies, unanswered questions can discourage patients from keeping their scheduled colonoscopy appointment.10,11 In one report of African-American church members, those with adequate knowledge about colorectal cancer screening were more likely to complete screening.24
Wolf and Becker suggested that discussions about cancer screening address 4 broad topics: the probability of developing the cancer, the operating characteristics of the screening test(s), the likelihood that screening will benefit the patient, and potential burdens of the test.25 Instead of a balanced and lengthy discussion, our study physicians generally emphasized the positives such as the value of avoiding colon cancer, the standard nature of this test, and the benefit of being sedated for the procedure. Thus, gain-framed messages about colorectal cancer were the norm for our study physicians.
Half of the physicians also offered loss-framed messages emphasizing the need to avoid the consequences of colorectal cancer and the increased threat associated with a family history of this malignancy. Research in mammography screening suggests that loss-framed messaging may be a more powerful motivator than gain-framed messaging,26 but it is not clear if this observation can be generalized to colorectal cancer screening.
Walking a fine line with the particulars of risk
Our study physicians rarely provided data on the probability of developing colorectal cancer. Physicians may avoid this topic because many patients have difficulty understanding information about the risk of colorectal cancer.11 In support of this approach, Lipkus and colleagues reported that various ways of informing patients about colorectal cancer risk did not affect their intention to be screened.27 Of concern, most of our physicians did not address the common misconception that colorectal cancer screening is unnecessary in the absence of symptoms.28
Overall, the level of numeracy information provided by study physicians required minimal patient understanding of mathematical and statistical concepts. Most information was descriptive, such as colonoscopy being “more thorough” than other tests. Though statistical concepts such as “risk” were often mentioned, few physicians offered probabilities or incidence data. Experts recommend providing such data,25 but Web sites have been criticized for offering excessive numerical cancer risk data.22 Therefore, physicians must walk a fine line between providing adequate information and offering data that require a high level of health numeracy for understanding.
6 key points physicians often overlook
Most physicians failed to mention dietary and medication changes, scheduling/insurance coverage issues, and risk of complications from colonoscopy. Nearly 60% failed to discuss the patient’s risk of colorectal cancer. Almost half did not mention the need for a companion to accompany the patient after the test. Scheduling challenges, in particular, are known to interfere with completing colonoscopy.11
Many neglect to describe the procedure
Thirty percent of physicians failed to describe the procedure itself, so it is not surprising that patients complain they have a poor understanding of test logistics.11,29,30 Denberg and colleagues have reported that mailing an informational brochure about colonoscopy can increase the number who keep their appointment.31
How language choices may affect understanding
Other researchers have identified additional patient barriers to colonoscopy, including fear of pain, concern for modesty, and desire to avoid the bowel prep.11,32 These concerns may be mitigated or heightened by the physician’s language. In our review of transcripts, physicians often used slang or colloquial language to describe the procedure, probably in an attempt to convey information in a familiar way. This language may be viewed as crude and potentially discouraging, but further research is needed to evaluate patient receptiveness to different ways of speaking about sensitive topics.
Additionally, physicians commonly used technical terms such as “polyp” and “biopsy” without explaining them. Technical language may increase racial disparities in adhering to scheduled colonoscopy. In a family medicine clinic, patients from minority groups had particular difficulty understanding medical terms and procedure names.28 Because little time is available for counseling about cancer screening tests, and because patients retain only a limited amount of information about procedures,33 supplementary informational sources are warranted.15-17,31 Options include brochures, telephone calls, letters, e-mails, Web site data, and videotapes, but it is unclear which sources optimally improve patient adherence to screening colonoscopy.34
Study limitations include simulated interaction
There were a number of limitations to this study. First, the investigators “simulated” the patient. Though study physicians were told to act as if they were speaking to a regular patient, they may still have unconsciously modified their usual approach to addressing this topic.
Second, we did not assess the effectiveness of these discussions in motivating actual patients to receive colonoscopy.
Other limitations included the following:
- We did not set a time period for these discussions, so they may have been even more limited in actual practice.
- We studied physicians from a single health care setting wherein colonoscopy appears to be the preferred approach to screen an average risk patient for colorectal cancer. In addition, in this health care system, this test is performed by a gastroenterologist, rather than a primary care physician.
- We did not determine whether patients regard our selected quotes as too colloquial or technical.
- This study did not address the important barrier of a physician forgetting to recommend colorectal cancer screening.35
Further research, next steps
Our study supports the hypothesis that physicians differ widely—but are generally deficient—when informing patients about screening colonoscopy. They generally emphasize the positives of colonoscopy and use terms that are colloquial, avoiding statistical concepts that may be hard for patients to understand. Future studies need to address the effectiveness of these approaches to discussing screening colonoscopy.
Given the central role of the primary care physician in motivating patients to undergo screening colonoscopy in a limited time period, it appears that additional supports are needed to supplement physician discussion about this important preventive care procedure.
Correspondence
Barbara J. Turner MD, MSEd, University of Pennsylvania, 1123 Blockley Hall/6021, 423 Guardian Drive, Philadelphia, PA 19104; bturner@mail.med.upenn.edu
1. Ries LA, Wingo PA, Miller DS, et al. The annual report to the nation on the status of cancer, 1973–1997, with a special section on colorectal cancer. Cancer 2000;88:2398-2424.
2. Centers for Disease Control and Prevention (CDC). Colorectal cancer test use among persons aged > or = 50 years—United States, 2001. MMWR Morb Mortal Wkly Rep 2003;52:193-196.
3. Wee CC, McCarthy EP, Phillips RS. Factors associated with colon cancer screening: the role of patient factors and physician counseling. Prev Med 2005;41:23-29.
4. Taylor V, Lessler D, Mertens K, et al. Colorectal cancer screening among African Americans: the importance of physician recommendations. J Natl Med Assoc 2003;95:806-812.
5. Brawarsky P, Brooks DR, Mucci LA, Wood PA. Effect of physician recommendation and patient adherence on rates of colorectal cancer testing. Cancer Detect Prevent 2004;28:260-268.
6. Holt WS, Jr. Factors affecting compliance with screening sigmoidoscopy. J Fam Pract 1991;32:585-589.
7. Brenes GA, Paskett ED. Predictors of stage of adoption for colorectal cancer screening. Prev Med 2000;31:410-416.
8. Myers RE, Turner B, Weinberg D, et al. Impact of a physician-oriented intervention on follow-up in colorectal cancer screening. Prev Med 2004;38:375-381.
9. Brawarsky P, Brooks DR, Mucci LA, Wood PA. Effect of physician recommendation and patient adherence on rates of colorectal cancer testing. Cancer Detect Prev 2004;28:260-268.
10. Turner BJ, Weiner M, Yang C, TenHave T. Predicting adherence to colonoscopy or flexible sigmoidoscopy on the basis of physician appointment-keeping behavior. Ann Intern Med 2004;140:528-532.
11. Denberg TD, Melhado TV, Coombes JM, et al. Predictors of nonadherence to screening colonoscopy. J Gen Intern Med 2005;20:989-995.
12. Kelly RB, Shank JC. Adherence to screening flexible sigmoidoscopy in asymptomatic patients. Med Care 1992;30:1029-1042.
13. Janz NK, Wren PA, Schottenfeld D, Guire KE. Colorectal cancer screening attitudes and behavior: a population-based study. Prev Med 2003;37:627-634.
14. US Preventive Services Task Force. Screening for colorectal cancer: recommendations and rationale. Ann Intern Med 2002;137:129-131.
15. Abuksis G, Mor M, Segal N, et al. A patient education program is cost-effective for preventing failure of endoscopic procedures in a gastroenterology department. Am J Gastroenterol 2001;96:1786-1790.
16. Pignone M, Harris R, Kinsinger L. Videotape-based decision aid for colon cancer screening. A randomized, controlled trial. Ann Intern Med 2000;13:761-769.
17. Wardle J, Williamson S, McCaffery K, et al. Increasing attendance at colorectal cancer screening: testing the efficacy of a mailed, psychoeducational intervention in a community sample of older adults. Health Psychol 2003;22:99-105.
18. Detweiler JB, Bedell BT, Salovey P, et al. Message framing and sunscreen use: gain-framed messages motivate beach-goers. Health Psychol 1999;18:189-196.
19. Banks SM, Salovey P, Greener S, et al. The effects of message framing on mammography utilization. Health Psychol 1995;14:178-184.
20. Rivers SE, Salovey P, Pizarro DA, et al. Message framing and pap test utilization among women attending a community health clinic. J Health Psychol 2005;10:65-77.
21. Davids SL, Schapira MM, McAuliffe TL, Nattinger AB. Predictors of pessimistic breast cancer risk perceptions in a primary care population. J Gen Intern Med 2004;19:310-315.
22. Ahlers-Schmidt CR, Golbeck AL, Paschal AM, et al. Breast cancer counts: numeracy in breast cancer information on the web. J Cancer Educ 2006;21:95-98.
23. Hodgson J, Hughes E, Lambert C. “SLANG”—Sensitive Language and the New Genetics—an exploratory study. J Genet Couns 2005;14:415-421.
24. Katz ML, James AS, Pignone MP, et al. Colorectal cancer screening among African American church members: a qualitative and quantitative study of patient-provider communication. BMC Public Health 2004;4:62.-
25. Wolf AM, Becker DM. Cancer screening and informed patient discussions. Truth and consequences. Arch Intern Med 1996;156:1069-1072.
26. Banks SM, Salovey P, Greener S, et al. The effects of message framing on mammography utilization. Health Psychol 1995;14:178-184.
27. Lipkus IM, Crawford Y, Fenn K, et al. Testing different formats for communicating colorectal cancer risk. J Health Commun 1999;4:311-324.
28. Shokar NK, Vernon SW, Weller SC. Cancer and colorectal cancer: knowledge, beliefs, and screening p of a diverse patient population. Fam Med 2005;37:341-347.
29. Katz ML, Ruzek SB, Miller SM, Legos P. Gender differences in patients needs and concerns to diagnostic tests for possible cancer. J Cancer Educ 2004;19:227-231.
30. Dube CE, Fuller BK, Rosen RK, et al. Men’s experiences of physical exams and cancer screening tests: a qualitative study. Prev Med 2005;40:628-635.
31. Denberg TD, Coombes JM, Byers TE, et al. Effect of a mailed brochure on appointment-keeping for screening colonoscopy: a randomized trial. Ann Intern Med 2006;145:895-900.
32. Harewood GC, Wiersema MJ, Melton LJ, 3rd. A prospective, controlled assessment of factors influencing acceptance of screening colonoscopy. Am J Gastroenterol 2002;97:3186-3194.
33. Godwin Y. Do they listen? A review of information retained by patients following consent for reduction mammoplasty. Br J Plastic Surgery 2000;53:121-125.
34. Greisinger A, Hawley ST, Bettencourt JL, et al. Primary care patients’ understanding of colorectal cancer screening. Cancer Detect Prev 2006;30:67-74.
35. Dulai GS, Farmer MM, Ganz PA, et al. Primary care physician perceptions of barriers to and facilitators of colorectal cancer screening in a managed care setting. Cancer 2004;100:1843-1852.