User login
Baby Boomer HCV Screening and Care
INTRODUCTION
The baby boomer generation, born from 1945 to 1965, accounts for 75% of the estimated 2.7 to 3.9 million persons with chronic hepatitis C virus (HCV) infection in the US.[1, 2, 3] Most HCV‐infected baby boomers do not know that they are infected.[4] With the advent of better‐tolerated, more‐effective therapies to treat chronic HCV infection,[5] and to reduce rates of complications such as cirrhosis, liver failure, and hepatocellular carcinoma,[6] universal 1‐time screening of baby boomers has been endorsed by the Centers for Disease Control and Prevention (CDC) and the United States Preventive Services Task Force.[1, 7] Hospitalized baby boomers may offer an important target for HCV screening. Our group conducted an anonymous HCV seroprevalence study of nearly 800 patients on general medicine and trauma services of 2 Philadelphia hospitals, and found that 8% had undiagnosed HCV infection, and 8% had diagnosed HCV. [8]
Little is known about barriers and facilitators to implementation of universal HCV screening of baby boomers. Lessons from implementing HIV screening offer a useful guide.[9] First, limited clinician knowledge and confusion about screening guidelines necessitated convenient, well‐designed educational programs.[10] Second, burdensome consent procedures were reduced by opt‐out consent for screening supplemented by patient education.[9] Third, electronic medical record (EMR) algorithms minimized burdens on staff by efficiently identifying and flagging eligible persons for screening.[11] Fourth, ancillary staff support for patient education and linkage to follow‐up care increased screening rates compared with usual care by physicians/staff.[11] Finally, routine human immunodeficiency virus (HIV) testing of inpatients increased rates of diagnosis, especially compared with physician referral systems.[12]
This article describes how HIV screening strategies informed the development in a baby boomer HCV screening and linkage to a care program in a safety‐net hospital serving a majority Hispanic population. We report results of the first 14 months of the screening program and linkage to care for chronically HCV‐infected persons after a minimum 10 months follow‐up. We also estimate costs for program implementation and maintenance to inform hospital administrators, healthcare policymakers, and clinicians about resources that may be required to effectively screen hospitalized baby boomers for HCV.
METHODS
Study Setting
The HCV baby boomer screening program was pilot tested in November 2012 and launched December 1, 2012 in a 498‐bed academic‐affiliated hospital of a healthcare system serving the indigent population of South Texas.
Project Development Phase
From October 1, 2012 to November 30, 2012, project infrastructure development and provider/staff education were conducted. A half‐hour PowerPoint lecture (in person or online) was developed about HCV epidemiology, birth‐cohort HCV screening guidelines, newer treatment modalities, and screening program components. Lectures were delivered to departmental chairs at the affiliated medical school, departmental grand rounds, and the hospital's nursing supervisors. One‐on‐one informational meetings were also held with hospital administrators and staff.
With the hospital's information technology team, screens were developed to identify eligible baby boomers from up to 7 years of previous inpatient and outpatient encounters in the EMR from: birth year (19451965) and no prior diagnosis of HCV infection (070.41, 070.44, 070.51, 070.54, 070.7x, V02.62) or any type of completed test for HCV. The algorithm also excluded patients admitted to psychiatry due to lack of decision‐making capacity or patients with a poor prognosis such as metastatic cancer. An audit of 100 consecutive excluded patients identified all as legitimate.
A new laboratory order for HCV screening was developed by laboratory administrators and pathology faculty for an anti‐HCV antibody test followed by reflex HCV RNA testing for positive results per CDC recommendations.[13] The anti‐HCV test was performed on serum or ethylenediaminetetraacetic acid plasma using the Advia Centaur HCV Assay (Bayer HealthCare LLC, Tarrytown, NY). This assay has excellent sensitivity (99.9%) and specificity (97.5%).[14, 15] The HCV RNA assay was performed using quantitative real‐time polymerase chain reaction (PCR) using the COBAS AmpliPrep/COBAS TaqMan HCV test (Roche Molecular Systems, Pleasanton, CA). Use of plasma preparation tubes (PPTs) (BD Vacutainer PPT tubes; Becton, Dickinson and Co., Franklin Lakes, NJ) permitted both anti‐HCV antibody and HCV PCR testing to be performed on the same specimen when anti‐HCV antibody was detected, eliminating a second blood draw for the PCR test. For patients eligible for screening, an EMR algorithm was created to add an HCV screening order to over 50 different admission order sets.
To educate patients newly diagnosed with HCV infection, we developed an interactive, low‐literacy, educational program in Spanish and English for an electronic tablet device that addressed: HCV epidemiology, transmission prevention, factors that can accelerate chronic HCV infection, and management/treatment strategies. At several points in the program, the patient needed to answer questions correctly to continue. The tablet retained responses linked to a study identification about alcohol consumption, history of past and current illicit drug use, sexual risk behavior, and offered risk reduction messages. The tablet content and presentation reflected suggestions by Hispanic patient‐reviewers about cultural appropriateness and comprehension.
Project Implementation and Maintenance Phase
We report implementation of the program from December 1, 2012 to January 31, 2014. An automated EMR report classified all baby boomers admitted in the previous 24 hours as: (1) eligible with pending screening test order, (2) eligible without an order, (3) ineligible due to prior HCV test or diagnosis, or (4) ineligible due to comorbidity (eg, metastatic cancer). For approximately one‐third of eligible patients, a study team member placed an order after review of the daily admission report because the order had not been automatically placed.
Admitting nurses initially asked for consent from eligible patients for HCV screening, but this was ultimately deemed too onerous a task along with all of their other duties. We then instituted opt‐out consent with patient education about testing and opportunities to refuse via posters placed throughout the hospital and flyers in admission packets. A bilingual HCV counselor provided HCV screening test results to all patients. She counseled patients who screened positive for HCV with the educational program on an electronic tablet and developed a follow‐up care plan.
A bilingual promotora (community health worker) contacted patients newly diagnosed with chronic HCV infection after hospital discharge to address the following: obtaining insurance, access to primary care and HCV specialty care, scheduling appointments, and treatment for alcohol problems or drug abuse. After obtaining signed consent, the promotora sent test results and recommendations for follow‐up care (eg, hepatitis A and B immunization) to a designated outpatient physician and reminded patients about appointments and pending tests. The promotora received training in motivational interviewing skills to engage patients with needed care including alcohol treatment.
Study Data
A summary report was developed from the EMR with demographic, insurance, clinical, and HCV screening data for all admitted baby boomers. For patients diagnosed with chronic HCV infection, the promotora obtained data about follow‐up HCV care through December 10, 2014 from the EMR, outside provider records, and patient reports.
Study Variables
The 2 outcome measures were a positive anti‐HCV antibody test and positive HCV RNA test. Insurance status was categorized as insured (private, public, Veterans Administration, Department of Defense) or uninsured (self‐pay or county‐based financial assistance program). Problem drinking was identified from International Classification of Diseases, Ninth Revision, Clinical Modification codes for the admission, notes by clinicians describing alcohol abuse/dependence, or quantity/frequency meeting National Institute on Alcohol Abuse and Alcoholism criteria for alcohol problems of >14 drinks/week or >4 drinks/day for men and >7 drinks per week or >3 drinks per day for women.[16]
Implementation costs included informatics support, mobile app development, other patient educational materials, costs of screening tests for uninsured, and 0.3 full‐time equivalent (FTE) of a clinician for half a year. Maintenance costs included salaries for the study team, HCV testing costs, and postage.
Analysis
Demographics by HCV antibody test results are compared using [2] tests or Student t tests as appropriate. Among persons with a positive HCV antibody test, HCV RNA results are similarly compared. This implementation project was approved by the University of Texas Health Science Center at San Antonio Institutional Review Board (HSC20130033N).
RESULTS
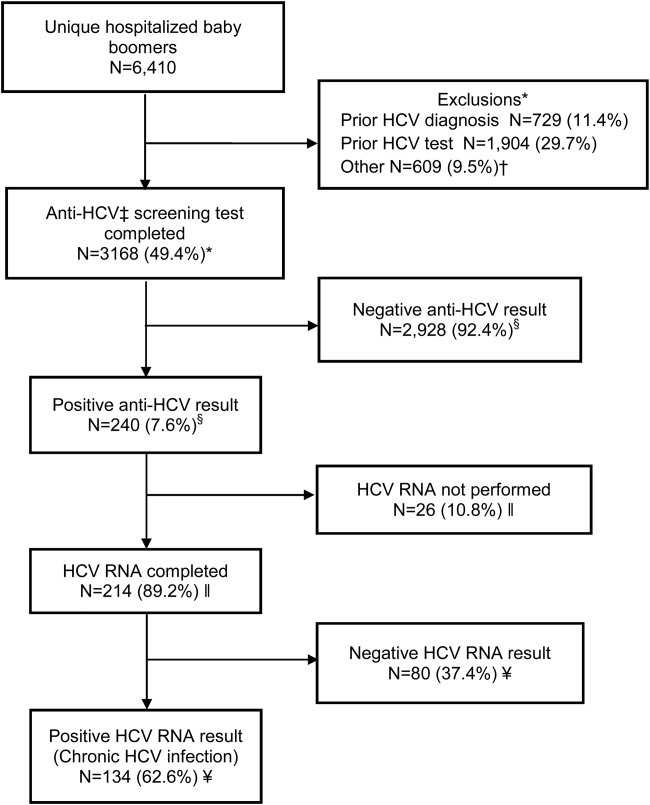
Within 14 months, 6410 unique baby boomers were admitted with a mean age 56.4 years (standard deviation [SD] 5.7), 55.9% men, 59.1% Hispanic, 8.2% nonwhite, and 46.7% uninsured (Table 1). Among admitted patients, 729 (11.4%) had a previous HCV diagnosis and 1904 (29.7%) had been tested for HCV (Figure 1). Anti‐HCV antibody testing was completed for 3168 (49.4% of all admitted patients and 83.9% of never‐tested patients). After exclusions such as significant comorbidity or psychiatric admission, 95% of eligible persons were tested. Of screened patients, 240 (7.6%) were positive; these patients were significantly younger (P<0.0001) and more likely to be men (P<0.0001) and uninsured (P=0.002) (Table 1). Notably, 10% of men were anti‐HCV positive versus 4% of women. In this predominantly Hispanic cohort, no significant difference appeared by race‐ethnicity, but African Americans had a higher prevalence (10.4%) than other groups.
| Characteristic | All Screened Patients, No. | Anti‐HCV Antibody‐Positive Patients, No. (Row %) | P Value* |
|---|---|---|---|
| |||
| Overall | 3,168 | Total=240 (7.6) | |
| Age, mean (SD) | 57.0 (5.7) | 54.8 (5.0) | <0.0001 |
| Sex | |||
| Men | 1,771 | 185 (10.4) | <0.0001 |
| Women | 1,397 | 55 (3.9) | |
| Race | |||
| Non‐Hispanic white | 1,036 | 86 (8.3) | 0.12 |
| Hispanic | 1,872 | 134 (7.2) | |
| African American | 163 | 17 (10.4) | |
| Other | 97 | 3 (3.1) | |
| Insurance | |||
| Insured | 1,740 | 109 (6.3) | 0.002 |
| Uninsured | 1,428 | 131 (9.2) | |
HCV RNA testing was completed for 214 (89.2%) anti‐HCVpositive patients, of whom 134 (62.6%) had detectable RNA, indicating chronic HCV infection (Figure 1). Overall, 4.2% of all eligible patients tested for HCV were chronically infected. No characteristics were significantly associated with chronic HCV, but persons with chronic infection tended to be younger, uninsured, and African American (Table 2).
| Characteristics | All HCV RNA‐Tested Patients, No. | HCV RNA‐Positive Patients, No. (Row %) | P Value* |
|---|---|---|---|
| |||
| Overall | 214 | 134 (62.6) | |
| Age, y, mean (SD) | 54.6 (5.0) | 54.2 (5.1) | 0.09 |
| Sex | |||
| Men | 165 | 106 (64.2) | 0.37 |
| Women | 49 | 28 (57.1) | |
| Race | |||
| Non‐Hispanic white | 78 | 49 (62.8) | 0.65 |
| Hispanic | 118 | 73 (61.8) | |
| African American | 15 | 11 (73.3) | |
| Other | 3 | 1 (33.3) | |
| Insurance | |||
| Insured | 92 | 52 (56.5) | 0.11 |
| Uninsured | 122 | 82 (67.2) | |
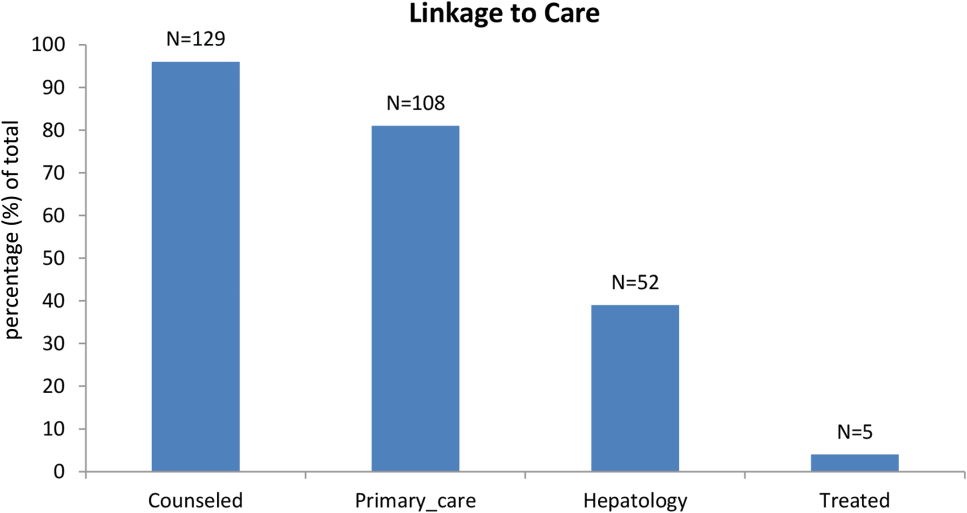
Among patients with chronic HCV infection, 129 (96.3%) were counseled and follow‐up plans developed (Figure 2). By December 10, 2014, 108 (80.6%) patients had received follow‐up primary care, and 52 (38.8%) had care from a hepatologist. Five had initiated HCV‐specific treatment, but many others were awaiting approval for compassionate drug programs offering direct‐acting antivirals. Barriers to care included 82 (61.2%) uninsured, 45 (34%) problem drinkers, 22 (16%) homeless, and 25 (18.6%) incarcerated (not shown). The promotora addressed these issues by visiting homes or homeless shelters, assistance with obtaining county‐based or other types of insurance, offering alcohol risk‐reduction counseling, linking patients to alcohol‐treatment programs, and communicating with the county jail about follow‐up care.
Most of the developmental costs for the program were dedicated to developing EMR programs (Table 3). An optional cost was for the development of the tablet educational program about HCV. In regard to maintenance costs for the first 14 months, the majority was to support the program faculty, counseling/case management, and a nurse practitioner who helped with ordering tests. We also estimated costs for testing uninsured patients (45% of HCV antibody tested, 57% of HCV PCR tested, per Tables 1 and 2, respectively), as they must be borne by the hospital.
| Program Component | Monthly ($) | Total ($) |
|---|---|---|
| ||
| Development phase (2 months prior to start) | ||
| Personnel | ||
| Faculty physicians (0.3 FTE salary+benefits) | 6,641 | 13,282 |
| Role: Development educational materials, provider education, and pilot testing | ||
| Technology | ||
| Development of eligibility screen and order sets for electronic medical record | 41,171 | |
| HCV counseling educational program for tabletdevelopment and pilot testing (optional) | 15,000 | |
| Patient educational materials (posters, flyers) | 400 | |
| Total for development phase | 69,853 | |
| Maintenance phase (14 months) | ||
| Personnel | ||
| Faculty physicians (0.3 FTE, salary+benefits) | 6,641 | 92,974 |
| Role: Coordinate with hospital staff and faculty, liaison with laboratory, supervise study team, review all identified cases for eligibility and management plans | ||
| Inpatient counselor and outpatient case management (2 FTE, salary+benefits) | 6,343 | 88,802 |
| Role: Inpatient and outpatient counseling of HCV Ab+patients and facilitation of follow‐up care for patients with chronic HCV infection | ||
| Nurse practitioner ($35/hour @ 10 hours/month) | 350 | 4,900 |
| Role: Review daily list of admitted baby boomers and manually order HCV screening test for those missed by the automated order | ||
| Postage | 10 | 140 |
| Laboratory costs for uninsured (based on % in cohort) | ||
| HCV antibody in plasma preparation tubes ($13.41/test 1,423) | 19,082 | |
| HCV RNA PCR ($87.96/test 122) | 10,731 | |
| Total for maintenance phase | 216,629 | |
| Total program costs | 286,482 | |
DISCUSSION
Implementation of universal HCV screening and linkage to care for hospitalized baby boomers utilizes a multicomponent infrastructure that reflects lessons learned from similar HIV programs. Use of an EMR algorithm to identify eligible patients and programs to automatically order HCV screening was a linchpin of our high testing rate and averted testing those who did not require screening. Of all 6410 baby boomers admitted to our safety‐net hospital, the EMR screen identified over 40% as ineligible due to prior diagnosis of HCV infection or prior HCV tests. Most of the additional 609 patients who were not tested were excluded due to comorbidities or admission to psychiatry. Overall, the EMR programs, tests ordered by the team, and opt‐out screening with education resulted in screening 95% of eligible patients. However, this program carries substantial costs, nearly $300,000 for the first 2 years, for unreimbursed services in this safety‐net hospital. The new guidelines for HCV screening[1, 2] are not accompanied by financial support either for program implementation or for screening and linkage to care for the uninsured, creating significant financial hurdles to achieve guideline compliance within already overtaxed public healthcare systems.
The infrastructure implemented in this hospital succeeded in achieving a higher rate of HCV screening of baby boomers than reported by other programs. In an emergency department in Birmingham, Alabama, a screening program for baby boomers tested 66% of 2325 persons who were HCV‐unaware.[17] In an outpatient clinic for men who have sex with men, only 54% of 1329 patients were screened for HCV.[18]
Among 3168 screened patients in our cohort, 7.6% were anti‐HCV antibody positive, which is over twice the prevalence of 3.5% (95% confidence interval: 2.2%‐4.8%) for anti‐HCVpositive tests in baby boomers based on National Health and Nutrition Examination Survey (NHANES) data from 2001 to 2010.[19] However, the Alabama emergency department study found that 11% of tested patients were anti‐HCV positive.[17] Although that study lacked race‐ethnicity data for half of the subjects, among those with this information, 13% of black and 7% of white subjects tested anti‐HCV positive. Compared with the Alabama study, the anti‐HCV prevalence in our cohort was somewhat lower for blacks (10.4%) but higher for non‐Hispanic whites (8.3%). Hispanics in our cohort had the lowest anti‐HCV prevalence (7.2%), whereas the Alabama study did not report this figure. National studies also find that the prevalence of anti‐HCVpositive results is twice as high for blacks compared with non‐Hispanic whites and Hispanics, and nearly twice as high for men compared with women.[19] In our cohort, the proportion of men with anti‐HCVpositive results was nearly 3 times that for women.
Diagnosis of chronic HCV infection requires 2 tests, similar to performing a Western blot test after a positive enzyme‐linked immunoassay for HIV. In a Veterans Affairs study, only 64% of patients with a positive anti‐HCV antibody test had a HCV RNA performed when reflex testing was not performed, and patients had to come in for a second test versus >90% of patients in sites that offer reflex testing.[20] At a somewhat increased price due to using more expensive PPTs ($96/100 PPT tubes vs $6.50/100 for serum red top tubes), both tests were performed on the same blood sample, resulting in 89% of anti‐HCV antibody‐positive patients being tested for HCV RNA.
Overall, 62% of patients in our cohort with a positive anti‐HCV antibody test had HCV RNA detected (viremic) compared with 71% of persons aged 20 years in an NHANES study from 2003 to 2010.[21] Several factors may contribute to this lower rate of chronic infection. In a study of HCV seropositive blood donors, Hispanics and non‐Hispanic whites were significantly more likely to have spontaneously cleared HCV infection than Asians and non‐Hispanic blacks.[22] Spontaneous clearance of HCV has also been associated with younger age at infection and HCV genotype 1.[23] Poorly understood genetic factors may also play a role.[24] The high rate of HCV clearance in our cohort reinforces the need to perform HCV RNA testing.
Overall, 4.2% of our cohort had chronic HCV infection. According to CDC estimates from 1999 to 2008 NHANES data, 2.74 million (3.25%) of 84.2 million US baby boomers have been infected with HCV, and 2.04 million (2.4%) have chronic infection.[1] Therefore, our safety‐net cohort of never‐tested baby boomers had over twice the prevalence of chronic HCV infection than the national estimate for this age group. This high proportion of chronic HCV may reflect our predominantly low‐income patient population. An analysis conducted by Milliman, Inc. using 2010 data estimated that half of all persons with undiagnosed HCV infection are uninsured.[25] This finding reinforces the need to conduct HCV screening in acute‐care settings such as hospitals, because the uninsured have poor access to ambulatory care.
Our chronic HCV‐infected cohort had many barriers to follow‐up care because most were uninsured and 15% were homeless. Our counselors addressed socioeconomic barriers to care[26] and concerns about the disease.[27] Many patients also had problem drinking based on either self‐report or documented in the medical record. Even moderate alcohol use may increase the risk of overall and liver‐related mortality from chronic HCV infection,[28] so our team offered brief alcohol counseling and partnered with healthcare providers and local Alcoholics Anonymous programs to offer support.
We linked 80% of newly diagnosed patients to primary care or hepatology providers, aided by a county‐level financial assistance program for healthcare services for uninsured residents, but it still required patients to pay out of pocket for care. Access to newer, highly effective, all‐oral therapy treatment[5] was slowed while awaiting US Food and Drug Administration approval in the first year of this project, then treatment provided only after lengthy applications to drug company assistance programs with priority given to persons with compensated cirrhosis.
Our project raises serious concerns for policymakers and payers. Should universal baby boomer HCV testing be undertaken without taking into account the financial and personnel resources required to implement this screening program or the substantial expenditures necessary to treat chronically infected persons? Although the Centers for Medicaid and Medicare Services pay for HCV screening costs,[29] our hospital had to cover costs for uninsured persons. Admittedly, Texas has the highest proportion of residents who are uninsured in the nation, but even in other states, Medicaid and other insurance programs are wrestling with how to deal with the high cost of HCV therapy.[30]
We acknowledge several limitations of this project. First, it was undertaken in only 1 hospital. Yet, our challenges and solutions are likely to be applicable to other hospitals nationally, especially those serving vulnerable populations. Second, patients in our cohort were usually admitted for comorbidities that needed to be managed before HCV infection could be addressed. However, persons with a poor prognosis, such as metastatic cancer, were excluded. We did not attempt to exclude other persons with serious comorbidities such as congestive heart failure, because the guidelines do not currently recommend this, and there may be benefits for patients, their families, and providers from knowing that an individual is chronically HCV infected even if they are not eligible to be treated. Third, the cost of the program was supported in part by a grant and would otherwise have to be borne by the hospital. Fourth, the EMR used by our hospital allows hundreds of admission order sets to be created and made automated order entry hard to implement. This is unlikely to be the situation in other hospitals using different types of EMRs.
It remains to be seen whether safety‐net hospitals with populations at greater risk of HCV infection can afford to support HCV testing and linkage to care. In view of several cost‐effectiveness studies that find screening and treating chronic HCV‐infected baby boomers cost‐effective within standard thresholds,[31, 32, 33] it may be important for policymakers and payers to consider lessons from HIV programs. Because HIV‐infected persons could not afford life‐saving medication, vigorous advocacy efforts led to legislation approving the Ryan White program in 1990 to fill gaps in HIV care that were not covered by other sources of support.[34] HCV infection is the most common blood‐borne infection in the nation, with potentially devastating consequences if ignored, but the underlying premise that universal HCV testing will save lives is in question if most of the individuals who are diagnosed with chronic HCV are low income, uninsured, or underinsured with limited access to curative medications. A rigorous public policy debate regarding both the merits of screening and the availability of treatment to those who are diagnosed is essential to the success of these programs.
Disclosure
Funding for this study was received from the Centers for Disease Control and Prevention CDC PS12‐1209PPHF12. The authors report no conflicts of interest.
- , , , , , Centers for Disease Control and Prevention. Recommendations for the identification of chronic hepatitis C virus infection among persons born during 1945–1965. MMWR Recomm Rep. 2012;61:1–32.
- 2. Centers for Disease Control and Prevention. Vital signs: evaluation of hepatitis C virus infection testing and reporting–eight U.S. sites, 2005‐2011. MMWR Morb Mortal Wkly Rep. 2013;62:357–361.
- , , , , Hepatitis C virus infection in USA: an estimate of true prevalence. Liver Int. 2011;31:1090–1101.
- Institute of Medicine. Hepatitis and liver cancer: a national strategy for prevention and control of hepatitis B and C. Washington, DC: The National Academies Press; 2010.
- , Current and future therapies for hepatitis C virus infection. N Engl J Med. 2013;368:1907–1917.
- , , , et al. Increasing prevalence of HCC and cirrhosis in patients with chronic hepatitis C virus infection. Gastroenterology. 2011;140:1182–1188.
- U.S. Preventive Services Task Force. Screening for hepatitis C virus infection in adults: U.S. Preventive Services Task Force recommendation statement. Ann Intern Med. 2013;159:349–357.
- , , Undiagnosed hepatitis C on the general medicine and trauma services of two urban hospitals. J Infect. 2009;59:62–69.
- U.S. Preventive Services Task Force. Screening for HIV: U.S. Preventive Services Task Force recommendation statement. Ann Intern Med. 2013;159:51–60.
- , , , et al. Factors affecting clinician educator encouragement of routine HIV testing among trainees. J Gen Intern Med. 2012;27:839–844.
- , , , et al. Counselor‐versus provider‐based HIV screening in the emergency department: Results from the universal screening for HIV infection in the emergency room (USHER) randomized controlled trial. Ann Emerg Med. 2011;58:S126–S132.e1–4.
- , , Approaching the CDC's guidelines on the HIV testing of inpatients: physician‐referral versus nonreferral‐based testing. AIDS Patient Care STDS. 2006;20:311–317.
- Centers for Disease Control and Prevention (CDC). Testing for HCV infection: an update of guidance for clinicians and laboratorians. MMWR Morb Mortal Wkly Rep. 2013;62:362–365.
- Advia Centaur Assay Manual. Malvern, PA: Siemens Medical Solutions Diagnostics; Pub# 07063235, Rev. C, 2005‐01.
- , , , Comparison of the ADVIA Centaur and Abbott AxSYM immunoassay systems for a routine diagnostic virology laboratory. J Clin Virol. 2004;30:S11–S15.
- National Institute on Alcohol Abuse and Alcoholism. Drinking levels defined. Available at: http://www.niaaa.nih.gov/alcohol‐health/overview‐alcohol‐consumption/moderate‐binge‐drinking. Accessed June 12, 2014.
- , , , et al. Unrecognized chronic hepatitis C virus infection among baby boomers in the emergency department. Hepatology. 2015;61:776–782.
- , , , et al. Low rates of hepatitis screening and vaccination of HIV‐infected MSM in HIV clinics. Sex Transm Dis. 2012;39:349–353.
- , , , , , The changing epidemiology of hepatitis C virus infection in the United States: National Health and Nutrition Examination Survey 2001 through 2010. J Hepatol. 2014;60:691–698.
- , , , , Viral RNA testing in hepatitis C antibody‐positive veterans. Am J Prev Med. 2009;36:235–238.
- , , , et al. Chronic hepatitis C virus infection in the United States: National Health and Nutrition Examination Survey 2003 to 2010. Ann Intern Med. 2014;160:293–300.
- , , , et al. NHLBI Retrovirus Epidemiology Donor Study (REDS) Group. Correlates of hepatitis C virus (HCV) RNA negativity among HCV‐seropositive blood donors. Transfusion. 2006;46:469–475.
- , , , , , Spontaneous loss of hepatitis C virus RNA from serum is associated with genotype 1 and younger age at exposure. J Med Virol. 2011;83:1338–1344.
- , , , et al. Genetics of spontaneous clearance of hepatitis C virus infection: a complex topic with much to learn. Hepatology. 2014;60:2127–2128.
- , , , Health care reform and hepatitis C: a convergence of risk and opportunity. Available at: http://us.milliman.com/uploadedFiles/insight/2013/convergence‐of‐risk‐and‐opportunity.pdf. Accessed February 5, 2015.
- , , , Hepatitis C testing, infection, and linkage to care among racial and ethnic minorities in the United States, 2009‐2010. Am J Public Health. 2013;103:112–119.
- , Barriers to hepatitis C treatment. Liver Int. 2012;32:151–156.
- , , , , Moderate, excessive or heavy alcohol consumption: Each is significantly associated with increased mortality in patients with chronic hepatitis C. Aliment Pharmacol Ther. 2013;37:703–709.
- Centers for Medicare and Medicaid Services. Proposed decision memo for screening for hepatitis c virus (HCV) in adults (CAG‐00436N). Available at: http://www.cms.gov/medicare-coverage-database/details/nca-proposed-decision-memo.aspx?NCAId=272. Accessed June 2, 2014.
- , Therapy for hepatitis C—the costs of success. N Engl J Med. 2014;370:1552–1553.
- , , , et al. Economic model of a birth cohort screening program for hepatitis C. Hepatology. 2012;55:1344–1355.
- , , , Cost‐effectiveness analysis of risk‐factor guided and birth‐cohort screening for chronic hepatitis C infection in the United States. PLoS One. 2013;8:e58975.
- , , , et al. The cost‐effectiveness of birth‐cohort screening for hepatitis C antibody in U.S. primary care settings. Ann Intern Med. 2012;156:263–270.
- U.S. Department of Health and Human Services. Health Resources and Services Administration: HIV/AIDS programs. Available at: http://hab.hrsa.gov/abouthab/legislation.html. Accessed April 8, 2015.
INTRODUCTION
The baby boomer generation, born from 1945 to 1965, accounts for 75% of the estimated 2.7 to 3.9 million persons with chronic hepatitis C virus (HCV) infection in the US.[1, 2, 3] Most HCV‐infected baby boomers do not know that they are infected.[4] With the advent of better‐tolerated, more‐effective therapies to treat chronic HCV infection,[5] and to reduce rates of complications such as cirrhosis, liver failure, and hepatocellular carcinoma,[6] universal 1‐time screening of baby boomers has been endorsed by the Centers for Disease Control and Prevention (CDC) and the United States Preventive Services Task Force.[1, 7] Hospitalized baby boomers may offer an important target for HCV screening. Our group conducted an anonymous HCV seroprevalence study of nearly 800 patients on general medicine and trauma services of 2 Philadelphia hospitals, and found that 8% had undiagnosed HCV infection, and 8% had diagnosed HCV. [8]
Little is known about barriers and facilitators to implementation of universal HCV screening of baby boomers. Lessons from implementing HIV screening offer a useful guide.[9] First, limited clinician knowledge and confusion about screening guidelines necessitated convenient, well‐designed educational programs.[10] Second, burdensome consent procedures were reduced by opt‐out consent for screening supplemented by patient education.[9] Third, electronic medical record (EMR) algorithms minimized burdens on staff by efficiently identifying and flagging eligible persons for screening.[11] Fourth, ancillary staff support for patient education and linkage to follow‐up care increased screening rates compared with usual care by physicians/staff.[11] Finally, routine human immunodeficiency virus (HIV) testing of inpatients increased rates of diagnosis, especially compared with physician referral systems.[12]
This article describes how HIV screening strategies informed the development in a baby boomer HCV screening and linkage to a care program in a safety‐net hospital serving a majority Hispanic population. We report results of the first 14 months of the screening program and linkage to care for chronically HCV‐infected persons after a minimum 10 months follow‐up. We also estimate costs for program implementation and maintenance to inform hospital administrators, healthcare policymakers, and clinicians about resources that may be required to effectively screen hospitalized baby boomers for HCV.
METHODS
Study Setting
The HCV baby boomer screening program was pilot tested in November 2012 and launched December 1, 2012 in a 498‐bed academic‐affiliated hospital of a healthcare system serving the indigent population of South Texas.
Project Development Phase
From October 1, 2012 to November 30, 2012, project infrastructure development and provider/staff education were conducted. A half‐hour PowerPoint lecture (in person or online) was developed about HCV epidemiology, birth‐cohort HCV screening guidelines, newer treatment modalities, and screening program components. Lectures were delivered to departmental chairs at the affiliated medical school, departmental grand rounds, and the hospital's nursing supervisors. One‐on‐one informational meetings were also held with hospital administrators and staff.
With the hospital's information technology team, screens were developed to identify eligible baby boomers from up to 7 years of previous inpatient and outpatient encounters in the EMR from: birth year (19451965) and no prior diagnosis of HCV infection (070.41, 070.44, 070.51, 070.54, 070.7x, V02.62) or any type of completed test for HCV. The algorithm also excluded patients admitted to psychiatry due to lack of decision‐making capacity or patients with a poor prognosis such as metastatic cancer. An audit of 100 consecutive excluded patients identified all as legitimate.
A new laboratory order for HCV screening was developed by laboratory administrators and pathology faculty for an anti‐HCV antibody test followed by reflex HCV RNA testing for positive results per CDC recommendations.[13] The anti‐HCV test was performed on serum or ethylenediaminetetraacetic acid plasma using the Advia Centaur HCV Assay (Bayer HealthCare LLC, Tarrytown, NY). This assay has excellent sensitivity (99.9%) and specificity (97.5%).[14, 15] The HCV RNA assay was performed using quantitative real‐time polymerase chain reaction (PCR) using the COBAS AmpliPrep/COBAS TaqMan HCV test (Roche Molecular Systems, Pleasanton, CA). Use of plasma preparation tubes (PPTs) (BD Vacutainer PPT tubes; Becton, Dickinson and Co., Franklin Lakes, NJ) permitted both anti‐HCV antibody and HCV PCR testing to be performed on the same specimen when anti‐HCV antibody was detected, eliminating a second blood draw for the PCR test. For patients eligible for screening, an EMR algorithm was created to add an HCV screening order to over 50 different admission order sets.
To educate patients newly diagnosed with HCV infection, we developed an interactive, low‐literacy, educational program in Spanish and English for an electronic tablet device that addressed: HCV epidemiology, transmission prevention, factors that can accelerate chronic HCV infection, and management/treatment strategies. At several points in the program, the patient needed to answer questions correctly to continue. The tablet retained responses linked to a study identification about alcohol consumption, history of past and current illicit drug use, sexual risk behavior, and offered risk reduction messages. The tablet content and presentation reflected suggestions by Hispanic patient‐reviewers about cultural appropriateness and comprehension.
Project Implementation and Maintenance Phase
We report implementation of the program from December 1, 2012 to January 31, 2014. An automated EMR report classified all baby boomers admitted in the previous 24 hours as: (1) eligible with pending screening test order, (2) eligible without an order, (3) ineligible due to prior HCV test or diagnosis, or (4) ineligible due to comorbidity (eg, metastatic cancer). For approximately one‐third of eligible patients, a study team member placed an order after review of the daily admission report because the order had not been automatically placed.
Admitting nurses initially asked for consent from eligible patients for HCV screening, but this was ultimately deemed too onerous a task along with all of their other duties. We then instituted opt‐out consent with patient education about testing and opportunities to refuse via posters placed throughout the hospital and flyers in admission packets. A bilingual HCV counselor provided HCV screening test results to all patients. She counseled patients who screened positive for HCV with the educational program on an electronic tablet and developed a follow‐up care plan.
A bilingual promotora (community health worker) contacted patients newly diagnosed with chronic HCV infection after hospital discharge to address the following: obtaining insurance, access to primary care and HCV specialty care, scheduling appointments, and treatment for alcohol problems or drug abuse. After obtaining signed consent, the promotora sent test results and recommendations for follow‐up care (eg, hepatitis A and B immunization) to a designated outpatient physician and reminded patients about appointments and pending tests. The promotora received training in motivational interviewing skills to engage patients with needed care including alcohol treatment.
Study Data
A summary report was developed from the EMR with demographic, insurance, clinical, and HCV screening data for all admitted baby boomers. For patients diagnosed with chronic HCV infection, the promotora obtained data about follow‐up HCV care through December 10, 2014 from the EMR, outside provider records, and patient reports.
Study Variables
The 2 outcome measures were a positive anti‐HCV antibody test and positive HCV RNA test. Insurance status was categorized as insured (private, public, Veterans Administration, Department of Defense) or uninsured (self‐pay or county‐based financial assistance program). Problem drinking was identified from International Classification of Diseases, Ninth Revision, Clinical Modification codes for the admission, notes by clinicians describing alcohol abuse/dependence, or quantity/frequency meeting National Institute on Alcohol Abuse and Alcoholism criteria for alcohol problems of >14 drinks/week or >4 drinks/day for men and >7 drinks per week or >3 drinks per day for women.[16]
Implementation costs included informatics support, mobile app development, other patient educational materials, costs of screening tests for uninsured, and 0.3 full‐time equivalent (FTE) of a clinician for half a year. Maintenance costs included salaries for the study team, HCV testing costs, and postage.
Analysis
Demographics by HCV antibody test results are compared using [2] tests or Student t tests as appropriate. Among persons with a positive HCV antibody test, HCV RNA results are similarly compared. This implementation project was approved by the University of Texas Health Science Center at San Antonio Institutional Review Board (HSC20130033N).
RESULTS
Within 14 months, 6410 unique baby boomers were admitted with a mean age 56.4 years (standard deviation [SD] 5.7), 55.9% men, 59.1% Hispanic, 8.2% nonwhite, and 46.7% uninsured (Table 1). Among admitted patients, 729 (11.4%) had a previous HCV diagnosis and 1904 (29.7%) had been tested for HCV (Figure 1). Anti‐HCV antibody testing was completed for 3168 (49.4% of all admitted patients and 83.9% of never‐tested patients). After exclusions such as significant comorbidity or psychiatric admission, 95% of eligible persons were tested. Of screened patients, 240 (7.6%) were positive; these patients were significantly younger (P<0.0001) and more likely to be men (P<0.0001) and uninsured (P=0.002) (Table 1). Notably, 10% of men were anti‐HCV positive versus 4% of women. In this predominantly Hispanic cohort, no significant difference appeared by race‐ethnicity, but African Americans had a higher prevalence (10.4%) than other groups.
| Characteristic | All Screened Patients, No. | Anti‐HCV Antibody‐Positive Patients, No. (Row %) | P Value* |
|---|---|---|---|
| |||
| Overall | 3,168 | Total=240 (7.6) | |
| Age, mean (SD) | 57.0 (5.7) | 54.8 (5.0) | <0.0001 |
| Sex | |||
| Men | 1,771 | 185 (10.4) | <0.0001 |
| Women | 1,397 | 55 (3.9) | |
| Race | |||
| Non‐Hispanic white | 1,036 | 86 (8.3) | 0.12 |
| Hispanic | 1,872 | 134 (7.2) | |
| African American | 163 | 17 (10.4) | |
| Other | 97 | 3 (3.1) | |
| Insurance | |||
| Insured | 1,740 | 109 (6.3) | 0.002 |
| Uninsured | 1,428 | 131 (9.2) | |
HCV RNA testing was completed for 214 (89.2%) anti‐HCVpositive patients, of whom 134 (62.6%) had detectable RNA, indicating chronic HCV infection (Figure 1). Overall, 4.2% of all eligible patients tested for HCV were chronically infected. No characteristics were significantly associated with chronic HCV, but persons with chronic infection tended to be younger, uninsured, and African American (Table 2).
| Characteristics | All HCV RNA‐Tested Patients, No. | HCV RNA‐Positive Patients, No. (Row %) | P Value* |
|---|---|---|---|
| |||
| Overall | 214 | 134 (62.6) | |
| Age, y, mean (SD) | 54.6 (5.0) | 54.2 (5.1) | 0.09 |
| Sex | |||
| Men | 165 | 106 (64.2) | 0.37 |
| Women | 49 | 28 (57.1) | |
| Race | |||
| Non‐Hispanic white | 78 | 49 (62.8) | 0.65 |
| Hispanic | 118 | 73 (61.8) | |
| African American | 15 | 11 (73.3) | |
| Other | 3 | 1 (33.3) | |
| Insurance | |||
| Insured | 92 | 52 (56.5) | 0.11 |
| Uninsured | 122 | 82 (67.2) | |
Among patients with chronic HCV infection, 129 (96.3%) were counseled and follow‐up plans developed (Figure 2). By December 10, 2014, 108 (80.6%) patients had received follow‐up primary care, and 52 (38.8%) had care from a hepatologist. Five had initiated HCV‐specific treatment, but many others were awaiting approval for compassionate drug programs offering direct‐acting antivirals. Barriers to care included 82 (61.2%) uninsured, 45 (34%) problem drinkers, 22 (16%) homeless, and 25 (18.6%) incarcerated (not shown). The promotora addressed these issues by visiting homes or homeless shelters, assistance with obtaining county‐based or other types of insurance, offering alcohol risk‐reduction counseling, linking patients to alcohol‐treatment programs, and communicating with the county jail about follow‐up care.
Most of the developmental costs for the program were dedicated to developing EMR programs (Table 3). An optional cost was for the development of the tablet educational program about HCV. In regard to maintenance costs for the first 14 months, the majority was to support the program faculty, counseling/case management, and a nurse practitioner who helped with ordering tests. We also estimated costs for testing uninsured patients (45% of HCV antibody tested, 57% of HCV PCR tested, per Tables 1 and 2, respectively), as they must be borne by the hospital.
| Program Component | Monthly ($) | Total ($) |
|---|---|---|
| ||
| Development phase (2 months prior to start) | ||
| Personnel | ||
| Faculty physicians (0.3 FTE salary+benefits) | 6,641 | 13,282 |
| Role: Development educational materials, provider education, and pilot testing | ||
| Technology | ||
| Development of eligibility screen and order sets for electronic medical record | 41,171 | |
| HCV counseling educational program for tabletdevelopment and pilot testing (optional) | 15,000 | |
| Patient educational materials (posters, flyers) | 400 | |
| Total for development phase | 69,853 | |
| Maintenance phase (14 months) | ||
| Personnel | ||
| Faculty physicians (0.3 FTE, salary+benefits) | 6,641 | 92,974 |
| Role: Coordinate with hospital staff and faculty, liaison with laboratory, supervise study team, review all identified cases for eligibility and management plans | ||
| Inpatient counselor and outpatient case management (2 FTE, salary+benefits) | 6,343 | 88,802 |
| Role: Inpatient and outpatient counseling of HCV Ab+patients and facilitation of follow‐up care for patients with chronic HCV infection | ||
| Nurse practitioner ($35/hour @ 10 hours/month) | 350 | 4,900 |
| Role: Review daily list of admitted baby boomers and manually order HCV screening test for those missed by the automated order | ||
| Postage | 10 | 140 |
| Laboratory costs for uninsured (based on % in cohort) | ||
| HCV antibody in plasma preparation tubes ($13.41/test 1,423) | 19,082 | |
| HCV RNA PCR ($87.96/test 122) | 10,731 | |
| Total for maintenance phase | 216,629 | |
| Total program costs | 286,482 | |
DISCUSSION
Implementation of universal HCV screening and linkage to care for hospitalized baby boomers utilizes a multicomponent infrastructure that reflects lessons learned from similar HIV programs. Use of an EMR algorithm to identify eligible patients and programs to automatically order HCV screening was a linchpin of our high testing rate and averted testing those who did not require screening. Of all 6410 baby boomers admitted to our safety‐net hospital, the EMR screen identified over 40% as ineligible due to prior diagnosis of HCV infection or prior HCV tests. Most of the additional 609 patients who were not tested were excluded due to comorbidities or admission to psychiatry. Overall, the EMR programs, tests ordered by the team, and opt‐out screening with education resulted in screening 95% of eligible patients. However, this program carries substantial costs, nearly $300,000 for the first 2 years, for unreimbursed services in this safety‐net hospital. The new guidelines for HCV screening[1, 2] are not accompanied by financial support either for program implementation or for screening and linkage to care for the uninsured, creating significant financial hurdles to achieve guideline compliance within already overtaxed public healthcare systems.
The infrastructure implemented in this hospital succeeded in achieving a higher rate of HCV screening of baby boomers than reported by other programs. In an emergency department in Birmingham, Alabama, a screening program for baby boomers tested 66% of 2325 persons who were HCV‐unaware.[17] In an outpatient clinic for men who have sex with men, only 54% of 1329 patients were screened for HCV.[18]
Among 3168 screened patients in our cohort, 7.6% were anti‐HCV antibody positive, which is over twice the prevalence of 3.5% (95% confidence interval: 2.2%‐4.8%) for anti‐HCVpositive tests in baby boomers based on National Health and Nutrition Examination Survey (NHANES) data from 2001 to 2010.[19] However, the Alabama emergency department study found that 11% of tested patients were anti‐HCV positive.[17] Although that study lacked race‐ethnicity data for half of the subjects, among those with this information, 13% of black and 7% of white subjects tested anti‐HCV positive. Compared with the Alabama study, the anti‐HCV prevalence in our cohort was somewhat lower for blacks (10.4%) but higher for non‐Hispanic whites (8.3%). Hispanics in our cohort had the lowest anti‐HCV prevalence (7.2%), whereas the Alabama study did not report this figure. National studies also find that the prevalence of anti‐HCVpositive results is twice as high for blacks compared with non‐Hispanic whites and Hispanics, and nearly twice as high for men compared with women.[19] In our cohort, the proportion of men with anti‐HCVpositive results was nearly 3 times that for women.
Diagnosis of chronic HCV infection requires 2 tests, similar to performing a Western blot test after a positive enzyme‐linked immunoassay for HIV. In a Veterans Affairs study, only 64% of patients with a positive anti‐HCV antibody test had a HCV RNA performed when reflex testing was not performed, and patients had to come in for a second test versus >90% of patients in sites that offer reflex testing.[20] At a somewhat increased price due to using more expensive PPTs ($96/100 PPT tubes vs $6.50/100 for serum red top tubes), both tests were performed on the same blood sample, resulting in 89% of anti‐HCV antibody‐positive patients being tested for HCV RNA.
Overall, 62% of patients in our cohort with a positive anti‐HCV antibody test had HCV RNA detected (viremic) compared with 71% of persons aged 20 years in an NHANES study from 2003 to 2010.[21] Several factors may contribute to this lower rate of chronic infection. In a study of HCV seropositive blood donors, Hispanics and non‐Hispanic whites were significantly more likely to have spontaneously cleared HCV infection than Asians and non‐Hispanic blacks.[22] Spontaneous clearance of HCV has also been associated with younger age at infection and HCV genotype 1.[23] Poorly understood genetic factors may also play a role.[24] The high rate of HCV clearance in our cohort reinforces the need to perform HCV RNA testing.
Overall, 4.2% of our cohort had chronic HCV infection. According to CDC estimates from 1999 to 2008 NHANES data, 2.74 million (3.25%) of 84.2 million US baby boomers have been infected with HCV, and 2.04 million (2.4%) have chronic infection.[1] Therefore, our safety‐net cohort of never‐tested baby boomers had over twice the prevalence of chronic HCV infection than the national estimate for this age group. This high proportion of chronic HCV may reflect our predominantly low‐income patient population. An analysis conducted by Milliman, Inc. using 2010 data estimated that half of all persons with undiagnosed HCV infection are uninsured.[25] This finding reinforces the need to conduct HCV screening in acute‐care settings such as hospitals, because the uninsured have poor access to ambulatory care.
Our chronic HCV‐infected cohort had many barriers to follow‐up care because most were uninsured and 15% were homeless. Our counselors addressed socioeconomic barriers to care[26] and concerns about the disease.[27] Many patients also had problem drinking based on either self‐report or documented in the medical record. Even moderate alcohol use may increase the risk of overall and liver‐related mortality from chronic HCV infection,[28] so our team offered brief alcohol counseling and partnered with healthcare providers and local Alcoholics Anonymous programs to offer support.
We linked 80% of newly diagnosed patients to primary care or hepatology providers, aided by a county‐level financial assistance program for healthcare services for uninsured residents, but it still required patients to pay out of pocket for care. Access to newer, highly effective, all‐oral therapy treatment[5] was slowed while awaiting US Food and Drug Administration approval in the first year of this project, then treatment provided only after lengthy applications to drug company assistance programs with priority given to persons with compensated cirrhosis.
Our project raises serious concerns for policymakers and payers. Should universal baby boomer HCV testing be undertaken without taking into account the financial and personnel resources required to implement this screening program or the substantial expenditures necessary to treat chronically infected persons? Although the Centers for Medicaid and Medicare Services pay for HCV screening costs,[29] our hospital had to cover costs for uninsured persons. Admittedly, Texas has the highest proportion of residents who are uninsured in the nation, but even in other states, Medicaid and other insurance programs are wrestling with how to deal with the high cost of HCV therapy.[30]
We acknowledge several limitations of this project. First, it was undertaken in only 1 hospital. Yet, our challenges and solutions are likely to be applicable to other hospitals nationally, especially those serving vulnerable populations. Second, patients in our cohort were usually admitted for comorbidities that needed to be managed before HCV infection could be addressed. However, persons with a poor prognosis, such as metastatic cancer, were excluded. We did not attempt to exclude other persons with serious comorbidities such as congestive heart failure, because the guidelines do not currently recommend this, and there may be benefits for patients, their families, and providers from knowing that an individual is chronically HCV infected even if they are not eligible to be treated. Third, the cost of the program was supported in part by a grant and would otherwise have to be borne by the hospital. Fourth, the EMR used by our hospital allows hundreds of admission order sets to be created and made automated order entry hard to implement. This is unlikely to be the situation in other hospitals using different types of EMRs.
It remains to be seen whether safety‐net hospitals with populations at greater risk of HCV infection can afford to support HCV testing and linkage to care. In view of several cost‐effectiveness studies that find screening and treating chronic HCV‐infected baby boomers cost‐effective within standard thresholds,[31, 32, 33] it may be important for policymakers and payers to consider lessons from HIV programs. Because HIV‐infected persons could not afford life‐saving medication, vigorous advocacy efforts led to legislation approving the Ryan White program in 1990 to fill gaps in HIV care that were not covered by other sources of support.[34] HCV infection is the most common blood‐borne infection in the nation, with potentially devastating consequences if ignored, but the underlying premise that universal HCV testing will save lives is in question if most of the individuals who are diagnosed with chronic HCV are low income, uninsured, or underinsured with limited access to curative medications. A rigorous public policy debate regarding both the merits of screening and the availability of treatment to those who are diagnosed is essential to the success of these programs.
Disclosure
Funding for this study was received from the Centers for Disease Control and Prevention CDC PS12‐1209PPHF12. The authors report no conflicts of interest.
- , , , , , Centers for Disease Control and Prevention. Recommendations for the identification of chronic hepatitis C virus infection among persons born during 1945–1965. MMWR Recomm Rep. 2012;61:1–32.
- 2. Centers for Disease Control and Prevention. Vital signs: evaluation of hepatitis C virus infection testing and reporting–eight U.S. sites, 2005‐2011. MMWR Morb Mortal Wkly Rep. 2013;62:357–361.
- , , , , Hepatitis C virus infection in USA: an estimate of true prevalence. Liver Int. 2011;31:1090–1101.
- Institute of Medicine. Hepatitis and liver cancer: a national strategy for prevention and control of hepatitis B and C. Washington, DC: The National Academies Press; 2010.
- , Current and future therapies for hepatitis C virus infection. N Engl J Med. 2013;368:1907–1917.
- , , , et al. Increasing prevalence of HCC and cirrhosis in patients with chronic hepatitis C virus infection. Gastroenterology. 2011;140:1182–1188.
- U.S. Preventive Services Task Force. Screening for hepatitis C virus infection in adults: U.S. Preventive Services Task Force recommendation statement. Ann Intern Med. 2013;159:349–357.
- , , Undiagnosed hepatitis C on the general medicine and trauma services of two urban hospitals. J Infect. 2009;59:62–69.
- U.S. Preventive Services Task Force. Screening for HIV: U.S. Preventive Services Task Force recommendation statement. Ann Intern Med. 2013;159:51–60.
- , , , et al. Factors affecting clinician educator encouragement of routine HIV testing among trainees. J Gen Intern Med. 2012;27:839–844.
- , , , et al. Counselor‐versus provider‐based HIV screening in the emergency department: Results from the universal screening for HIV infection in the emergency room (USHER) randomized controlled trial. Ann Emerg Med. 2011;58:S126–S132.e1–4.
- , , Approaching the CDC's guidelines on the HIV testing of inpatients: physician‐referral versus nonreferral‐based testing. AIDS Patient Care STDS. 2006;20:311–317.
- Centers for Disease Control and Prevention (CDC). Testing for HCV infection: an update of guidance for clinicians and laboratorians. MMWR Morb Mortal Wkly Rep. 2013;62:362–365.
- Advia Centaur Assay Manual. Malvern, PA: Siemens Medical Solutions Diagnostics; Pub# 07063235, Rev. C, 2005‐01.
- , , , Comparison of the ADVIA Centaur and Abbott AxSYM immunoassay systems for a routine diagnostic virology laboratory. J Clin Virol. 2004;30:S11–S15.
- National Institute on Alcohol Abuse and Alcoholism. Drinking levels defined. Available at: http://www.niaaa.nih.gov/alcohol‐health/overview‐alcohol‐consumption/moderate‐binge‐drinking. Accessed June 12, 2014.
- , , , et al. Unrecognized chronic hepatitis C virus infection among baby boomers in the emergency department. Hepatology. 2015;61:776–782.
- , , , et al. Low rates of hepatitis screening and vaccination of HIV‐infected MSM in HIV clinics. Sex Transm Dis. 2012;39:349–353.
- , , , , , The changing epidemiology of hepatitis C virus infection in the United States: National Health and Nutrition Examination Survey 2001 through 2010. J Hepatol. 2014;60:691–698.
- , , , , Viral RNA testing in hepatitis C antibody‐positive veterans. Am J Prev Med. 2009;36:235–238.
- , , , et al. Chronic hepatitis C virus infection in the United States: National Health and Nutrition Examination Survey 2003 to 2010. Ann Intern Med. 2014;160:293–300.
- , , , et al. NHLBI Retrovirus Epidemiology Donor Study (REDS) Group. Correlates of hepatitis C virus (HCV) RNA negativity among HCV‐seropositive blood donors. Transfusion. 2006;46:469–475.
- , , , , , Spontaneous loss of hepatitis C virus RNA from serum is associated with genotype 1 and younger age at exposure. J Med Virol. 2011;83:1338–1344.
- , , , et al. Genetics of spontaneous clearance of hepatitis C virus infection: a complex topic with much to learn. Hepatology. 2014;60:2127–2128.
- , , , Health care reform and hepatitis C: a convergence of risk and opportunity. Available at: http://us.milliman.com/uploadedFiles/insight/2013/convergence‐of‐risk‐and‐opportunity.pdf. Accessed February 5, 2015.
- , , , Hepatitis C testing, infection, and linkage to care among racial and ethnic minorities in the United States, 2009‐2010. Am J Public Health. 2013;103:112–119.
- , Barriers to hepatitis C treatment. Liver Int. 2012;32:151–156.
- , , , , Moderate, excessive or heavy alcohol consumption: Each is significantly associated with increased mortality in patients with chronic hepatitis C. Aliment Pharmacol Ther. 2013;37:703–709.
- Centers for Medicare and Medicaid Services. Proposed decision memo for screening for hepatitis c virus (HCV) in adults (CAG‐00436N). Available at: http://www.cms.gov/medicare-coverage-database/details/nca-proposed-decision-memo.aspx?NCAId=272. Accessed June 2, 2014.
- , Therapy for hepatitis C—the costs of success. N Engl J Med. 2014;370:1552–1553.
- , , , et al. Economic model of a birth cohort screening program for hepatitis C. Hepatology. 2012;55:1344–1355.
- , , , Cost‐effectiveness analysis of risk‐factor guided and birth‐cohort screening for chronic hepatitis C infection in the United States. PLoS One. 2013;8:e58975.
- , , , et al. The cost‐effectiveness of birth‐cohort screening for hepatitis C antibody in U.S. primary care settings. Ann Intern Med. 2012;156:263–270.
- U.S. Department of Health and Human Services. Health Resources and Services Administration: HIV/AIDS programs. Available at: http://hab.hrsa.gov/abouthab/legislation.html. Accessed April 8, 2015.
© 2015 Society of Hospital Medicine

Nighttime Clinical Encounters
For hospitalized patients, restrictions on resident duty hours and the hospitalist movement have led to fragmentation in care.[1] After 2003 duty‐hour regulations were implemented, one study estimated an increase of 11% in care transfers for a given patient, whereas another study reported that an individual intern participated in 40% more handoffs.[2, 3] Although these changes have represented an improvement in safety with reduced provider fatigue and increased expertise in inpatient care, tradeoffs in safety may occur. Communication breakdown during care transfers has been implicated in many medical errors,[4, 5, 6] and the ability to safely transfer a patient's care has been identified as a necessary clinical skill.[7] The Accreditation Council on Graduate Medical Education has mandated that training programs include education to ensure effective handoff processes.[8] The Joint Commission has developed a toolset for improving handoffs.[9] Taking cues from the military and other industries that operate continuously, approaches designed to standardize handoffs have been developed.[3, 10, 11, 12]
The use of handoff tools has been reported to reduce the time required to transfer care from one provider to another,[13] but evidence that these handoff tools improve quality of care is limited.[14, 15] Concern that patients have poorer outcomes in care transitions remains, particularly at night when many patients are cared for by covering or night float providers.[6] Studies regarding the outcomes of patients at night have had mixed results.[16, 17, 18] Uncertainty is inherent in the trajectories of individual patients and in the systems in which they receive care.[19] The recognition of uncertainty reframes care transitions from a problem of improving information transfer to a problem of navigating uncertainty, or making sense. Sensemaking is an activity through which providers come to understand what is happening with a patient, in a way that allows them to take action.[20]
We sought to better understand how to support providers' ability to make sense and act in uncertain situations, focusing on night float resident physicians. We hoped to better understand overnight encounters and the information needed to navigate them. We approached the issue in two ways: first, through assessing resident attitudes and perceptions of handoffs using survey methodology, and second, through assessing actual calls night float residents receive and strategies they use to navigate these scenarios. We focused on handoffs between the primary team and covering nighttime providers. Our goal was to use this information to understand what approaches could better support care transitions and handoff practices.
METHODS
General Approach
We surveyed residents regarding handoffs. We also collected self‐reported information about calls received by night float postgraduate year (PGY) 1 (intern) residents and the strategies they used to address these calls.
Setting
Our study was conducted in the internal medicine residency program at the University of Texas Health Science Center at San Antonio, which has approximately 90 residents, 76 of whom are categorical. Residents work at 2 primary teaching hospitals: the Audie L. Murphy Veterans Affairs Hospital (ALMVAH), the 220‐bed acute care hospital for the South Texas Veterans Health Care System, and University Hospital (UH), the 614‐bed county hospital for Bexar County.
The residency program implemented a night float system in 1992. Daytime care is performed by multiple teams, which are comprised of one attending, one resident, and two to three interns. These teams sign out to the on‐call team in the late afternoon to early evening. The on‐call team in turn signs out to a night intern who is supervised by a resident and on‐site faculty member. The night float intern is responsible for all patient care on five inpatient teams until 7 am the following day, but is not responsible for admitting patients. In the morning, the night intern discusses overnight events with the day teams as they arrive.
Sign‐out consists of verbal and written communication. At ALMVAH, written documentation is created within the electronic medical record. Basic information is prepopulated, and clinical information is modifiable. At UH, written documentation is created in word processing software and maintained within a document saved electronically. It is expected that the day team update the modifiable information within these documents on a daily basis. The written documentation is printed and given to the covering interns (see Supporting Information, Appendix 1, in the online version of this article showing the sign‐out tools used by our program.).
The day team is responsible for the content and level of detail in the written sign‐out. There are three domains including: main diagnosis, clinical history and course, and plans of care. The clinical history and course is a synopsis of the patient presentation including current clinical status. The plans of care are reserved for expectant management or conditional statements.
Survey Development
A survey regarding resident experiences and perceptions of handoffs was developed by the Department of Surgery, and we adapted it to the internal medicine residency program. The survey contained 48 questions focused on the following areas: attitudes toward night float, communication content, and night float behaviors (see Supporting Information, Appendix 2, in the online version of this article for the full survey). Some responses were recorded in a 5‐point Likert‐type format, in a range of strongly disagree to strongly agree. Others were recorded on a 4‐point frequency scale from never to always. Paper and online survey versions were created, and residents could respond using either modality.
Survey Administration
All residents were asked to participate in the survey. Paper versions were distributed in March 2012. All residents also received an e‐mail soliciting participation. Responses were collected anonymously. Reminders were sent on a biweekly basis for six weeks. Survey administration was concluded by May 2012, and no incentive was offered for completion.
Overnight Call Data
We asked the night interns at both hospitals to self‐report activities in real time during their shift. To minimize respondent burden and obtain a representative sample, they collected data on their activities over 2‐hour periods. On any given night, a predetermined period was assigned, and all periods were sampled equally over the duration of data collection. A total of six interns at both hospitals were asked to participate over 18 nights during a 3‐month period in 2011. Convenience sampling was used, and participants were identified based on clinical schedules.
The tool allowed interns to record unique encounters initiated as a phone call or page. Open‐ended responses were permitted for caller identification and encounter reason. The interns categorized the source of background information and were permitted to select more than one for any given encounter. Similarly, the interns were asked to categorize the type of action required to respond (see Supporting Information, Appendix 3, in the online version of this article for the self‐report tool).
Overnight encounters were categorized as clinical, administrative, or pain related. Clinical encounters consisted of calls related to clinical conditions that would require clinical assessment and decision making, for example, a patient with new fever. Administrative encounters consisted of contact for reasons that would require only acknowledgement from a physician. An example of an administrative encounter is restraint renewal. Pain‐related calls consisted of calls for patients experiencing pain or requests for new or additional pain medications.
Analysis
Frequency and percentages were calculated for each category of encounter, including callers and reasons for calls. Comparisons were made between reasons for the encounter, the sources of background information utilized, and actions taken in response. Survey data were analyzed using Microsoft Excel (Microsoft Corp., Redmond, WA).
RESULTS
Encounter Data
Data from 299 encounters were recorded, and 96.7% (289/299) encounters were complete. Clinical encounters were most frequent at 54.7% (158/289), whereas administrative notifications or pain‐related encounters were 32.9% (158/289) and 12.5% (36/289), respectively. Nurses initiated 94.8% (274/289) of encounters.
Sources of information used by interns varied by reason for the call and are shown in Table 1. Responding to clinical requests, interns most frequently interacted with a nurse alone or in combination with the chart (51.3%, 81/158). Responding to administrative notifications, the interns most frequently spoke to only the nurse as the primary source of information (44.2%, 42/95). In pain‐related notifications, the nurse alone as a source of information accounted for 33.3% (12/36) of encounters. The sign‐out tool was not used in 72.3% (209/289) of encounters.
| Information Source | Encounter Type | |||
|---|---|---|---|---|
| Clinical* | Administrative | Pain Related | All | |
| ||||
| Only tool | 2 (1.3%) | 6 (6.3%) | 2 (5.6%) | 10 (3.5%) |
| Only nurse | 30 (19.0%) | 42 (44.2%) | 12 (33.3%) | 84 (29.1%) |
| Only chart‖ | 28 (17.7%) | 14 (14.7%) | 5 (13.9%) | 47 (16.3%) |
| Only miscellaneous | 4 (2.5%) | 2 (2.1%) | 0 (0.0%) | 6 (2.1%) |
| Tool+nurse | 10 (6.3%) | 8 (8.4%) | 5 (13.9%) | 23 (8.0%) |
| Tool+chart‖ | 10 (6.3%) | 5 (5.3%) | 1 (2.8%) | 16 (5.5%) |
| Nurse+chart‖ | 51 (32.3%) | 12 (12.6%) | 5 (13.9%) | 68 (23.5%) |
| Nurse+miscellaneous | 1 (0.6%) | 0 (0.0%) | 0 (0.0%) | 1 (0.3%) |
| Chart+miscellaneous | 3 (1.9%) | 0 (0.0%) | 0 (0.0%) | 3 (1.0%) |
| Tool, nurse,+chart‖ | 19 (12.0%) | 6 (6.3%) | 6 (16.7%) | 31 (10.7%) |
Use of miscellaneous information sources was infrequent; removing these left 279 encounters with complete information. To better assess the instances in which the handoff tool was used, we combined categories for information sources. These data are summarized in Table 2.
| Information Source | Request Type | ||
|---|---|---|---|
| Clinicala | Administrativeb | Pain Relatedc | |
| |||
| Only tool | 2 (1.3%) | 6 (6.5%) | 2 (5.6%) |
| Only nurse | 30 (20.0%) | 42 (45.2%) | 12 (33.3%) |
| Only chart | 28 (18.7%) | 14 (15.1%) | 5 (13.9%) |
| Any combination with tool | 39 (26.0%) | 19 (20.4%) | 12 (33.3%) |
| Any combination without tool | 51 (34.0%) | 12 (12.9%) | 5 (13.9%) |
The actions taken by interns varied by reason for the call. Clinical encounters had the most variety of actions taken, with 55.1% (87/158) resulting in a new medication order and 49.9% (78/158) handled over the phone. Bedside evaluations occurred in 23.4% (37/158) of the encounters, and 3.8% (6/158) were documented in the electronic medical record. Administrative encounter responses were more homogeneous; 96.8% (92/95) were handled entirely over the phone. Responses to pain‐related requests were similarly less varied than clinical encounters; 63.9% (23/36) were handled over the phone and 66.7% (24/36) resulted in a new medication order. Neither administrative nor pain notifications resulted in documentation in the electronic medical records. These data are summarized in Table 3. Despite the availability of a resident and attending overnight, only 6.3% (10/150) of the clinical requests led to a discussion with them; none of the administrative or pain‐related notifications involved discussion with either the resident or the attending.
| Actions Taken | Encounter Type | ||
|---|---|---|---|
| Clinicala | Administrativeb | Pain Relatedc | |
| |||
| Handled over the phone | 78 (49.4%) | 92 (96.8%) | 23 (63.9%) |
| Evaluated the patient at the bedside | 37 (23.4%) | 2 (2.1%) | 2 (5.6%) |
| Reviewed previously ordered labs or imaging | 43 (27.2%) | 12 (12.6%) | 0 (0.0%) |
| Ordered new lab or imaging | 44 (27.8%) | 2 (2.1%) | 0 (0.0%) |
| Ordered new medication | 87 (55.1%) | 1 (1.1%) | 24 (66.7%) |
| Wrote cross‐cover note | 6 (3.8%) | 0 (0.0%) | 0 (0.0%) |
| Conferred with supervising physician | 10 (6.3%) | 0 (0.0%) | 0 (0.0%) |
| Called consult | 3 (1.9%) | 0 (0.0%) | 0 (0.0%) |
| Upgraded level of care | 1 (0.6%) | 0 (0.0%) | 0 (0.0%) |
Survey Data
Fifty‐three residents completed surveys, for an overall response rate of 59.6% (53/89). All PGYs were represented; PGY‐3s had a response rate of 68.0% (17/25), PGY‐2s had a 58.3% response rate (14/24), and PGY‐1s had a 55% response rate (22/40).
A night float intern was perceived to be safer than an on‐call team performing the same job by 73.6% (39/89) of respondents. The written sign‐out was considered a time saver by 66% (35/53) of respondents. The sign‐out procedure was thought to be frequently or always safe by 73.6% (39/89). Overnight documentation within the electronic medical record was reported to be frequently or always completed by 58.5% (31/53).
Furthermore, 20.7% (11/53) of respondents reported receiving a do not do list frequently or always, and 43.4% (23/53) of respondents reported giving a do not do list frequently or always. Conditional statements were reported as frequently or always given by 90.4% (47/52). A standardized verbal checkout was considered safer by 71.7% (38/53), standardized written documentation was considered beneficial by 94.3% (50/53), and a checklist to go over was considered beneficial by 84.9% (45/53).
DISCUSSION
Our goal was to understand how to better support care transitions and handoff processes. Our residents report that current approaches to care transitions are safe and useful. Although this perception is reassuring, it is difficult to know whether this reflects the actual delivery of safe care. A minority of residents report giving and receiving do not do lists, which are important aspects of care when giving guidance to a covering physician. Also, we find discrepancies between our survey results and nighttime call collection data in important areas. Although residents report that the written sign‐out is useful, it was deemed useful for resolving a clinical issue only 27% of the time. Previous reports have found variable and conflicting rates of written sign‐out utilization, as well as variable quality of a written sign‐out,[21, 22, 23] and our data support infrequent usage. Residents were much more likely to access the electronic medical record than they were to use the handoff tool. Additionally, although residents report documentation, very little actual documentation occurred. The high rates of calls for routine and pain‐related notifications are notable and should be examined further for areas of potential improvement. Preemptive orders for routine, common, and benign conditions are often not employed as strategy and their omission can lead to higher workloads for nighttime physicians. Additionally, education and training may be necessary to help housestaff understand how such a strategy is safely implemented, such as a specific regimen for mild pain, and why it is helpful beyond reducing nighttime workload, such as a proactive approach to clinical care.
Several important insights emerge from our results. First, the electronic health record is accessible, and providers use it frequently. This raises the question of the need for a handoff tool for information transfer. When data can be easily accessed, their presence in a physical tool may be less important. Because electronic health records can easily be leveraged to populate handoff tools, having a brief tool that minimizes information transfer but better supports clinical reasoning may be more effective.
Second, our data highlight the need to focus on the handback, or providing information back to the returning day team. Our experience and previous studies support that this process is not adequately developed.[24, 25] There is little opportunity for communication between the covering and primary providers, and there is little documentation. In our observations, 3.8% of calls resulted in documentation, whereas the majority of respondents to the survey state it is performed frequently or always. The reason for this discrepancy is unclear, but fostering more of a mentality that considers all of the providers involved in patient care to be part of the same team may help address this issue.
Third, clinical services assume providers have what they need to provide care in the form of the handoff instrument. In fact, providers have handoff instruments, but whether they need them is unclear. Based on these observations, overnight physicians are able to provide care in the vast majority of cases without the use of the handoff tool.
Fourth, our data demonstrate the social or relational nature of providing clinical coverage. The single most frequent action taken by covering residents was speaking to the nurse. This may not be surprising; however, when we reframe transitions of care and handoffs as a relational issue, we are forced to reframe potential strategies to improve these transitions. The problem we need to address is not only of information transfer; it is also of making sense of what is happening.
How do we make handoff tools more effective sensemaking tools? More focus on contingency statements might be an approach. These have the dual benefit of helping the covering provider to make sense using the primary team's reasoning, as well as improving the primary team's reasoning by making the potential complications more explicit. Another approach could be to reinforce relational actions, through providing guidance on who to call if there is a change in the status of the patient. We found that the night intern rarely discussed care with supervising physicians, indicating weak integration of the night team. The handoff tool could thus strengthen the network of providers caring for the patient. A tool that emphasizes sensemaking may be a tool that captures the nonroutine aspects of care that are not already documented in the health record.
Our data are limited in that they were collected in a single institution over few nights with few interns. Our processes may not be representative, and our expectations for provider communication may not be the norm. Although a night float system of coverage is not the only model of providing care, it is common, and our handoff tool is similar to those reported in the literature. One area of concern is that our handback expectations may be less robust than other institutions. Despite this limitation, the larger issues of information transfer and sensemaking are generally applicable. Although we collected data over only 18 nights, we did obtain information on almost 300 calls, giving us a robust sample of actual issues that residents were called to resolve. Interns are the most involved in actually providing night coverage. Their response rate was 55%, slightly below our overall response rate of 59.6%, but representing the majority of interns. A 2‐step process of sign‐out may have ramifications on care transitions; however, these data were collected at night. Because the handoff tool information is the day team's responsibility, the process may have less impact on these results.
Coverage and care transfers are part of the inpatient landscape, and it may be unreasonable to expect care to be delivered by a group of providers who know the patient with the same level of depth at all hours of the day. By understanding that fostering effective care for patients requires providers to pay attention to not only how they transfer information, but also how they collectively make sense of what is happening, we will enable safer care.
Disclosures: The research reported here was supported by the Department of Veterans Affairs, Veterans Health Administration, Health Services Research and Development Service (CDA 07‐022). Investigator salary support was provided through this funding, and through the South Texas Veterans Health Care System. The views expressed in this article are those of the authors and do not necessarily reflect the position or policy of the Department of Veterans Affairs. Parts of these data were presented at the 2013 SGIM National Meeting in Denver, Colorado. The authors report no conflicts of interest.
- , , , , . The impact of fragmentation of hospitalist care on length of stay. J Hosp Med. 2010;5(6):335–358.
- , , , . Transfers of patient care between house staff on internal medicine wards: a national survey. Arch Intern Med. 2006;166(11):1173–1177.
- , , , , . Managing discontinuity in academic medical centers: strategies for a safe and effective resident sign‐out. J Hosp Med. 2006;1(4):257–266.
- , , , , , . The Quality in Australian Health Care Study. Med J Aust. 1995;163(9):458–471.
- “Improving America's Hospitals.” The Joint Commission's Annual Report on Quality and Safety. Available at: http://www.jointcommission.org/Improving_Americas_Hospitals_The_Joint_Commissions_Annual_Report_on_Quality_and_Safety_‐_2007. Published 2007. Accessed November 17, 2014.
- , , , , . Communication failures in patient sign‐out and suggestions for improvement: a critical incident analysis. Qual Saf Health Care. 2005;14(6):401–407.
- , . Resident handoffs: appreciating them as a critical competency. J Gen Intern Med. 2012;27(3):270–272.
- Accreditation Council for Graduate Medical Education. Common program requirements. Available at: http://www.acgme.org/acgmeweb/Portals/0/PDFs/Common_Program_Requirements_07012011%5B2%5D.pdf. Published July 1, 2011. Accessed November 17, 2014.
- Joint Commission Center for Transforming Healthcare. Hand‐off communications. Available at: http://www.centerfortransforminghealthcare.org/projects/detail.aspx?Project=1. Accessed November 17, 2014.
- , . Handover and note‐keeping: the SBAR approach. Clin Risk. 2010;16(5):173–175.
- , , , et al. A structured handoff program for interns. Acad Med. 2009;84(3):347–352.
- , , , et al. I‐pass, a mnemonic to standardize verbal handoffs. Pediatrics. 2012;129(2):201–204.
- , , . SBAR: a shared mental model for improving communication between clinicians. Jt Comm J Qual Patient Saf. 2006;32(3):167–175.
- , , , , . Review of computerized physician handoff tools for improving the quality of patient care. J Hosp Med. 2013;8(8):456–463.
- , , , et al. Changes in medical errors after implementation of a handoff program. N Engl J Med. 2014;371(19):1803–1812.
- , , , , , . Systematic review: effects of resident work hours on patient safety. Ann Intern Med. 2004;141(11):851–857.
- , . Mortality in out‐of‐hours emergency medical admissions—more than just a weekend effect. J R Coll Physicians Edinb. 2010;40(2):115–118.
- , , , , , . The association between night or weekend admission and hospitalization‐relevant patient outcomes. J Hosp Med. 2011;6(1):10–14.
- , , . Varieties of uncertainty in health care: a conceptual taxonomy. Med Decis Making. 2011;31(6):828–838.
- . Sensemaking in Organizations. Thousand Oaks, CA: Sage Publications; 1995.
- , , , , . Answering questions on call: pediatric resident physicians' use of handoffs and other resources. J Hosp Med. 2013;8(6):328–333.
- , , , . Effectiveness of written hospitalist sign‐outs in answering overnight inquiries. J Hosp Med. 2013;8(11):609–614.
- , , . Assessment of internal medicine trainee sign‐out quality and utilization habits. Intern Emerg Med. 2014;9(5):529–535.
- , , , , . Morning handover of on‐call issues: opportunities for improvement. JAMA Intern Med. 2014;174(9):1479–1485.
- , , , et al. Improving resident morning sign‐out by use of daily events reports [published online ahead of print February 11, 2014]. J Patient Saf. doi: 10.1097/PTS.0b013e31829e4f56
For hospitalized patients, restrictions on resident duty hours and the hospitalist movement have led to fragmentation in care.[1] After 2003 duty‐hour regulations were implemented, one study estimated an increase of 11% in care transfers for a given patient, whereas another study reported that an individual intern participated in 40% more handoffs.[2, 3] Although these changes have represented an improvement in safety with reduced provider fatigue and increased expertise in inpatient care, tradeoffs in safety may occur. Communication breakdown during care transfers has been implicated in many medical errors,[4, 5, 6] and the ability to safely transfer a patient's care has been identified as a necessary clinical skill.[7] The Accreditation Council on Graduate Medical Education has mandated that training programs include education to ensure effective handoff processes.[8] The Joint Commission has developed a toolset for improving handoffs.[9] Taking cues from the military and other industries that operate continuously, approaches designed to standardize handoffs have been developed.[3, 10, 11, 12]
The use of handoff tools has been reported to reduce the time required to transfer care from one provider to another,[13] but evidence that these handoff tools improve quality of care is limited.[14, 15] Concern that patients have poorer outcomes in care transitions remains, particularly at night when many patients are cared for by covering or night float providers.[6] Studies regarding the outcomes of patients at night have had mixed results.[16, 17, 18] Uncertainty is inherent in the trajectories of individual patients and in the systems in which they receive care.[19] The recognition of uncertainty reframes care transitions from a problem of improving information transfer to a problem of navigating uncertainty, or making sense. Sensemaking is an activity through which providers come to understand what is happening with a patient, in a way that allows them to take action.[20]
We sought to better understand how to support providers' ability to make sense and act in uncertain situations, focusing on night float resident physicians. We hoped to better understand overnight encounters and the information needed to navigate them. We approached the issue in two ways: first, through assessing resident attitudes and perceptions of handoffs using survey methodology, and second, through assessing actual calls night float residents receive and strategies they use to navigate these scenarios. We focused on handoffs between the primary team and covering nighttime providers. Our goal was to use this information to understand what approaches could better support care transitions and handoff practices.
METHODS
General Approach
We surveyed residents regarding handoffs. We also collected self‐reported information about calls received by night float postgraduate year (PGY) 1 (intern) residents and the strategies they used to address these calls.
Setting
Our study was conducted in the internal medicine residency program at the University of Texas Health Science Center at San Antonio, which has approximately 90 residents, 76 of whom are categorical. Residents work at 2 primary teaching hospitals: the Audie L. Murphy Veterans Affairs Hospital (ALMVAH), the 220‐bed acute care hospital for the South Texas Veterans Health Care System, and University Hospital (UH), the 614‐bed county hospital for Bexar County.
The residency program implemented a night float system in 1992. Daytime care is performed by multiple teams, which are comprised of one attending, one resident, and two to three interns. These teams sign out to the on‐call team in the late afternoon to early evening. The on‐call team in turn signs out to a night intern who is supervised by a resident and on‐site faculty member. The night float intern is responsible for all patient care on five inpatient teams until 7 am the following day, but is not responsible for admitting patients. In the morning, the night intern discusses overnight events with the day teams as they arrive.
Sign‐out consists of verbal and written communication. At ALMVAH, written documentation is created within the electronic medical record. Basic information is prepopulated, and clinical information is modifiable. At UH, written documentation is created in word processing software and maintained within a document saved electronically. It is expected that the day team update the modifiable information within these documents on a daily basis. The written documentation is printed and given to the covering interns (see Supporting Information, Appendix 1, in the online version of this article showing the sign‐out tools used by our program.).
The day team is responsible for the content and level of detail in the written sign‐out. There are three domains including: main diagnosis, clinical history and course, and plans of care. The clinical history and course is a synopsis of the patient presentation including current clinical status. The plans of care are reserved for expectant management or conditional statements.
Survey Development
A survey regarding resident experiences and perceptions of handoffs was developed by the Department of Surgery, and we adapted it to the internal medicine residency program. The survey contained 48 questions focused on the following areas: attitudes toward night float, communication content, and night float behaviors (see Supporting Information, Appendix 2, in the online version of this article for the full survey). Some responses were recorded in a 5‐point Likert‐type format, in a range of strongly disagree to strongly agree. Others were recorded on a 4‐point frequency scale from never to always. Paper and online survey versions were created, and residents could respond using either modality.
Survey Administration
All residents were asked to participate in the survey. Paper versions were distributed in March 2012. All residents also received an e‐mail soliciting participation. Responses were collected anonymously. Reminders were sent on a biweekly basis for six weeks. Survey administration was concluded by May 2012, and no incentive was offered for completion.
Overnight Call Data
We asked the night interns at both hospitals to self‐report activities in real time during their shift. To minimize respondent burden and obtain a representative sample, they collected data on their activities over 2‐hour periods. On any given night, a predetermined period was assigned, and all periods were sampled equally over the duration of data collection. A total of six interns at both hospitals were asked to participate over 18 nights during a 3‐month period in 2011. Convenience sampling was used, and participants were identified based on clinical schedules.
The tool allowed interns to record unique encounters initiated as a phone call or page. Open‐ended responses were permitted for caller identification and encounter reason. The interns categorized the source of background information and were permitted to select more than one for any given encounter. Similarly, the interns were asked to categorize the type of action required to respond (see Supporting Information, Appendix 3, in the online version of this article for the self‐report tool).
Overnight encounters were categorized as clinical, administrative, or pain related. Clinical encounters consisted of calls related to clinical conditions that would require clinical assessment and decision making, for example, a patient with new fever. Administrative encounters consisted of contact for reasons that would require only acknowledgement from a physician. An example of an administrative encounter is restraint renewal. Pain‐related calls consisted of calls for patients experiencing pain or requests for new or additional pain medications.
Analysis
Frequency and percentages were calculated for each category of encounter, including callers and reasons for calls. Comparisons were made between reasons for the encounter, the sources of background information utilized, and actions taken in response. Survey data were analyzed using Microsoft Excel (Microsoft Corp., Redmond, WA).
RESULTS
Encounter Data
Data from 299 encounters were recorded, and 96.7% (289/299) encounters were complete. Clinical encounters were most frequent at 54.7% (158/289), whereas administrative notifications or pain‐related encounters were 32.9% (158/289) and 12.5% (36/289), respectively. Nurses initiated 94.8% (274/289) of encounters.
Sources of information used by interns varied by reason for the call and are shown in Table 1. Responding to clinical requests, interns most frequently interacted with a nurse alone or in combination with the chart (51.3%, 81/158). Responding to administrative notifications, the interns most frequently spoke to only the nurse as the primary source of information (44.2%, 42/95). In pain‐related notifications, the nurse alone as a source of information accounted for 33.3% (12/36) of encounters. The sign‐out tool was not used in 72.3% (209/289) of encounters.
| Information Source | Encounter Type | |||
|---|---|---|---|---|
| Clinical* | Administrative | Pain Related | All | |
| ||||
| Only tool | 2 (1.3%) | 6 (6.3%) | 2 (5.6%) | 10 (3.5%) |
| Only nurse | 30 (19.0%) | 42 (44.2%) | 12 (33.3%) | 84 (29.1%) |
| Only chart‖ | 28 (17.7%) | 14 (14.7%) | 5 (13.9%) | 47 (16.3%) |
| Only miscellaneous | 4 (2.5%) | 2 (2.1%) | 0 (0.0%) | 6 (2.1%) |
| Tool+nurse | 10 (6.3%) | 8 (8.4%) | 5 (13.9%) | 23 (8.0%) |
| Tool+chart‖ | 10 (6.3%) | 5 (5.3%) | 1 (2.8%) | 16 (5.5%) |
| Nurse+chart‖ | 51 (32.3%) | 12 (12.6%) | 5 (13.9%) | 68 (23.5%) |
| Nurse+miscellaneous | 1 (0.6%) | 0 (0.0%) | 0 (0.0%) | 1 (0.3%) |
| Chart+miscellaneous | 3 (1.9%) | 0 (0.0%) | 0 (0.0%) | 3 (1.0%) |
| Tool, nurse,+chart‖ | 19 (12.0%) | 6 (6.3%) | 6 (16.7%) | 31 (10.7%) |
Use of miscellaneous information sources was infrequent; removing these left 279 encounters with complete information. To better assess the instances in which the handoff tool was used, we combined categories for information sources. These data are summarized in Table 2.
| Information Source | Request Type | ||
|---|---|---|---|
| Clinicala | Administrativeb | Pain Relatedc | |
| |||
| Only tool | 2 (1.3%) | 6 (6.5%) | 2 (5.6%) |
| Only nurse | 30 (20.0%) | 42 (45.2%) | 12 (33.3%) |
| Only chart | 28 (18.7%) | 14 (15.1%) | 5 (13.9%) |
| Any combination with tool | 39 (26.0%) | 19 (20.4%) | 12 (33.3%) |
| Any combination without tool | 51 (34.0%) | 12 (12.9%) | 5 (13.9%) |
The actions taken by interns varied by reason for the call. Clinical encounters had the most variety of actions taken, with 55.1% (87/158) resulting in a new medication order and 49.9% (78/158) handled over the phone. Bedside evaluations occurred in 23.4% (37/158) of the encounters, and 3.8% (6/158) were documented in the electronic medical record. Administrative encounter responses were more homogeneous; 96.8% (92/95) were handled entirely over the phone. Responses to pain‐related requests were similarly less varied than clinical encounters; 63.9% (23/36) were handled over the phone and 66.7% (24/36) resulted in a new medication order. Neither administrative nor pain notifications resulted in documentation in the electronic medical records. These data are summarized in Table 3. Despite the availability of a resident and attending overnight, only 6.3% (10/150) of the clinical requests led to a discussion with them; none of the administrative or pain‐related notifications involved discussion with either the resident or the attending.
| Actions Taken | Encounter Type | ||
|---|---|---|---|
| Clinicala | Administrativeb | Pain Relatedc | |
| |||
| Handled over the phone | 78 (49.4%) | 92 (96.8%) | 23 (63.9%) |
| Evaluated the patient at the bedside | 37 (23.4%) | 2 (2.1%) | 2 (5.6%) |
| Reviewed previously ordered labs or imaging | 43 (27.2%) | 12 (12.6%) | 0 (0.0%) |
| Ordered new lab or imaging | 44 (27.8%) | 2 (2.1%) | 0 (0.0%) |
| Ordered new medication | 87 (55.1%) | 1 (1.1%) | 24 (66.7%) |
| Wrote cross‐cover note | 6 (3.8%) | 0 (0.0%) | 0 (0.0%) |
| Conferred with supervising physician | 10 (6.3%) | 0 (0.0%) | 0 (0.0%) |
| Called consult | 3 (1.9%) | 0 (0.0%) | 0 (0.0%) |
| Upgraded level of care | 1 (0.6%) | 0 (0.0%) | 0 (0.0%) |
Survey Data
Fifty‐three residents completed surveys, for an overall response rate of 59.6% (53/89). All PGYs were represented; PGY‐3s had a response rate of 68.0% (17/25), PGY‐2s had a 58.3% response rate (14/24), and PGY‐1s had a 55% response rate (22/40).
A night float intern was perceived to be safer than an on‐call team performing the same job by 73.6% (39/89) of respondents. The written sign‐out was considered a time saver by 66% (35/53) of respondents. The sign‐out procedure was thought to be frequently or always safe by 73.6% (39/89). Overnight documentation within the electronic medical record was reported to be frequently or always completed by 58.5% (31/53).
Furthermore, 20.7% (11/53) of respondents reported receiving a do not do list frequently or always, and 43.4% (23/53) of respondents reported giving a do not do list frequently or always. Conditional statements were reported as frequently or always given by 90.4% (47/52). A standardized verbal checkout was considered safer by 71.7% (38/53), standardized written documentation was considered beneficial by 94.3% (50/53), and a checklist to go over was considered beneficial by 84.9% (45/53).
DISCUSSION
Our goal was to understand how to better support care transitions and handoff processes. Our residents report that current approaches to care transitions are safe and useful. Although this perception is reassuring, it is difficult to know whether this reflects the actual delivery of safe care. A minority of residents report giving and receiving do not do lists, which are important aspects of care when giving guidance to a covering physician. Also, we find discrepancies between our survey results and nighttime call collection data in important areas. Although residents report that the written sign‐out is useful, it was deemed useful for resolving a clinical issue only 27% of the time. Previous reports have found variable and conflicting rates of written sign‐out utilization, as well as variable quality of a written sign‐out,[21, 22, 23] and our data support infrequent usage. Residents were much more likely to access the electronic medical record than they were to use the handoff tool. Additionally, although residents report documentation, very little actual documentation occurred. The high rates of calls for routine and pain‐related notifications are notable and should be examined further for areas of potential improvement. Preemptive orders for routine, common, and benign conditions are often not employed as strategy and their omission can lead to higher workloads for nighttime physicians. Additionally, education and training may be necessary to help housestaff understand how such a strategy is safely implemented, such as a specific regimen for mild pain, and why it is helpful beyond reducing nighttime workload, such as a proactive approach to clinical care.
Several important insights emerge from our results. First, the electronic health record is accessible, and providers use it frequently. This raises the question of the need for a handoff tool for information transfer. When data can be easily accessed, their presence in a physical tool may be less important. Because electronic health records can easily be leveraged to populate handoff tools, having a brief tool that minimizes information transfer but better supports clinical reasoning may be more effective.
Second, our data highlight the need to focus on the handback, or providing information back to the returning day team. Our experience and previous studies support that this process is not adequately developed.[24, 25] There is little opportunity for communication between the covering and primary providers, and there is little documentation. In our observations, 3.8% of calls resulted in documentation, whereas the majority of respondents to the survey state it is performed frequently or always. The reason for this discrepancy is unclear, but fostering more of a mentality that considers all of the providers involved in patient care to be part of the same team may help address this issue.
Third, clinical services assume providers have what they need to provide care in the form of the handoff instrument. In fact, providers have handoff instruments, but whether they need them is unclear. Based on these observations, overnight physicians are able to provide care in the vast majority of cases without the use of the handoff tool.
Fourth, our data demonstrate the social or relational nature of providing clinical coverage. The single most frequent action taken by covering residents was speaking to the nurse. This may not be surprising; however, when we reframe transitions of care and handoffs as a relational issue, we are forced to reframe potential strategies to improve these transitions. The problem we need to address is not only of information transfer; it is also of making sense of what is happening.
How do we make handoff tools more effective sensemaking tools? More focus on contingency statements might be an approach. These have the dual benefit of helping the covering provider to make sense using the primary team's reasoning, as well as improving the primary team's reasoning by making the potential complications more explicit. Another approach could be to reinforce relational actions, through providing guidance on who to call if there is a change in the status of the patient. We found that the night intern rarely discussed care with supervising physicians, indicating weak integration of the night team. The handoff tool could thus strengthen the network of providers caring for the patient. A tool that emphasizes sensemaking may be a tool that captures the nonroutine aspects of care that are not already documented in the health record.
Our data are limited in that they were collected in a single institution over few nights with few interns. Our processes may not be representative, and our expectations for provider communication may not be the norm. Although a night float system of coverage is not the only model of providing care, it is common, and our handoff tool is similar to those reported in the literature. One area of concern is that our handback expectations may be less robust than other institutions. Despite this limitation, the larger issues of information transfer and sensemaking are generally applicable. Although we collected data over only 18 nights, we did obtain information on almost 300 calls, giving us a robust sample of actual issues that residents were called to resolve. Interns are the most involved in actually providing night coverage. Their response rate was 55%, slightly below our overall response rate of 59.6%, but representing the majority of interns. A 2‐step process of sign‐out may have ramifications on care transitions; however, these data were collected at night. Because the handoff tool information is the day team's responsibility, the process may have less impact on these results.
Coverage and care transfers are part of the inpatient landscape, and it may be unreasonable to expect care to be delivered by a group of providers who know the patient with the same level of depth at all hours of the day. By understanding that fostering effective care for patients requires providers to pay attention to not only how they transfer information, but also how they collectively make sense of what is happening, we will enable safer care.
Disclosures: The research reported here was supported by the Department of Veterans Affairs, Veterans Health Administration, Health Services Research and Development Service (CDA 07‐022). Investigator salary support was provided through this funding, and through the South Texas Veterans Health Care System. The views expressed in this article are those of the authors and do not necessarily reflect the position or policy of the Department of Veterans Affairs. Parts of these data were presented at the 2013 SGIM National Meeting in Denver, Colorado. The authors report no conflicts of interest.
- , , , , . The impact of fragmentation of hospitalist care on length of stay. J Hosp Med. 2010;5(6):335–358.
- , , , . Transfers of patient care between house staff on internal medicine wards: a national survey. Arch Intern Med. 2006;166(11):1173–1177.
- , , , , . Managing discontinuity in academic medical centers: strategies for a safe and effective resident sign‐out. J Hosp Med. 2006;1(4):257–266.
- , , , , , . The Quality in Australian Health Care Study. Med J Aust. 1995;163(9):458–471.
- “Improving America's Hospitals.” The Joint Commission's Annual Report on Quality and Safety. Available at: http://www.jointcommission.org/Improving_Americas_Hospitals_The_Joint_Commissions_Annual_Report_on_Quality_and_Safety_‐_2007. Published 2007. Accessed November 17, 2014.
- , , , , . Communication failures in patient sign‐out and suggestions for improvement: a critical incident analysis. Qual Saf Health Care. 2005;14(6):401–407.
- , . Resident handoffs: appreciating them as a critical competency. J Gen Intern Med. 2012;27(3):270–272.
- Accreditation Council for Graduate Medical Education. Common program requirements. Available at: http://www.acgme.org/acgmeweb/Portals/0/PDFs/Common_Program_Requirements_07012011%5B2%5D.pdf. Published July 1, 2011. Accessed November 17, 2014.
- Joint Commission Center for Transforming Healthcare. Hand‐off communications. Available at: http://www.centerfortransforminghealthcare.org/projects/detail.aspx?Project=1. Accessed November 17, 2014.
- , . Handover and note‐keeping: the SBAR approach. Clin Risk. 2010;16(5):173–175.
- , , , et al. A structured handoff program for interns. Acad Med. 2009;84(3):347–352.
- , , , et al. I‐pass, a mnemonic to standardize verbal handoffs. Pediatrics. 2012;129(2):201–204.
- , , . SBAR: a shared mental model for improving communication between clinicians. Jt Comm J Qual Patient Saf. 2006;32(3):167–175.
- , , , , . Review of computerized physician handoff tools for improving the quality of patient care. J Hosp Med. 2013;8(8):456–463.
- , , , et al. Changes in medical errors after implementation of a handoff program. N Engl J Med. 2014;371(19):1803–1812.
- , , , , , . Systematic review: effects of resident work hours on patient safety. Ann Intern Med. 2004;141(11):851–857.
- , . Mortality in out‐of‐hours emergency medical admissions—more than just a weekend effect. J R Coll Physicians Edinb. 2010;40(2):115–118.
- , , , , , . The association between night or weekend admission and hospitalization‐relevant patient outcomes. J Hosp Med. 2011;6(1):10–14.
- , , . Varieties of uncertainty in health care: a conceptual taxonomy. Med Decis Making. 2011;31(6):828–838.
- . Sensemaking in Organizations. Thousand Oaks, CA: Sage Publications; 1995.
- , , , , . Answering questions on call: pediatric resident physicians' use of handoffs and other resources. J Hosp Med. 2013;8(6):328–333.
- , , , . Effectiveness of written hospitalist sign‐outs in answering overnight inquiries. J Hosp Med. 2013;8(11):609–614.
- , , . Assessment of internal medicine trainee sign‐out quality and utilization habits. Intern Emerg Med. 2014;9(5):529–535.
- , , , , . Morning handover of on‐call issues: opportunities for improvement. JAMA Intern Med. 2014;174(9):1479–1485.
- , , , et al. Improving resident morning sign‐out by use of daily events reports [published online ahead of print February 11, 2014]. J Patient Saf. doi: 10.1097/PTS.0b013e31829e4f56
© 2015 Society of Hospital Medicine