User login
Hospital-level factors associated with pediatric emergency department return visits
Return visit (RV) rate is a quality measure commonly used in the emergency department (ED) setting. This metric may represent suboptimal care at the index ED visit.1-5 Although patient- and visit-level factors affecting ED RVs have been evaluated,1,3,4,6-9 hospital-level factors and factors of a hospital’s patient population that may play roles in ED RV rates have not been examined. Identifying the factors associated with increased RVs may allow resources to be designated to areas that improve emergent care for children.10
Hospital readmission rates are a closely followed quality measure and are linked to reimbursement by the federal government, but a recent study found the influence a hospital can have on this marker may be mitigated by the impact of the social determinates of health (SDHs) of the hospital’s patient population.11 That study and others have prompted an ongoing debate about adjusting quality measures for SDHs.12,13 A clearer understanding of these interactions may permit us to focus on factors that can truly lead to improvement in care instead of penalizing practitioners or hospitals that provide care to those most in need.
Prior work has identified several SDHs associated with higher ED RV rates in patient- or visit-level analyses.3,11,14 We conducted a study of hospital-level characteristics and characteristics of a hospital’s patient population to identify potentially mutable factors associated with increased ED RV rates that, once recognized, may allow for improvement in this quality measure.
PATIENTS AND METHODS
This study was not considered human subjects research in accordance with Common Rule 45 CFR§46.104(f) and was evaluated by the Ann and Robert H. Lurie Children’s Hospital and Northwestern University Feinberg School of Medicine Institutional Review Boards and deemed exempt from review.
Study Population and Protocol
Our study had 2 data sources (to be described in detail): the Pediatric Health Information System (PHIS) and a survey of ED medical directors of the hospitals represented within PHIS. Hospitals were eligible for inclusion in the study if their data (1) met PHIS quality control standards for ED patient visits as determined by internal data assurance processes incorporated in PHIS,3,14,15 (2) included data only from an identifiable single main ED, and (3) completed the ED medical director’s survey.
PHIS Database
PHIS, an administrative database managed by Truven Health Analytics, includes data from ED, ambulatory surgery, observation, and inpatient encounters across Children’s Hospital Association member children’s hospitals in North America. Data are subjected to validity checks before being included in the database.16 PHIS assigns unique patient identifiers to track individual patient visits within participating institutions over time.
Hospitals were described by percentages of ED patients in several groups: age (<1, 1-4, 5-9, 10-14, and 15-18 years)17; sex; race/ethnicity; insurance type (commercial, government, other); ED International Classification of Diseases, Ninth Edition (ICD-9) diagnosis code–based severity classification system score (1-2, low severity; 3-5, high severity)18; complex
ED Medical Director Survey
A web-based survey was constructed in an iterative process based on literature review and expert opinion to assess hospital-level factors that may impact ED RV rates.3,7,24-26 The survey was piloted at 3 institutions to refine its structure and content.
The survey included 15 close-ended or multiple-choice questions on ED environment and operations and 2 open-ended questions, “What is the largest barrier to reducing the number of return visits within 72 hours of discharge from a previous ED visit?” and “In your opinion, what is the best way of reducing the number of the return visits within 72 hours of previous ED visit ?” (questionnaire in Supplemental material). Hospital characteristics from the survey included total clinical time allotment, or full-time equivalent (FTE), among all physicians, pediatric emergency medicine (PEM) fellowship-trained physicians, and all other (non-PEM) physicians. The data were standardized across sites by calculating FTE-per-10,000-visits values for each hospital; median duration of ED visit for admitted and discharged patients; median time from arrival to ED physician evaluation; rate of leaving without being seen; discharge educational material authorship and age specificity; follow-up visit scheduling procedure; and percentage of ED patients for whom English was a second language.
Responses to the 2 open-ended questions were independently categorized by Drs. Pittsenbarger and Alpern. Responses could be placed in more than 1 category if multiple answers to the question were included in the response. Categorizations were compared for consistency, and any inconsistencies were resolved by the consensus of the study investigators.
Outcome Measures From PHIS Database
All ED visits within a 12-month period (July 1, 2013–June 30, 2014) by patients younger than 18 years at time of index ED visit were eligible for inclusion in the study. An index visit was defined as any ED visit without another ED visit within the preceding 72 hours. The 72-hour time frame was used because it is the most widely studied time frame for ED RVs.5 Index ED visits that led to admission, observation status, death, or transfer were excluded.
The 2 primary outcomes of interest were (1) RVs within 72 hours of index ED visit discharge and (2) RVs within 72 hours that resulted in hospital admission or observation status at the next ED visit (RVA).7,9,27-30 For patients with multiple ED revisits within 72 hours, only the first was assessed. There was a 72-hour minimum between index visits for the same patient.
Statistical Analyses
To determine hospital groups based on RV and RVA rates, we adjusted RV and RVA rates using generalized linear mixed-effects models, controlling for clustering and allowing for correlated data (within hospitals), nonconstant variability (across hospitals), and non-normally distributed data, as we did in a study of patient-level factors associated with ED RV and RVA.3 For each calculated rate (RV, RVA), the hospitals were then classified into 3 groups based on whether the hospital’s adjusted RV and RVA rates were outside 2 SDs from the mean, below the 5th or above the 95th percentile, or within that range. These groups were labeled lowest outliers, highest outliers, and average-performing hospitals.
After the groups of hospitals were determined, we returned to using unadjusted data to statistically analyze them. We summarized continuous variables using minimum and maximum values, medians, and interquartile ranges (IQRs). We present categorical variables using counts and percentages. To identify hospital characteristics with the most potential to gain from improvement, we also analyzed associations using 2 collapsed groups: hospitals with RV (or RVA) rates included in the average-performing and lowest outlier groups and hospitals within the highest outlier group. Hospital characteristics and hospital’s patient population characteristics from the surveys are summarized based on RV and RVA rate groups. Differences in distributions among continuous variables were assessed by Kruskal-Wallis 1-way analysis of variance. Chi-square tests were used to evaluate differences in proportions among categorical variables. All statistical analyses were performed with SAS Version 9.4 (SAS Institute); 2-sided P < 0.05 was considered statistically significant.
RESULTS
Return Visit Rates and Hospital ED Site Population Characteristics
Twenty-four of 35 (68%) eligible hospitals that met PHIS quality control standards for ED patient visits responded to the ED medical director survey. The included hospitals that both met quality control standards and completed the survey had a total of 1,456,377 patient visits during the study period. Individual sites had annual volumes ranging from 26,627 to 96,637 ED encounters. The mean RV rate across the institutions was 3.7% (range, 3.0%-4.8%), and the mean RVA rate across the hospitals was 0.7% (range, 0.5%-1.1%) (Figure).

There were 5 hospitals with RV rates less than 2 SDs of the mean rate, placing them in the lowest outlier group for RV; 13 hospitals with RV rates within 2 SDs of the mean RV rate, placing them in the average-performing group; and 6 hospitals with RV rates above 2 SDs of the mean, placing them in the highest outlier group. Table 1 lists the hospital ED site population characteristics among the 3 RV rate groups. Hospitals in the highest outlier group served populations with higher proportions of patients with insurance from a government payer, lower proportions of patients covered by a commercial insurance plan, and higher proportion of patients with lower median household incomes.

In the RVA analysis, there were 6 hospitals with RVA rates less than 2 SDs of the mean RVA rate (lowest outliers); 14 hospitals with RVA rates within 2 SDs of the mean RVA rate (average performers); and 4 hospitals with RVA rates above 2 SDs of the mean RVA rate (highest outliers). When using these groups based on RVA rate, there were no statistically significant differences in hospital ED site population characteristics (Supplemental Table 1).
RV Rates and Hospital-Level Factors Survey Characteristics
Table 2 lists the ED medical director survey hospital-level data among the 3 RV rate groups. There were fewer FTEs by PEM fellowship-trained physicians per 10,000 patient visits at sites with higher RV rates (Table 2). Hospital-level characteristics assessed by the survey were not associated with RVA rates (Supplemental Table 2).
 and Return Visit Rates")
Evaluating characteristics of hospitals with the most potential to gain from improvement, hospitals with the highest RV rates (highest outlier group), compared with hospitals in the lowest outlier and average-performing groups collapsed together, persisted in having fewer PEM fellowship-trained physician FTEs per patient visit (Table 3). A similar collapsed analysis of RVA rates demonstrated that hospitals in the highest outlier group had longer-wait-to-physician time (81 minutes; IQR, 51-105 minutes) compared with hospitals in the other 2 groups (30 minutes; IQR, 19-42.5 minutes) (Table 3).
In response to the first qualitative question on the ED medial director survey, “In your opinion, what is the largest barrier to reducing the number of return visits within 72 hours of discharge from a previous ED visit?”, 15 directors (62.5%) reported limited access to primary care, 4 (16.6%) reported inadequate discharge instructions and/or education provided, and 3 (12.5%) reported lack of access to specialist care. To the second question, “In your opinion, what is the best way of reducing the number of the return visits within 72 hours of previous ED visit for the same condition?”, they responded that RVs could be reduced by innovations in scheduling primary care or specialty follow-up visits (19, 79%), improving discharge education and instructions (6, 25%), and identifying more case management or care coordination (4, 16.6%).
DISCUSSION
Other studies have identified patient- and visit-level characteristics associated with higher ED RV and RVA rates.3,8,9,31 However, as our goal was to identify possible modifiable institutional features, our study examined factors at hospital and population-served levels (instead of patient or visit level) that may impact ED RV and RVA rates. Interestingly, our sample of tertiary-care pediatric center EDs provided evidence of variability in RV and RVA rates. We identified factors associated with RV rates related to the SDHs of the populations served by the ED, which suggests these factors are not modifiable at an institution level. In addition, we found that the increased availability of PEM providers per patient visit correlated with fewer ED RVs.
Hospitals serving ED populations with more government-insured and fewer commercially insured patients had higher rates of return to the ED. Similarly, hospitals with larger proportions of patients from areas with lower median household incomes had higher RV rates. These factors may indicate that patients with limited resources may have more frequent ED RVs,3,6,32,33 and hospitals that serve them have higher ED RV rates. Our findings complement those of a recent study by Sills et al.,11 who evaluated hospital readmissions and proposed risk adjustment for performance reimbursement. This study found that hospital population-level race, ethnicity, insurance status, and household income were predictors of hospital readmission after discharge.
Of note, our data did not identify similar site-level attributes related to the population served that correlated with RVA rates. We postulate that the need for admission on RV may indicate an inherent clinical urgency or medical need associated with the return to the ED, whereas RV without admission may be related more to patient- or population-level sociodemographic factors than to quality of care and clinical course, which influence ED utilization.1,3,30 EDs treating higher proportions of patients of minority race or ethnicity, those with fewer financial resources, and those in more need of government health insurance are at higher risk for ED revisits.
We observed that increased PEM fellowship-trained physician staffing was associated with decreased RV rates. The availability of specialty-trained physicians in PEM may allow a larger proportion of patients treated by physicians with honed clinical skills for the patient population. Data from a single pediatric center showed PEM fellowship-trained physicians had admission rates lower than those of their counterparts without subspecialty fellowship training.34 The lower RV rate for this group in our study is especially interesting in light of previously reported lower admission rates at index visit in PEM trained physicians. With lower index admission rates, it may have been assumed that visits associated with PEM trained physician care would have an increased (rather than decreased) chance of RV. In addition, we noted the increased RVA rates were associated with longer waits to see a physician. These measures may indicate the effect of institutional access to robust resources (the ability to hire and support more specialty-trained physicians). These novel findings warrant further evaluation, particularly as our sample included only pediatric centers.
Our survey data demonstrated the impact that access to care has on ED RV rates. The ED medical directors indicated that limited access to outpatient appointments with PCPs and specialists was an important factor increasing ED RVs and a potential avenue for interventions. As the 2 open-ended questions addressed barriers and potential solutions, it is interesting that the respondents cited access to care and discharge instructions as the largest barriers and identified innovations in access to care and discharge education as important potential remedies.
This study demonstrated that, at the hospital level, ED RV quality measures are influenced by complex and varied SDHs that primarily reflect the characteristics of the patient populations served. Prior work has similarly highlighted the importance of gaining a rigorous understanding of other quality measures before widespread use, reporting, and dissemination of results.11,35-38 With this in mind, as quality measures are developed and implemented, care should be taken to ensure they accurately and appropriately reflect the quality of care provided to the patient and are not more representative of other factors not directly within institutional control. These findings call into question the usefulness of ED RVs as a quality measure for comparing institutions.
Study Limitations
This study had several limitations. The PHIS dataset tracks only patients within each institution and does not include RVs to other EDs, which may account for a proportion of RVs.39 Our survey response rate was 68% among medical directors, excluding 11 hospitals from analysis, which decreased the study’s power to detect differences that may be present between groups. In addition, the generalizability of our findings may be limited to tertiary-care children’s hospitals, as the PHIS dataset included only these types of healthcare facilities. We also included data only from the sites’ main EDs, and therefore cannot know if our results are applicable to satellite EDs. ED staffing of PEM physicians was analyzed using FTEs. However, number of clinical hours in 1 FTE may vary among sites, leading to imprecision in this hospital characteristic.
CONCLUSION
Hospitals with the highest RV rates served populations with a larger proportion of patients with government insurance and lower household income, and these hospitals had fewer PEM trained physicians. Variation in RV rates among hospitals may be indicative of the SDHs of their unique patient populations. ED revisit rates should be used cautiously in determining the quality of care of hospitals providing care to differing populations.
Disclosure
Nothing to report.
1. Goldman RD, Kapoor A, Mehta S. Children admitted to the hospital after returning to the emergency department within 72 hours. Pediatr Emerg Care. 2011;27(9):808-811. PubMed
2. Cho CS, Shapiro DJ, Cabana MD, Maselli JH, Hersh AL. A national depiction of children with return visits to the emergency department within 72 hours, 2001–2007. Pediatr Emerg Care. 2012;28(7):606-610. PubMed
3. Akenroye AT, Thurm CW, Neuman MI, et al. Prevalence and predictors of return visits to pediatric emergency departments. J Hosp Med. 2014;9(12):779-787. PubMed
4. Gallagher RA, Porter S, Monuteaux MC, Stack AM. Unscheduled return visits to the emergency department: the impact of language. Pediatr Emerg Care. 2013;29(5):579-583. PubMed
5. Sørup CM, Jacobsen P, Forberg JL. Evaluation of emergency department performance—a systematic review on recommended performance and quality-in-care measures. Scand J Trauma Resusc Emerg Med. 2013;21:62. PubMed
6. Gabayan GZ, Asch SM, Hsia RY, et al. Factors associated with short-term bounce-back admissions after emergency department discharge. Ann Emerg Med. 2013;62(2):136-144.e1. PubMed
7. Ali AB, Place R, Howell J, Malubay SM. Early pediatric emergency department return visits: a prospective patient-centric assessment. Clin Pediatr (Phila). 2012;51(7):651-658. PubMed
8. Alessandrini EA, Lavelle JM, Grenfell SM, Jacobstein CR, Shaw KN. Return visits to a pediatric emergency department. Pediatr Emerg Care. 2004;20(3):166-171. PubMed
9. Goldman RD, Ong M, Macpherson A. Unscheduled return visits to the pediatric emergency department—one-year experience. Pediatr Emerg Care. 2006;22(8):545-549. PubMed
10. Berry JG, Toomey SL, Zaslavsky AM, et al. Pediatric readmission prevalence and variability across hospitals. JAMA. 2013;309(4):372-380. PubMed
11. Sills MR, Hall M, Colvin JD, et al. Association of social determinants with children’s hospitals’ preventable readmissions performance. JAMA Pediatr. 2016;170(4):350-358. PubMed
12. Fiscella K, Burstin HR, Nerenz DR. Quality measures and sociodemographic risk factors: to adjust or not to adjust. JAMA. 2014;312(24):2615-2616. PubMed
13. Lipstein SH, Dunagan WC. The risks of not adjusting performance measures for sociodemographic factors. Ann Intern Med. 2014;161(8):594-596. PubMed
14. Berry JG, Hall DE, Kuo DZ, et al. Hospital utilization and characteristics of patients experiencing recurrent readmissions within children’s hospitals. JAMA. 2011;305(7):682-690. PubMed
15. Bourgeois FT, Monuteaux MC, Stack AM, Neuman MI. Variation in emergency department admission rates in US children’s hospitals. Pediatrics. 2014;134(3):539-545. PubMed
16. Fletcher DM. Achieving data quality. How data from a pediatric health information system earns the trust of its users. J AHIMA. 2004;75(10):22-26. PubMed
17. US Census Bureau. US Census current estimates data. 2014. https://www.census.gov/programs-surveys/popest/data/data-sets.2014.html. Accessed June 2015.
18. Alessandrini EA, Alpern ER, Chamberlain JM, Shea JA, Gorelick MH. A new diagnosis grouping system for child emergency department visits. Acad Emerg Med. 2010;17(2):204-213. PubMed
19. Feudtner C, Levin JE, Srivastava R, et al. How well can hospital readmission be predicted in a cohort of hospitalized children? A retrospective, multicenter study. Pediatrics. 2009;123(1):286-293. PubMed
20. Feinstein JA, Feudtner C, Kempe A. Adverse drug event–related emergency department visits associated with complex chronic conditions. Pediatrics. 2014;133(6):e1575-e1585. PubMed
21. Simon TD, Berry J, Feudtner C, et al. Children with complex chronic conditions in inpatient hospital settings in the United States. Pediatrics. 2010;126(4):647-655. PubMed
22. Dartmouth Medical School, Center for Evaluative Clinical Sciences. The Dartmouth Atlas of Health Care. Chicago, IL: American Hospital Publishing; 2015.
23. Kansagara D, Englander H, Salanitro A, et al. Risk prediction models for hospital readmission: a systematic review. JAMA. 2011;306(15):1688-1698. PubMed
24. Lawrence LM, Jenkins CA, Zhou C, Givens TG. The effect of diagnosis-specific computerized discharge instructions on 72-hour return visits to the pediatric emergency department. Pediatr Emerg Care. 2009;25(11):733-738. PubMed
25. National Quality Forum. National Quality Forum issue brief: strengthening pediatric quality measurement and reporting. J Healthc Qual. 2008;30(3):51-55. PubMed
26. Rising KL, Victor TW, Hollander JE, Carr BG. Patient returns to the emergency department: the time-to-return curve. Acad Emerg Med. 2014;21(8):864-871. PubMed
27. Cho CS, Shapiro DJ, Cabana MD, Maselli JH, Hersh AL. A national depiction of children with return visits to the emergency department within 72 hours, 2001–2007. Pediatr Emerg Care. 2012;28(7):606-610. PubMed
28. Adekoya N. Patients seen in emergency departments who had a prior visit within the previous 72 h—National Hospital Ambulatory Medical Care Survey, 2002. Public Health. 2005;119(10):914-918. PubMed
29. Mittal MK, Zorc JJ, Garcia-Espana JF, Shaw KN. An assessment of clinical performance measures for pediatric emergency physicians. Am J Med Qual. 2013;28(1):33-39. PubMed
30. Depiero AD, Ochsenschlager DW, Chamberlain JM. Analysis of pediatric hospitalizations after emergency department release as a quality improvement tool. Ann Emerg Med. 2002;39(2):159-163. PubMed
31. Sung SF, Liu KE, Chen SC, Lo CL, Lin KC, Hu YH. Predicting factors and risk stratification for return visits to the emergency department within 72 hours in pediatric patients. Pediatr Emerg Care. 2015;31(12):819-824. PubMed
32. Jacobstein CR, Alessandrini EA, Lavelle JM, Shaw KN. Unscheduled revisits to a pediatric emergency department: risk factors for children with fever or infection-related complaints. Pediatr Emerg Care. 2005;21(12):816-821. PubMed
33. Barnett ML, Hsu J, McWilliams J. Patient characteristics and differences in hospital readmission rates. JAMA Intern Med. 2015;175(11):1803-1812. PubMed
34. Gaucher N, Bailey B, Gravel J. Impact of physicians’ characteristics on the admission risk among children visiting a pediatric emergency department. Pediatr Emerg Care. 2012;28(2):120-124. PubMed
35. McHugh M, Neimeyer J, Powell E, Khare RK, Adams JG. An early look at performance on the emergency care measures included in Medicare’s hospital inpatient Value-Based Purchasing Program. Ann Emerg Med. 2013;61(6):616-623.e2. PubMed
36. Axon RN, Williams MV. Hospital readmission as an accountability measure. JAMA. 2011;305(5):504-505. PubMed
37. Adams JG. Ensuring the quality of quality metrics for emergency care. JAMA. 2016;315(7):659-660. PubMed
38. Payne NR, Flood A. Preventing pediatric readmissions: which ones and how? J Pediatr. 2015;166(3):519-520. PubMed
39. Khan A, Nakamura MM, Zaslavsky AM, et al. Same-hospital readmission rates as a measure of pediatric quality of care. JAMA Pediatr. 2015;169(10):905-912. PubMed
Return visit (RV) rate is a quality measure commonly used in the emergency department (ED) setting. This metric may represent suboptimal care at the index ED visit.1-5 Although patient- and visit-level factors affecting ED RVs have been evaluated,1,3,4,6-9 hospital-level factors and factors of a hospital’s patient population that may play roles in ED RV rates have not been examined. Identifying the factors associated with increased RVs may allow resources to be designated to areas that improve emergent care for children.10
Hospital readmission rates are a closely followed quality measure and are linked to reimbursement by the federal government, but a recent study found the influence a hospital can have on this marker may be mitigated by the impact of the social determinates of health (SDHs) of the hospital’s patient population.11 That study and others have prompted an ongoing debate about adjusting quality measures for SDHs.12,13 A clearer understanding of these interactions may permit us to focus on factors that can truly lead to improvement in care instead of penalizing practitioners or hospitals that provide care to those most in need.
Prior work has identified several SDHs associated with higher ED RV rates in patient- or visit-level analyses.3,11,14 We conducted a study of hospital-level characteristics and characteristics of a hospital’s patient population to identify potentially mutable factors associated with increased ED RV rates that, once recognized, may allow for improvement in this quality measure.
PATIENTS AND METHODS
This study was not considered human subjects research in accordance with Common Rule 45 CFR§46.104(f) and was evaluated by the Ann and Robert H. Lurie Children’s Hospital and Northwestern University Feinberg School of Medicine Institutional Review Boards and deemed exempt from review.
Study Population and Protocol
Our study had 2 data sources (to be described in detail): the Pediatric Health Information System (PHIS) and a survey of ED medical directors of the hospitals represented within PHIS. Hospitals were eligible for inclusion in the study if their data (1) met PHIS quality control standards for ED patient visits as determined by internal data assurance processes incorporated in PHIS,3,14,15 (2) included data only from an identifiable single main ED, and (3) completed the ED medical director’s survey.
PHIS Database
PHIS, an administrative database managed by Truven Health Analytics, includes data from ED, ambulatory surgery, observation, and inpatient encounters across Children’s Hospital Association member children’s hospitals in North America. Data are subjected to validity checks before being included in the database.16 PHIS assigns unique patient identifiers to track individual patient visits within participating institutions over time.
Hospitals were described by percentages of ED patients in several groups: age (<1, 1-4, 5-9, 10-14, and 15-18 years)17; sex; race/ethnicity; insurance type (commercial, government, other); ED International Classification of Diseases, Ninth Edition (ICD-9) diagnosis code–based severity classification system score (1-2, low severity; 3-5, high severity)18; complex
ED Medical Director Survey
A web-based survey was constructed in an iterative process based on literature review and expert opinion to assess hospital-level factors that may impact ED RV rates.3,7,24-26 The survey was piloted at 3 institutions to refine its structure and content.
The survey included 15 close-ended or multiple-choice questions on ED environment and operations and 2 open-ended questions, “What is the largest barrier to reducing the number of return visits within 72 hours of discharge from a previous ED visit?” and “In your opinion, what is the best way of reducing the number of the return visits within 72 hours of previous ED visit ?” (questionnaire in Supplemental material). Hospital characteristics from the survey included total clinical time allotment, or full-time equivalent (FTE), among all physicians, pediatric emergency medicine (PEM) fellowship-trained physicians, and all other (non-PEM) physicians. The data were standardized across sites by calculating FTE-per-10,000-visits values for each hospital; median duration of ED visit for admitted and discharged patients; median time from arrival to ED physician evaluation; rate of leaving without being seen; discharge educational material authorship and age specificity; follow-up visit scheduling procedure; and percentage of ED patients for whom English was a second language.
Responses to the 2 open-ended questions were independently categorized by Drs. Pittsenbarger and Alpern. Responses could be placed in more than 1 category if multiple answers to the question were included in the response. Categorizations were compared for consistency, and any inconsistencies were resolved by the consensus of the study investigators.
Outcome Measures From PHIS Database
All ED visits within a 12-month period (July 1, 2013–June 30, 2014) by patients younger than 18 years at time of index ED visit were eligible for inclusion in the study. An index visit was defined as any ED visit without another ED visit within the preceding 72 hours. The 72-hour time frame was used because it is the most widely studied time frame for ED RVs.5 Index ED visits that led to admission, observation status, death, or transfer were excluded.
The 2 primary outcomes of interest were (1) RVs within 72 hours of index ED visit discharge and (2) RVs within 72 hours that resulted in hospital admission or observation status at the next ED visit (RVA).7,9,27-30 For patients with multiple ED revisits within 72 hours, only the first was assessed. There was a 72-hour minimum between index visits for the same patient.
Statistical Analyses
To determine hospital groups based on RV and RVA rates, we adjusted RV and RVA rates using generalized linear mixed-effects models, controlling for clustering and allowing for correlated data (within hospitals), nonconstant variability (across hospitals), and non-normally distributed data, as we did in a study of patient-level factors associated with ED RV and RVA.3 For each calculated rate (RV, RVA), the hospitals were then classified into 3 groups based on whether the hospital’s adjusted RV and RVA rates were outside 2 SDs from the mean, below the 5th or above the 95th percentile, or within that range. These groups were labeled lowest outliers, highest outliers, and average-performing hospitals.
After the groups of hospitals were determined, we returned to using unadjusted data to statistically analyze them. We summarized continuous variables using minimum and maximum values, medians, and interquartile ranges (IQRs). We present categorical variables using counts and percentages. To identify hospital characteristics with the most potential to gain from improvement, we also analyzed associations using 2 collapsed groups: hospitals with RV (or RVA) rates included in the average-performing and lowest outlier groups and hospitals within the highest outlier group. Hospital characteristics and hospital’s patient population characteristics from the surveys are summarized based on RV and RVA rate groups. Differences in distributions among continuous variables were assessed by Kruskal-Wallis 1-way analysis of variance. Chi-square tests were used to evaluate differences in proportions among categorical variables. All statistical analyses were performed with SAS Version 9.4 (SAS Institute); 2-sided P < 0.05 was considered statistically significant.
RESULTS
Return Visit Rates and Hospital ED Site Population Characteristics
Twenty-four of 35 (68%) eligible hospitals that met PHIS quality control standards for ED patient visits responded to the ED medical director survey. The included hospitals that both met quality control standards and completed the survey had a total of 1,456,377 patient visits during the study period. Individual sites had annual volumes ranging from 26,627 to 96,637 ED encounters. The mean RV rate across the institutions was 3.7% (range, 3.0%-4.8%), and the mean RVA rate across the hospitals was 0.7% (range, 0.5%-1.1%) (Figure).
There were 5 hospitals with RV rates less than 2 SDs of the mean rate, placing them in the lowest outlier group for RV; 13 hospitals with RV rates within 2 SDs of the mean RV rate, placing them in the average-performing group; and 6 hospitals with RV rates above 2 SDs of the mean, placing them in the highest outlier group. Table 1 lists the hospital ED site population characteristics among the 3 RV rate groups. Hospitals in the highest outlier group served populations with higher proportions of patients with insurance from a government payer, lower proportions of patients covered by a commercial insurance plan, and higher proportion of patients with lower median household incomes.
In the RVA analysis, there were 6 hospitals with RVA rates less than 2 SDs of the mean RVA rate (lowest outliers); 14 hospitals with RVA rates within 2 SDs of the mean RVA rate (average performers); and 4 hospitals with RVA rates above 2 SDs of the mean RVA rate (highest outliers). When using these groups based on RVA rate, there were no statistically significant differences in hospital ED site population characteristics (Supplemental Table 1).
RV Rates and Hospital-Level Factors Survey Characteristics
Table 2 lists the ED medical director survey hospital-level data among the 3 RV rate groups. There were fewer FTEs by PEM fellowship-trained physicians per 10,000 patient visits at sites with higher RV rates (Table 2). Hospital-level characteristics assessed by the survey were not associated with RVA rates (Supplemental Table 2).
Evaluating characteristics of hospitals with the most potential to gain from improvement, hospitals with the highest RV rates (highest outlier group), compared with hospitals in the lowest outlier and average-performing groups collapsed together, persisted in having fewer PEM fellowship-trained physician FTEs per patient visit (Table 3). A similar collapsed analysis of RVA rates demonstrated that hospitals in the highest outlier group had longer-wait-to-physician time (81 minutes; IQR, 51-105 minutes) compared with hospitals in the other 2 groups (30 minutes; IQR, 19-42.5 minutes) (Table 3).
In response to the first qualitative question on the ED medial director survey, “In your opinion, what is the largest barrier to reducing the number of return visits within 72 hours of discharge from a previous ED visit?”, 15 directors (62.5%) reported limited access to primary care, 4 (16.6%) reported inadequate discharge instructions and/or education provided, and 3 (12.5%) reported lack of access to specialist care. To the second question, “In your opinion, what is the best way of reducing the number of the return visits within 72 hours of previous ED visit for the same condition?”, they responded that RVs could be reduced by innovations in scheduling primary care or specialty follow-up visits (19, 79%), improving discharge education and instructions (6, 25%), and identifying more case management or care coordination (4, 16.6%).
DISCUSSION
Other studies have identified patient- and visit-level characteristics associated with higher ED RV and RVA rates.3,8,9,31 However, as our goal was to identify possible modifiable institutional features, our study examined factors at hospital and population-served levels (instead of patient or visit level) that may impact ED RV and RVA rates. Interestingly, our sample of tertiary-care pediatric center EDs provided evidence of variability in RV and RVA rates. We identified factors associated with RV rates related to the SDHs of the populations served by the ED, which suggests these factors are not modifiable at an institution level. In addition, we found that the increased availability of PEM providers per patient visit correlated with fewer ED RVs.
Hospitals serving ED populations with more government-insured and fewer commercially insured patients had higher rates of return to the ED. Similarly, hospitals with larger proportions of patients from areas with lower median household incomes had higher RV rates. These factors may indicate that patients with limited resources may have more frequent ED RVs,3,6,32,33 and hospitals that serve them have higher ED RV rates. Our findings complement those of a recent study by Sills et al.,11 who evaluated hospital readmissions and proposed risk adjustment for performance reimbursement. This study found that hospital population-level race, ethnicity, insurance status, and household income were predictors of hospital readmission after discharge.
Of note, our data did not identify similar site-level attributes related to the population served that correlated with RVA rates. We postulate that the need for admission on RV may indicate an inherent clinical urgency or medical need associated with the return to the ED, whereas RV without admission may be related more to patient- or population-level sociodemographic factors than to quality of care and clinical course, which influence ED utilization.1,3,30 EDs treating higher proportions of patients of minority race or ethnicity, those with fewer financial resources, and those in more need of government health insurance are at higher risk for ED revisits.
We observed that increased PEM fellowship-trained physician staffing was associated with decreased RV rates. The availability of specialty-trained physicians in PEM may allow a larger proportion of patients treated by physicians with honed clinical skills for the patient population. Data from a single pediatric center showed PEM fellowship-trained physicians had admission rates lower than those of their counterparts without subspecialty fellowship training.34 The lower RV rate for this group in our study is especially interesting in light of previously reported lower admission rates at index visit in PEM trained physicians. With lower index admission rates, it may have been assumed that visits associated with PEM trained physician care would have an increased (rather than decreased) chance of RV. In addition, we noted the increased RVA rates were associated with longer waits to see a physician. These measures may indicate the effect of institutional access to robust resources (the ability to hire and support more specialty-trained physicians). These novel findings warrant further evaluation, particularly as our sample included only pediatric centers.
Our survey data demonstrated the impact that access to care has on ED RV rates. The ED medical directors indicated that limited access to outpatient appointments with PCPs and specialists was an important factor increasing ED RVs and a potential avenue for interventions. As the 2 open-ended questions addressed barriers and potential solutions, it is interesting that the respondents cited access to care and discharge instructions as the largest barriers and identified innovations in access to care and discharge education as important potential remedies.
This study demonstrated that, at the hospital level, ED RV quality measures are influenced by complex and varied SDHs that primarily reflect the characteristics of the patient populations served. Prior work has similarly highlighted the importance of gaining a rigorous understanding of other quality measures before widespread use, reporting, and dissemination of results.11,35-38 With this in mind, as quality measures are developed and implemented, care should be taken to ensure they accurately and appropriately reflect the quality of care provided to the patient and are not more representative of other factors not directly within institutional control. These findings call into question the usefulness of ED RVs as a quality measure for comparing institutions.
Study Limitations
This study had several limitations. The PHIS dataset tracks only patients within each institution and does not include RVs to other EDs, which may account for a proportion of RVs.39 Our survey response rate was 68% among medical directors, excluding 11 hospitals from analysis, which decreased the study’s power to detect differences that may be present between groups. In addition, the generalizability of our findings may be limited to tertiary-care children’s hospitals, as the PHIS dataset included only these types of healthcare facilities. We also included data only from the sites’ main EDs, and therefore cannot know if our results are applicable to satellite EDs. ED staffing of PEM physicians was analyzed using FTEs. However, number of clinical hours in 1 FTE may vary among sites, leading to imprecision in this hospital characteristic.
CONCLUSION
Hospitals with the highest RV rates served populations with a larger proportion of patients with government insurance and lower household income, and these hospitals had fewer PEM trained physicians. Variation in RV rates among hospitals may be indicative of the SDHs of their unique patient populations. ED revisit rates should be used cautiously in determining the quality of care of hospitals providing care to differing populations.
Disclosure
Nothing to report.
1. Goldman RD, Kapoor A, Mehta S. Children admitted to the hospital after returning to the emergency department within 72 hours. Pediatr Emerg Care. 2011;27(9):808-811. PubMed
2. Cho CS, Shapiro DJ, Cabana MD, Maselli JH, Hersh AL. A national depiction of children with return visits to the emergency department within 72 hours, 2001–2007. Pediatr Emerg Care. 2012;28(7):606-610. PubMed
3. Akenroye AT, Thurm CW, Neuman MI, et al. Prevalence and predictors of return visits to pediatric emergency departments. J Hosp Med. 2014;9(12):779-787. PubMed
4. Gallagher RA, Porter S, Monuteaux MC, Stack AM. Unscheduled return visits to the emergency department: the impact of language. Pediatr Emerg Care. 2013;29(5):579-583. PubMed
5. Sørup CM, Jacobsen P, Forberg JL. Evaluation of emergency department performance—a systematic review on recommended performance and quality-in-care measures. Scand J Trauma Resusc Emerg Med. 2013;21:62. PubMed
6. Gabayan GZ, Asch SM, Hsia RY, et al. Factors associated with short-term bounce-back admissions after emergency department discharge. Ann Emerg Med. 2013;62(2):136-144.e1. PubMed
7. Ali AB, Place R, Howell J, Malubay SM. Early pediatric emergency department return visits: a prospective patient-centric assessment. Clin Pediatr (Phila). 2012;51(7):651-658. PubMed
8. Alessandrini EA, Lavelle JM, Grenfell SM, Jacobstein CR, Shaw KN. Return visits to a pediatric emergency department. Pediatr Emerg Care. 2004;20(3):166-171. PubMed
9. Goldman RD, Ong M, Macpherson A. Unscheduled return visits to the pediatric emergency department—one-year experience. Pediatr Emerg Care. 2006;22(8):545-549. PubMed
10. Berry JG, Toomey SL, Zaslavsky AM, et al. Pediatric readmission prevalence and variability across hospitals. JAMA. 2013;309(4):372-380. PubMed
11. Sills MR, Hall M, Colvin JD, et al. Association of social determinants with children’s hospitals’ preventable readmissions performance. JAMA Pediatr. 2016;170(4):350-358. PubMed
12. Fiscella K, Burstin HR, Nerenz DR. Quality measures and sociodemographic risk factors: to adjust or not to adjust. JAMA. 2014;312(24):2615-2616. PubMed
13. Lipstein SH, Dunagan WC. The risks of not adjusting performance measures for sociodemographic factors. Ann Intern Med. 2014;161(8):594-596. PubMed
14. Berry JG, Hall DE, Kuo DZ, et al. Hospital utilization and characteristics of patients experiencing recurrent readmissions within children’s hospitals. JAMA. 2011;305(7):682-690. PubMed
15. Bourgeois FT, Monuteaux MC, Stack AM, Neuman MI. Variation in emergency department admission rates in US children’s hospitals. Pediatrics. 2014;134(3):539-545. PubMed
16. Fletcher DM. Achieving data quality. How data from a pediatric health information system earns the trust of its users. J AHIMA. 2004;75(10):22-26. PubMed
17. US Census Bureau. US Census current estimates data. 2014. https://www.census.gov/programs-surveys/popest/data/data-sets.2014.html. Accessed June 2015.
18. Alessandrini EA, Alpern ER, Chamberlain JM, Shea JA, Gorelick MH. A new diagnosis grouping system for child emergency department visits. Acad Emerg Med. 2010;17(2):204-213. PubMed
19. Feudtner C, Levin JE, Srivastava R, et al. How well can hospital readmission be predicted in a cohort of hospitalized children? A retrospective, multicenter study. Pediatrics. 2009;123(1):286-293. PubMed
20. Feinstein JA, Feudtner C, Kempe A. Adverse drug event–related emergency department visits associated with complex chronic conditions. Pediatrics. 2014;133(6):e1575-e1585. PubMed
21. Simon TD, Berry J, Feudtner C, et al. Children with complex chronic conditions in inpatient hospital settings in the United States. Pediatrics. 2010;126(4):647-655. PubMed
22. Dartmouth Medical School, Center for Evaluative Clinical Sciences. The Dartmouth Atlas of Health Care. Chicago, IL: American Hospital Publishing; 2015.
23. Kansagara D, Englander H, Salanitro A, et al. Risk prediction models for hospital readmission: a systematic review. JAMA. 2011;306(15):1688-1698. PubMed
24. Lawrence LM, Jenkins CA, Zhou C, Givens TG. The effect of diagnosis-specific computerized discharge instructions on 72-hour return visits to the pediatric emergency department. Pediatr Emerg Care. 2009;25(11):733-738. PubMed
25. National Quality Forum. National Quality Forum issue brief: strengthening pediatric quality measurement and reporting. J Healthc Qual. 2008;30(3):51-55. PubMed
26. Rising KL, Victor TW, Hollander JE, Carr BG. Patient returns to the emergency department: the time-to-return curve. Acad Emerg Med. 2014;21(8):864-871. PubMed
27. Cho CS, Shapiro DJ, Cabana MD, Maselli JH, Hersh AL. A national depiction of children with return visits to the emergency department within 72 hours, 2001–2007. Pediatr Emerg Care. 2012;28(7):606-610. PubMed
28. Adekoya N. Patients seen in emergency departments who had a prior visit within the previous 72 h—National Hospital Ambulatory Medical Care Survey, 2002. Public Health. 2005;119(10):914-918. PubMed
29. Mittal MK, Zorc JJ, Garcia-Espana JF, Shaw KN. An assessment of clinical performance measures for pediatric emergency physicians. Am J Med Qual. 2013;28(1):33-39. PubMed
30. Depiero AD, Ochsenschlager DW, Chamberlain JM. Analysis of pediatric hospitalizations after emergency department release as a quality improvement tool. Ann Emerg Med. 2002;39(2):159-163. PubMed
31. Sung SF, Liu KE, Chen SC, Lo CL, Lin KC, Hu YH. Predicting factors and risk stratification for return visits to the emergency department within 72 hours in pediatric patients. Pediatr Emerg Care. 2015;31(12):819-824. PubMed
32. Jacobstein CR, Alessandrini EA, Lavelle JM, Shaw KN. Unscheduled revisits to a pediatric emergency department: risk factors for children with fever or infection-related complaints. Pediatr Emerg Care. 2005;21(12):816-821. PubMed
33. Barnett ML, Hsu J, McWilliams J. Patient characteristics and differences in hospital readmission rates. JAMA Intern Med. 2015;175(11):1803-1812. PubMed
34. Gaucher N, Bailey B, Gravel J. Impact of physicians’ characteristics on the admission risk among children visiting a pediatric emergency department. Pediatr Emerg Care. 2012;28(2):120-124. PubMed
35. McHugh M, Neimeyer J, Powell E, Khare RK, Adams JG. An early look at performance on the emergency care measures included in Medicare’s hospital inpatient Value-Based Purchasing Program. Ann Emerg Med. 2013;61(6):616-623.e2. PubMed
36. Axon RN, Williams MV. Hospital readmission as an accountability measure. JAMA. 2011;305(5):504-505. PubMed
37. Adams JG. Ensuring the quality of quality metrics for emergency care. JAMA. 2016;315(7):659-660. PubMed
38. Payne NR, Flood A. Preventing pediatric readmissions: which ones and how? J Pediatr. 2015;166(3):519-520. PubMed
39. Khan A, Nakamura MM, Zaslavsky AM, et al. Same-hospital readmission rates as a measure of pediatric quality of care. JAMA Pediatr. 2015;169(10):905-912. PubMed
© 2017 Society of Hospital Medicine
Return Visits to Pediatric EDs
Returns to the hospital following recent encounters, such as an admission to the inpatient unit or evaluation in an emergency department (ED), may reflect the natural progression of a disease, the quality of care received during the initial admission or visit, or the quality of the underlying healthcare system.[1, 2, 3, 4, 5, 6, 7, 8, 9, 10] Although national attention has focused on hospital readmissions,[3, 4, 5, 6, 7, 11, 12] ED revisits are a source of concern to emergency physicians.[8, 9] Some ED revisits are medically necessary, but revisits that may be managed in the primary care setting contribute to ED crowding, can be stressful to patients and providers, and increase healthcare costs.[10, 11, 12] Approximately 27 million annual ED visits are made by children, accounting for over one‐quarter of all ED visits in the United States, with a reported ED revisit rate of 2.5% to 5.2%.[2, 13, 14, 15, 16, 17, 18, 19, 20] Improved understanding of the patient‐level or visit‐level factors associated with ED revisits may provide an opportunity to enhance disposition decision making at the index visit and optimize site of and communication around follow‐up care.
Previous studies on ED revisits have largely been conducted in single centers and have used variable visit intervals ranging between 48 hours and 30 days.[2, 13, 16, 18, 21, 22, 23, 24, 25] Two national studies used the National Hospital Ambulatory Medical Care Survey, which includes data from both general and pediatric EDs.[13, 14] Factors identified to be associated with increased odds of returning were: young age, higher acuity, chronic conditions, and public insurance. One national study identified some diagnoses associated with higher likelihood of returning,[13] whereas the other focused primarily on infectious diseaserelated diagnoses.[14]
The purpose of this study was to describe the prevalence of return visits specifically to pediatric EDs and to investigate patient‐level, visit‐level, and healthcare systemrelated factors that may be associated with return visits and hospitalization at return.
METHODS
Study Design and Data Source
This retrospective cohort study used data from the Pediatric Health Information System (PHIS), an administrative database with data from 44 tertiary care pediatric hospitals in 27 US states and the District of Columbia. This database contains patient demographics, diagnoses, and procedures as well as medications, diagnostic imaging, laboratory, and supply charges for each patient. Data are deidentified prior to inclusion; encrypted medical record numbers allow for the identification of individual patients across all ED visits and hospitalizations to the same hospital. The Children's Hospital Association (Overland Park, KS) and participating hospitals jointly assure the quality and integrity of the data. This study was approved by the institutional review board at Boston Children's Hospital with a waiver for informed consent granted.
Study Population and Protocol
To standardize comparisons across the hospitals, we included data from 23 of the 44 hospitals in PHIS; 7 were excluded for not including ED‐specific data. For institutions that collect information from multiple hospitals within their healthcare system, we included only records from the main campus or children's hospital when possible, leading to the exclusion of 9 hospitals where the data were not able to be segregated. As an additional level of data validation, we compared the hospital‐level ED volume and admission rates as reported in the PHIS to those reported to a separate database (the Pediatric Analysis and Comparison Tool). We further excluded 5 hospitals whose volume differed by >10% between these 2 data sources.
Patients <18 years of age who were discharged from these EDs following their index visit in 2012 formed the eligible cohort.
Key Outcome Measures
The primary outcomes were return visits within 72 hours of discharge from the ED, and return visits resulting in hospitalization, including observation status. We defined an ED revisit as a return within 72 hours of ED discharge regardless of whether the patient was subsequently discharged from the ED on the return visit or hospitalized. We assessed revisits within 72 hours of an index ED discharge, because return visits within this time frame are likely to be related to the index visit.[2, 13, 16, 21, 22, 24, 25, 26]
Factors Associated With ED Revisits
A priori, we chose to adjust for the following patient‐level factors: age (<30 days, 30 days<1 year, 14 years, 511 years, 1217 years), gender, and socioeconomic status (SES) measured as the zip codebased median household income, obtained from the 2010 US Census, with respect to the federal poverty level (FPL) (<1.5 FPL, 1.52 FPL, 23 FPL, and >3 FPL).[27] We also adjusted for insurance type (commercial, government, or other), proximity of patient's home zip code to hospital (modeled as the natural log of the geographical distance to patient's home address from the hospital), ED diagnosis‐based severity classification system score (1=low severity, 5=high severity),[28] presence of a complex chronic condition at the index or prior visits using a validated classification scheme,[15, 29, 30, 31] and primary care physician (PCP) density per 100,000 in the patient's residential area (modeled as quartiles: very low, <57.2; low, 57.267.9; medium, 68.078.7; high, >78.8). PCP density, defined by the Dartmouth Atlas of Health Care,[32, 33, 34] is the number of primary care physicians per 100,000 residents (PCP count) in federal health service areas (HSA). Patients were assigned to a corresponding HSA based on their home zip code.
Visit‐level factors included arrival time of index visit (8:01 am 4:00 pm, 4:01 pm12:00 am, 12:01 am8 am representing day, evening, and overnight arrival, respectively), day of the week, season, length of stay (LOS) in the ED during the index visit, and ED crowding (calculated as the average daily LOS/yearly average LOS for the individual ED).[35] We categorized the ED primary diagnosis for each visit using the major diagnosis groupings of a previously described pediatric ED‐specific classification scheme.[36] Using International Classification of Diseases, Ninth Revision (ICD‐9) codes, we identified the conditions with the highest ED revisit rates.
Statistical Analyses
Categorical variables describing the study cohort were summarized using frequencies and percentages. Continuous variables were summarized using mean, median, and interquartile range values, where appropriate. We used 2 different hierarchical logistic regression models to assess revisit rates by patient‐ and visit‐level characteristics. The initial model included all patients discharged from the ED following the index visit and assessed for the outcome of a revisit within 72 hours. The second model considered only patients who returned within 72 hours of an index visit and assessed for hospitalization on that return visit. We used generalized linear mixed effects models, with hospital as a random effect to account for the presence of correlated data (within hospitals), nonconstant variability (across hospitals), and binary responses. Adjusted odds ratios with 95% confidence intervals were used as summary measures of the effect of the individual adjusters. Adjusters were missing in fewer than 5% of patients across participating hospitals. Statistical analyses were performed using SAS version 9.3 (SAS Institute Inc., Cary, NC); 2‐sided P values <0.004 were considered statistically significant to account for multiple comparisons (Bonferroni‐adjusted level of significance=0.0038).
RESULTS
Patients
A total of 1,610,201 patients <18 years of age evaluated across the 23 PHIS EDs in 2012 were included in the study. Twenty‐one of the 23 EDs have academic affiliations; 10 are located in the South, 6 in the Midwest, 5 in the West, and 2 in the Northeast region of the United States. The annual ED volume for these EDs ranged from 25,090 to 136,160 (median, 65,075; interquartile range, 45,28085,206). Of the total patients, 1,415,721 (87.9%) were discharged following the index visit and comprised our study cohort. Of these patients, 47,294 (revisit rate: 3.3%) had an ED revisit within 72 hours. There were 4015 patients (0.3%) who returned more than once within 72 hours, and the largest proportion of these returned with infection‐related conditions. Of those returning, 37,999 (80.3%) were discharged again, whereas 9295 (19.7%) were admitted to the hospital (Figure 1). The demographic and clinical characteristics of study participants are displayed in Table 1.
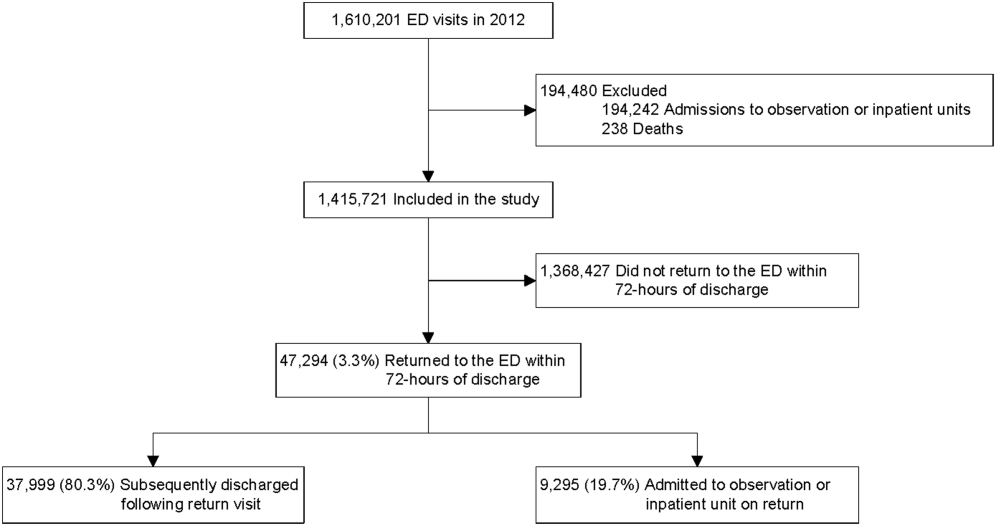
| Index Visit, n=1,415,721, n (%) | Return Visits Within 72 Hours of Discharge, n=47,294, 3.3% | ||
|---|---|---|---|
| Return to Discharge, n (%) | Return to Admission, n (%) | ||
| |||
| Gender, female | 659,417 (46.6) | 17,665 (46.5) | 4,304 (46.3) |
| Payor | |||
| Commercial | 379,403 (26.8) | 8,388 (22.1) | 3,214 (34.6) |
| Government | 925,147 (65.4) | 26,880 (70.7) | 5,786 (62.3) |
| Other | 111,171 (7.9) | 2,731 (7.2) | 295 (3.2) |
| Age | |||
| <30 days | 19,217 (1.4) | 488 (1.3) | 253 (2.7) |
| 30 days to <1 year | 216,967 (15.3) | 8,280 (21.8) | 2,372 (25.5) |
| 1 year to 4 years | 547,083 (38.6) | 15,542 (40.9) | 3,187 (34.3) |
| 5 years to 11 years | 409,463 (28.9) | 8,906 (23.4) | 1,964 (21.1) |
| 12 years to 17 years | 222,991 (15.8) | 4,783 (12.6) | 1,519 (16.3) |
| Socioeconomic statusa | |||
| <1.5 times FPL | 493,770 (34.9) | 13,851 (36.5) | 2,879 (31.0) |
| 1.5 to 2 times FPL | 455,490 (32.2) | 12,364 (32.5) | 2,904 (31.2) |
| 2 to 3 times FPL | 367,557 (26.0) | 9,560 (25.2) | 2,714 (29.2) |
| >3 times FPL | 98,904 (7.0) | 2,224 (5.9) | 798 (8.6) |
| Primary care physician density per 100,000 patients | |||
| Very low | 351,798 (24.9) | 8,727 (23.0) | 2,628 (28.3) |
| Low | 357,099 (25.2) | 9,810 (25.8) | 2,067 (22.2) |
| Medium | 347,995 (24.6) | 10,186 (26.8) | 2,035 (21.9) |
| High | 358,829 (25.4) | 9,276 (24.4) | 2,565 (27.6) |
| CCC present, yes | 125,774 (8.9) | 4,446 (11.7) | 2,825 (30.4) |
| Severity score | |||
| Low severity (0,1,2) | 721,061 (50.9) | 17,310 (45.6) | 2,955 (31.8) |
| High severity (3,4,5) | 694,660 (49.1) | 20,689 (54.5) | 6,340 (68.2) |
| Time of arrival | |||
| Day | 533,328 (37.7) | 13,449 (35.4) | 3,396 (36.5) |
| Evening | 684,873 (48.4) | 18,417 (48.5) | 4,378 (47.1) |
| Overnight | 197,520 (14.0) | 6,133 (16.1) | 1,521 (16.4) |
| Season | |||
| Winter | 384,957 (27.2) | 10,603 (27.9) | 2,844 (30.6) |
| Spring | 367,434 (26.0) | 9,923 (26.1) | 2,311 (24.9) |
| Summer | 303,872 (21.5) | 8,308 (21.9) | 1,875 (20.2) |
| Fall | 359,458 (25.4) | 9,165 (24.1) | 2,265 (24.4) |
| Weekday/weekend | |||
| Monday | 217,774 (15.4) | 5,646 (14.9) | 1,394 (15) |
| Tuesday | 198,220 (14.0) | 5,054 (13.3) | 1,316 (14.2) |
| Wednesday | 194,295 (13.7) | 4,985 (13.1) | 1,333 (14.3) |
| Thursday | 191,950 (13.6) | 5,123 (13.5) | 1,234 (13.3) |
| Friday | 190,022 (13.4) | 5,449 (14.3) | 1,228 (13.2) |
| Saturday | 202,247 (14.3) | 5,766 (15.2) | 1,364 (14.7) |
| Sunday | 221,213 (15.6) | 5,976 (15.7) | 1,426 (15.3) |
| Distance from hospital in miles, median (IQR) | 8.3 (4.614.9) | 9.2 (4.917.4) | 8.3 (4.614.9) |
| ED crowding score at index visit, median (IQR) | 1.0 (0.91.1) | 1.0 (0.91.1) | 1.0 (0.91.1) |
| ED LOS in hours at index visit, median (IQR) | 2.0 (1.03.0) | 3.0 (2.05.0) | 2.0 (1.03.0) |
ED Revisit Rates and Revisits Resulting in Admission
In multivariate analyses, compared to patients who did not return to the ED, patients who returned within 72 hours of discharge had higher odds of revisit if they had the following characteristics: a chronic condition, were <1 year old, a higher severity score, and public insurance. Visit‐level factors associated with higher odds of revisits included arrival for the index visit during the evening or overnight shift or on a Friday or Saturday, index visit during times of lower ED crowding, and living closer to the hospital. On return, patients were more likely to be hospitalized if they had a higher severity score, a chronic condition, private insurance, or were <30 days old. Visit‐level factors associated with higher odds of hospitalization at revisit included an index visit during the evening and overnight shift and living further from the hospital. Although the median SES and PCP density of a patient's area of residence were not associated with greater likelihood of returning, when they returned, patients residing in an area with a lower SES and higher PCP densities (>78.8 PCPs/100,000) had lower odds of being admitted to the hospital. Patients whose index visit was on a Sunday also had lower odds of being hospitalized upon return (Table 2).
| Characteristic | Adjusted OR of 72‐Hour Revisit (95% CI), n=1,380,723 | P Value | Adjusted OR of 72‐Hour Revisit Admissions (95% CI), n=46,364 | P Value |
|---|---|---|---|---|
| ||||
| Gender | ||||
| Male | 0.99 (0.971.01) | 0.2809 | 1.02 (0.971.07) | 0.5179 |
| Female | Reference | Reference | ||
| Payor | ||||
| Government | 1.14 (1.111.17) | <0.0001 | 0.68 (0.640.72) | <0.0001 |
| Other | 0.97 (0.921.01) | 0.1148 | 0.33 (0.280.39) | <0.0001 |
| Private | Reference | Reference | ||
| Age group | ||||
| 30 days to <1 year | 1.32 (1.221.42) | <0.0001 | 0.58 (0.490.69) | <0.0001 |
| 1 year to 5 years | 0.89 (0.830.96) | 0.003 | 0.41 (0.340.48) | <0.0001 |
| 5 years to 11 years | 0.69 (0.640.74) | <0.0001 | 0.40 (0.330.48) | <0.0001 |
| 12 years to 17 years | 0.72 (0.660.77) | <0.0001 | 0.50 (0.420.60) | <0.0001 |
| <30 days | Reference | Reference | ||
| Socioeconomic statusa | ||||
| % <1.5 times FPL | 0.96 (0.921.01) | 0.0992 | 0.82 (0.740.92) | 0.0005 |
| % 1.5 to 2 times FPL | 0.98 (0.941.02) | 0.2992 | 0.83 (0.750.92) | 0.0005 |
| % 2 to 3 times FPL | 1.02 (0.981.07) | 0.292 | 0.88 (0.790.97) | 0.01 |
| % >3 times FPL | Reference | Reference | ||
| Severity score | ||||
| High severity, 4, 5, 6 | 1.43 (1.401.45) | <0.0001 | 3.42 (3.233.62) | <0.0001 |
| Low severity, 1, 2, 3 | Reference | Reference | ||
| Presence of any CCC | ||||
| Yes | 1.90 (1.861.96) | <0.0001 | 2.92 (2.753.10) | <0.0001 |
| No | Reference | Reference | ||
| Time of arrival | ||||
| Evening | 1.05 (1.031.08) | <0.0001 | 1.37 (1.291.44) | <0.0001 |
| Overnight | 1.19 (1.151.22) | <0.0001 | 1.84 (1.711.97) | <0.0001 |
| Day | Reference | Reference | ||
| Season | ||||
| Winter | 1.09 (1.061.11) | <0.0001 | 1.06 (0.991.14) | 0.0722 |
| Spring | 1.07 (1.041.10) | <0.0001 | 0.98 (0.911.046) | 0.4763 |
| Summer | 1.05 (1.021.08) | 0.0011 | 0.93 (0.871.01) | 0.0729 |
| Fall | Reference | Reference | ||
| Weekday/weekend | ||||
| Thursday | 1.02 (0.9821.055) | 0.3297 | 0.983 (0.8971.078) | 0.7185 |
| Friday | 1.08 (1.041.11) | <0.0001 | 1.03 (0.941.13) | 0.5832 |
| Saturday | 1.08 (1.041.12) | <0.0001 | 0.89 (0.810.97) | 0.0112 |
| Sunday | 1.02 (0.991.06) | 0.2054 | 0.81 (0.740.89) | <0.0001 |
| Monday | 1.00 (0.961.03) | 0.8928 | 0.98 (0.901.07) | 0.6647 |
| Tuesday | 0.99 (0.951.03) | 0.5342 | 0.93 (0.851.02) | 0.1417 |
| Wednesday | Reference | Reference | ||
| PCP ratio per 100,000 patients | ||||
| 57.267.9 | 1.00 (0.961.04) | 0.8844 | 0.93 (0.841.03) | 0.1669 |
| 68.078.7 | 1.00 (0.951.04) | 0.8156 | 0.86 (0.770.96) | 0.0066 |
| >78.8 | 1.00 (0.951.04) | 0.6883 | 0.82 (0.730.92) | 0.001 |
| <57.2 | Reference | Reference | ||
| ED crowding score at index visitb | ||||
| 2 | 0.92 (0.900.95) | <0.0001 | 0.96 (0.881.05) | 0.3435 |
| 1 | Reference | Reference | ||
| Distance from hospitalc | ||||
| 3.168, 23.6 miles | 0.95 (0.940.96) | <0.0001 | 1.16 (1.121.19) | <0.0001 |
| 2.168, 8.7 miles | Reference | Reference | ||
| ED LOS at index visitb | ||||
| 3.7 hours | 1.003 (1.0011.005) | 0.0052 | NA | |
| 2.7 hours | Reference | |||
Diagnoses Associated With Return Visits
Patients with index visit diagnoses of sickle cell disease and leukemia had the highest proportion of return visits (10.7% and 7.3%, respectively). Other conditions with high revisit rates included infectious diseases such as cellulitis, bronchiolitis, and gastroenteritis. Patients with other chronic diseases such as diabetes and with devices, such as gastrostomy tubes, also had high rates of return visits. At return, the rate of hospitalization for these conditions ranged from a 1‐in‐6 chance of hospitalization for the diagnoses of a fever to a 1‐in‐2 chance of hospitalization for patients with sickle cell anemia (Table 3).
| Major Diagnostic Subgroup | No. of Index ED Visit Dischargesa | 72‐Hour Revisit, % (95% CI) | Admitted on Return, % (95% CI) |
|---|---|---|---|
| |||
| Sickle cell anemia | 2,531 | 10.7 (9.511.9) | 49.6 (43.755.6) |
| Neoplastic diseases, cancer | 536 | 7.3 (5.19.5) | 36 (2151) |
| Infectious gastrointestinal diseases | 802 | 7.2 (5.49.0) | 21 (1031) |
| Devices and complications of the circulatory systemb | 1,033 | 6.9 (5.38.4) | 45 (3457) |
| Other hematologic diseasesb | 1,538 | 6.1 (4.97.3) | 33 (2443) |
| Fever | 80,626 | 5.9 (5.76.0) | 16.3 (15.217.3) |
| Dehydration | 7,362 | 5.4 (5.25.5) | 34.6 (30.139) |
| Infectious respiratory diseases | 72,652 | 5.4 (5.25.5) | 28.6 (27.230) |
| Seizures | 17,637 | 5.3 (4.95.6) | 33.3 (30.336.4) |
| Other devices and complicationsb | 1,896 | 5.3 (4.36.3) | 39.0 (29.448.6) |
| Infectious skin, dermatologic and soft tissue diseases | 40,272 | 4.7 (4.55) | 20.0 (18.221.8) |
| Devices and complications of the gastrointestinal systemb | 4,692 | 4.6 (4.05.2) | 24.7 (18.930.4) |
| Vomiting | 44,730 | 4.4 (4.24.6) | 23.7 (21.825.6) |
| Infectious urinary tract diseases | 17,020 | 4.4 (4.14.7) | 25.9 (22.729) |
| Headache | 19,016 | 4.3 (4.14.6) | 28.2 (25.131.3) |
| Diabetes mellitus | 1,531 | 4.5 (3.35.3) | 29 (1840) |
| Abdominal pain | 39,594 | 4.2 (44.4) | 24.8 (22.726.8) |
| Other infectious diseasesb | 647 | 4.2 (2.65.7) | 33 (1651) |
| Gastroenteritis | 55,613 | 4.0 (3.84.1) | 20.6 (18.922.3) |
DISCUSSION
In this nationally representative sample of free‐standing children's hospitals, 3.3% of patients discharged from the ED returned to the same ED within 72 hours. This rate is similar to rates previously published in studies of general EDs.[11, 15] Of the returning children, over 80% were discharged again, and 19.7% were hospitalized, which is two‐thirds more than the admission rate at index visit (12%). In accordance with previous studies,[14, 16, 25] we found higher disease severity, presence of a chronic condition, and younger age were strongly associated with both the odds of patients returning to the ED and of being hospitalized at return. Patients who were hospitalized lived further away from the hospital and were of a higher SES. In this study, we show that visit‐level and access‐related factors are also associated with increased risk of return, although to a lesser degree. Patients seen on a weekend (Friday or Saturday) were found to have higher odds of returning, whereas those seen initially on a Sunday had lower odds of hospitalization at return. In this study, we also found that patients seen on the evening or night shifts at the index presentation had a significant association with return visits and hospitalization at return. Additionally, we found that although PCP density was not associated with the odds of returning to the ED, patients from areas with a higher PCP density were less likely to be admitted at return. In addition, by evaluating the diagnoses of patients who returned, we found that many infectious conditions commonly seen in the ED also had high return rates.
As previously shown,[23] we found that patients with complex and chronic diseases were at risk for ED revisits, especially patients with sickle cell anemia and cancer (mainly acute leukemia). In addition, patients with a chronic condition were 3 times more likely to be hospitalized when they returned. These findings may indicate an opportunity for improved discharge planning and coordination of care with subspecialty care providers for particularly at‐risk populations, or stronger consideration of admission at the index visit. However, admission for these patients at revisit may be unavoidable.
Excluding patients with chronic and complex conditions, the majority of conditions with high revisit rates were acute infectious conditions. One national study showed that >70% of ED revisits by patients with infectious conditions had planned ED follow‐up.[13] Although this study was unable to assess the reasons for return or admission at return, children with infectious diseases often worsen over time (eg, those with bronchiolitis). The relatively low admission rates at return for these conditions, despite evidence that providers may have a lower threshold for admission when a patient returns to the ED shortly after discharge,[24] may reflect the potential for improving follow‐up at the PCP office. However, although some revisits may be prevented,[37, 38] we recognize that an ED visit could be appropriate and necessary for some of these children, especially those without primary care.
Access to primary care and insurance status influence ED utilization.[14, 39, 40, 41] A fragmented healthcare system with poor access to primary care is strongly associated with utilization of the ED for nonurgent care. A high ED revisit rate might be indicative of poor coordination between ED and outpatient services.[9, 39, 42, 43, 44, 45, 46] Our study's finding of increased risk of return visit if the index visit occurred on a Friday or Saturday, and a decreased likelihood of subsequent admission when a patient returns on a Sunday, may suggest limited or perceived limited access to the PCP over a weekend. Although insured patients tend to use the ED less often for nonemergent cases, even when patients have PCPs, they might still choose to return to the ED out of convenience.[47, 48] This may be reflected in our finding that, when adjusted for insurance status and PCP density, patients who lived closer to the hospital were more likely to return, but less likely to be admitted, thereby suggesting proximity as a factor in the decision to return. It is also possible that patients residing further away returned to another institution. Although PCP density did not seem to be associated with revisits, patients who lived in areas with higher PCP density were less likely to be admitted when they returned. In this study, there was a stepwise gradient in the effect of PCP density on the odds of being hospitalized on return with those patients in areas with fewer PCPs being admitted at higher rates on return. Guttmann et al.,[40] in a recent study conducted in Canada where there is universal health insurance, showed that children residing in areas with higher PCP densities had higher rates of PCP visits but lower rates of ED visits compared to children residing in areas with lower PCP densities. It is possible that emergency physicians have more confidence that patients will have dedicated follow‐up when a PCP can be identified. These findings suggest that the development of PCP networks with expanded access, such as alignment of office hours with parent need and patient/parent education about PCP availability, may reduce ED revisits. Alternatively, creation of centralized hospital‐based urgent care centers for evening, night, and weekend visits may benefit both the patient and the PCP and avoid ED revisits and associated costs.
Targeting and eliminating disparities in care might also play a role in reducing ED revisits. Prior studies have shown that publicly insured individuals, in particular, frequently use the ED as their usual source of care and are more likely to return to the ED within 72 hours of an initial visit.[23, 39, 44, 49, 50] Likewise, we found that patients with public insurance were more likely to return but less likely to be admitted on revisit. After controlling for disease severity and other demographic variables, patients with public insurance and of lower socioeconomic status still had lower odds of being hospitalized following a revisit. This might also signify an increase of avoidable hospitalizations among patients of higher SES or with private insurance. Further investigation is needed to explore the reasons for these differences and to identify effective interventions to eliminate disparities.
Our findings have implications for emergency care, ambulatory care, and the larger healthcare system. First, ED revisits are costly and contribute to already overburdened EDs.[10, 11] The average ED visit incurs charges that are 2 to 5 times more than an outpatient office visit.[49, 50] Careful coordination of ambulatory and ED services could not only ensure optimal care for patients, but could save the US healthcare system billions of dollars in potentially avoidable healthcare expenditures.[49, 50] Second, prior studies have demonstrated a consistent relationship between poor access to primary care and increased use of the ED for nonurgent conditions.[42] Publicly insured patients have been shown to have disproportionately increased difficulty acquiring and accessing primary care.[41, 42, 47, 51] Furthermore, conditions with high ED revisit rates are similar to conditions reported by Berry et al.4 as having the highest hospital readmission rates such as cancer, sickle cell anemia, seizure, pneumonia, asthma, and gastroenteritis. This might suggest a close relationship between 72‐hour ED revisits and 30‐day hospital readmissions. In light of the recent expansion of health insurance coverage to an additional 30 million individuals, the need for better coordination of services throughout the entire continuum of care, including primary care, ED, and inpatient services, has never been more important.[52] Future improvements could explore condition‐specific revisit or readmission rates to identify the most effective interventions to reduce the possibly preventable returns.
This study has several limitations. First, as an administrative database, PHIS has limited clinical data, and reasons for return visits could not be assessed. Variations between hospitals in diagnostic coding might also lead to misclassification bias. Second, we were unable to assess return visits to a different ED. Thus, we may have underestimated revisit frequency. However, because children are generally more likely to seek repeat care in the same hospital,[3] we believe our estimate of return visit rate approximates the actual return visit rate; our findings are also similar to previously reported rates. Third, for the PCP density factor, we were unable to account for types of insurance each physician accepted and influence on return rates. Fourth, return visits in our sample could have been for conditions unrelated to the diagnosis at index visit, though the short timeframe considered for revisits makes this less likely. In addition, the crowding index does not include the proportion of occupied beds at the precise moment of the index visit. Finally, this cohort includes only children seen in the EDs of pediatric hospitals, and our findings may not be generalizable to all EDs who provide care for ill and injured children.
We have shown that, in addition to previously identified patient level factors, there are visit‐level and access‐related factors associated with pediatric ED return visits. Eighty percent are discharged again, and almost one‐fifth of returning patients are admitted to the hospital. Admitted patients tend to be younger, sicker, chronically ill, and live farther from the hospital. By being aware of patients' comorbidities, PCP access, as well as certain diagnoses associated with high rates of return, physicians may better target interventions to optimize care. This may include having a lower threshold for hospitalization at the initial visit for children at high risk of return, and communication with the PCP at the time of discharge to ensure close follow‐up. Our study helps to provide benchmarks around ED revisit rates, and may serve as a starting point to better understand variation in care. Future efforts should aim to find creative solutions at individual institutions, with the goal of disseminating and replicating successes more broadly. For example, investigators in Boston have shown that the use of a comprehensive home‐based asthma management program has been successful in decreasing emergency department visits and hospitalization rates.[53] It is possible that this approach could be spread to other institutions to decrease revisits for patients with asthma. As a next step, the authors have undertaken an investigation to identify hospital‐level characteristics that may be associated with rates of return visits.
Acknowledgements
The authors thank the following members of the PHIS ED Return Visits Research Group for their contributions to the data analysis plan and interpretation of results of this study: Rustin Morse, MD, Children's Medical Center of Dallas; Catherine Perron, MD, Boston Children's Hospital; John Cheng, MD, Children's Healthcare of Atlanta; Shabnam Jain, MD, MPH, Children's Healthcare of Atlanta; and Amanda Montalbano, MD, MPH, Children's Mercy Hospitals and Clinics. These contributors did not receive compensation for their help with this work.
Disclosures
A.T.A. and A.M.S. conceived the study and developed the initial study design. All authors were involved in the development of the final study design and data analysis plan. C.W.T. collected and analyzed the data. A.T.A. and C.W.T. had full access to all of the data and take responsibility for the integrity of the data and the accuracy of the data analysis. All authors were involved in the interpretation of the data. A.T.A. drafted the article, and all authors made critical revisions to the initial draft and subsequent versions. A.T.A. and A.M.S. take full responsibility for the article as a whole. The authors report no conflicts of interest.
- Joint policy statement—guidelines for care of children in the emergency department. Pediatrics. 2009;124:1233–1243.
- , , , , . Return visits to a pediatric emergency department. Pediatr Emerg Care. 2004;20:166–171.
- , . Hospital readmission as an accountability measure. JAMA. 2011;305:504–505.
- , , , et al. Hospital utilization and characteristics of patients experiencing recurrent readmissions within children's hospitals. JAMA. 2011;305:682–690.
- , , , et al. Pediatric readmission prevalence and variability across hospitals. JAMA. 2013;309:372–380.
- . Farewell, and don't come back. Health reform gives hospitals a big incentive to send patients home for good. US News World Rep. 2010;147:20, 22–23.
- . CMS' stealth health reform. Plan to reduce readmissions and boost the continuum of care. Hosp Health Netw. 2008;82:24.
- , . Return visits to the emergency department. J Emerg Med. 1987;5:359–362.
- , , , . Emergency department visits after hospital discharge: a missing part of the equation. Ann Emerg Med. 2013;62:145–150.
- , , , , . Quality indicators for high acuity pediatric conditions. Pediatrics. 2013;132:752–762.
- , . Revisiting hospital readmissions. JAMA. 2013;309:398–400.
- , , . Thirty‐day readmissions: the clock is ticking. JAMA. 2013;309:345–346.
- . Patients seen in emergency departments who had a prior visit within the previous 72 h‐National Hospital Ambulatory Medical Care Survey, 2002. Public Health. 2005;119:914–918.
- , , , , . A national depiction of children with return visits to the emergency department within 72 hours, 2001–2007. Pediatr Emerg Care. 2012;28:606–610.
- , , , et al. How well can hospital readmission be predicted in a cohort of hospitalized children? A retrospective, multicenter study. Pediatrics. 2009;123:286–293.
- , , . Unscheduled return visits to the pediatric emergency department‐one‐year experience. Pediatr Emerg Care. 2006;22:545–549.
- , . Return visits to the emergency department among febrile children 3 to 36 months of age. Pediatr Emerg Care. 2011;27:1126–1129.
- , , , . Pediatric emergency department recidivism: demographic characteristics and diagnostic predictors. J Emerg Nurs. 2006;32:131–138.
- Healthcare Cost and Utilization Project. Pediatric emergency department visits in community hospitals from selected states, 2005. Statistical brief #52. Available at: http://www.ncbi.nlm.nih.gov/books/NBK56039. Accessed October 3, 2013.
- , , , , , . Factors influencing infant visits to emergency departments. Pediatrics. 2000;106:1031–1039.
- , , , . Early pediatric emergency department return visits: a prospective patient‐centric assessment. Clin Pediatr (Phila). 2012;51:651–658.
- , , , , . Unscheduled return visits with and without admission post emergency department discharge. J Emerg Med. 2012;43:1110–1118.
- , , , . Unscheduled revisits to a pediatric emergency department: risk factors for children with fever or infection‐related complaints. Pediatr Emerg Care. 2005;21:816–821.
- , , , , . Unscheduled return visits to the emergency department: consequences for triage. Acad Emerg Med. 2013;20:33–39.
- , , , et al. Repeat pediatric visits to a general emergency department. Ann Emerg Med. 1996;28:467–473.
- , , , , . Emergency department revisits. Ann Emerg Med. 1989;18:964–968.
- US Department of Health 19:70–78.
- , , . Pediatric deaths attributable to complex chronic conditions: a population‐based study of Washington State, 1980–1997. Pediatrics. 2000;106:205–209.
- , , , , , . Deaths attributed to pediatric complex chronic conditions: national trends and implications for supportive care services. Pediatrics. 2001;107:E99.
- , , . Where do children with complex chronic conditions die? Patterns in Washington State, 1980–1998. Pediatrics. 2002;109:656–660.
- Dartmouth Atlas of Health Care. Hospital and physician capacity, 2006. Available at: http://www.dartmouthatlas.org/data/topic/topic.aspx?cat=24. Accessed October 7, 2013.
- Dartmouth Atlas of Health Care. Research methods. What is an HSA/HRR? Available at: http://www.dartmouthatlas.org/tools/faq/researchmethods.aspx. Accessed October 7, 2013,.
- Dartmouth Atlas of Health Care. Appendix on the geography of health care in the United States. Available at: http://www.dartmouthatlas.org/downloads/methods/geogappdx.pdf. Accessed October 7, 2013.
- , , . Emergency department crowding: prioritising quantified crowding measures using a Delphi study. Emerg Med J. 2012;29:868–871.
- , , , , . A new diagnosis grouping system for child emergency department visits. Acad Emerg Med. 2010;17:204–213.
- , , , et al. Effectiveness of emergency department asthma management strategies on return visits in children: a population‐based study. Pediatrics. 2007;120:e1402–e1410.
- , , , . Emergency department patients with diabetes have better glycemic control when they have identifiable primary care providers. Acad Emerg Med. 2012;19:650–655.
- , , , , , Newman L. Impact of socioeconomic status on hospital use in New York City. Health Aff (Millwood). 1993;12:162–173.
- , , , , . Primary care physician supply and children's health care use, access, and outcomes: findings from Canada. Pediatrics. 2010;125:1119–1126.
- , , , et al. Insurance status and access to urgent ambulatory care follow‐up appointments. JAMA. 2005;294:1248–1254.
- , . Emergency departments, Medicaid costs, and access to primary care—understanding the link. N Engl J Med. 2012;366:2141–2143.
- Committee on the Future of Emergency Care in the United States Health System. Emergency Care for Children: Growing Pains. Washington, DC: The National Academies Press; 2007.
- Committee on the Future of Emergency Care in the United States Health System. Hospital‐Based Emergency Care: At the Breaking Point. Washington, DC: The National Academies Press; 2007.
- , . Geographic variation in access to care—the relationship with quality. N Engl J Med. 2012;367:3–6.
- , , , , . Trends and characteristics of US emergency department visits, 1997–2007. JAMA. 2010;304:664–670.
- , , , , . Ambulatory visits to hospital emergency departments. Patterns and reasons for use. 24 Hours in the ED Study Group. JAMA. 1996;276:460–465.
- , , , , . Emergency department workload increase: dependence on primary care? J Emerg Med. 2010;38:279–285.
- Network for Excellence in Health Innovation. Leading healthcare research organizations to examine emergency department overuse. New England Research Institute, 2008. Available at: http://www.nehi.net/news/310‐leading‐health‐care‐research‐organizations‐to‐examine‐emergency‐department‐overuse/view. Accessed October 4, 2013.
- Robert Wood Johnson Foundation. Quality field notes: reducing inappropriate emergency department use. Available at: http://www.rwjf.org/en/research‐publications/find‐rwjf‐research/2013/09/quality‐field‐notes–reducing‐inappropriate‐emergency‐department.html.
- Access of Medicaid recipients to outpatient care. N Engl J Med. 1994;330:1426–1430.
- Medicaid policy statement. Pediatrics. 2013;131:e1697–e1706.
- , , , et al. Community asthma initiative: evaluation of a quality improvement program for comprehensive asthma care. Pediatrics. 2012;129:465–472.
Returns to the hospital following recent encounters, such as an admission to the inpatient unit or evaluation in an emergency department (ED), may reflect the natural progression of a disease, the quality of care received during the initial admission or visit, or the quality of the underlying healthcare system.[1, 2, 3, 4, 5, 6, 7, 8, 9, 10] Although national attention has focused on hospital readmissions,[3, 4, 5, 6, 7, 11, 12] ED revisits are a source of concern to emergency physicians.[8, 9] Some ED revisits are medically necessary, but revisits that may be managed in the primary care setting contribute to ED crowding, can be stressful to patients and providers, and increase healthcare costs.[10, 11, 12] Approximately 27 million annual ED visits are made by children, accounting for over one‐quarter of all ED visits in the United States, with a reported ED revisit rate of 2.5% to 5.2%.[2, 13, 14, 15, 16, 17, 18, 19, 20] Improved understanding of the patient‐level or visit‐level factors associated with ED revisits may provide an opportunity to enhance disposition decision making at the index visit and optimize site of and communication around follow‐up care.
Previous studies on ED revisits have largely been conducted in single centers and have used variable visit intervals ranging between 48 hours and 30 days.[2, 13, 16, 18, 21, 22, 23, 24, 25] Two national studies used the National Hospital Ambulatory Medical Care Survey, which includes data from both general and pediatric EDs.[13, 14] Factors identified to be associated with increased odds of returning were: young age, higher acuity, chronic conditions, and public insurance. One national study identified some diagnoses associated with higher likelihood of returning,[13] whereas the other focused primarily on infectious diseaserelated diagnoses.[14]
The purpose of this study was to describe the prevalence of return visits specifically to pediatric EDs and to investigate patient‐level, visit‐level, and healthcare systemrelated factors that may be associated with return visits and hospitalization at return.
METHODS
Study Design and Data Source
This retrospective cohort study used data from the Pediatric Health Information System (PHIS), an administrative database with data from 44 tertiary care pediatric hospitals in 27 US states and the District of Columbia. This database contains patient demographics, diagnoses, and procedures as well as medications, diagnostic imaging, laboratory, and supply charges for each patient. Data are deidentified prior to inclusion; encrypted medical record numbers allow for the identification of individual patients across all ED visits and hospitalizations to the same hospital. The Children's Hospital Association (Overland Park, KS) and participating hospitals jointly assure the quality and integrity of the data. This study was approved by the institutional review board at Boston Children's Hospital with a waiver for informed consent granted.
Study Population and Protocol
To standardize comparisons across the hospitals, we included data from 23 of the 44 hospitals in PHIS; 7 were excluded for not including ED‐specific data. For institutions that collect information from multiple hospitals within their healthcare system, we included only records from the main campus or children's hospital when possible, leading to the exclusion of 9 hospitals where the data were not able to be segregated. As an additional level of data validation, we compared the hospital‐level ED volume and admission rates as reported in the PHIS to those reported to a separate database (the Pediatric Analysis and Comparison Tool). We further excluded 5 hospitals whose volume differed by >10% between these 2 data sources.
Patients <18 years of age who were discharged from these EDs following their index visit in 2012 formed the eligible cohort.
Key Outcome Measures
The primary outcomes were return visits within 72 hours of discharge from the ED, and return visits resulting in hospitalization, including observation status. We defined an ED revisit as a return within 72 hours of ED discharge regardless of whether the patient was subsequently discharged from the ED on the return visit or hospitalized. We assessed revisits within 72 hours of an index ED discharge, because return visits within this time frame are likely to be related to the index visit.[2, 13, 16, 21, 22, 24, 25, 26]
Factors Associated With ED Revisits
A priori, we chose to adjust for the following patient‐level factors: age (<30 days, 30 days<1 year, 14 years, 511 years, 1217 years), gender, and socioeconomic status (SES) measured as the zip codebased median household income, obtained from the 2010 US Census, with respect to the federal poverty level (FPL) (<1.5 FPL, 1.52 FPL, 23 FPL, and >3 FPL).[27] We also adjusted for insurance type (commercial, government, or other), proximity of patient's home zip code to hospital (modeled as the natural log of the geographical distance to patient's home address from the hospital), ED diagnosis‐based severity classification system score (1=low severity, 5=high severity),[28] presence of a complex chronic condition at the index or prior visits using a validated classification scheme,[15, 29, 30, 31] and primary care physician (PCP) density per 100,000 in the patient's residential area (modeled as quartiles: very low, <57.2; low, 57.267.9; medium, 68.078.7; high, >78.8). PCP density, defined by the Dartmouth Atlas of Health Care,[32, 33, 34] is the number of primary care physicians per 100,000 residents (PCP count) in federal health service areas (HSA). Patients were assigned to a corresponding HSA based on their home zip code.
Visit‐level factors included arrival time of index visit (8:01 am 4:00 pm, 4:01 pm12:00 am, 12:01 am8 am representing day, evening, and overnight arrival, respectively), day of the week, season, length of stay (LOS) in the ED during the index visit, and ED crowding (calculated as the average daily LOS/yearly average LOS for the individual ED).[35] We categorized the ED primary diagnosis for each visit using the major diagnosis groupings of a previously described pediatric ED‐specific classification scheme.[36] Using International Classification of Diseases, Ninth Revision (ICD‐9) codes, we identified the conditions with the highest ED revisit rates.
Statistical Analyses
Categorical variables describing the study cohort were summarized using frequencies and percentages. Continuous variables were summarized using mean, median, and interquartile range values, where appropriate. We used 2 different hierarchical logistic regression models to assess revisit rates by patient‐ and visit‐level characteristics. The initial model included all patients discharged from the ED following the index visit and assessed for the outcome of a revisit within 72 hours. The second model considered only patients who returned within 72 hours of an index visit and assessed for hospitalization on that return visit. We used generalized linear mixed effects models, with hospital as a random effect to account for the presence of correlated data (within hospitals), nonconstant variability (across hospitals), and binary responses. Adjusted odds ratios with 95% confidence intervals were used as summary measures of the effect of the individual adjusters. Adjusters were missing in fewer than 5% of patients across participating hospitals. Statistical analyses were performed using SAS version 9.3 (SAS Institute Inc., Cary, NC); 2‐sided P values <0.004 were considered statistically significant to account for multiple comparisons (Bonferroni‐adjusted level of significance=0.0038).
RESULTS
Patients
A total of 1,610,201 patients <18 years of age evaluated across the 23 PHIS EDs in 2012 were included in the study. Twenty‐one of the 23 EDs have academic affiliations; 10 are located in the South, 6 in the Midwest, 5 in the West, and 2 in the Northeast region of the United States. The annual ED volume for these EDs ranged from 25,090 to 136,160 (median, 65,075; interquartile range, 45,28085,206). Of the total patients, 1,415,721 (87.9%) were discharged following the index visit and comprised our study cohort. Of these patients, 47,294 (revisit rate: 3.3%) had an ED revisit within 72 hours. There were 4015 patients (0.3%) who returned more than once within 72 hours, and the largest proportion of these returned with infection‐related conditions. Of those returning, 37,999 (80.3%) were discharged again, whereas 9295 (19.7%) were admitted to the hospital (Figure 1). The demographic and clinical characteristics of study participants are displayed in Table 1.
| Index Visit, n=1,415,721, n (%) | Return Visits Within 72 Hours of Discharge, n=47,294, 3.3% | ||
|---|---|---|---|
| Return to Discharge, n (%) | Return to Admission, n (%) | ||
| |||
| Gender, female | 659,417 (46.6) | 17,665 (46.5) | 4,304 (46.3) |
| Payor | |||
| Commercial | 379,403 (26.8) | 8,388 (22.1) | 3,214 (34.6) |
| Government | 925,147 (65.4) | 26,880 (70.7) | 5,786 (62.3) |
| Other | 111,171 (7.9) | 2,731 (7.2) | 295 (3.2) |
| Age | |||
| <30 days | 19,217 (1.4) | 488 (1.3) | 253 (2.7) |
| 30 days to <1 year | 216,967 (15.3) | 8,280 (21.8) | 2,372 (25.5) |
| 1 year to 4 years | 547,083 (38.6) | 15,542 (40.9) | 3,187 (34.3) |
| 5 years to 11 years | 409,463 (28.9) | 8,906 (23.4) | 1,964 (21.1) |
| 12 years to 17 years | 222,991 (15.8) | 4,783 (12.6) | 1,519 (16.3) |
| Socioeconomic statusa | |||
| <1.5 times FPL | 493,770 (34.9) | 13,851 (36.5) | 2,879 (31.0) |
| 1.5 to 2 times FPL | 455,490 (32.2) | 12,364 (32.5) | 2,904 (31.2) |
| 2 to 3 times FPL | 367,557 (26.0) | 9,560 (25.2) | 2,714 (29.2) |
| >3 times FPL | 98,904 (7.0) | 2,224 (5.9) | 798 (8.6) |
| Primary care physician density per 100,000 patients | |||
| Very low | 351,798 (24.9) | 8,727 (23.0) | 2,628 (28.3) |
| Low | 357,099 (25.2) | 9,810 (25.8) | 2,067 (22.2) |
| Medium | 347,995 (24.6) | 10,186 (26.8) | 2,035 (21.9) |
| High | 358,829 (25.4) | 9,276 (24.4) | 2,565 (27.6) |
| CCC present, yes | 125,774 (8.9) | 4,446 (11.7) | 2,825 (30.4) |
| Severity score | |||
| Low severity (0,1,2) | 721,061 (50.9) | 17,310 (45.6) | 2,955 (31.8) |
| High severity (3,4,5) | 694,660 (49.1) | 20,689 (54.5) | 6,340 (68.2) |
| Time of arrival | |||
| Day | 533,328 (37.7) | 13,449 (35.4) | 3,396 (36.5) |
| Evening | 684,873 (48.4) | 18,417 (48.5) | 4,378 (47.1) |
| Overnight | 197,520 (14.0) | 6,133 (16.1) | 1,521 (16.4) |
| Season | |||
| Winter | 384,957 (27.2) | 10,603 (27.9) | 2,844 (30.6) |
| Spring | 367,434 (26.0) | 9,923 (26.1) | 2,311 (24.9) |
| Summer | 303,872 (21.5) | 8,308 (21.9) | 1,875 (20.2) |
| Fall | 359,458 (25.4) | 9,165 (24.1) | 2,265 (24.4) |
| Weekday/weekend | |||
| Monday | 217,774 (15.4) | 5,646 (14.9) | 1,394 (15) |
| Tuesday | 198,220 (14.0) | 5,054 (13.3) | 1,316 (14.2) |
| Wednesday | 194,295 (13.7) | 4,985 (13.1) | 1,333 (14.3) |
| Thursday | 191,950 (13.6) | 5,123 (13.5) | 1,234 (13.3) |
| Friday | 190,022 (13.4) | 5,449 (14.3) | 1,228 (13.2) |
| Saturday | 202,247 (14.3) | 5,766 (15.2) | 1,364 (14.7) |
| Sunday | 221,213 (15.6) | 5,976 (15.7) | 1,426 (15.3) |
| Distance from hospital in miles, median (IQR) | 8.3 (4.614.9) | 9.2 (4.917.4) | 8.3 (4.614.9) |
| ED crowding score at index visit, median (IQR) | 1.0 (0.91.1) | 1.0 (0.91.1) | 1.0 (0.91.1) |
| ED LOS in hours at index visit, median (IQR) | 2.0 (1.03.0) | 3.0 (2.05.0) | 2.0 (1.03.0) |
ED Revisit Rates and Revisits Resulting in Admission
In multivariate analyses, compared to patients who did not return to the ED, patients who returned within 72 hours of discharge had higher odds of revisit if they had the following characteristics: a chronic condition, were <1 year old, a higher severity score, and public insurance. Visit‐level factors associated with higher odds of revisits included arrival for the index visit during the evening or overnight shift or on a Friday or Saturday, index visit during times of lower ED crowding, and living closer to the hospital. On return, patients were more likely to be hospitalized if they had a higher severity score, a chronic condition, private insurance, or were <30 days old. Visit‐level factors associated with higher odds of hospitalization at revisit included an index visit during the evening and overnight shift and living further from the hospital. Although the median SES and PCP density of a patient's area of residence were not associated with greater likelihood of returning, when they returned, patients residing in an area with a lower SES and higher PCP densities (>78.8 PCPs/100,000) had lower odds of being admitted to the hospital. Patients whose index visit was on a Sunday also had lower odds of being hospitalized upon return (Table 2).
| Characteristic | Adjusted OR of 72‐Hour Revisit (95% CI), n=1,380,723 | P Value | Adjusted OR of 72‐Hour Revisit Admissions (95% CI), n=46,364 | P Value |
|---|---|---|---|---|
| ||||
| Gender | ||||
| Male | 0.99 (0.971.01) | 0.2809 | 1.02 (0.971.07) | 0.5179 |
| Female | Reference | Reference | ||
| Payor | ||||
| Government | 1.14 (1.111.17) | <0.0001 | 0.68 (0.640.72) | <0.0001 |
| Other | 0.97 (0.921.01) | 0.1148 | 0.33 (0.280.39) | <0.0001 |
| Private | Reference | Reference | ||
| Age group | ||||
| 30 days to <1 year | 1.32 (1.221.42) | <0.0001 | 0.58 (0.490.69) | <0.0001 |
| 1 year to 5 years | 0.89 (0.830.96) | 0.003 | 0.41 (0.340.48) | <0.0001 |
| 5 years to 11 years | 0.69 (0.640.74) | <0.0001 | 0.40 (0.330.48) | <0.0001 |
| 12 years to 17 years | 0.72 (0.660.77) | <0.0001 | 0.50 (0.420.60) | <0.0001 |
| <30 days | Reference | Reference | ||
| Socioeconomic statusa | ||||
| % <1.5 times FPL | 0.96 (0.921.01) | 0.0992 | 0.82 (0.740.92) | 0.0005 |
| % 1.5 to 2 times FPL | 0.98 (0.941.02) | 0.2992 | 0.83 (0.750.92) | 0.0005 |
| % 2 to 3 times FPL | 1.02 (0.981.07) | 0.292 | 0.88 (0.790.97) | 0.01 |
| % >3 times FPL | Reference | Reference | ||
| Severity score | ||||
| High severity, 4, 5, 6 | 1.43 (1.401.45) | <0.0001 | 3.42 (3.233.62) | <0.0001 |
| Low severity, 1, 2, 3 | Reference | Reference | ||
| Presence of any CCC | ||||
| Yes | 1.90 (1.861.96) | <0.0001 | 2.92 (2.753.10) | <0.0001 |
| No | Reference | Reference | ||
| Time of arrival | ||||
| Evening | 1.05 (1.031.08) | <0.0001 | 1.37 (1.291.44) | <0.0001 |
| Overnight | 1.19 (1.151.22) | <0.0001 | 1.84 (1.711.97) | <0.0001 |
| Day | Reference | Reference | ||
| Season | ||||
| Winter | 1.09 (1.061.11) | <0.0001 | 1.06 (0.991.14) | 0.0722 |
| Spring | 1.07 (1.041.10) | <0.0001 | 0.98 (0.911.046) | 0.4763 |
| Summer | 1.05 (1.021.08) | 0.0011 | 0.93 (0.871.01) | 0.0729 |
| Fall | Reference | Reference | ||
| Weekday/weekend | ||||
| Thursday | 1.02 (0.9821.055) | 0.3297 | 0.983 (0.8971.078) | 0.7185 |
| Friday | 1.08 (1.041.11) | <0.0001 | 1.03 (0.941.13) | 0.5832 |
| Saturday | 1.08 (1.041.12) | <0.0001 | 0.89 (0.810.97) | 0.0112 |
| Sunday | 1.02 (0.991.06) | 0.2054 | 0.81 (0.740.89) | <0.0001 |
| Monday | 1.00 (0.961.03) | 0.8928 | 0.98 (0.901.07) | 0.6647 |
| Tuesday | 0.99 (0.951.03) | 0.5342 | 0.93 (0.851.02) | 0.1417 |
| Wednesday | Reference | Reference | ||
| PCP ratio per 100,000 patients | ||||
| 57.267.9 | 1.00 (0.961.04) | 0.8844 | 0.93 (0.841.03) | 0.1669 |
| 68.078.7 | 1.00 (0.951.04) | 0.8156 | 0.86 (0.770.96) | 0.0066 |
| >78.8 | 1.00 (0.951.04) | 0.6883 | 0.82 (0.730.92) | 0.001 |
| <57.2 | Reference | Reference | ||
| ED crowding score at index visitb | ||||
| 2 | 0.92 (0.900.95) | <0.0001 | 0.96 (0.881.05) | 0.3435 |
| 1 | Reference | Reference | ||
| Distance from hospitalc | ||||
| 3.168, 23.6 miles | 0.95 (0.940.96) | <0.0001 | 1.16 (1.121.19) | <0.0001 |
| 2.168, 8.7 miles | Reference | Reference | ||
| ED LOS at index visitb | ||||
| 3.7 hours | 1.003 (1.0011.005) | 0.0052 | NA | |
| 2.7 hours | Reference | |||
Diagnoses Associated With Return Visits
Patients with index visit diagnoses of sickle cell disease and leukemia had the highest proportion of return visits (10.7% and 7.3%, respectively). Other conditions with high revisit rates included infectious diseases such as cellulitis, bronchiolitis, and gastroenteritis. Patients with other chronic diseases such as diabetes and with devices, such as gastrostomy tubes, also had high rates of return visits. At return, the rate of hospitalization for these conditions ranged from a 1‐in‐6 chance of hospitalization for the diagnoses of a fever to a 1‐in‐2 chance of hospitalization for patients with sickle cell anemia (Table 3).
| Major Diagnostic Subgroup | No. of Index ED Visit Dischargesa | 72‐Hour Revisit, % (95% CI) | Admitted on Return, % (95% CI) |
|---|---|---|---|
| |||
| Sickle cell anemia | 2,531 | 10.7 (9.511.9) | 49.6 (43.755.6) |
| Neoplastic diseases, cancer | 536 | 7.3 (5.19.5) | 36 (2151) |
| Infectious gastrointestinal diseases | 802 | 7.2 (5.49.0) | 21 (1031) |
| Devices and complications of the circulatory systemb | 1,033 | 6.9 (5.38.4) | 45 (3457) |
| Other hematologic diseasesb | 1,538 | 6.1 (4.97.3) | 33 (2443) |
| Fever | 80,626 | 5.9 (5.76.0) | 16.3 (15.217.3) |
| Dehydration | 7,362 | 5.4 (5.25.5) | 34.6 (30.139) |
| Infectious respiratory diseases | 72,652 | 5.4 (5.25.5) | 28.6 (27.230) |
| Seizures | 17,637 | 5.3 (4.95.6) | 33.3 (30.336.4) |
| Other devices and complicationsb | 1,896 | 5.3 (4.36.3) | 39.0 (29.448.6) |
| Infectious skin, dermatologic and soft tissue diseases | 40,272 | 4.7 (4.55) | 20.0 (18.221.8) |
| Devices and complications of the gastrointestinal systemb | 4,692 | 4.6 (4.05.2) | 24.7 (18.930.4) |
| Vomiting | 44,730 | 4.4 (4.24.6) | 23.7 (21.825.6) |
| Infectious urinary tract diseases | 17,020 | 4.4 (4.14.7) | 25.9 (22.729) |
| Headache | 19,016 | 4.3 (4.14.6) | 28.2 (25.131.3) |
| Diabetes mellitus | 1,531 | 4.5 (3.35.3) | 29 (1840) |
| Abdominal pain | 39,594 | 4.2 (44.4) | 24.8 (22.726.8) |
| Other infectious diseasesb | 647 | 4.2 (2.65.7) | 33 (1651) |
| Gastroenteritis | 55,613 | 4.0 (3.84.1) | 20.6 (18.922.3) |
DISCUSSION
In this nationally representative sample of free‐standing children's hospitals, 3.3% of patients discharged from the ED returned to the same ED within 72 hours. This rate is similar to rates previously published in studies of general EDs.[11, 15] Of the returning children, over 80% were discharged again, and 19.7% were hospitalized, which is two‐thirds more than the admission rate at index visit (12%). In accordance with previous studies,[14, 16, 25] we found higher disease severity, presence of a chronic condition, and younger age were strongly associated with both the odds of patients returning to the ED and of being hospitalized at return. Patients who were hospitalized lived further away from the hospital and were of a higher SES. In this study, we show that visit‐level and access‐related factors are also associated with increased risk of return, although to a lesser degree. Patients seen on a weekend (Friday or Saturday) were found to have higher odds of returning, whereas those seen initially on a Sunday had lower odds of hospitalization at return. In this study, we also found that patients seen on the evening or night shifts at the index presentation had a significant association with return visits and hospitalization at return. Additionally, we found that although PCP density was not associated with the odds of returning to the ED, patients from areas with a higher PCP density were less likely to be admitted at return. In addition, by evaluating the diagnoses of patients who returned, we found that many infectious conditions commonly seen in the ED also had high return rates.
As previously shown,[23] we found that patients with complex and chronic diseases were at risk for ED revisits, especially patients with sickle cell anemia and cancer (mainly acute leukemia). In addition, patients with a chronic condition were 3 times more likely to be hospitalized when they returned. These findings may indicate an opportunity for improved discharge planning and coordination of care with subspecialty care providers for particularly at‐risk populations, or stronger consideration of admission at the index visit. However, admission for these patients at revisit may be unavoidable.
Excluding patients with chronic and complex conditions, the majority of conditions with high revisit rates were acute infectious conditions. One national study showed that >70% of ED revisits by patients with infectious conditions had planned ED follow‐up.[13] Although this study was unable to assess the reasons for return or admission at return, children with infectious diseases often worsen over time (eg, those with bronchiolitis). The relatively low admission rates at return for these conditions, despite evidence that providers may have a lower threshold for admission when a patient returns to the ED shortly after discharge,[24] may reflect the potential for improving follow‐up at the PCP office. However, although some revisits may be prevented,[37, 38] we recognize that an ED visit could be appropriate and necessary for some of these children, especially those without primary care.
Access to primary care and insurance status influence ED utilization.[14, 39, 40, 41] A fragmented healthcare system with poor access to primary care is strongly associated with utilization of the ED for nonurgent care. A high ED revisit rate might be indicative of poor coordination between ED and outpatient services.[9, 39, 42, 43, 44, 45, 46] Our study's finding of increased risk of return visit if the index visit occurred on a Friday or Saturday, and a decreased likelihood of subsequent admission when a patient returns on a Sunday, may suggest limited or perceived limited access to the PCP over a weekend. Although insured patients tend to use the ED less often for nonemergent cases, even when patients have PCPs, they might still choose to return to the ED out of convenience.[47, 48] This may be reflected in our finding that, when adjusted for insurance status and PCP density, patients who lived closer to the hospital were more likely to return, but less likely to be admitted, thereby suggesting proximity as a factor in the decision to return. It is also possible that patients residing further away returned to another institution. Although PCP density did not seem to be associated with revisits, patients who lived in areas with higher PCP density were less likely to be admitted when they returned. In this study, there was a stepwise gradient in the effect of PCP density on the odds of being hospitalized on return with those patients in areas with fewer PCPs being admitted at higher rates on return. Guttmann et al.,[40] in a recent study conducted in Canada where there is universal health insurance, showed that children residing in areas with higher PCP densities had higher rates of PCP visits but lower rates of ED visits compared to children residing in areas with lower PCP densities. It is possible that emergency physicians have more confidence that patients will have dedicated follow‐up when a PCP can be identified. These findings suggest that the development of PCP networks with expanded access, such as alignment of office hours with parent need and patient/parent education about PCP availability, may reduce ED revisits. Alternatively, creation of centralized hospital‐based urgent care centers for evening, night, and weekend visits may benefit both the patient and the PCP and avoid ED revisits and associated costs.
Targeting and eliminating disparities in care might also play a role in reducing ED revisits. Prior studies have shown that publicly insured individuals, in particular, frequently use the ED as their usual source of care and are more likely to return to the ED within 72 hours of an initial visit.[23, 39, 44, 49, 50] Likewise, we found that patients with public insurance were more likely to return but less likely to be admitted on revisit. After controlling for disease severity and other demographic variables, patients with public insurance and of lower socioeconomic status still had lower odds of being hospitalized following a revisit. This might also signify an increase of avoidable hospitalizations among patients of higher SES or with private insurance. Further investigation is needed to explore the reasons for these differences and to identify effective interventions to eliminate disparities.
Our findings have implications for emergency care, ambulatory care, and the larger healthcare system. First, ED revisits are costly and contribute to already overburdened EDs.[10, 11] The average ED visit incurs charges that are 2 to 5 times more than an outpatient office visit.[49, 50] Careful coordination of ambulatory and ED services could not only ensure optimal care for patients, but could save the US healthcare system billions of dollars in potentially avoidable healthcare expenditures.[49, 50] Second, prior studies have demonstrated a consistent relationship between poor access to primary care and increased use of the ED for nonurgent conditions.[42] Publicly insured patients have been shown to have disproportionately increased difficulty acquiring and accessing primary care.[41, 42, 47, 51] Furthermore, conditions with high ED revisit rates are similar to conditions reported by Berry et al.4 as having the highest hospital readmission rates such as cancer, sickle cell anemia, seizure, pneumonia, asthma, and gastroenteritis. This might suggest a close relationship between 72‐hour ED revisits and 30‐day hospital readmissions. In light of the recent expansion of health insurance coverage to an additional 30 million individuals, the need for better coordination of services throughout the entire continuum of care, including primary care, ED, and inpatient services, has never been more important.[52] Future improvements could explore condition‐specific revisit or readmission rates to identify the most effective interventions to reduce the possibly preventable returns.
This study has several limitations. First, as an administrative database, PHIS has limited clinical data, and reasons for return visits could not be assessed. Variations between hospitals in diagnostic coding might also lead to misclassification bias. Second, we were unable to assess return visits to a different ED. Thus, we may have underestimated revisit frequency. However, because children are generally more likely to seek repeat care in the same hospital,[3] we believe our estimate of return visit rate approximates the actual return visit rate; our findings are also similar to previously reported rates. Third, for the PCP density factor, we were unable to account for types of insurance each physician accepted and influence on return rates. Fourth, return visits in our sample could have been for conditions unrelated to the diagnosis at index visit, though the short timeframe considered for revisits makes this less likely. In addition, the crowding index does not include the proportion of occupied beds at the precise moment of the index visit. Finally, this cohort includes only children seen in the EDs of pediatric hospitals, and our findings may not be generalizable to all EDs who provide care for ill and injured children.
We have shown that, in addition to previously identified patient level factors, there are visit‐level and access‐related factors associated with pediatric ED return visits. Eighty percent are discharged again, and almost one‐fifth of returning patients are admitted to the hospital. Admitted patients tend to be younger, sicker, chronically ill, and live farther from the hospital. By being aware of patients' comorbidities, PCP access, as well as certain diagnoses associated with high rates of return, physicians may better target interventions to optimize care. This may include having a lower threshold for hospitalization at the initial visit for children at high risk of return, and communication with the PCP at the time of discharge to ensure close follow‐up. Our study helps to provide benchmarks around ED revisit rates, and may serve as a starting point to better understand variation in care. Future efforts should aim to find creative solutions at individual institutions, with the goal of disseminating and replicating successes more broadly. For example, investigators in Boston have shown that the use of a comprehensive home‐based asthma management program has been successful in decreasing emergency department visits and hospitalization rates.[53] It is possible that this approach could be spread to other institutions to decrease revisits for patients with asthma. As a next step, the authors have undertaken an investigation to identify hospital‐level characteristics that may be associated with rates of return visits.
Acknowledgements
The authors thank the following members of the PHIS ED Return Visits Research Group for their contributions to the data analysis plan and interpretation of results of this study: Rustin Morse, MD, Children's Medical Center of Dallas; Catherine Perron, MD, Boston Children's Hospital; John Cheng, MD, Children's Healthcare of Atlanta; Shabnam Jain, MD, MPH, Children's Healthcare of Atlanta; and Amanda Montalbano, MD, MPH, Children's Mercy Hospitals and Clinics. These contributors did not receive compensation for their help with this work.
Disclosures
A.T.A. and A.M.S. conceived the study and developed the initial study design. All authors were involved in the development of the final study design and data analysis plan. C.W.T. collected and analyzed the data. A.T.A. and C.W.T. had full access to all of the data and take responsibility for the integrity of the data and the accuracy of the data analysis. All authors were involved in the interpretation of the data. A.T.A. drafted the article, and all authors made critical revisions to the initial draft and subsequent versions. A.T.A. and A.M.S. take full responsibility for the article as a whole. The authors report no conflicts of interest.
- Joint policy statement—guidelines for care of children in the emergency department. Pediatrics. 2009;124:1233–1243.
- , , , , . Return visits to a pediatric emergency department. Pediatr Emerg Care. 2004;20:166–171.
- , . Hospital readmission as an accountability measure. JAMA. 2011;305:504–505.
- , , , et al. Hospital utilization and characteristics of patients experiencing recurrent readmissions within children's hospitals. JAMA. 2011;305:682–690.
- , , , et al. Pediatric readmission prevalence and variability across hospitals. JAMA. 2013;309:372–380.
- . Farewell, and don't come back. Health reform gives hospitals a big incentive to send patients home for good. US News World Rep. 2010;147:20, 22–23.
- . CMS' stealth health reform. Plan to reduce readmissions and boost the continuum of care. Hosp Health Netw. 2008;82:24.
- , . Return visits to the emergency department. J Emerg Med. 1987;5:359–362.
- , , , . Emergency department visits after hospital discharge: a missing part of the equation. Ann Emerg Med. 2013;62:145–150.
- , , , , . Quality indicators for high acuity pediatric conditions. Pediatrics. 2013;132:752–762.
- , . Revisiting hospital readmissions. JAMA. 2013;309:398–400.
- , , . Thirty‐day readmissions: the clock is ticking. JAMA. 2013;309:345–346.
- . Patients seen in emergency departments who had a prior visit within the previous 72 h‐National Hospital Ambulatory Medical Care Survey, 2002. Public Health. 2005;119:914–918.
- , , , , . A national depiction of children with return visits to the emergency department within 72 hours, 2001–2007. Pediatr Emerg Care. 2012;28:606–610.
- , , , et al. How well can hospital readmission be predicted in a cohort of hospitalized children? A retrospective, multicenter study. Pediatrics. 2009;123:286–293.
- , , . Unscheduled return visits to the pediatric emergency department‐one‐year experience. Pediatr Emerg Care. 2006;22:545–549.
- , . Return visits to the emergency department among febrile children 3 to 36 months of age. Pediatr Emerg Care. 2011;27:1126–1129.
- , , , . Pediatric emergency department recidivism: demographic characteristics and diagnostic predictors. J Emerg Nurs. 2006;32:131–138.
- Healthcare Cost and Utilization Project. Pediatric emergency department visits in community hospitals from selected states, 2005. Statistical brief #52. Available at: http://www.ncbi.nlm.nih.gov/books/NBK56039. Accessed October 3, 2013.
- , , , , , . Factors influencing infant visits to emergency departments. Pediatrics. 2000;106:1031–1039.
- , , , . Early pediatric emergency department return visits: a prospective patient‐centric assessment. Clin Pediatr (Phila). 2012;51:651–658.
- , , , , . Unscheduled return visits with and without admission post emergency department discharge. J Emerg Med. 2012;43:1110–1118.
- , , , . Unscheduled revisits to a pediatric emergency department: risk factors for children with fever or infection‐related complaints. Pediatr Emerg Care. 2005;21:816–821.
- , , , , . Unscheduled return visits to the emergency department: consequences for triage. Acad Emerg Med. 2013;20:33–39.
- , , , et al. Repeat pediatric visits to a general emergency department. Ann Emerg Med. 1996;28:467–473.
- , , , , . Emergency department revisits. Ann Emerg Med. 1989;18:964–968.
- US Department of Health 19:70–78.
- , , . Pediatric deaths attributable to complex chronic conditions: a population‐based study of Washington State, 1980–1997. Pediatrics. 2000;106:205–209.
- , , , , , . Deaths attributed to pediatric complex chronic conditions: national trends and implications for supportive care services. Pediatrics. 2001;107:E99.
- , , . Where do children with complex chronic conditions die? Patterns in Washington State, 1980–1998. Pediatrics. 2002;109:656–660.
- Dartmouth Atlas of Health Care. Hospital and physician capacity, 2006. Available at: http://www.dartmouthatlas.org/data/topic/topic.aspx?cat=24. Accessed October 7, 2013.
- Dartmouth Atlas of Health Care. Research methods. What is an HSA/HRR? Available at: http://www.dartmouthatlas.org/tools/faq/researchmethods.aspx. Accessed October 7, 2013,.
- Dartmouth Atlas of Health Care. Appendix on the geography of health care in the United States. Available at: http://www.dartmouthatlas.org/downloads/methods/geogappdx.pdf. Accessed October 7, 2013.
- , , . Emergency department crowding: prioritising quantified crowding measures using a Delphi study. Emerg Med J. 2012;29:868–871.
- , , , , . A new diagnosis grouping system for child emergency department visits. Acad Emerg Med. 2010;17:204–213.
- , , , et al. Effectiveness of emergency department asthma management strategies on return visits in children: a population‐based study. Pediatrics. 2007;120:e1402–e1410.
- , , , . Emergency department patients with diabetes have better glycemic control when they have identifiable primary care providers. Acad Emerg Med. 2012;19:650–655.
- , , , , , Newman L. Impact of socioeconomic status on hospital use in New York City. Health Aff (Millwood). 1993;12:162–173.
- , , , , . Primary care physician supply and children's health care use, access, and outcomes: findings from Canada. Pediatrics. 2010;125:1119–1126.
- , , , et al. Insurance status and access to urgent ambulatory care follow‐up appointments. JAMA. 2005;294:1248–1254.
- , . Emergency departments, Medicaid costs, and access to primary care—understanding the link. N Engl J Med. 2012;366:2141–2143.
- Committee on the Future of Emergency Care in the United States Health System. Emergency Care for Children: Growing Pains. Washington, DC: The National Academies Press; 2007.
- Committee on the Future of Emergency Care in the United States Health System. Hospital‐Based Emergency Care: At the Breaking Point. Washington, DC: The National Academies Press; 2007.
- , . Geographic variation in access to care—the relationship with quality. N Engl J Med. 2012;367:3–6.
- , , , , . Trends and characteristics of US emergency department visits, 1997–2007. JAMA. 2010;304:664–670.
- , , , , . Ambulatory visits to hospital emergency departments. Patterns and reasons for use. 24 Hours in the ED Study Group. JAMA. 1996;276:460–465.
- , , , , . Emergency department workload increase: dependence on primary care? J Emerg Med. 2010;38:279–285.
- Network for Excellence in Health Innovation. Leading healthcare research organizations to examine emergency department overuse. New England Research Institute, 2008. Available at: http://www.nehi.net/news/310‐leading‐health‐care‐research‐organizations‐to‐examine‐emergency‐department‐overuse/view. Accessed October 4, 2013.
- Robert Wood Johnson Foundation. Quality field notes: reducing inappropriate emergency department use. Available at: http://www.rwjf.org/en/research‐publications/find‐rwjf‐research/2013/09/quality‐field‐notes–reducing‐inappropriate‐emergency‐department.html.
- Access of Medicaid recipients to outpatient care. N Engl J Med. 1994;330:1426–1430.
- Medicaid policy statement. Pediatrics. 2013;131:e1697–e1706.
- , , , et al. Community asthma initiative: evaluation of a quality improvement program for comprehensive asthma care. Pediatrics. 2012;129:465–472.
© 2014 Society of Hospital Medicine
