User login
Social Disadvantage, Access to Care, and Disparities in Physical Functioning Among Children Hospitalized with Respiratory Illness
Examining disparities in health-related quality of life (HRQoL) outcomes in children provides a unique patient-centered perspective on pediatric health services equity.1,2 Prior studies have demonstrated the relationship between minority race, low socioeconomic status, and lower maternal education with poorer HRQoL outcomes in children.3-6 Some studies have also shown a dose-response relationship between social disadvantage markers and poorer child health status.7,8 Furthermore, the associations between social disadvantage and poor access to care,9-11 and between poor access to care and lower HRQoL, are also well established.12-14
Examining HRQoL before and after hospitalization can further our understanding of how disparities in HRQoL may change once children engage with the medical system for an acute illness.15 Children requiring hospitalization constitute a useful population for examination of this question as they represent a group of children with variable social disadvantage markers and access to outpatient care.16 Although interventions to address social determinants of health for patients with social disadvantages have been associated with within-group improvements in HRQoL, none have assessed changes in disparities as an outcome.17 Furthermore, many of these studies were conducted in the outpatient setting,18,19 whereas hospitalization provides an additional point of care to address the social determinants of health for vulnerable families.20 Even for short hospitalizations, the 24/7 nature of hospital care provides the opportunity for frequent interactions with clinicians, nurses, and support staff to clarify illness-related questions, discuss other health concerns and unmet needs, and connect with social services or community resources. These opportunities may be particularly important for families with a higher number of social disadvantage markers and even more beneficial to those with difficulty accessing needed care from their primary medical home.
In this study, we focused on children with common respiratory illnesses (asthma, bronchiolitis, and pneumonia), which constitute the majority of childhood hospitalizations.21 Additionally, we only focused on the child’s physical functioning component of HRQoL because this component is most likely to improve after hospitalization for children with an acute respiratory illness.22 A prior study examining HRQoL before and after hospitalization demonstrated that most children return to and/or surpass their baseline physical functioning by 1 month after hospital discharge.23
Our primary objective was to examine associations between several markers of social disadvantage, access to care, and child physical functioning before and after hospitalization for acute respiratory illness. Second, we aimed to understand if access to care (defined as perceived difficulty/delays getting care) acts as an independent predictor of improvement in physical functioning from baseline to follow-up and/or if it modifies the relationship between social disadvantage and improvement in physical functioning (Appendix Figure).
METHODS
Study Design and Population
This study was nested within a multicenter, prospective cohort study of children who were hospitalized for asthma, bronchiolitis, or pneumonia between July 2014 and June 2016 at one of five children’s hospitals in the Pediatric Research in Inpatient Settings Network.24
We approached families for study participation within 72 hours of admission to the hospital using a standard protocol. Patients and their caregivers were eligible to participate in the study if the patient was 2 weeks to 16 years old and if the primary caregiver’s preferred language for medical communication was either English or Spanish. Patients with chronic medical conditions (except asthma), with moderate to severe developmental delay, with a history of prematurity <32 weeks, or who received care in the intensive care unit were excluded. Patients could only participate in the study once.
The study team set out to enroll an even number of patients across all three conditions. If a patient’s discharge diagnosis differed from their admission diagnosis (eg, from bronchiolitis to pneumonia), discharge diagnosis was used for condition group assignment. If the discharge diagnosis was not one of these three respiratory conditions, we excluded the patient from further analysis.
Data Collection
We collected data using two surveys. The first survey was administered within 72 hours of admission. This survey asked questions related to (1) caregiver-reported markers of social disadvantage, (2) caregiver perceptions of access to care, and (3) caregiver- and patient-reported assessments of physical functioning. The second survey was administered within 2 to 8 weeks after the patient’s discharge and included a second assessment of physical functioning.
Social Disadvantage
Patients were considered to have a marker of social disadvantage if their caregiver reported (1) being of non-White race and/or Hispanic ethnicity, (2) primarily speaking a language other than English at home and not speaking English very well (ie, limited English proficiency), (3) attaining at most a high school or equivalent degree, or (4) having a =/<$30,000 annual household income.
Access to Care
We used the following survey item from the 2009-2010 National Survey of Children with Special Health Care Needs25 to measure caregiver perceptions of access to care: “In the last six months, did you have any difficulties or delays getting care for your child because there were waiting lists, backlogs, or other problems getting an appointment?” We narrowed the original assessment time frame from 12 months to 6 months to provide a more proximal assessment of access in relation to the hospitalization.
Child Physical Functioning
We assessed child physical functioning using the physical functioning domain of the Pediatric Quality of Life Inventory (PedsQL) 4.0 Generic Core Scales and PedsQL Infant Scales, which have been validated for use in the inpatient setting.22 Caregivers completed one of these scales based on their child’s age. Assenting patients 8 to 16 years old completed the self-report PedsQL 4.0 Generic Core Scales instrument. When completing the first PedsQL survey, caregivers and patients reflected on the previous month before their child (or they) became ill to obtain a baseline physical functioning assessment.23 When completing the second PedsQL survey, caregivers and patients reflected on the past 7 days to obtain a follow-up assessment.
All study procedures were approved by the Western Institutional Review Board (IRB) or the participating hospitals’ IRB.
Statistical Analysis
Patients with no missing data for all four social disadvantage markers were categorized based on the number of markers they reported: none, one, two, or three or more markers. We combined patients with three and four social disadvantage markers into one group to maximize power for the analyses. We dichotomized the access to care variable and coded response options as “no difficulty/delays accessing care” if the caregiver chose “Never” and “any difficulty/delays accessing care” if they chose “Sometimes/Usually/Always.”
For each patient–caregiver dyad, PedsQL items were scored using a standard method in which higher scores reflected better functioning.22 A single set of PedsQL scores was used for each patient–caregiver dyad. We used self-reported patient scores if the patient completed the PedsQL instrument; otherwise, we used proxy-reported caregiver scores. Intraclass correlations between child self-report and parent proxy-report demonstrate moderate to good agreement above age 8 years.26 We computed a change in the physical functioning score by subtracting the baseline score from the follow-up score. The minimal clinically important difference (MCID) for the PedsQL instrument is 4.5 points, which we used to identify clinically meaningful differences.13
Analysis of variance models were constructed to test for differences in mean baseline and follow-up PedsQL scores (dependent variable) between the following independent variables: (1) social disadvantage groups and (2) those who reported having any difficulty/delays accessing care compared with those who did not. Only patient–caregiver dyads with both baseline and follow-up assessments were included in these analyses. Mixed-effects linear regression models were constructed to identify clinically meaningful differences in PedsQL scores between groups (MCID =/> 4.5) with adjustment for patient age, gender, respiratory condition, days between surveys, and hospital site as fixed effects. Site-specific random effects were included to account for within-hospital clustering. A similarly adjusted mixed-effects linear regression model was constructed to examine whether having any difficulty/delays accessing care modified the association between social disadvantage and PedsQL change scores (eg, an improvement from baseline to follow-up).
Because 17% of respondents had missing data for at least one social disadvantage marker, sensitivity analyses were conducted using multiple imputation to account for missing social disadvantage markers using chained equations.27 Sensitivity analyses were also conducted to adjust for severity of illness using vital sign data within the first 24 hours, which could only be validly captured on patients with asthma within our dataset. By restricting this latter analysis to patients with asthma, we were able to examine the relationships of interest in a population with chronic disease.
RESULTS
The study sample included 1,860 patients, of which 1,325 had both baseline and follow-up PedsQL data (71%). Descriptive statistics were similar between those who completed the baseline and follow-up surveys (Table 1).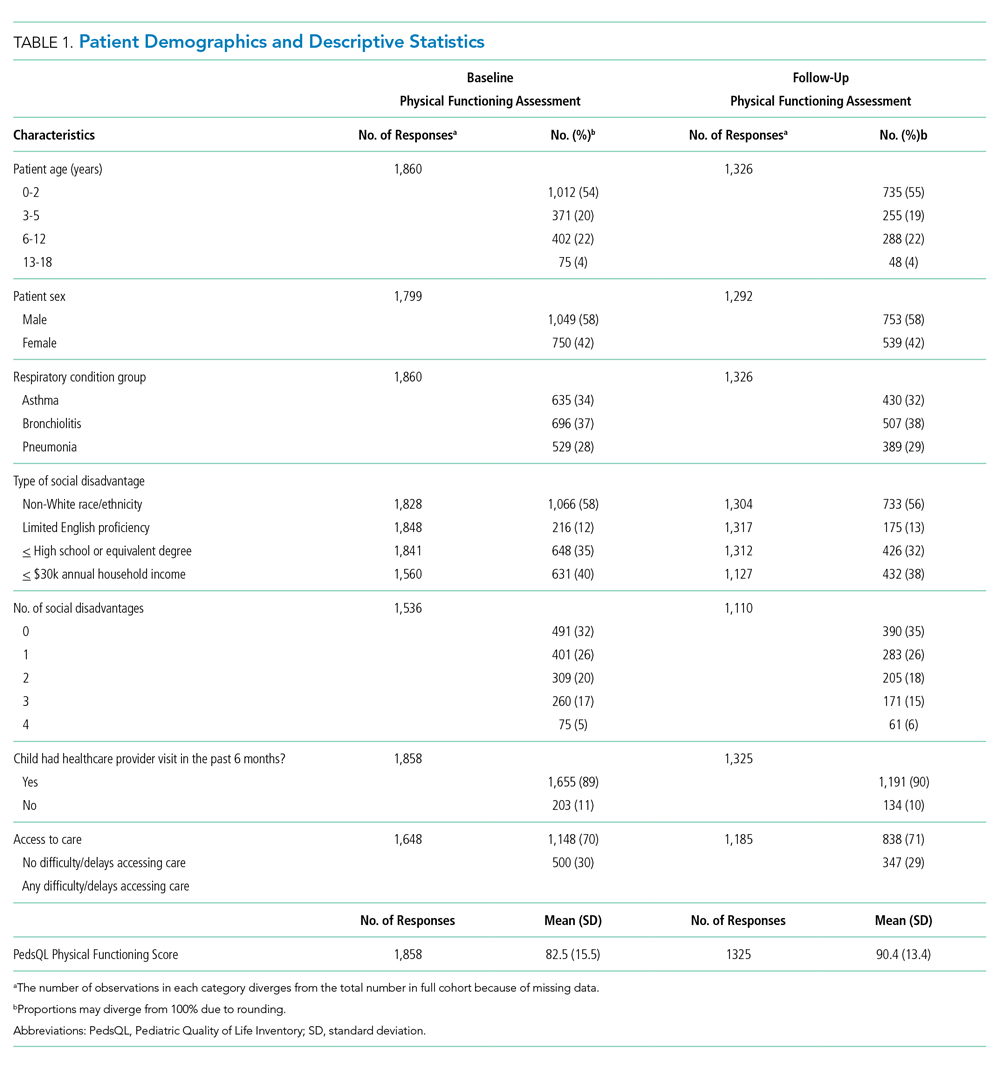
Twenty-two percent of patients had >/=3 social disadvantages and 30% of caregivers reported having any difficulty/delays accessing care. The mean follow-up PedsQL score was higher than the baseline score (90.4 vs 82.5; Table 1).
Social Disadvantage Markers and PedsQL Scores
The number of social disadvantage markers was inversely related to mean baseline PedsQL scores, but there was no difference in mean follow-up PedsQL scores between social disadvantage groups (Table 2). In adjusted analyses, the mean baseline PedsQL score was −6.1 points (95% CI: −8.7, −3.5) lower for patients with >/= 3 social disadvantage markers compared with patients with no social disadvantage markers, which exceeded the scale’s MCID.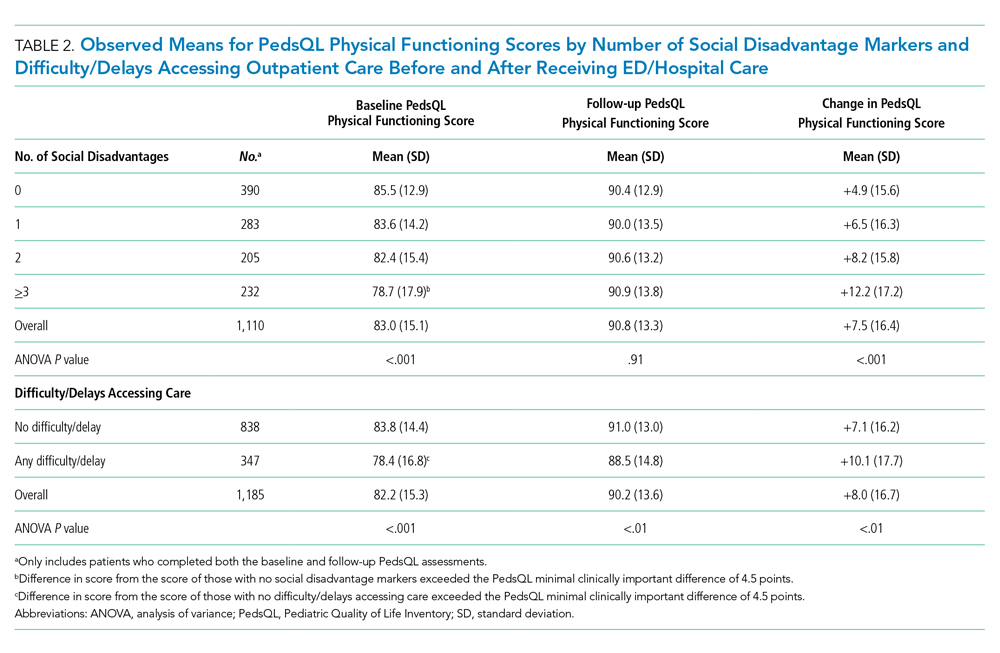
Difficulty/Delays Accessing Care and PedsQL Scores
Having any difficulty/delays accessing care was significantly associated with lower baseline and follow-up PedsQL scores (Table 2). In adjusted analyses, the difference in baseline scores was 5.2 points (95% CI: −7.2, −3.2), which exceedes the scale’s MCID.
Interaction Between Social Disadvantage Markers, Difficulty/Delays Accessing Care, and Change in PedsQL Scores from Baseline to Follow-Up
While having =/>2 social disadvantage markers and difficulty/delays accessing care were each positively associated with changes in PedsQL scores from baseline to follow-up (Table 3), only patients with =/> 3 social disadvantage markers exceeded the PedsQL MCID. In stratified analyses, patients with a combination of social disadvantage makers and difficulties/delays accessing care had lower baseline PedsQL scores and greater change in PedsQL scores from baseline to follow-up compared with those without difficulties/delays accessing care (Figure). However, having any difficulty/delays accessing care did not significantly modify the relationship between social disadvantage and change in PedsQL scores, as none of the interaction terms were significant (Table 3, Model 3).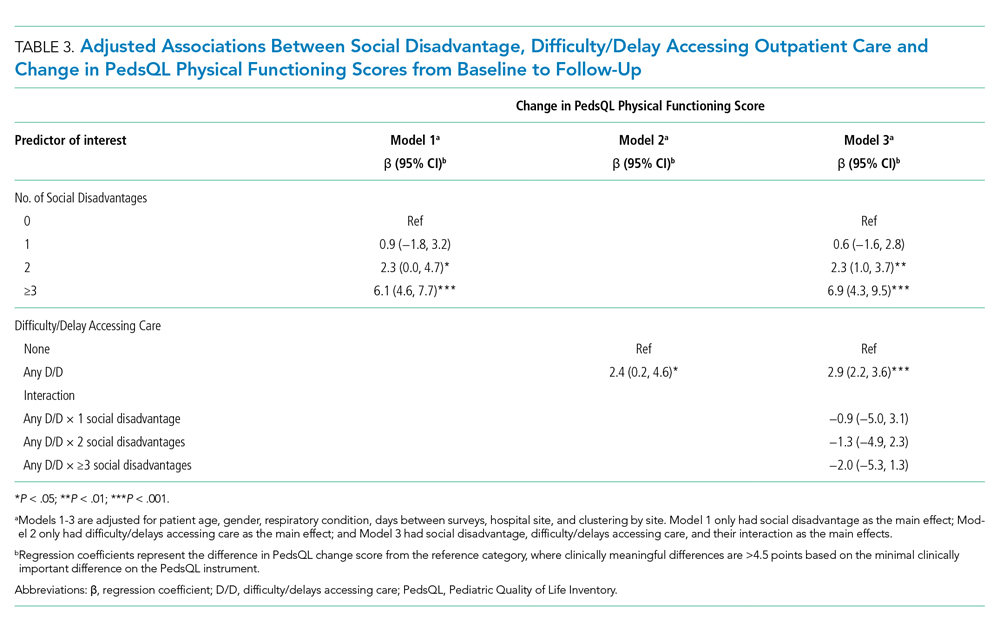
Sensitivity Analysis
Baseline, follow-up, and change in PedsQL scores were similar to our main analysis after performing multiple imputation for missing social disadvantage markers (Supplemental Table 1). Findings were also similar for patients with a diagnosis of asthma only; however, changes in PedsQL scores were greater in magnitude (Appendix Table 2).
DISCUSSION
This study examined the relationship between social disadvantage and child physical functioning before and after hospitalization for acute respiratory illness. Study findings indicated that patients with higher numbers of social disadvantage markers reported lower PedsQL scores before hospitalization; however, differences in PedsQL scores were not apparent after hospitalization. Patients who experienced difficulty/delays accessing care also reported lower PedsQL scores at baseline. This difference was still significant but did not exceed the PedsQL MCID threshold after hospitalization. Difficulty/delays accessing care appeared to be an additional social disadvantage marker; however, it did not modify the relationship between social disadvantage and improvement in physical functioning.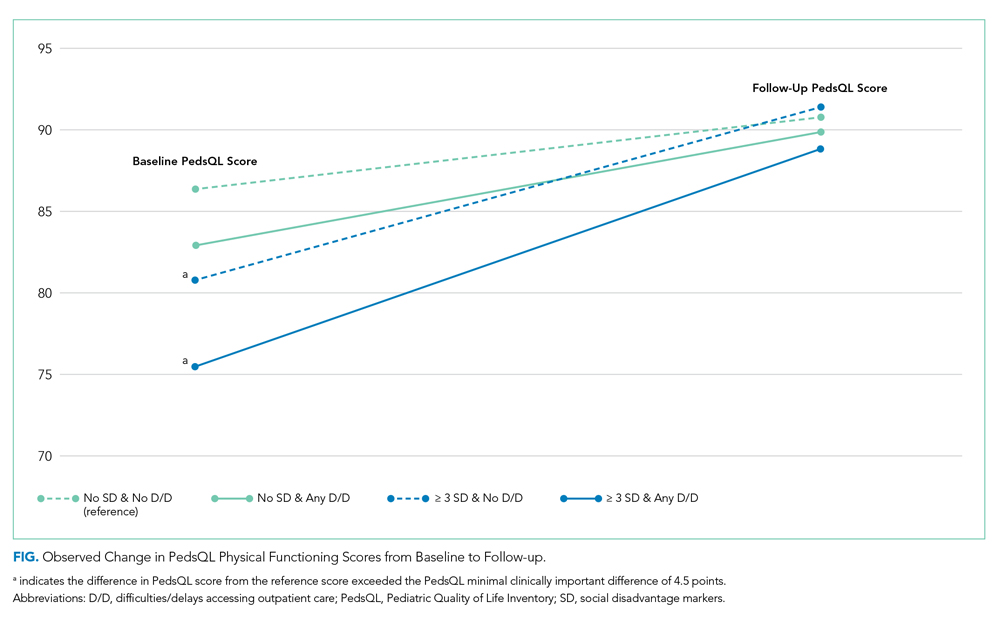
The study findings at baseline are consistent with prior studies demonstrating a negative association between social disadvantage markers and HRQoL and a cumulative effect based on the number of social disadvantages.3,4,7,8 This study adds to the existing literature by examining how this relationship changes after hospitalization. As evidenced by the lack of association between social disadvantage markers and follow-up PedsQL scores, our findings suggest that receipt of inpatient care improved perceptions of physical functioning to a greater extent for patients with more social disadvantage markers (especially patients with =/> 3 social disadvantage markers). There are several potential reasons for these findings.
One possibility is that caregivers and/or patients with more social disadvantage markers are more influenced by context when assessing physical functioning. This could lead to an underestimation of functioning when asked to recall baseline physical functioning at the time of acute illness and overestimation of functioning after recovery from an illness. This possibility is consistent with a form of response bias, extreme response tendencies, in which lower socioeconomic subgroups tend to choose the more extreme response options of a scale.28 In the absence of longitudinal assessments of HRQoL across the care continuum over time, disentangling whether these differences are due to response bias or representative of true changes in physical functioning remains challenging.
Given that disparities in physical functioning at baseline were consistent with prior evidence, another possibility is that hospitalization provided an opportunity to address gaps in access and quality that may have existed for patients with social disadvantage in the community setting. The 24/7 nature of hospital care, usually from a multidisciplinary team of providers, lends itself to opportunities to receive intensive education related to the current illness or to address other health concerns that parents or providers identify during a hospital stay. For example, consistent and repetitive asthma education may be more beneficial to patients and families with more social disadvantage markers. The fact that the association between social disadvantage markers and change in physical functioning scores were greater for patients with asthma supports this reasoning. Hospital care may also provide an opportunity to address other unmet medical needs or psychosocial needs by providing efficient access to subspecialists, social workers, or interpreters. Further research is needed to elucidate whether families received additional services in the hospital setting that were not available to them prior to hospitalization, such as consistent interpreter use, social work engagement, and subspecialty/community referrals. Further studies should also determine whether the provision of equitable medical and social support services is associated with improvements in HRQoL disparities. Additionally, studies should examine whether physical functioning improvements following hospitalization return to baseline levels after a longer period of time and, if so, how we might sustain these reductions in HRQoL disparities. Such studies may identify tangible targets and interventions to reduce disparities in HRQoL for these children.
This study highlights the importance of assessing for difficulty/delays accessing care in addition to social disadvantage markers, as this was also a significant predictor of lower child physical functioning. Differences in PedsQL scores between those who reported any versus no difficulty/delays accessing care were more pronounced at baseline compared with follow-up. A possible reason for these findings is that receiving hospital care may have addressed some access to care issues that were present in the outpatient setting, which resulted in improved perceptions of physical functioning. For example, hospital care may mitigate access to care barriers such as limited after-hours clinic appointments, language barriers, and lack of insurance, thus providing some patients with an alternative pathway to address their health concerns. Alternatively, hospital staff may assist families in scheduling follow-up appointments with the patient’s primary medical home after discharge, which potentially reduced some access to care barriers. The question is whether these disparities will widen once again after a longer follow-up period if families continue facing barriers to accessing needed care in the outpatient setting.
The results of the effect modification analysis demonstrated that the association between social disadvantage and change in PedsQL scores from baseline to follow-up was not significantly different based on a child’s ability to access care. In our stratified analysis, difficulty/delays accessing care added to baseline disparities at each social disadvantage level but did not alter how perceptions of physical functioning change over time. Therefore, physical functioning improvements may rely more heavily on the type of care received within the hospital setting as opposed to accessing care in the first place. However, future studies should examine whether access to high-quality care instead of simply measuring difficulty/delays in accessing care would lead to different results. Access to a comprehensive medical home may be a better measure to assess for effect modification because it measures features beyond access to care, such as continuity, comprehensiveness, communication, and coordination of outpatient care.29-31
If additional studies find evidence that the nature of hospital care, an intensive 24/7 care setting, differentially benefits patients with higher social disadvantage markers (particularly those with =/> 3 markers and chronic illness), this would support the need for systematic screening for social disadvantages or difficulty/delays accessing care in the inpatient setting. Systematic screening could help ensure all patients who may benefit from additional services, such as intensive, culturally tailored education or connections to food, housing, or financial services, will in fact receive them, which may lead to sustained reductions in health disparities.20 Further research into pairing validated screening tools with proven interventions is needed.32
This study has additional limitations aside from those noted above. First, we did not reassess perceived or actual access to care after hospitalization, which may have allowed for analyses to examine access to care as a mediator between social disadvantage and lower child physical functioning. Second, this study included only English- and Spanish-speaking patients and families. Patients with less commonly spoken languages may experience more difficulty accessing or navigating the health system, which may further impact access to care and HRQoL. Third, we had a considerable amount of missing social disadvantage marker data (mainly income); however, our sensitivity analyses did not result in significantly different or clinically meaningful differences in our findings. Insurance status is more feasible to obtain from administrative data and could serve as a proxy for income or as an additional social disadvantage marker in future studies. Finally, we could calculate illness severity only for patients with asthma based on the available data; therefore, we could not adequately control for illness severity across all conditions.
CONCLUSIONS
Social disadvantage was associated with lower child physical functioning before hospitalization, but differences were not apparent after hospitalization for children with acute respiratory illness. Caregiver-perceived difficulty/delays accessing care was found to be an additional predictor of lower physical functioning at baseline but did not significantly alter the association between social disadvantage and improvement in physical functioning over time. Further studies are needed to understand how hospital care may differentially impact child physical functioning for patients with higher social disadvantage makers in order to sustain improvements in HRQoL disparities.
Acknowledgments
The authors thank the following individuals of the Pediatric Respiratory Illness Measurement System (PRIMES) study team for their contributions to this work: Karen M. Wilson, New York, New York; Ricardo A. Quinonez, Houston, Texas; Joyee G. Vachani, Houston, Texas; and Amy Tyler, Aurora, Colorado. We would also like to thank the Pediatric Research in Inpatient Settings Network for facilitating this work.
1. Szilagyi PG, Schor EL. The health of children. Health Serv Res. 1998;33(4 Pt 2):1001-1039.
2. Varni JW, Burwinkle TM, Lane MM. Health-related quality of life measurement in pediatric clinical practice: an appraisal and precept for future research and application. Health Qual Life Outcomes. 2005;3(1):34. https://doi.org/10.1186/1477-7525-3-34.
3. von Rueden U, Gosch A, Rajmil L, Bisegger C, Ravens-Sieberer U. Socioeconomic determinants of health related quality of life in childhood and adolescence: results from a European study. J Epidemiol Community Health. 2006;60(2):130-135. https://doi.org/10.1136/jech.2005.039792.
4. Quittner AL, Schechter MS, Rasouliyan L, Haselkorn T, Pasta DJ, Wagener JS. Impact of socioeconomic status, race, and ethnicity on quality of life in patients with cystic fibrosis in the United States. Chest. 2010;137(3):642-650. https://doi.org/10.1378/chest.09-0345.
5. Flores G, Tomany-Korman SC, Corey CR, Freeman HE, Shapiro MF. Racial and ethnic disparities in medical and dental health, access to care, and use of services in US children. Pediatrics. 2008;121(2):e286-98. https://doi.org/10.1542/peds.2007-1243.
6. Fedele DA, Molzon ES, Eddington AR, Hullmann SE, Mullins LL, Gillaspy SG. Perceived barriers to care in a pediatric medical home: the moderating role of caregiver minority status. Clin Pediatr (Phila). 2014;53(4):351-355. https://doi.org/10.1177/0009922813507994.
7. Larson K, Russ SA, Crall JJ, Halfon N. Influence of multiple social risks on children’s health. Pediatrics. 2008;121(2):337-344. https://doi.org/10.1542/peds.2007-0447.
8. Bauman LJ, Silver EJ, Stein REK. Cumulative social disadvantage and child health. Pediatrics. 2006;117(4):1321-1328. https://doi.org/10.1542/peds.2005-1647.
9. Andrulis DP. Moving beyond the status quo in reducing racial and ethnic disparities in children’s health. Public Health Rep. 2005;120(4):370-377. https://doi.org/10.1177/003335490512000403.
10. Flores G, Lin H. Trends in racial/ethnic disparities in medical and oral health, access to care, and use of services in US children: has anything changed over the years? Int J Equity Health. 2013;12:10. https://doi.org/10.1186/1475-9276-12-10.
11. Seid M, Stevens GD, Varni JW. Parents’ perceptions of pediatric primary care quality: effects of race/ethnicity, language, and access. Health Serv Res. 2003;38(4):1009-1031. https://doi.org/10.1111/1475-6773.00160.
12. Seid M, Varni JW, Cummings L, Schonlau M. The impact of realized access to care on health-related quality of life: a two-year prospective cohort study of children in the California State Children’s Health Insurance Program. J Pediatr. 2006;149(3):354-361. https://doi.org/10.1016/j.jpeds.2006.04.024.
13. Varni JW, Burwinkle TM, Seid M, Skarr D. The PedsQL 4.0 as a pediatric population health measure: feasibility, reliability, and validity. Ambul Pediatr. 2003;3(6):329-341. https://doi.xorg/10.1367/1539-4409(2003)003<0329:tpaapp>2.0.co;2.
14. Simon AE, Chan KS, Forrest CB. Assessment of children’s health-related quality of life in the united states with a multidimensional index. Pediatrics. 2008;121(1):e118-e126. https://doi.org/10.1542/peds.2007-0480.
15. Cheng TL, Emmanuel MA, Levy DJ, Jenkins RR. Child health disparities: what can a clinician do? Pediatrics. 2015;136(5):961-968. https://doi.org/10.1542/peds.2014-4126.
16. Christakis DA, Mell L, Koepsell TD, Zimmerman FJ, Connell FA. Association of lower continuity of care with greater risk of emergency department use and hospitalization in children. Pediatrics. 2001;107(3):524-529. https://doi.org/10.1542/peds.107.3.524.
17. Lion KC, Raphael JL. Partnering health disparities research with quality improvement science in pediatrics. Pediatrics. 2015;135(2):354-361. https://doi.org/10.1542/peds.2014-2982.
18. Williams DR, Costa MV, Odunlami AO, Mohammed SA. Moving upstream: how interventions that address the social determinants of health can improve health and reduce disparities. J Public Health Manag Pract. 2008;14:S8-S17. https://doi.org/10.1097/01.PHH.0000338382.36695.42.
19. Beck AF, Cohen AJ, Colvin JD, et al. Perspectives from the Society for Pediatric Research: interventions targeting social needs in pediatric clinical care. Pediatr Res. 2018;84(1):10-21. https://doi.org/10.1038/s41390-018-0012-1.
20. Shah AN, Simmons J, Beck AF. Adding a vital sign: considering the utility of place-based measures in health care settings. Hosp Pediatr. 2018;8(2):112-114. https://doi.org/10.1542/hpeds.2017-0219.
21. Leyenaar JK, Ralston SL, Shieh M-S, Pekow PS, Mangione-Smith R, Lindenauer PK. Epidemiology of pediatric hospitalizations at general hospitals and freestanding children’s hospitals in the United States. J Hosp Med. 2016;11(11):743-749. https://doi.org/10.1002/jhm.2624.
22. Desai AD, Zhou C, Stanford S, Haaland W, Varni JW, Mangione-Smith RM. Validity and responsiveness of the pediatric quality of life inventory (PedsQL) 4.0 generic core scales in the pediatric inpatient setting. JAMA Pediatr. 2014;168(12):1114-1121. https://doi.org/10.1001/jamapediatrics.2014.1600.
23. Rabbitts JA, Palermo TM, Zhou C, Mangione-Smith R. Pain and health-related quality of life after pediatric inpatient surgery. J Pain. 2015;16(12):1334-1341. https://doi.org/10.1016/j.jpain.2015.09.005.
24. Mangione-Smith R, Zhou C, Williams DJ, et al. Pediatric respiratory illness measurement system (PRIMES) scores and outcomes. Pediatrics. 2019;144(2):e20190242. https://doi.org/10.1542/peds.2019-0242.
25. Child and Adolescent Health Measurement Initiative. National survey of children with special health care needs (NS-CSHCN), 2009-2010. Available at: http://childhealthdata.org/learn/NS-CSHCN/topics_questions. Accessed on September 20, 2018.
26. Varni JW, Limbers CA, Burwinkle TM. How young can children reliably and validly self-report their health-related quality of life?: an analysis of 8,591 children across age subgroups with the PedsQL 4.0 Generic Core Scales. Health Qual Life Outcomes. 2007;5:1. https://doi.org/10.1186/1477-7525-5-1.
27. Buuren S van, Groothuis-Oudshoorn K. Mice: Multivariate imputation by chained equations in R. J Stat Softw. 2011;45(3):1-67. https://doi.org/10.18637/jss.v045.i03.
28. Elliott MN, Haviland AM, Kanouse DE, Hambarsoomian K, Hays RD. Adjusting for subgroup differences in extreme response tendency in ratings of health care: impact on disparity estimates. Heal Serv Res. 2009;44(2 Pt 1):542-561. https://doi.org/10.1111/j.1475-6773.2008.00922.x.
29. Stevens GD, Vane C, Cousineau MR. Association of experiences of medical home quality with health-related quality of life and school engagement among Latino children in low-income families. Health Serv Res. 2011;46(6pt1):1822-1842. https://doi.org/10.1111/j.1475-6773.2011.01292.x.
30. Long WE, Bauchner H, Sege RD, Cabral HJ, Garg A. The value of the medical home for children without special health care needs. Pediatrics. 2012;129(1):87-98. https://doi.org/10.1542/peds.2011-1739.
31. Strickland BB, Jones JR, Ghandour RM, Kogan MD, Newacheck PW. The medical home: health care access and impact for children and youth in the United States. Pediatrics. 2011;127(4):604-611. https://doi.org/10.1542/peds.2009-3555.
32. Sokol R, Austin A, Chandler C, et al. Screening children for social determinants of health: a systematic review. Pediatrics. 2019;144(4):e20191622. https://doi.org/10.1542/peds.2019-1622.
Examining disparities in health-related quality of life (HRQoL) outcomes in children provides a unique patient-centered perspective on pediatric health services equity.1,2 Prior studies have demonstrated the relationship between minority race, low socioeconomic status, and lower maternal education with poorer HRQoL outcomes in children.3-6 Some studies have also shown a dose-response relationship between social disadvantage markers and poorer child health status.7,8 Furthermore, the associations between social disadvantage and poor access to care,9-11 and between poor access to care and lower HRQoL, are also well established.12-14
Examining HRQoL before and after hospitalization can further our understanding of how disparities in HRQoL may change once children engage with the medical system for an acute illness.15 Children requiring hospitalization constitute a useful population for examination of this question as they represent a group of children with variable social disadvantage markers and access to outpatient care.16 Although interventions to address social determinants of health for patients with social disadvantages have been associated with within-group improvements in HRQoL, none have assessed changes in disparities as an outcome.17 Furthermore, many of these studies were conducted in the outpatient setting,18,19 whereas hospitalization provides an additional point of care to address the social determinants of health for vulnerable families.20 Even for short hospitalizations, the 24/7 nature of hospital care provides the opportunity for frequent interactions with clinicians, nurses, and support staff to clarify illness-related questions, discuss other health concerns and unmet needs, and connect with social services or community resources. These opportunities may be particularly important for families with a higher number of social disadvantage markers and even more beneficial to those with difficulty accessing needed care from their primary medical home.
In this study, we focused on children with common respiratory illnesses (asthma, bronchiolitis, and pneumonia), which constitute the majority of childhood hospitalizations.21 Additionally, we only focused on the child’s physical functioning component of HRQoL because this component is most likely to improve after hospitalization for children with an acute respiratory illness.22 A prior study examining HRQoL before and after hospitalization demonstrated that most children return to and/or surpass their baseline physical functioning by 1 month after hospital discharge.23
Our primary objective was to examine associations between several markers of social disadvantage, access to care, and child physical functioning before and after hospitalization for acute respiratory illness. Second, we aimed to understand if access to care (defined as perceived difficulty/delays getting care) acts as an independent predictor of improvement in physical functioning from baseline to follow-up and/or if it modifies the relationship between social disadvantage and improvement in physical functioning (Appendix Figure).
METHODS
Study Design and Population
This study was nested within a multicenter, prospective cohort study of children who were hospitalized for asthma, bronchiolitis, or pneumonia between July 2014 and June 2016 at one of five children’s hospitals in the Pediatric Research in Inpatient Settings Network.24
We approached families for study participation within 72 hours of admission to the hospital using a standard protocol. Patients and their caregivers were eligible to participate in the study if the patient was 2 weeks to 16 years old and if the primary caregiver’s preferred language for medical communication was either English or Spanish. Patients with chronic medical conditions (except asthma), with moderate to severe developmental delay, with a history of prematurity <32 weeks, or who received care in the intensive care unit were excluded. Patients could only participate in the study once.
The study team set out to enroll an even number of patients across all three conditions. If a patient’s discharge diagnosis differed from their admission diagnosis (eg, from bronchiolitis to pneumonia), discharge diagnosis was used for condition group assignment. If the discharge diagnosis was not one of these three respiratory conditions, we excluded the patient from further analysis.
Data Collection
We collected data using two surveys. The first survey was administered within 72 hours of admission. This survey asked questions related to (1) caregiver-reported markers of social disadvantage, (2) caregiver perceptions of access to care, and (3) caregiver- and patient-reported assessments of physical functioning. The second survey was administered within 2 to 8 weeks after the patient’s discharge and included a second assessment of physical functioning.
Social Disadvantage
Patients were considered to have a marker of social disadvantage if their caregiver reported (1) being of non-White race and/or Hispanic ethnicity, (2) primarily speaking a language other than English at home and not speaking English very well (ie, limited English proficiency), (3) attaining at most a high school or equivalent degree, or (4) having a =/<$30,000 annual household income.
Access to Care
We used the following survey item from the 2009-2010 National Survey of Children with Special Health Care Needs25 to measure caregiver perceptions of access to care: “In the last six months, did you have any difficulties or delays getting care for your child because there were waiting lists, backlogs, or other problems getting an appointment?” We narrowed the original assessment time frame from 12 months to 6 months to provide a more proximal assessment of access in relation to the hospitalization.
Child Physical Functioning
We assessed child physical functioning using the physical functioning domain of the Pediatric Quality of Life Inventory (PedsQL) 4.0 Generic Core Scales and PedsQL Infant Scales, which have been validated for use in the inpatient setting.22 Caregivers completed one of these scales based on their child’s age. Assenting patients 8 to 16 years old completed the self-report PedsQL 4.0 Generic Core Scales instrument. When completing the first PedsQL survey, caregivers and patients reflected on the previous month before their child (or they) became ill to obtain a baseline physical functioning assessment.23 When completing the second PedsQL survey, caregivers and patients reflected on the past 7 days to obtain a follow-up assessment.
All study procedures were approved by the Western Institutional Review Board (IRB) or the participating hospitals’ IRB.
Statistical Analysis
Patients with no missing data for all four social disadvantage markers were categorized based on the number of markers they reported: none, one, two, or three or more markers. We combined patients with three and four social disadvantage markers into one group to maximize power for the analyses. We dichotomized the access to care variable and coded response options as “no difficulty/delays accessing care” if the caregiver chose “Never” and “any difficulty/delays accessing care” if they chose “Sometimes/Usually/Always.”
For each patient–caregiver dyad, PedsQL items were scored using a standard method in which higher scores reflected better functioning.22 A single set of PedsQL scores was used for each patient–caregiver dyad. We used self-reported patient scores if the patient completed the PedsQL instrument; otherwise, we used proxy-reported caregiver scores. Intraclass correlations between child self-report and parent proxy-report demonstrate moderate to good agreement above age 8 years.26 We computed a change in the physical functioning score by subtracting the baseline score from the follow-up score. The minimal clinically important difference (MCID) for the PedsQL instrument is 4.5 points, which we used to identify clinically meaningful differences.13
Analysis of variance models were constructed to test for differences in mean baseline and follow-up PedsQL scores (dependent variable) between the following independent variables: (1) social disadvantage groups and (2) those who reported having any difficulty/delays accessing care compared with those who did not. Only patient–caregiver dyads with both baseline and follow-up assessments were included in these analyses. Mixed-effects linear regression models were constructed to identify clinically meaningful differences in PedsQL scores between groups (MCID =/> 4.5) with adjustment for patient age, gender, respiratory condition, days between surveys, and hospital site as fixed effects. Site-specific random effects were included to account for within-hospital clustering. A similarly adjusted mixed-effects linear regression model was constructed to examine whether having any difficulty/delays accessing care modified the association between social disadvantage and PedsQL change scores (eg, an improvement from baseline to follow-up).
Because 17% of respondents had missing data for at least one social disadvantage marker, sensitivity analyses were conducted using multiple imputation to account for missing social disadvantage markers using chained equations.27 Sensitivity analyses were also conducted to adjust for severity of illness using vital sign data within the first 24 hours, which could only be validly captured on patients with asthma within our dataset. By restricting this latter analysis to patients with asthma, we were able to examine the relationships of interest in a population with chronic disease.
RESULTS
The study sample included 1,860 patients, of which 1,325 had both baseline and follow-up PedsQL data (71%). Descriptive statistics were similar between those who completed the baseline and follow-up surveys (Table 1).
Twenty-two percent of patients had >/=3 social disadvantages and 30% of caregivers reported having any difficulty/delays accessing care. The mean follow-up PedsQL score was higher than the baseline score (90.4 vs 82.5; Table 1).
Social Disadvantage Markers and PedsQL Scores
The number of social disadvantage markers was inversely related to mean baseline PedsQL scores, but there was no difference in mean follow-up PedsQL scores between social disadvantage groups (Table 2). In adjusted analyses, the mean baseline PedsQL score was −6.1 points (95% CI: −8.7, −3.5) lower for patients with >/= 3 social disadvantage markers compared with patients with no social disadvantage markers, which exceeded the scale’s MCID.
Difficulty/Delays Accessing Care and PedsQL Scores
Having any difficulty/delays accessing care was significantly associated with lower baseline and follow-up PedsQL scores (Table 2). In adjusted analyses, the difference in baseline scores was 5.2 points (95% CI: −7.2, −3.2), which exceedes the scale’s MCID.
Interaction Between Social Disadvantage Markers, Difficulty/Delays Accessing Care, and Change in PedsQL Scores from Baseline to Follow-Up
While having =/>2 social disadvantage markers and difficulty/delays accessing care were each positively associated with changes in PedsQL scores from baseline to follow-up (Table 3), only patients with =/> 3 social disadvantage markers exceeded the PedsQL MCID. In stratified analyses, patients with a combination of social disadvantage makers and difficulties/delays accessing care had lower baseline PedsQL scores and greater change in PedsQL scores from baseline to follow-up compared with those without difficulties/delays accessing care (Figure). However, having any difficulty/delays accessing care did not significantly modify the relationship between social disadvantage and change in PedsQL scores, as none of the interaction terms were significant (Table 3, Model 3).
Sensitivity Analysis
Baseline, follow-up, and change in PedsQL scores were similar to our main analysis after performing multiple imputation for missing social disadvantage markers (Supplemental Table 1). Findings were also similar for patients with a diagnosis of asthma only; however, changes in PedsQL scores were greater in magnitude (Appendix Table 2).
DISCUSSION
This study examined the relationship between social disadvantage and child physical functioning before and after hospitalization for acute respiratory illness. Study findings indicated that patients with higher numbers of social disadvantage markers reported lower PedsQL scores before hospitalization; however, differences in PedsQL scores were not apparent after hospitalization. Patients who experienced difficulty/delays accessing care also reported lower PedsQL scores at baseline. This difference was still significant but did not exceed the PedsQL MCID threshold after hospitalization. Difficulty/delays accessing care appeared to be an additional social disadvantage marker; however, it did not modify the relationship between social disadvantage and improvement in physical functioning.
The study findings at baseline are consistent with prior studies demonstrating a negative association between social disadvantage markers and HRQoL and a cumulative effect based on the number of social disadvantages.3,4,7,8 This study adds to the existing literature by examining how this relationship changes after hospitalization. As evidenced by the lack of association between social disadvantage markers and follow-up PedsQL scores, our findings suggest that receipt of inpatient care improved perceptions of physical functioning to a greater extent for patients with more social disadvantage markers (especially patients with =/> 3 social disadvantage markers). There are several potential reasons for these findings.
One possibility is that caregivers and/or patients with more social disadvantage markers are more influenced by context when assessing physical functioning. This could lead to an underestimation of functioning when asked to recall baseline physical functioning at the time of acute illness and overestimation of functioning after recovery from an illness. This possibility is consistent with a form of response bias, extreme response tendencies, in which lower socioeconomic subgroups tend to choose the more extreme response options of a scale.28 In the absence of longitudinal assessments of HRQoL across the care continuum over time, disentangling whether these differences are due to response bias or representative of true changes in physical functioning remains challenging.
Given that disparities in physical functioning at baseline were consistent with prior evidence, another possibility is that hospitalization provided an opportunity to address gaps in access and quality that may have existed for patients with social disadvantage in the community setting. The 24/7 nature of hospital care, usually from a multidisciplinary team of providers, lends itself to opportunities to receive intensive education related to the current illness or to address other health concerns that parents or providers identify during a hospital stay. For example, consistent and repetitive asthma education may be more beneficial to patients and families with more social disadvantage markers. The fact that the association between social disadvantage markers and change in physical functioning scores were greater for patients with asthma supports this reasoning. Hospital care may also provide an opportunity to address other unmet medical needs or psychosocial needs by providing efficient access to subspecialists, social workers, or interpreters. Further research is needed to elucidate whether families received additional services in the hospital setting that were not available to them prior to hospitalization, such as consistent interpreter use, social work engagement, and subspecialty/community referrals. Further studies should also determine whether the provision of equitable medical and social support services is associated with improvements in HRQoL disparities. Additionally, studies should examine whether physical functioning improvements following hospitalization return to baseline levels after a longer period of time and, if so, how we might sustain these reductions in HRQoL disparities. Such studies may identify tangible targets and interventions to reduce disparities in HRQoL for these children.
This study highlights the importance of assessing for difficulty/delays accessing care in addition to social disadvantage markers, as this was also a significant predictor of lower child physical functioning. Differences in PedsQL scores between those who reported any versus no difficulty/delays accessing care were more pronounced at baseline compared with follow-up. A possible reason for these findings is that receiving hospital care may have addressed some access to care issues that were present in the outpatient setting, which resulted in improved perceptions of physical functioning. For example, hospital care may mitigate access to care barriers such as limited after-hours clinic appointments, language barriers, and lack of insurance, thus providing some patients with an alternative pathway to address their health concerns. Alternatively, hospital staff may assist families in scheduling follow-up appointments with the patient’s primary medical home after discharge, which potentially reduced some access to care barriers. The question is whether these disparities will widen once again after a longer follow-up period if families continue facing barriers to accessing needed care in the outpatient setting.
The results of the effect modification analysis demonstrated that the association between social disadvantage and change in PedsQL scores from baseline to follow-up was not significantly different based on a child’s ability to access care. In our stratified analysis, difficulty/delays accessing care added to baseline disparities at each social disadvantage level but did not alter how perceptions of physical functioning change over time. Therefore, physical functioning improvements may rely more heavily on the type of care received within the hospital setting as opposed to accessing care in the first place. However, future studies should examine whether access to high-quality care instead of simply measuring difficulty/delays in accessing care would lead to different results. Access to a comprehensive medical home may be a better measure to assess for effect modification because it measures features beyond access to care, such as continuity, comprehensiveness, communication, and coordination of outpatient care.29-31
If additional studies find evidence that the nature of hospital care, an intensive 24/7 care setting, differentially benefits patients with higher social disadvantage markers (particularly those with =/> 3 markers and chronic illness), this would support the need for systematic screening for social disadvantages or difficulty/delays accessing care in the inpatient setting. Systematic screening could help ensure all patients who may benefit from additional services, such as intensive, culturally tailored education or connections to food, housing, or financial services, will in fact receive them, which may lead to sustained reductions in health disparities.20 Further research into pairing validated screening tools with proven interventions is needed.32
This study has additional limitations aside from those noted above. First, we did not reassess perceived or actual access to care after hospitalization, which may have allowed for analyses to examine access to care as a mediator between social disadvantage and lower child physical functioning. Second, this study included only English- and Spanish-speaking patients and families. Patients with less commonly spoken languages may experience more difficulty accessing or navigating the health system, which may further impact access to care and HRQoL. Third, we had a considerable amount of missing social disadvantage marker data (mainly income); however, our sensitivity analyses did not result in significantly different or clinically meaningful differences in our findings. Insurance status is more feasible to obtain from administrative data and could serve as a proxy for income or as an additional social disadvantage marker in future studies. Finally, we could calculate illness severity only for patients with asthma based on the available data; therefore, we could not adequately control for illness severity across all conditions.
CONCLUSIONS
Social disadvantage was associated with lower child physical functioning before hospitalization, but differences were not apparent after hospitalization for children with acute respiratory illness. Caregiver-perceived difficulty/delays accessing care was found to be an additional predictor of lower physical functioning at baseline but did not significantly alter the association between social disadvantage and improvement in physical functioning over time. Further studies are needed to understand how hospital care may differentially impact child physical functioning for patients with higher social disadvantage makers in order to sustain improvements in HRQoL disparities.
Acknowledgments
The authors thank the following individuals of the Pediatric Respiratory Illness Measurement System (PRIMES) study team for their contributions to this work: Karen M. Wilson, New York, New York; Ricardo A. Quinonez, Houston, Texas; Joyee G. Vachani, Houston, Texas; and Amy Tyler, Aurora, Colorado. We would also like to thank the Pediatric Research in Inpatient Settings Network for facilitating this work.
1. Szilagyi PG, Schor EL. The health of children. Health Serv Res. 1998;33(4 Pt 2):1001-1039.
2. Varni JW, Burwinkle TM, Lane MM. Health-related quality of life measurement in pediatric clinical practice: an appraisal and precept for future research and application. Health Qual Life Outcomes. 2005;3(1):34. https://doi.org/10.1186/1477-7525-3-34.
3. von Rueden U, Gosch A, Rajmil L, Bisegger C, Ravens-Sieberer U. Socioeconomic determinants of health related quality of life in childhood and adolescence: results from a European study. J Epidemiol Community Health. 2006;60(2):130-135. https://doi.org/10.1136/jech.2005.039792.
4. Quittner AL, Schechter MS, Rasouliyan L, Haselkorn T, Pasta DJ, Wagener JS. Impact of socioeconomic status, race, and ethnicity on quality of life in patients with cystic fibrosis in the United States. Chest. 2010;137(3):642-650. https://doi.org/10.1378/chest.09-0345.
5. Flores G, Tomany-Korman SC, Corey CR, Freeman HE, Shapiro MF. Racial and ethnic disparities in medical and dental health, access to care, and use of services in US children. Pediatrics. 2008;121(2):e286-98. https://doi.org/10.1542/peds.2007-1243.
6. Fedele DA, Molzon ES, Eddington AR, Hullmann SE, Mullins LL, Gillaspy SG. Perceived barriers to care in a pediatric medical home: the moderating role of caregiver minority status. Clin Pediatr (Phila). 2014;53(4):351-355. https://doi.org/10.1177/0009922813507994.
7. Larson K, Russ SA, Crall JJ, Halfon N. Influence of multiple social risks on children’s health. Pediatrics. 2008;121(2):337-344. https://doi.org/10.1542/peds.2007-0447.
8. Bauman LJ, Silver EJ, Stein REK. Cumulative social disadvantage and child health. Pediatrics. 2006;117(4):1321-1328. https://doi.org/10.1542/peds.2005-1647.
9. Andrulis DP. Moving beyond the status quo in reducing racial and ethnic disparities in children’s health. Public Health Rep. 2005;120(4):370-377. https://doi.org/10.1177/003335490512000403.
10. Flores G, Lin H. Trends in racial/ethnic disparities in medical and oral health, access to care, and use of services in US children: has anything changed over the years? Int J Equity Health. 2013;12:10. https://doi.org/10.1186/1475-9276-12-10.
11. Seid M, Stevens GD, Varni JW. Parents’ perceptions of pediatric primary care quality: effects of race/ethnicity, language, and access. Health Serv Res. 2003;38(4):1009-1031. https://doi.org/10.1111/1475-6773.00160.
12. Seid M, Varni JW, Cummings L, Schonlau M. The impact of realized access to care on health-related quality of life: a two-year prospective cohort study of children in the California State Children’s Health Insurance Program. J Pediatr. 2006;149(3):354-361. https://doi.org/10.1016/j.jpeds.2006.04.024.
13. Varni JW, Burwinkle TM, Seid M, Skarr D. The PedsQL 4.0 as a pediatric population health measure: feasibility, reliability, and validity. Ambul Pediatr. 2003;3(6):329-341. https://doi.xorg/10.1367/1539-4409(2003)003<0329:tpaapp>2.0.co;2.
14. Simon AE, Chan KS, Forrest CB. Assessment of children’s health-related quality of life in the united states with a multidimensional index. Pediatrics. 2008;121(1):e118-e126. https://doi.org/10.1542/peds.2007-0480.
15. Cheng TL, Emmanuel MA, Levy DJ, Jenkins RR. Child health disparities: what can a clinician do? Pediatrics. 2015;136(5):961-968. https://doi.org/10.1542/peds.2014-4126.
16. Christakis DA, Mell L, Koepsell TD, Zimmerman FJ, Connell FA. Association of lower continuity of care with greater risk of emergency department use and hospitalization in children. Pediatrics. 2001;107(3):524-529. https://doi.org/10.1542/peds.107.3.524.
17. Lion KC, Raphael JL. Partnering health disparities research with quality improvement science in pediatrics. Pediatrics. 2015;135(2):354-361. https://doi.org/10.1542/peds.2014-2982.
18. Williams DR, Costa MV, Odunlami AO, Mohammed SA. Moving upstream: how interventions that address the social determinants of health can improve health and reduce disparities. J Public Health Manag Pract. 2008;14:S8-S17. https://doi.org/10.1097/01.PHH.0000338382.36695.42.
19. Beck AF, Cohen AJ, Colvin JD, et al. Perspectives from the Society for Pediatric Research: interventions targeting social needs in pediatric clinical care. Pediatr Res. 2018;84(1):10-21. https://doi.org/10.1038/s41390-018-0012-1.
20. Shah AN, Simmons J, Beck AF. Adding a vital sign: considering the utility of place-based measures in health care settings. Hosp Pediatr. 2018;8(2):112-114. https://doi.org/10.1542/hpeds.2017-0219.
21. Leyenaar JK, Ralston SL, Shieh M-S, Pekow PS, Mangione-Smith R, Lindenauer PK. Epidemiology of pediatric hospitalizations at general hospitals and freestanding children’s hospitals in the United States. J Hosp Med. 2016;11(11):743-749. https://doi.org/10.1002/jhm.2624.
22. Desai AD, Zhou C, Stanford S, Haaland W, Varni JW, Mangione-Smith RM. Validity and responsiveness of the pediatric quality of life inventory (PedsQL) 4.0 generic core scales in the pediatric inpatient setting. JAMA Pediatr. 2014;168(12):1114-1121. https://doi.org/10.1001/jamapediatrics.2014.1600.
23. Rabbitts JA, Palermo TM, Zhou C, Mangione-Smith R. Pain and health-related quality of life after pediatric inpatient surgery. J Pain. 2015;16(12):1334-1341. https://doi.org/10.1016/j.jpain.2015.09.005.
24. Mangione-Smith R, Zhou C, Williams DJ, et al. Pediatric respiratory illness measurement system (PRIMES) scores and outcomes. Pediatrics. 2019;144(2):e20190242. https://doi.org/10.1542/peds.2019-0242.
25. Child and Adolescent Health Measurement Initiative. National survey of children with special health care needs (NS-CSHCN), 2009-2010. Available at: http://childhealthdata.org/learn/NS-CSHCN/topics_questions. Accessed on September 20, 2018.
26. Varni JW, Limbers CA, Burwinkle TM. How young can children reliably and validly self-report their health-related quality of life?: an analysis of 8,591 children across age subgroups with the PedsQL 4.0 Generic Core Scales. Health Qual Life Outcomes. 2007;5:1. https://doi.org/10.1186/1477-7525-5-1.
27. Buuren S van, Groothuis-Oudshoorn K. Mice: Multivariate imputation by chained equations in R. J Stat Softw. 2011;45(3):1-67. https://doi.org/10.18637/jss.v045.i03.
28. Elliott MN, Haviland AM, Kanouse DE, Hambarsoomian K, Hays RD. Adjusting for subgroup differences in extreme response tendency in ratings of health care: impact on disparity estimates. Heal Serv Res. 2009;44(2 Pt 1):542-561. https://doi.org/10.1111/j.1475-6773.2008.00922.x.
29. Stevens GD, Vane C, Cousineau MR. Association of experiences of medical home quality with health-related quality of life and school engagement among Latino children in low-income families. Health Serv Res. 2011;46(6pt1):1822-1842. https://doi.org/10.1111/j.1475-6773.2011.01292.x.
30. Long WE, Bauchner H, Sege RD, Cabral HJ, Garg A. The value of the medical home for children without special health care needs. Pediatrics. 2012;129(1):87-98. https://doi.org/10.1542/peds.2011-1739.
31. Strickland BB, Jones JR, Ghandour RM, Kogan MD, Newacheck PW. The medical home: health care access and impact for children and youth in the United States. Pediatrics. 2011;127(4):604-611. https://doi.org/10.1542/peds.2009-3555.
32. Sokol R, Austin A, Chandler C, et al. Screening children for social determinants of health: a systematic review. Pediatrics. 2019;144(4):e20191622. https://doi.org/10.1542/peds.2019-1622.
© 2020 Society of Hospital Medicine
Nephrotoxin-Related Acute Kidney Injury and Predicting High-Risk Medication Combinations in the Hospitalized Child
Acute kidney injury (AKI) is increasingly common in the hospitalized patient1,2 with recent adult and pediatric multinational studies reporting AKI rates of 57% and 27%, respectively.3,4 The development of AKI is associated with significant adverse outcomes including an increased risk of mortality.5-7 For those that survive, the history of AKI may contribute to a lifetime of impaired health with chronic kidney disease.8,9 This is particularly concerning for pediatric patients as AKI may impact morbidity for many decades, influence available therapies for these morbidities, and ultimately contribute to a shortened lifespan.10
AKI in the hospitalized patient is no longer accepted as an unfortunate and unavoidable consequence of illness or the indicated therapy. Currently, there is strong interest in this hospital-acquired condition with global initiatives aimed at increased prevention and early detection and treatment of AKI.11,12 To this objective, risk stratification tools or prediction models could assist clinicians in decision making. Numerous studies have tested AKI prediction models either in particular high-risk populations or based on associated comorbidities, biomarkers, and critical illness scores. These studies are predominantly in adult populations, and few have been externally validated.13 While associations between certain medications and AKI are well known, an AKI prediction model that is applicable to pediatric or adult populations and is based on medication exposure is difficult. However, there is a growing recognition of the potential to develop such a model using the electronic health record (EHR).14
In 2013, Seattle Children’s Hospital (SCH) implemented a nephrotoxin and AKI detection system to assist in clinical decision making within the EHR. This system instituted the automatic ordering of serum creatinines to screen for AKI when the provider ordered three or more medications that were suspected to be nephrotoxic. Other clinical factors such as the diagnoses or preexisting conditions were not considered in the decision-tool algorithm. This original algorithm (Algorithm 1) was later modified and the list of suspected nephrotoxins was expanded (Table 1) in order to align with a national pediatric AKI collaborative (Algorithm 2). However, it was unclear whether the algorithm modification would improve AKI detection.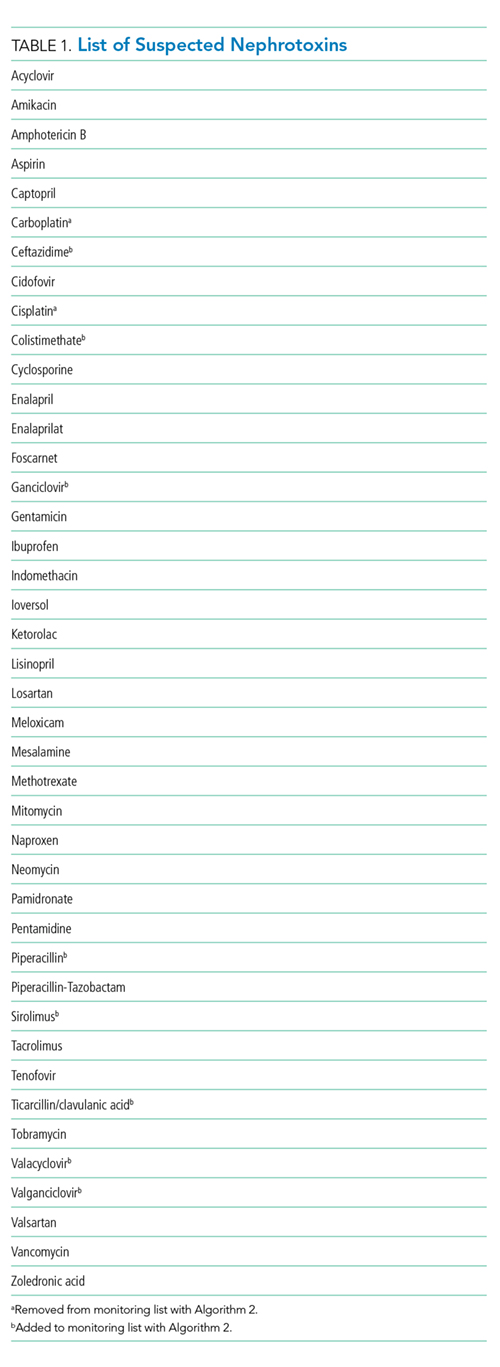
The present study had two objectives. The first was to evaluate the impact of the modifications on the sensitivity and specificity of our system. The second objective, if either the sensitivity or specificity was determined to be suboptimal, was to develop an improved model for nephrotoxin-related AKI detection. Having either the sensitivity or the specificity under 50% would be equivalent to or worse than a random guess, which we would consider unacceptable.
METHODS
Context
SCH is a tertiary care academic teaching hospital affiliated with the University of Washington School of Medicine, Harborview Medical Center, and the Seattle Cancer Care Alliance. The hospital has 371 licensed beds and approximately 18 medical subspecialty services.
Study Population
This was a retrospective cohort study examining all patients ages 0-21 years admitted to SCH between December 1, 2013 and November 30, 2015. The detection system was modified to align with the national pediatric AKI collaborative, Nephrotoxic Injury Negated by Just-in-Time Action (NINJA) in November 2014. Both acute care and intensive care patients were included (data not separated by location). Patients who had end-stage kidney disease and were receiving dialysis and patients who were evaluated in the emergency department without being admitted or admitted as observation status were excluded from analysis. Patients were also excluded if they did not have a baseline serum creatinine as defined below.
Study Measures
AKI is defined at SCH using the Kidney Disease: Improving Global Outcomes Stage 1 criteria as a guideline. The diagnosis of AKI is based on an increase in the baseline serum creatinine by 0.3 mg/dL or an increase in the serum creatinine by >1.5 times the baseline assuming the incoming creatinine is 0.5 mg/dL or higher. For our definition, the increase in serum creatinine needs to have occurred within a one-week timeframe and urine output is not a diagnostic criterion.15 Baseline serum creatinine is defined as the lowest serum creatinine in the previous six months. Forty medications were classified as nephrotoxins based on previous analysis16 and adapted for our institutional formulary.
Statistical Analysis
To evaluate the efficacy of our systems in detecting nephrotoxin-related AKI, the sensitivity and the specificity using both our original algorithm (Algorithm 1) and the modified algorithm (Algorithm 2) were generated on our complete data set. To test sensitivity, the proportion of AKI patients who would trigger alert using Algorithm 1 and then with Algorithm 2 was identified. Similarly, to test specificity, the proportion of non-AKI patients who did not trigger an alert by the surveillance systems was identified. The differences in sensitivity and specificity between the two algorithms were evaluated using two-sample tests of proportion.
The statistical method of Combinatorial Inference has been utilized in studies of cancer biology17 and in genomics.18 A variation of this approach was used in this study to identify the specific medication combinations most associated with AKI. First, all of the nephrotoxic medications and medication combinations that were prescribed during our study period were identified from a data set (ie, a training set) containing 75% of all encounters selected at random without replacement. Using this training set, the prevalence of each medication combination and the rate of AKI associated with each combination were identified. The predicted overall AKI risk of an individual medication is the average of all the AKI rates associated with each combination containing that specific medication. Also incorporated into the determination of the predicted AKI risk was the prevalence of that medication combination.
To test our model’s predictive capability, the algorithm was applied to the remaining 25% of the total patient data (ie, the test set). The predicted AKI risk was compared with the actual AKI rate in the test data set. Our model’s predictive capability was represented in a receiver operator characteristic (ROC) analysis. The goal was to achieve an area under the ROC curve (AUC) approaching one as this would reflect 100% sensitivity and 100% specificity, whereas an AUC of 0.5 would represent a random guess (50% chance of being correct).
Lastly, our final step was to use our model’s ROC curve to determine an optimal threshold of AKI risk for which to trigger an alert. This predicted risk threshold was based on our goal to increase our surveillance system’s sensitivity balanced with maintaining an acceptable specificity.
An a priori threshold of P = .05 was used to determine statistical significance of all results. Analyses were conducted in Stata 12.1 (StataCorp LP, College Station, Texas) and R 3.3.2 (R Foundation for Statistical Computing, Vienna, Austria). A sample data set containing replication code for our model can be found in an online repository (https://dataverse.harvard.edu/dataverse/chuan). This study was approved by the Seattle Children’s Institutional Review Board.
RESULTS
Sensitivity and Specificity
Of the patient encounters, 14,779 were eligible during the study period. The sensitivity of the system’s ability to identify nephrotoxin-related AKI decreased from 46.9% using Algorithm 1 to 43.3% using Algorithm 2, a change of 3.6% (P = .22). The specificity increased from 73.6% to 89.3%, a change of 15.7% (P < .001; Table 2).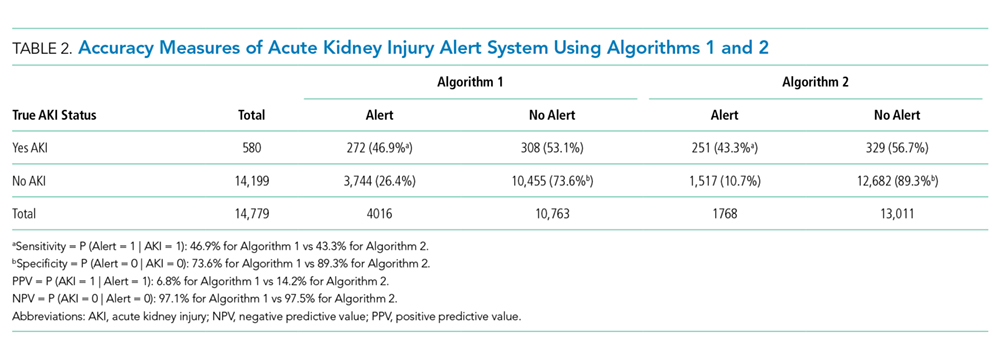
Improvement of Our Nephrotoxin-Related AKI Detection System Using a Novel AKI Prediction Strategy
A total of 838 medication combinations were identified in our training set and the predicted AKI risk for every medication combination was determined. By comparing the predicted risk of AKI to the actual AKI occurrence, an ROC curve with an AUC of 0.756 (Figure) was generated. An increase in system sensitivity was prioritized when determining the optimal AKI risk at which the model would trigger an alert. Setting an alert threshold at a predicted AKI risk of >8%, our model performed with a sensitivity of 74% while decreasing the specificity to 70%.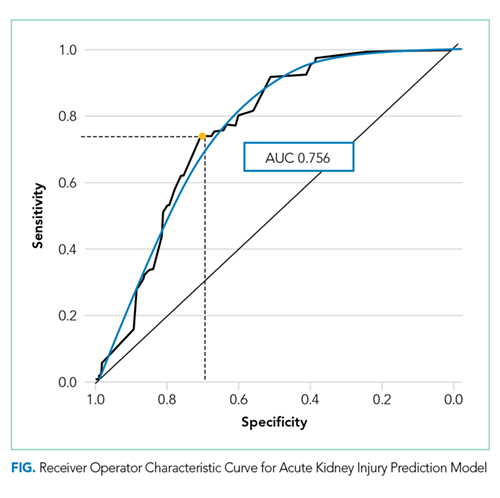
Identification of High-Risk Nephrotoxic Medications and Medication Combinations
Approximately 200 medication combinations were associated with >8% AKI risk, our new AKI prediction model’s alert threshold. Medication combinations consisting of up to 11 concomitantly prescribed medications were present in our data set. However, many of these combinations were infrequently prescribed. Further analysis, conducted in order to increase the clinical relevance of our findings, identified 10 medications or medication combinations that were both associated with a predicted AKI risk of >8% and that were prescribed on average greater than twice a month (Table 3).
DISCUSSION
The nephrotoxin-related AKI detection system at SCH automatically places orders for serum creatinines on patients who have met criteria for concomitant nephrotoxin exposure. This has given us a robust database from which to develop our clinical decision-making tool. Both our original and updated systems were based on the absolute number of concomitant nephrotoxic medications prescribed.16 This is a reasonable approach given the complexity of building a surveillance system19 and resource limitations. However, a system based on observed rather than theoretical or in vitro data, adaptable to the institution and designed for ongoing refinement, would be more valuable.
The interest in AKI prediction tools continues to be high. Bedford et al. employed numerous variables and diagnostic codes to predict the development of AKI in adults during hospitalization. They were able to produce a prediction model with a reasonable fit (AUC 0.72) to identify patients at higher risk for AKI but were less successful in their attempts to predict progression to severe AKI.20 Hodgson et al. recently developed an adult AKI prediction score (AUC 0.65-0.72) also based on numerous clinical factors that was able to positively impact inpatient mortality.21 To our knowledge, our model is unique in that it focuses on nephrotoxins using a predicted AKI risk algorithm based on observed AKI rates of previously ordered medications/medication combinations (two to 11 medications). Having a decision tool targeting medications gives the clinician guidance that can be used to make a specific intervention rather than identifying a patient at risk due to a diagnosis code or other difficult to modify factors.
There are abundant case studies and reports using logistic regression models identifying specific medications associated with AKI. Our choice of methodology was based on our assessment that logistic regression models would be inadequate for the development of a real-time clinical decision-making tool for several reasons. Using logistic regression to explore every medication combination based on our medication list would be challenging as there are approximately 5.5 × 10¹⁰ potential medication combinations. Additionally, logistic regression ignores any potential interactions between the medications. This is an important point as medication interactions can be synergistic, neutral, or antagonist. Consequently, the outcome generated from a set of combined variables may be different from one generated from the sum of each variable taken independently. Logistic regression also does not account for the potential prescribing trends among providers as it assumes that all medications or medication combinations are equally available at the same time. However, in practice, depending on numerous factors, such as hospital culture (eg, the presence of clinical standard work pathways), local bacterial resistance patterns, or medication shortages; certain medication combinations may occur more frequently while others not at all. Finally, logistic regression cannot account for the possibility of a medication combination occurring; therefore, logistic regression may identify a combination strongly associated with AKI that is rarely prescribed.
We theorized that AKI detection would improve with the Algorithm 2 modifications, including the expanded nephrotoxin list, which accompanied alignment with the national pediatric AKI collaborative, NINJA. The finding that our surveillance sensitivity did not improve with this system update supported our subsequent objective to develop a novel nephrotoxin-related AKI decision tool or detection system using our EHR data to identify which specific medications and/or medication combinations were associated with a higher rate of AKI. However, it should be noted that two factors related to measurement bias introduce limitations to our sensitivity and specificity analyses. First, regarding the presence of the alert system, our system will order serum creatinines on patients when they have been exposed to nephrotoxins. Consequently, the proportion of patients with creatinines measured will increase in the nephrotoxin-exposed patients. Unexposed patients may have AKI that is not detected because creatinines may not be ordered. Therefore, there is the potential for a relative increase in AKI detection among nephrotoxin-exposed patients as compared with unexposed patients, which would then affect the measured sensitivity and specificity of the alert. Second, the automated alerts require a baseline creatinine in order to trigger therefore are unable to identify AKI among patients who do not have a baseline serum creatinine measurement.
Our new nephrotoxin-related AKI detection model performed best when an alert was triggered for those medications or medication combinations with a predicted AKI risk of >8%. Forty-six medication combinations consisting of exactly two medications were determined to have a predicted AKI risk of >8% therefore would trigger an alert in our new model system. These medication combinations would not have triggered an alert using either of the previous system algorithms as both algorithms are based on the presence of three or more concomitant nephrotoxic medications.
From the list of suspected nephrotoxins, we identified 11 unique medications in 10 different combinations with a predicted AKI risk of >8% that were prescribed frequently (at least twice a month on average; Table 3). Notably, six out of 10 medication combinations involved vancomycin. Piperacillin-tazobactam was also represented in several combinations. These findings support the concern that others have reported regarding these two medications particularly when prescribed together.22,23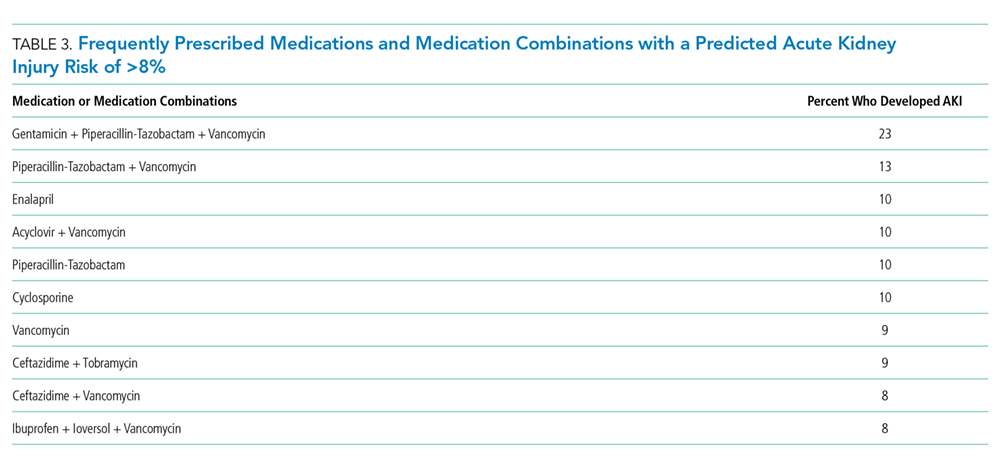
Interestingly, enalapril was identified as a higher-risk medication both alone and in combination with another medication. We do not suspect that enalapril carries a higher risk than other angiotensin-converting enzyme (ACE) inhibitors to increase a patient’s serum creatinine. Rather, we suspect that in our hospitalized patients, this relatively short-acting ACE inhibitor is commonly used in several of our vulnerable populations such as in cardiac and bone marrow transplant patients.
The alert threshold of our model can be adjusted to increase either the sensitivity or the specificity of AKI detection. Our detection sensitivity increased by >1.5-fold with the alert trigger threshold set at a predicted AKI risk of >8%. As a screening tool, our alert limits could be set such that our sensitivity would be greater; however, balancing the potential for alert fatigue is important in determining the acceptance and, ultimately, the success of a working surveillance system.24
A patient’s overall risk of AKI is influenced by many factors such as the presence of underlying chronic comorbidities and the nature or severity of the acute illness as this may affect the patient’s intravascular volume status, systemic blood pressures, or drug metabolism. Our study is limited as we are a children’s hospital and our patients may have fewer comorbidities than seen in the adult population. One could argue that this permits a perspective not clouded by the confounders of chronic disease and allows for the effect of the medications prescribed to be more apparent. However, our study includes critically ill patients and patients who may have been hemodynamically unstable. This may explain why the NINJA algorithm did not improve the sensitivity of our AKI detection as the NINJA collaborative excludes critically ill patients.
Dose and dosing frequency of the prescribed medications could not be taken into account, which could explain the finding that nonsteroidal anti-inflammatory drugs (NSAIDs) such as aspirin, ibuprofen, or ketorolac when used alone were associated with a low (<1%) rate of AKI despite being frequently prescribed. Additionally, as many providers are aware of the AKI risk of NSAIDs, these medications may have been used intermittently (as needed) or in select, perhaps healthier, patients or in patients that take these medications chronically who were admitted for reasons that did not alter their outpatient medication regimen.
Our study also reflects the prescribing habits of our institution and may not be directly applicable to nontertiary care hospitals or centers that do not have large cystic fibrosis, bone marrow, or solid organ transplant populations. Despite our study’s limitations, we feel that there are several findings that are relevant across centers and populations. Our data were derived from the systematic ordering of daily serum creatinines when a patient is at risk for nephrotoxin-related AKI. This is in step with the philosophy advocated by others that AKI identification can only occur if the providers are aware of this risk and are vigilant.25 In this vigilance, we also recognize that not all risks are of the same magnitude and may not deserve the same attention when resources are limited. Our identification of those medication combinations most associated with AKI at our institution has helped us narrow our focus and identify specific areas of potential education and intervention. The specific combinations identified may also be relevant to similar institutions serving similarly complex patients. Those with dissimilar populations could use this methodology to identify those medication combinations most relevant for their patient population and their prescriber’s habits. More studies of this type would be beneficial to the medical community as a whole as certain medication combinations may be found to be high risk regardless of the institution and the age or demographics of the populations they serve.
Acknowledgments
Dr. Karyn E. Yonekawa conceptualized and designed the study, directed the data analysis, interpreted the data, drafted, revised and gave final approval of the manuscript. Dr. Chuan Zhou contributed to the study design, acquired data, conducted the data analysis, critically reviewed, and gave final approval of the manuscript. Ms. Wren L. Haaland contributed to the study design, acquired data, conducted the data analysis, critically reviewed, and gave final approval of the manuscript. Dr. Davene R. Wright contributed to the study design, data analysis, critically reviewed, revised, and gave final approval of the manuscript.
The authors would like to thank Holly Clifton and Suzanne Spencer for their assistance with data acquisition and Drs. Derya Caglar, Corrie McDaniel, and Thida Ong for their writing support.
All authors approved the final manuscript as submitted and agree to be accountable for all aspects of the work.
Disclosures
The authors have no conflicts of interest to report.
1. Siew ED, Davenport A. The growth of acute kidney injury: a rising tide or just closer attention to detail? Kidney Int. 2015;87(1):46-61. https://doi.org/10.1038/ki.2014.293.
2. Matuszkiewicz-Rowinska J, Zebrowski P, Koscielska M, Malyszko J, Mazur A. The growth of acute kidney injury: Eastern European perspective. Kidney Int. 2015;87(6):1264. https://doi.org/10.1038/ki.2015.61.
3. Hoste EA, Bagshaw SM, Bellomo R, et al. Epidemiology of acute kidney injury in critically ill patients: the multinational AKI-EPI study. Intensive Care Med. 2015;41(8):1411-1423. https://doi.org/10.1007/s00134-015-3934-7.
4. Kaddourah A, Basu RK, Bagshaw SM, Goldstein SL, AWARE Investigators. Epidemiology of acute kidney injury in critically ill children and young adults. N Engl J Med. 2017;376(1):11-20. https://doi.org/10.1056/NEJMoa1611391.
5. Soler YA, Nieves-Plaza M, Prieto M, Garcia-De Jesus R, Suarez-Rivera M. Pediatric risk, injury, failure, loss, end-stage renal disease score identifies acute kidney injury and predicts mortality in critically ill children: a prospective study. Pediatr Crit Care Med. 2013;14(4):e189-e195. https://doi.org/10.1097/PCC.0b013e3182745675.
6. Case J, Khan S, Khalid R, Khan A. Epidemiology of acute kidney injury in the intensive care unit. Crit Care Res Pract. 2013;2013:479730. https://doi.org/10.1155/2013/479730.
7. Rewa O, Bagshaw SM. Acute kidney injury-epidemiology, outcomes and economics. Nat Rev Nephrol. 2014;10(4):193-207. https://doi.org/10.1038/nrneph.2013.282.
8. Hsu RK, Hsu CY. The role of acute kidney injury in chronic kidney disease. Semin Nephrol. 2016;36(4):283-292. https://doi.org/10.1016/j.semnephrol.2016.05.005.
9. Menon S, Kirkendall ES, Nguyen H, Goldstein SL. Acute kidney injury associated with high nephrotoxic medication exposure leads to chronic kidney disease after 6 months. J Pediatr. 2014;165(3):522-527.https://doi.org/10.1016/j.jpeds.2014.04.058.
10. Neild GH. Life expectancy with chronic kidney disease: an educational review. Pediatr Nephrol. 2017;32(2):243-248. https://doi.org/10.1007/s00467-016-3383-8.
11. Kellum JA. Acute kidney injury: AKI: the myth of inevitability is finally shattered. Nat Rev Nephrol. 2017;13(3):140-141. https://doi.org/10.1038/nrneph.2017.11.
12. Mehta RL, Cerda J, Burdmann EA, et al. International Society of Nephrology’s 0by25 initiative for acute kidney injury (zero preventable deaths by 2025): a human rights case for nephrology. Lancet. 2015;385(9987):2616-2643. https://doi.org/10.106/S0140-6736(15)60126-X.13.
13. Hodgson LE, Sarnowski A, Roderick PJ, Dimitrov BD, Venn RM, Forni LG. Systematic review of prognostic prediction models for acute kidney injury (AKI) in general hospital populations. BMJ Open. 2017;7(9):e016591. https://doi.org/10.1136/bmjopen-2017-016591.
14. Sutherland SM. Electronic health record-enabled big-data approaches to nephrotoxin-associated acute kidney injury risk prediction. Pharmacotherapy. 2018;38(8):804-812. https://doi.org/10.1002/phar.2150.
15. KDIGO Work Group. KDIGO clinical practice guidelines for acute kidney injury. Kidney Int Suppl. 2012;2(1):S1-138. PubMed
16. Moffett BS, Goldstein SL. Acute kidney injury and increasing nephrotoxic-medication exposure in noncritically-ill children. Clin J Am Soc Nephrol. 2011;6(4):856-863. https://doi.org/10.2215/CJN.08110910.
17. Mukherjee S, Pelech S, Neve RM, et al. Sparse combinatorial inference with an application in cancer biology. Bioinformatics. 2009;25(2):265-271. https://doi.org/10.1093/bioinformatics/btn611.
18. Bailly-Bechet M, Braunstein A, Pagnani A, Weigt M, Zecchina R. Inference of sparse combinatorial-control networks from gene-expression data: a message passing approach. BMC Bioinformatics. 2010;11:355. https://doi.org/10.1186/1471-2105-11-355.
19. Kirkendall ES, Spires WL, Mottes TA, et al. Development and performance of electronic acute kidney injury triggers to identify pediatric patients at risk for nephrotoxic medication-associated harm. Appl Clin Inform. 2014;5(2):313-333. https://doi.org/10.4338/ACI-2013-12-RA-0102.
20. Bedford M, Stevens P, Coulton S, et al. Development of Risk Models for the Prediction of New or Worsening Acute Kidney Injury on or During Hospital Admission: A Cohort and Nested Study. Southampton, UK: NIHR Journals Library; 2016. PubMed
21. Hodgson LE, Roderick PJ, Venn RM, Yao GL, Dimitrov BD, Forni LG. The ICE-AKI study: impact analysis of a clinical prediction rule and electronic AKI alert in general medical patients. PLoS One. 2018;13(8):e0200584. https://doi.org/10.1371/journal.pone.0200584.
22. Hammond DA, Smith MN, Li C, Hayes SM, Lusardi K, Bookstaver PB. Systematic review and meta-analysis of acute kidney injury associated with concomitant vancomycin and piperacillin/tazobactam. Clin Infect Dis. 2017;64(5):666-674. https://doi.org/10.1093/cid/ciw811.
23. Downes KJ, Cowden C, Laskin BL, et al. Association of acute kidney injury with concomitant vancomycin and piperacillin/tazobactam treatment among hospitalized children. JAMA Pediatr. 2017;171(12):e173219.https://doi.org/10.1001/jamapediatrics.2017.3219.
24. Agency for Heathcare Research and Quality. Alert Fatigue Web site. https://psnet.ahrq.gov/primers/primer/28/alert-fatigue. Updated July 2016. Accessed April 14, 2017.
25. Downes KJ, Rao MB, Kahill L, Nguyen H, Clancy JP, Goldstein SL. Daily serum creatinine monitoring promotes earlier detection of acute kidney injury in children and adolescents with cystic fibrosis. J Cyst Fibros. 2014;13(4):435-441. https://doi.org/10.1016/j.jcf.2014.03.005.
Acute kidney injury (AKI) is increasingly common in the hospitalized patient1,2 with recent adult and pediatric multinational studies reporting AKI rates of 57% and 27%, respectively.3,4 The development of AKI is associated with significant adverse outcomes including an increased risk of mortality.5-7 For those that survive, the history of AKI may contribute to a lifetime of impaired health with chronic kidney disease.8,9 This is particularly concerning for pediatric patients as AKI may impact morbidity for many decades, influence available therapies for these morbidities, and ultimately contribute to a shortened lifespan.10
AKI in the hospitalized patient is no longer accepted as an unfortunate and unavoidable consequence of illness or the indicated therapy. Currently, there is strong interest in this hospital-acquired condition with global initiatives aimed at increased prevention and early detection and treatment of AKI.11,12 To this objective, risk stratification tools or prediction models could assist clinicians in decision making. Numerous studies have tested AKI prediction models either in particular high-risk populations or based on associated comorbidities, biomarkers, and critical illness scores. These studies are predominantly in adult populations, and few have been externally validated.13 While associations between certain medications and AKI are well known, an AKI prediction model that is applicable to pediatric or adult populations and is based on medication exposure is difficult. However, there is a growing recognition of the potential to develop such a model using the electronic health record (EHR).14
In 2013, Seattle Children’s Hospital (SCH) implemented a nephrotoxin and AKI detection system to assist in clinical decision making within the EHR. This system instituted the automatic ordering of serum creatinines to screen for AKI when the provider ordered three or more medications that were suspected to be nephrotoxic. Other clinical factors such as the diagnoses or preexisting conditions were not considered in the decision-tool algorithm. This original algorithm (Algorithm 1) was later modified and the list of suspected nephrotoxins was expanded (Table 1) in order to align with a national pediatric AKI collaborative (Algorithm 2). However, it was unclear whether the algorithm modification would improve AKI detection.
The present study had two objectives. The first was to evaluate the impact of the modifications on the sensitivity and specificity of our system. The second objective, if either the sensitivity or specificity was determined to be suboptimal, was to develop an improved model for nephrotoxin-related AKI detection. Having either the sensitivity or the specificity under 50% would be equivalent to or worse than a random guess, which we would consider unacceptable.
METHODS
Context
SCH is a tertiary care academic teaching hospital affiliated with the University of Washington School of Medicine, Harborview Medical Center, and the Seattle Cancer Care Alliance. The hospital has 371 licensed beds and approximately 18 medical subspecialty services.
Study Population
This was a retrospective cohort study examining all patients ages 0-21 years admitted to SCH between December 1, 2013 and November 30, 2015. The detection system was modified to align with the national pediatric AKI collaborative, Nephrotoxic Injury Negated by Just-in-Time Action (NINJA) in November 2014. Both acute care and intensive care patients were included (data not separated by location). Patients who had end-stage kidney disease and were receiving dialysis and patients who were evaluated in the emergency department without being admitted or admitted as observation status were excluded from analysis. Patients were also excluded if they did not have a baseline serum creatinine as defined below.
Study Measures
AKI is defined at SCH using the Kidney Disease: Improving Global Outcomes Stage 1 criteria as a guideline. The diagnosis of AKI is based on an increase in the baseline serum creatinine by 0.3 mg/dL or an increase in the serum creatinine by >1.5 times the baseline assuming the incoming creatinine is 0.5 mg/dL or higher. For our definition, the increase in serum creatinine needs to have occurred within a one-week timeframe and urine output is not a diagnostic criterion.15 Baseline serum creatinine is defined as the lowest serum creatinine in the previous six months. Forty medications were classified as nephrotoxins based on previous analysis16 and adapted for our institutional formulary.
Statistical Analysis
To evaluate the efficacy of our systems in detecting nephrotoxin-related AKI, the sensitivity and the specificity using both our original algorithm (Algorithm 1) and the modified algorithm (Algorithm 2) were generated on our complete data set. To test sensitivity, the proportion of AKI patients who would trigger alert using Algorithm 1 and then with Algorithm 2 was identified. Similarly, to test specificity, the proportion of non-AKI patients who did not trigger an alert by the surveillance systems was identified. The differences in sensitivity and specificity between the two algorithms were evaluated using two-sample tests of proportion.
The statistical method of Combinatorial Inference has been utilized in studies of cancer biology17 and in genomics.18 A variation of this approach was used in this study to identify the specific medication combinations most associated with AKI. First, all of the nephrotoxic medications and medication combinations that were prescribed during our study period were identified from a data set (ie, a training set) containing 75% of all encounters selected at random without replacement. Using this training set, the prevalence of each medication combination and the rate of AKI associated with each combination were identified. The predicted overall AKI risk of an individual medication is the average of all the AKI rates associated with each combination containing that specific medication. Also incorporated into the determination of the predicted AKI risk was the prevalence of that medication combination.
To test our model’s predictive capability, the algorithm was applied to the remaining 25% of the total patient data (ie, the test set). The predicted AKI risk was compared with the actual AKI rate in the test data set. Our model’s predictive capability was represented in a receiver operator characteristic (ROC) analysis. The goal was to achieve an area under the ROC curve (AUC) approaching one as this would reflect 100% sensitivity and 100% specificity, whereas an AUC of 0.5 would represent a random guess (50% chance of being correct).
Lastly, our final step was to use our model’s ROC curve to determine an optimal threshold of AKI risk for which to trigger an alert. This predicted risk threshold was based on our goal to increase our surveillance system’s sensitivity balanced with maintaining an acceptable specificity.
An a priori threshold of P = .05 was used to determine statistical significance of all results. Analyses were conducted in Stata 12.1 (StataCorp LP, College Station, Texas) and R 3.3.2 (R Foundation for Statistical Computing, Vienna, Austria). A sample data set containing replication code for our model can be found in an online repository (https://dataverse.harvard.edu/dataverse/chuan). This study was approved by the Seattle Children’s Institutional Review Board.
RESULTS
Sensitivity and Specificity
Of the patient encounters, 14,779 were eligible during the study period. The sensitivity of the system’s ability to identify nephrotoxin-related AKI decreased from 46.9% using Algorithm 1 to 43.3% using Algorithm 2, a change of 3.6% (P = .22). The specificity increased from 73.6% to 89.3%, a change of 15.7% (P < .001; Table 2).
Improvement of Our Nephrotoxin-Related AKI Detection System Using a Novel AKI Prediction Strategy
A total of 838 medication combinations were identified in our training set and the predicted AKI risk for every medication combination was determined. By comparing the predicted risk of AKI to the actual AKI occurrence, an ROC curve with an AUC of 0.756 (Figure) was generated. An increase in system sensitivity was prioritized when determining the optimal AKI risk at which the model would trigger an alert. Setting an alert threshold at a predicted AKI risk of >8%, our model performed with a sensitivity of 74% while decreasing the specificity to 70%.
Identification of High-Risk Nephrotoxic Medications and Medication Combinations
Approximately 200 medication combinations were associated with >8% AKI risk, our new AKI prediction model’s alert threshold. Medication combinations consisting of up to 11 concomitantly prescribed medications were present in our data set. However, many of these combinations were infrequently prescribed. Further analysis, conducted in order to increase the clinical relevance of our findings, identified 10 medications or medication combinations that were both associated with a predicted AKI risk of >8% and that were prescribed on average greater than twice a month (Table 3).
DISCUSSION
The nephrotoxin-related AKI detection system at SCH automatically places orders for serum creatinines on patients who have met criteria for concomitant nephrotoxin exposure. This has given us a robust database from which to develop our clinical decision-making tool. Both our original and updated systems were based on the absolute number of concomitant nephrotoxic medications prescribed.16 This is a reasonable approach given the complexity of building a surveillance system19 and resource limitations. However, a system based on observed rather than theoretical or in vitro data, adaptable to the institution and designed for ongoing refinement, would be more valuable.
The interest in AKI prediction tools continues to be high. Bedford et al. employed numerous variables and diagnostic codes to predict the development of AKI in adults during hospitalization. They were able to produce a prediction model with a reasonable fit (AUC 0.72) to identify patients at higher risk for AKI but were less successful in their attempts to predict progression to severe AKI.20 Hodgson et al. recently developed an adult AKI prediction score (AUC 0.65-0.72) also based on numerous clinical factors that was able to positively impact inpatient mortality.21 To our knowledge, our model is unique in that it focuses on nephrotoxins using a predicted AKI risk algorithm based on observed AKI rates of previously ordered medications/medication combinations (two to 11 medications). Having a decision tool targeting medications gives the clinician guidance that can be used to make a specific intervention rather than identifying a patient at risk due to a diagnosis code or other difficult to modify factors.
There are abundant case studies and reports using logistic regression models identifying specific medications associated with AKI. Our choice of methodology was based on our assessment that logistic regression models would be inadequate for the development of a real-time clinical decision-making tool for several reasons. Using logistic regression to explore every medication combination based on our medication list would be challenging as there are approximately 5.5 × 10¹⁰ potential medication combinations. Additionally, logistic regression ignores any potential interactions between the medications. This is an important point as medication interactions can be synergistic, neutral, or antagonist. Consequently, the outcome generated from a set of combined variables may be different from one generated from the sum of each variable taken independently. Logistic regression also does not account for the potential prescribing trends among providers as it assumes that all medications or medication combinations are equally available at the same time. However, in practice, depending on numerous factors, such as hospital culture (eg, the presence of clinical standard work pathways), local bacterial resistance patterns, or medication shortages; certain medication combinations may occur more frequently while others not at all. Finally, logistic regression cannot account for the possibility of a medication combination occurring; therefore, logistic regression may identify a combination strongly associated with AKI that is rarely prescribed.
We theorized that AKI detection would improve with the Algorithm 2 modifications, including the expanded nephrotoxin list, which accompanied alignment with the national pediatric AKI collaborative, NINJA. The finding that our surveillance sensitivity did not improve with this system update supported our subsequent objective to develop a novel nephrotoxin-related AKI decision tool or detection system using our EHR data to identify which specific medications and/or medication combinations were associated with a higher rate of AKI. However, it should be noted that two factors related to measurement bias introduce limitations to our sensitivity and specificity analyses. First, regarding the presence of the alert system, our system will order serum creatinines on patients when they have been exposed to nephrotoxins. Consequently, the proportion of patients with creatinines measured will increase in the nephrotoxin-exposed patients. Unexposed patients may have AKI that is not detected because creatinines may not be ordered. Therefore, there is the potential for a relative increase in AKI detection among nephrotoxin-exposed patients as compared with unexposed patients, which would then affect the measured sensitivity and specificity of the alert. Second, the automated alerts require a baseline creatinine in order to trigger therefore are unable to identify AKI among patients who do not have a baseline serum creatinine measurement.
Our new nephrotoxin-related AKI detection model performed best when an alert was triggered for those medications or medication combinations with a predicted AKI risk of >8%. Forty-six medication combinations consisting of exactly two medications were determined to have a predicted AKI risk of >8% therefore would trigger an alert in our new model system. These medication combinations would not have triggered an alert using either of the previous system algorithms as both algorithms are based on the presence of three or more concomitant nephrotoxic medications.
From the list of suspected nephrotoxins, we identified 11 unique medications in 10 different combinations with a predicted AKI risk of >8% that were prescribed frequently (at least twice a month on average; Table 3). Notably, six out of 10 medication combinations involved vancomycin. Piperacillin-tazobactam was also represented in several combinations. These findings support the concern that others have reported regarding these two medications particularly when prescribed together.22,23
Interestingly, enalapril was identified as a higher-risk medication both alone and in combination with another medication. We do not suspect that enalapril carries a higher risk than other angiotensin-converting enzyme (ACE) inhibitors to increase a patient’s serum creatinine. Rather, we suspect that in our hospitalized patients, this relatively short-acting ACE inhibitor is commonly used in several of our vulnerable populations such as in cardiac and bone marrow transplant patients.
The alert threshold of our model can be adjusted to increase either the sensitivity or the specificity of AKI detection. Our detection sensitivity increased by >1.5-fold with the alert trigger threshold set at a predicted AKI risk of >8%. As a screening tool, our alert limits could be set such that our sensitivity would be greater; however, balancing the potential for alert fatigue is important in determining the acceptance and, ultimately, the success of a working surveillance system.24
A patient’s overall risk of AKI is influenced by many factors such as the presence of underlying chronic comorbidities and the nature or severity of the acute illness as this may affect the patient’s intravascular volume status, systemic blood pressures, or drug metabolism. Our study is limited as we are a children’s hospital and our patients may have fewer comorbidities than seen in the adult population. One could argue that this permits a perspective not clouded by the confounders of chronic disease and allows for the effect of the medications prescribed to be more apparent. However, our study includes critically ill patients and patients who may have been hemodynamically unstable. This may explain why the NINJA algorithm did not improve the sensitivity of our AKI detection as the NINJA collaborative excludes critically ill patients.
Dose and dosing frequency of the prescribed medications could not be taken into account, which could explain the finding that nonsteroidal anti-inflammatory drugs (NSAIDs) such as aspirin, ibuprofen, or ketorolac when used alone were associated with a low (<1%) rate of AKI despite being frequently prescribed. Additionally, as many providers are aware of the AKI risk of NSAIDs, these medications may have been used intermittently (as needed) or in select, perhaps healthier, patients or in patients that take these medications chronically who were admitted for reasons that did not alter their outpatient medication regimen.
Our study also reflects the prescribing habits of our institution and may not be directly applicable to nontertiary care hospitals or centers that do not have large cystic fibrosis, bone marrow, or solid organ transplant populations. Despite our study’s limitations, we feel that there are several findings that are relevant across centers and populations. Our data were derived from the systematic ordering of daily serum creatinines when a patient is at risk for nephrotoxin-related AKI. This is in step with the philosophy advocated by others that AKI identification can only occur if the providers are aware of this risk and are vigilant.25 In this vigilance, we also recognize that not all risks are of the same magnitude and may not deserve the same attention when resources are limited. Our identification of those medication combinations most associated with AKI at our institution has helped us narrow our focus and identify specific areas of potential education and intervention. The specific combinations identified may also be relevant to similar institutions serving similarly complex patients. Those with dissimilar populations could use this methodology to identify those medication combinations most relevant for their patient population and their prescriber’s habits. More studies of this type would be beneficial to the medical community as a whole as certain medication combinations may be found to be high risk regardless of the institution and the age or demographics of the populations they serve.
Acknowledgments
Dr. Karyn E. Yonekawa conceptualized and designed the study, directed the data analysis, interpreted the data, drafted, revised and gave final approval of the manuscript. Dr. Chuan Zhou contributed to the study design, acquired data, conducted the data analysis, critically reviewed, and gave final approval of the manuscript. Ms. Wren L. Haaland contributed to the study design, acquired data, conducted the data analysis, critically reviewed, and gave final approval of the manuscript. Dr. Davene R. Wright contributed to the study design, data analysis, critically reviewed, revised, and gave final approval of the manuscript.
The authors would like to thank Holly Clifton and Suzanne Spencer for their assistance with data acquisition and Drs. Derya Caglar, Corrie McDaniel, and Thida Ong for their writing support.
All authors approved the final manuscript as submitted and agree to be accountable for all aspects of the work.
Disclosures
The authors have no conflicts of interest to report.
1. Siew ED, Davenport A. The growth of acute kidney injury: a rising tide or just closer attention to detail? Kidney Int. 2015;87(1):46-61. https://doi.org/10.1038/ki.2014.293.
2. Matuszkiewicz-Rowinska J, Zebrowski P, Koscielska M, Malyszko J, Mazur A. The growth of acute kidney injury: Eastern European perspective. Kidney Int. 2015;87(6):1264. https://doi.org/10.1038/ki.2015.61.
3. Hoste EA, Bagshaw SM, Bellomo R, et al. Epidemiology of acute kidney injury in critically ill patients: the multinational AKI-EPI study. Intensive Care Med. 2015;41(8):1411-1423. https://doi.org/10.1007/s00134-015-3934-7.
4. Kaddourah A, Basu RK, Bagshaw SM, Goldstein SL, AWARE Investigators. Epidemiology of acute kidney injury in critically ill children and young adults. N Engl J Med. 2017;376(1):11-20. https://doi.org/10.1056/NEJMoa1611391.
5. Soler YA, Nieves-Plaza M, Prieto M, Garcia-De Jesus R, Suarez-Rivera M. Pediatric risk, injury, failure, loss, end-stage renal disease score identifies acute kidney injury and predicts mortality in critically ill children: a prospective study. Pediatr Crit Care Med. 2013;14(4):e189-e195. https://doi.org/10.1097/PCC.0b013e3182745675.
6. Case J, Khan S, Khalid R, Khan A. Epidemiology of acute kidney injury in the intensive care unit. Crit Care Res Pract. 2013;2013:479730. https://doi.org/10.1155/2013/479730.
7. Rewa O, Bagshaw SM. Acute kidney injury-epidemiology, outcomes and economics. Nat Rev Nephrol. 2014;10(4):193-207. https://doi.org/10.1038/nrneph.2013.282.
8. Hsu RK, Hsu CY. The role of acute kidney injury in chronic kidney disease. Semin Nephrol. 2016;36(4):283-292. https://doi.org/10.1016/j.semnephrol.2016.05.005.
9. Menon S, Kirkendall ES, Nguyen H, Goldstein SL. Acute kidney injury associated with high nephrotoxic medication exposure leads to chronic kidney disease after 6 months. J Pediatr. 2014;165(3):522-527.https://doi.org/10.1016/j.jpeds.2014.04.058.
10. Neild GH. Life expectancy with chronic kidney disease: an educational review. Pediatr Nephrol. 2017;32(2):243-248. https://doi.org/10.1007/s00467-016-3383-8.
11. Kellum JA. Acute kidney injury: AKI: the myth of inevitability is finally shattered. Nat Rev Nephrol. 2017;13(3):140-141. https://doi.org/10.1038/nrneph.2017.11.
12. Mehta RL, Cerda J, Burdmann EA, et al. International Society of Nephrology’s 0by25 initiative for acute kidney injury (zero preventable deaths by 2025): a human rights case for nephrology. Lancet. 2015;385(9987):2616-2643. https://doi.org/10.106/S0140-6736(15)60126-X.13.
13. Hodgson LE, Sarnowski A, Roderick PJ, Dimitrov BD, Venn RM, Forni LG. Systematic review of prognostic prediction models for acute kidney injury (AKI) in general hospital populations. BMJ Open. 2017;7(9):e016591. https://doi.org/10.1136/bmjopen-2017-016591.
14. Sutherland SM. Electronic health record-enabled big-data approaches to nephrotoxin-associated acute kidney injury risk prediction. Pharmacotherapy. 2018;38(8):804-812. https://doi.org/10.1002/phar.2150.
15. KDIGO Work Group. KDIGO clinical practice guidelines for acute kidney injury. Kidney Int Suppl. 2012;2(1):S1-138. PubMed
16. Moffett BS, Goldstein SL. Acute kidney injury and increasing nephrotoxic-medication exposure in noncritically-ill children. Clin J Am Soc Nephrol. 2011;6(4):856-863. https://doi.org/10.2215/CJN.08110910.
17. Mukherjee S, Pelech S, Neve RM, et al. Sparse combinatorial inference with an application in cancer biology. Bioinformatics. 2009;25(2):265-271. https://doi.org/10.1093/bioinformatics/btn611.
18. Bailly-Bechet M, Braunstein A, Pagnani A, Weigt M, Zecchina R. Inference of sparse combinatorial-control networks from gene-expression data: a message passing approach. BMC Bioinformatics. 2010;11:355. https://doi.org/10.1186/1471-2105-11-355.
19. Kirkendall ES, Spires WL, Mottes TA, et al. Development and performance of electronic acute kidney injury triggers to identify pediatric patients at risk for nephrotoxic medication-associated harm. Appl Clin Inform. 2014;5(2):313-333. https://doi.org/10.4338/ACI-2013-12-RA-0102.
20. Bedford M, Stevens P, Coulton S, et al. Development of Risk Models for the Prediction of New or Worsening Acute Kidney Injury on or During Hospital Admission: A Cohort and Nested Study. Southampton, UK: NIHR Journals Library; 2016. PubMed
21. Hodgson LE, Roderick PJ, Venn RM, Yao GL, Dimitrov BD, Forni LG. The ICE-AKI study: impact analysis of a clinical prediction rule and electronic AKI alert in general medical patients. PLoS One. 2018;13(8):e0200584. https://doi.org/10.1371/journal.pone.0200584.
22. Hammond DA, Smith MN, Li C, Hayes SM, Lusardi K, Bookstaver PB. Systematic review and meta-analysis of acute kidney injury associated with concomitant vancomycin and piperacillin/tazobactam. Clin Infect Dis. 2017;64(5):666-674. https://doi.org/10.1093/cid/ciw811.
23. Downes KJ, Cowden C, Laskin BL, et al. Association of acute kidney injury with concomitant vancomycin and piperacillin/tazobactam treatment among hospitalized children. JAMA Pediatr. 2017;171(12):e173219.https://doi.org/10.1001/jamapediatrics.2017.3219.
24. Agency for Heathcare Research and Quality. Alert Fatigue Web site. https://psnet.ahrq.gov/primers/primer/28/alert-fatigue. Updated July 2016. Accessed April 14, 2017.
25. Downes KJ, Rao MB, Kahill L, Nguyen H, Clancy JP, Goldstein SL. Daily serum creatinine monitoring promotes earlier detection of acute kidney injury in children and adolescents with cystic fibrosis. J Cyst Fibros. 2014;13(4):435-441. https://doi.org/10.1016/j.jcf.2014.03.005.
© 2019 Society of Hospital Medicine
Home Smoke Exposure and Health-Related Quality of Life in Children with Acute Respiratory Illness
Acute respiratory illnesses (ARIs), including acute exacerbations of asthma, croup, pneumonia, and bronchiolitis, are among the most common illnesses in childhood.1 Although most ARIs can be managed in the outpatient setting,
Exposure to secondhand smoke (SHS) is a preventable risk factor for ARI in children, particularly when there is regular exposure in the home.2 Chronic exposure to SHS impacts systemic inflammation by suppressing serum interferon-gamma,3 which can lead to increased susceptibility to viral and bacterial infections,4 and increasing Th2 (atopic) cytokine expression, which is associated with asthma.5 SHS exposure in children has also been linked to diminished lung function.6 As a result, SHS exposure is associated with increased ARI susceptibility and severity in children.7-10
Much research has focused on the clinical impact of SHS exposure on respiratory health in children, but little is known about the impact on patient-reported outcomes, such as health-related quality of life (HRQOL). Patient-reported outcomes help provide a comprehensive evaluation of the effectiveness of healthcare delivery systems. These outcomes are increasingly used by health service researchers to better understand patient and caregiver perspectives.11 Given the known associations between SHS exposure and ARI morbidity, we postulated that regular SHS exposure would also impact HRQOL in children. In this study, we assessed the relationship between SHS exposure and HRQOL within a large, multicenter, prospective cohort of children presenting to the emergency department (ED) and/or hospital with ARI.
METHODS
Study Population
This study was nested within the Pediatric Respiratory Illness Measurement System (PRIMES) study, a prospective cohort study of children with ARI in the ED and inpatient settings at five tertiary care children’s hospitals within the Pediatric Research in Inpatient Settings Network in Colorado, Pennsylvania, Tennessee, Texas, and Washington. Eligible children were two weeks to 16 years of age hospitalized after presenting to the ED with a primary diagnosis of asthma, croup, bronchiolitis, or pneumonia between July 1, 2014 and June 30, 2016. Because of an anticipated low frequency of croup hospitalizations, we also included children presenting to the ED and then discharged to home with this diagnosis. Children were assigned to a PRIMES diagnosis group based on their final discharge diagnosis. If there was a discrepancy between admission and discharge diagnoses, the discharge diagnosis was used. If a child had more than one discharge diagnosis for a PRIMES condition (eg, acute asthma and pneumonia), we chose the PRIMES condition with the lowest total enrollments overall. If the final discharge diagnosis was not a PRIMES condition, the case was excluded from further analysis. Patients with immunodeficiency, cystic fibrosis, a history of prematurity <32 weeks, chronic neuromuscular disease, cardiovascular disease, pulmonary diseases (other than asthma), and moderate to severe developmental delay were also excluded. Children admitted to intensive care were eligible only if they were transferred to an acute care ward <72 hours following admission. A survey was administered at the time of enrollment that collected information on SHS exposure, HRQOL, healthcare utilization, and demographics. All study procedures were reviewed and approved by the institutional review boards at each of the participating hospitals.
SECONDHAND SMOKE EXPOSURE
To ascertain SHS exposure, we asked caregivers, “How many persons living in the child’s home smoke?” Responses were dichotomized into non-SHS exposed (0 smokers) and SHS exposed (≥1 smokers). Children with missing data on home SHS exposure were excluded.
Health-Related Quality of Life Outcomes
We estimated HRQOL using the Pediatric Quality of Life (PedsQLTM) 4.0 Generic Core and Infant Scales. The PedsQL instruments are validated, population HRQOL measures that evaluate the physical, mental, emotional, and social functioning of children two to 18 years old based on self- or caregiver-proxy report.12-15 These instruments have also shown responsiveness as well as construct and predictive validity in hospitalized children.11 For this study, we focused on the PedsQL physical functioning subscale, which assesses for problems with physical activities (eg, sports activity or exercise, low energy, and hurts or aches) on a five-point Likert scale (never to almost always a problem). Scores range from 0 to 100 with higher scores indicating a better HRQOL. The reported minimal clinically important difference (MCID), defined as the smallest difference in which individuals would perceive a benefit or would necessitate a change in management, for this scale is 4.5 points.16,17
Children >8 years old were invited to complete the self-report version of the PedsQL. For children <8 years old, and for older children who were unable to complete them, surveys were completed by a parent or legal guardian. Respondents were asked to assess perceptions of their (or their child’s) HRQOL during periods of baseline health (the child’s usual state of health in the month preceding the current illness) and during the acute illness (the child’s state of health at the time of admission) as SHS exposure may influence perceptions of general health and/or contribute to worse outcomes during periods of acute illness.
Covariates collected at the time of enrollment included sociodemographics (child age, gender, race/ethnicity, and caregiver education), and healthcare utilization (caregiver-reported patient visits to a healthcare provider in the preceding six months). Insurance status and level of medical complexity (using the Pediatric Medical Complexity Algorithm)18 were obtained using the Pediatric Hospital Information System database, an administrative database containing clinical and resource utilization data from >45 children’s hospitals in the United States including all of the PRIMES study hospitals.13
Analysis
Descriptive statistics included frequency (%) and mean (standard deviation). Bivariate comparisons according to SHS exposure status were analyzed using chi-squared tests for categorical variables and analysis of variance for continuous variables. Multivariable linear mixed regression models were used to examine associations between home SHS exposure and HRQOL for baseline health and during admission, overall and stratified by diagnosis. Covariates in each model included age, sex, race/ethnicity, caregiver education, and healthcare visits in the preceding six months. We also included a hospital random effect to account for clustering of patients within hospitals and used robust standard errors for inference.
In a secondary analysis to explore potential dose-response effects of SHS exposure, we examined associations between an ordinal exposure variable (0 smokers, 1 smoker, ≥2 smokers) and HRQOL for baseline health and during admission for the acute illness. Because of sample size limitations, diagnosis-specific analyses examining dose-response effects were not conducted.
RESULTS
Study Population
Of the 2,334 children enrolled in the PRIMES study, 25 (1%) respondents did not report on home SHS exposure and were excluded, yielding a final study population of 2,309 children, of whom 728 (32%) had reported home SHS exposure. The study population included 664 children with asthma (mean age seven years [3.5]; 38% with home SHS exposure), 740 with bronchiolitis (mean age 0.7 years [0.5]; 32% with home SHS exposure), 342 with croup (mean age 1.7 [1.1]; 25% with home SHS exposure), and 563 with pneumonia (mean age 4.4 [3.8]; 27% with home SHS exposure; Table 1). Compared with non-SHS-exposed children, those with home SHS exposure tend to be slightly older (3.9 vs 3.4 years, P = .01), more likely to be non-Hispanic Black (29% vs 19%, P < .001), to have a chronic condition (52% vs 41%, P < .001), to come from a household where caregiver(s) did not graduate from college (45% vs 29%, P < .001), and to have public insurance (73% vs 49%, P < .001).
Home SHS Exposure and Health-related Quality of Life
The overall mean HRQOL score for baseline health was 83 (15), with a range across diagnoses of 82 to 87. Compared with non-SHS-exposed children, children with home SHS exposure had a lower mean HRQOL score for baseline health (adjusted mean difference –3.04 [95% CI -4.34, –1.74]). In analyses stratified by diagnosis, baseline health scores were lower for SHS-exposed children for all four conditions, but differences were statistically significant only for bronchiolitis (adjusted mean difference –2.94 [–5.0, –0.89]) and pneumonia (adjusted mean value –4.13 [–6.82, –1.44]; Table 2); none of these differences met the MCID threshold.
The overall mean HRQOL score at the time of admission was 56 (23), with a range across diagnoses of 49 to 61, with lower scores noted among SHS-exposed children compared with non-SHS-exposed children (adjusted mean difference –2.16 [–4.22, –0.10]). Similar to scores representing baseline health, admission scores were lower across all four conditions for SHS-exposed children. Only children with croup, however, had significantly lower admission scores that also met the MCID threshold (adjusted mean difference –5.71 [–10.67, –0.75]; Table 2).
To assess for potential dose-response effects of SHS exposure on HRQOL, we stratified SHS-exposed children into those with one smoker in the home (n = 513) and those with ≥2 smokers in the home (n = 215). Compared with non-SHS-exposed children, both HRQOL scores (baseline health and admission) were lower for SHS-exposed children. Consistent with a dose-response association, scores were lowest for children with ≥2 smokers in the home, both at baseline health (adjusted mean difference –3.92 [–6.03, –1.81]) and on admission (adjusted mean difference –3.67 [–6.98, –0.36]; Table 3).
DISCUSSION
Within a multicenter cohort of 2,309 children hospitalized with ARI, we noted significantly lower HRQOL scores among children exposed to SHS in the home as compared with nonexposed children. Differences were greatest for children living with ≥2 smokers in the home. In analyses stratified by diagnosis, differences in baseline health HRQOL scores were greatest for children with bronchiolitis and pneumonia. Differences in acute illness scores were greatest for children with croup.16
Our study provides evidence for acute and chronic impacts of SHS on HRQOL in children hospitalized with ARI. Although several studies have linked SHS exposure to reduced HRQOL in adults,19,20 few similar studies have been conducted in children. Nonetheless, a wealth of studies have documented the negative impact of SHS exposure on clinical outcomes among children with ARI.8,10,21-23 Our findings that home SHS exposure was associated with reduced HRQOL among our cohort of children with ARI are therefore consistent with related findings in adults and children. The observation that the effects of SHS exposure on HRQOL were greatest among children living with ≥2 smokers provides further evidence of a potential causal link between regular SHS exposure and HRQOL.
Although the magnitude and significance of associations between SHS exposure and HRQOL varied for each of the four diagnoses for baseline health and the acute illness, it is important to note that the point estimates for the adjusted mean differences were uniformly lower for the SHS-exposed children in each subgroup. Even so, only acute illness scores for croup exceeded the MCID threshold.16 Croup is the only included condition of the upper airway and is characterized by laryngotracheal inflammation leading to the typical cough and, in moderate to severe cases, stridor. Given that chronic SHS exposure induces a proinflammatory state,3 it is possible that SHS-exposed children with croup had more severe illness compared with nonexposed children with croup resulting in lower HRQOL scores on admission. Further, perceived differences in illness severity and HRQOL may be more readily apparent in children with croup (eg, stridor at rest vs intermittent or no stridor) as compared with children with lower respiratory tract diseases.
Of the four included diagnoses, the link between SHS exposure and asthma outcomes has been most studied. Prior work has demonstrated more frequent and severe acute exacerbations, as well as worse long-term lung function among SHS-exposed children as compared with nonexposed children.22-24 It was, therefore, surprising that our study failed to demonstrate associations between SHS exposure and HRQOL among children with asthma. Reasons for this finding are unclear. One hypothesis is that caregivers of SHS-exposed children with asthma may be more aware of the impacts of SHS exposure on respiratory health (through prior education) and, thus, more likely to modify their smoking behaviors, or for their children to be on daily asthma controller therapy. Alternatively, caregivers of children with asthma may be more likely to underreport home SHS exposure. Thirty-eight percent of children with asthma, however, were classified as SHS-exposed. This percentage was greater than the other three conditions studied (25%-32%), suggesting that differential bias in underreporting was minimal. Given that children with asthma were older, on average, than children with the other three conditions, it may also be that these children spent more time in smoke-free environments (eg, school).
Nearly one-third of children in our study were exposed to SHS in the home. This is similar to the prevalence of exposure in other studies conducted among hospitalized children8,10,21,25 but higher than the national prevalence of home SHS exposure among children in the United States.26 Thus, hospitalized children represent a particularly vulnerable population and an important target for interventions aiming to reduce exposure to SHS. Although longitudinal interventions are likely necessary to affect long-term success, hospitalization for ARI may serve as a powerful teachable moment to begin cessation efforts. Hospitalization also offers time beyond a typical primary care outpatient encounter to focus on cessation counseling and may be the only opportunity to engage in counseling activities for some families with limited time or access. Further, prior studies have demonstrated both the feasibility and the effectiveness of smoking cessation interventions in hospitalized children.27-30 Unfortunately, however, SHS exposure is often not documented at the time of hospitalization, and many opportunities to intervene are missed.25,31 Thus, there is a need for improved strategies to reliably identify and intervene on SHS-exposed children in the hospital setting.
These findings should be considered in the context of several limitations. The observational nature of our study raises the potential for confounding, specifically with regard to socioeconomic status, as this is associated with both SHS exposure and lower HRQOL. Our modeling approach attempted to control for several factors associated with socioeconomic status, including caregiver education and insurance coverage, but there is potential for residual confounding. No single question is sufficient to fully assess SHS exposure as the intensity of home SHS exposure likely varies widely, and some children may be exposed to SHS outside of the home environment.32 The home, however, is often the most likely source of regular SHS exposure,33,34 especially among young children (our cohort’s mean age was 3.6 years). Misclassification of SHS exposure is also possible due to underreporting of smoking.35,36 As a result, some children regularly exposed to SHS may have been misclassified as nonexposed, and the observed associations between SHS exposure and HRQOL may be underestimated. Confirming our study’s findings using objective assessments of SHS exposure, such as cotinine, are warranted. Given the young age of our cohort, the PedsQL surveys were completed by the parent or legal guardian only in >90% of the enrolled subjects, and caregiver perceptions may not accurately reflect the child’s perceptions. Prior work, however, has demonstrated the validity of parent-proxy reporting of the PedsQL, including correlation with child self-report.37 In our study, correlation between child and caregiver reporting (when available) was also very good (r = 0.72, 95% CI 0.64, 0.77). It is also possible that the timing of the HRQOL assessments (on admission) may have biased perceptions of baseline HRQOL, although we anticipate any bias would likely be nondifferential between SHS-exposed and nonexposed children and across diagnoses.
Nearly one-third of children in our study were exposed to SHS exposure in the home, and SHS exposure was associated with lower HRQOL for baseline health and during acute illness, providing further evidence of the dangers of SHS. Much work is needed in order to eliminate the impact of SHS on child health and families of children hospitalized for respiratory illness should be considered a priority population for smoking cessation efforts.
Acknowledgment
The authors wish to acknowledge the efforts of PRIS-PRIMES study team. The authors also wish to thank the children and families who consented to be a part of the PRIMES study.
Disclosures
The authors have no conflicts of interest relevant to this article to disclose.
Funding
This study was supported by NIH-NHLBI 1R01HL121067 to RMS.
1. Witt WP, Weiss AJ, Elixhauser A. Overview of Hospital Stays for Children in the United States, 2012: Statistical Brief #187. Healthcare Cost and Utilization Project (HCUP) Statistical Briefs. Rockville (MD)2006. PubMed
2. Burke H, Leonardi-Bee J, Hashim A, et al. Prenatal and passive smoke exposure and incidence of asthma and wheeze: systematic review and meta-analysis. Pediatrics. 2012;129(4):735-744. PubMed
3. Jinot J, Bayard S. Respiratory health effects of exposure to environmental tobacco smoke. Rev Environ Health. 1996;11(3):89-100. PubMed
4. Wilson KM, Wesgate SC, Pier J, et al. Secondhand smoke exposure and serum cytokine levels in healthy children. Cytokine. 2012;60(1):34-37. PubMed
5. Feleszko W, Zawadzka-Krajewska A, Matysiak K, et al. Parental tobacco smoking is associated with augmented IL-13 secretion in children with allergic asthma. J Allergy Clin Immunol. 2006;117(1):97-102. PubMed
6. Cook DG, Strachan DP. Health effects of passive smoking-10: Summary of effects of parental smoking on the respiratory health of children and implications for research. Thorax. 1999;54(4):357-366. PubMed
7. Merianos AL, Dixon CA, Mahabee-Gittens EM. Secondhand smoke exposure, illness severity, and resource utilization in pediatric emergency department patients with respiratory illnesses. J Asthma. 2017;54(8):798-806. PubMed
8. Ahn A, Edwards KM, Grijalva CG, et al. Secondhand Smoke Exposure and Illness Severity among Children Hospitalized with Pneumonia. J Pediatr. 2015;167(4):869-874 e861. PubMed
9. Cheraghi M, Salvi S. Environmental tobacco smoke (ETS) and respiratory health in children. Eur J Pediatr. 2009;168(8):897-905. PubMed
10. Bradley JP, Bacharier LB, Bonfiglio J, et al. Severity of respiratory syncytial virus bronchiolitis is affected by cigarette smoke exposure and atopy. Pediatrics. 2005;115(1):e7-e14. PubMed
11. Desai AD, Zhou C, Stanford S, Haaland W, Varni JW, Mangione-Smith RM. Validity and responsiveness of the pediatric quality of life inventory (PedsQL) 4.0 generic core scales in the pediatric inpatient setting. JAMA Pediatr. 2014;168(12):1114-1121. PubMed
12. Varni JW, Seid M, Kurtin PS. PedsQL 4.0: reliability and validity of the Pediatric Quality of Life Inventory version 4.0 generic core scales in healthy and patient populations. Med Care. 2001;39(8):800-812. PubMed
13. Varni JW, Limbers CA, Neighbors K, et al. The PedsQL Infant Scales: feasibility, internal consistency reliability, and validity in healthy and ill infants. Qual Life Res. 2011;20(1):45-55.
14. Hullmann SE, Ryan JL, Ramsey RR, Chaney JM, Mullins LL. Measures of general pediatric quality of life: Child Health Questionnaire (CHQ), DISABKIDS Chronic Generic Measure (DCGM), KINDL-R, Pediatric Quality of Life Inventory (PedsQL) 4.0 Generic Core Scales, and Quality of My Life Questionnaire (QoML). Arthritis Care Res (Hoboken). 2011;63(11):S420-S430. PubMed
15. Varni JW, Seid M, Rode CA. The PedsQL: measurement model for the pediatric quality of life inventory. Med Care. 1999;37(2):126-139. PubMed
16. Varni JW, Burwinkle TM, Seid M, Skarr D. The PedsQL 4.0 as a pediatric population health measure: feasibility, reliability, and validity. Ambul Pediatr. 2003;3(6):329-341. PubMed
17. Varni JW, Burwinkle TM, Seid M. The PedsQL 4.0 as a school population health measure: feasibility, reliability, and validity. Qual Life Res. 2006;15(2):203-215. PubMed
18. Simon TD, Cawthon ML, Stanford S, et al. Pediatric medical complexity algorithm: a new method to stratify children by medical complexity. Pediatrics. 2014;133(6):e1647-e1654. PubMed
19. Chen J, Wang MP, Wang X, Viswanath K, Lam TH, Chan SS. Secondhand smoke exposure (SHS) and health-related quality of life (HRQoL) in Chinese never smokers in Hong Kong. BMJ Open. 2015;5(9):e007694. PubMed
20. Bridevaux PO, Cornuz J, Gaspoz JM, et al. Secondhand smoke and health-related quality of life in never smokers: results from the SAPALDIA cohort study 2. Arch Intern Med. 2007;167(22):2516-2523. PubMed
21. Wilson KM, Pier JC, Wesgate SC, Cohen JM, Blumkin AK. Secondhand tobacco smoke exposure and severity of influenza in hospitalized children. J Pediatr. 2013;162(1):16-21. PubMed
22. LeSon S, Gershwin ME. Risk factors for asthmatic patients requiring intubation. I. Observations in children. J Asthma. 1995;32(4):285-294. PubMed
23. Chilmonczyk BA, Salmun LM, Megathlin KN, et al. Association between exposure to environmental tobacco smoke and exacerbations of asthma in children. N Engl J Med. 1993;328(23):1665-1669. PubMed
24. Evans D, Levison MJ, Feldman CH, et al. The impact of passive smoking on emergency room visits of urban children with asthma. Am Rev Respir Dis. 1987;135(3):567-572. PubMed
25. Wilson KM, Wesgate SC, Best D, Blumkin AK, Klein JD. Admission screening for secondhand tobacco smoke exposure. Hosp Pediatr. 2012;2(1):26-33. PubMed
26. Marano C, Schober SE, Brody DJ, Zhang C. Secondhand tobacco smoke exposure among children and adolescents: United States, 2003-2006. Pediatrics. 2009;124(5):1299-1305. PubMed
27. Ralston S, Roohi M. A randomized, controlled trial of smoking cessation counseling provided during child hospitalization for respiratory illness. Pediatr Pulmonol. 2008;43(6):561-566. PubMed
28. Winickoff JP, Hillis VJ, Palfrey JS, Perrin JM, Rigotti NA. A smoking cessation intervention for parents of children who are hospitalized for respiratory illness: the stop tobacco outreach program. Pediatrics. 2003;111(1):140-145. PubMed
29. Torok MR, Lowary M, Ziniel SI, et al. Perceptions of parental tobacco dependence treatment among a children’s hospital staff. Hosp Pediatr. 2018;8(11):724-728. PubMed
30. Jenssen BP, Shelov ED, Bonafide CP, Bernstein SL, Fiks AG, Bryant-Stephens T. Clinical decision support tool for parental tobacco treatment in hospitalized children. Appl Clin Inform. 2016;7(2):399-411. PubMed
31. Lustre BL, Dixon CA, Merianos AL, Gordon JS, Zhang B, Mahabee-Gittens EM. Assessment of tobacco smoke exposure in the pediatric emergency department. Prev Med. 2016;85:42-46. PubMed
32. Groner JA, Rule AM, McGrath-Morrow SA, et al. Assessing pediatric tobacco exposure using parent report: comparison with hair nicotine. J Expo Sci Environ Epidemiol. 2018;28(6):530-537. PubMed
33. Gergen PJ. Environmental tobacco smoke as a risk factor for respiratory disease in children. Respir Physiol. 2001;128(1):39-46. PubMed
34. Klepeis NE, Nelson WC, Ott WR, et al. The National Human Activity Pattern Survey (NHAPS): a resource for assessing exposure to environmental pollutants. J Expo Anal Environ Epidemiol. 2001;11(3):231-252. PubMed
35. Couluris M, Schnapf BM, Casey A, Xu P, Gross-King M, Krischer J. How to measure secondhand smoke exposure in a pediatric clinic setting. Arch Pediatr Adolesc Med. 2011;165(7):670-671. PubMed
36. Boyaci H, Etiler N, Duman C, Basyigit I, Pala A. Environmental tobacco smoke exposure in school children: parent report and urine cotinine measures. Pediatr Int. 2006;48(4):382-389. PubMed
37. Varni JW, Limbers CA, Burwinkle TM. Parent proxy-report of their children’s health-related quality of life: an analysis of 13,878 parents’ reliability and validity across age subgroups using the PedsQL 4.0 Generic Core Scales. Health Qual Life Outcomes. 2007;5(1):2. PubMed
Acute respiratory illnesses (ARIs), including acute exacerbations of asthma, croup, pneumonia, and bronchiolitis, are among the most common illnesses in childhood.1 Although most ARIs can be managed in the outpatient setting,
Exposure to secondhand smoke (SHS) is a preventable risk factor for ARI in children, particularly when there is regular exposure in the home.2 Chronic exposure to SHS impacts systemic inflammation by suppressing serum interferon-gamma,3 which can lead to increased susceptibility to viral and bacterial infections,4 and increasing Th2 (atopic) cytokine expression, which is associated with asthma.5 SHS exposure in children has also been linked to diminished lung function.6 As a result, SHS exposure is associated with increased ARI susceptibility and severity in children.7-10
Much research has focused on the clinical impact of SHS exposure on respiratory health in children, but little is known about the impact on patient-reported outcomes, such as health-related quality of life (HRQOL). Patient-reported outcomes help provide a comprehensive evaluation of the effectiveness of healthcare delivery systems. These outcomes are increasingly used by health service researchers to better understand patient and caregiver perspectives.11 Given the known associations between SHS exposure and ARI morbidity, we postulated that regular SHS exposure would also impact HRQOL in children. In this study, we assessed the relationship between SHS exposure and HRQOL within a large, multicenter, prospective cohort of children presenting to the emergency department (ED) and/or hospital with ARI.
METHODS
Study Population
This study was nested within the Pediatric Respiratory Illness Measurement System (PRIMES) study, a prospective cohort study of children with ARI in the ED and inpatient settings at five tertiary care children’s hospitals within the Pediatric Research in Inpatient Settings Network in Colorado, Pennsylvania, Tennessee, Texas, and Washington. Eligible children were two weeks to 16 years of age hospitalized after presenting to the ED with a primary diagnosis of asthma, croup, bronchiolitis, or pneumonia between July 1, 2014 and June 30, 2016. Because of an anticipated low frequency of croup hospitalizations, we also included children presenting to the ED and then discharged to home with this diagnosis. Children were assigned to a PRIMES diagnosis group based on their final discharge diagnosis. If there was a discrepancy between admission and discharge diagnoses, the discharge diagnosis was used. If a child had more than one discharge diagnosis for a PRIMES condition (eg, acute asthma and pneumonia), we chose the PRIMES condition with the lowest total enrollments overall. If the final discharge diagnosis was not a PRIMES condition, the case was excluded from further analysis. Patients with immunodeficiency, cystic fibrosis, a history of prematurity <32 weeks, chronic neuromuscular disease, cardiovascular disease, pulmonary diseases (other than asthma), and moderate to severe developmental delay were also excluded. Children admitted to intensive care were eligible only if they were transferred to an acute care ward <72 hours following admission. A survey was administered at the time of enrollment that collected information on SHS exposure, HRQOL, healthcare utilization, and demographics. All study procedures were reviewed and approved by the institutional review boards at each of the participating hospitals.
SECONDHAND SMOKE EXPOSURE
To ascertain SHS exposure, we asked caregivers, “How many persons living in the child’s home smoke?” Responses were dichotomized into non-SHS exposed (0 smokers) and SHS exposed (≥1 smokers). Children with missing data on home SHS exposure were excluded.
Health-Related Quality of Life Outcomes
We estimated HRQOL using the Pediatric Quality of Life (PedsQLTM) 4.0 Generic Core and Infant Scales. The PedsQL instruments are validated, population HRQOL measures that evaluate the physical, mental, emotional, and social functioning of children two to 18 years old based on self- or caregiver-proxy report.12-15 These instruments have also shown responsiveness as well as construct and predictive validity in hospitalized children.11 For this study, we focused on the PedsQL physical functioning subscale, which assesses for problems with physical activities (eg, sports activity or exercise, low energy, and hurts or aches) on a five-point Likert scale (never to almost always a problem). Scores range from 0 to 100 with higher scores indicating a better HRQOL. The reported minimal clinically important difference (MCID), defined as the smallest difference in which individuals would perceive a benefit or would necessitate a change in management, for this scale is 4.5 points.16,17
Children >8 years old were invited to complete the self-report version of the PedsQL. For children <8 years old, and for older children who were unable to complete them, surveys were completed by a parent or legal guardian. Respondents were asked to assess perceptions of their (or their child’s) HRQOL during periods of baseline health (the child’s usual state of health in the month preceding the current illness) and during the acute illness (the child’s state of health at the time of admission) as SHS exposure may influence perceptions of general health and/or contribute to worse outcomes during periods of acute illness.
Covariates collected at the time of enrollment included sociodemographics (child age, gender, race/ethnicity, and caregiver education), and healthcare utilization (caregiver-reported patient visits to a healthcare provider in the preceding six months). Insurance status and level of medical complexity (using the Pediatric Medical Complexity Algorithm)18 were obtained using the Pediatric Hospital Information System database, an administrative database containing clinical and resource utilization data from >45 children’s hospitals in the United States including all of the PRIMES study hospitals.13
Analysis
Descriptive statistics included frequency (%) and mean (standard deviation). Bivariate comparisons according to SHS exposure status were analyzed using chi-squared tests for categorical variables and analysis of variance for continuous variables. Multivariable linear mixed regression models were used to examine associations between home SHS exposure and HRQOL for baseline health and during admission, overall and stratified by diagnosis. Covariates in each model included age, sex, race/ethnicity, caregiver education, and healthcare visits in the preceding six months. We also included a hospital random effect to account for clustering of patients within hospitals and used robust standard errors for inference.
In a secondary analysis to explore potential dose-response effects of SHS exposure, we examined associations between an ordinal exposure variable (0 smokers, 1 smoker, ≥2 smokers) and HRQOL for baseline health and during admission for the acute illness. Because of sample size limitations, diagnosis-specific analyses examining dose-response effects were not conducted.
RESULTS
Study Population
Of the 2,334 children enrolled in the PRIMES study, 25 (1%) respondents did not report on home SHS exposure and were excluded, yielding a final study population of 2,309 children, of whom 728 (32%) had reported home SHS exposure. The study population included 664 children with asthma (mean age seven years [3.5]; 38% with home SHS exposure), 740 with bronchiolitis (mean age 0.7 years [0.5]; 32% with home SHS exposure), 342 with croup (mean age 1.7 [1.1]; 25% with home SHS exposure), and 563 with pneumonia (mean age 4.4 [3.8]; 27% with home SHS exposure; Table 1). Compared with non-SHS-exposed children, those with home SHS exposure tend to be slightly older (3.9 vs 3.4 years, P = .01), more likely to be non-Hispanic Black (29% vs 19%, P < .001), to have a chronic condition (52% vs 41%, P < .001), to come from a household where caregiver(s) did not graduate from college (45% vs 29%, P < .001), and to have public insurance (73% vs 49%, P < .001).
Home SHS Exposure and Health-related Quality of Life
The overall mean HRQOL score for baseline health was 83 (15), with a range across diagnoses of 82 to 87. Compared with non-SHS-exposed children, children with home SHS exposure had a lower mean HRQOL score for baseline health (adjusted mean difference –3.04 [95% CI -4.34, –1.74]). In analyses stratified by diagnosis, baseline health scores were lower for SHS-exposed children for all four conditions, but differences were statistically significant only for bronchiolitis (adjusted mean difference –2.94 [–5.0, –0.89]) and pneumonia (adjusted mean value –4.13 [–6.82, –1.44]; Table 2); none of these differences met the MCID threshold.
The overall mean HRQOL score at the time of admission was 56 (23), with a range across diagnoses of 49 to 61, with lower scores noted among SHS-exposed children compared with non-SHS-exposed children (adjusted mean difference –2.16 [–4.22, –0.10]). Similar to scores representing baseline health, admission scores were lower across all four conditions for SHS-exposed children. Only children with croup, however, had significantly lower admission scores that also met the MCID threshold (adjusted mean difference –5.71 [–10.67, –0.75]; Table 2).
To assess for potential dose-response effects of SHS exposure on HRQOL, we stratified SHS-exposed children into those with one smoker in the home (n = 513) and those with ≥2 smokers in the home (n = 215). Compared with non-SHS-exposed children, both HRQOL scores (baseline health and admission) were lower for SHS-exposed children. Consistent with a dose-response association, scores were lowest for children with ≥2 smokers in the home, both at baseline health (adjusted mean difference –3.92 [–6.03, –1.81]) and on admission (adjusted mean difference –3.67 [–6.98, –0.36]; Table 3).
DISCUSSION
Within a multicenter cohort of 2,309 children hospitalized with ARI, we noted significantly lower HRQOL scores among children exposed to SHS in the home as compared with nonexposed children. Differences were greatest for children living with ≥2 smokers in the home. In analyses stratified by diagnosis, differences in baseline health HRQOL scores were greatest for children with bronchiolitis and pneumonia. Differences in acute illness scores were greatest for children with croup.16
Our study provides evidence for acute and chronic impacts of SHS on HRQOL in children hospitalized with ARI. Although several studies have linked SHS exposure to reduced HRQOL in adults,19,20 few similar studies have been conducted in children. Nonetheless, a wealth of studies have documented the negative impact of SHS exposure on clinical outcomes among children with ARI.8,10,21-23 Our findings that home SHS exposure was associated with reduced HRQOL among our cohort of children with ARI are therefore consistent with related findings in adults and children. The observation that the effects of SHS exposure on HRQOL were greatest among children living with ≥2 smokers provides further evidence of a potential causal link between regular SHS exposure and HRQOL.
Although the magnitude and significance of associations between SHS exposure and HRQOL varied for each of the four diagnoses for baseline health and the acute illness, it is important to note that the point estimates for the adjusted mean differences were uniformly lower for the SHS-exposed children in each subgroup. Even so, only acute illness scores for croup exceeded the MCID threshold.16 Croup is the only included condition of the upper airway and is characterized by laryngotracheal inflammation leading to the typical cough and, in moderate to severe cases, stridor. Given that chronic SHS exposure induces a proinflammatory state,3 it is possible that SHS-exposed children with croup had more severe illness compared with nonexposed children with croup resulting in lower HRQOL scores on admission. Further, perceived differences in illness severity and HRQOL may be more readily apparent in children with croup (eg, stridor at rest vs intermittent or no stridor) as compared with children with lower respiratory tract diseases.
Of the four included diagnoses, the link between SHS exposure and asthma outcomes has been most studied. Prior work has demonstrated more frequent and severe acute exacerbations, as well as worse long-term lung function among SHS-exposed children as compared with nonexposed children.22-24 It was, therefore, surprising that our study failed to demonstrate associations between SHS exposure and HRQOL among children with asthma. Reasons for this finding are unclear. One hypothesis is that caregivers of SHS-exposed children with asthma may be more aware of the impacts of SHS exposure on respiratory health (through prior education) and, thus, more likely to modify their smoking behaviors, or for their children to be on daily asthma controller therapy. Alternatively, caregivers of children with asthma may be more likely to underreport home SHS exposure. Thirty-eight percent of children with asthma, however, were classified as SHS-exposed. This percentage was greater than the other three conditions studied (25%-32%), suggesting that differential bias in underreporting was minimal. Given that children with asthma were older, on average, than children with the other three conditions, it may also be that these children spent more time in smoke-free environments (eg, school).
Nearly one-third of children in our study were exposed to SHS in the home. This is similar to the prevalence of exposure in other studies conducted among hospitalized children8,10,21,25 but higher than the national prevalence of home SHS exposure among children in the United States.26 Thus, hospitalized children represent a particularly vulnerable population and an important target for interventions aiming to reduce exposure to SHS. Although longitudinal interventions are likely necessary to affect long-term success, hospitalization for ARI may serve as a powerful teachable moment to begin cessation efforts. Hospitalization also offers time beyond a typical primary care outpatient encounter to focus on cessation counseling and may be the only opportunity to engage in counseling activities for some families with limited time or access. Further, prior studies have demonstrated both the feasibility and the effectiveness of smoking cessation interventions in hospitalized children.27-30 Unfortunately, however, SHS exposure is often not documented at the time of hospitalization, and many opportunities to intervene are missed.25,31 Thus, there is a need for improved strategies to reliably identify and intervene on SHS-exposed children in the hospital setting.
These findings should be considered in the context of several limitations. The observational nature of our study raises the potential for confounding, specifically with regard to socioeconomic status, as this is associated with both SHS exposure and lower HRQOL. Our modeling approach attempted to control for several factors associated with socioeconomic status, including caregiver education and insurance coverage, but there is potential for residual confounding. No single question is sufficient to fully assess SHS exposure as the intensity of home SHS exposure likely varies widely, and some children may be exposed to SHS outside of the home environment.32 The home, however, is often the most likely source of regular SHS exposure,33,34 especially among young children (our cohort’s mean age was 3.6 years). Misclassification of SHS exposure is also possible due to underreporting of smoking.35,36 As a result, some children regularly exposed to SHS may have been misclassified as nonexposed, and the observed associations between SHS exposure and HRQOL may be underestimated. Confirming our study’s findings using objective assessments of SHS exposure, such as cotinine, are warranted. Given the young age of our cohort, the PedsQL surveys were completed by the parent or legal guardian only in >90% of the enrolled subjects, and caregiver perceptions may not accurately reflect the child’s perceptions. Prior work, however, has demonstrated the validity of parent-proxy reporting of the PedsQL, including correlation with child self-report.37 In our study, correlation between child and caregiver reporting (when available) was also very good (r = 0.72, 95% CI 0.64, 0.77). It is also possible that the timing of the HRQOL assessments (on admission) may have biased perceptions of baseline HRQOL, although we anticipate any bias would likely be nondifferential between SHS-exposed and nonexposed children and across diagnoses.
Nearly one-third of children in our study were exposed to SHS exposure in the home, and SHS exposure was associated with lower HRQOL for baseline health and during acute illness, providing further evidence of the dangers of SHS. Much work is needed in order to eliminate the impact of SHS on child health and families of children hospitalized for respiratory illness should be considered a priority population for smoking cessation efforts.
Acknowledgment
The authors wish to acknowledge the efforts of PRIS-PRIMES study team. The authors also wish to thank the children and families who consented to be a part of the PRIMES study.
Disclosures
The authors have no conflicts of interest relevant to this article to disclose.
Funding
This study was supported by NIH-NHLBI 1R01HL121067 to RMS.
1. Witt WP, Weiss AJ, Elixhauser A. Overview of Hospital Stays for Children in the United States, 2012: Statistical Brief #187. Healthcare Cost and Utilization Project (HCUP) Statistical Briefs. Rockville (MD)2006. PubMed
2. Burke H, Leonardi-Bee J, Hashim A, et al. Prenatal and passive smoke exposure and incidence of asthma and wheeze: systematic review and meta-analysis. Pediatrics. 2012;129(4):735-744. PubMed
3. Jinot J, Bayard S. Respiratory health effects of exposure to environmental tobacco smoke. Rev Environ Health. 1996;11(3):89-100. PubMed
4. Wilson KM, Wesgate SC, Pier J, et al. Secondhand smoke exposure and serum cytokine levels in healthy children. Cytokine. 2012;60(1):34-37. PubMed
5. Feleszko W, Zawadzka-Krajewska A, Matysiak K, et al. Parental tobacco smoking is associated with augmented IL-13 secretion in children with allergic asthma. J Allergy Clin Immunol. 2006;117(1):97-102. PubMed
6. Cook DG, Strachan DP. Health effects of passive smoking-10: Summary of effects of parental smoking on the respiratory health of children and implications for research. Thorax. 1999;54(4):357-366. PubMed
7. Merianos AL, Dixon CA, Mahabee-Gittens EM. Secondhand smoke exposure, illness severity, and resource utilization in pediatric emergency department patients with respiratory illnesses. J Asthma. 2017;54(8):798-806. PubMed
8. Ahn A, Edwards KM, Grijalva CG, et al. Secondhand Smoke Exposure and Illness Severity among Children Hospitalized with Pneumonia. J Pediatr. 2015;167(4):869-874 e861. PubMed
9. Cheraghi M, Salvi S. Environmental tobacco smoke (ETS) and respiratory health in children. Eur J Pediatr. 2009;168(8):897-905. PubMed
10. Bradley JP, Bacharier LB, Bonfiglio J, et al. Severity of respiratory syncytial virus bronchiolitis is affected by cigarette smoke exposure and atopy. Pediatrics. 2005;115(1):e7-e14. PubMed
11. Desai AD, Zhou C, Stanford S, Haaland W, Varni JW, Mangione-Smith RM. Validity and responsiveness of the pediatric quality of life inventory (PedsQL) 4.0 generic core scales in the pediatric inpatient setting. JAMA Pediatr. 2014;168(12):1114-1121. PubMed
12. Varni JW, Seid M, Kurtin PS. PedsQL 4.0: reliability and validity of the Pediatric Quality of Life Inventory version 4.0 generic core scales in healthy and patient populations. Med Care. 2001;39(8):800-812. PubMed
13. Varni JW, Limbers CA, Neighbors K, et al. The PedsQL Infant Scales: feasibility, internal consistency reliability, and validity in healthy and ill infants. Qual Life Res. 2011;20(1):45-55.
14. Hullmann SE, Ryan JL, Ramsey RR, Chaney JM, Mullins LL. Measures of general pediatric quality of life: Child Health Questionnaire (CHQ), DISABKIDS Chronic Generic Measure (DCGM), KINDL-R, Pediatric Quality of Life Inventory (PedsQL) 4.0 Generic Core Scales, and Quality of My Life Questionnaire (QoML). Arthritis Care Res (Hoboken). 2011;63(11):S420-S430. PubMed
15. Varni JW, Seid M, Rode CA. The PedsQL: measurement model for the pediatric quality of life inventory. Med Care. 1999;37(2):126-139. PubMed
16. Varni JW, Burwinkle TM, Seid M, Skarr D. The PedsQL 4.0 as a pediatric population health measure: feasibility, reliability, and validity. Ambul Pediatr. 2003;3(6):329-341. PubMed
17. Varni JW, Burwinkle TM, Seid M. The PedsQL 4.0 as a school population health measure: feasibility, reliability, and validity. Qual Life Res. 2006;15(2):203-215. PubMed
18. Simon TD, Cawthon ML, Stanford S, et al. Pediatric medical complexity algorithm: a new method to stratify children by medical complexity. Pediatrics. 2014;133(6):e1647-e1654. PubMed
19. Chen J, Wang MP, Wang X, Viswanath K, Lam TH, Chan SS. Secondhand smoke exposure (SHS) and health-related quality of life (HRQoL) in Chinese never smokers in Hong Kong. BMJ Open. 2015;5(9):e007694. PubMed
20. Bridevaux PO, Cornuz J, Gaspoz JM, et al. Secondhand smoke and health-related quality of life in never smokers: results from the SAPALDIA cohort study 2. Arch Intern Med. 2007;167(22):2516-2523. PubMed
21. Wilson KM, Pier JC, Wesgate SC, Cohen JM, Blumkin AK. Secondhand tobacco smoke exposure and severity of influenza in hospitalized children. J Pediatr. 2013;162(1):16-21. PubMed
22. LeSon S, Gershwin ME. Risk factors for asthmatic patients requiring intubation. I. Observations in children. J Asthma. 1995;32(4):285-294. PubMed
23. Chilmonczyk BA, Salmun LM, Megathlin KN, et al. Association between exposure to environmental tobacco smoke and exacerbations of asthma in children. N Engl J Med. 1993;328(23):1665-1669. PubMed
24. Evans D, Levison MJ, Feldman CH, et al. The impact of passive smoking on emergency room visits of urban children with asthma. Am Rev Respir Dis. 1987;135(3):567-572. PubMed
25. Wilson KM, Wesgate SC, Best D, Blumkin AK, Klein JD. Admission screening for secondhand tobacco smoke exposure. Hosp Pediatr. 2012;2(1):26-33. PubMed
26. Marano C, Schober SE, Brody DJ, Zhang C. Secondhand tobacco smoke exposure among children and adolescents: United States, 2003-2006. Pediatrics. 2009;124(5):1299-1305. PubMed
27. Ralston S, Roohi M. A randomized, controlled trial of smoking cessation counseling provided during child hospitalization for respiratory illness. Pediatr Pulmonol. 2008;43(6):561-566. PubMed
28. Winickoff JP, Hillis VJ, Palfrey JS, Perrin JM, Rigotti NA. A smoking cessation intervention for parents of children who are hospitalized for respiratory illness: the stop tobacco outreach program. Pediatrics. 2003;111(1):140-145. PubMed
29. Torok MR, Lowary M, Ziniel SI, et al. Perceptions of parental tobacco dependence treatment among a children’s hospital staff. Hosp Pediatr. 2018;8(11):724-728. PubMed
30. Jenssen BP, Shelov ED, Bonafide CP, Bernstein SL, Fiks AG, Bryant-Stephens T. Clinical decision support tool for parental tobacco treatment in hospitalized children. Appl Clin Inform. 2016;7(2):399-411. PubMed
31. Lustre BL, Dixon CA, Merianos AL, Gordon JS, Zhang B, Mahabee-Gittens EM. Assessment of tobacco smoke exposure in the pediatric emergency department. Prev Med. 2016;85:42-46. PubMed
32. Groner JA, Rule AM, McGrath-Morrow SA, et al. Assessing pediatric tobacco exposure using parent report: comparison with hair nicotine. J Expo Sci Environ Epidemiol. 2018;28(6):530-537. PubMed
33. Gergen PJ. Environmental tobacco smoke as a risk factor for respiratory disease in children. Respir Physiol. 2001;128(1):39-46. PubMed
34. Klepeis NE, Nelson WC, Ott WR, et al. The National Human Activity Pattern Survey (NHAPS): a resource for assessing exposure to environmental pollutants. J Expo Anal Environ Epidemiol. 2001;11(3):231-252. PubMed
35. Couluris M, Schnapf BM, Casey A, Xu P, Gross-King M, Krischer J. How to measure secondhand smoke exposure in a pediatric clinic setting. Arch Pediatr Adolesc Med. 2011;165(7):670-671. PubMed
36. Boyaci H, Etiler N, Duman C, Basyigit I, Pala A. Environmental tobacco smoke exposure in school children: parent report and urine cotinine measures. Pediatr Int. 2006;48(4):382-389. PubMed
37. Varni JW, Limbers CA, Burwinkle TM. Parent proxy-report of their children’s health-related quality of life: an analysis of 13,878 parents’ reliability and validity across age subgroups using the PedsQL 4.0 Generic Core Scales. Health Qual Life Outcomes. 2007;5(1):2. PubMed
© 2019 Society of Hospital Medicine