User login
Factors Associated With COVID-19 Disease Severity in US Children and Adolescents
The COVID-19 pandemic has led to more than 40 million infections and more than 650,000 deaths in the United States alone.1 Morbidity and mortality have disproportionately affected older adults.2-4 However, acute infection and delayed effects, such as multisystem inflammatory syndrome in children (MIS-C), occur and can lead to severe complications, hospitalization, and death in pediatric patients.5,6 Due to higher clinical disease prevalence and morbidity in the adult population, we have learned much about the clinical factors associated with severe adult COVID-19 disease.5,7-9 Such clinical factors include older age, concurrent comorbidities, smoke exposure, and Black race or Hispanic ethnicity, among others.5,7-10 However, there is a paucity of data on severe COVID-19 disease in pediatric patients.5,11,12 In addition, most immunization strategies and pharmacologic treatments for COVID-19 have not been evaluated or approved for use in children.13 To guide targeted prevention and treatment strategies, there is a critical need to identify children and adolescents—who are among the most vulnerable patient populations—at high risk for severe disease.
Identifying the clinical factors associated with severe COVID-19 disease will help with prioritizing and allocating vaccines when they are approved for use in patients younger than 12 years.
METHODS
Study Design
We conducted a multicenter retrospective cohort study of patients presenting for care at pediatric hospitals that report data to the Pediatric Health Information System (PHIS) database. The PHIS administrative database includes billing and utilization data from 45 US tertiary care hospitals affiliated with the Children’s Hospital Association (Lenexa, Kansas). Data quality and reliability are ensured through a joint validation effort between the Children’s Hospital Association and participating hospitals. Hospitals submit discharge data, including demographics, diagnoses, and procedures using International Classification of Diseases, 10th Revision (ICD-10) codes, along with daily detailed information on pharmacy, location of care, and other services.
Study Population
Patients 30 days to 18 years of age discharged from the emergency department (ED) or inpatient setting with a primary diagnosis of COVID-19 (ICD-10 codes U.071 and U.072) between April 1, 2020, and September 30, 2020, were eligible for inclusion.14 In a prior study, the positive predictive value of an ICD-10–coded diagnosis of COVID-19 among hospitalized pediatric patients was 95.5%, compared with reverse transcription polymerase reaction results or presence of MIS-C.15 The diagnostic code for COVID-19 (ICD-10-CM) also had a high sensitivity (98.0%) in the hospitalized population.16 Acknowledging the increasing practice of screening patients upon admission, and in an attempt to minimize potential misclassification, we did not include encounters with secondary diagnoses of COVID-19 in our primary analyses. Pediatric patients with surgical diagnoses and neonates who never left the hospital were also excluded.
Factors Associated With Severe COVID-19 Disease
Exposures of interest were determined a priori based on current evidence in the literature and included patient age (0-4 years, 5-11 years, and 12-18 years), sex, race and ethnicity (non-Hispanic White, non-Hispanic Black, Hispanic, Asian, other non-White race [defined as Pacific Islander, Native American, or other]), payor type, cardiovascular complex chronic conditions (CCC), neuromuscular CCC, obesity/type 2 diabetes mellitus (DM), pulmonary CCC, asthma (defined using ICD-10 codes17), and immunocompromised CCC
Pediatric Complications and Conditions Associated With COVID-19
Based on current evidence and expert opinion of study members, associated diagnoses and complications co-occurring with a COVID-19 diagnosis were defined a priori and identified through ICD-10 codes (Appendix Table 1). These included acute kidney injury, acute liver injury, aseptic meningitis, asthma exacerbation, bronchiolitis, cerebral infarction, croup, encephalitis, encephalopathy, infant fever, febrile seizure, gastroenteritis/dehydration, Kawasaki disease/MIS-C, myocarditis/pericarditis, pneumonia, lung effusion or empyema, respiratory failure, sepsis, nonfebrile seizure, pancreatitis, sickle cell complications, and thrombotic complications.
Outcomes
COVID-19 severity outcomes were assessed as follows: (1) mild = ED discharge; (2) moderate = inpatient admission; (3) severe = intensive care unit (ICU) admission without mechanical ventilation, shock, or death; and (4) very severe = ICU admission with mechanical ventilation, shock, or death.19 This ordinal ranking system did not violate the proportional odds assumption. Potential reasons for admission to the ICU without mechanical ventilation, shock, or death include, but are not limited to, need for noninvasive ventilation, vital sign instability, dysrhythmias, respiratory insufficiency, or complications arising from concurrent conditions (eg, thrombotic events, need for continuous albuterol therapy). We examined several secondary, hospital-based outcomes, including associated diagnoses and complications, all-cause 30-day healthcare reutilization (ED visit or rehospitalization), length of stay (LOS), and ICU LOS.
Statistical Analysis
Demographic characteristics were summarized using frequencies and percentages for categorical variables and geometric means with SD and medians with interquartile ranges (IQR) for continuous variables, as appropriate. Factors associated with hospitalization (encompassing severity levels 2-4) vs ED discharge (severity level 1) were assessed using logistic regression. Factors associated with increasing severity among hospitalized pediatric patients (severity levels 2, 3, and 4) were assessed using ordinal logistic regression. Covariates in these analyses included race and ethnicity, age, sex, payor, cardiovascular CCC, neurologic/neuromuscular CCC, obesity/type 2 DM, pulmonary CCC, asthma, and immunocompromised CCC. Adjusted odds ratios (aOR) and corresponding 95% CI for each risk factor were generated using generalized linear mixed effects models and random intercepts for each hospital. Given the potential for diagnostic misclassification of pediatric patients with COVID-19 based on primary vs secondary diagnoses, we performed sensitivity analyses defining the study population as those with a primary diagnosis of COVID-19 and those with a secondary diagnosis of COVID-19 plus a concurrent primary diagnosis of a condition associated with COVID-19 (Appendix Table 1).
All analyses were performed using SAS version 9.4 (SAS Institute, Inc), and P < .05 was considered statistically significant. The Institutional Review Board at Vanderbilt University Medical Center determined that this study of de-identified data did not meet the criteria for human subjects research.
RESULTS
Study Population
A total of 19,976 encounters were included in the study. Of those, 15,913 (79.7%) were discharged from the ED and 4063 (20.3%) were hospitalized (Table 1). The most common race/ethnicity was Hispanic (9741, 48.8%), followed by non-Hispanic White (4217, 21.1%). Reference race/ethnicity data for the overall 2019 PHIS population can be found in Appendix Table 2.

The severity distribution among the hospitalized population was moderate (3222, 79.3%), severe (431, 11.3%), and very severe (380, 9.4%). The frequency of COVID-19 diagnoses increased late in the study period (Figure). Among those hospitalized, the median LOS for the index admission was 2 days (IQR, 1-4), while among those admitted to the ICU, the median LOS was 3 days (IQR, 2-5).

Overall, 10.1% (n = 2020) of the study population had an all-cause repeat encounter (ie, subsequent ED encounter or hospitalization) within 30 days following the index discharge. Repeat encounters were more frequent among patients hospitalized than among those discharged from the ED (Appendix Table 3).
Prevalence of Conditions and Complications Associated With COVID-19
Overall, 3257 (16.3%) patients had one or more co-occurring diagnoses categorized as a COVID-19–associated condition or complication. The most frequent diagnoses included lower respiratory tract disease (pneumonia, lung effusion, or empyema; n = 1415, 7.1%), gastroenteritis/dehydration (n = 1068, 5.3%), respiratory failure (n = 731, 3.7%), febrile infant (n = 413, 2.1%), and nonfebrile seizure (n = 425, 2.1%). Aside from nonfebrile seizure, neurological complications were less frequent and included febrile seizure (n = 155, 0.8%), encephalopathy (n = 63, 0.3%), aseptic meningitis (n = 16, 0.1%), encephalitis (n = 11, 0.1%), and cerebral infarction (n = 6, <0.1%). Kawasaki disease and MIS-C comprised 1.7% (n = 346) of diagnoses. Thrombotic complications occurred in 0.1% (n = 13) of patients. Overall, these conditions and complications associated with COVID-19 were more frequent in hospitalized patients than in those discharged from the ED (P < .001) (Table 2).

Factors Associated With COVID-19 Disease Severity
Compared to pediatric patients with COVID-19 discharged from the ED, factors associated with increased odds of hospitalization included private payor insurance; obesity/type 2 DM; asthma; and cardiovascular, immunocompromised, neurologic/neuromuscular, and pulmonary CCCs (Table 3). Factors associated with decreased risk of hospitalization included Black race or Hispanic ethnicity compared with White race; female sex; and age 5 to 11 years and age 12 to 17 years (vs age 0-4 years). Among children and adolescents hospitalized with COVID-19, factors associated with greater disease severity included Black or other non-White race; age 5 to 11 years; age 12 to 17 years; obesity/type 2 DM; immunocompromised conditions; and cardiovascular, neurologic/neuromuscular, and pulmonary CCCs (Table 3).

Sensitivity Analysis
We performed a sensitivity analysis that expanded the study population to include those with a secondary diagnosis of COVID-19 plus a diagnosis of a COVID-19–associated condition or complication. Analyses using the expanded population (N = 21,247) were similar to the primary analyses (Appendix Table 4 and Appendix Table 5).
DISCUSSION
In this large multicenter study evaluating COVID-19 disease severity in more than 19,000 patients presenting for emergency care at US pediatric hospitals, approximately 20% were hospitalized, and among those hospitalized almost a quarter required ICU care. Clinical risk factors associated with increased risk of hospitalization include private payor status and selected comorbidities (obesity/type 2 DM; asthma; and cardiovascular, pulmonary, immunocompromised, neurologic/neuromuscular CCCs), while those associated with decreased risk of hospitalization include older age, female sex, and Black race or Hispanic ethnicity. Factors associated with severe disease among hospitalized pediatric patients include Black or other non-White race, school age (≥5 years), and certain chronic conditions (cardiovascular disease, obesity/type 2 DM, neurologic or neuromuscular disease). Sixteen percent of patients had a concurrent diagnosis for a condition or complication associated with COVID-19.
While the study population (ie, children and adolescents presenting to the ED) represents a small fraction of children and adolescents in the community with SARS-CoV-2 infection, the results provide important insight into factors of severe COVID-19 in the pediatric population. A report from France suggested ventilatory or hemodynamic support or death were independently associated with older age (≥10 years), elevated C-reactive protein, and hypoxemia.12 An Italian study found that younger age (0-4 years) was associated with less severe disease, while preexisting conditions were more likely in patients with severe disease.11 A single-center case series of 50 patients (aged ≤21 years) hospitalized at a children’s hospital in New York City found respiratory failure (n = 9) was more common in children older than 1 year, patients with elevated inflammatory markers, and patients with obesity.20
Our study confirms several factors for severe COVID-19 found in these studies, including older age,11,12,20 obesity,20 and preexisting conditions.11 Our findings also expand on these reports, including identification of factors associated with hospitalization. Given the rate of 30-day re-encounters among pediatric patients with COVID-19 (10.1%), identifying risk factors for hospitalization may aid ED providers in determining optimal disposition (eg, home, hospital admission, ICU). We also identified specific comorbidities associated with more severe disease in those hospitalized with COVID-19, such as cardiovascular disease, obesity/type 2 DM, and pulmonary, neurologic, or neuromuscular conditions. We also found that asthma increased the risk for hospitalization but not more severe disease among those hospitalized. This latter finding also aligns with recent single-center studies,21,22 whereas a Turkish study of pediatric patients aged 0 to 18 years found no association between asthma and COVID-19 hospitalizations.23We also examined payor type and racial/ethnic factors in our analysis. In 2019, patients who identified as Black or Hispanic comprised 52.3% of all encounters and 40.7% of hospitalizations recorded in the PHIS database. During the same year, encounters for influenza among Black or Hispanic pediatric patients comprised 58.7% of all influenza diagnoses and 47.0% of pediatric influenza hospitalizations (Appendix Table 2). In this study, patients who identified as Black or Hispanic race represented a disproportionately large share of patients presenting to children’s hospitals (68.5%) and of those hospitalized (60.8%). Hispanic ethnicity, in particular, represented a disproportionate share of patients seeking care for COVID-19 compared to the overall PHIS population (47.7% and 27.1%, respectively). After accounting for other factors, we found Black and other non-White race—but not of Hispanic ethnicity—were independently associated with more disease severity among those hospitalized. This contrasts with findings from a recent adult study by Yehia et al,24 who found (after adjusting for other clinical factors) no significant difference in mortality between Black patients and White patients among adults hospitalized due to COVID-19. It also contrasts with a recent large population-based UK study wherein pediatric patients identifying as Asian, but not Black or mixed race or ethnicity, had an increased risk of hospital admission and admission to the ICU compared to children identifying as White. Children identifying as Black or mixed race had longer hospital admissions.25 However, as the authors of the study note, residual confounders and ascertainment bias due to differences in COVID testing may have influenced these findings.
Our findings of differences in hospitalization and disease severity among those hospitalized by race and ethnicity should be interpreted carefully. These may reflect a constellation of factors that are difficult to measure, including differences in healthcare access, inequalities in care (including hospital admission inequalities), and implicit bias—all of which may reflect structural racism. For example, it is possible that children who identify as Black or Hispanic have different access to care compared to children who identify as White, and this may affect disease severity on presentation.2 Alternatively, it is possible that White pediatric patients are more likely to be hospitalized as compared to non-White pediatric patients with similar illness severity. Our finding that pediatric patients who identify as Hispanic or Black had a lower risk of hospitalization should be also interpreted carefully, as this may reflect higher utilization of the ED for SARS-CoV-2 testing, increased use of nonemergency services among those without access to primary care, or systematic differences in provider decision-making among this segment of the population.2 Further study is needed to determine specific drivers for racial and ethnic differences in healthcare utilization in children and adolescents with COVID-19.26
Complications and co-occurring diagnoses in adults with COVID-19 are well documented.27-30 However, there is little information to date on the co-occurring diagnoses and complications associated with COVID-19 in children and adolescents. We found that complications and co-occurring conditions occurred in 16.3% of the study population, with the most frequent conditions including known complications of viral infections such as pneumonia, respiratory failure, and seizures. Acute kidney and liver injury, as well as thrombotic complications, occurred less commonly than in adults.26-29 Interestingly, neurologic complications were also uncommon compared to adult reports8,31 and less frequent than in other viral illnesses in children and adolescents. For example, neurologic complications occur in approximately 7.5% of children and adolescents hospitalized with influenza.32
Limitations of the present study include the retrospective design, as well as incomplete patient-level clinical data in the PHIS database. The PHIS database only includes children’s hospitals, which may limit the generalizability of findings to community hospitals. We also excluded newborns, and our findings may not be generalizable to this population. We only included children and adolescents with a primary diagnosis of COVID-19, which has the potential for misclassification in cases where COVID-19 was a secondary diagnosis. However, results of our sensitivity analysis, which incorporated secondary diagnoses of COVID-19, were consistent with findings from our main analyses. Our study was designed to examine associations between certain prespecified factors and COVID-19 severity among pediatric patients who visited the ED or were admitted to the hospital during the COVID-19 pandemic. Thus, our findings must be interpreted in light of these considerations and may not be generalizable outside the ED or hospital setting. For example, it could be that some segments of the population utilized ED resources for testing, whereas others avoided the ED and other healthcare settings for fear of exposure to SARS-CoV-2. We also relied on diagnosis codes to identify concurrent diagnoses, as well as mechanical ventilation in our very severe outcome cohort, which resulted in this classification for some of these diagnoses. Despite these limitations, our findings represent an important step in understanding the risk factors associated with severe clinical COVID-19 disease in pediatric patients.
Our findings may inform future research and clinical interventions. Future studies on antiviral therapies and immune modulators targeting SARS-CoV-2 infection in children and adolescents should focus on high-risk populations, such as those identified in the study, as these patients are most likely to benefit from therapeutic interventions. Similarly, vaccine-development efforts may benefit from additional evaluation in high-risk populations, some of which may have altered immune responses. Furthermore, with increasing vaccination among adults and changes in recommendations, societal mitigation efforts (eg, masking, physical distancing) will diminish. Continued vigilance and COVID-19–mitigation efforts among high-risk children, for whom vaccines are not yet available, are critical during this transition.
CONCLUSION
Among children with COVID-19 who received care at children’s hospitals and EDs, 20% were hospitalized, and, of those, 21% were admitted to the ICU. Older children and adolescent patients had a lower risk of hospitalization; however, when hospitalized, they had greater illness severity. Those with selected comorbidities (eg, cardiovascular, obesity/type 2 DM, pulmonary and neurologic or neuromuscular disease) had both increased odds of hospitalization and in-hospital illness severity. While there were observed differences in COVID-19 severity by race and ethnicity, additional research is needed to clarify the drivers of such disparities. These factors should be considered when prioritizing mitigation strategies to prevent infection (eg, remote learning, avoidance of group activities, prioritization of COVID-19 vaccine when approved for children aged <12 years).
1. Centers for Disease Control and Prevention. COVID data tracker. Accessed September 9, 2021. https://covid.cdc.gov/covid-data-tracker/#datatracker-home
2. Levy C, Basmaci R, Bensaid P, et al. Changes in reverse transcription polymerase chain reaction-positive severe acute respiratory syndrome coronavirus 2 rates in adults and children according to the epidemic stages. Pediatr Infect Dis J. 2020;39(11):e369-e372. https://doi.org/10.1097/inf.0000000000002861
3. Gudbjartsson DF, Helgason A, Jonsson H, et al. Spread of SARS-CoV-2 in the Icelandic population. N Engl J Med. 2020;382(24):2302-2315. https://doi.org/10.1056/nejmoa2006100
4. Garg S, Kim L, Whitaker M, et al. Hospitalization rates and characteristics of patients hospitalized with laboratory-confirmed coronavirus disease 2019 - COVID-NET, 14 States, March 1-30, 2020. MMWR Morb Mortal Wkly Rep. 2020;69(15):458-464. https://doi.org/10.15585/mmwr.mm6915e3
5. Castagnoli R, Votto M, Licari A, et al. Severe acute respiratory syndrome coronavirus 2 (SARS-CoV-2) infection in children and adolescents: a systematic review. JAMA Pediatr. 2020;174(9):882-889. https://doi.org/10.1001/jamapediatrics.2020.1467
6. Feldstein LR, Rose EB, Horwitz SM, et al; Overcoming COVID-19 Investigators; CDC COVID-19 Response Team. Multisystem inflammatory syndrome in U.S. children and adolescents. N Engl J Med. 2020;383(4):334-346. https://doi.org/10.1056/nejmoa2021680
7. Magro B, Zuccaro V, Novelli L, et al. Predicting in-hospital mortality from coronavirus disease 2019: a simple validated app for clinical use. PLoS One. 2021;16(1):e0245281. https://doi.org/10.1371/journal.pone.0245281
8. Helms J, Kremer S, Merdji H, et al. Neurologic features in severe SARS-CoV-2 infection. N Engl J Med. 2020;382(23):2268-2270. https://doi.org/10.1056/nejmc2008597
9. Severe Covid GWAS Group; Ellinghaus D, Degenhardt F, Bujanda L, et al. Genomewide association study of severe Covid-19 with respiratory failure. N Engl J Med. 2020;383(16):1522-1534.
10. Kabarriti R, Brodin NP, Maron MI, et al. association of race and ethnicity with comorbidities and survival among patients with COVID-19 at an urban medical center in New York. JAMA Netw Open. 2020;3(9):e2019795. https://doi.org/10.1001/jamanetworkopen.2020.19795
11. Bellino S, Punzo O, Rota MC, et al; COVID-19 Working Group. COVID-19 disease severity risk factors for pediatric patients in Italy. Pediatrics. 2020;146(4):e2020009399. https://doi.org/10.1542/peds.2020-009399
12. Ouldali N, Yang DD, Madhi F, et al; investigator group of the PANDOR study. Factors associated with severe SARS-CoV-2 infection. Pediatrics. 2020;147(3):e2020023432. https://doi.org/10.1542/peds.2020-023432
13. Castells MC, Phillips EJ. Maintaining safety with SARS-CoV-2 vaccines. N Engl J Med. 2021;384(7):643-649. https://doi.org/10.1056/nejmra2035343
14. Antoon JW, Williams DJ, Thurm C, et al. The COVID-19 pandemic and changes in healthcare utilization for pediatric respiratory and nonrespiratory illnesses in the United States. J Hosp Med. 2021;16(5):294-297. https://doi.org/10.12788/jhm.3608
15. Blatz AM, David MZ, Otto WR, Luan X, Gerber JS. Validation of International Classification of Disease-10 code for identifying children hospitalized with coronavirus disease-2019. J Pediatric Infect Dis Soc. 2020;10(4):547-548. https://doi.org/10.1093/jpids/piaa140
16. Kadri SS, Gundrum J, Warner S, et al. Uptake and accuracy of the diagnosis code for COVID-19 among US hospitalizations. JAMA. 2020;324(24):2553-2554. https://doi.org/10.1001/jama.2020.20323
17. Kaiser SV, Rodean J, Bekmezian A, et al; Pediatric Research in Inpatient Settings (PRIS) Network. Effectiveness of pediatric asthma pathways for hospitalized children: a multicenter, national analysis. J Pediatr. 2018;197:165-171.e162. https://doi.org/10.1016/j.jpeds.2018.01.084
18. Feudtner C, Feinstein JA, Zhong W, Hall M, Dai D. Pediatric complex chronic conditions classification system version 2: updated for ICD-10 and complex medical technology dependence and transplantation. BMC Pediatr. 2014;14:199. https://doi.org/10.1186/1471-2431-14-199.
19. Williams DJ, Zhu Y, Grijalva CG, et al. Predicting severe pneumonia outcomes in children. Pediatrics. 2016;138(4):e20161019. https://doi.org/10.1542/peds.2016-1019
20. Zachariah P, Johnson CL, Halabi KC, et al. Epidemiology, clinical features, and disease severity in patients with coronavirus disease 2019 (COVID-19) in a children’s hospital in New York City, New York. JAMA Pediatr. 2020;174(10):e202430. https://doi.org/10.1001/jamapediatrics.2020.2430
21. DeBiasi RL, Song X, Delaney M, et al. Severe coronavirus disease-2019 in children and young adults in the Washington, DC, metropolitan region. J Pediatr. 2020;223:199-203.e191. https://doi.org/10.1016/j.jpeds.2020.05.007
22. Lovinsky-Desir S, Deshpande DR, De A, et al. Asthma among hospitalized patients with COVID-19 and related outcomes. J Allergy Clin Immunol. 2020;146(5):1027-1034.e1024. https://doi.org/10.1016/j.jaci.2020.07.026
23. Beken B, Ozturk GK, Aygun FD, Aydogmus C, Akar HH. Asthma and allergic diseases are not risk factors for hospitalization in children with coronavirus disease 2019. Ann Allergy Asthma Immunol. 2021;126(5):569-575. https://doi.org/10.1016/j.anai.2021.01.018
24. Yehia BR, Winegar A, Fogel R, et al. Association of race with mortality among patients hospitalized with coronavirus disease 2019 (COVID-19) at 92 US hospitals. JAMA Netw Open. 2020;3(8):e2018039. https://doi.org/10.1001/jamanetworkopen.2020.18039
25. Saatci D, Ranger TA, Garriga C, et al. Association between race and COVID-19 outcomes among 2.6 million children in England. JAMA Pediatr. 2021;e211685. https://doi.org/10.1001/jamapediatrics.2021.1685
26. Lopez L, 3rd, Hart LH, 3rd, Katz MH. Racial and ethnic health disparities related to COVID-19. JAMA. 2021;325(8):719-720. https://doi.org/10.1001/jama.2020.26443
27. Altunok ES, Alkan M, Kamat S, et al. Clinical characteristics of adult patients hospitalized with laboratory-confirmed COVID-19 pneumonia. J Infect Chemother. 2020. https://doi.org/10.1016/j.jiac.2020.10.020
28. Ali H, Daoud A, Mohamed MM, et al. Survival rate in acute kidney injury superimposed COVID-19 patients: a systematic review and meta-analysis. Ren Fail. 2020;42(1):393-397. https://doi.org/10.1080/0886022x.2020.1756323
29. Anirvan P, Bharali P, Gogoi M, Thuluvath PJ, Singh SP, Satapathy SK. Liver injury in COVID-19: the hepatic aspect of the respiratory syndrome - what we know so far. World J Hepatol. 2020;12(12):1182-1197. https://doi.org/10.4254/wjh.v12.i12.1182
30. Moschonas IC, Tselepis AD. SARS-CoV-2 infection and thrombotic complications: a narrative review. J Thromb Thrombolysis. 2021;52(1):111-123. https://doi.org/10.1007/s11239-020-02374-3
31. Lee MH, Perl DP, Nair G, et al. Microvascular injury in the brains of patients with Covid-19. N Engl J Med. 2020;384(5):481-483. https://doi.org/10.1056/nejmc2033369
32. Antoon JW, Hall M, Herndon A, et al. Prevalence, risk factors, and outcomes of influenza-associated neurological Complications in Children. J Pediatr. 2021;S0022-3476(21)00657-0. https://doi.org/10.1016/j.jpeds.2021.06.075
The COVID-19 pandemic has led to more than 40 million infections and more than 650,000 deaths in the United States alone.1 Morbidity and mortality have disproportionately affected older adults.2-4 However, acute infection and delayed effects, such as multisystem inflammatory syndrome in children (MIS-C), occur and can lead to severe complications, hospitalization, and death in pediatric patients.5,6 Due to higher clinical disease prevalence and morbidity in the adult population, we have learned much about the clinical factors associated with severe adult COVID-19 disease.5,7-9 Such clinical factors include older age, concurrent comorbidities, smoke exposure, and Black race or Hispanic ethnicity, among others.5,7-10 However, there is a paucity of data on severe COVID-19 disease in pediatric patients.5,11,12 In addition, most immunization strategies and pharmacologic treatments for COVID-19 have not been evaluated or approved for use in children.13 To guide targeted prevention and treatment strategies, there is a critical need to identify children and adolescents—who are among the most vulnerable patient populations—at high risk for severe disease.
Identifying the clinical factors associated with severe COVID-19 disease will help with prioritizing and allocating vaccines when they are approved for use in patients younger than 12 years.
METHODS
Study Design
We conducted a multicenter retrospective cohort study of patients presenting for care at pediatric hospitals that report data to the Pediatric Health Information System (PHIS) database. The PHIS administrative database includes billing and utilization data from 45 US tertiary care hospitals affiliated with the Children’s Hospital Association (Lenexa, Kansas). Data quality and reliability are ensured through a joint validation effort between the Children’s Hospital Association and participating hospitals. Hospitals submit discharge data, including demographics, diagnoses, and procedures using International Classification of Diseases, 10th Revision (ICD-10) codes, along with daily detailed information on pharmacy, location of care, and other services.
Study Population
Patients 30 days to 18 years of age discharged from the emergency department (ED) or inpatient setting with a primary diagnosis of COVID-19 (ICD-10 codes U.071 and U.072) between April 1, 2020, and September 30, 2020, were eligible for inclusion.14 In a prior study, the positive predictive value of an ICD-10–coded diagnosis of COVID-19 among hospitalized pediatric patients was 95.5%, compared with reverse transcription polymerase reaction results or presence of MIS-C.15 The diagnostic code for COVID-19 (ICD-10-CM) also had a high sensitivity (98.0%) in the hospitalized population.16 Acknowledging the increasing practice of screening patients upon admission, and in an attempt to minimize potential misclassification, we did not include encounters with secondary diagnoses of COVID-19 in our primary analyses. Pediatric patients with surgical diagnoses and neonates who never left the hospital were also excluded.
Factors Associated With Severe COVID-19 Disease
Exposures of interest were determined a priori based on current evidence in the literature and included patient age (0-4 years, 5-11 years, and 12-18 years), sex, race and ethnicity (non-Hispanic White, non-Hispanic Black, Hispanic, Asian, other non-White race [defined as Pacific Islander, Native American, or other]), payor type, cardiovascular complex chronic conditions (CCC), neuromuscular CCC, obesity/type 2 diabetes mellitus (DM), pulmonary CCC, asthma (defined using ICD-10 codes17), and immunocompromised CCC
Pediatric Complications and Conditions Associated With COVID-19
Based on current evidence and expert opinion of study members, associated diagnoses and complications co-occurring with a COVID-19 diagnosis were defined a priori and identified through ICD-10 codes (Appendix Table 1). These included acute kidney injury, acute liver injury, aseptic meningitis, asthma exacerbation, bronchiolitis, cerebral infarction, croup, encephalitis, encephalopathy, infant fever, febrile seizure, gastroenteritis/dehydration, Kawasaki disease/MIS-C, myocarditis/pericarditis, pneumonia, lung effusion or empyema, respiratory failure, sepsis, nonfebrile seizure, pancreatitis, sickle cell complications, and thrombotic complications.
Outcomes
COVID-19 severity outcomes were assessed as follows: (1) mild = ED discharge; (2) moderate = inpatient admission; (3) severe = intensive care unit (ICU) admission without mechanical ventilation, shock, or death; and (4) very severe = ICU admission with mechanical ventilation, shock, or death.19 This ordinal ranking system did not violate the proportional odds assumption. Potential reasons for admission to the ICU without mechanical ventilation, shock, or death include, but are not limited to, need for noninvasive ventilation, vital sign instability, dysrhythmias, respiratory insufficiency, or complications arising from concurrent conditions (eg, thrombotic events, need for continuous albuterol therapy). We examined several secondary, hospital-based outcomes, including associated diagnoses and complications, all-cause 30-day healthcare reutilization (ED visit or rehospitalization), length of stay (LOS), and ICU LOS.
Statistical Analysis
Demographic characteristics were summarized using frequencies and percentages for categorical variables and geometric means with SD and medians with interquartile ranges (IQR) for continuous variables, as appropriate. Factors associated with hospitalization (encompassing severity levels 2-4) vs ED discharge (severity level 1) were assessed using logistic regression. Factors associated with increasing severity among hospitalized pediatric patients (severity levels 2, 3, and 4) were assessed using ordinal logistic regression. Covariates in these analyses included race and ethnicity, age, sex, payor, cardiovascular CCC, neurologic/neuromuscular CCC, obesity/type 2 DM, pulmonary CCC, asthma, and immunocompromised CCC. Adjusted odds ratios (aOR) and corresponding 95% CI for each risk factor were generated using generalized linear mixed effects models and random intercepts for each hospital. Given the potential for diagnostic misclassification of pediatric patients with COVID-19 based on primary vs secondary diagnoses, we performed sensitivity analyses defining the study population as those with a primary diagnosis of COVID-19 and those with a secondary diagnosis of COVID-19 plus a concurrent primary diagnosis of a condition associated with COVID-19 (Appendix Table 1).
All analyses were performed using SAS version 9.4 (SAS Institute, Inc), and P < .05 was considered statistically significant. The Institutional Review Board at Vanderbilt University Medical Center determined that this study of de-identified data did not meet the criteria for human subjects research.
RESULTS
Study Population
A total of 19,976 encounters were included in the study. Of those, 15,913 (79.7%) were discharged from the ED and 4063 (20.3%) were hospitalized (Table 1). The most common race/ethnicity was Hispanic (9741, 48.8%), followed by non-Hispanic White (4217, 21.1%). Reference race/ethnicity data for the overall 2019 PHIS population can be found in Appendix Table 2.
The severity distribution among the hospitalized population was moderate (3222, 79.3%), severe (431, 11.3%), and very severe (380, 9.4%). The frequency of COVID-19 diagnoses increased late in the study period (Figure). Among those hospitalized, the median LOS for the index admission was 2 days (IQR, 1-4), while among those admitted to the ICU, the median LOS was 3 days (IQR, 2-5).
Overall, 10.1% (n = 2020) of the study population had an all-cause repeat encounter (ie, subsequent ED encounter or hospitalization) within 30 days following the index discharge. Repeat encounters were more frequent among patients hospitalized than among those discharged from the ED (Appendix Table 3).
Prevalence of Conditions and Complications Associated With COVID-19
Overall, 3257 (16.3%) patients had one or more co-occurring diagnoses categorized as a COVID-19–associated condition or complication. The most frequent diagnoses included lower respiratory tract disease (pneumonia, lung effusion, or empyema; n = 1415, 7.1%), gastroenteritis/dehydration (n = 1068, 5.3%), respiratory failure (n = 731, 3.7%), febrile infant (n = 413, 2.1%), and nonfebrile seizure (n = 425, 2.1%). Aside from nonfebrile seizure, neurological complications were less frequent and included febrile seizure (n = 155, 0.8%), encephalopathy (n = 63, 0.3%), aseptic meningitis (n = 16, 0.1%), encephalitis (n = 11, 0.1%), and cerebral infarction (n = 6, <0.1%). Kawasaki disease and MIS-C comprised 1.7% (n = 346) of diagnoses. Thrombotic complications occurred in 0.1% (n = 13) of patients. Overall, these conditions and complications associated with COVID-19 were more frequent in hospitalized patients than in those discharged from the ED (P < .001) (Table 2).
Factors Associated With COVID-19 Disease Severity
Compared to pediatric patients with COVID-19 discharged from the ED, factors associated with increased odds of hospitalization included private payor insurance; obesity/type 2 DM; asthma; and cardiovascular, immunocompromised, neurologic/neuromuscular, and pulmonary CCCs (Table 3). Factors associated with decreased risk of hospitalization included Black race or Hispanic ethnicity compared with White race; female sex; and age 5 to 11 years and age 12 to 17 years (vs age 0-4 years). Among children and adolescents hospitalized with COVID-19, factors associated with greater disease severity included Black or other non-White race; age 5 to 11 years; age 12 to 17 years; obesity/type 2 DM; immunocompromised conditions; and cardiovascular, neurologic/neuromuscular, and pulmonary CCCs (Table 3).
Sensitivity Analysis
We performed a sensitivity analysis that expanded the study population to include those with a secondary diagnosis of COVID-19 plus a diagnosis of a COVID-19–associated condition or complication. Analyses using the expanded population (N = 21,247) were similar to the primary analyses (Appendix Table 4 and Appendix Table 5).
DISCUSSION
In this large multicenter study evaluating COVID-19 disease severity in more than 19,000 patients presenting for emergency care at US pediatric hospitals, approximately 20% were hospitalized, and among those hospitalized almost a quarter required ICU care. Clinical risk factors associated with increased risk of hospitalization include private payor status and selected comorbidities (obesity/type 2 DM; asthma; and cardiovascular, pulmonary, immunocompromised, neurologic/neuromuscular CCCs), while those associated with decreased risk of hospitalization include older age, female sex, and Black race or Hispanic ethnicity. Factors associated with severe disease among hospitalized pediatric patients include Black or other non-White race, school age (≥5 years), and certain chronic conditions (cardiovascular disease, obesity/type 2 DM, neurologic or neuromuscular disease). Sixteen percent of patients had a concurrent diagnosis for a condition or complication associated with COVID-19.
While the study population (ie, children and adolescents presenting to the ED) represents a small fraction of children and adolescents in the community with SARS-CoV-2 infection, the results provide important insight into factors of severe COVID-19 in the pediatric population. A report from France suggested ventilatory or hemodynamic support or death were independently associated with older age (≥10 years), elevated C-reactive protein, and hypoxemia.12 An Italian study found that younger age (0-4 years) was associated with less severe disease, while preexisting conditions were more likely in patients with severe disease.11 A single-center case series of 50 patients (aged ≤21 years) hospitalized at a children’s hospital in New York City found respiratory failure (n = 9) was more common in children older than 1 year, patients with elevated inflammatory markers, and patients with obesity.20
Our study confirms several factors for severe COVID-19 found in these studies, including older age,11,12,20 obesity,20 and preexisting conditions.11 Our findings also expand on these reports, including identification of factors associated with hospitalization. Given the rate of 30-day re-encounters among pediatric patients with COVID-19 (10.1%), identifying risk factors for hospitalization may aid ED providers in determining optimal disposition (eg, home, hospital admission, ICU). We also identified specific comorbidities associated with more severe disease in those hospitalized with COVID-19, such as cardiovascular disease, obesity/type 2 DM, and pulmonary, neurologic, or neuromuscular conditions. We also found that asthma increased the risk for hospitalization but not more severe disease among those hospitalized. This latter finding also aligns with recent single-center studies,21,22 whereas a Turkish study of pediatric patients aged 0 to 18 years found no association between asthma and COVID-19 hospitalizations.23We also examined payor type and racial/ethnic factors in our analysis. In 2019, patients who identified as Black or Hispanic comprised 52.3% of all encounters and 40.7% of hospitalizations recorded in the PHIS database. During the same year, encounters for influenza among Black or Hispanic pediatric patients comprised 58.7% of all influenza diagnoses and 47.0% of pediatric influenza hospitalizations (Appendix Table 2). In this study, patients who identified as Black or Hispanic race represented a disproportionately large share of patients presenting to children’s hospitals (68.5%) and of those hospitalized (60.8%). Hispanic ethnicity, in particular, represented a disproportionate share of patients seeking care for COVID-19 compared to the overall PHIS population (47.7% and 27.1%, respectively). After accounting for other factors, we found Black and other non-White race—but not of Hispanic ethnicity—were independently associated with more disease severity among those hospitalized. This contrasts with findings from a recent adult study by Yehia et al,24 who found (after adjusting for other clinical factors) no significant difference in mortality between Black patients and White patients among adults hospitalized due to COVID-19. It also contrasts with a recent large population-based UK study wherein pediatric patients identifying as Asian, but not Black or mixed race or ethnicity, had an increased risk of hospital admission and admission to the ICU compared to children identifying as White. Children identifying as Black or mixed race had longer hospital admissions.25 However, as the authors of the study note, residual confounders and ascertainment bias due to differences in COVID testing may have influenced these findings.
Our findings of differences in hospitalization and disease severity among those hospitalized by race and ethnicity should be interpreted carefully. These may reflect a constellation of factors that are difficult to measure, including differences in healthcare access, inequalities in care (including hospital admission inequalities), and implicit bias—all of which may reflect structural racism. For example, it is possible that children who identify as Black or Hispanic have different access to care compared to children who identify as White, and this may affect disease severity on presentation.2 Alternatively, it is possible that White pediatric patients are more likely to be hospitalized as compared to non-White pediatric patients with similar illness severity. Our finding that pediatric patients who identify as Hispanic or Black had a lower risk of hospitalization should be also interpreted carefully, as this may reflect higher utilization of the ED for SARS-CoV-2 testing, increased use of nonemergency services among those without access to primary care, or systematic differences in provider decision-making among this segment of the population.2 Further study is needed to determine specific drivers for racial and ethnic differences in healthcare utilization in children and adolescents with COVID-19.26
Complications and co-occurring diagnoses in adults with COVID-19 are well documented.27-30 However, there is little information to date on the co-occurring diagnoses and complications associated with COVID-19 in children and adolescents. We found that complications and co-occurring conditions occurred in 16.3% of the study population, with the most frequent conditions including known complications of viral infections such as pneumonia, respiratory failure, and seizures. Acute kidney and liver injury, as well as thrombotic complications, occurred less commonly than in adults.26-29 Interestingly, neurologic complications were also uncommon compared to adult reports8,31 and less frequent than in other viral illnesses in children and adolescents. For example, neurologic complications occur in approximately 7.5% of children and adolescents hospitalized with influenza.32
Limitations of the present study include the retrospective design, as well as incomplete patient-level clinical data in the PHIS database. The PHIS database only includes children’s hospitals, which may limit the generalizability of findings to community hospitals. We also excluded newborns, and our findings may not be generalizable to this population. We only included children and adolescents with a primary diagnosis of COVID-19, which has the potential for misclassification in cases where COVID-19 was a secondary diagnosis. However, results of our sensitivity analysis, which incorporated secondary diagnoses of COVID-19, were consistent with findings from our main analyses. Our study was designed to examine associations between certain prespecified factors and COVID-19 severity among pediatric patients who visited the ED or were admitted to the hospital during the COVID-19 pandemic. Thus, our findings must be interpreted in light of these considerations and may not be generalizable outside the ED or hospital setting. For example, it could be that some segments of the population utilized ED resources for testing, whereas others avoided the ED and other healthcare settings for fear of exposure to SARS-CoV-2. We also relied on diagnosis codes to identify concurrent diagnoses, as well as mechanical ventilation in our very severe outcome cohort, which resulted in this classification for some of these diagnoses. Despite these limitations, our findings represent an important step in understanding the risk factors associated with severe clinical COVID-19 disease in pediatric patients.
Our findings may inform future research and clinical interventions. Future studies on antiviral therapies and immune modulators targeting SARS-CoV-2 infection in children and adolescents should focus on high-risk populations, such as those identified in the study, as these patients are most likely to benefit from therapeutic interventions. Similarly, vaccine-development efforts may benefit from additional evaluation in high-risk populations, some of which may have altered immune responses. Furthermore, with increasing vaccination among adults and changes in recommendations, societal mitigation efforts (eg, masking, physical distancing) will diminish. Continued vigilance and COVID-19–mitigation efforts among high-risk children, for whom vaccines are not yet available, are critical during this transition.
CONCLUSION
Among children with COVID-19 who received care at children’s hospitals and EDs, 20% were hospitalized, and, of those, 21% were admitted to the ICU. Older children and adolescent patients had a lower risk of hospitalization; however, when hospitalized, they had greater illness severity. Those with selected comorbidities (eg, cardiovascular, obesity/type 2 DM, pulmonary and neurologic or neuromuscular disease) had both increased odds of hospitalization and in-hospital illness severity. While there were observed differences in COVID-19 severity by race and ethnicity, additional research is needed to clarify the drivers of such disparities. These factors should be considered when prioritizing mitigation strategies to prevent infection (eg, remote learning, avoidance of group activities, prioritization of COVID-19 vaccine when approved for children aged <12 years).
1. Centers for Disease Control and Prevention. COVID data tracker. Accessed September 9, 2021. https://covid.cdc.gov/covid-data-tracker/#datatracker-home
2. Levy C, Basmaci R, Bensaid P, et al. Changes in reverse transcription polymerase chain reaction-positive severe acute respiratory syndrome coronavirus 2 rates in adults and children according to the epidemic stages. Pediatr Infect Dis J. 2020;39(11):e369-e372. https://doi.org/10.1097/inf.0000000000002861
3. Gudbjartsson DF, Helgason A, Jonsson H, et al. Spread of SARS-CoV-2 in the Icelandic population. N Engl J Med. 2020;382(24):2302-2315. https://doi.org/10.1056/nejmoa2006100
4. Garg S, Kim L, Whitaker M, et al. Hospitalization rates and characteristics of patients hospitalized with laboratory-confirmed coronavirus disease 2019 - COVID-NET, 14 States, March 1-30, 2020. MMWR Morb Mortal Wkly Rep. 2020;69(15):458-464. https://doi.org/10.15585/mmwr.mm6915e3
5. Castagnoli R, Votto M, Licari A, et al. Severe acute respiratory syndrome coronavirus 2 (SARS-CoV-2) infection in children and adolescents: a systematic review. JAMA Pediatr. 2020;174(9):882-889. https://doi.org/10.1001/jamapediatrics.2020.1467
6. Feldstein LR, Rose EB, Horwitz SM, et al; Overcoming COVID-19 Investigators; CDC COVID-19 Response Team. Multisystem inflammatory syndrome in U.S. children and adolescents. N Engl J Med. 2020;383(4):334-346. https://doi.org/10.1056/nejmoa2021680
7. Magro B, Zuccaro V, Novelli L, et al. Predicting in-hospital mortality from coronavirus disease 2019: a simple validated app for clinical use. PLoS One. 2021;16(1):e0245281. https://doi.org/10.1371/journal.pone.0245281
8. Helms J, Kremer S, Merdji H, et al. Neurologic features in severe SARS-CoV-2 infection. N Engl J Med. 2020;382(23):2268-2270. https://doi.org/10.1056/nejmc2008597
9. Severe Covid GWAS Group; Ellinghaus D, Degenhardt F, Bujanda L, et al. Genomewide association study of severe Covid-19 with respiratory failure. N Engl J Med. 2020;383(16):1522-1534.
10. Kabarriti R, Brodin NP, Maron MI, et al. association of race and ethnicity with comorbidities and survival among patients with COVID-19 at an urban medical center in New York. JAMA Netw Open. 2020;3(9):e2019795. https://doi.org/10.1001/jamanetworkopen.2020.19795
11. Bellino S, Punzo O, Rota MC, et al; COVID-19 Working Group. COVID-19 disease severity risk factors for pediatric patients in Italy. Pediatrics. 2020;146(4):e2020009399. https://doi.org/10.1542/peds.2020-009399
12. Ouldali N, Yang DD, Madhi F, et al; investigator group of the PANDOR study. Factors associated with severe SARS-CoV-2 infection. Pediatrics. 2020;147(3):e2020023432. https://doi.org/10.1542/peds.2020-023432
13. Castells MC, Phillips EJ. Maintaining safety with SARS-CoV-2 vaccines. N Engl J Med. 2021;384(7):643-649. https://doi.org/10.1056/nejmra2035343
14. Antoon JW, Williams DJ, Thurm C, et al. The COVID-19 pandemic and changes in healthcare utilization for pediatric respiratory and nonrespiratory illnesses in the United States. J Hosp Med. 2021;16(5):294-297. https://doi.org/10.12788/jhm.3608
15. Blatz AM, David MZ, Otto WR, Luan X, Gerber JS. Validation of International Classification of Disease-10 code for identifying children hospitalized with coronavirus disease-2019. J Pediatric Infect Dis Soc. 2020;10(4):547-548. https://doi.org/10.1093/jpids/piaa140
16. Kadri SS, Gundrum J, Warner S, et al. Uptake and accuracy of the diagnosis code for COVID-19 among US hospitalizations. JAMA. 2020;324(24):2553-2554. https://doi.org/10.1001/jama.2020.20323
17. Kaiser SV, Rodean J, Bekmezian A, et al; Pediatric Research in Inpatient Settings (PRIS) Network. Effectiveness of pediatric asthma pathways for hospitalized children: a multicenter, national analysis. J Pediatr. 2018;197:165-171.e162. https://doi.org/10.1016/j.jpeds.2018.01.084
18. Feudtner C, Feinstein JA, Zhong W, Hall M, Dai D. Pediatric complex chronic conditions classification system version 2: updated for ICD-10 and complex medical technology dependence and transplantation. BMC Pediatr. 2014;14:199. https://doi.org/10.1186/1471-2431-14-199.
19. Williams DJ, Zhu Y, Grijalva CG, et al. Predicting severe pneumonia outcomes in children. Pediatrics. 2016;138(4):e20161019. https://doi.org/10.1542/peds.2016-1019
20. Zachariah P, Johnson CL, Halabi KC, et al. Epidemiology, clinical features, and disease severity in patients with coronavirus disease 2019 (COVID-19) in a children’s hospital in New York City, New York. JAMA Pediatr. 2020;174(10):e202430. https://doi.org/10.1001/jamapediatrics.2020.2430
21. DeBiasi RL, Song X, Delaney M, et al. Severe coronavirus disease-2019 in children and young adults in the Washington, DC, metropolitan region. J Pediatr. 2020;223:199-203.e191. https://doi.org/10.1016/j.jpeds.2020.05.007
22. Lovinsky-Desir S, Deshpande DR, De A, et al. Asthma among hospitalized patients with COVID-19 and related outcomes. J Allergy Clin Immunol. 2020;146(5):1027-1034.e1024. https://doi.org/10.1016/j.jaci.2020.07.026
23. Beken B, Ozturk GK, Aygun FD, Aydogmus C, Akar HH. Asthma and allergic diseases are not risk factors for hospitalization in children with coronavirus disease 2019. Ann Allergy Asthma Immunol. 2021;126(5):569-575. https://doi.org/10.1016/j.anai.2021.01.018
24. Yehia BR, Winegar A, Fogel R, et al. Association of race with mortality among patients hospitalized with coronavirus disease 2019 (COVID-19) at 92 US hospitals. JAMA Netw Open. 2020;3(8):e2018039. https://doi.org/10.1001/jamanetworkopen.2020.18039
25. Saatci D, Ranger TA, Garriga C, et al. Association between race and COVID-19 outcomes among 2.6 million children in England. JAMA Pediatr. 2021;e211685. https://doi.org/10.1001/jamapediatrics.2021.1685
26. Lopez L, 3rd, Hart LH, 3rd, Katz MH. Racial and ethnic health disparities related to COVID-19. JAMA. 2021;325(8):719-720. https://doi.org/10.1001/jama.2020.26443
27. Altunok ES, Alkan M, Kamat S, et al. Clinical characteristics of adult patients hospitalized with laboratory-confirmed COVID-19 pneumonia. J Infect Chemother. 2020. https://doi.org/10.1016/j.jiac.2020.10.020
28. Ali H, Daoud A, Mohamed MM, et al. Survival rate in acute kidney injury superimposed COVID-19 patients: a systematic review and meta-analysis. Ren Fail. 2020;42(1):393-397. https://doi.org/10.1080/0886022x.2020.1756323
29. Anirvan P, Bharali P, Gogoi M, Thuluvath PJ, Singh SP, Satapathy SK. Liver injury in COVID-19: the hepatic aspect of the respiratory syndrome - what we know so far. World J Hepatol. 2020;12(12):1182-1197. https://doi.org/10.4254/wjh.v12.i12.1182
30. Moschonas IC, Tselepis AD. SARS-CoV-2 infection and thrombotic complications: a narrative review. J Thromb Thrombolysis. 2021;52(1):111-123. https://doi.org/10.1007/s11239-020-02374-3
31. Lee MH, Perl DP, Nair G, et al. Microvascular injury in the brains of patients with Covid-19. N Engl J Med. 2020;384(5):481-483. https://doi.org/10.1056/nejmc2033369
32. Antoon JW, Hall M, Herndon A, et al. Prevalence, risk factors, and outcomes of influenza-associated neurological Complications in Children. J Pediatr. 2021;S0022-3476(21)00657-0. https://doi.org/10.1016/j.jpeds.2021.06.075
© 2021 Society of Hospital Medicine
Healthcare Encounter and Financial Impact of COVID-19 on Children’s Hospitals
To benefit patients and the public health of their communities, children’s hospitals across the United States prepared for and responded to COVID-19 by conserving personal protective equipment, suspending noncritical in-person healthcare encounters (including outpatient visits and elective surgeries), and implementing socially distanced essential care.1,2 These measures were promptly instituted during a time of both substantial uncertainty about the pandemic’s behavior in children—including its severity and duration—and extreme variation in local and state governments’ responses to the pandemic.
Congruent with other healthcare institutions, children’s hospitals calibrated their clinical operations to the evolving nature of the pandemic, prioritizing the safety of patients and staff while striving to maintain financial viability in the setting of increased costs and decreased revenue. In some cases, children’s hospitals aided adult hospitals and health systems by admitting young and middle-aged adult patients and by centralizing all pediatric patients requiring intensive care within a region. These efforts occurred while many children’s hospitals remained the sole source of specialized pediatric care, including care for rare complex health problems.
As the COVID-19 pandemic continues, there is a critical need to assess how the initial phase of the pandemic affected healthcare encounters and related finances in children’s hospitals. Understanding these trends will position children’s hospitals to project and prepare for subsequent COVID-19 surges, as well as future related public health crises that necessitate widespread social distancing. Therefore, we compared year-over-year trends in healthcare encounters and hospital charges across US children’s hospitals before and during the COVID-19 pandemic, focusing on the beginning of COVID-19 in the United States, which was defined as February through June 2020.
METHODS
This is a retrospective analysis of 26 children’s hospitals (22 freestanding, 4 nonfreestanding) from all US regions (12 South, 7 Midwest, 5 West, 2 Northeast) contributing encounter and financial data to the PROSPECT database (Children’s Hospital Association, Lenexa, Kansas) from February 1 to June 30 in both 2019 (before COVID-19) and 2020 (during COVID-19). In response to COVID-19, hospitals participating in PROSPECT increased the efficiency of data centralization and reporting in 2020 during the period February 1 to June 30 to expedite analysis and dissemination of findings.
The main outcome measures were the percentage of change in weekly encounters (inpatient bed-days, emergency department [ED] visits, and surgeries) and inflation-adjusted charges (categorized as inpatient care and outpatient care, such as ambulatory surgery, clinics, and ED visits) before vs during COVID-19.
RESULTS


Charges that accrued from February 1 to June 30 were lower in 2020 by a median 23.6% (IQR, –28.7% to –19.1%) per children’s hospital than they were in 2019, corresponding to a median decrease of $276.3 million (IQR, $404.0-$126.0 million) in charges per hospital (Table). Forty percent of this decrease was attributable to decreased charges resulting from fewer inpatient healthcare encounters.
DISCUSSION
These findings beg the question of how well children’s hospitals are positioned to weather a recurrent surge in COVID-19. Because the severity of illness of COVID-19 has been lower to date in the pediatric vs adult populations, an increase in COVID-19-related visits to EDs and admissions to offset the decreased resource use of other pediatric healthcare problems is not anticipated. Existing hospital financial reserves as well as federal aid from the Coronavirus Aid, Relief, and Economic Security Act that helped mitigate the initial encounter and financial losses during the beginning of COVID-19 may not be readily available over time.4,5 Certainly, the findings from the current study support continued lobbying for additional state and federal funds allocated through future relief packages to children’s hospitals.
Additional approaches to financial solvency in children’s hospitals during the sustained COVID-19 pandemic include addressing surgical backlogs and sharing best practices for safe and sustained reopening of clinical operations and financial practices across institutions. Although the PROSPECT database does not contain information on the types of surgeries present within this backlog, our experiences suggest that both same-day and inpatient elective surgeries have been affected, especially lengthy procedures (eg, spinal fusion for neuromuscular scoliosis). Spread and scale of feasible and efficient solutions to reengineer and expand patient capacities and throughput for operating rooms, postanesthesia recovery areas, and intensive care and floor units are needed. Enhanced analytics that accurately predict postoperative length of hospital stay, coupled with early recovery after surgery clinical protocols, could help optimize hospital bed management. Effective ways to convert hospital rooms from single to double occupancy, to manage family visitation, and to proactively test asymptomatic patients, family, and hospital staff will mitigate continued COVID-19 penetration through children’s hospitals.
One important limitation of the current study is the measurement of hospitals’ charges. The charge data were not positioned to comprehensively measure each hospital’s financial state during the COVID-19 pandemic. However, the decrease in hospital charges reported by the children’s hospitals in the current study is comparable with the financial losses reported for many adult hospitals during the pandemic.6,7
CONCLUSION
Children’s hospitals’ ability to serve the nation’s pediatric patients depends on the success of the hospitals’ plans to manage current and future COVID-19 surges and to reopen and recover from the surges that have passed. Additional investigation is needed to identify best operational and financial practices among children’s hospitals that have enabled them to endure the COVID-19 pandemic.
1. COVID-19: ways to prepare your children’s hospital now. Children’s Hospital Association. March 12, 2020. Accessed June 30, 2020. https://www.childrenshospitals.org/Newsroom/Childrens-Hospitals-Today/Articles/2020/03/COVID-19-11-Ways-to-Prepare-Your-Hospital-Now
2. Chopra V, Toner E, Waldhorn R, Washer L. How should U.S. hospitals prepare for coronavirus disease 2019 (COVID-19)? Ann Intern Med. 2020;172(9):621-622. https://doi.org/10.7326/m20-0907
3. Oseran AS, Nash D, Kim C, et al. Changes in hospital admissions for urgent conditions during COVID-19 pandemic. Am J Manag Care. 2020;26(8):327-328. https://doi.org/10.37765/ajmc.2020.43837
4. Coronavirus Aid, Relief, and Economic Security Act or the CARES Act. 15 USC Chapter 116 (2020). Pub L No. 116-36, 134 Stat 281. https://www.congress.gov/bill/116th-congress/house-bill/748
5. The Coronavirus Aid, Relief, and Economic Security (CARES) Act Provider Relief Fund: general information. US Department of Health & Human Services. June 25, 2020. Accessed June 30, 2020. https://www.hhs.gov/coronavirus/cares-act-provider-relief-fund/general-information/index.html
6. Hospitals and health systems face unprecedented financial pressures due to COVID-19. American Hospital Association. May 2020. Accessed July 13, 2020. https://www.aha.org/system/files/media/file/2020/05/aha-covid19-financial-impact-0520-FINAL.pdf
7. Birkmeyer J, Barnato A, Birkmeyer N, Bessler R, Skinner J. The impact of the COVID-19 pandemic on hospital admissions in the United States. Health Aff (Millwood). 2020;39(11):2010-2017. https://doi.org/10.1377/hlthaff.2020.00980
To benefit patients and the public health of their communities, children’s hospitals across the United States prepared for and responded to COVID-19 by conserving personal protective equipment, suspending noncritical in-person healthcare encounters (including outpatient visits and elective surgeries), and implementing socially distanced essential care.1,2 These measures were promptly instituted during a time of both substantial uncertainty about the pandemic’s behavior in children—including its severity and duration—and extreme variation in local and state governments’ responses to the pandemic.
Congruent with other healthcare institutions, children’s hospitals calibrated their clinical operations to the evolving nature of the pandemic, prioritizing the safety of patients and staff while striving to maintain financial viability in the setting of increased costs and decreased revenue. In some cases, children’s hospitals aided adult hospitals and health systems by admitting young and middle-aged adult patients and by centralizing all pediatric patients requiring intensive care within a region. These efforts occurred while many children’s hospitals remained the sole source of specialized pediatric care, including care for rare complex health problems.
As the COVID-19 pandemic continues, there is a critical need to assess how the initial phase of the pandemic affected healthcare encounters and related finances in children’s hospitals. Understanding these trends will position children’s hospitals to project and prepare for subsequent COVID-19 surges, as well as future related public health crises that necessitate widespread social distancing. Therefore, we compared year-over-year trends in healthcare encounters and hospital charges across US children’s hospitals before and during the COVID-19 pandemic, focusing on the beginning of COVID-19 in the United States, which was defined as February through June 2020.
METHODS
This is a retrospective analysis of 26 children’s hospitals (22 freestanding, 4 nonfreestanding) from all US regions (12 South, 7 Midwest, 5 West, 2 Northeast) contributing encounter and financial data to the PROSPECT database (Children’s Hospital Association, Lenexa, Kansas) from February 1 to June 30 in both 2019 (before COVID-19) and 2020 (during COVID-19). In response to COVID-19, hospitals participating in PROSPECT increased the efficiency of data centralization and reporting in 2020 during the period February 1 to June 30 to expedite analysis and dissemination of findings.
The main outcome measures were the percentage of change in weekly encounters (inpatient bed-days, emergency department [ED] visits, and surgeries) and inflation-adjusted charges (categorized as inpatient care and outpatient care, such as ambulatory surgery, clinics, and ED visits) before vs during COVID-19.
RESULTS
Charges that accrued from February 1 to June 30 were lower in 2020 by a median 23.6% (IQR, –28.7% to –19.1%) per children’s hospital than they were in 2019, corresponding to a median decrease of $276.3 million (IQR, $404.0-$126.0 million) in charges per hospital (Table). Forty percent of this decrease was attributable to decreased charges resulting from fewer inpatient healthcare encounters.
DISCUSSION
These findings beg the question of how well children’s hospitals are positioned to weather a recurrent surge in COVID-19. Because the severity of illness of COVID-19 has been lower to date in the pediatric vs adult populations, an increase in COVID-19-related visits to EDs and admissions to offset the decreased resource use of other pediatric healthcare problems is not anticipated. Existing hospital financial reserves as well as federal aid from the Coronavirus Aid, Relief, and Economic Security Act that helped mitigate the initial encounter and financial losses during the beginning of COVID-19 may not be readily available over time.4,5 Certainly, the findings from the current study support continued lobbying for additional state and federal funds allocated through future relief packages to children’s hospitals.
Additional approaches to financial solvency in children’s hospitals during the sustained COVID-19 pandemic include addressing surgical backlogs and sharing best practices for safe and sustained reopening of clinical operations and financial practices across institutions. Although the PROSPECT database does not contain information on the types of surgeries present within this backlog, our experiences suggest that both same-day and inpatient elective surgeries have been affected, especially lengthy procedures (eg, spinal fusion for neuromuscular scoliosis). Spread and scale of feasible and efficient solutions to reengineer and expand patient capacities and throughput for operating rooms, postanesthesia recovery areas, and intensive care and floor units are needed. Enhanced analytics that accurately predict postoperative length of hospital stay, coupled with early recovery after surgery clinical protocols, could help optimize hospital bed management. Effective ways to convert hospital rooms from single to double occupancy, to manage family visitation, and to proactively test asymptomatic patients, family, and hospital staff will mitigate continued COVID-19 penetration through children’s hospitals.
One important limitation of the current study is the measurement of hospitals’ charges. The charge data were not positioned to comprehensively measure each hospital’s financial state during the COVID-19 pandemic. However, the decrease in hospital charges reported by the children’s hospitals in the current study is comparable with the financial losses reported for many adult hospitals during the pandemic.6,7
CONCLUSION
Children’s hospitals’ ability to serve the nation’s pediatric patients depends on the success of the hospitals’ plans to manage current and future COVID-19 surges and to reopen and recover from the surges that have passed. Additional investigation is needed to identify best operational and financial practices among children’s hospitals that have enabled them to endure the COVID-19 pandemic.
1. COVID-19: ways to prepare your children’s hospital now. Children’s Hospital Association. March 12, 2020. Accessed June 30, 2020. https://www.childrenshospitals.org/Newsroom/Childrens-Hospitals-Today/Articles/2020/03/COVID-19-11-Ways-to-Prepare-Your-Hospital-Now
2. Chopra V, Toner E, Waldhorn R, Washer L. How should U.S. hospitals prepare for coronavirus disease 2019 (COVID-19)? Ann Intern Med. 2020;172(9):621-622. https://doi.org/10.7326/m20-0907
3. Oseran AS, Nash D, Kim C, et al. Changes in hospital admissions for urgent conditions during COVID-19 pandemic. Am J Manag Care. 2020;26(8):327-328. https://doi.org/10.37765/ajmc.2020.43837
4. Coronavirus Aid, Relief, and Economic Security Act or the CARES Act. 15 USC Chapter 116 (2020). Pub L No. 116-36, 134 Stat 281. https://www.congress.gov/bill/116th-congress/house-bill/748
5. The Coronavirus Aid, Relief, and Economic Security (CARES) Act Provider Relief Fund: general information. US Department of Health & Human Services. June 25, 2020. Accessed June 30, 2020. https://www.hhs.gov/coronavirus/cares-act-provider-relief-fund/general-information/index.html
6. Hospitals and health systems face unprecedented financial pressures due to COVID-19. American Hospital Association. May 2020. Accessed July 13, 2020. https://www.aha.org/system/files/media/file/2020/05/aha-covid19-financial-impact-0520-FINAL.pdf
7. Birkmeyer J, Barnato A, Birkmeyer N, Bessler R, Skinner J. The impact of the COVID-19 pandemic on hospital admissions in the United States. Health Aff (Millwood). 2020;39(11):2010-2017. https://doi.org/10.1377/hlthaff.2020.00980
© 2021 Society of Hospital Medicine
The COVID-19 Pandemic and Changes in Healthcare Utilization for Pediatric Respiratory and Nonrespiratory Illnesses in the United States
In the United States, respiratory illnesses are the most common cause of emergency department (ED) visits and hospitalizations in children.1 In response to the ongoing COVID-19 pandemic, several public health interventions, including school and business closures, stay-at-home orders, and mask mandates, were implemented to limit transmission of SARS-CoV-2.2,3 Studies have shown that children can contribute to the spread of SARS-CoV-2 infections, especially within households.4-6 Recent data suggest that COVID-19, and the associated public health measures enacted to slow its spread, may have affected the transmission of other respiratory pathogens.7 Similarly, the pandemic has likely affected healthcare utilization for nonrespiratory illnesses through adoption of social distancing recommendations, suspension and delays in nonemergent elective care, avoidance of healthcare settings, and the effect of decreased respiratory disease on exacerbation of chronic illness.8 The objective of this study was to examine associations between the COVID-19 pandemic and healthcare utilization for pediatric respiratory and nonrespiratory illnesses at US pediatric hospitals.
METHODS
Study Design
This is a multicenter, cross-sectional study of encounters at 44 pediatric hospitals that reported data to the Pediatric Health Information System (PHIS) database maintained by the Children’s Hospital Association (Lenexa, Kansas).
Study Population
Children 2 months to 18 years of age discharged from ED or inpatient settings with a nonsurgical diagnosis from January 1 to September 30 over a 4-year period (2017-2020) were included.
Exposure
The primary exposure was the 2020 COVID-19 pandemic time, divided into three periods: pre-COVID-19 (January-February 2020, the period prior to the pandemic in the United States), early COVID-19 (March-April 2020, coinciding with the first reported US pediatric case of COVID-19 on March 2, 2020), and COVID-19 (May-September 2020, marked by the implementation of at least two of the following containment measures in every US state: stay-at-home/shelter orders, school closures, nonessential business closures, restaurant closures, or prohibition of gatherings of more than 10 people).2
Outcomes
Statistical Analysis
Categorical variables were summarized using frequencies and percentages and compared using chi-square tests. Continuous variables were summarized as median and interquartile range (IQR) and compared using Wilcoxon rank sum tests. Weekly observed-to-expected (O:E) ratios were calculated for each hospital by dividing the number of observed respiratory illness and nonrespiratory illness encounters in a given week in 2020 (observed) by the average number of encounters for that same week during 2017-2019 (expected). O:E ratios were then aggregated over the three COVID-19 study periods, and 95% confidence intervals were established around mean O:E ratios across individual hospitals. Outcomes were then stratified by respiratory illness subgroups, geographic region, and age. Additional details can be found in the Supplemental Methods in the Appendix.
RESULTS
Study Population
A total of 9,051,980 encounters were included in the study, 6,811,799 with nonrespiratory illnesses and 2,240,181 with respiratory illnesses. Median age was 5 years (IQR, 1-11 years), and 52.7% of the population was male (Appendix Table 2 and Appendix Table 3).
Respiratory vs Nonrespiratory Illness During the COVID-19 Pandemic
Over the study period, fewer respiratory and nonrespiratory illness encounters were observed than expected, with a larger decrease in respiratory illness encounters (Table, Appendix Table 4). 

Respiratory Subgroup Analyses
The O:E ratio decreased for all respiratory subgroups over the study period (Table, Appendix Table 4). There were significant differences in specific respiratory subgroups, including asthma, bronchiolitis, croup, influenza, and pneumonia (Appendix Figure 1A). Temporal trends in respiratory encounters were consistent across hospital settings, ages, and geographic regions (Appendix Figure 1B-D). When comparing the with and without COVID-19 subgroups in the “other respiratory illnesses” cohort, other respiratory illness without COVID-19 decreased and remained lower than expected over the rest of the study period, while other respiratory illness with COVID-19 increased markedly during the summer months and declined thereafter (Appendix Figure 2).
All age groups had reductions in respiratory illness encounters during the early COVID-19 and COVID-19 periods, although the decline was less pronounced in the 12- to 17-year-old group (Appendix Figure 1B). Similarly, while all age groups experienced increases in encounters for respiratory illnesses during the summer months, only children in the 12- to 17-year-old group experienced increases beyond pre-COVID-19 levels. Importantly, this increase in respiratory encounters was largely driven by COVID-19 diagnoses (Appendix Figure 3). The trend in nonrespiratory illness encounters stratified by age is shown in Appendix Figure 4.
When patients were stratified by hospital setting, there were no differences between those hospitalized and those discharged from the ED (Appendix Figure 1C). Patterns in respiratory illnesses by geographic location were qualitatively similar until the beginning of the summer 2020, after which geographical variation became more evident (Appendix Figure 1D).
DISCUSSION
In this large, multicenter study evaluating ED visits and hospitalizations for respiratory and nonrespiratory illnesses at US pediatric hospitals during the 2020 COVID-19 pandemic, we found a significant and substantial decrease in healthcare encounters for respiratory illnesses. A rapid and marked decline in encounters for respiratory illness in a relatively short period of time (March 12-April 2) was observed across all hospitals and US regions. Declines were consistent across common respiratory illnesses. More modest, yet still substantial, declines were also observed for nonrespiratory illnesses.
There are likely multiple underlying reasons for the observed reductions. Social distancing measures almost certainly played an important role in interrupting respiratory infection transmission. Rapid reduction in influenza transmission during the early COVID-19 period has been attributed to social distancing measures,3 and influenza transmission in children decreases with school closures.9 It is also possible that some families delayed seeking care at hospitals due to COVID-19, leading to less frequent encounters but more severe illness. The similar decrease in O:E ratio for ED visits and hospitalizations, however, is inconsistent with this explanation.
We also found relative differences in changes in encounters for respiratory illness by age. Adolescents’ levels of respiratory healthcare use declined less and recovered at a faster rate than those of younger children, returning to pre-COVID-19 levels by the end of the study period. The reason for this age differential is likely multifaceted. Infections, such as bronchiolitis and pneumonia, are more likely to be a source of respiratory illness in younger than in older children. It is also likely that disproportionate relaxation of social distancing measures among adolescents, who are known to have a stronger pattern of social interaction, contributed to the faster rise in respiratory illness–related encounters in this age group.11 Adolescents have been reported to be more susceptible to, and more likely to transmit, SARS-CoV-2 compared to younger age groups.12 More modest, albeit similar, age-based changes were observed in encounters for nonrespiratory illnesses
Emerging evidence suggests that school-age children may play an important role in SARS-CoV-2 transmission in the community.4,14 Our finding that, compared to younger children, adolescents had significantly fewer reductions in respiratory illness encounters is concerning. These findings suggest that community-based efforts to help prevent respiratory illnesses, especially COVID-19, should focus on adolescents, who are most likely to maintain social interactions and transmit respiratory infections in the school setting and their households.
This study is limited by the inclusion of only tertiary care children’s hospitals, which may not be nationally representative, and the inability to assess the precise timing of when specific public health interventions were introduced. Moreover, previous studies suggest that social distancing behaviors may have changed even before formal recommendations were enacted.15 Future studies should investigate the local impact of state- and municipality-specific mandates on the burden of COVID-19 and other respiratory illnesses.
The COVID-19 pandemic was associated with substantial reductions in encounters for respiratory diseases, and also with more modest but still sizable reductions in encounters for nonrespiratory diseases. These reductions varied by age. Encounters among adolescents declined less and returned to previous levels faster compared with those of younger children.
ACKNOWLEDGMENT
This publication is dedicated to the memory of our coauthor, Dr. Michael Bendel-Stenzel. Dr. Bendel-Stenzel was dedicated to bettering the lives of children and advancing our knowledge of pediatrics through his research.
1. Leyenaar JK, Ralston SL, Shieh MS, Pekow PS, Mangione-Smith R, Lindenauer PK. Epidemiology of pediatric hospitalizations at general hospitals and freestanding children’s hospitals in the United States. J Hosp Med. 2016;11(11):743-749. https://doi.org/10.1002/jhm.2624
2. Auger KA, Shah SS, Richardson T, et al. Association between statewide school closure and COVID-19 incidence and mortality in the US. JAMA. 2020;324(9):859-870. https://doi.org/10.1001/jama.2020.14348
3. Wiese AD, Everson J, Grijalva CG. Social distancing measures: evidence of interruption of seasonal influenza activity and early lessons of the SARS-CoV-2 pandemic. Clin Infect Dis. Published online June 20, 2020. https://doi.org/10.1093/cid/ciaa834
4. Grijalva CG, Rolfes MA, Zhu Y, et al. Transmission of SARS-COV-2 infections in households - Tennessee and Wisconsin, April-September 2020. MMWR Morb Mortal Wkly Rep. 2020;69(44):1631-1634. https://doi.org/10.15585/mmwr.mm6944e1
5. Worby CJ, Chaves SS, Wallinga J, Lipsitch M, Finelli L, Goldstein E. On the relative role of different age groups in influenza epidemics. Epidemics. 2015;13:10-16. https://doi.org/10.1016/j.epidem.2015.04.003
6. Zimmerman KO, Akinboyo IC, Brookhart MA, et al. Incidence and secondary transmission of SARS-CoV-2 infections in schools. Pediatrics. Published online January 8, 2021. https://doi.org/10.1542/peds.2020-048090
7. Hatoun J, Correa ET, Donahue SMA, Vernacchio L. Social distancing for COVID-19 and diagnoses of other infectious diseases in children. Pediatrics. 2020;146(4):e2020006460. https://doi.org/10.1542/peds.2020-006460
8. Chaiyachati BH, Agawu A, Zorc JJ, Balamuth F. Trends in pediatric emergency department utilization after institution of coronavirus disease-19 mandatory social distancing. J Pediatr. 2020;226:274-277.e1. https://doi.org/10.1016/j.jpeds.2020.07.048
9. Luca G, Kerckhove KV, Coletti P, et al. The impact of regular school closure on seasonal influenza epidemics: a data-driven spatial transmission model for Belgium. BMC Infect Dis. 2018;18(1):29. https://doi.org/10.1186/s12879-017-2934-3
10. Taquechel K, Diwadkar AR, Sayed S, et al. Pediatric asthma healthcare utilization, viral testing, and air pollution changes during the COVID-19 pandemic. J Allergy Clin Immunol Pract. 2020;8(10):3378-3387.e11. https://doi.org/10.1016/j.jaip.2020.07.057
11. Park YJ, Choe YJ, Park O, et al. Contact tracing during coronavirus disease outbreak, South Korea, 2020. Emerg Infect Dis. 2020;26(10):2465-2468. https://doi.org/10.3201/eid2610.201315
12. Davies NG, Klepac P, Liu Y, et al. Age-dependent effects in the transmission and control of COVID-19 epidemics. Nat Med. 2020;26(8):1205-1211. https://doi.org/10.1038/s41591-020-0962-9
13. Hill RM, Rufino K, Kurian S, Saxena J, Saxena K, Williams L. Suicide ideation and attempts in a pediatric emergency department before and during COVID-19. Pediatrics. Published online December 16, 2020. https://doi.org/10.1542/peds.2020-029280
14. Flasche S, Edmunds WJ. The role of schools and school-aged children in SARS-CoV-2 transmission. Lancet Infect Dis. Published online December 8, 2020. https://doi.org/10.1016/S1473-3099(20)30927-0
15. Sehra ST, George M, Wiebe DJ, Fundin S, Baker JF. Cell phone activity in categories of places and associations with growth in cases of COVID-19 in the US. JAMA Intern Med. Published online August 31, 2020. https://doi.org/10.1001/jamainternmed.2020.4288
In the United States, respiratory illnesses are the most common cause of emergency department (ED) visits and hospitalizations in children.1 In response to the ongoing COVID-19 pandemic, several public health interventions, including school and business closures, stay-at-home orders, and mask mandates, were implemented to limit transmission of SARS-CoV-2.2,3 Studies have shown that children can contribute to the spread of SARS-CoV-2 infections, especially within households.4-6 Recent data suggest that COVID-19, and the associated public health measures enacted to slow its spread, may have affected the transmission of other respiratory pathogens.7 Similarly, the pandemic has likely affected healthcare utilization for nonrespiratory illnesses through adoption of social distancing recommendations, suspension and delays in nonemergent elective care, avoidance of healthcare settings, and the effect of decreased respiratory disease on exacerbation of chronic illness.8 The objective of this study was to examine associations between the COVID-19 pandemic and healthcare utilization for pediatric respiratory and nonrespiratory illnesses at US pediatric hospitals.
METHODS
Study Design
This is a multicenter, cross-sectional study of encounters at 44 pediatric hospitals that reported data to the Pediatric Health Information System (PHIS) database maintained by the Children’s Hospital Association (Lenexa, Kansas).
Study Population
Children 2 months to 18 years of age discharged from ED or inpatient settings with a nonsurgical diagnosis from January 1 to September 30 over a 4-year period (2017-2020) were included.
Exposure
The primary exposure was the 2020 COVID-19 pandemic time, divided into three periods: pre-COVID-19 (January-February 2020, the period prior to the pandemic in the United States), early COVID-19 (March-April 2020, coinciding with the first reported US pediatric case of COVID-19 on March 2, 2020), and COVID-19 (May-September 2020, marked by the implementation of at least two of the following containment measures in every US state: stay-at-home/shelter orders, school closures, nonessential business closures, restaurant closures, or prohibition of gatherings of more than 10 people).2
Outcomes
Statistical Analysis
Categorical variables were summarized using frequencies and percentages and compared using chi-square tests. Continuous variables were summarized as median and interquartile range (IQR) and compared using Wilcoxon rank sum tests. Weekly observed-to-expected (O:E) ratios were calculated for each hospital by dividing the number of observed respiratory illness and nonrespiratory illness encounters in a given week in 2020 (observed) by the average number of encounters for that same week during 2017-2019 (expected). O:E ratios were then aggregated over the three COVID-19 study periods, and 95% confidence intervals were established around mean O:E ratios across individual hospitals. Outcomes were then stratified by respiratory illness subgroups, geographic region, and age. Additional details can be found in the Supplemental Methods in the Appendix.
RESULTS
Study Population
A total of 9,051,980 encounters were included in the study, 6,811,799 with nonrespiratory illnesses and 2,240,181 with respiratory illnesses. Median age was 5 years (IQR, 1-11 years), and 52.7% of the population was male (Appendix Table 2 and Appendix Table 3).
Respiratory vs Nonrespiratory Illness During the COVID-19 Pandemic
Over the study period, fewer respiratory and nonrespiratory illness encounters were observed than expected, with a larger decrease in respiratory illness encounters (Table, Appendix Table 4).
Respiratory Subgroup Analyses
The O:E ratio decreased for all respiratory subgroups over the study period (Table, Appendix Table 4). There were significant differences in specific respiratory subgroups, including asthma, bronchiolitis, croup, influenza, and pneumonia (Appendix Figure 1A). Temporal trends in respiratory encounters were consistent across hospital settings, ages, and geographic regions (Appendix Figure 1B-D). When comparing the with and without COVID-19 subgroups in the “other respiratory illnesses” cohort, other respiratory illness without COVID-19 decreased and remained lower than expected over the rest of the study period, while other respiratory illness with COVID-19 increased markedly during the summer months and declined thereafter (Appendix Figure 2).
All age groups had reductions in respiratory illness encounters during the early COVID-19 and COVID-19 periods, although the decline was less pronounced in the 12- to 17-year-old group (Appendix Figure 1B). Similarly, while all age groups experienced increases in encounters for respiratory illnesses during the summer months, only children in the 12- to 17-year-old group experienced increases beyond pre-COVID-19 levels. Importantly, this increase in respiratory encounters was largely driven by COVID-19 diagnoses (Appendix Figure 3). The trend in nonrespiratory illness encounters stratified by age is shown in Appendix Figure 4.
When patients were stratified by hospital setting, there were no differences between those hospitalized and those discharged from the ED (Appendix Figure 1C). Patterns in respiratory illnesses by geographic location were qualitatively similar until the beginning of the summer 2020, after which geographical variation became more evident (Appendix Figure 1D).
DISCUSSION
In this large, multicenter study evaluating ED visits and hospitalizations for respiratory and nonrespiratory illnesses at US pediatric hospitals during the 2020 COVID-19 pandemic, we found a significant and substantial decrease in healthcare encounters for respiratory illnesses. A rapid and marked decline in encounters for respiratory illness in a relatively short period of time (March 12-April 2) was observed across all hospitals and US regions. Declines were consistent across common respiratory illnesses. More modest, yet still substantial, declines were also observed for nonrespiratory illnesses.
There are likely multiple underlying reasons for the observed reductions. Social distancing measures almost certainly played an important role in interrupting respiratory infection transmission. Rapid reduction in influenza transmission during the early COVID-19 period has been attributed to social distancing measures,3 and influenza transmission in children decreases with school closures.9 It is also possible that some families delayed seeking care at hospitals due to COVID-19, leading to less frequent encounters but more severe illness. The similar decrease in O:E ratio for ED visits and hospitalizations, however, is inconsistent with this explanation.
We also found relative differences in changes in encounters for respiratory illness by age. Adolescents’ levels of respiratory healthcare use declined less and recovered at a faster rate than those of younger children, returning to pre-COVID-19 levels by the end of the study period. The reason for this age differential is likely multifaceted. Infections, such as bronchiolitis and pneumonia, are more likely to be a source of respiratory illness in younger than in older children. It is also likely that disproportionate relaxation of social distancing measures among adolescents, who are known to have a stronger pattern of social interaction, contributed to the faster rise in respiratory illness–related encounters in this age group.11 Adolescents have been reported to be more susceptible to, and more likely to transmit, SARS-CoV-2 compared to younger age groups.12 More modest, albeit similar, age-based changes were observed in encounters for nonrespiratory illnesses
Emerging evidence suggests that school-age children may play an important role in SARS-CoV-2 transmission in the community.4,14 Our finding that, compared to younger children, adolescents had significantly fewer reductions in respiratory illness encounters is concerning. These findings suggest that community-based efforts to help prevent respiratory illnesses, especially COVID-19, should focus on adolescents, who are most likely to maintain social interactions and transmit respiratory infections in the school setting and their households.
This study is limited by the inclusion of only tertiary care children’s hospitals, which may not be nationally representative, and the inability to assess the precise timing of when specific public health interventions were introduced. Moreover, previous studies suggest that social distancing behaviors may have changed even before formal recommendations were enacted.15 Future studies should investigate the local impact of state- and municipality-specific mandates on the burden of COVID-19 and other respiratory illnesses.
The COVID-19 pandemic was associated with substantial reductions in encounters for respiratory diseases, and also with more modest but still sizable reductions in encounters for nonrespiratory diseases. These reductions varied by age. Encounters among adolescents declined less and returned to previous levels faster compared with those of younger children.
ACKNOWLEDGMENT
This publication is dedicated to the memory of our coauthor, Dr. Michael Bendel-Stenzel. Dr. Bendel-Stenzel was dedicated to bettering the lives of children and advancing our knowledge of pediatrics through his research.
1. Leyenaar JK, Ralston SL, Shieh MS, Pekow PS, Mangione-Smith R, Lindenauer PK. Epidemiology of pediatric hospitalizations at general hospitals and freestanding children’s hospitals in the United States. J Hosp Med. 2016;11(11):743-749. https://doi.org/10.1002/jhm.2624
2. Auger KA, Shah SS, Richardson T, et al. Association between statewide school closure and COVID-19 incidence and mortality in the US. JAMA. 2020;324(9):859-870. https://doi.org/10.1001/jama.2020.14348
3. Wiese AD, Everson J, Grijalva CG. Social distancing measures: evidence of interruption of seasonal influenza activity and early lessons of the SARS-CoV-2 pandemic. Clin Infect Dis. Published online June 20, 2020. https://doi.org/10.1093/cid/ciaa834
4. Grijalva CG, Rolfes MA, Zhu Y, et al. Transmission of SARS-COV-2 infections in households - Tennessee and Wisconsin, April-September 2020. MMWR Morb Mortal Wkly Rep. 2020;69(44):1631-1634. https://doi.org/10.15585/mmwr.mm6944e1
5. Worby CJ, Chaves SS, Wallinga J, Lipsitch M, Finelli L, Goldstein E. On the relative role of different age groups in influenza epidemics. Epidemics. 2015;13:10-16. https://doi.org/10.1016/j.epidem.2015.04.003
6. Zimmerman KO, Akinboyo IC, Brookhart MA, et al. Incidence and secondary transmission of SARS-CoV-2 infections in schools. Pediatrics. Published online January 8, 2021. https://doi.org/10.1542/peds.2020-048090
7. Hatoun J, Correa ET, Donahue SMA, Vernacchio L. Social distancing for COVID-19 and diagnoses of other infectious diseases in children. Pediatrics. 2020;146(4):e2020006460. https://doi.org/10.1542/peds.2020-006460
8. Chaiyachati BH, Agawu A, Zorc JJ, Balamuth F. Trends in pediatric emergency department utilization after institution of coronavirus disease-19 mandatory social distancing. J Pediatr. 2020;226:274-277.e1. https://doi.org/10.1016/j.jpeds.2020.07.048
9. Luca G, Kerckhove KV, Coletti P, et al. The impact of regular school closure on seasonal influenza epidemics: a data-driven spatial transmission model for Belgium. BMC Infect Dis. 2018;18(1):29. https://doi.org/10.1186/s12879-017-2934-3
10. Taquechel K, Diwadkar AR, Sayed S, et al. Pediatric asthma healthcare utilization, viral testing, and air pollution changes during the COVID-19 pandemic. J Allergy Clin Immunol Pract. 2020;8(10):3378-3387.e11. https://doi.org/10.1016/j.jaip.2020.07.057
11. Park YJ, Choe YJ, Park O, et al. Contact tracing during coronavirus disease outbreak, South Korea, 2020. Emerg Infect Dis. 2020;26(10):2465-2468. https://doi.org/10.3201/eid2610.201315
12. Davies NG, Klepac P, Liu Y, et al. Age-dependent effects in the transmission and control of COVID-19 epidemics. Nat Med. 2020;26(8):1205-1211. https://doi.org/10.1038/s41591-020-0962-9
13. Hill RM, Rufino K, Kurian S, Saxena J, Saxena K, Williams L. Suicide ideation and attempts in a pediatric emergency department before and during COVID-19. Pediatrics. Published online December 16, 2020. https://doi.org/10.1542/peds.2020-029280
14. Flasche S, Edmunds WJ. The role of schools and school-aged children in SARS-CoV-2 transmission. Lancet Infect Dis. Published online December 8, 2020. https://doi.org/10.1016/S1473-3099(20)30927-0
15. Sehra ST, George M, Wiebe DJ, Fundin S, Baker JF. Cell phone activity in categories of places and associations with growth in cases of COVID-19 in the US. JAMA Intern Med. Published online August 31, 2020. https://doi.org/10.1001/jamainternmed.2020.4288
© 2021 Society of Hospital Medicine
Clinical Progress Note: Procalcitonin in the Management of Pediatric Lower Respiratory Tract Infection
Procalcitonin (PCT) is a biomarker that has shown promise to identify bacterial etiology in acute infections, including bacterial lower respiratory tract infection (LRTI). In 2017, the United States Food and Drug Administration (FDA) approved the use of PCT as a diagnostic aid to guide the decisions around antibiotic therapy in acute LRTI.1 Although most of the data supporting the use of PCT for LRTI stems from adult studies, the high disease burden, predominance of viral etiologies, and frequent diagnostic uncertainty resulting in antibiotic overuse make pediatric LRTI an ideal target for the use of PCT as a diagnostic aid. This review evaluates and summarizes the current evidence regarding the role of PCT in the clinical care of pediatric LRTI, including its use in guiding antibiotic use and prognosticating disease severity.
THE ROLE OF PROCALCITONIN IN GUIDING INITIATION OF ANTIBIOTICS
The commonly used PCT cut points for withholding or stopping antibiotics in adults and children are 0.1 µg/L (very low risk of bacterial etiology) or 0.25 µg/L (low risk of bacterial etiology).2-4 Among the 532 children enrolled in the multicenter study of Etiology of Pneumonia in the Community (EPIC), a PCT threshold of 0.25 µg/L demonstrated an approximate sensitivity of 85%, specificity of 45%, positive likelihood ratio of 1.55, and negative likelihood ratio of 0.33 for community acquired pneumonia (CAP) caused by typical bacterial pathogens.5 Lowering the cutoff to <0.1 µg/L increased PCT sensitivity to 100%, decreased specificity, positive likelihood ratio, and negative likelihood ratio to 20%, 1.26, and 0, respectively. Although the EPIC study obtained culture and performed PCR testing on any blood sample, pleural fluid specimen, endotracheal aspirate, or bronchoalveolar–lavage specimens obtained during the study period, currently available laboratory methods show poor sensitivity for defining bacterial LRTI. Thus, bacterial etiologies may have been underestimated. The highly negative predictive value demonstrated in this study highlights the potential of PCT as a biomarker for ruling out bacterial diseases, including LRTI.
Multiple studies have evaluated the potential utility of PCT in guiding antibiotic initiation in adults with LRTI, but data on pediatric patients are sparse.4 In a randomized, single-center Italian study comparing a PCT-guided algorithm (withholding antibiotics when PCT < 0.25 µg/L) versus usual care among 319 hospitalized children with pneumonia, the PCT group experienced fewer antibiotic initiations (15.5% vs 100%, P < .05) without significant differences in recurrence of respiratory symptoms or new antibiotic prescriptions in the month following enrollment.2
A similar randomized trial using a PCT-guided algorithm for the initiation of antibiotics conducted among 337 Swiss children presented to the emergency department (ED) with pneumonia and other LRTIs failed to demonstrate decreases in antibiotic initiation.3 This study used an algorithm that categorized the likelihood of requiring antibiotic treatment for bacterial LRTI as “definitely” if PCT was >0.5 µg/L, “probably” if PCT was 0.26–0.5 µg/L, “probably not” if PCT was 0.1–0.25 µg/L, and “definitely not” if PCT was <0.1 µg/L. In the PCT group, 104 out of 168 (62%) patients received antibiotics within 14 days compared with 93 out of 165 (56%) patients in the control group (odds ratio [OR]: 1.26, 95% CI: 0.81, 1.95). In the subgroup analyses, the odds of administering antibiotics to those with nonpneumonia LRTI was significantly higher than those of the PCT group and control group (OR: 4.09, 95% CI: 1.8, 9.93); the odds of receiving antibiotics also showed no difference in the subgroup of children with pneumonia (OR: 0.66, 95% CI: 0.35, 1.23).
The benefit of PCT for informing decisions around the initiation of antibiotics likely varies based on perceived risk of bacterial diseases. When the pretest probability of bacterial disease is extremely high, the use of PCT is unlikely to alter treatment decisions. Similarly, PCT should not be used in situations where the pretest probability for bacterial pneumonia is very low—in these instances, an elevated PCT may lead to unnecessary antibiotic use among children presenting to the ED. However, the risk of bacterial pneumonia is often equivocal, and in these situations, PCT may provide clinicians with useful insights, primarily for ruling out bacterial disease.
THE ROLE OF PROCALCITONIN IN GUIDING DISCONTINUATION OF ANTIBIOTICS
In the study by Esposito et al., the PCT levels were additionally measured every two days until discharge and during two scheduled follow-up visits; the antibiotics were discontinued when PCT < 0.25 µg/L.2 The PCT-guided group experienced shorter antibiotic duration (mean 5.4 vs 11.0 days, P < .05), shorter length of hospital stay (mean 4.7 vs 5.61 days for mild LRTI and 5.01 vs 5.93 for severe LRTI), and fewer antibiotic-related adverse events (3.9% vs 25.2%, P < .05). Similarly, in the study by Baer et al., the PCT-guided group had PCT levels repeated on days three and five after enrollment, and the antibiotics were discontinued when PCT was less than 0.25 µg/L. The duration of antibiotic administration was significantly lower in the PCT-guided group (mean difference: 1.8 days, 95% CI: −3.1, −0.).3 The rates of hospitalization, duration of hospital stay, and mean impairment of daily activities attributable to LRTI were similar between groups.
Considering the adult studies and the small number of pediatric LRTI research published to date, the use of PCT to safely reduce antibiotic treatment duration is encouraging.4 Although the studies on the kinetics of PCT are limited, the biomarker has been shown to rise two to four hours after a bacterial stimulus, peak in 24-48 hours and achieve a half-life of 24-36 hours.6,7 As such, serial PCT measurements at 24-hour intervals for three to five days may be more beneficial than stand-alone PCT tests. Nonetheless, additional studies are needed to better define groups of patients who will most likely benefit from PCT testing and to understand how to best integrate testing into clinical practice.
PROCALCITONIN FOR SEVERITY PREDICTION OF LRTI
PCT has also been explored as a marker of LRTI disease severity. In a 2008 multicenter cohort encompassing 1,651 adults with pneumonia, PCT < 0.1 µg/L was associated with a decreased 30-day mortality, shorter length of stay, and decreased admission to the intensive care unit (ICU) compared with those with PCT>0.1 µg/L.8 In a 2017 study of 317 adults hospitalized with pneumonia, the PCT level was significantly higher in those with bacteremia and in those admitted to intensive care.9 When used in combination with the pneumonia severity index (PSI), the addition of PCT resulted in improved prognostic performance compared with the PSI alone for both outcomes, increasing the area under the receiver operating characteristic curve from 0.67 to 0.85 for bacteremia and from 0.58 to 0.64 for intensive care. Similarly, in the adult EPIC cohort, the addition of PCT contributed significant prognostic information beyond existing severity scores for predicting the need for invasive respiratory or vasopressor support; each 1 µg/L increase in PCT was associated with a 1% to 2% absolute increase in the need for this outcome.10
A European study of 100 children with pneumonia also demonstrated higher PCT values among hospitalized children (n = 26, median PCT 17.8 µg/L) compared with outpatient children (n = 73, median PCT 0.72 µg/L, P < .01).11 Among the 532 children from the EPIC study, a PCT < 0.25 µg/L was associated with the reduced odds of ICU admission (adjusted OR: 0.48; 95% CI: 0.30, 0.78) and a 2.3-day (95% CI: 1.4, 3.2) decrease in the average length of stay compared with those with higher PCT concentrations.5 Of the 34 children with empyema requiring drainage, 28 (82%) showed a PCT concentration ≥0.5 µg/L. Additional pediatric studies are needed, but the limited data to date suggest that PCT may play a role in predicting pediatric LRTI disease severity, including the need for mechanical ventilatory support and ICU-level care.
LIMITATIONS TO CLINICAL APPLICATION
Although PCT shows promise as a biomarker to reliably rule out bacterial infection, several potential limitations exist in assessing its role in pediatric LRTI. Atypical bacterial infections (ie, Mycoplasma pneumoniae) and localized bacterial infection may not induce significant PCT production, as has been shown in adults and children with tonsillitis, localized skin infections, endocarditis, or empyema (Table).12 The majority of clinical trials in LRTI have been conducted in the adult population,4 with the number of pediatric trials remaining small.2,3 Given the predominance of viral LRTI in children compared with adults, the utility of PCT may differ in these populations.13,14 Furthermore, existing studies demonstrate mixed results regarding the magnitude of benefits that PCT may provide in terms of limiting antibiotic use. Another concern is the potential of PCT to increase unnecessary antibiotic use in those with viral LRTI,3 as PCT may also be increased in populations with systemic inflammation from nonbacterial causes.12,15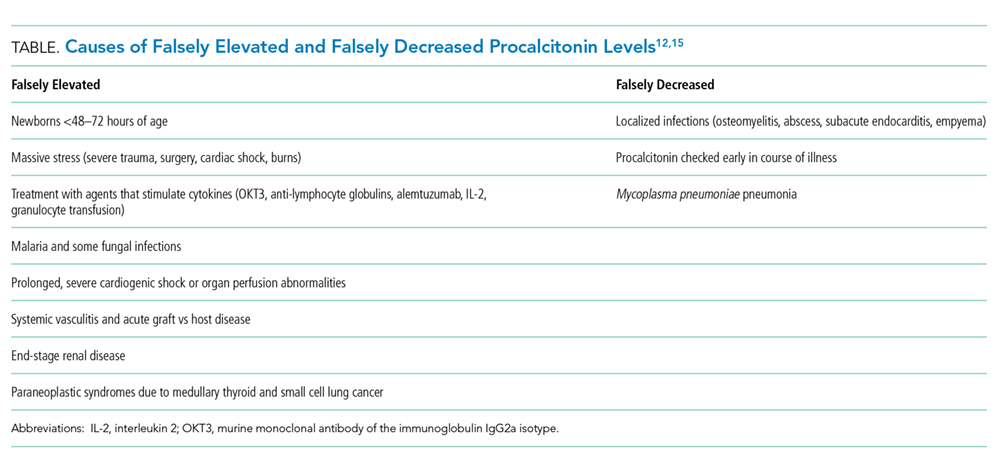
CONCLUSIONS AND CLINICAL APPLICATION
The misuse of antibiotics is a public health crisis resulting in the emergence of antibiotic-resistant pathogens and adverse outcomes, including Clostridioides difficile infection, drug toxicities, and increased healthcare costs.16 Pneumonia is responsible for more days of antibiotics than any other disease in children’s hospitals and is an important target for stewardship efforts.17 PCT is a promising biomarker for distinguishing bacterial from viral infection, and its use may help in making informed antibiotic decisions and predicting disease outcomes in pediatric LRTI. Although PCT has been cleared by the FDA for assisting with antibiotic decisions in pediatric LRTI, the majority of evidence supporting this indication is drawn from adults. Additional studies are needed prior to the widespread implementation in the pediatric population, but the results of available pediatric studies show promise. The clinical context and severity of patient presentation are important when considering whether or not to use PCT and how to best interpret PCT levels when making clinical management decisions. The utility of PCT for antibiotic initiation in the pediatric population is encouraging given the predominance of viral etiologies in pediatric LRTI. Currently available data demonstrate the value of serial PCT measurements in antibiotic de-escalation and promoting antibiotic stewardship for children and adults.2-4 As with all new diagnostic modalities, provider education is paramount to ensure a safe and value-driven implementation.
Disclosures
Dr. Katz received investigator-initiated grant funding from Roche and bioMérieux to conduct research involving procalcitonin in the past three years. Dr. Sartori has nothing to disclose. Dr. Williams received investigator-initiated grant funding from bioMérieux to conduct research involving procalcitonin in the past three years.
Funding
This work was supported by the National Institute of Health (1T32AI095202-07).
Disclaimer
This content is solely the responsibility of the authors and does not necessarily represent the official views of the National Institutes of Health, Roche, or bioMérieux.
1. FDA clears test to help manage antibiotic treatment for lower respiratory tract infections and sepsis. US Food and Drug Administration. [Press Release]. Silver Spring, MD, February 23 2017.
2. Esposito S, Tagliabue C, Picciolli I, et al. Procalcitonin measurements for guiding antibiotic treatment in pediatric pneumonia. Respir Med. 2011;105(12):1939-1945. https://doi.org/10.1016/j.rmed.2011.09.003.
3. Baer G, Baumann P, Buettcher M, et al. Procalcitonin guidance to reduce antibiotic treatment of lower respiratory tract infection in children and adolescents (ProPAED): a randomized controlled trial. PLoS One. 2013;8(8):e68419. https://doi.org/10.1371/journal.pone.0068419.
4. Choi JJ MM, Simon MS, Evans AT, Self WH, Glesby MJ. Procalcitonin in the diagnosis and management of community-acquired pneumonia in hospitalized adults. J Hosp Med. 2019;18(X);XXX-XXX. https://doi.org/10.12788/jhm.3272.
5. Stockmann C, Ampofo K, Killpack J, et al. Procalcitonin accurately identifies hospitalized children with low risk of bacterial community-acquired pneumonia. J Pediatric Infect Dis Soc. 2017;7(1): 46-53. https://doi.org/10.1093/jpids/piw091.
6. Dandona P, Nix D, Wilson MF, et al. Procalcitonin increase after endotoxin injection in normal subjects. J Clin Endocrinol Metab. 1994;79(6):1605-1608. https://doi.org/10.1210/jcem.79.6.7989463.
7. Brunkhorst FM, Heinz U, Forycki ZF. Kinetics of procalcitonin in iatrogenic sepsis. Intensive Care Med. 1998;24(8):888-889.
8. Huang DT, Weissfeld LA, Kellum JA, et al; GenIMS Investigators. Risk prediction with procalcitonin and clinical rules in community-acquired pneumonia. Ann Emerg Med. 2008;52(1):48-58 e42. https://doi.org/10.1016/j.annemergmed.2008.01.003.
9. McCluskey SM, Schuetz P, Abers MS, et al. Serial procalcitonin as a predictor of pacteremia and peed for intensive care unit care in adults with pneumonia, including those with highest severity: A Prospective Cohort Study. Open Forum Infect Dis. 2017;4(1):ofw238. https://doi.org/10.1093/ofid/ofw238.
10. Self WH, Grijalva CG, Williams DJ, et al. Procalcitonin as an early marker of the need for invasive respiratory or vasopressor support in adults with community-acquired pneumonia. Chest. 2016;150(4):819-828. https://doi.org/10.1016/j.chest.2016.04.010.
11. Don M, Valent F, Korppi M, et al. Efficacy of serum procalcitonin in evaluating severity of community-acquired pneumonia in childhood. Scand J Infect Dis. 2007;39(2):129-137. https://doi.org/10.1080/00365540600951283.
12. Meisner M. Update on procalcitonin measurements. Ann Lab Med. 2014;34(4):263-273. https://doi.org/10.3343/alm.2014.34.4.263.
13. Jain S, Williams DJ, Arnold SR, et al; CDC EPIC Study Team. Community-acquired pneumonia requiring hospitalization among U.S. children. N Engl J Med. 2015;372(9):835-845. https://doi.org/10.1056/NEJMoa1405870.
14. Jain S, Self WH, Wunderink RG, et al; CDC EPIC Study Team. Community-Acquired Pneumonia Requiring Hospitalization among U.S. adults. N Engl J Med. 2015;373(5):415-427. https://doi.org/10.1056/NEJMoa1500245.
15. Aloisio E, Dolci A, Panteghini M. Procalcitonin: Between evidence and critical issues. Clin Chim Acta. 2019;496:7-12. https://doi.org/10.1016/j.cca.2019.06.010.
16. Society for Healthcare Epidemiology of A, Infectious Diseases Society of A, Pediatric Infectious Diseases S. Policy statement on antimicrobial stewardship by the Society for Healthcare Epidemiology of America (SHEA), the Infectious Diseases Society of America (IDSA), and the Pediatric Infectious Diseases Society (PIDS). Infect Control Hosp Epidemiol. 2012;33(4):322-327. https://doi.org/10.1086/665010.
17. Gerber JS, Kronman MP, Ross RK, et al. Identifying targets for antimicrobial stewardship in children’s hospitals. Infect Control Hosp Epidemiol. 2013;34(12):1252-1258. https://doi.org/10.1086/673982.
Procalcitonin (PCT) is a biomarker that has shown promise to identify bacterial etiology in acute infections, including bacterial lower respiratory tract infection (LRTI). In 2017, the United States Food and Drug Administration (FDA) approved the use of PCT as a diagnostic aid to guide the decisions around antibiotic therapy in acute LRTI.1 Although most of the data supporting the use of PCT for LRTI stems from adult studies, the high disease burden, predominance of viral etiologies, and frequent diagnostic uncertainty resulting in antibiotic overuse make pediatric LRTI an ideal target for the use of PCT as a diagnostic aid. This review evaluates and summarizes the current evidence regarding the role of PCT in the clinical care of pediatric LRTI, including its use in guiding antibiotic use and prognosticating disease severity.
THE ROLE OF PROCALCITONIN IN GUIDING INITIATION OF ANTIBIOTICS
The commonly used PCT cut points for withholding or stopping antibiotics in adults and children are 0.1 µg/L (very low risk of bacterial etiology) or 0.25 µg/L (low risk of bacterial etiology).2-4 Among the 532 children enrolled in the multicenter study of Etiology of Pneumonia in the Community (EPIC), a PCT threshold of 0.25 µg/L demonstrated an approximate sensitivity of 85%, specificity of 45%, positive likelihood ratio of 1.55, and negative likelihood ratio of 0.33 for community acquired pneumonia (CAP) caused by typical bacterial pathogens.5 Lowering the cutoff to <0.1 µg/L increased PCT sensitivity to 100%, decreased specificity, positive likelihood ratio, and negative likelihood ratio to 20%, 1.26, and 0, respectively. Although the EPIC study obtained culture and performed PCR testing on any blood sample, pleural fluid specimen, endotracheal aspirate, or bronchoalveolar–lavage specimens obtained during the study period, currently available laboratory methods show poor sensitivity for defining bacterial LRTI. Thus, bacterial etiologies may have been underestimated. The highly negative predictive value demonstrated in this study highlights the potential of PCT as a biomarker for ruling out bacterial diseases, including LRTI.
Multiple studies have evaluated the potential utility of PCT in guiding antibiotic initiation in adults with LRTI, but data on pediatric patients are sparse.4 In a randomized, single-center Italian study comparing a PCT-guided algorithm (withholding antibiotics when PCT < 0.25 µg/L) versus usual care among 319 hospitalized children with pneumonia, the PCT group experienced fewer antibiotic initiations (15.5% vs 100%, P < .05) without significant differences in recurrence of respiratory symptoms or new antibiotic prescriptions in the month following enrollment.2
A similar randomized trial using a PCT-guided algorithm for the initiation of antibiotics conducted among 337 Swiss children presented to the emergency department (ED) with pneumonia and other LRTIs failed to demonstrate decreases in antibiotic initiation.3 This study used an algorithm that categorized the likelihood of requiring antibiotic treatment for bacterial LRTI as “definitely” if PCT was >0.5 µg/L, “probably” if PCT was 0.26–0.5 µg/L, “probably not” if PCT was 0.1–0.25 µg/L, and “definitely not” if PCT was <0.1 µg/L. In the PCT group, 104 out of 168 (62%) patients received antibiotics within 14 days compared with 93 out of 165 (56%) patients in the control group (odds ratio [OR]: 1.26, 95% CI: 0.81, 1.95). In the subgroup analyses, the odds of administering antibiotics to those with nonpneumonia LRTI was significantly higher than those of the PCT group and control group (OR: 4.09, 95% CI: 1.8, 9.93); the odds of receiving antibiotics also showed no difference in the subgroup of children with pneumonia (OR: 0.66, 95% CI: 0.35, 1.23).
The benefit of PCT for informing decisions around the initiation of antibiotics likely varies based on perceived risk of bacterial diseases. When the pretest probability of bacterial disease is extremely high, the use of PCT is unlikely to alter treatment decisions. Similarly, PCT should not be used in situations where the pretest probability for bacterial pneumonia is very low—in these instances, an elevated PCT may lead to unnecessary antibiotic use among children presenting to the ED. However, the risk of bacterial pneumonia is often equivocal, and in these situations, PCT may provide clinicians with useful insights, primarily for ruling out bacterial disease.
THE ROLE OF PROCALCITONIN IN GUIDING DISCONTINUATION OF ANTIBIOTICS
In the study by Esposito et al., the PCT levels were additionally measured every two days until discharge and during two scheduled follow-up visits; the antibiotics were discontinued when PCT < 0.25 µg/L.2 The PCT-guided group experienced shorter antibiotic duration (mean 5.4 vs 11.0 days, P < .05), shorter length of hospital stay (mean 4.7 vs 5.61 days for mild LRTI and 5.01 vs 5.93 for severe LRTI), and fewer antibiotic-related adverse events (3.9% vs 25.2%, P < .05). Similarly, in the study by Baer et al., the PCT-guided group had PCT levels repeated on days three and five after enrollment, and the antibiotics were discontinued when PCT was less than 0.25 µg/L. The duration of antibiotic administration was significantly lower in the PCT-guided group (mean difference: 1.8 days, 95% CI: −3.1, −0.).3 The rates of hospitalization, duration of hospital stay, and mean impairment of daily activities attributable to LRTI were similar between groups.
Considering the adult studies and the small number of pediatric LRTI research published to date, the use of PCT to safely reduce antibiotic treatment duration is encouraging.4 Although the studies on the kinetics of PCT are limited, the biomarker has been shown to rise two to four hours after a bacterial stimulus, peak in 24-48 hours and achieve a half-life of 24-36 hours.6,7 As such, serial PCT measurements at 24-hour intervals for three to five days may be more beneficial than stand-alone PCT tests. Nonetheless, additional studies are needed to better define groups of patients who will most likely benefit from PCT testing and to understand how to best integrate testing into clinical practice.
PROCALCITONIN FOR SEVERITY PREDICTION OF LRTI
PCT has also been explored as a marker of LRTI disease severity. In a 2008 multicenter cohort encompassing 1,651 adults with pneumonia, PCT < 0.1 µg/L was associated with a decreased 30-day mortality, shorter length of stay, and decreased admission to the intensive care unit (ICU) compared with those with PCT>0.1 µg/L.8 In a 2017 study of 317 adults hospitalized with pneumonia, the PCT level was significantly higher in those with bacteremia and in those admitted to intensive care.9 When used in combination with the pneumonia severity index (PSI), the addition of PCT resulted in improved prognostic performance compared with the PSI alone for both outcomes, increasing the area under the receiver operating characteristic curve from 0.67 to 0.85 for bacteremia and from 0.58 to 0.64 for intensive care. Similarly, in the adult EPIC cohort, the addition of PCT contributed significant prognostic information beyond existing severity scores for predicting the need for invasive respiratory or vasopressor support; each 1 µg/L increase in PCT was associated with a 1% to 2% absolute increase in the need for this outcome.10
A European study of 100 children with pneumonia also demonstrated higher PCT values among hospitalized children (n = 26, median PCT 17.8 µg/L) compared with outpatient children (n = 73, median PCT 0.72 µg/L, P < .01).11 Among the 532 children from the EPIC study, a PCT < 0.25 µg/L was associated with the reduced odds of ICU admission (adjusted OR: 0.48; 95% CI: 0.30, 0.78) and a 2.3-day (95% CI: 1.4, 3.2) decrease in the average length of stay compared with those with higher PCT concentrations.5 Of the 34 children with empyema requiring drainage, 28 (82%) showed a PCT concentration ≥0.5 µg/L. Additional pediatric studies are needed, but the limited data to date suggest that PCT may play a role in predicting pediatric LRTI disease severity, including the need for mechanical ventilatory support and ICU-level care.
LIMITATIONS TO CLINICAL APPLICATION
Although PCT shows promise as a biomarker to reliably rule out bacterial infection, several potential limitations exist in assessing its role in pediatric LRTI. Atypical bacterial infections (ie, Mycoplasma pneumoniae) and localized bacterial infection may not induce significant PCT production, as has been shown in adults and children with tonsillitis, localized skin infections, endocarditis, or empyema (Table).12 The majority of clinical trials in LRTI have been conducted in the adult population,4 with the number of pediatric trials remaining small.2,3 Given the predominance of viral LRTI in children compared with adults, the utility of PCT may differ in these populations.13,14 Furthermore, existing studies demonstrate mixed results regarding the magnitude of benefits that PCT may provide in terms of limiting antibiotic use. Another concern is the potential of PCT to increase unnecessary antibiotic use in those with viral LRTI,3 as PCT may also be increased in populations with systemic inflammation from nonbacterial causes.12,15
CONCLUSIONS AND CLINICAL APPLICATION
The misuse of antibiotics is a public health crisis resulting in the emergence of antibiotic-resistant pathogens and adverse outcomes, including Clostridioides difficile infection, drug toxicities, and increased healthcare costs.16 Pneumonia is responsible for more days of antibiotics than any other disease in children’s hospitals and is an important target for stewardship efforts.17 PCT is a promising biomarker for distinguishing bacterial from viral infection, and its use may help in making informed antibiotic decisions and predicting disease outcomes in pediatric LRTI. Although PCT has been cleared by the FDA for assisting with antibiotic decisions in pediatric LRTI, the majority of evidence supporting this indication is drawn from adults. Additional studies are needed prior to the widespread implementation in the pediatric population, but the results of available pediatric studies show promise. The clinical context and severity of patient presentation are important when considering whether or not to use PCT and how to best interpret PCT levels when making clinical management decisions. The utility of PCT for antibiotic initiation in the pediatric population is encouraging given the predominance of viral etiologies in pediatric LRTI. Currently available data demonstrate the value of serial PCT measurements in antibiotic de-escalation and promoting antibiotic stewardship for children and adults.2-4 As with all new diagnostic modalities, provider education is paramount to ensure a safe and value-driven implementation.
Disclosures
Dr. Katz received investigator-initiated grant funding from Roche and bioMérieux to conduct research involving procalcitonin in the past three years. Dr. Sartori has nothing to disclose. Dr. Williams received investigator-initiated grant funding from bioMérieux to conduct research involving procalcitonin in the past three years.
Funding
This work was supported by the National Institute of Health (1T32AI095202-07).
Disclaimer
This content is solely the responsibility of the authors and does not necessarily represent the official views of the National Institutes of Health, Roche, or bioMérieux.
1. FDA clears test to help manage antibiotic treatment for lower respiratory tract infections and sepsis. US Food and Drug Administration. [Press Release]. Silver Spring, MD, February 23 2017.
2. Esposito S, Tagliabue C, Picciolli I, et al. Procalcitonin measurements for guiding antibiotic treatment in pediatric pneumonia. Respir Med. 2011;105(12):1939-1945. https://doi.org/10.1016/j.rmed.2011.09.003.
3. Baer G, Baumann P, Buettcher M, et al. Procalcitonin guidance to reduce antibiotic treatment of lower respiratory tract infection in children and adolescents (ProPAED): a randomized controlled trial. PLoS One. 2013;8(8):e68419. https://doi.org/10.1371/journal.pone.0068419.
4. Choi JJ MM, Simon MS, Evans AT, Self WH, Glesby MJ. Procalcitonin in the diagnosis and management of community-acquired pneumonia in hospitalized adults. J Hosp Med. 2019;18(X);XXX-XXX. https://doi.org/10.12788/jhm.3272.
5. Stockmann C, Ampofo K, Killpack J, et al. Procalcitonin accurately identifies hospitalized children with low risk of bacterial community-acquired pneumonia. J Pediatric Infect Dis Soc. 2017;7(1): 46-53. https://doi.org/10.1093/jpids/piw091.
6. Dandona P, Nix D, Wilson MF, et al. Procalcitonin increase after endotoxin injection in normal subjects. J Clin Endocrinol Metab. 1994;79(6):1605-1608. https://doi.org/10.1210/jcem.79.6.7989463.
7. Brunkhorst FM, Heinz U, Forycki ZF. Kinetics of procalcitonin in iatrogenic sepsis. Intensive Care Med. 1998;24(8):888-889.
8. Huang DT, Weissfeld LA, Kellum JA, et al; GenIMS Investigators. Risk prediction with procalcitonin and clinical rules in community-acquired pneumonia. Ann Emerg Med. 2008;52(1):48-58 e42. https://doi.org/10.1016/j.annemergmed.2008.01.003.
9. McCluskey SM, Schuetz P, Abers MS, et al. Serial procalcitonin as a predictor of pacteremia and peed for intensive care unit care in adults with pneumonia, including those with highest severity: A Prospective Cohort Study. Open Forum Infect Dis. 2017;4(1):ofw238. https://doi.org/10.1093/ofid/ofw238.
10. Self WH, Grijalva CG, Williams DJ, et al. Procalcitonin as an early marker of the need for invasive respiratory or vasopressor support in adults with community-acquired pneumonia. Chest. 2016;150(4):819-828. https://doi.org/10.1016/j.chest.2016.04.010.
11. Don M, Valent F, Korppi M, et al. Efficacy of serum procalcitonin in evaluating severity of community-acquired pneumonia in childhood. Scand J Infect Dis. 2007;39(2):129-137. https://doi.org/10.1080/00365540600951283.
12. Meisner M. Update on procalcitonin measurements. Ann Lab Med. 2014;34(4):263-273. https://doi.org/10.3343/alm.2014.34.4.263.
13. Jain S, Williams DJ, Arnold SR, et al; CDC EPIC Study Team. Community-acquired pneumonia requiring hospitalization among U.S. children. N Engl J Med. 2015;372(9):835-845. https://doi.org/10.1056/NEJMoa1405870.
14. Jain S, Self WH, Wunderink RG, et al; CDC EPIC Study Team. Community-Acquired Pneumonia Requiring Hospitalization among U.S. adults. N Engl J Med. 2015;373(5):415-427. https://doi.org/10.1056/NEJMoa1500245.
15. Aloisio E, Dolci A, Panteghini M. Procalcitonin: Between evidence and critical issues. Clin Chim Acta. 2019;496:7-12. https://doi.org/10.1016/j.cca.2019.06.010.
16. Society for Healthcare Epidemiology of A, Infectious Diseases Society of A, Pediatric Infectious Diseases S. Policy statement on antimicrobial stewardship by the Society for Healthcare Epidemiology of America (SHEA), the Infectious Diseases Society of America (IDSA), and the Pediatric Infectious Diseases Society (PIDS). Infect Control Hosp Epidemiol. 2012;33(4):322-327. https://doi.org/10.1086/665010.
17. Gerber JS, Kronman MP, Ross RK, et al. Identifying targets for antimicrobial stewardship in children’s hospitals. Infect Control Hosp Epidemiol. 2013;34(12):1252-1258. https://doi.org/10.1086/673982.
© 2019 Society of Hospital Medicine
Home Smoke Exposure and Health-Related Quality of Life in Children with Acute Respiratory Illness
Acute respiratory illnesses (ARIs), including acute exacerbations of asthma, croup, pneumonia, and bronchiolitis, are among the most common illnesses in childhood.1 Although most ARIs can be managed in the outpatient setting,
Exposure to secondhand smoke (SHS) is a preventable risk factor for ARI in children, particularly when there is regular exposure in the home.2 Chronic exposure to SHS impacts systemic inflammation by suppressing serum interferon-gamma,3 which can lead to increased susceptibility to viral and bacterial infections,4 and increasing Th2 (atopic) cytokine expression, which is associated with asthma.5 SHS exposure in children has also been linked to diminished lung function.6 As a result, SHS exposure is associated with increased ARI susceptibility and severity in children.7-10
Much research has focused on the clinical impact of SHS exposure on respiratory health in children, but little is known about the impact on patient-reported outcomes, such as health-related quality of life (HRQOL). Patient-reported outcomes help provide a comprehensive evaluation of the effectiveness of healthcare delivery systems. These outcomes are increasingly used by health service researchers to better understand patient and caregiver perspectives.11 Given the known associations between SHS exposure and ARI morbidity, we postulated that regular SHS exposure would also impact HRQOL in children. In this study, we assessed the relationship between SHS exposure and HRQOL within a large, multicenter, prospective cohort of children presenting to the emergency department (ED) and/or hospital with ARI.
METHODS
Study Population
This study was nested within the Pediatric Respiratory Illness Measurement System (PRIMES) study, a prospective cohort study of children with ARI in the ED and inpatient settings at five tertiary care children’s hospitals within the Pediatric Research in Inpatient Settings Network in Colorado, Pennsylvania, Tennessee, Texas, and Washington. Eligible children were two weeks to 16 years of age hospitalized after presenting to the ED with a primary diagnosis of asthma, croup, bronchiolitis, or pneumonia between July 1, 2014 and June 30, 2016. Because of an anticipated low frequency of croup hospitalizations, we also included children presenting to the ED and then discharged to home with this diagnosis. Children were assigned to a PRIMES diagnosis group based on their final discharge diagnosis. If there was a discrepancy between admission and discharge diagnoses, the discharge diagnosis was used. If a child had more than one discharge diagnosis for a PRIMES condition (eg, acute asthma and pneumonia), we chose the PRIMES condition with the lowest total enrollments overall. If the final discharge diagnosis was not a PRIMES condition, the case was excluded from further analysis. Patients with immunodeficiency, cystic fibrosis, a history of prematurity <32 weeks, chronic neuromuscular disease, cardiovascular disease, pulmonary diseases (other than asthma), and moderate to severe developmental delay were also excluded. Children admitted to intensive care were eligible only if they were transferred to an acute care ward <72 hours following admission. A survey was administered at the time of enrollment that collected information on SHS exposure, HRQOL, healthcare utilization, and demographics. All study procedures were reviewed and approved by the institutional review boards at each of the participating hospitals.
SECONDHAND SMOKE EXPOSURE
To ascertain SHS exposure, we asked caregivers, “How many persons living in the child’s home smoke?” Responses were dichotomized into non-SHS exposed (0 smokers) and SHS exposed (≥1 smokers). Children with missing data on home SHS exposure were excluded.
Health-Related Quality of Life Outcomes
We estimated HRQOL using the Pediatric Quality of Life (PedsQLTM) 4.0 Generic Core and Infant Scales. The PedsQL instruments are validated, population HRQOL measures that evaluate the physical, mental, emotional, and social functioning of children two to 18 years old based on self- or caregiver-proxy report.12-15 These instruments have also shown responsiveness as well as construct and predictive validity in hospitalized children.11 For this study, we focused on the PedsQL physical functioning subscale, which assesses for problems with physical activities (eg, sports activity or exercise, low energy, and hurts or aches) on a five-point Likert scale (never to almost always a problem). Scores range from 0 to 100 with higher scores indicating a better HRQOL. The reported minimal clinically important difference (MCID), defined as the smallest difference in which individuals would perceive a benefit or would necessitate a change in management, for this scale is 4.5 points.16,17
Children >8 years old were invited to complete the self-report version of the PedsQL. For children <8 years old, and for older children who were unable to complete them, surveys were completed by a parent or legal guardian. Respondents were asked to assess perceptions of their (or their child’s) HRQOL during periods of baseline health (the child’s usual state of health in the month preceding the current illness) and during the acute illness (the child’s state of health at the time of admission) as SHS exposure may influence perceptions of general health and/or contribute to worse outcomes during periods of acute illness.
Covariates collected at the time of enrollment included sociodemographics (child age, gender, race/ethnicity, and caregiver education), and healthcare utilization (caregiver-reported patient visits to a healthcare provider in the preceding six months). Insurance status and level of medical complexity (using the Pediatric Medical Complexity Algorithm)18 were obtained using the Pediatric Hospital Information System database, an administrative database containing clinical and resource utilization data from >45 children’s hospitals in the United States including all of the PRIMES study hospitals.13
Analysis
Descriptive statistics included frequency (%) and mean (standard deviation). Bivariate comparisons according to SHS exposure status were analyzed using chi-squared tests for categorical variables and analysis of variance for continuous variables. Multivariable linear mixed regression models were used to examine associations between home SHS exposure and HRQOL for baseline health and during admission, overall and stratified by diagnosis. Covariates in each model included age, sex, race/ethnicity, caregiver education, and healthcare visits in the preceding six months. We also included a hospital random effect to account for clustering of patients within hospitals and used robust standard errors for inference.
In a secondary analysis to explore potential dose-response effects of SHS exposure, we examined associations between an ordinal exposure variable (0 smokers, 1 smoker, ≥2 smokers) and HRQOL for baseline health and during admission for the acute illness. Because of sample size limitations, diagnosis-specific analyses examining dose-response effects were not conducted.
RESULTS
Study Population
Of the 2,334 children enrolled in the PRIMES study, 25 (1%) respondents did not report on home SHS exposure and were excluded, yielding a final study population of 2,309 children, of whom 728 (32%) had reported home SHS exposure. The study population included 664 children with asthma (mean age seven years [3.5]; 38% with home SHS exposure), 740 with bronchiolitis (mean age 0.7 years [0.5]; 32% with home SHS exposure), 342 with croup (mean age 1.7 [1.1]; 25% with home SHS exposure), and 563 with pneumonia (mean age 4.4 [3.8]; 27% with home SHS exposure; Table 1). Compared with non-SHS-exposed children, those with home SHS exposure tend to be slightly older (3.9 vs 3.4 years, P = .01), more likely to be non-Hispanic Black (29% vs 19%, P < .001), to have a chronic condition (52% vs 41%, P < .001), to come from a household where caregiver(s) did not graduate from college (45% vs 29%, P < .001), and to have public insurance (73% vs 49%, P < .001).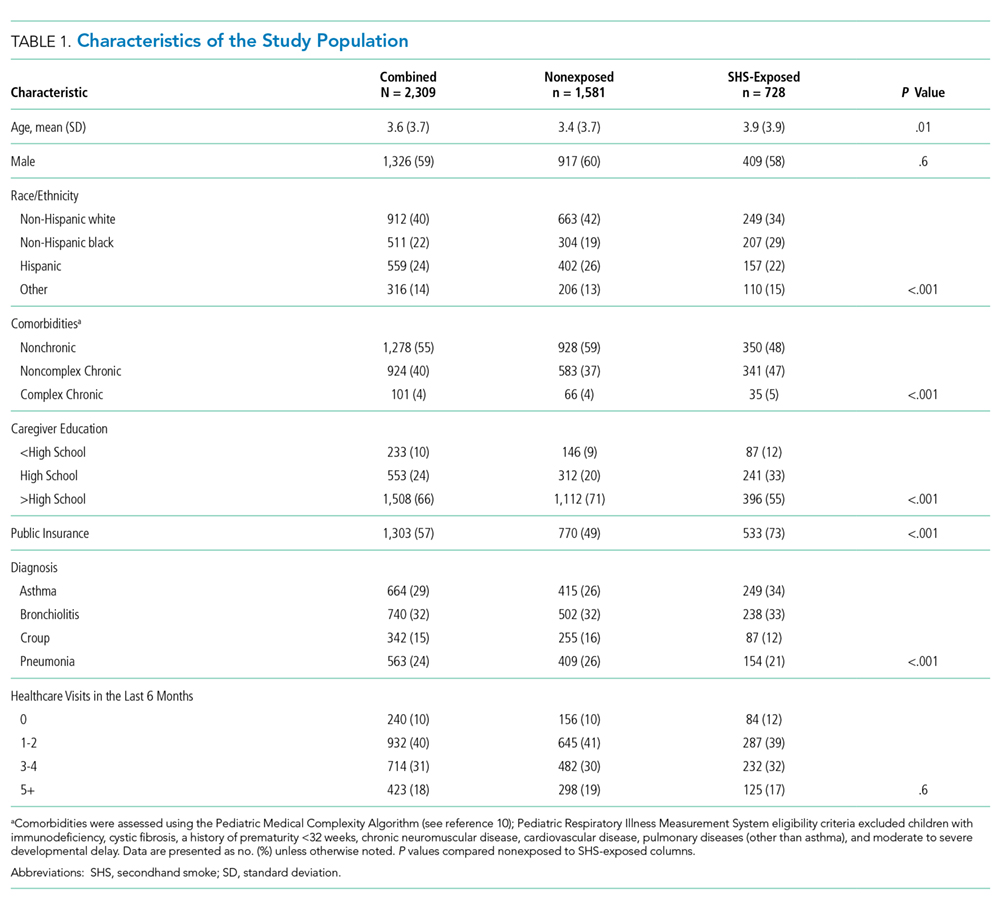
Home SHS Exposure and Health-related Quality of Life
The overall mean HRQOL score for baseline health was 83 (15), with a range across diagnoses of 82 to 87. Compared with non-SHS-exposed children, children with home SHS exposure had a lower mean HRQOL score for baseline health (adjusted mean difference –3.04 [95% CI -4.34, –1.74]). In analyses stratified by diagnosis, baseline health scores were lower for SHS-exposed children for all four conditions, but differences were statistically significant only for bronchiolitis (adjusted mean difference –2.94 [–5.0, –0.89]) and pneumonia (adjusted mean value –4.13 [–6.82, –1.44]; Table 2); none of these differences met the MCID threshold.
The overall mean HRQOL score at the time of admission was 56 (23), with a range across diagnoses of 49 to 61, with lower scores noted among SHS-exposed children compared with non-SHS-exposed children (adjusted mean difference –2.16 [–4.22, –0.10]). Similar to scores representing baseline health, admission scores were lower across all four conditions for SHS-exposed children. Only children with croup, however, had significantly lower admission scores that also met the MCID threshold (adjusted mean difference –5.71 [–10.67, –0.75]; Table 2).
To assess for potential dose-response effects of SHS exposure on HRQOL, we stratified SHS-exposed children into those with one smoker in the home (n = 513) and those with ≥2 smokers in the home (n = 215). Compared with non-SHS-exposed children, both HRQOL scores (baseline health and admission) were lower for SHS-exposed children. Consistent with a dose-response association, scores were lowest for children with ≥2 smokers in the home, both at baseline health (adjusted mean difference –3.92 [–6.03, –1.81]) and on admission (adjusted mean difference –3.67 [–6.98, –0.36]; Table 3).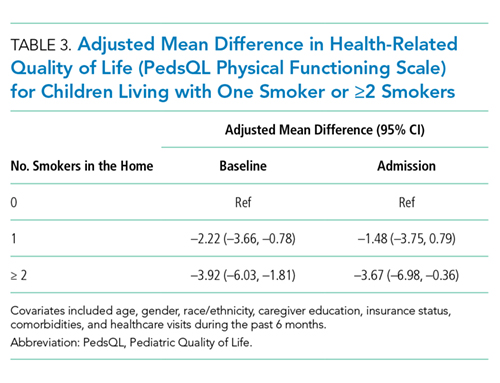
DISCUSSION
Within a multicenter cohort of 2,309 children hospitalized with ARI, we noted significantly lower HRQOL scores among children exposed to SHS in the home as compared with nonexposed children. Differences were greatest for children living with ≥2 smokers in the home. In analyses stratified by diagnosis, differences in baseline health HRQOL scores were greatest for children with bronchiolitis and pneumonia. Differences in acute illness scores were greatest for children with croup.16
Our study provides evidence for acute and chronic impacts of SHS on HRQOL in children hospitalized with ARI. Although several studies have linked SHS exposure to reduced HRQOL in adults,19,20 few similar studies have been conducted in children. Nonetheless, a wealth of studies have documented the negative impact of SHS exposure on clinical outcomes among children with ARI.8,10,21-23 Our findings that home SHS exposure was associated with reduced HRQOL among our cohort of children with ARI are therefore consistent with related findings in adults and children. The observation that the effects of SHS exposure on HRQOL were greatest among children living with ≥2 smokers provides further evidence of a potential causal link between regular SHS exposure and HRQOL.
Although the magnitude and significance of associations between SHS exposure and HRQOL varied for each of the four diagnoses for baseline health and the acute illness, it is important to note that the point estimates for the adjusted mean differences were uniformly lower for the SHS-exposed children in each subgroup. Even so, only acute illness scores for croup exceeded the MCID threshold.16 Croup is the only included condition of the upper airway and is characterized by laryngotracheal inflammation leading to the typical cough and, in moderate to severe cases, stridor. Given that chronic SHS exposure induces a proinflammatory state,3 it is possible that SHS-exposed children with croup had more severe illness compared with nonexposed children with croup resulting in lower HRQOL scores on admission. Further, perceived differences in illness severity and HRQOL may be more readily apparent in children with croup (eg, stridor at rest vs intermittent or no stridor) as compared with children with lower respiratory tract diseases.
Of the four included diagnoses, the link between SHS exposure and asthma outcomes has been most studied. Prior work has demonstrated more frequent and severe acute exacerbations, as well as worse long-term lung function among SHS-exposed children as compared with nonexposed children.22-24 It was, therefore, surprising that our study failed to demonstrate associations between SHS exposure and HRQOL among children with asthma. Reasons for this finding are unclear. One hypothesis is that caregivers of SHS-exposed children with asthma may be more aware of the impacts of SHS exposure on respiratory health (through prior education) and, thus, more likely to modify their smoking behaviors, or for their children to be on daily asthma controller therapy. Alternatively, caregivers of children with asthma may be more likely to underreport home SHS exposure. Thirty-eight percent of children with asthma, however, were classified as SHS-exposed. This percentage was greater than the other three conditions studied (25%-32%), suggesting that differential bias in underreporting was minimal. Given that children with asthma were older, on average, than children with the other three conditions, it may also be that these children spent more time in smoke-free environments (eg, school).
Nearly one-third of children in our study were exposed to SHS in the home. This is similar to the prevalence of exposure in other studies conducted among hospitalized children8,10,21,25 but higher than the national prevalence of home SHS exposure among children in the United States.26 Thus, hospitalized children represent a particularly vulnerable population and an important target for interventions aiming to reduce exposure to SHS. Although longitudinal interventions are likely necessary to affect long-term success, hospitalization for ARI may serve as a powerful teachable moment to begin cessation efforts. Hospitalization also offers time beyond a typical primary care outpatient encounter to focus on cessation counseling and may be the only opportunity to engage in counseling activities for some families with limited time or access. Further, prior studies have demonstrated both the feasibility and the effectiveness of smoking cessation interventions in hospitalized children.27-30 Unfortunately, however, SHS exposure is often not documented at the time of hospitalization, and many opportunities to intervene are missed.25,31 Thus, there is a need for improved strategies to reliably identify and intervene on SHS-exposed children in the hospital setting.
These findings should be considered in the context of several limitations. The observational nature of our study raises the potential for confounding, specifically with regard to socioeconomic status, as this is associated with both SHS exposure and lower HRQOL. Our modeling approach attempted to control for several factors associated with socioeconomic status, including caregiver education and insurance coverage, but there is potential for residual confounding. No single question is sufficient to fully assess SHS exposure as the intensity of home SHS exposure likely varies widely, and some children may be exposed to SHS outside of the home environment.32 The home, however, is often the most likely source of regular SHS exposure,33,34 especially among young children (our cohort’s mean age was 3.6 years). Misclassification of SHS exposure is also possible due to underreporting of smoking.35,36 As a result, some children regularly exposed to SHS may have been misclassified as nonexposed, and the observed associations between SHS exposure and HRQOL may be underestimated. Confirming our study’s findings using objective assessments of SHS exposure, such as cotinine, are warranted. Given the young age of our cohort, the PedsQL surveys were completed by the parent or legal guardian only in >90% of the enrolled subjects, and caregiver perceptions may not accurately reflect the child’s perceptions. Prior work, however, has demonstrated the validity of parent-proxy reporting of the PedsQL, including correlation with child self-report.37 In our study, correlation between child and caregiver reporting (when available) was also very good (r = 0.72, 95% CI 0.64, 0.77). It is also possible that the timing of the HRQOL assessments (on admission) may have biased perceptions of baseline HRQOL, although we anticipate any bias would likely be nondifferential between SHS-exposed and nonexposed children and across diagnoses.
Nearly one-third of children in our study were exposed to SHS exposure in the home, and SHS exposure was associated with lower HRQOL for baseline health and during acute illness, providing further evidence of the dangers of SHS. Much work is needed in order to eliminate the impact of SHS on child health and families of children hospitalized for respiratory illness should be considered a priority population for smoking cessation efforts.
Acknowledgment
The authors wish to acknowledge the efforts of PRIS-PRIMES study team. The authors also wish to thank the children and families who consented to be a part of the PRIMES study.
Disclosures
The authors have no conflicts of interest relevant to this article to disclose.
Funding
This study was supported by NIH-NHLBI 1R01HL121067 to RMS.
1. Witt WP, Weiss AJ, Elixhauser A. Overview of Hospital Stays for Children in the United States, 2012: Statistical Brief #187. Healthcare Cost and Utilization Project (HCUP) Statistical Briefs. Rockville (MD)2006. PubMed
2. Burke H, Leonardi-Bee J, Hashim A, et al. Prenatal and passive smoke exposure and incidence of asthma and wheeze: systematic review and meta-analysis. Pediatrics. 2012;129(4):735-744. PubMed
3. Jinot J, Bayard S. Respiratory health effects of exposure to environmental tobacco smoke. Rev Environ Health. 1996;11(3):89-100. PubMed
4. Wilson KM, Wesgate SC, Pier J, et al. Secondhand smoke exposure and serum cytokine levels in healthy children. Cytokine. 2012;60(1):34-37. PubMed
5. Feleszko W, Zawadzka-Krajewska A, Matysiak K, et al. Parental tobacco smoking is associated with augmented IL-13 secretion in children with allergic asthma. J Allergy Clin Immunol. 2006;117(1):97-102. PubMed
6. Cook DG, Strachan DP. Health effects of passive smoking-10: Summary of effects of parental smoking on the respiratory health of children and implications for research. Thorax. 1999;54(4):357-366. PubMed
7. Merianos AL, Dixon CA, Mahabee-Gittens EM. Secondhand smoke exposure, illness severity, and resource utilization in pediatric emergency department patients with respiratory illnesses. J Asthma. 2017;54(8):798-806. PubMed
8. Ahn A, Edwards KM, Grijalva CG, et al. Secondhand Smoke Exposure and Illness Severity among Children Hospitalized with Pneumonia. J Pediatr. 2015;167(4):869-874 e861. PubMed
9. Cheraghi M, Salvi S. Environmental tobacco smoke (ETS) and respiratory health in children. Eur J Pediatr. 2009;168(8):897-905. PubMed
10. Bradley JP, Bacharier LB, Bonfiglio J, et al. Severity of respiratory syncytial virus bronchiolitis is affected by cigarette smoke exposure and atopy. Pediatrics. 2005;115(1):e7-e14. PubMed
11. Desai AD, Zhou C, Stanford S, Haaland W, Varni JW, Mangione-Smith RM. Validity and responsiveness of the pediatric quality of life inventory (PedsQL) 4.0 generic core scales in the pediatric inpatient setting. JAMA Pediatr. 2014;168(12):1114-1121. PubMed
12. Varni JW, Seid M, Kurtin PS. PedsQL 4.0: reliability and validity of the Pediatric Quality of Life Inventory version 4.0 generic core scales in healthy and patient populations. Med Care. 2001;39(8):800-812. PubMed
13. Varni JW, Limbers CA, Neighbors K, et al. The PedsQL Infant Scales: feasibility, internal consistency reliability, and validity in healthy and ill infants. Qual Life Res. 2011;20(1):45-55.
14. Hullmann SE, Ryan JL, Ramsey RR, Chaney JM, Mullins LL. Measures of general pediatric quality of life: Child Health Questionnaire (CHQ), DISABKIDS Chronic Generic Measure (DCGM), KINDL-R, Pediatric Quality of Life Inventory (PedsQL) 4.0 Generic Core Scales, and Quality of My Life Questionnaire (QoML). Arthritis Care Res (Hoboken). 2011;63(11):S420-S430. PubMed
15. Varni JW, Seid M, Rode CA. The PedsQL: measurement model for the pediatric quality of life inventory. Med Care. 1999;37(2):126-139. PubMed
16. Varni JW, Burwinkle TM, Seid M, Skarr D. The PedsQL 4.0 as a pediatric population health measure: feasibility, reliability, and validity. Ambul Pediatr. 2003;3(6):329-341. PubMed
17. Varni JW, Burwinkle TM, Seid M. The PedsQL 4.0 as a school population health measure: feasibility, reliability, and validity. Qual Life Res. 2006;15(2):203-215. PubMed
18. Simon TD, Cawthon ML, Stanford S, et al. Pediatric medical complexity algorithm: a new method to stratify children by medical complexity. Pediatrics. 2014;133(6):e1647-e1654. PubMed
19. Chen J, Wang MP, Wang X, Viswanath K, Lam TH, Chan SS. Secondhand smoke exposure (SHS) and health-related quality of life (HRQoL) in Chinese never smokers in Hong Kong. BMJ Open. 2015;5(9):e007694. PubMed
20. Bridevaux PO, Cornuz J, Gaspoz JM, et al. Secondhand smoke and health-related quality of life in never smokers: results from the SAPALDIA cohort study 2. Arch Intern Med. 2007;167(22):2516-2523. PubMed
21. Wilson KM, Pier JC, Wesgate SC, Cohen JM, Blumkin AK. Secondhand tobacco smoke exposure and severity of influenza in hospitalized children. J Pediatr. 2013;162(1):16-21. PubMed
22. LeSon S, Gershwin ME. Risk factors for asthmatic patients requiring intubation. I. Observations in children. J Asthma. 1995;32(4):285-294. PubMed
23. Chilmonczyk BA, Salmun LM, Megathlin KN, et al. Association between exposure to environmental tobacco smoke and exacerbations of asthma in children. N Engl J Med. 1993;328(23):1665-1669. PubMed
24. Evans D, Levison MJ, Feldman CH, et al. The impact of passive smoking on emergency room visits of urban children with asthma. Am Rev Respir Dis. 1987;135(3):567-572. PubMed
25. Wilson KM, Wesgate SC, Best D, Blumkin AK, Klein JD. Admission screening for secondhand tobacco smoke exposure. Hosp Pediatr. 2012;2(1):26-33. PubMed
26. Marano C, Schober SE, Brody DJ, Zhang C. Secondhand tobacco smoke exposure among children and adolescents: United States, 2003-2006. Pediatrics. 2009;124(5):1299-1305. PubMed
27. Ralston S, Roohi M. A randomized, controlled trial of smoking cessation counseling provided during child hospitalization for respiratory illness. Pediatr Pulmonol. 2008;43(6):561-566. PubMed
28. Winickoff JP, Hillis VJ, Palfrey JS, Perrin JM, Rigotti NA. A smoking cessation intervention for parents of children who are hospitalized for respiratory illness: the stop tobacco outreach program. Pediatrics. 2003;111(1):140-145. PubMed
29. Torok MR, Lowary M, Ziniel SI, et al. Perceptions of parental tobacco dependence treatment among a children’s hospital staff. Hosp Pediatr. 2018;8(11):724-728. PubMed
30. Jenssen BP, Shelov ED, Bonafide CP, Bernstein SL, Fiks AG, Bryant-Stephens T. Clinical decision support tool for parental tobacco treatment in hospitalized children. Appl Clin Inform. 2016;7(2):399-411. PubMed
31. Lustre BL, Dixon CA, Merianos AL, Gordon JS, Zhang B, Mahabee-Gittens EM. Assessment of tobacco smoke exposure in the pediatric emergency department. Prev Med. 2016;85:42-46. PubMed
32. Groner JA, Rule AM, McGrath-Morrow SA, et al. Assessing pediatric tobacco exposure using parent report: comparison with hair nicotine. J Expo Sci Environ Epidemiol. 2018;28(6):530-537. PubMed
33. Gergen PJ. Environmental tobacco smoke as a risk factor for respiratory disease in children. Respir Physiol. 2001;128(1):39-46. PubMed
34. Klepeis NE, Nelson WC, Ott WR, et al. The National Human Activity Pattern Survey (NHAPS): a resource for assessing exposure to environmental pollutants. J Expo Anal Environ Epidemiol. 2001;11(3):231-252. PubMed
35. Couluris M, Schnapf BM, Casey A, Xu P, Gross-King M, Krischer J. How to measure secondhand smoke exposure in a pediatric clinic setting. Arch Pediatr Adolesc Med. 2011;165(7):670-671. PubMed
36. Boyaci H, Etiler N, Duman C, Basyigit I, Pala A. Environmental tobacco smoke exposure in school children: parent report and urine cotinine measures. Pediatr Int. 2006;48(4):382-389. PubMed
37. Varni JW, Limbers CA, Burwinkle TM. Parent proxy-report of their children’s health-related quality of life: an analysis of 13,878 parents’ reliability and validity across age subgroups using the PedsQL 4.0 Generic Core Scales. Health Qual Life Outcomes. 2007;5(1):2. PubMed
Acute respiratory illnesses (ARIs), including acute exacerbations of asthma, croup, pneumonia, and bronchiolitis, are among the most common illnesses in childhood.1 Although most ARIs can be managed in the outpatient setting,
Exposure to secondhand smoke (SHS) is a preventable risk factor for ARI in children, particularly when there is regular exposure in the home.2 Chronic exposure to SHS impacts systemic inflammation by suppressing serum interferon-gamma,3 which can lead to increased susceptibility to viral and bacterial infections,4 and increasing Th2 (atopic) cytokine expression, which is associated with asthma.5 SHS exposure in children has also been linked to diminished lung function.6 As a result, SHS exposure is associated with increased ARI susceptibility and severity in children.7-10
Much research has focused on the clinical impact of SHS exposure on respiratory health in children, but little is known about the impact on patient-reported outcomes, such as health-related quality of life (HRQOL). Patient-reported outcomes help provide a comprehensive evaluation of the effectiveness of healthcare delivery systems. These outcomes are increasingly used by health service researchers to better understand patient and caregiver perspectives.11 Given the known associations between SHS exposure and ARI morbidity, we postulated that regular SHS exposure would also impact HRQOL in children. In this study, we assessed the relationship between SHS exposure and HRQOL within a large, multicenter, prospective cohort of children presenting to the emergency department (ED) and/or hospital with ARI.
METHODS
Study Population
This study was nested within the Pediatric Respiratory Illness Measurement System (PRIMES) study, a prospective cohort study of children with ARI in the ED and inpatient settings at five tertiary care children’s hospitals within the Pediatric Research in Inpatient Settings Network in Colorado, Pennsylvania, Tennessee, Texas, and Washington. Eligible children were two weeks to 16 years of age hospitalized after presenting to the ED with a primary diagnosis of asthma, croup, bronchiolitis, or pneumonia between July 1, 2014 and June 30, 2016. Because of an anticipated low frequency of croup hospitalizations, we also included children presenting to the ED and then discharged to home with this diagnosis. Children were assigned to a PRIMES diagnosis group based on their final discharge diagnosis. If there was a discrepancy between admission and discharge diagnoses, the discharge diagnosis was used. If a child had more than one discharge diagnosis for a PRIMES condition (eg, acute asthma and pneumonia), we chose the PRIMES condition with the lowest total enrollments overall. If the final discharge diagnosis was not a PRIMES condition, the case was excluded from further analysis. Patients with immunodeficiency, cystic fibrosis, a history of prematurity <32 weeks, chronic neuromuscular disease, cardiovascular disease, pulmonary diseases (other than asthma), and moderate to severe developmental delay were also excluded. Children admitted to intensive care were eligible only if they were transferred to an acute care ward <72 hours following admission. A survey was administered at the time of enrollment that collected information on SHS exposure, HRQOL, healthcare utilization, and demographics. All study procedures were reviewed and approved by the institutional review boards at each of the participating hospitals.
SECONDHAND SMOKE EXPOSURE
To ascertain SHS exposure, we asked caregivers, “How many persons living in the child’s home smoke?” Responses were dichotomized into non-SHS exposed (0 smokers) and SHS exposed (≥1 smokers). Children with missing data on home SHS exposure were excluded.
Health-Related Quality of Life Outcomes
We estimated HRQOL using the Pediatric Quality of Life (PedsQLTM) 4.0 Generic Core and Infant Scales. The PedsQL instruments are validated, population HRQOL measures that evaluate the physical, mental, emotional, and social functioning of children two to 18 years old based on self- or caregiver-proxy report.12-15 These instruments have also shown responsiveness as well as construct and predictive validity in hospitalized children.11 For this study, we focused on the PedsQL physical functioning subscale, which assesses for problems with physical activities (eg, sports activity or exercise, low energy, and hurts or aches) on a five-point Likert scale (never to almost always a problem). Scores range from 0 to 100 with higher scores indicating a better HRQOL. The reported minimal clinically important difference (MCID), defined as the smallest difference in which individuals would perceive a benefit or would necessitate a change in management, for this scale is 4.5 points.16,17
Children >8 years old were invited to complete the self-report version of the PedsQL. For children <8 years old, and for older children who were unable to complete them, surveys were completed by a parent or legal guardian. Respondents were asked to assess perceptions of their (or their child’s) HRQOL during periods of baseline health (the child’s usual state of health in the month preceding the current illness) and during the acute illness (the child’s state of health at the time of admission) as SHS exposure may influence perceptions of general health and/or contribute to worse outcomes during periods of acute illness.
Covariates collected at the time of enrollment included sociodemographics (child age, gender, race/ethnicity, and caregiver education), and healthcare utilization (caregiver-reported patient visits to a healthcare provider in the preceding six months). Insurance status and level of medical complexity (using the Pediatric Medical Complexity Algorithm)18 were obtained using the Pediatric Hospital Information System database, an administrative database containing clinical and resource utilization data from >45 children’s hospitals in the United States including all of the PRIMES study hospitals.13
Analysis
Descriptive statistics included frequency (%) and mean (standard deviation). Bivariate comparisons according to SHS exposure status were analyzed using chi-squared tests for categorical variables and analysis of variance for continuous variables. Multivariable linear mixed regression models were used to examine associations between home SHS exposure and HRQOL for baseline health and during admission, overall and stratified by diagnosis. Covariates in each model included age, sex, race/ethnicity, caregiver education, and healthcare visits in the preceding six months. We also included a hospital random effect to account for clustering of patients within hospitals and used robust standard errors for inference.
In a secondary analysis to explore potential dose-response effects of SHS exposure, we examined associations between an ordinal exposure variable (0 smokers, 1 smoker, ≥2 smokers) and HRQOL for baseline health and during admission for the acute illness. Because of sample size limitations, diagnosis-specific analyses examining dose-response effects were not conducted.
RESULTS
Study Population
Of the 2,334 children enrolled in the PRIMES study, 25 (1%) respondents did not report on home SHS exposure and were excluded, yielding a final study population of 2,309 children, of whom 728 (32%) had reported home SHS exposure. The study population included 664 children with asthma (mean age seven years [3.5]; 38% with home SHS exposure), 740 with bronchiolitis (mean age 0.7 years [0.5]; 32% with home SHS exposure), 342 with croup (mean age 1.7 [1.1]; 25% with home SHS exposure), and 563 with pneumonia (mean age 4.4 [3.8]; 27% with home SHS exposure; Table 1). Compared with non-SHS-exposed children, those with home SHS exposure tend to be slightly older (3.9 vs 3.4 years, P = .01), more likely to be non-Hispanic Black (29% vs 19%, P < .001), to have a chronic condition (52% vs 41%, P < .001), to come from a household where caregiver(s) did not graduate from college (45% vs 29%, P < .001), and to have public insurance (73% vs 49%, P < .001).
Home SHS Exposure and Health-related Quality of Life
The overall mean HRQOL score for baseline health was 83 (15), with a range across diagnoses of 82 to 87. Compared with non-SHS-exposed children, children with home SHS exposure had a lower mean HRQOL score for baseline health (adjusted mean difference –3.04 [95% CI -4.34, –1.74]). In analyses stratified by diagnosis, baseline health scores were lower for SHS-exposed children for all four conditions, but differences were statistically significant only for bronchiolitis (adjusted mean difference –2.94 [–5.0, –0.89]) and pneumonia (adjusted mean value –4.13 [–6.82, –1.44]; Table 2); none of these differences met the MCID threshold.
The overall mean HRQOL score at the time of admission was 56 (23), with a range across diagnoses of 49 to 61, with lower scores noted among SHS-exposed children compared with non-SHS-exposed children (adjusted mean difference –2.16 [–4.22, –0.10]). Similar to scores representing baseline health, admission scores were lower across all four conditions for SHS-exposed children. Only children with croup, however, had significantly lower admission scores that also met the MCID threshold (adjusted mean difference –5.71 [–10.67, –0.75]; Table 2).
To assess for potential dose-response effects of SHS exposure on HRQOL, we stratified SHS-exposed children into those with one smoker in the home (n = 513) and those with ≥2 smokers in the home (n = 215). Compared with non-SHS-exposed children, both HRQOL scores (baseline health and admission) were lower for SHS-exposed children. Consistent with a dose-response association, scores were lowest for children with ≥2 smokers in the home, both at baseline health (adjusted mean difference –3.92 [–6.03, –1.81]) and on admission (adjusted mean difference –3.67 [–6.98, –0.36]; Table 3).
DISCUSSION
Within a multicenter cohort of 2,309 children hospitalized with ARI, we noted significantly lower HRQOL scores among children exposed to SHS in the home as compared with nonexposed children. Differences were greatest for children living with ≥2 smokers in the home. In analyses stratified by diagnosis, differences in baseline health HRQOL scores were greatest for children with bronchiolitis and pneumonia. Differences in acute illness scores were greatest for children with croup.16
Our study provides evidence for acute and chronic impacts of SHS on HRQOL in children hospitalized with ARI. Although several studies have linked SHS exposure to reduced HRQOL in adults,19,20 few similar studies have been conducted in children. Nonetheless, a wealth of studies have documented the negative impact of SHS exposure on clinical outcomes among children with ARI.8,10,21-23 Our findings that home SHS exposure was associated with reduced HRQOL among our cohort of children with ARI are therefore consistent with related findings in adults and children. The observation that the effects of SHS exposure on HRQOL were greatest among children living with ≥2 smokers provides further evidence of a potential causal link between regular SHS exposure and HRQOL.
Although the magnitude and significance of associations between SHS exposure and HRQOL varied for each of the four diagnoses for baseline health and the acute illness, it is important to note that the point estimates for the adjusted mean differences were uniformly lower for the SHS-exposed children in each subgroup. Even so, only acute illness scores for croup exceeded the MCID threshold.16 Croup is the only included condition of the upper airway and is characterized by laryngotracheal inflammation leading to the typical cough and, in moderate to severe cases, stridor. Given that chronic SHS exposure induces a proinflammatory state,3 it is possible that SHS-exposed children with croup had more severe illness compared with nonexposed children with croup resulting in lower HRQOL scores on admission. Further, perceived differences in illness severity and HRQOL may be more readily apparent in children with croup (eg, stridor at rest vs intermittent or no stridor) as compared with children with lower respiratory tract diseases.
Of the four included diagnoses, the link between SHS exposure and asthma outcomes has been most studied. Prior work has demonstrated more frequent and severe acute exacerbations, as well as worse long-term lung function among SHS-exposed children as compared with nonexposed children.22-24 It was, therefore, surprising that our study failed to demonstrate associations between SHS exposure and HRQOL among children with asthma. Reasons for this finding are unclear. One hypothesis is that caregivers of SHS-exposed children with asthma may be more aware of the impacts of SHS exposure on respiratory health (through prior education) and, thus, more likely to modify their smoking behaviors, or for their children to be on daily asthma controller therapy. Alternatively, caregivers of children with asthma may be more likely to underreport home SHS exposure. Thirty-eight percent of children with asthma, however, were classified as SHS-exposed. This percentage was greater than the other three conditions studied (25%-32%), suggesting that differential bias in underreporting was minimal. Given that children with asthma were older, on average, than children with the other three conditions, it may also be that these children spent more time in smoke-free environments (eg, school).
Nearly one-third of children in our study were exposed to SHS in the home. This is similar to the prevalence of exposure in other studies conducted among hospitalized children8,10,21,25 but higher than the national prevalence of home SHS exposure among children in the United States.26 Thus, hospitalized children represent a particularly vulnerable population and an important target for interventions aiming to reduce exposure to SHS. Although longitudinal interventions are likely necessary to affect long-term success, hospitalization for ARI may serve as a powerful teachable moment to begin cessation efforts. Hospitalization also offers time beyond a typical primary care outpatient encounter to focus on cessation counseling and may be the only opportunity to engage in counseling activities for some families with limited time or access. Further, prior studies have demonstrated both the feasibility and the effectiveness of smoking cessation interventions in hospitalized children.27-30 Unfortunately, however, SHS exposure is often not documented at the time of hospitalization, and many opportunities to intervene are missed.25,31 Thus, there is a need for improved strategies to reliably identify and intervene on SHS-exposed children in the hospital setting.
These findings should be considered in the context of several limitations. The observational nature of our study raises the potential for confounding, specifically with regard to socioeconomic status, as this is associated with both SHS exposure and lower HRQOL. Our modeling approach attempted to control for several factors associated with socioeconomic status, including caregiver education and insurance coverage, but there is potential for residual confounding. No single question is sufficient to fully assess SHS exposure as the intensity of home SHS exposure likely varies widely, and some children may be exposed to SHS outside of the home environment.32 The home, however, is often the most likely source of regular SHS exposure,33,34 especially among young children (our cohort’s mean age was 3.6 years). Misclassification of SHS exposure is also possible due to underreporting of smoking.35,36 As a result, some children regularly exposed to SHS may have been misclassified as nonexposed, and the observed associations between SHS exposure and HRQOL may be underestimated. Confirming our study’s findings using objective assessments of SHS exposure, such as cotinine, are warranted. Given the young age of our cohort, the PedsQL surveys were completed by the parent or legal guardian only in >90% of the enrolled subjects, and caregiver perceptions may not accurately reflect the child’s perceptions. Prior work, however, has demonstrated the validity of parent-proxy reporting of the PedsQL, including correlation with child self-report.37 In our study, correlation between child and caregiver reporting (when available) was also very good (r = 0.72, 95% CI 0.64, 0.77). It is also possible that the timing of the HRQOL assessments (on admission) may have biased perceptions of baseline HRQOL, although we anticipate any bias would likely be nondifferential between SHS-exposed and nonexposed children and across diagnoses.
Nearly one-third of children in our study were exposed to SHS exposure in the home, and SHS exposure was associated with lower HRQOL for baseline health and during acute illness, providing further evidence of the dangers of SHS. Much work is needed in order to eliminate the impact of SHS on child health and families of children hospitalized for respiratory illness should be considered a priority population for smoking cessation efforts.
Acknowledgment
The authors wish to acknowledge the efforts of PRIS-PRIMES study team. The authors also wish to thank the children and families who consented to be a part of the PRIMES study.
Disclosures
The authors have no conflicts of interest relevant to this article to disclose.
Funding
This study was supported by NIH-NHLBI 1R01HL121067 to RMS.
1. Witt WP, Weiss AJ, Elixhauser A. Overview of Hospital Stays for Children in the United States, 2012: Statistical Brief #187. Healthcare Cost and Utilization Project (HCUP) Statistical Briefs. Rockville (MD)2006. PubMed
2. Burke H, Leonardi-Bee J, Hashim A, et al. Prenatal and passive smoke exposure and incidence of asthma and wheeze: systematic review and meta-analysis. Pediatrics. 2012;129(4):735-744. PubMed
3. Jinot J, Bayard S. Respiratory health effects of exposure to environmental tobacco smoke. Rev Environ Health. 1996;11(3):89-100. PubMed
4. Wilson KM, Wesgate SC, Pier J, et al. Secondhand smoke exposure and serum cytokine levels in healthy children. Cytokine. 2012;60(1):34-37. PubMed
5. Feleszko W, Zawadzka-Krajewska A, Matysiak K, et al. Parental tobacco smoking is associated with augmented IL-13 secretion in children with allergic asthma. J Allergy Clin Immunol. 2006;117(1):97-102. PubMed
6. Cook DG, Strachan DP. Health effects of passive smoking-10: Summary of effects of parental smoking on the respiratory health of children and implications for research. Thorax. 1999;54(4):357-366. PubMed
7. Merianos AL, Dixon CA, Mahabee-Gittens EM. Secondhand smoke exposure, illness severity, and resource utilization in pediatric emergency department patients with respiratory illnesses. J Asthma. 2017;54(8):798-806. PubMed
8. Ahn A, Edwards KM, Grijalva CG, et al. Secondhand Smoke Exposure and Illness Severity among Children Hospitalized with Pneumonia. J Pediatr. 2015;167(4):869-874 e861. PubMed
9. Cheraghi M, Salvi S. Environmental tobacco smoke (ETS) and respiratory health in children. Eur J Pediatr. 2009;168(8):897-905. PubMed
10. Bradley JP, Bacharier LB, Bonfiglio J, et al. Severity of respiratory syncytial virus bronchiolitis is affected by cigarette smoke exposure and atopy. Pediatrics. 2005;115(1):e7-e14. PubMed
11. Desai AD, Zhou C, Stanford S, Haaland W, Varni JW, Mangione-Smith RM. Validity and responsiveness of the pediatric quality of life inventory (PedsQL) 4.0 generic core scales in the pediatric inpatient setting. JAMA Pediatr. 2014;168(12):1114-1121. PubMed
12. Varni JW, Seid M, Kurtin PS. PedsQL 4.0: reliability and validity of the Pediatric Quality of Life Inventory version 4.0 generic core scales in healthy and patient populations. Med Care. 2001;39(8):800-812. PubMed
13. Varni JW, Limbers CA, Neighbors K, et al. The PedsQL Infant Scales: feasibility, internal consistency reliability, and validity in healthy and ill infants. Qual Life Res. 2011;20(1):45-55.
14. Hullmann SE, Ryan JL, Ramsey RR, Chaney JM, Mullins LL. Measures of general pediatric quality of life: Child Health Questionnaire (CHQ), DISABKIDS Chronic Generic Measure (DCGM), KINDL-R, Pediatric Quality of Life Inventory (PedsQL) 4.0 Generic Core Scales, and Quality of My Life Questionnaire (QoML). Arthritis Care Res (Hoboken). 2011;63(11):S420-S430. PubMed
15. Varni JW, Seid M, Rode CA. The PedsQL: measurement model for the pediatric quality of life inventory. Med Care. 1999;37(2):126-139. PubMed
16. Varni JW, Burwinkle TM, Seid M, Skarr D. The PedsQL 4.0 as a pediatric population health measure: feasibility, reliability, and validity. Ambul Pediatr. 2003;3(6):329-341. PubMed
17. Varni JW, Burwinkle TM, Seid M. The PedsQL 4.0 as a school population health measure: feasibility, reliability, and validity. Qual Life Res. 2006;15(2):203-215. PubMed
18. Simon TD, Cawthon ML, Stanford S, et al. Pediatric medical complexity algorithm: a new method to stratify children by medical complexity. Pediatrics. 2014;133(6):e1647-e1654. PubMed
19. Chen J, Wang MP, Wang X, Viswanath K, Lam TH, Chan SS. Secondhand smoke exposure (SHS) and health-related quality of life (HRQoL) in Chinese never smokers in Hong Kong. BMJ Open. 2015;5(9):e007694. PubMed
20. Bridevaux PO, Cornuz J, Gaspoz JM, et al. Secondhand smoke and health-related quality of life in never smokers: results from the SAPALDIA cohort study 2. Arch Intern Med. 2007;167(22):2516-2523. PubMed
21. Wilson KM, Pier JC, Wesgate SC, Cohen JM, Blumkin AK. Secondhand tobacco smoke exposure and severity of influenza in hospitalized children. J Pediatr. 2013;162(1):16-21. PubMed
22. LeSon S, Gershwin ME. Risk factors for asthmatic patients requiring intubation. I. Observations in children. J Asthma. 1995;32(4):285-294. PubMed
23. Chilmonczyk BA, Salmun LM, Megathlin KN, et al. Association between exposure to environmental tobacco smoke and exacerbations of asthma in children. N Engl J Med. 1993;328(23):1665-1669. PubMed
24. Evans D, Levison MJ, Feldman CH, et al. The impact of passive smoking on emergency room visits of urban children with asthma. Am Rev Respir Dis. 1987;135(3):567-572. PubMed
25. Wilson KM, Wesgate SC, Best D, Blumkin AK, Klein JD. Admission screening for secondhand tobacco smoke exposure. Hosp Pediatr. 2012;2(1):26-33. PubMed
26. Marano C, Schober SE, Brody DJ, Zhang C. Secondhand tobacco smoke exposure among children and adolescents: United States, 2003-2006. Pediatrics. 2009;124(5):1299-1305. PubMed
27. Ralston S, Roohi M. A randomized, controlled trial of smoking cessation counseling provided during child hospitalization for respiratory illness. Pediatr Pulmonol. 2008;43(6):561-566. PubMed
28. Winickoff JP, Hillis VJ, Palfrey JS, Perrin JM, Rigotti NA. A smoking cessation intervention for parents of children who are hospitalized for respiratory illness: the stop tobacco outreach program. Pediatrics. 2003;111(1):140-145. PubMed
29. Torok MR, Lowary M, Ziniel SI, et al. Perceptions of parental tobacco dependence treatment among a children’s hospital staff. Hosp Pediatr. 2018;8(11):724-728. PubMed
30. Jenssen BP, Shelov ED, Bonafide CP, Bernstein SL, Fiks AG, Bryant-Stephens T. Clinical decision support tool for parental tobacco treatment in hospitalized children. Appl Clin Inform. 2016;7(2):399-411. PubMed
31. Lustre BL, Dixon CA, Merianos AL, Gordon JS, Zhang B, Mahabee-Gittens EM. Assessment of tobacco smoke exposure in the pediatric emergency department. Prev Med. 2016;85:42-46. PubMed
32. Groner JA, Rule AM, McGrath-Morrow SA, et al. Assessing pediatric tobacco exposure using parent report: comparison with hair nicotine. J Expo Sci Environ Epidemiol. 2018;28(6):530-537. PubMed
33. Gergen PJ. Environmental tobacco smoke as a risk factor for respiratory disease in children. Respir Physiol. 2001;128(1):39-46. PubMed
34. Klepeis NE, Nelson WC, Ott WR, et al. The National Human Activity Pattern Survey (NHAPS): a resource for assessing exposure to environmental pollutants. J Expo Anal Environ Epidemiol. 2001;11(3):231-252. PubMed
35. Couluris M, Schnapf BM, Casey A, Xu P, Gross-King M, Krischer J. How to measure secondhand smoke exposure in a pediatric clinic setting. Arch Pediatr Adolesc Med. 2011;165(7):670-671. PubMed
36. Boyaci H, Etiler N, Duman C, Basyigit I, Pala A. Environmental tobacco smoke exposure in school children: parent report and urine cotinine measures. Pediatr Int. 2006;48(4):382-389. PubMed
37. Varni JW, Limbers CA, Burwinkle TM. Parent proxy-report of their children’s health-related quality of life: an analysis of 13,878 parents’ reliability and validity across age subgroups using the PedsQL 4.0 Generic Core Scales. Health Qual Life Outcomes. 2007;5(1):2. PubMed
© 2019 Society of Hospital Medicine