User login
Methodologic Progress Note: A Clinician’s Guide to Logistic Regression
The ability to read and correctly interpret research is an essential skill, but most hospitalists—and physicians in general—do not receive formal training in biostatistics during their medical education.1-3 In addition to straightforward statistical tests that compare a single exposure and outcome, researchers commonly use statistical models to identify and quantify complex relationships among many exposures (eg, demographics, clinical characteristics, interventions, or other variables) and an outcome. Understanding statistical models can be challenging. Still, it is important to recognize the advantages and limitations of statistical models, how to interpret their results, and the potential implications of findings on current clinical practice.
In the article “Rates and Characteristics of Medical Malpractice Claims Against Hospitalists” published in the July 2021 issue of the Journal of Hospital Medicine, Schaffer et al4 used the Comparative Benchmarking System database, which is maintained by a malpractice insurer, to characterize malpractice claims against hospitalists. The authors used multiple logistic regression models to understand the relationship among clinical factors and indemnity payments. In this Progress Note, we describe situations in which logistic regression is the proper statistical method to analyze a data set, explain results from logistic regression analyses, and equip readers with skills to critically appraise conclusions drawn from these models.
Choosing an Appropriate Statistical Model
Statistical models often are used to describe the relationship among one or more exposure variables (ie, independent variables) and an outcome (ie, dependent variable). These models allow researchers to evaluate the effects of multiple exposure variables simultaneously, which in turn allows them to “isolate” the effect of each variable; in other words, models facilitate an understanding of the relationship between each exposure variable and the outcome, adjusted for (ie, independent of) the other exposure variables in the model.
Several statistical models can be used to quantify relationships within the data, but each type of model has certain assumptions that must be satisfied. Two important assumptions include characteristics of the outcome (eg, the type and distribution) and the nature of the relationships among the outcome and independent variables (eg, linear vs nonlinear). Simple linear regression, one of the most basic statistical models used in research,5 assumes that (a) the outcome is continuous (ie, any numeric value is possible) and normally distributed (ie, its histogram is a bell-shaped curve) and (b) the relationship between the independent variable and the outcome is linear (ie, follows a straight line). If an investigator wanted to understand how weight is related to height, a simple linear regression could be used to develop a mathematical equation that tells us how the outcome (weight) generally increases as the independent variable (height) increases.
Often, the outcome in a study is not a continuous variable but a simple success/failure variable (ie, dichotomous variable that can be one of two possible values). Schaffer et al4 examined the binary outcome of whether a malpractice claim case would end in an indemnity payment or no payment. Linear regression models are not equipped to handle dichotomous outcomes. Instead, we need to use a different statistical model: logistic regression. In logistic regression, the probability (p) of a defined outcome event is estimated by creating a regression model.
The Logistic Model
A probability (p) is a measure of how likely an event (eg, a malpractice claim ends in an indemnity payment or not) is to occur. It is always between 0 (ie, the event will definitely not occur) and 1 (ie, the event will definitely occur). A p of 0.5 means there is a 50/50 chance that the event will occur (ie, equivalent to a coin flip). Because p is a probability, we need to make sure it is always between 0 and 1. If we were to try to model p with a linear regression, the model would assume that p could extend beyond 0 and 1. What can we do?
Applying a transformation is a commonly used tool in statistics to make data work better within statistical models.6 In this case, we will transform the variable p. In logistic regression, we model the probability of experiencing the outcome through a transformation called a logit. The logit represents the natural logarithm (ln) of the ratio of the probability of experiencing the outcome (p) vs the probability of not experiencing the outcome (1 – p), with the ratio being the odds of the event occurring.

This transformation works well for dichotomous outcomes because the logit transformation approximates a straight line as long as p is not too large or too small (between 0.05 and 0.95).
If we are performing a logistic regression with only one independent variable (x) and want to understand the relationship between this variable (x) and the probability of an outcome event (p), then our model is the equation of a line. The equation for the base model of logistic regression with one independent variable (x) is

where β0 is the y-intercept and β1 is the slope of the line. Equation (2) is identical to the algebraic equation y = mx + b for a line, just rearranged slightly. In this algebraic equation, m is the slope (the same as β1) and b is the y-intercept (the same as β0). We will see that β0 and β1 are estimated (ie, assigned numeric values) from the data collected to help us understand how x and

are related and are the basis for estimating odds ratios.
We can build more complex models using multivariable logistic regression by adding more independent variables to the right side of equation (2). Essentially, this is what S
There are two notable techniques used frequently with multivariable logistic regression models. The first involves choosing which independent variables to include in the model. One way to select variables for multivariable models is defining them a priori, that is deciding which variables are clinically or conceptually associated with the outcome before looking at the data. With this approach, we can test specific hypotheses about the relationships between the independent variables and the outcome. Another common approach is to look at the data and identify the variables that vary significantly between the two outcome groups. Schaffer et al4 used an a priori approach to define variables in their multivariable model (ie, “variables for inclusion into the multivariable model were determined a priori”).
A second technique is the evaluation of collinearity, which helps us understand whether the i
Understanding the Results of the Logistic Model
Fitting the model is the process by which statistical software (eg, SAS, Stata, R, SPSS) estimates the relationships among independent variables in the model and the outcome within a specific dataset. In equation (2), this essentially means that the software will evaluate the data and provide us with the best estimates for β0 (the y-intercept) and β1 (the slope) that describe the relationship between the variable x and

Modeling can be iterative, and part of the process may include removing variables from the model that are not significantly associated with the outcome to create a simpler solution, a process known as model reduction. The results from models describe the independent association between a specific characteristic and the outcome, meaning that the relationship has been adjusted for all the other characteristics in the model.
The relationships among the independent variables and outcome are most often represented as an odds ratio (OR), which quantifies the strength of the association between two variables and is directly calculated from the β values in the model. As the name suggests, an OR is a ratio of odds. But what are odds? Simply, the odds of an outcome (such as mortality) is the probability of experiencing the event divided by the probability of not experiencing that event; in other words, it is the ratio:

The concept of odds is often unfamiliar, so it can be helpful to consider the definition in the context of games of chance. For example, in horse race betting, the outcome of interest is that a horse will lose a race. Imagine that the probability of a horse losing a race is 0.8 and the probability of winning is 0.2. The odds of losing are
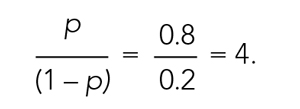
These odds usually are listed as 4-to-1, meaning that out of 5 races (ie, 4 + 1) the horse is expected to lose 4 times and win once. When odds are listed this way, we can easily calculate the associated probability by recognizing that the total number of expected races is the sum of two numbers (probability of losing: 4 races out of 5, or 0.80 vs probability of winning: 1 race out of 5, or 0.20).
In medical research, the OR typically represents the odds for one group of patients (A) compared with the odds for another group of patients (B) experiencing an outcome. If the odds of the outcome are the same for group A and group B, then OR = 1.0, meaning that the probability of the outcome is the same between the two groups. If the patients in group A have greater odds of experiencing the outcome compared with group B patients (and a greater probability of the outcome), then the OR will be >1. If the opposite is true, then the OR will be <1.
Schaffer et al4 estimated that the OR of an indemnity payment in malpractice cases involving errors in clinical judgment as a contributing factor was 5.01 (95% CI, 3.37-7.45). This means that malpractice cases involving errors in clinical judgement had a 5.01 times greater odds of indemnity payment compared with those without these errors after adjusting for all other variables in the model (eg, age, severity). Note that the 95% CI does not include 1.0. This indicates that the OR is statistically >1, and we can conclude that there is a significant relationship between errors in clinical judgment and payment that is unlikely to be attributed to chance alone.
In logistic regression for categorical independent variables, all categories are compared with a reference group within that variable, with the reference group serving as the denominator of the OR. The authors4 did not incorporate continuous independent variables in their multivariable logistic regression model. However, if the authors examined length of hospitalization as a contributing factor in indemnity payments, for example, the OR would represent a 1-unit increase in this variable (eg, 1-day increase in length of stay).
Conclusion
Logistic regression describes the relationships in data and is an important statistical model across many types of research. This Progress Note emphasizes the importance of weighing the advantages and limitations of logistic regression, provides a common approach to data transformation, and guides the correct interpretation of logistic regression model results.
1. Windish DM, Huot SJ, Green ML. Medicine residents’ understanding of the biostatistics and results in the medical literature. JAMA. 2007;298(9):1010. https://doi.org/10.1001/jama.298.9.1010
2. MacDougall M, Cameron HS, Maxwell SRJ. Medical graduate views on statistical learning needs for clinical practice: a comprehensive survey. BMC Med Educ. 2019;20(1):1. https://doi.org/10.1186/s12909-019-1842-1
3. Montori VM. Progress in evidence-based medicine. JAMA. 2008;300(15):1814-1816. https://doi.org/10.1001/jama.300.15.1814
4. Schaffer AC, Yu-Moe CW, Babayan A, Wachter RM, Einbinder JS. Rates and characteristics of medical malpractice claims against hospitalists. J Hosp Med. 2021;16(7):390-396. https://doi.org/10.12788/jhm.3557
5. Lane DM, Scott D, Hebl M, Guerra R, Osherson D, Zimmer H. Introducton to Statistics. Accessed April 13, 2021. https://onlinestatbook.com/Online_Statistics_Education.pdf
6. Marill KA. Advanced statistics: linear regression, part II: multiple linear regression. Acad Emerg Med Off J Soc Acad Emerg Med. 2004;11(1):94-102. https://doi.org/10.1197/j.aem.2003.09.006
The ability to read and correctly interpret research is an essential skill, but most hospitalists—and physicians in general—do not receive formal training in biostatistics during their medical education.1-3 In addition to straightforward statistical tests that compare a single exposure and outcome, researchers commonly use statistical models to identify and quantify complex relationships among many exposures (eg, demographics, clinical characteristics, interventions, or other variables) and an outcome. Understanding statistical models can be challenging. Still, it is important to recognize the advantages and limitations of statistical models, how to interpret their results, and the potential implications of findings on current clinical practice.
In the article “Rates and Characteristics of Medical Malpractice Claims Against Hospitalists” published in the July 2021 issue of the Journal of Hospital Medicine, Schaffer et al4 used the Comparative Benchmarking System database, which is maintained by a malpractice insurer, to characterize malpractice claims against hospitalists. The authors used multiple logistic regression models to understand the relationship among clinical factors and indemnity payments. In this Progress Note, we describe situations in which logistic regression is the proper statistical method to analyze a data set, explain results from logistic regression analyses, and equip readers with skills to critically appraise conclusions drawn from these models.
Choosing an Appropriate Statistical Model
Statistical models often are used to describe the relationship among one or more exposure variables (ie, independent variables) and an outcome (ie, dependent variable). These models allow researchers to evaluate the effects of multiple exposure variables simultaneously, which in turn allows them to “isolate” the effect of each variable; in other words, models facilitate an understanding of the relationship between each exposure variable and the outcome, adjusted for (ie, independent of) the other exposure variables in the model.
Several statistical models can be used to quantify relationships within the data, but each type of model has certain assumptions that must be satisfied. Two important assumptions include characteristics of the outcome (eg, the type and distribution) and the nature of the relationships among the outcome and independent variables (eg, linear vs nonlinear). Simple linear regression, one of the most basic statistical models used in research,5 assumes that (a) the outcome is continuous (ie, any numeric value is possible) and normally distributed (ie, its histogram is a bell-shaped curve) and (b) the relationship between the independent variable and the outcome is linear (ie, follows a straight line). If an investigator wanted to understand how weight is related to height, a simple linear regression could be used to develop a mathematical equation that tells us how the outcome (weight) generally increases as the independent variable (height) increases.
Often, the outcome in a study is not a continuous variable but a simple success/failure variable (ie, dichotomous variable that can be one of two possible values). Schaffer et al4 examined the binary outcome of whether a malpractice claim case would end in an indemnity payment or no payment. Linear regression models are not equipped to handle dichotomous outcomes. Instead, we need to use a different statistical model: logistic regression. In logistic regression, the probability (p) of a defined outcome event is estimated by creating a regression model.
The Logistic Model
A probability (p) is a measure of how likely an event (eg, a malpractice claim ends in an indemnity payment or not) is to occur. It is always between 0 (ie, the event will definitely not occur) and 1 (ie, the event will definitely occur). A p of 0.5 means there is a 50/50 chance that the event will occur (ie, equivalent to a coin flip). Because p is a probability, we need to make sure it is always between 0 and 1. If we were to try to model p with a linear regression, the model would assume that p could extend beyond 0 and 1. What can we do?
Applying a transformation is a commonly used tool in statistics to make data work better within statistical models.6 In this case, we will transform the variable p. In logistic regression, we model the probability of experiencing the outcome through a transformation called a logit. The logit represents the natural logarithm (ln) of the ratio of the probability of experiencing the outcome (p) vs the probability of not experiencing the outcome (1 – p), with the ratio being the odds of the event occurring.
This transformation works well for dichotomous outcomes because the logit transformation approximates a straight line as long as p is not too large or too small (between 0.05 and 0.95).
If we are performing a logistic regression with only one independent variable (x) and want to understand the relationship between this variable (x) and the probability of an outcome event (p), then our model is the equation of a line. The equation for the base model of logistic regression with one independent variable (x) is
where β0 is the y-intercept and β1 is the slope of the line. Equation (2) is identical to the algebraic equation y = mx + b for a line, just rearranged slightly. In this algebraic equation, m is the slope (the same as β1) and b is the y-intercept (the same as β0). We will see that β0 and β1 are estimated (ie, assigned numeric values) from the data collected to help us understand how x and
are related and are the basis for estimating odds ratios.
We can build more complex models using multivariable logistic regression by adding more independent variables to the right side of equation (2). Essentially, this is what S
There are two notable techniques used frequently with multivariable logistic regression models. The first involves choosing which independent variables to include in the model. One way to select variables for multivariable models is defining them a priori, that is deciding which variables are clinically or conceptually associated with the outcome before looking at the data. With this approach, we can test specific hypotheses about the relationships between the independent variables and the outcome. Another common approach is to look at the data and identify the variables that vary significantly between the two outcome groups. Schaffer et al4 used an a priori approach to define variables in their multivariable model (ie, “variables for inclusion into the multivariable model were determined a priori”).
A second technique is the evaluation of collinearity, which helps us understand whether the i
Understanding the Results of the Logistic Model
Fitting the model is the process by which statistical software (eg, SAS, Stata, R, SPSS) estimates the relationships among independent variables in the model and the outcome within a specific dataset. In equation (2), this essentially means that the software will evaluate the data and provide us with the best estimates for β0 (the y-intercept) and β1 (the slope) that describe the relationship between the variable x and
Modeling can be iterative, and part of the process may include removing variables from the model that are not significantly associated with the outcome to create a simpler solution, a process known as model reduction. The results from models describe the independent association between a specific characteristic and the outcome, meaning that the relationship has been adjusted for all the other characteristics in the model.
The relationships among the independent variables and outcome are most often represented as an odds ratio (OR), which quantifies the strength of the association between two variables and is directly calculated from the β values in the model. As the name suggests, an OR is a ratio of odds. But what are odds? Simply, the odds of an outcome (such as mortality) is the probability of experiencing the event divided by the probability of not experiencing that event; in other words, it is the ratio:
The concept of odds is often unfamiliar, so it can be helpful to consider the definition in the context of games of chance. For example, in horse race betting, the outcome of interest is that a horse will lose a race. Imagine that the probability of a horse losing a race is 0.8 and the probability of winning is 0.2. The odds of losing are
These odds usually are listed as 4-to-1, meaning that out of 5 races (ie, 4 + 1) the horse is expected to lose 4 times and win once. When odds are listed this way, we can easily calculate the associated probability by recognizing that the total number of expected races is the sum of two numbers (probability of losing: 4 races out of 5, or 0.80 vs probability of winning: 1 race out of 5, or 0.20).
In medical research, the OR typically represents the odds for one group of patients (A) compared with the odds for another group of patients (B) experiencing an outcome. If the odds of the outcome are the same for group A and group B, then OR = 1.0, meaning that the probability of the outcome is the same between the two groups. If the patients in group A have greater odds of experiencing the outcome compared with group B patients (and a greater probability of the outcome), then the OR will be >1. If the opposite is true, then the OR will be <1.
Schaffer et al4 estimated that the OR of an indemnity payment in malpractice cases involving errors in clinical judgment as a contributing factor was 5.01 (95% CI, 3.37-7.45). This means that malpractice cases involving errors in clinical judgement had a 5.01 times greater odds of indemnity payment compared with those without these errors after adjusting for all other variables in the model (eg, age, severity). Note that the 95% CI does not include 1.0. This indicates that the OR is statistically >1, and we can conclude that there is a significant relationship between errors in clinical judgment and payment that is unlikely to be attributed to chance alone.
In logistic regression for categorical independent variables, all categories are compared with a reference group within that variable, with the reference group serving as the denominator of the OR. The authors4 did not incorporate continuous independent variables in their multivariable logistic regression model. However, if the authors examined length of hospitalization as a contributing factor in indemnity payments, for example, the OR would represent a 1-unit increase in this variable (eg, 1-day increase in length of stay).
Conclusion
Logistic regression describes the relationships in data and is an important statistical model across many types of research. This Progress Note emphasizes the importance of weighing the advantages and limitations of logistic regression, provides a common approach to data transformation, and guides the correct interpretation of logistic regression model results.
1. Windish DM, Huot SJ, Green ML. Medicine residents’ understanding of the biostatistics and results in the medical literature. JAMA. 2007;298(9):1010. https://doi.org/10.1001/jama.298.9.1010
2. MacDougall M, Cameron HS, Maxwell SRJ. Medical graduate views on statistical learning needs for clinical practice: a comprehensive survey. BMC Med Educ. 2019;20(1):1. https://doi.org/10.1186/s12909-019-1842-1
3. Montori VM. Progress in evidence-based medicine. JAMA. 2008;300(15):1814-1816. https://doi.org/10.1001/jama.300.15.1814
4. Schaffer AC, Yu-Moe CW, Babayan A, Wachter RM, Einbinder JS. Rates and characteristics of medical malpractice claims against hospitalists. J Hosp Med. 2021;16(7):390-396. https://doi.org/10.12788/jhm.3557
5. Lane DM, Scott D, Hebl M, Guerra R, Osherson D, Zimmer H. Introducton to Statistics. Accessed April 13, 2021. https://onlinestatbook.com/Online_Statistics_Education.pdf
6. Marill KA. Advanced statistics: linear regression, part II: multiple linear regression. Acad Emerg Med Off J Soc Acad Emerg Med. 2004;11(1):94-102. https://doi.org/10.1197/j.aem.2003.09.006
© 2021 Society of Hospital Medicine
Factors Associated With COVID-19 Disease Severity in US Children and Adolescents
The COVID-19 pandemic has led to more than 40 million infections and more than 650,000 deaths in the United States alone.1 Morbidity and mortality have disproportionately affected older adults.2-4 However, acute infection and delayed effects, such as multisystem inflammatory syndrome in children (MIS-C), occur and can lead to severe complications, hospitalization, and death in pediatric patients.5,6 Due to higher clinical disease prevalence and morbidity in the adult population, we have learned much about the clinical factors associated with severe adult COVID-19 disease.5,7-9 Such clinical factors include older age, concurrent comorbidities, smoke exposure, and Black race or Hispanic ethnicity, among others.5,7-10 However, there is a paucity of data on severe COVID-19 disease in pediatric patients.5,11,12 In addition, most immunization strategies and pharmacologic treatments for COVID-19 have not been evaluated or approved for use in children.13 To guide targeted prevention and treatment strategies, there is a critical need to identify children and adolescents—who are among the most vulnerable patient populations—at high risk for severe disease.
Identifying the clinical factors associated with severe COVID-19 disease will help with prioritizing and allocating vaccines when they are approved for use in patients younger than 12 years.
METHODS
Study Design
We conducted a multicenter retrospective cohort study of patients presenting for care at pediatric hospitals that report data to the Pediatric Health Information System (PHIS) database. The PHIS administrative database includes billing and utilization data from 45 US tertiary care hospitals affiliated with the Children’s Hospital Association (Lenexa, Kansas). Data quality and reliability are ensured through a joint validation effort between the Children’s Hospital Association and participating hospitals. Hospitals submit discharge data, including demographics, diagnoses, and procedures using International Classification of Diseases, 10th Revision (ICD-10) codes, along with daily detailed information on pharmacy, location of care, and other services.
Study Population
Patients 30 days to 18 years of age discharged from the emergency department (ED) or inpatient setting with a primary diagnosis of COVID-19 (ICD-10 codes U.071 and U.072) between April 1, 2020, and September 30, 2020, were eligible for inclusion.14 In a prior study, the positive predictive value of an ICD-10–coded diagnosis of COVID-19 among hospitalized pediatric patients was 95.5%, compared with reverse transcription polymerase reaction results or presence of MIS-C.15 The diagnostic code for COVID-19 (ICD-10-CM) also had a high sensitivity (98.0%) in the hospitalized population.16 Acknowledging the increasing practice of screening patients upon admission, and in an attempt to minimize potential misclassification, we did not include encounters with secondary diagnoses of COVID-19 in our primary analyses. Pediatric patients with surgical diagnoses and neonates who never left the hospital were also excluded.
Factors Associated With Severe COVID-19 Disease
Exposures of interest were determined a priori based on current evidence in the literature and included patient age (0-4 years, 5-11 years, and 12-18 years), sex, race and ethnicity (non-Hispanic White, non-Hispanic Black, Hispanic, Asian, other non-White race [defined as Pacific Islander, Native American, or other]), payor type, cardiovascular complex chronic conditions (CCC), neuromuscular CCC, obesity/type 2 diabetes mellitus (DM), pulmonary CCC, asthma (defined using ICD-10 codes17), and immunocompromised CCC
Pediatric Complications and Conditions Associated With COVID-19
Based on current evidence and expert opinion of study members, associated diagnoses and complications co-occurring with a COVID-19 diagnosis were defined a priori and identified through ICD-10 codes (Appendix Table 1). These included acute kidney injury, acute liver injury, aseptic meningitis, asthma exacerbation, bronchiolitis, cerebral infarction, croup, encephalitis, encephalopathy, infant fever, febrile seizure, gastroenteritis/dehydration, Kawasaki disease/MIS-C, myocarditis/pericarditis, pneumonia, lung effusion or empyema, respiratory failure, sepsis, nonfebrile seizure, pancreatitis, sickle cell complications, and thrombotic complications.
Outcomes
COVID-19 severity outcomes were assessed as follows: (1) mild = ED discharge; (2) moderate = inpatient admission; (3) severe = intensive care unit (ICU) admission without mechanical ventilation, shock, or death; and (4) very severe = ICU admission with mechanical ventilation, shock, or death.19 This ordinal ranking system did not violate the proportional odds assumption. Potential reasons for admission to the ICU without mechanical ventilation, shock, or death include, but are not limited to, need for noninvasive ventilation, vital sign instability, dysrhythmias, respiratory insufficiency, or complications arising from concurrent conditions (eg, thrombotic events, need for continuous albuterol therapy). We examined several secondary, hospital-based outcomes, including associated diagnoses and complications, all-cause 30-day healthcare reutilization (ED visit or rehospitalization), length of stay (LOS), and ICU LOS.
Statistical Analysis
Demographic characteristics were summarized using frequencies and percentages for categorical variables and geometric means with SD and medians with interquartile ranges (IQR) for continuous variables, as appropriate. Factors associated with hospitalization (encompassing severity levels 2-4) vs ED discharge (severity level 1) were assessed using logistic regression. Factors associated with increasing severity among hospitalized pediatric patients (severity levels 2, 3, and 4) were assessed using ordinal logistic regression. Covariates in these analyses included race and ethnicity, age, sex, payor, cardiovascular CCC, neurologic/neuromuscular CCC, obesity/type 2 DM, pulmonary CCC, asthma, and immunocompromised CCC. Adjusted odds ratios (aOR) and corresponding 95% CI for each risk factor were generated using generalized linear mixed effects models and random intercepts for each hospital. Given the potential for diagnostic misclassification of pediatric patients with COVID-19 based on primary vs secondary diagnoses, we performed sensitivity analyses defining the study population as those with a primary diagnosis of COVID-19 and those with a secondary diagnosis of COVID-19 plus a concurrent primary diagnosis of a condition associated with COVID-19 (Appendix Table 1).
All analyses were performed using SAS version 9.4 (SAS Institute, Inc), and P < .05 was considered statistically significant. The Institutional Review Board at Vanderbilt University Medical Center determined that this study of de-identified data did not meet the criteria for human subjects research.
RESULTS
Study Population
A total of 19,976 encounters were included in the study. Of those, 15,913 (79.7%) were discharged from the ED and 4063 (20.3%) were hospitalized (Table 1). The most common race/ethnicity was Hispanic (9741, 48.8%), followed by non-Hispanic White (4217, 21.1%). Reference race/ethnicity data for the overall 2019 PHIS population can be found in Appendix Table 2.

The severity distribution among the hospitalized population was moderate (3222, 79.3%), severe (431, 11.3%), and very severe (380, 9.4%). The frequency of COVID-19 diagnoses increased late in the study period (Figure). Among those hospitalized, the median LOS for the index admission was 2 days (IQR, 1-4), while among those admitted to the ICU, the median LOS was 3 days (IQR, 2-5).

Overall, 10.1% (n = 2020) of the study population had an all-cause repeat encounter (ie, subsequent ED encounter or hospitalization) within 30 days following the index discharge. Repeat encounters were more frequent among patients hospitalized than among those discharged from the ED (Appendix Table 3).
Prevalence of Conditions and Complications Associated With COVID-19
Overall, 3257 (16.3%) patients had one or more co-occurring diagnoses categorized as a COVID-19–associated condition or complication. The most frequent diagnoses included lower respiratory tract disease (pneumonia, lung effusion, or empyema; n = 1415, 7.1%), gastroenteritis/dehydration (n = 1068, 5.3%), respiratory failure (n = 731, 3.7%), febrile infant (n = 413, 2.1%), and nonfebrile seizure (n = 425, 2.1%). Aside from nonfebrile seizure, neurological complications were less frequent and included febrile seizure (n = 155, 0.8%), encephalopathy (n = 63, 0.3%), aseptic meningitis (n = 16, 0.1%), encephalitis (n = 11, 0.1%), and cerebral infarction (n = 6, <0.1%). Kawasaki disease and MIS-C comprised 1.7% (n = 346) of diagnoses. Thrombotic complications occurred in 0.1% (n = 13) of patients. Overall, these conditions and complications associated with COVID-19 were more frequent in hospitalized patients than in those discharged from the ED (P < .001) (Table 2).

Factors Associated With COVID-19 Disease Severity
Compared to pediatric patients with COVID-19 discharged from the ED, factors associated with increased odds of hospitalization included private payor insurance; obesity/type 2 DM; asthma; and cardiovascular, immunocompromised, neurologic/neuromuscular, and pulmonary CCCs (Table 3). Factors associated with decreased risk of hospitalization included Black race or Hispanic ethnicity compared with White race; female sex; and age 5 to 11 years and age 12 to 17 years (vs age 0-4 years). Among children and adolescents hospitalized with COVID-19, factors associated with greater disease severity included Black or other non-White race; age 5 to 11 years; age 12 to 17 years; obesity/type 2 DM; immunocompromised conditions; and cardiovascular, neurologic/neuromuscular, and pulmonary CCCs (Table 3).

Sensitivity Analysis
We performed a sensitivity analysis that expanded the study population to include those with a secondary diagnosis of COVID-19 plus a diagnosis of a COVID-19–associated condition or complication. Analyses using the expanded population (N = 21,247) were similar to the primary analyses (Appendix Table 4 and Appendix Table 5).
DISCUSSION
In this large multicenter study evaluating COVID-19 disease severity in more than 19,000 patients presenting for emergency care at US pediatric hospitals, approximately 20% were hospitalized, and among those hospitalized almost a quarter required ICU care. Clinical risk factors associated with increased risk of hospitalization include private payor status and selected comorbidities (obesity/type 2 DM; asthma; and cardiovascular, pulmonary, immunocompromised, neurologic/neuromuscular CCCs), while those associated with decreased risk of hospitalization include older age, female sex, and Black race or Hispanic ethnicity. Factors associated with severe disease among hospitalized pediatric patients include Black or other non-White race, school age (≥5 years), and certain chronic conditions (cardiovascular disease, obesity/type 2 DM, neurologic or neuromuscular disease). Sixteen percent of patients had a concurrent diagnosis for a condition or complication associated with COVID-19.
While the study population (ie, children and adolescents presenting to the ED) represents a small fraction of children and adolescents in the community with SARS-CoV-2 infection, the results provide important insight into factors of severe COVID-19 in the pediatric population. A report from France suggested ventilatory or hemodynamic support or death were independently associated with older age (≥10 years), elevated C-reactive protein, and hypoxemia.12 An Italian study found that younger age (0-4 years) was associated with less severe disease, while preexisting conditions were more likely in patients with severe disease.11 A single-center case series of 50 patients (aged ≤21 years) hospitalized at a children’s hospital in New York City found respiratory failure (n = 9) was more common in children older than 1 year, patients with elevated inflammatory markers, and patients with obesity.20
Our study confirms several factors for severe COVID-19 found in these studies, including older age,11,12,20 obesity,20 and preexisting conditions.11 Our findings also expand on these reports, including identification of factors associated with hospitalization. Given the rate of 30-day re-encounters among pediatric patients with COVID-19 (10.1%), identifying risk factors for hospitalization may aid ED providers in determining optimal disposition (eg, home, hospital admission, ICU). We also identified specific comorbidities associated with more severe disease in those hospitalized with COVID-19, such as cardiovascular disease, obesity/type 2 DM, and pulmonary, neurologic, or neuromuscular conditions. We also found that asthma increased the risk for hospitalization but not more severe disease among those hospitalized. This latter finding also aligns with recent single-center studies,21,22 whereas a Turkish study of pediatric patients aged 0 to 18 years found no association between asthma and COVID-19 hospitalizations.23We also examined payor type and racial/ethnic factors in our analysis. In 2019, patients who identified as Black or Hispanic comprised 52.3% of all encounters and 40.7% of hospitalizations recorded in the PHIS database. During the same year, encounters for influenza among Black or Hispanic pediatric patients comprised 58.7% of all influenza diagnoses and 47.0% of pediatric influenza hospitalizations (Appendix Table 2). In this study, patients who identified as Black or Hispanic race represented a disproportionately large share of patients presenting to children’s hospitals (68.5%) and of those hospitalized (60.8%). Hispanic ethnicity, in particular, represented a disproportionate share of patients seeking care for COVID-19 compared to the overall PHIS population (47.7% and 27.1%, respectively). After accounting for other factors, we found Black and other non-White race—but not of Hispanic ethnicity—were independently associated with more disease severity among those hospitalized. This contrasts with findings from a recent adult study by Yehia et al,24 who found (after adjusting for other clinical factors) no significant difference in mortality between Black patients and White patients among adults hospitalized due to COVID-19. It also contrasts with a recent large population-based UK study wherein pediatric patients identifying as Asian, but not Black or mixed race or ethnicity, had an increased risk of hospital admission and admission to the ICU compared to children identifying as White. Children identifying as Black or mixed race had longer hospital admissions.25 However, as the authors of the study note, residual confounders and ascertainment bias due to differences in COVID testing may have influenced these findings.
Our findings of differences in hospitalization and disease severity among those hospitalized by race and ethnicity should be interpreted carefully. These may reflect a constellation of factors that are difficult to measure, including differences in healthcare access, inequalities in care (including hospital admission inequalities), and implicit bias—all of which may reflect structural racism. For example, it is possible that children who identify as Black or Hispanic have different access to care compared to children who identify as White, and this may affect disease severity on presentation.2 Alternatively, it is possible that White pediatric patients are more likely to be hospitalized as compared to non-White pediatric patients with similar illness severity. Our finding that pediatric patients who identify as Hispanic or Black had a lower risk of hospitalization should be also interpreted carefully, as this may reflect higher utilization of the ED for SARS-CoV-2 testing, increased use of nonemergency services among those without access to primary care, or systematic differences in provider decision-making among this segment of the population.2 Further study is needed to determine specific drivers for racial and ethnic differences in healthcare utilization in children and adolescents with COVID-19.26
Complications and co-occurring diagnoses in adults with COVID-19 are well documented.27-30 However, there is little information to date on the co-occurring diagnoses and complications associated with COVID-19 in children and adolescents. We found that complications and co-occurring conditions occurred in 16.3% of the study population, with the most frequent conditions including known complications of viral infections such as pneumonia, respiratory failure, and seizures. Acute kidney and liver injury, as well as thrombotic complications, occurred less commonly than in adults.26-29 Interestingly, neurologic complications were also uncommon compared to adult reports8,31 and less frequent than in other viral illnesses in children and adolescents. For example, neurologic complications occur in approximately 7.5% of children and adolescents hospitalized with influenza.32
Limitations of the present study include the retrospective design, as well as incomplete patient-level clinical data in the PHIS database. The PHIS database only includes children’s hospitals, which may limit the generalizability of findings to community hospitals. We also excluded newborns, and our findings may not be generalizable to this population. We only included children and adolescents with a primary diagnosis of COVID-19, which has the potential for misclassification in cases where COVID-19 was a secondary diagnosis. However, results of our sensitivity analysis, which incorporated secondary diagnoses of COVID-19, were consistent with findings from our main analyses. Our study was designed to examine associations between certain prespecified factors and COVID-19 severity among pediatric patients who visited the ED or were admitted to the hospital during the COVID-19 pandemic. Thus, our findings must be interpreted in light of these considerations and may not be generalizable outside the ED or hospital setting. For example, it could be that some segments of the population utilized ED resources for testing, whereas others avoided the ED and other healthcare settings for fear of exposure to SARS-CoV-2. We also relied on diagnosis codes to identify concurrent diagnoses, as well as mechanical ventilation in our very severe outcome cohort, which resulted in this classification for some of these diagnoses. Despite these limitations, our findings represent an important step in understanding the risk factors associated with severe clinical COVID-19 disease in pediatric patients.
Our findings may inform future research and clinical interventions. Future studies on antiviral therapies and immune modulators targeting SARS-CoV-2 infection in children and adolescents should focus on high-risk populations, such as those identified in the study, as these patients are most likely to benefit from therapeutic interventions. Similarly, vaccine-development efforts may benefit from additional evaluation in high-risk populations, some of which may have altered immune responses. Furthermore, with increasing vaccination among adults and changes in recommendations, societal mitigation efforts (eg, masking, physical distancing) will diminish. Continued vigilance and COVID-19–mitigation efforts among high-risk children, for whom vaccines are not yet available, are critical during this transition.
CONCLUSION
Among children with COVID-19 who received care at children’s hospitals and EDs, 20% were hospitalized, and, of those, 21% were admitted to the ICU. Older children and adolescent patients had a lower risk of hospitalization; however, when hospitalized, they had greater illness severity. Those with selected comorbidities (eg, cardiovascular, obesity/type 2 DM, pulmonary and neurologic or neuromuscular disease) had both increased odds of hospitalization and in-hospital illness severity. While there were observed differences in COVID-19 severity by race and ethnicity, additional research is needed to clarify the drivers of such disparities. These factors should be considered when prioritizing mitigation strategies to prevent infection (eg, remote learning, avoidance of group activities, prioritization of COVID-19 vaccine when approved for children aged <12 years).
1. Centers for Disease Control and Prevention. COVID data tracker. Accessed September 9, 2021. https://covid.cdc.gov/covid-data-tracker/#datatracker-home
2. Levy C, Basmaci R, Bensaid P, et al. Changes in reverse transcription polymerase chain reaction-positive severe acute respiratory syndrome coronavirus 2 rates in adults and children according to the epidemic stages. Pediatr Infect Dis J. 2020;39(11):e369-e372. https://doi.org/10.1097/inf.0000000000002861
3. Gudbjartsson DF, Helgason A, Jonsson H, et al. Spread of SARS-CoV-2 in the Icelandic population. N Engl J Med. 2020;382(24):2302-2315. https://doi.org/10.1056/nejmoa2006100
4. Garg S, Kim L, Whitaker M, et al. Hospitalization rates and characteristics of patients hospitalized with laboratory-confirmed coronavirus disease 2019 - COVID-NET, 14 States, March 1-30, 2020. MMWR Morb Mortal Wkly Rep. 2020;69(15):458-464. https://doi.org/10.15585/mmwr.mm6915e3
5. Castagnoli R, Votto M, Licari A, et al. Severe acute respiratory syndrome coronavirus 2 (SARS-CoV-2) infection in children and adolescents: a systematic review. JAMA Pediatr. 2020;174(9):882-889. https://doi.org/10.1001/jamapediatrics.2020.1467
6. Feldstein LR, Rose EB, Horwitz SM, et al; Overcoming COVID-19 Investigators; CDC COVID-19 Response Team. Multisystem inflammatory syndrome in U.S. children and adolescents. N Engl J Med. 2020;383(4):334-346. https://doi.org/10.1056/nejmoa2021680
7. Magro B, Zuccaro V, Novelli L, et al. Predicting in-hospital mortality from coronavirus disease 2019: a simple validated app for clinical use. PLoS One. 2021;16(1):e0245281. https://doi.org/10.1371/journal.pone.0245281
8. Helms J, Kremer S, Merdji H, et al. Neurologic features in severe SARS-CoV-2 infection. N Engl J Med. 2020;382(23):2268-2270. https://doi.org/10.1056/nejmc2008597
9. Severe Covid GWAS Group; Ellinghaus D, Degenhardt F, Bujanda L, et al. Genomewide association study of severe Covid-19 with respiratory failure. N Engl J Med. 2020;383(16):1522-1534.
10. Kabarriti R, Brodin NP, Maron MI, et al. association of race and ethnicity with comorbidities and survival among patients with COVID-19 at an urban medical center in New York. JAMA Netw Open. 2020;3(9):e2019795. https://doi.org/10.1001/jamanetworkopen.2020.19795
11. Bellino S, Punzo O, Rota MC, et al; COVID-19 Working Group. COVID-19 disease severity risk factors for pediatric patients in Italy. Pediatrics. 2020;146(4):e2020009399. https://doi.org/10.1542/peds.2020-009399
12. Ouldali N, Yang DD, Madhi F, et al; investigator group of the PANDOR study. Factors associated with severe SARS-CoV-2 infection. Pediatrics. 2020;147(3):e2020023432. https://doi.org/10.1542/peds.2020-023432
13. Castells MC, Phillips EJ. Maintaining safety with SARS-CoV-2 vaccines. N Engl J Med. 2021;384(7):643-649. https://doi.org/10.1056/nejmra2035343
14. Antoon JW, Williams DJ, Thurm C, et al. The COVID-19 pandemic and changes in healthcare utilization for pediatric respiratory and nonrespiratory illnesses in the United States. J Hosp Med. 2021;16(5):294-297. https://doi.org/10.12788/jhm.3608
15. Blatz AM, David MZ, Otto WR, Luan X, Gerber JS. Validation of International Classification of Disease-10 code for identifying children hospitalized with coronavirus disease-2019. J Pediatric Infect Dis Soc. 2020;10(4):547-548. https://doi.org/10.1093/jpids/piaa140
16. Kadri SS, Gundrum J, Warner S, et al. Uptake and accuracy of the diagnosis code for COVID-19 among US hospitalizations. JAMA. 2020;324(24):2553-2554. https://doi.org/10.1001/jama.2020.20323
17. Kaiser SV, Rodean J, Bekmezian A, et al; Pediatric Research in Inpatient Settings (PRIS) Network. Effectiveness of pediatric asthma pathways for hospitalized children: a multicenter, national analysis. J Pediatr. 2018;197:165-171.e162. https://doi.org/10.1016/j.jpeds.2018.01.084
18. Feudtner C, Feinstein JA, Zhong W, Hall M, Dai D. Pediatric complex chronic conditions classification system version 2: updated for ICD-10 and complex medical technology dependence and transplantation. BMC Pediatr. 2014;14:199. https://doi.org/10.1186/1471-2431-14-199.
19. Williams DJ, Zhu Y, Grijalva CG, et al. Predicting severe pneumonia outcomes in children. Pediatrics. 2016;138(4):e20161019. https://doi.org/10.1542/peds.2016-1019
20. Zachariah P, Johnson CL, Halabi KC, et al. Epidemiology, clinical features, and disease severity in patients with coronavirus disease 2019 (COVID-19) in a children’s hospital in New York City, New York. JAMA Pediatr. 2020;174(10):e202430. https://doi.org/10.1001/jamapediatrics.2020.2430
21. DeBiasi RL, Song X, Delaney M, et al. Severe coronavirus disease-2019 in children and young adults in the Washington, DC, metropolitan region. J Pediatr. 2020;223:199-203.e191. https://doi.org/10.1016/j.jpeds.2020.05.007
22. Lovinsky-Desir S, Deshpande DR, De A, et al. Asthma among hospitalized patients with COVID-19 and related outcomes. J Allergy Clin Immunol. 2020;146(5):1027-1034.e1024. https://doi.org/10.1016/j.jaci.2020.07.026
23. Beken B, Ozturk GK, Aygun FD, Aydogmus C, Akar HH. Asthma and allergic diseases are not risk factors for hospitalization in children with coronavirus disease 2019. Ann Allergy Asthma Immunol. 2021;126(5):569-575. https://doi.org/10.1016/j.anai.2021.01.018
24. Yehia BR, Winegar A, Fogel R, et al. Association of race with mortality among patients hospitalized with coronavirus disease 2019 (COVID-19) at 92 US hospitals. JAMA Netw Open. 2020;3(8):e2018039. https://doi.org/10.1001/jamanetworkopen.2020.18039
25. Saatci D, Ranger TA, Garriga C, et al. Association between race and COVID-19 outcomes among 2.6 million children in England. JAMA Pediatr. 2021;e211685. https://doi.org/10.1001/jamapediatrics.2021.1685
26. Lopez L, 3rd, Hart LH, 3rd, Katz MH. Racial and ethnic health disparities related to COVID-19. JAMA. 2021;325(8):719-720. https://doi.org/10.1001/jama.2020.26443
27. Altunok ES, Alkan M, Kamat S, et al. Clinical characteristics of adult patients hospitalized with laboratory-confirmed COVID-19 pneumonia. J Infect Chemother. 2020. https://doi.org/10.1016/j.jiac.2020.10.020
28. Ali H, Daoud A, Mohamed MM, et al. Survival rate in acute kidney injury superimposed COVID-19 patients: a systematic review and meta-analysis. Ren Fail. 2020;42(1):393-397. https://doi.org/10.1080/0886022x.2020.1756323
29. Anirvan P, Bharali P, Gogoi M, Thuluvath PJ, Singh SP, Satapathy SK. Liver injury in COVID-19: the hepatic aspect of the respiratory syndrome - what we know so far. World J Hepatol. 2020;12(12):1182-1197. https://doi.org/10.4254/wjh.v12.i12.1182
30. Moschonas IC, Tselepis AD. SARS-CoV-2 infection and thrombotic complications: a narrative review. J Thromb Thrombolysis. 2021;52(1):111-123. https://doi.org/10.1007/s11239-020-02374-3
31. Lee MH, Perl DP, Nair G, et al. Microvascular injury in the brains of patients with Covid-19. N Engl J Med. 2020;384(5):481-483. https://doi.org/10.1056/nejmc2033369
32. Antoon JW, Hall M, Herndon A, et al. Prevalence, risk factors, and outcomes of influenza-associated neurological Complications in Children. J Pediatr. 2021;S0022-3476(21)00657-0. https://doi.org/10.1016/j.jpeds.2021.06.075
The COVID-19 pandemic has led to more than 40 million infections and more than 650,000 deaths in the United States alone.1 Morbidity and mortality have disproportionately affected older adults.2-4 However, acute infection and delayed effects, such as multisystem inflammatory syndrome in children (MIS-C), occur and can lead to severe complications, hospitalization, and death in pediatric patients.5,6 Due to higher clinical disease prevalence and morbidity in the adult population, we have learned much about the clinical factors associated with severe adult COVID-19 disease.5,7-9 Such clinical factors include older age, concurrent comorbidities, smoke exposure, and Black race or Hispanic ethnicity, among others.5,7-10 However, there is a paucity of data on severe COVID-19 disease in pediatric patients.5,11,12 In addition, most immunization strategies and pharmacologic treatments for COVID-19 have not been evaluated or approved for use in children.13 To guide targeted prevention and treatment strategies, there is a critical need to identify children and adolescents—who are among the most vulnerable patient populations—at high risk for severe disease.
Identifying the clinical factors associated with severe COVID-19 disease will help with prioritizing and allocating vaccines when they are approved for use in patients younger than 12 years.
METHODS
Study Design
We conducted a multicenter retrospective cohort study of patients presenting for care at pediatric hospitals that report data to the Pediatric Health Information System (PHIS) database. The PHIS administrative database includes billing and utilization data from 45 US tertiary care hospitals affiliated with the Children’s Hospital Association (Lenexa, Kansas). Data quality and reliability are ensured through a joint validation effort between the Children’s Hospital Association and participating hospitals. Hospitals submit discharge data, including demographics, diagnoses, and procedures using International Classification of Diseases, 10th Revision (ICD-10) codes, along with daily detailed information on pharmacy, location of care, and other services.
Study Population
Patients 30 days to 18 years of age discharged from the emergency department (ED) or inpatient setting with a primary diagnosis of COVID-19 (ICD-10 codes U.071 and U.072) between April 1, 2020, and September 30, 2020, were eligible for inclusion.14 In a prior study, the positive predictive value of an ICD-10–coded diagnosis of COVID-19 among hospitalized pediatric patients was 95.5%, compared with reverse transcription polymerase reaction results or presence of MIS-C.15 The diagnostic code for COVID-19 (ICD-10-CM) also had a high sensitivity (98.0%) in the hospitalized population.16 Acknowledging the increasing practice of screening patients upon admission, and in an attempt to minimize potential misclassification, we did not include encounters with secondary diagnoses of COVID-19 in our primary analyses. Pediatric patients with surgical diagnoses and neonates who never left the hospital were also excluded.
Factors Associated With Severe COVID-19 Disease
Exposures of interest were determined a priori based on current evidence in the literature and included patient age (0-4 years, 5-11 years, and 12-18 years), sex, race and ethnicity (non-Hispanic White, non-Hispanic Black, Hispanic, Asian, other non-White race [defined as Pacific Islander, Native American, or other]), payor type, cardiovascular complex chronic conditions (CCC), neuromuscular CCC, obesity/type 2 diabetes mellitus (DM), pulmonary CCC, asthma (defined using ICD-10 codes17), and immunocompromised CCC
Pediatric Complications and Conditions Associated With COVID-19
Based on current evidence and expert opinion of study members, associated diagnoses and complications co-occurring with a COVID-19 diagnosis were defined a priori and identified through ICD-10 codes (Appendix Table 1). These included acute kidney injury, acute liver injury, aseptic meningitis, asthma exacerbation, bronchiolitis, cerebral infarction, croup, encephalitis, encephalopathy, infant fever, febrile seizure, gastroenteritis/dehydration, Kawasaki disease/MIS-C, myocarditis/pericarditis, pneumonia, lung effusion or empyema, respiratory failure, sepsis, nonfebrile seizure, pancreatitis, sickle cell complications, and thrombotic complications.
Outcomes
COVID-19 severity outcomes were assessed as follows: (1) mild = ED discharge; (2) moderate = inpatient admission; (3) severe = intensive care unit (ICU) admission without mechanical ventilation, shock, or death; and (4) very severe = ICU admission with mechanical ventilation, shock, or death.19 This ordinal ranking system did not violate the proportional odds assumption. Potential reasons for admission to the ICU without mechanical ventilation, shock, or death include, but are not limited to, need for noninvasive ventilation, vital sign instability, dysrhythmias, respiratory insufficiency, or complications arising from concurrent conditions (eg, thrombotic events, need for continuous albuterol therapy). We examined several secondary, hospital-based outcomes, including associated diagnoses and complications, all-cause 30-day healthcare reutilization (ED visit or rehospitalization), length of stay (LOS), and ICU LOS.
Statistical Analysis
Demographic characteristics were summarized using frequencies and percentages for categorical variables and geometric means with SD and medians with interquartile ranges (IQR) for continuous variables, as appropriate. Factors associated with hospitalization (encompassing severity levels 2-4) vs ED discharge (severity level 1) were assessed using logistic regression. Factors associated with increasing severity among hospitalized pediatric patients (severity levels 2, 3, and 4) were assessed using ordinal logistic regression. Covariates in these analyses included race and ethnicity, age, sex, payor, cardiovascular CCC, neurologic/neuromuscular CCC, obesity/type 2 DM, pulmonary CCC, asthma, and immunocompromised CCC. Adjusted odds ratios (aOR) and corresponding 95% CI for each risk factor were generated using generalized linear mixed effects models and random intercepts for each hospital. Given the potential for diagnostic misclassification of pediatric patients with COVID-19 based on primary vs secondary diagnoses, we performed sensitivity analyses defining the study population as those with a primary diagnosis of COVID-19 and those with a secondary diagnosis of COVID-19 plus a concurrent primary diagnosis of a condition associated with COVID-19 (Appendix Table 1).
All analyses were performed using SAS version 9.4 (SAS Institute, Inc), and P < .05 was considered statistically significant. The Institutional Review Board at Vanderbilt University Medical Center determined that this study of de-identified data did not meet the criteria for human subjects research.
RESULTS
Study Population
A total of 19,976 encounters were included in the study. Of those, 15,913 (79.7%) were discharged from the ED and 4063 (20.3%) were hospitalized (Table 1). The most common race/ethnicity was Hispanic (9741, 48.8%), followed by non-Hispanic White (4217, 21.1%). Reference race/ethnicity data for the overall 2019 PHIS population can be found in Appendix Table 2.
The severity distribution among the hospitalized population was moderate (3222, 79.3%), severe (431, 11.3%), and very severe (380, 9.4%). The frequency of COVID-19 diagnoses increased late in the study period (Figure). Among those hospitalized, the median LOS for the index admission was 2 days (IQR, 1-4), while among those admitted to the ICU, the median LOS was 3 days (IQR, 2-5).
Overall, 10.1% (n = 2020) of the study population had an all-cause repeat encounter (ie, subsequent ED encounter or hospitalization) within 30 days following the index discharge. Repeat encounters were more frequent among patients hospitalized than among those discharged from the ED (Appendix Table 3).
Prevalence of Conditions and Complications Associated With COVID-19
Overall, 3257 (16.3%) patients had one or more co-occurring diagnoses categorized as a COVID-19–associated condition or complication. The most frequent diagnoses included lower respiratory tract disease (pneumonia, lung effusion, or empyema; n = 1415, 7.1%), gastroenteritis/dehydration (n = 1068, 5.3%), respiratory failure (n = 731, 3.7%), febrile infant (n = 413, 2.1%), and nonfebrile seizure (n = 425, 2.1%). Aside from nonfebrile seizure, neurological complications were less frequent and included febrile seizure (n = 155, 0.8%), encephalopathy (n = 63, 0.3%), aseptic meningitis (n = 16, 0.1%), encephalitis (n = 11, 0.1%), and cerebral infarction (n = 6, <0.1%). Kawasaki disease and MIS-C comprised 1.7% (n = 346) of diagnoses. Thrombotic complications occurred in 0.1% (n = 13) of patients. Overall, these conditions and complications associated with COVID-19 were more frequent in hospitalized patients than in those discharged from the ED (P < .001) (Table 2).
Factors Associated With COVID-19 Disease Severity
Compared to pediatric patients with COVID-19 discharged from the ED, factors associated with increased odds of hospitalization included private payor insurance; obesity/type 2 DM; asthma; and cardiovascular, immunocompromised, neurologic/neuromuscular, and pulmonary CCCs (Table 3). Factors associated with decreased risk of hospitalization included Black race or Hispanic ethnicity compared with White race; female sex; and age 5 to 11 years and age 12 to 17 years (vs age 0-4 years). Among children and adolescents hospitalized with COVID-19, factors associated with greater disease severity included Black or other non-White race; age 5 to 11 years; age 12 to 17 years; obesity/type 2 DM; immunocompromised conditions; and cardiovascular, neurologic/neuromuscular, and pulmonary CCCs (Table 3).
Sensitivity Analysis
We performed a sensitivity analysis that expanded the study population to include those with a secondary diagnosis of COVID-19 plus a diagnosis of a COVID-19–associated condition or complication. Analyses using the expanded population (N = 21,247) were similar to the primary analyses (Appendix Table 4 and Appendix Table 5).
DISCUSSION
In this large multicenter study evaluating COVID-19 disease severity in more than 19,000 patients presenting for emergency care at US pediatric hospitals, approximately 20% were hospitalized, and among those hospitalized almost a quarter required ICU care. Clinical risk factors associated with increased risk of hospitalization include private payor status and selected comorbidities (obesity/type 2 DM; asthma; and cardiovascular, pulmonary, immunocompromised, neurologic/neuromuscular CCCs), while those associated with decreased risk of hospitalization include older age, female sex, and Black race or Hispanic ethnicity. Factors associated with severe disease among hospitalized pediatric patients include Black or other non-White race, school age (≥5 years), and certain chronic conditions (cardiovascular disease, obesity/type 2 DM, neurologic or neuromuscular disease). Sixteen percent of patients had a concurrent diagnosis for a condition or complication associated with COVID-19.
While the study population (ie, children and adolescents presenting to the ED) represents a small fraction of children and adolescents in the community with SARS-CoV-2 infection, the results provide important insight into factors of severe COVID-19 in the pediatric population. A report from France suggested ventilatory or hemodynamic support or death were independently associated with older age (≥10 years), elevated C-reactive protein, and hypoxemia.12 An Italian study found that younger age (0-4 years) was associated with less severe disease, while preexisting conditions were more likely in patients with severe disease.11 A single-center case series of 50 patients (aged ≤21 years) hospitalized at a children’s hospital in New York City found respiratory failure (n = 9) was more common in children older than 1 year, patients with elevated inflammatory markers, and patients with obesity.20
Our study confirms several factors for severe COVID-19 found in these studies, including older age,11,12,20 obesity,20 and preexisting conditions.11 Our findings also expand on these reports, including identification of factors associated with hospitalization. Given the rate of 30-day re-encounters among pediatric patients with COVID-19 (10.1%), identifying risk factors for hospitalization may aid ED providers in determining optimal disposition (eg, home, hospital admission, ICU). We also identified specific comorbidities associated with more severe disease in those hospitalized with COVID-19, such as cardiovascular disease, obesity/type 2 DM, and pulmonary, neurologic, or neuromuscular conditions. We also found that asthma increased the risk for hospitalization but not more severe disease among those hospitalized. This latter finding also aligns with recent single-center studies,21,22 whereas a Turkish study of pediatric patients aged 0 to 18 years found no association between asthma and COVID-19 hospitalizations.23We also examined payor type and racial/ethnic factors in our analysis. In 2019, patients who identified as Black or Hispanic comprised 52.3% of all encounters and 40.7% of hospitalizations recorded in the PHIS database. During the same year, encounters for influenza among Black or Hispanic pediatric patients comprised 58.7% of all influenza diagnoses and 47.0% of pediatric influenza hospitalizations (Appendix Table 2). In this study, patients who identified as Black or Hispanic race represented a disproportionately large share of patients presenting to children’s hospitals (68.5%) and of those hospitalized (60.8%). Hispanic ethnicity, in particular, represented a disproportionate share of patients seeking care for COVID-19 compared to the overall PHIS population (47.7% and 27.1%, respectively). After accounting for other factors, we found Black and other non-White race—but not of Hispanic ethnicity—were independently associated with more disease severity among those hospitalized. This contrasts with findings from a recent adult study by Yehia et al,24 who found (after adjusting for other clinical factors) no significant difference in mortality between Black patients and White patients among adults hospitalized due to COVID-19. It also contrasts with a recent large population-based UK study wherein pediatric patients identifying as Asian, but not Black or mixed race or ethnicity, had an increased risk of hospital admission and admission to the ICU compared to children identifying as White. Children identifying as Black or mixed race had longer hospital admissions.25 However, as the authors of the study note, residual confounders and ascertainment bias due to differences in COVID testing may have influenced these findings.
Our findings of differences in hospitalization and disease severity among those hospitalized by race and ethnicity should be interpreted carefully. These may reflect a constellation of factors that are difficult to measure, including differences in healthcare access, inequalities in care (including hospital admission inequalities), and implicit bias—all of which may reflect structural racism. For example, it is possible that children who identify as Black or Hispanic have different access to care compared to children who identify as White, and this may affect disease severity on presentation.2 Alternatively, it is possible that White pediatric patients are more likely to be hospitalized as compared to non-White pediatric patients with similar illness severity. Our finding that pediatric patients who identify as Hispanic or Black had a lower risk of hospitalization should be also interpreted carefully, as this may reflect higher utilization of the ED for SARS-CoV-2 testing, increased use of nonemergency services among those without access to primary care, or systematic differences in provider decision-making among this segment of the population.2 Further study is needed to determine specific drivers for racial and ethnic differences in healthcare utilization in children and adolescents with COVID-19.26
Complications and co-occurring diagnoses in adults with COVID-19 are well documented.27-30 However, there is little information to date on the co-occurring diagnoses and complications associated with COVID-19 in children and adolescents. We found that complications and co-occurring conditions occurred in 16.3% of the study population, with the most frequent conditions including known complications of viral infections such as pneumonia, respiratory failure, and seizures. Acute kidney and liver injury, as well as thrombotic complications, occurred less commonly than in adults.26-29 Interestingly, neurologic complications were also uncommon compared to adult reports8,31 and less frequent than in other viral illnesses in children and adolescents. For example, neurologic complications occur in approximately 7.5% of children and adolescents hospitalized with influenza.32
Limitations of the present study include the retrospective design, as well as incomplete patient-level clinical data in the PHIS database. The PHIS database only includes children’s hospitals, which may limit the generalizability of findings to community hospitals. We also excluded newborns, and our findings may not be generalizable to this population. We only included children and adolescents with a primary diagnosis of COVID-19, which has the potential for misclassification in cases where COVID-19 was a secondary diagnosis. However, results of our sensitivity analysis, which incorporated secondary diagnoses of COVID-19, were consistent with findings from our main analyses. Our study was designed to examine associations between certain prespecified factors and COVID-19 severity among pediatric patients who visited the ED or were admitted to the hospital during the COVID-19 pandemic. Thus, our findings must be interpreted in light of these considerations and may not be generalizable outside the ED or hospital setting. For example, it could be that some segments of the population utilized ED resources for testing, whereas others avoided the ED and other healthcare settings for fear of exposure to SARS-CoV-2. We also relied on diagnosis codes to identify concurrent diagnoses, as well as mechanical ventilation in our very severe outcome cohort, which resulted in this classification for some of these diagnoses. Despite these limitations, our findings represent an important step in understanding the risk factors associated with severe clinical COVID-19 disease in pediatric patients.
Our findings may inform future research and clinical interventions. Future studies on antiviral therapies and immune modulators targeting SARS-CoV-2 infection in children and adolescents should focus on high-risk populations, such as those identified in the study, as these patients are most likely to benefit from therapeutic interventions. Similarly, vaccine-development efforts may benefit from additional evaluation in high-risk populations, some of which may have altered immune responses. Furthermore, with increasing vaccination among adults and changes in recommendations, societal mitigation efforts (eg, masking, physical distancing) will diminish. Continued vigilance and COVID-19–mitigation efforts among high-risk children, for whom vaccines are not yet available, are critical during this transition.
CONCLUSION
Among children with COVID-19 who received care at children’s hospitals and EDs, 20% were hospitalized, and, of those, 21% were admitted to the ICU. Older children and adolescent patients had a lower risk of hospitalization; however, when hospitalized, they had greater illness severity. Those with selected comorbidities (eg, cardiovascular, obesity/type 2 DM, pulmonary and neurologic or neuromuscular disease) had both increased odds of hospitalization and in-hospital illness severity. While there were observed differences in COVID-19 severity by race and ethnicity, additional research is needed to clarify the drivers of such disparities. These factors should be considered when prioritizing mitigation strategies to prevent infection (eg, remote learning, avoidance of group activities, prioritization of COVID-19 vaccine when approved for children aged <12 years).
1. Centers for Disease Control and Prevention. COVID data tracker. Accessed September 9, 2021. https://covid.cdc.gov/covid-data-tracker/#datatracker-home
2. Levy C, Basmaci R, Bensaid P, et al. Changes in reverse transcription polymerase chain reaction-positive severe acute respiratory syndrome coronavirus 2 rates in adults and children according to the epidemic stages. Pediatr Infect Dis J. 2020;39(11):e369-e372. https://doi.org/10.1097/inf.0000000000002861
3. Gudbjartsson DF, Helgason A, Jonsson H, et al. Spread of SARS-CoV-2 in the Icelandic population. N Engl J Med. 2020;382(24):2302-2315. https://doi.org/10.1056/nejmoa2006100
4. Garg S, Kim L, Whitaker M, et al. Hospitalization rates and characteristics of patients hospitalized with laboratory-confirmed coronavirus disease 2019 - COVID-NET, 14 States, March 1-30, 2020. MMWR Morb Mortal Wkly Rep. 2020;69(15):458-464. https://doi.org/10.15585/mmwr.mm6915e3
5. Castagnoli R, Votto M, Licari A, et al. Severe acute respiratory syndrome coronavirus 2 (SARS-CoV-2) infection in children and adolescents: a systematic review. JAMA Pediatr. 2020;174(9):882-889. https://doi.org/10.1001/jamapediatrics.2020.1467
6. Feldstein LR, Rose EB, Horwitz SM, et al; Overcoming COVID-19 Investigators; CDC COVID-19 Response Team. Multisystem inflammatory syndrome in U.S. children and adolescents. N Engl J Med. 2020;383(4):334-346. https://doi.org/10.1056/nejmoa2021680
7. Magro B, Zuccaro V, Novelli L, et al. Predicting in-hospital mortality from coronavirus disease 2019: a simple validated app for clinical use. PLoS One. 2021;16(1):e0245281. https://doi.org/10.1371/journal.pone.0245281
8. Helms J, Kremer S, Merdji H, et al. Neurologic features in severe SARS-CoV-2 infection. N Engl J Med. 2020;382(23):2268-2270. https://doi.org/10.1056/nejmc2008597
9. Severe Covid GWAS Group; Ellinghaus D, Degenhardt F, Bujanda L, et al. Genomewide association study of severe Covid-19 with respiratory failure. N Engl J Med. 2020;383(16):1522-1534.
10. Kabarriti R, Brodin NP, Maron MI, et al. association of race and ethnicity with comorbidities and survival among patients with COVID-19 at an urban medical center in New York. JAMA Netw Open. 2020;3(9):e2019795. https://doi.org/10.1001/jamanetworkopen.2020.19795
11. Bellino S, Punzo O, Rota MC, et al; COVID-19 Working Group. COVID-19 disease severity risk factors for pediatric patients in Italy. Pediatrics. 2020;146(4):e2020009399. https://doi.org/10.1542/peds.2020-009399
12. Ouldali N, Yang DD, Madhi F, et al; investigator group of the PANDOR study. Factors associated with severe SARS-CoV-2 infection. Pediatrics. 2020;147(3):e2020023432. https://doi.org/10.1542/peds.2020-023432
13. Castells MC, Phillips EJ. Maintaining safety with SARS-CoV-2 vaccines. N Engl J Med. 2021;384(7):643-649. https://doi.org/10.1056/nejmra2035343
14. Antoon JW, Williams DJ, Thurm C, et al. The COVID-19 pandemic and changes in healthcare utilization for pediatric respiratory and nonrespiratory illnesses in the United States. J Hosp Med. 2021;16(5):294-297. https://doi.org/10.12788/jhm.3608
15. Blatz AM, David MZ, Otto WR, Luan X, Gerber JS. Validation of International Classification of Disease-10 code for identifying children hospitalized with coronavirus disease-2019. J Pediatric Infect Dis Soc. 2020;10(4):547-548. https://doi.org/10.1093/jpids/piaa140
16. Kadri SS, Gundrum J, Warner S, et al. Uptake and accuracy of the diagnosis code for COVID-19 among US hospitalizations. JAMA. 2020;324(24):2553-2554. https://doi.org/10.1001/jama.2020.20323
17. Kaiser SV, Rodean J, Bekmezian A, et al; Pediatric Research in Inpatient Settings (PRIS) Network. Effectiveness of pediatric asthma pathways for hospitalized children: a multicenter, national analysis. J Pediatr. 2018;197:165-171.e162. https://doi.org/10.1016/j.jpeds.2018.01.084
18. Feudtner C, Feinstein JA, Zhong W, Hall M, Dai D. Pediatric complex chronic conditions classification system version 2: updated for ICD-10 and complex medical technology dependence and transplantation. BMC Pediatr. 2014;14:199. https://doi.org/10.1186/1471-2431-14-199.
19. Williams DJ, Zhu Y, Grijalva CG, et al. Predicting severe pneumonia outcomes in children. Pediatrics. 2016;138(4):e20161019. https://doi.org/10.1542/peds.2016-1019
20. Zachariah P, Johnson CL, Halabi KC, et al. Epidemiology, clinical features, and disease severity in patients with coronavirus disease 2019 (COVID-19) in a children’s hospital in New York City, New York. JAMA Pediatr. 2020;174(10):e202430. https://doi.org/10.1001/jamapediatrics.2020.2430
21. DeBiasi RL, Song X, Delaney M, et al. Severe coronavirus disease-2019 in children and young adults in the Washington, DC, metropolitan region. J Pediatr. 2020;223:199-203.e191. https://doi.org/10.1016/j.jpeds.2020.05.007
22. Lovinsky-Desir S, Deshpande DR, De A, et al. Asthma among hospitalized patients with COVID-19 and related outcomes. J Allergy Clin Immunol. 2020;146(5):1027-1034.e1024. https://doi.org/10.1016/j.jaci.2020.07.026
23. Beken B, Ozturk GK, Aygun FD, Aydogmus C, Akar HH. Asthma and allergic diseases are not risk factors for hospitalization in children with coronavirus disease 2019. Ann Allergy Asthma Immunol. 2021;126(5):569-575. https://doi.org/10.1016/j.anai.2021.01.018
24. Yehia BR, Winegar A, Fogel R, et al. Association of race with mortality among patients hospitalized with coronavirus disease 2019 (COVID-19) at 92 US hospitals. JAMA Netw Open. 2020;3(8):e2018039. https://doi.org/10.1001/jamanetworkopen.2020.18039
25. Saatci D, Ranger TA, Garriga C, et al. Association between race and COVID-19 outcomes among 2.6 million children in England. JAMA Pediatr. 2021;e211685. https://doi.org/10.1001/jamapediatrics.2021.1685
26. Lopez L, 3rd, Hart LH, 3rd, Katz MH. Racial and ethnic health disparities related to COVID-19. JAMA. 2021;325(8):719-720. https://doi.org/10.1001/jama.2020.26443
27. Altunok ES, Alkan M, Kamat S, et al. Clinical characteristics of adult patients hospitalized with laboratory-confirmed COVID-19 pneumonia. J Infect Chemother. 2020. https://doi.org/10.1016/j.jiac.2020.10.020
28. Ali H, Daoud A, Mohamed MM, et al. Survival rate in acute kidney injury superimposed COVID-19 patients: a systematic review and meta-analysis. Ren Fail. 2020;42(1):393-397. https://doi.org/10.1080/0886022x.2020.1756323
29. Anirvan P, Bharali P, Gogoi M, Thuluvath PJ, Singh SP, Satapathy SK. Liver injury in COVID-19: the hepatic aspect of the respiratory syndrome - what we know so far. World J Hepatol. 2020;12(12):1182-1197. https://doi.org/10.4254/wjh.v12.i12.1182
30. Moschonas IC, Tselepis AD. SARS-CoV-2 infection and thrombotic complications: a narrative review. J Thromb Thrombolysis. 2021;52(1):111-123. https://doi.org/10.1007/s11239-020-02374-3
31. Lee MH, Perl DP, Nair G, et al. Microvascular injury in the brains of patients with Covid-19. N Engl J Med. 2020;384(5):481-483. https://doi.org/10.1056/nejmc2033369
32. Antoon JW, Hall M, Herndon A, et al. Prevalence, risk factors, and outcomes of influenza-associated neurological Complications in Children. J Pediatr. 2021;S0022-3476(21)00657-0. https://doi.org/10.1016/j.jpeds.2021.06.075
© 2021 Society of Hospital Medicine
Association of Weekend Admission and Weekend Discharge with Length of Stay and 30-Day Readmission in Children’s Hospitals
Increasingly, metrics such as length of stay (LOS) and readmissions are being utilized in the United States to assess quality of healthcare because these factors may represent opportunities to reduce cost and improve healthcare delivery.1-8 However, the relatively low rate of pediatric readmissions,9 coupled with limited data regarding recommended LOS or best practices to prevent readmissions in children, challenges the ability of hospitals to safely reduce LOS and readmission rates for children.10–12
In adults, weekend admission is associated with prolonged LOS, increased readmission rates, and increased risk of mortality.13-21 This association is referred to as the “weekend effect.” While the weekend effect has been examined in children, the results of these studies have been variable, with some studies supporting this association and others refuting it.22-31 In contrast to patient demographic and clinical characteristics that are known to affect LOS and readmissions,32 the weekend effect represents a potentially modifiable aspect of a hospitalization that could be targeted to improve healthcare delivery.
With increasing national attention toward improving quality of care and reducing LOS and healthcare costs, more definitive evidence of the weekend effect is necessary to prioritize resource use at both the local and national levels. Therefore, we sought to determine the association of weekend admission and weekend discharge on LOS and 30-day readmissions, respectively, among a national cohort of children. We hypothesized that children admitted on the weekend would have longer LOS, whereas those discharged on the weekend would have higher readmission rates.
METHODS
Study Design and Data Source
We conducted a multicenter, retrospective, cross-sectional study. Data were obtained from the Pediatric Health Information System (PHIS), an administrative and billing database of 46 free-standing tertiary care pediatric hospitals affiliated with the Children’s Hospital Association (Lenexa, Kansas). Patient data are de-identified within PHIS; however, encrypted patient identifiers allow individual patients to be followed across visits. This study was not considered human subjects research by the policies of the Cincinnati Children’s Hospital Institutional Review Board.
Participants
We included hospitalizations to a PHIS-participating hospital for children aged 0-17 years between October 1, 2014 and September 30, 2015. We excluded children who were transferred from/to another institution, left against medical advice, or died in the hospital because these indications may result in incomplete LOS information and would not consistently contribute to readmission rates. We also excluded birth hospitalizations and children admitted for planned procedures. Birth hospitalizations were defined as hospitalizations that began on the day of birth.
Main Exposures
No standard definition of weekend admission or discharge was identified in the literature.33 Thus, we defined a weekend admission as an admission between 3:00
Main Outcomes
Our outcomes included LOS for weekend admission and 30-day readmissions for weekend discharge. LOS, measured in hours, was defined using the reported admission and discharge times. Readmissions were defined as a return to the same hospital within the subsequent 30 days following discharge.
Patient Demographics and Other Study Variables
Patient demographics included age, gender, race/ethnicity, payer, and median household income quartile based on the patient’s home ZIP code. Other study variables included presence of a complex chronic condition (CCC),34 technology dependence,34 number of chronic conditions of any complexity, admission through the emergency department, intensive care unit (ICU) admission, and case mix index. ICU admission and case mix index were chosen as markers for severity of illness. ICU admission was defined as any child who incurred ICU charges at any time following admission. Case mix index in PHIS is a relative weight assigned to each discharge based on the All-Patient Refined Diagnostic Group (APR-DRG; 3M) assignment and APR-DRG severity of illness, which ranges from 1 (minor) to 4 (extreme). The weights are derived by the Children’s Hospital Association from the HCUP KID 2012 database as the ratio of the average cost for discharges within a specific APR-DRG severity of illness combination to the average cost for all discharges in the database.
Statistical Analysis
Continuous variables were summarized with medians and interquartile ranges, while categorical variables were summarized with frequencies and percentages. Differences in admission and discharge characteristics between weekend and weekday were assessed using Wilcoxon rank sum tests for continuous variables and chi-square tests of association for categorical variables. We used generalized linear mixed modeling (GLMM) techniques to assess the impact of weekend admission on LOS and weekend discharge on readmission, adjusting for important patient demographic and clinical characteristics. Furthermore, we used GLMM point estimates to describe the variation across hospitals of the impact of weekday versus weekend care on LOS and readmissions. We assumed an underlying log-normal distribution for LOS and an underlying binomial distribution for 30-day readmission. All GLMMs included a random intercept for each hospital to account for patient clustering within a hospital. All statistical analyses were performed using SAS v.9.4 (SAS Institute, Cary, North Carolina), and P values <.05 were considered statistically significant.
RESULTS
We identified 390,745 hospitalizations that met inclusion criteria (Supplementary Figure 1). The median LOS among our cohort was 41 hours (interquartile range [IQR] 24-71) and the median 30-day readmission rate was 8.2% (IQR 7.2-9.4).
Admission Demographics for Weekends and Weekdays
Among the included hospitalizations, 92,266 (23.6%) admissions occurred on a weekend (Supplementary Table 1). Overall, a higher percentage of children <5 years of age were admitted on a weekend compared with those admitted on a weekday (53.3% vs 49.1%, P < .001). We observed a small but statistically significant difference in the proportion of weekend versus weekday admissions according to gender, race/ethnicity, payer, and median household income quartile. Children with medical complexity and those with technology dependence were admitted less frequently on a weekend. A higher proportion of children were admitted through the emergency department on a weekend and a higher frequency of ICU utilization was observed for children admitted on a weekend compared with those admitted on a weekday.
Association Between Study Variables and Length of Stay
In comparing adjusted LOS for weekend versus weekday admissions across 43 hospitals, not only did LOS vary across hospitals (P < .001), but the association between LOS and weekend versus weekday care also varied across hospitals (P < .001) (Figure 1). Weekend admission was associated with a significantly longer LOS at eight (18.6%) hospitals and a significantly shorter LOS at four (9.3%) hospitals with nonstatistically significant differences at the remaining hospitals.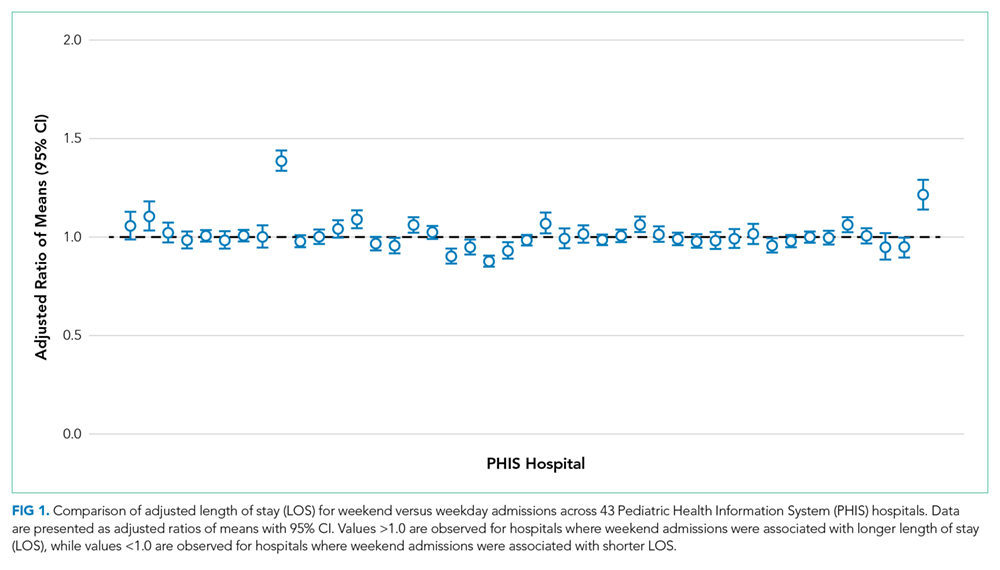
In adjusted analyses, we observed that infants ≤30 days of age, on average, had an adjusted LOS that was 24% longer than that of 15- to 17-year-olds, while children aged 1-14 years had an adjusted LOS that was 6%-18% shorter (Table 1). ICU utilization, admission through the emergency department, and number of chronic conditions had the greatest association with LOS. As the number of chronic conditions increased, the LOS increased. No association was found between weekend versus weekday admission and LOS (adjusted LOS [95% CI]: weekend 63.70 [61.01-66.52] hours versus weekday 63.40 [60.73-66.19] hours, P = .112).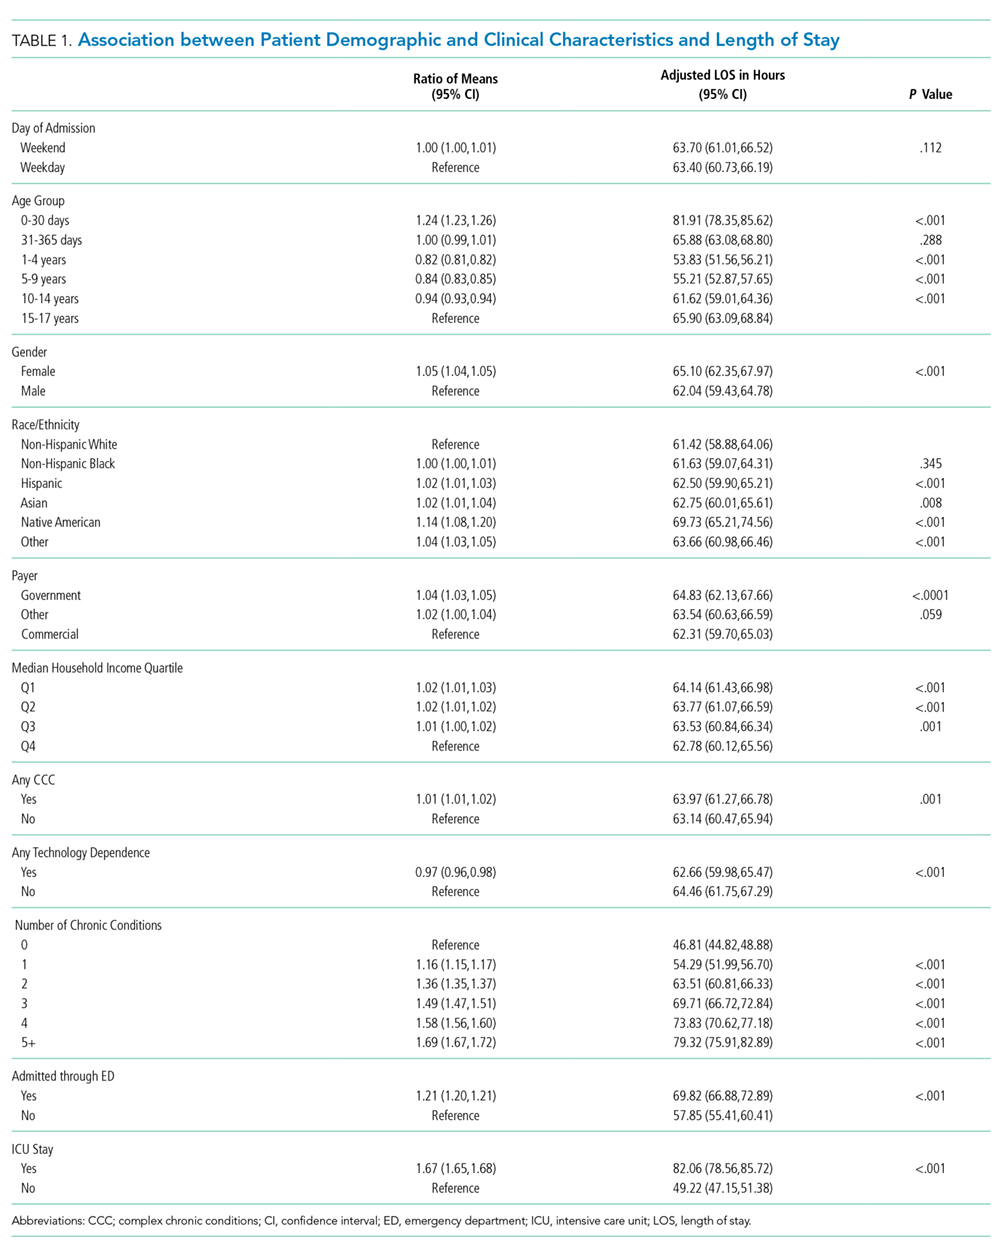
Discharge Demographics for Weekends and Weekdays
Of the included hospitalizations, 127,421 (32.6%) discharges occurred on a weekend (Supplementary Table 2). Overall, a greater percentage of weekend discharges comprised children <5 years of age compared with the percentage of weekday discharges for children <5 years of age (51.5% vs 49.5%, P < .001). No statistically significant differences were found in gender, payer, or median household income quartile between those children discharged on a weekend versus those discharged on a weekday. We found small, statistically significant differences in the proportion of weekend versus weekday discharges according to race/ethnicity, with fewer non-Hispanic white children being discharged on the weekend versus weekday. Children with medical complexity, technology dependence, and patients with ICU utilization were less frequently discharged on a weekend compared with those discharged on a weekday.
Association Between Study Variables and Readmissions
In comparing the adjusted odds of readmissions for weekend versus weekday discharges across 43 PHIS hospitals, we observed significant variation (P < .001) in readmission rates from hospital to hospital (Figure 2). However, the direction of impact of weekend care on readmissions was similar (P = .314) across hospitals (ie, for 37 of 43 hospitals, the readmission rate was greater for weekend discharges compared with that for weekday discharges). For 17 (39.5%) of 43 hospitals, weekend discharge was associated with a significantly higher readmission rate, while the differences between weekday and weekend discharge were not statistically significant for the remaining hospitals.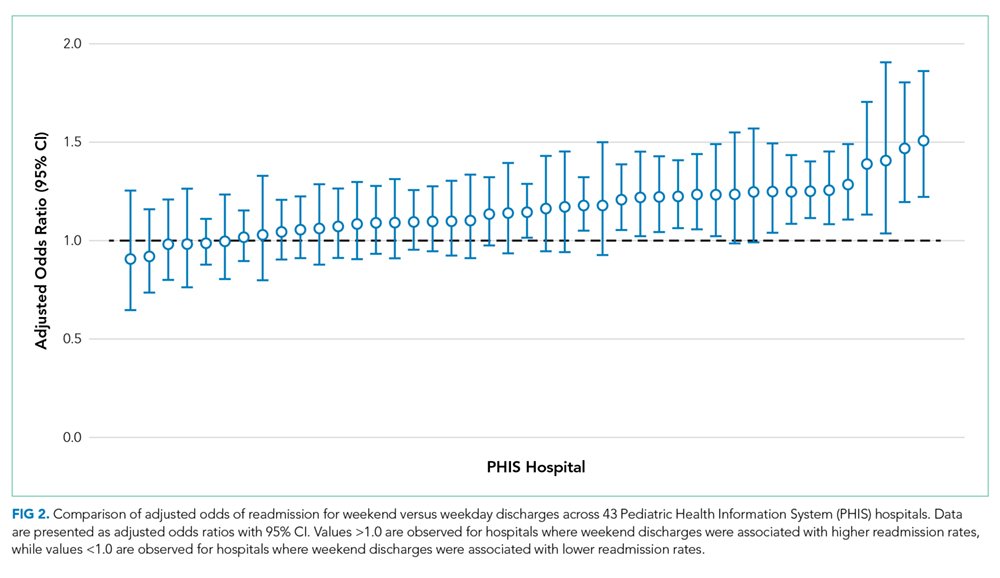
In adjusted analyses, we observed that infants <1 year were more likely to be readmitted compared with 15- to 17-year-olds, while children 5-14 years of age were less likely to be readmitted (Table 2). Medical complexity and the number of chronic conditions had the greatest association with readmissions, with increased likelihood of readmission observed as the number of chronic conditions increased. Weekend discharge was associated with increased probability of readmission compared with weekday discharge (adjusted probability of readmission [95% CI]: weekend 0.13 [0.12-0.13] vs weekday 0.11 [0.11-0.12], P < .001).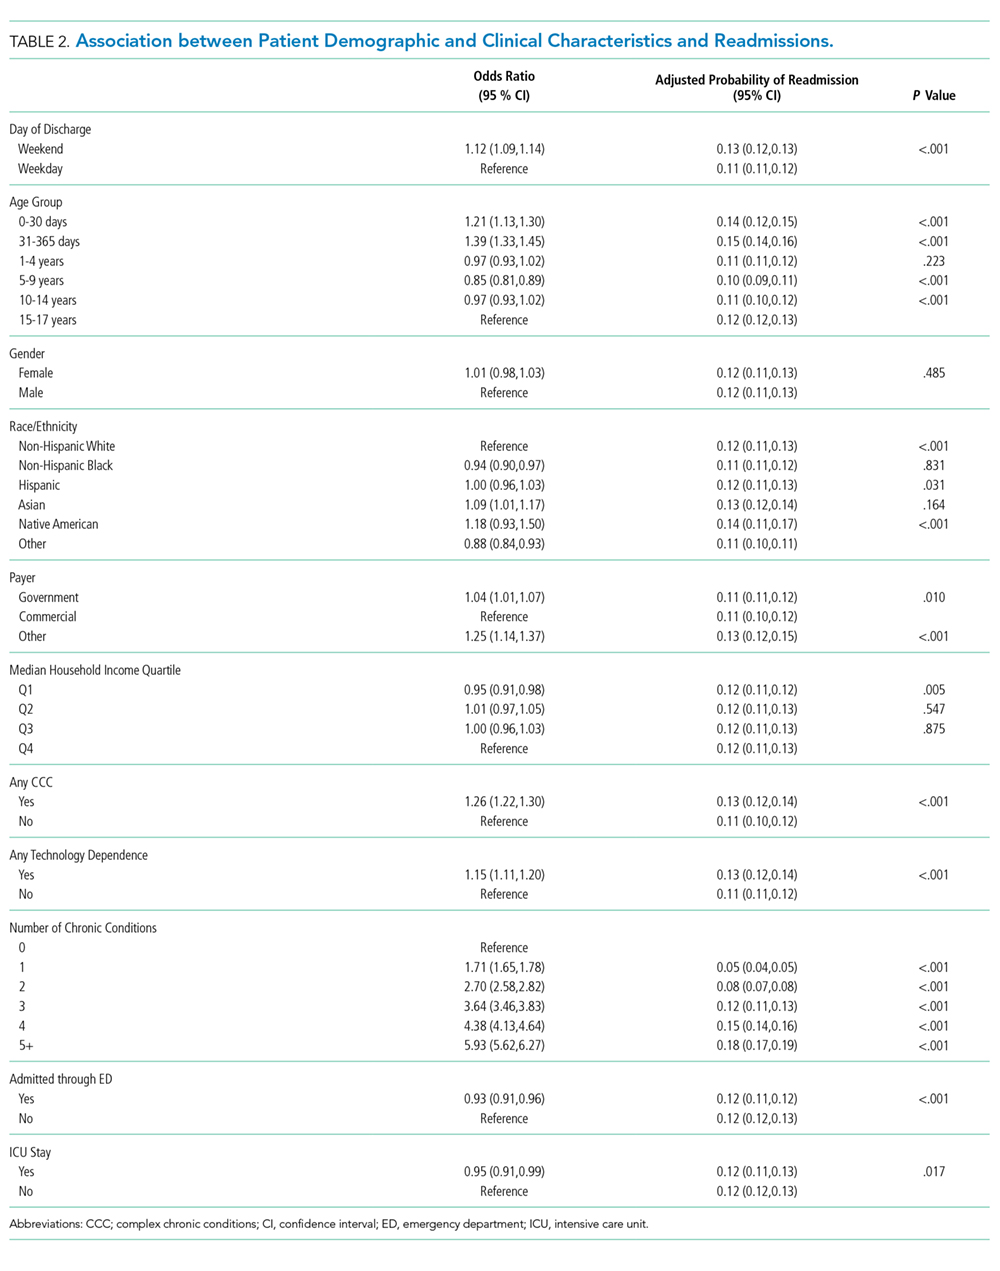
DISCUSSION
While the reasons for the weekend effect are unclear, data supporting this difference have been observed across many diverse patient groups and health systems both nationally and internationally.13-27,31 Weekend care is thought to differ from weekday care because of differences in physician and nurse staffing, availability of ancillary services, access to diagnostic testing and therapeutic interventions, ability to arrange outpatient follow-up, and individual patient clinical factors, including acuity of illness. Few studies have assessed the effect of weekend discharges on patient or system outcomes. Among children within a single health system, readmission risk was associated with weekend admission but not with weekend discharge.22 This observation suggests that if differential care exists, then it occurs during initial clinical management rather than during discharge planning. Consequently, understanding the interaction of weekend admission and LOS is important. In addition, the relative paucity of pediatric data examining a weekend discharge effect limits the ability to generalize these findings across other hospitals or health systems.
In contrast to prior work, we observed a modest increased risk for readmission among those discharged on the weekend in a large sample of children. Auger and Davis reported a lack of association between weekend discharge and readmissions at one tertiary care children’s hospital, citing reduced discharge volumes on the weekend, especially among children with medical complexity, as a possible driver for their observation.22 The inclusion of a much larger population across 43 hospitals in our study may explain our different findings compared with previous research. In addition, the inclusion/exclusion criteria differed between the two studies; we excluded index admissions for planned procedures in this study (which are more likely to occur during the week), which may have contributed to the differing conclusions. Although Auger and Davis suggest that differences in initial clinical management may be responsible for the weekend effect,22 our observations suggest that discharge planning practices may also contribute to readmission risk. For example, a family’s inability to access compounded medications at a local pharmacy or to access primary care following discharge could reasonably contribute to treatment failure and increased readmission risk. Attention to improving and standardizing discharge practices may alleviate differences in readmission risk among children discharged on a weekend.
Individual patient characteristics greatly influence LOS and readmission risk. Congruent with prior studies, medical complexity and technology dependence were among the factors in our study that had the strongest association with LOS and readmission risk.32 As with prior studies22, we observed that children with medical complexity and technology dependence were less frequently admitted and discharged on a weekend than on a weekday, which suggests that physicians may avoid complicated discharges on the weekend. Children with medical complexity present a unique challenge to physicians when assessing discharge readiness, given that these children frequently require careful coordination of durable medical equipment, obtainment of special medication preparations, and possibly the resumption or establishment of home health services. Notably, we cannot discern from our data what proportion of discharges may be delayed over the weekend secondary to challenges involved in coordinating care for children with medical complexity. Future investigations aimed at assessing physician decision making and discharge readiness in relation to discharge timing among children with medical complexity may establish this relationship more clearly.
We observed substantial variation in LOS and readmission risk across 43 tertiary care children’s hospitals. Since the 1970s, numerous studies have reported worse outcomes among patients admitted on the weekend. While the majority of studies support the weekend effect, several recent studies suggest that patients admitted on the weekend are at no greater risk of adverse outcomes than those admitted during the week.35-37 Our work builds on the existing literature, demonstrating a complex and variable relationship between weekend admission/discharge, LOS, and readmission risk across hospitals. Notably, while many hospitals in our study experienced a significant weekend effect in LOS or readmission risk, only four hospitals experienced a statistically significant weekend effect for both LOS and readmission risk (three hospitals experienced increased risk for both, while one hospital experienced increased readmission risk but decreased LOS). Future investigations of the weekend effect should focus on exploring the differences in admission/discharge practices and staffing patterns of hospitals that did or did not experience a weekend effect.
This study has several limitations
CONCLUSION
In a study of 43 children’s hospitals, children discharged on the weekend had a slightly increased readmission risk compared with children discharged on a weekday. Wide variation in the weekend effect on LOS and readmission risk was evident across hospitals. Individual patient characteristics had a greater impact on LOS and readmission risk than the weekend effect. Future investigations aimed at understanding which factors contribute most strongly to a weekend effect within individual hospitals (eg, differences in institutional admission/discharge practices) may help alleviate the weekend effect and improve healthcare quality.
Acknowledgments
This manuscript resulted from “Paper in a Day,” a Pediatric Research in Inpatient Settings (PRIS) Network-sponsored workshop presented at the Pediatric Hospital Medicine 2017 annual meeting. Workshop participants learned how to ask and answer a health services research question and efficiently prepare a manuscript for publication. The following are the members of the PRIS Network who contributed to this work: Jessica L. Bettenhausen, MD; Rebecca M. Cantu, MD, MPH; Jillian M Cotter, MD; Megan Deisz, MD; Teresa Frazer, MD; Pratichi Goenka, MD; Ashley Jenkins, MD; Kathryn E. Kyler, MD; Janet T. Lau, MD; Brian E. Lee, MD; Christiane Lenzen, MD; Trisha Marshall, MD; John M. Morrison MD, PhD; Lauren Nassetta, MD; Raymond Parlar-Chun, MD; Sonya Tang Girdwood MD, PhD; Tony R Tarchichi, MD; Irina G. Trifonova, MD; Jacqueline M. Walker, MD, MHPE; and Susan C. Walley, MD. See appendix for contact information for members of the PRIS Network
Funding
The authors have no financial relationships relevant to this article to disclose.
Disclosures
The authors have no conflicts of interest to disclose.
1. Crossing the Quality Chasm: The IOM Health Care Quality Initiative : Health and Medicine Division. http://www.nationalacademies.org/hmd/Global/News%20Announcements/Crossing-the-Quality-Chasm-The-IOM-Health-Care-Quality-Initiative.aspx. Accessed November 20, 2017.
2. Institute for Healthcare Improvement: IHI Home Page. http://www.ihi.org:80/Pages/default.aspx. Accessed November 20, 2017.
3. Berry JG, Zaslavsky AM, Toomey SL, et al. Recognizing differences in hospital quality performance for pediatric inpatient care. Pediatrics. 2015;136(2):251-262. doi:10.1542/peds.2014-3131
4. NQF: All-Cause Admissions and Readmissions Measures - Final Report. http://www.qualityforum.org/Publications/2015/04/All-Cause_Admissions_and_Readmissions_Measures_-_Final_Report.aspx. Accessed March 24, 2018.
5. Hospital Inpatient Potentially Preventable Readmissions Information and Reports. https://www.illinois.gov/hfs/MedicalProviders/hospitals/PPRReports/Pages/default.aspx. Accessed November 6, 2016.
6. Potentially Preventable Readmissions in Texas Medicaid and CHIP Programs - Fiscal Year 2013 | Texas Health and Human Services. https://hhs.texas.gov/reports/2016/08/potentially-preventable-readmissions-texas-medicaid-and-chip-programs-fiscal-year. Accessed November 6, 2016.
7. Statewide Planning and Research Cooperative System. http://www.health.ny.gov/statistics/sparcs/sb/. Accessed November 6, 2016.
8. HCA Implements Potentially Preventable Readmission (PPR) Adjustments. Wash State Hosp Assoc. http://www.wsha.org/articles/hca-implements-potentially-preventable-readmission-ppr-adjustments/. Accessed November 8, 2016.
9. Berry JG, Toomey SL, Zaslavsky AM, et al. Pediatric readmission prevalence and variability across hospitals. JAMA. 2013;309(4):372-380. doi:10.1001/jama.2012.188351 PubMed
10. Bardach NS, Vittinghoff E, Asteria-Peñaloza R, et al. Measuring hospital quality using pediatric readmission and revisit rates. Pediatrics. 2013;132(3):429-436. doi:10.1542/peds.2012-3527 PubMed
11. Berry JG, Blaine K, Rogers J, et al. A framework of pediatric hospital discharge care informed by legislation, research, and practice. JAMA Pediatr. 2014;168(10):955-962; quiz 965-966. doi:10.1001/jamapediatrics.2014.891 PubMed
12. Auger KA, Simon TD, Cooperberg D, et al. Summary of STARNet: seamless transitions and (Re)admissions network. Pediatrics. 2015;135(1):164. doi:10.1542/peds.2014-1887 PubMed
13. Freemantle N, Ray D, McNulty D, et al. Increased mortality associated with weekend hospital admission: a case for expanded seven day services? BMJ. 2015;351:h4596. doi:10.1136/bmj.h4596 PubMed
14. Schilling PL, Campbell DA, Englesbe MJ, Davis MM. A comparison of in-hospital mortality risk conferred by high hospital occupancy, differences in nurse staffing levels, weekend admission, and seasonal influenza. Med Care. 2010;48(3):224-232. doi:10.1097/MLR.0b013e3181c162c0 PubMed
15. Cram P, Hillis SL, Barnett M, Rosenthal GE. Effects of weekend admission and hospital teaching status on in-hospital mortality. Am J Med. 2004;117(3):151-157. doi:10.1016/j.amjmed.2004.02.035 PubMed
16. Zapf MAC, Kothari AN, Markossian T, et al. The “weekend effect” in urgent general operative procedures. Surgery. 2015;158(2):508-514. doi:10.1016/j.surg.2015.02.024 PubMed
17. Freemantle N, Richardson M, Wood J, et al. Weekend hospitalization and additional risk of death: an analysis of inpatient data. J R Soc Med. 2012;105(2):74-84. doi:10.1258/jrsm.2012.120009 PubMed
18. Bell CM, Redelmeier DA. Mortality among patients admitted to hospitals on weekends as compared with weekdays. N Engl J Med. 2001;345(9):663-668. doi:10.1056/NEJMsa003376 PubMed
19. Coiera E, Wang Y, Magrabi F, Concha OP, Gallego B, Runciman W. Predicting the cumulative risk of death during hospitalization by modeling weekend, weekday and diurnal mortality risks. BMC Health Serv Res. 2014;14:226. doi:10.1186/1472-6963-14-226 PubMed
20. Powell ES, Khare RK, Courtney DM, Feinglass J. The weekend effect for patients with sepsis presenting to the emergency department. J Emerg Med. 2013;45(5):641-648. doi:10.1016/j.jemermed.2013.04.042 PubMed
21. Ananthakrishnan AN, McGinley EL, Saeian K. Outcomes of weekend admissions for upper gastrointestinal hemorrhage: a nationwide analysis. Clin Gastroenterol Hepatol Off Clin Pract J Am Gastroenterol Assoc. 2009;7(3):296-302e1. doi:10.1016/j.cgh.2008.08.013 PubMed
22. Auger KA, Davis MM. Pediatric weekend admission and increased unplanned readmission rates. J Hosp Med. 2015;10(11):743-745. doi:10.1002/jhm.2426 PubMed
23. Goldstein SD, Papandria DJ, Aboagye J, et al. The “weekend effect” in pediatric surgery - increased mortality for children undergoing urgent surgery during the weekend. J Pediatr Surg. 2014;49(7):1087-1091. doi:10.1016/j.jpedsurg.2014.01.001 PubMed
24. Adil MM, Vidal G, Beslow LA. Weekend effect in children with stroke in the nationwide inpatient sample. Stroke. 2016;47(6):1436-1443. doi:10.1161/STROKEAHA.116.013453 PubMed
25. McCrory MC, Spaeder MC, Gower EW, et al. Time of admission to the PICU and mortality. Pediatr Crit Care Med J Soc Crit Care Med World Fed Pediatr Intensive Crit Care Soc. 2017;18(10):915-923. doi:10.1097/PCC.0000000000001268 PubMed
26. Mangold WD. Neonatal mortality by the day of the week in the 1974-75 Arkansas live birth cohort. Am J Public Health. 1981;71(6):601-605. PubMed
27. MacFarlane A. Variations in number of births and perinatal mortality by day of week in England and Wales. Br Med J. 1978;2(6153):1670-1673. PubMed
28. McShane P, Draper ES, McKinney PA, McFadzean J, Parslow RC, Paediatric intensive care audit network (PICANet). Effects of out-of-hours and winter admissions and number of patients per unit on mortality in pediatric intensive care. J Pediatr. 2013;163(4):1039-1044.e5. doi:10.1016/j.jpeds.2013.03.061 PubMed
29. Hixson ED, Davis S, Morris S, Harrison AM. Do weekends or evenings matter in a pediatric intensive care unit? Pediatr Crit Care Med J Soc Crit Care Med World Fed Pediatr Intensive Crit Care Soc. 2005;6(5):523-530. PubMed
30. Gonzalez KW, Dalton BGA, Weaver KL, Sherman AK, St Peter SD, Snyder CL. Effect of timing of cannulation on outcome for pediatric extracorporeal life support. Pediatr Surg Int. 2016;32(7):665-669. doi:10.1007/s00383-016-3901-6 PubMed
31. Desai V, Gonda D, Ryan SL, et al. The effect of weekend and after-hours surgery on morbidity and mortality rates in pediatric neurosurgery patients. J Neurosurg Pediatr. 2015;16(6):726-731. doi:10.3171/2015.6.PEDS15184 PubMed
32. Berry JG, Hall DE, Kuo DZ, et al. Hospital utilization and characteristics of patients experiencing recurrent readmissions within children’s hospitals. JAMA. 2011;305(7):682-690. doi:10.1001/jama.2011.122 PubMed
33. Hoshijima H, Takeuchi R, Mihara T, et al. Weekend versus weekday admission and short-term mortality: A meta-analysis of 88 cohort studies including 56,934,649 participants. Medicine (Baltimore). 2017;96(17):e6685. doi:10.1097/MD.0000000000006685 PubMed
34. Feudtner C, Feinstein JA, Zhong W, Hall M, Dai D. Pediatric complex chronic conditions classification system version 2: updated for ICD-10 and complex medical technology dependence and transplantation. BMC Pediatr. 2014;14:199. doi:10.1186/1471-2431-14-199 PubMed
35. Li L, Rothwell PM, Oxford Vascular Study. Biases in detection of apparent “weekend effect” on outcome with administrative coding data: population based study of stroke. BMJ. 2016;353:i2648. doi: https://doi.org/10.1136/bmj.i2648 PubMed
36. Bray BD, Cloud GC, James MA, et al. Weekly variation in health-care quality by day and time of admission: a nationwide, registry-based, prospective cohort study of acute stroke care. The Lancet. 2016;388(10040):170-177. doi:10.1016/S0140-6736(16)30443-3 PubMed
37. Ko SQ, Strom JB, Shen C, Yeh RW. Mortality, Length of Stay, and Cost of Weekend Admissions. J Hosp Med. 2018. doi:10.12788/jhm.2906 PubMed
38. Tubbs-Cooley HL, Cimiotti JP, Silber JH, Sloane DM, Aiken LH. An observational study of nurse staffing ratios and hospital readmission among children admitted for common conditions. BMJ Qual Saf. 2013;22(9):735-742. doi:10.1136/bmjqs-2012-001610 PubMed
39. Ong M, Bostrom A, Vidyarthi A, McCulloch C, Auerbach A. House staff team workload and organization effects on patient outcomes in an academic general internal medicine inpatient service. Arch Intern Med. 2007;167(1):47-52. doi:10.1001/archinte.167.1.47 PubMed
Increasingly, metrics such as length of stay (LOS) and readmissions are being utilized in the United States to assess quality of healthcare because these factors may represent opportunities to reduce cost and improve healthcare delivery.1-8 However, the relatively low rate of pediatric readmissions,9 coupled with limited data regarding recommended LOS or best practices to prevent readmissions in children, challenges the ability of hospitals to safely reduce LOS and readmission rates for children.10–12
In adults, weekend admission is associated with prolonged LOS, increased readmission rates, and increased risk of mortality.13-21 This association is referred to as the “weekend effect.” While the weekend effect has been examined in children, the results of these studies have been variable, with some studies supporting this association and others refuting it.22-31 In contrast to patient demographic and clinical characteristics that are known to affect LOS and readmissions,32 the weekend effect represents a potentially modifiable aspect of a hospitalization that could be targeted to improve healthcare delivery.
With increasing national attention toward improving quality of care and reducing LOS and healthcare costs, more definitive evidence of the weekend effect is necessary to prioritize resource use at both the local and national levels. Therefore, we sought to determine the association of weekend admission and weekend discharge on LOS and 30-day readmissions, respectively, among a national cohort of children. We hypothesized that children admitted on the weekend would have longer LOS, whereas those discharged on the weekend would have higher readmission rates.
METHODS
Study Design and Data Source
We conducted a multicenter, retrospective, cross-sectional study. Data were obtained from the Pediatric Health Information System (PHIS), an administrative and billing database of 46 free-standing tertiary care pediatric hospitals affiliated with the Children’s Hospital Association (Lenexa, Kansas). Patient data are de-identified within PHIS; however, encrypted patient identifiers allow individual patients to be followed across visits. This study was not considered human subjects research by the policies of the Cincinnati Children’s Hospital Institutional Review Board.
Participants
We included hospitalizations to a PHIS-participating hospital for children aged 0-17 years between October 1, 2014 and September 30, 2015. We excluded children who were transferred from/to another institution, left against medical advice, or died in the hospital because these indications may result in incomplete LOS information and would not consistently contribute to readmission rates. We also excluded birth hospitalizations and children admitted for planned procedures. Birth hospitalizations were defined as hospitalizations that began on the day of birth.
Main Exposures
No standard definition of weekend admission or discharge was identified in the literature.33 Thus, we defined a weekend admission as an admission between 3:00
Main Outcomes
Our outcomes included LOS for weekend admission and 30-day readmissions for weekend discharge. LOS, measured in hours, was defined using the reported admission and discharge times. Readmissions were defined as a return to the same hospital within the subsequent 30 days following discharge.
Patient Demographics and Other Study Variables
Patient demographics included age, gender, race/ethnicity, payer, and median household income quartile based on the patient’s home ZIP code. Other study variables included presence of a complex chronic condition (CCC),34 technology dependence,34 number of chronic conditions of any complexity, admission through the emergency department, intensive care unit (ICU) admission, and case mix index. ICU admission and case mix index were chosen as markers for severity of illness. ICU admission was defined as any child who incurred ICU charges at any time following admission. Case mix index in PHIS is a relative weight assigned to each discharge based on the All-Patient Refined Diagnostic Group (APR-DRG; 3M) assignment and APR-DRG severity of illness, which ranges from 1 (minor) to 4 (extreme). The weights are derived by the Children’s Hospital Association from the HCUP KID 2012 database as the ratio of the average cost for discharges within a specific APR-DRG severity of illness combination to the average cost for all discharges in the database.
Statistical Analysis
Continuous variables were summarized with medians and interquartile ranges, while categorical variables were summarized with frequencies and percentages. Differences in admission and discharge characteristics between weekend and weekday were assessed using Wilcoxon rank sum tests for continuous variables and chi-square tests of association for categorical variables. We used generalized linear mixed modeling (GLMM) techniques to assess the impact of weekend admission on LOS and weekend discharge on readmission, adjusting for important patient demographic and clinical characteristics. Furthermore, we used GLMM point estimates to describe the variation across hospitals of the impact of weekday versus weekend care on LOS and readmissions. We assumed an underlying log-normal distribution for LOS and an underlying binomial distribution for 30-day readmission. All GLMMs included a random intercept for each hospital to account for patient clustering within a hospital. All statistical analyses were performed using SAS v.9.4 (SAS Institute, Cary, North Carolina), and P values <.05 were considered statistically significant.
RESULTS
We identified 390,745 hospitalizations that met inclusion criteria (Supplementary Figure 1). The median LOS among our cohort was 41 hours (interquartile range [IQR] 24-71) and the median 30-day readmission rate was 8.2% (IQR 7.2-9.4).
Admission Demographics for Weekends and Weekdays
Among the included hospitalizations, 92,266 (23.6%) admissions occurred on a weekend (Supplementary Table 1). Overall, a higher percentage of children <5 years of age were admitted on a weekend compared with those admitted on a weekday (53.3% vs 49.1%, P < .001). We observed a small but statistically significant difference in the proportion of weekend versus weekday admissions according to gender, race/ethnicity, payer, and median household income quartile. Children with medical complexity and those with technology dependence were admitted less frequently on a weekend. A higher proportion of children were admitted through the emergency department on a weekend and a higher frequency of ICU utilization was observed for children admitted on a weekend compared with those admitted on a weekday.
Association Between Study Variables and Length of Stay
In comparing adjusted LOS for weekend versus weekday admissions across 43 hospitals, not only did LOS vary across hospitals (P < .001), but the association between LOS and weekend versus weekday care also varied across hospitals (P < .001) (Figure 1). Weekend admission was associated with a significantly longer LOS at eight (18.6%) hospitals and a significantly shorter LOS at four (9.3%) hospitals with nonstatistically significant differences at the remaining hospitals.
In adjusted analyses, we observed that infants ≤30 days of age, on average, had an adjusted LOS that was 24% longer than that of 15- to 17-year-olds, while children aged 1-14 years had an adjusted LOS that was 6%-18% shorter (Table 1). ICU utilization, admission through the emergency department, and number of chronic conditions had the greatest association with LOS. As the number of chronic conditions increased, the LOS increased. No association was found between weekend versus weekday admission and LOS (adjusted LOS [95% CI]: weekend 63.70 [61.01-66.52] hours versus weekday 63.40 [60.73-66.19] hours, P = .112).
Discharge Demographics for Weekends and Weekdays
Of the included hospitalizations, 127,421 (32.6%) discharges occurred on a weekend (Supplementary Table 2). Overall, a greater percentage of weekend discharges comprised children <5 years of age compared with the percentage of weekday discharges for children <5 years of age (51.5% vs 49.5%, P < .001). No statistically significant differences were found in gender, payer, or median household income quartile between those children discharged on a weekend versus those discharged on a weekday. We found small, statistically significant differences in the proportion of weekend versus weekday discharges according to race/ethnicity, with fewer non-Hispanic white children being discharged on the weekend versus weekday. Children with medical complexity, technology dependence, and patients with ICU utilization were less frequently discharged on a weekend compared with those discharged on a weekday.
Association Between Study Variables and Readmissions
In comparing the adjusted odds of readmissions for weekend versus weekday discharges across 43 PHIS hospitals, we observed significant variation (P < .001) in readmission rates from hospital to hospital (Figure 2). However, the direction of impact of weekend care on readmissions was similar (P = .314) across hospitals (ie, for 37 of 43 hospitals, the readmission rate was greater for weekend discharges compared with that for weekday discharges). For 17 (39.5%) of 43 hospitals, weekend discharge was associated with a significantly higher readmission rate, while the differences between weekday and weekend discharge were not statistically significant for the remaining hospitals.
In adjusted analyses, we observed that infants <1 year were more likely to be readmitted compared with 15- to 17-year-olds, while children 5-14 years of age were less likely to be readmitted (Table 2). Medical complexity and the number of chronic conditions had the greatest association with readmissions, with increased likelihood of readmission observed as the number of chronic conditions increased. Weekend discharge was associated with increased probability of readmission compared with weekday discharge (adjusted probability of readmission [95% CI]: weekend 0.13 [0.12-0.13] vs weekday 0.11 [0.11-0.12], P < .001).
DISCUSSION
While the reasons for the weekend effect are unclear, data supporting this difference have been observed across many diverse patient groups and health systems both nationally and internationally.13-27,31 Weekend care is thought to differ from weekday care because of differences in physician and nurse staffing, availability of ancillary services, access to diagnostic testing and therapeutic interventions, ability to arrange outpatient follow-up, and individual patient clinical factors, including acuity of illness. Few studies have assessed the effect of weekend discharges on patient or system outcomes. Among children within a single health system, readmission risk was associated with weekend admission but not with weekend discharge.22 This observation suggests that if differential care exists, then it occurs during initial clinical management rather than during discharge planning. Consequently, understanding the interaction of weekend admission and LOS is important. In addition, the relative paucity of pediatric data examining a weekend discharge effect limits the ability to generalize these findings across other hospitals or health systems.
In contrast to prior work, we observed a modest increased risk for readmission among those discharged on the weekend in a large sample of children. Auger and Davis reported a lack of association between weekend discharge and readmissions at one tertiary care children’s hospital, citing reduced discharge volumes on the weekend, especially among children with medical complexity, as a possible driver for their observation.22 The inclusion of a much larger population across 43 hospitals in our study may explain our different findings compared with previous research. In addition, the inclusion/exclusion criteria differed between the two studies; we excluded index admissions for planned procedures in this study (which are more likely to occur during the week), which may have contributed to the differing conclusions. Although Auger and Davis suggest that differences in initial clinical management may be responsible for the weekend effect,22 our observations suggest that discharge planning practices may also contribute to readmission risk. For example, a family’s inability to access compounded medications at a local pharmacy or to access primary care following discharge could reasonably contribute to treatment failure and increased readmission risk. Attention to improving and standardizing discharge practices may alleviate differences in readmission risk among children discharged on a weekend.
Individual patient characteristics greatly influence LOS and readmission risk. Congruent with prior studies, medical complexity and technology dependence were among the factors in our study that had the strongest association with LOS and readmission risk.32 As with prior studies22, we observed that children with medical complexity and technology dependence were less frequently admitted and discharged on a weekend than on a weekday, which suggests that physicians may avoid complicated discharges on the weekend. Children with medical complexity present a unique challenge to physicians when assessing discharge readiness, given that these children frequently require careful coordination of durable medical equipment, obtainment of special medication preparations, and possibly the resumption or establishment of home health services. Notably, we cannot discern from our data what proportion of discharges may be delayed over the weekend secondary to challenges involved in coordinating care for children with medical complexity. Future investigations aimed at assessing physician decision making and discharge readiness in relation to discharge timing among children with medical complexity may establish this relationship more clearly.
We observed substantial variation in LOS and readmission risk across 43 tertiary care children’s hospitals. Since the 1970s, numerous studies have reported worse outcomes among patients admitted on the weekend. While the majority of studies support the weekend effect, several recent studies suggest that patients admitted on the weekend are at no greater risk of adverse outcomes than those admitted during the week.35-37 Our work builds on the existing literature, demonstrating a complex and variable relationship between weekend admission/discharge, LOS, and readmission risk across hospitals. Notably, while many hospitals in our study experienced a significant weekend effect in LOS or readmission risk, only four hospitals experienced a statistically significant weekend effect for both LOS and readmission risk (three hospitals experienced increased risk for both, while one hospital experienced increased readmission risk but decreased LOS). Future investigations of the weekend effect should focus on exploring the differences in admission/discharge practices and staffing patterns of hospitals that did or did not experience a weekend effect.
This study has several limitations
CONCLUSION
In a study of 43 children’s hospitals, children discharged on the weekend had a slightly increased readmission risk compared with children discharged on a weekday. Wide variation in the weekend effect on LOS and readmission risk was evident across hospitals. Individual patient characteristics had a greater impact on LOS and readmission risk than the weekend effect. Future investigations aimed at understanding which factors contribute most strongly to a weekend effect within individual hospitals (eg, differences in institutional admission/discharge practices) may help alleviate the weekend effect and improve healthcare quality.
Acknowledgments
This manuscript resulted from “Paper in a Day,” a Pediatric Research in Inpatient Settings (PRIS) Network-sponsored workshop presented at the Pediatric Hospital Medicine 2017 annual meeting. Workshop participants learned how to ask and answer a health services research question and efficiently prepare a manuscript for publication. The following are the members of the PRIS Network who contributed to this work: Jessica L. Bettenhausen, MD; Rebecca M. Cantu, MD, MPH; Jillian M Cotter, MD; Megan Deisz, MD; Teresa Frazer, MD; Pratichi Goenka, MD; Ashley Jenkins, MD; Kathryn E. Kyler, MD; Janet T. Lau, MD; Brian E. Lee, MD; Christiane Lenzen, MD; Trisha Marshall, MD; John M. Morrison MD, PhD; Lauren Nassetta, MD; Raymond Parlar-Chun, MD; Sonya Tang Girdwood MD, PhD; Tony R Tarchichi, MD; Irina G. Trifonova, MD; Jacqueline M. Walker, MD, MHPE; and Susan C. Walley, MD. See appendix for contact information for members of the PRIS Network
Funding
The authors have no financial relationships relevant to this article to disclose.
Disclosures
The authors have no conflicts of interest to disclose.
1. Crossing the Quality Chasm: The IOM Health Care Quality Initiative : Health and Medicine Division. http://www.nationalacademies.org/hmd/Global/News%20Announcements/Crossing-the-Quality-Chasm-The-IOM-Health-Care-Quality-Initiative.aspx. Accessed November 20, 2017.
2. Institute for Healthcare Improvement: IHI Home Page. http://www.ihi.org:80/Pages/default.aspx. Accessed November 20, 2017.
3. Berry JG, Zaslavsky AM, Toomey SL, et al. Recognizing differences in hospital quality performance for pediatric inpatient care. Pediatrics. 2015;136(2):251-262. doi:10.1542/peds.2014-3131
4. NQF: All-Cause Admissions and Readmissions Measures - Final Report. http://www.qualityforum.org/Publications/2015/04/All-Cause_Admissions_and_Readmissions_Measures_-_Final_Report.aspx. Accessed March 24, 2018.
5. Hospital Inpatient Potentially Preventable Readmissions Information and Reports. https://www.illinois.gov/hfs/MedicalProviders/hospitals/PPRReports/Pages/default.aspx. Accessed November 6, 2016.
6. Potentially Preventable Readmissions in Texas Medicaid and CHIP Programs - Fiscal Year 2013 | Texas Health and Human Services. https://hhs.texas.gov/reports/2016/08/potentially-preventable-readmissions-texas-medicaid-and-chip-programs-fiscal-year. Accessed November 6, 2016.
7. Statewide Planning and Research Cooperative System. http://www.health.ny.gov/statistics/sparcs/sb/. Accessed November 6, 2016.
8. HCA Implements Potentially Preventable Readmission (PPR) Adjustments. Wash State Hosp Assoc. http://www.wsha.org/articles/hca-implements-potentially-preventable-readmission-ppr-adjustments/. Accessed November 8, 2016.
9. Berry JG, Toomey SL, Zaslavsky AM, et al. Pediatric readmission prevalence and variability across hospitals. JAMA. 2013;309(4):372-380. doi:10.1001/jama.2012.188351 PubMed
10. Bardach NS, Vittinghoff E, Asteria-Peñaloza R, et al. Measuring hospital quality using pediatric readmission and revisit rates. Pediatrics. 2013;132(3):429-436. doi:10.1542/peds.2012-3527 PubMed
11. Berry JG, Blaine K, Rogers J, et al. A framework of pediatric hospital discharge care informed by legislation, research, and practice. JAMA Pediatr. 2014;168(10):955-962; quiz 965-966. doi:10.1001/jamapediatrics.2014.891 PubMed
12. Auger KA, Simon TD, Cooperberg D, et al. Summary of STARNet: seamless transitions and (Re)admissions network. Pediatrics. 2015;135(1):164. doi:10.1542/peds.2014-1887 PubMed
13. Freemantle N, Ray D, McNulty D, et al. Increased mortality associated with weekend hospital admission: a case for expanded seven day services? BMJ. 2015;351:h4596. doi:10.1136/bmj.h4596 PubMed
14. Schilling PL, Campbell DA, Englesbe MJ, Davis MM. A comparison of in-hospital mortality risk conferred by high hospital occupancy, differences in nurse staffing levels, weekend admission, and seasonal influenza. Med Care. 2010;48(3):224-232. doi:10.1097/MLR.0b013e3181c162c0 PubMed
15. Cram P, Hillis SL, Barnett M, Rosenthal GE. Effects of weekend admission and hospital teaching status on in-hospital mortality. Am J Med. 2004;117(3):151-157. doi:10.1016/j.amjmed.2004.02.035 PubMed
16. Zapf MAC, Kothari AN, Markossian T, et al. The “weekend effect” in urgent general operative procedures. Surgery. 2015;158(2):508-514. doi:10.1016/j.surg.2015.02.024 PubMed
17. Freemantle N, Richardson M, Wood J, et al. Weekend hospitalization and additional risk of death: an analysis of inpatient data. J R Soc Med. 2012;105(2):74-84. doi:10.1258/jrsm.2012.120009 PubMed
18. Bell CM, Redelmeier DA. Mortality among patients admitted to hospitals on weekends as compared with weekdays. N Engl J Med. 2001;345(9):663-668. doi:10.1056/NEJMsa003376 PubMed
19. Coiera E, Wang Y, Magrabi F, Concha OP, Gallego B, Runciman W. Predicting the cumulative risk of death during hospitalization by modeling weekend, weekday and diurnal mortality risks. BMC Health Serv Res. 2014;14:226. doi:10.1186/1472-6963-14-226 PubMed
20. Powell ES, Khare RK, Courtney DM, Feinglass J. The weekend effect for patients with sepsis presenting to the emergency department. J Emerg Med. 2013;45(5):641-648. doi:10.1016/j.jemermed.2013.04.042 PubMed
21. Ananthakrishnan AN, McGinley EL, Saeian K. Outcomes of weekend admissions for upper gastrointestinal hemorrhage: a nationwide analysis. Clin Gastroenterol Hepatol Off Clin Pract J Am Gastroenterol Assoc. 2009;7(3):296-302e1. doi:10.1016/j.cgh.2008.08.013 PubMed
22. Auger KA, Davis MM. Pediatric weekend admission and increased unplanned readmission rates. J Hosp Med. 2015;10(11):743-745. doi:10.1002/jhm.2426 PubMed
23. Goldstein SD, Papandria DJ, Aboagye J, et al. The “weekend effect” in pediatric surgery - increased mortality for children undergoing urgent surgery during the weekend. J Pediatr Surg. 2014;49(7):1087-1091. doi:10.1016/j.jpedsurg.2014.01.001 PubMed
24. Adil MM, Vidal G, Beslow LA. Weekend effect in children with stroke in the nationwide inpatient sample. Stroke. 2016;47(6):1436-1443. doi:10.1161/STROKEAHA.116.013453 PubMed
25. McCrory MC, Spaeder MC, Gower EW, et al. Time of admission to the PICU and mortality. Pediatr Crit Care Med J Soc Crit Care Med World Fed Pediatr Intensive Crit Care Soc. 2017;18(10):915-923. doi:10.1097/PCC.0000000000001268 PubMed
26. Mangold WD. Neonatal mortality by the day of the week in the 1974-75 Arkansas live birth cohort. Am J Public Health. 1981;71(6):601-605. PubMed
27. MacFarlane A. Variations in number of births and perinatal mortality by day of week in England and Wales. Br Med J. 1978;2(6153):1670-1673. PubMed
28. McShane P, Draper ES, McKinney PA, McFadzean J, Parslow RC, Paediatric intensive care audit network (PICANet). Effects of out-of-hours and winter admissions and number of patients per unit on mortality in pediatric intensive care. J Pediatr. 2013;163(4):1039-1044.e5. doi:10.1016/j.jpeds.2013.03.061 PubMed
29. Hixson ED, Davis S, Morris S, Harrison AM. Do weekends or evenings matter in a pediatric intensive care unit? Pediatr Crit Care Med J Soc Crit Care Med World Fed Pediatr Intensive Crit Care Soc. 2005;6(5):523-530. PubMed
30. Gonzalez KW, Dalton BGA, Weaver KL, Sherman AK, St Peter SD, Snyder CL. Effect of timing of cannulation on outcome for pediatric extracorporeal life support. Pediatr Surg Int. 2016;32(7):665-669. doi:10.1007/s00383-016-3901-6 PubMed
31. Desai V, Gonda D, Ryan SL, et al. The effect of weekend and after-hours surgery on morbidity and mortality rates in pediatric neurosurgery patients. J Neurosurg Pediatr. 2015;16(6):726-731. doi:10.3171/2015.6.PEDS15184 PubMed
32. Berry JG, Hall DE, Kuo DZ, et al. Hospital utilization and characteristics of patients experiencing recurrent readmissions within children’s hospitals. JAMA. 2011;305(7):682-690. doi:10.1001/jama.2011.122 PubMed
33. Hoshijima H, Takeuchi R, Mihara T, et al. Weekend versus weekday admission and short-term mortality: A meta-analysis of 88 cohort studies including 56,934,649 participants. Medicine (Baltimore). 2017;96(17):e6685. doi:10.1097/MD.0000000000006685 PubMed
34. Feudtner C, Feinstein JA, Zhong W, Hall M, Dai D. Pediatric complex chronic conditions classification system version 2: updated for ICD-10 and complex medical technology dependence and transplantation. BMC Pediatr. 2014;14:199. doi:10.1186/1471-2431-14-199 PubMed
35. Li L, Rothwell PM, Oxford Vascular Study. Biases in detection of apparent “weekend effect” on outcome with administrative coding data: population based study of stroke. BMJ. 2016;353:i2648. doi: https://doi.org/10.1136/bmj.i2648 PubMed
36. Bray BD, Cloud GC, James MA, et al. Weekly variation in health-care quality by day and time of admission: a nationwide, registry-based, prospective cohort study of acute stroke care. The Lancet. 2016;388(10040):170-177. doi:10.1016/S0140-6736(16)30443-3 PubMed
37. Ko SQ, Strom JB, Shen C, Yeh RW. Mortality, Length of Stay, and Cost of Weekend Admissions. J Hosp Med. 2018. doi:10.12788/jhm.2906 PubMed
38. Tubbs-Cooley HL, Cimiotti JP, Silber JH, Sloane DM, Aiken LH. An observational study of nurse staffing ratios and hospital readmission among children admitted for common conditions. BMJ Qual Saf. 2013;22(9):735-742. doi:10.1136/bmjqs-2012-001610 PubMed
39. Ong M, Bostrom A, Vidyarthi A, McCulloch C, Auerbach A. House staff team workload and organization effects on patient outcomes in an academic general internal medicine inpatient service. Arch Intern Med. 2007;167(1):47-52. doi:10.1001/archinte.167.1.47 PubMed
© 2018 Society of Hospital Medicine
Development of Hospitalization Resource Intensity Scores for Kids (H-RISK) and Comparison across Pediatric Populations
Hospitals are increasingly assessed comparatively in terms of costs and quality for benchmarking purposes. These comparisons can be used by patients and families to determine where to seek care, to report compliance and grant certifications by oversight organizations (eg, Leapfrog, Magnet, Joint Commission), and by payers, to determine reimbursement models and/or to assess financial penalty or bonuses for underperforming or overperforming hospitals. As these efforts can cause substantial reputational and financial consequences for hospitals, these metrics must be contextualized within the population of patients that each hospital serves.
In adult Medicare patient populations, methods have been developed to assess the relative severity of a hospital’s full complement of patients.1,2 These methods assume a relationship between severity and hospital resource intensity (ie, cost) and typically assume the form of relative weights (RWs), which are developed for clinically similar groups of patients (eg, Medicare Diagnosis Related Groups; MS-DRG) from a reference population. A RW for each MS-DRG is calculated as the average cost of patients within the group divided by the average cost for all patients in the reference population. These weights are then applied to a hospital’s discharges over a specific time period and averaged to obtain a hospital-level case-mix index (CMI). A value of 1 indicates that a hospital serves a mix of patients with similar severity (or resource intensity) to that of an “average” hospital discharge in the reference population, whereas a value of 1.2 indicates that a hospital serves a population of patients with 20% more severity than that of an “average” hospital discharge. Since 1983, the Centers for Medicare and Medicaid Services (CMS) has used RWs in their inpatient prospective payment system.3
Similar pediatric methods are less developed and necessitate special consideration as the use of existing weights may be inappropriate for a pediatric population. First, MS-DRGs were developed primarily for the Medicare population and lack sufficient granularity for pediatric populations, specifically newborns. Second, a severity stratification which incorporates important patient characteristics, such as age in pediatrics, does not exist in the MS-DRG system . Finally, although the reference populations that are used to develop MS-DRG weights do not explicitly exclude children, children typically account for approximately 15% of hospitalizations (6% excluding neonatal/maternal) and possibly feature different utilization patterns than adults with similar conditions. Thus, weights developed from a combined pediatric/adult reference population primarily reflect an adult population.
With valid pediatric RWs, stakeholders can assess a hospital’s severity mix of patients in a comparable fashion and contextualize outcome metrics. Additionally, these same weights can be used to estimate expected costs for hospitalizations or for risk adjusting various outcomes at the discharge- or hospital-level. Thus, we sought to develop hospitalization resource intensity scores for kids (H-RISK) using pediatric-specific weights and compare hospital-level CMIs across various hospital types and locations as an example of the application of this novel methodology.
METHODS
Dataset
Data for this analysis were obtained from the 2012 Healthcare Cost and Utilization Project (HCUP) Kids’ Inpatient Database (KID).4 KID is the largest publicly available all-payer inpatient administrative database in the United States and is sponsored by the Agency for Healthcare Research and Quality as part of the HCUP. The 2012 KID included a sample of approximately 3.2 million discharge records of children <21 years old from 44 states and 4,179 community, nonrehabilitation hospitals weighted for national estimates.
Hospital discharge costs were estimated from charges using cost-to-charge ratios (CCR) provided by HCUP as a supplement to the 2012 KID.5 Cost estimates associated with a specific discharge were estimated by multiplying the total charges reported in the data by the appropriate hospital-specific CCR and then adjusted for price factors beyond a hospital’s control using the area wage index also provided by HCUP as a supplement.
H-RISK and Case-Mix Index Calculations
We calculated H-RISK as pediatric-specific RWs based on version 30 of 3M’s All Patient Refined DRG (APR-DRG; 3M Health Information Systems, Salt Lake City, Utah) system as a measure of resource intensity. The APR-DRG system classifies hospital discharges into over 300 base DRGs based on demographic, diagnostic, and therapeutic characteristics. Each APR-DRG is further sub-divided into 4 subclasses of severity of illness (SOI; eg, minor, moderate, major, and extreme) to indicate the intensity of resource utilization during hospitalization. However, SOI levels for differing APR-DRGs are not comparable.
For every APR-DRG SOI combinations available in the 2012 KID, calculation of RW was based on the ratio of the mean cost for patients assigned to a particular APR-DRG SOI compared with the mean cost for all patients in the database. Inpatient costs less than $0.50 were set to missing and removed from analysis. Mortalities and discharges with missing CCR and wage index values were also excluded from analysis. We required that estimates for RWs be based on a reasonable set of data (ie, 10 or more discharges) for each APR-DRG SOI, and that estimates across the 4 SOI levels within an APR-DRG be monotonically nondecreasing (ie, as SOI level increases, weights must either be the same or increasing). Winsorized means were used as point estimates for mean cost in both the numerator and denominator of RW computation. Winsorizing refers to an analytic transformation by which the influence of outliers (eg, values beyond a certain threshold) is mitigated by replacing the value of outliers with the value of the threshold. We used the 5th and 95th percentiles as thresholds for Winsorizing our point estimates.
Winsorized point estimates failing to meet the minimum sample size of 10 or nondecreasing monotonicity requirement were modified by one of the two following methods:
- Cost data were modeled using a generalized linear model assuming an exponential distribution. Covariates in the model included APR-DRG and SOI within APR-DRG as a continuous variable. Where applicable, Winsorized estimates of the mean were replaced with modeled estimates.
- Data from an APR-DRG SOI in question were combined with other SOIs within the same APR-DRG with the closest Winsorized mean value. Once data were combined, a common Winsorized value was re-computed and values across SOIs were checked to ensure that nondecreasing monotonicity was maintained. In some APR-DRGs with sparse data, this involved combining pairs of severity levels; in others, it involved combining three or four severity levels together.
For APR-DRGs in which no discharges at any SOI were recorded in the 2012 KID, we used the Winsorized mean of all encounters with a common major diagnostic category (MDC) as the missing APR-DRG as point estimate for all 4 SOI levels.
To calculate the CMI for a set of discharges (eg, discharges at a hospital in a year), RWs were assigned to each discharge based on APR-DRG SOI designation. Consequently, all discharges from a specific APR-DRG SOI were assigned the same RW. Once RWs were assigned, CMI was calculated as the mean RW across all discharges. To compare hospital types based on acute-care hospital stays which are usually considered with the realm of pediatric care, we excluded RWs for normal newborns, defined as APR-DRG 626 (neonate birthweight of 2000–2499 g, normal newborn or neonate with other problems) and 640 (neonate birthweight >2499 g, normal newborn or neonate with other problems), and maternal hospitalizations, defined as APR-DRG 540 (cesarean delivery) and 560 (vaginal delivery), from our CMI calculations.
Statistical Methodology
Categorical variables were summarized using frequencies and percentages; continuous variables were summarized using medians and interquartile ranges. Differences between hospital
types (eg, rural, urban nonteaching, urban teaching, and
free-standing) were assessed using a Chi-square test for association for categorical variables. Differences in continuous variables including comparisons of neonatal (MDC 15) and nonneonatal discharges, and medical versus procedural discharges as defined by the APR-DRG grouper were assessed using a Kruskal–Wallis test. All analyses were performed using SAS, Version 9.4 (SAS Institute, Cary, North Carolina); P values <.05 were considered statistically significant.
This study was considered nonhuman subjects research by the Institutional Review Board of Vanderbilt University Medical Center.
RESULTS
Patient Population
Table 1 summarizes the patient characteristics for all 4 hospital types. All comparisons of patient characteristics across the four hospital types are significant (P < .001). Of the 6,675,222 weighted discharges in HCUP KID 2012, almost two-thirds were less than one year old (4,269,984). Three-quarters of those infant discharges (3,733,760) were in-hospital births. The South was the Census region with the most number of discharges (38.8%), and over half of discharges (53.2%) included patients who lived in metro areas with more than 1 million residents. Patients disproportionately originated from lower-income areas with 30.9% living in zip codes with median incomes in the first quartile.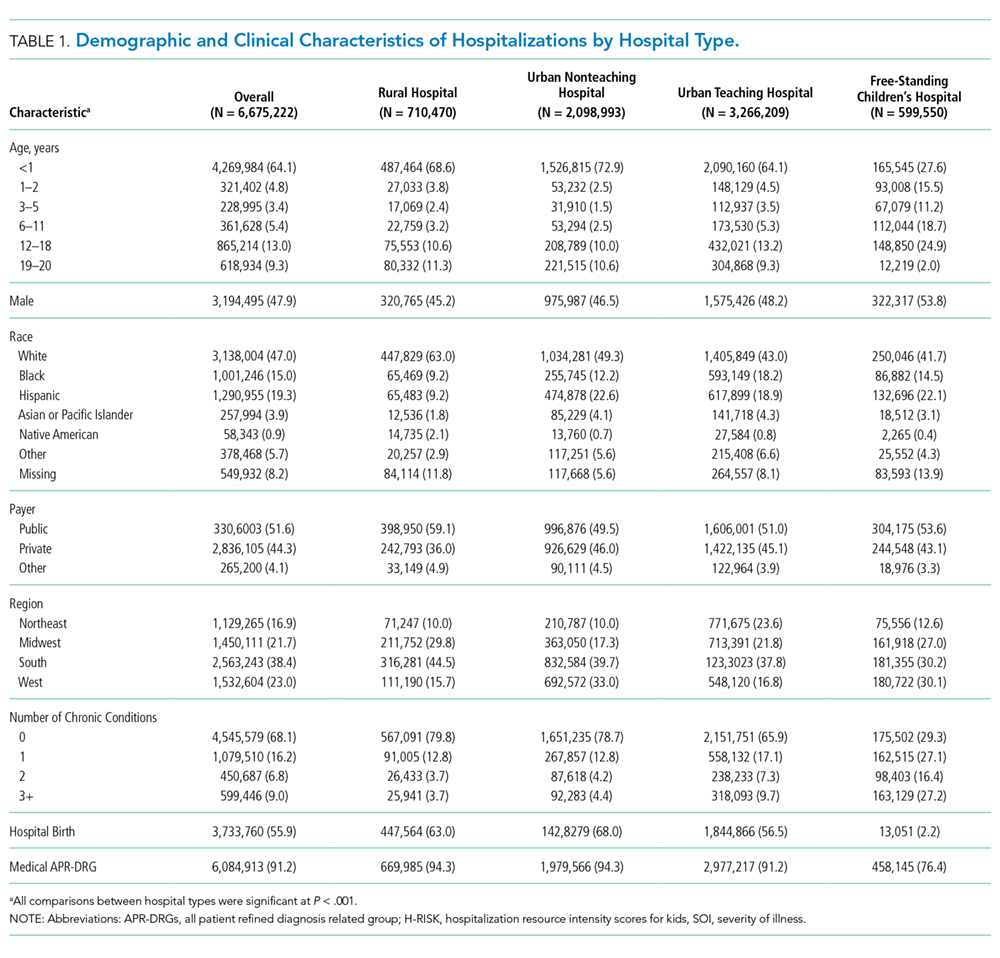
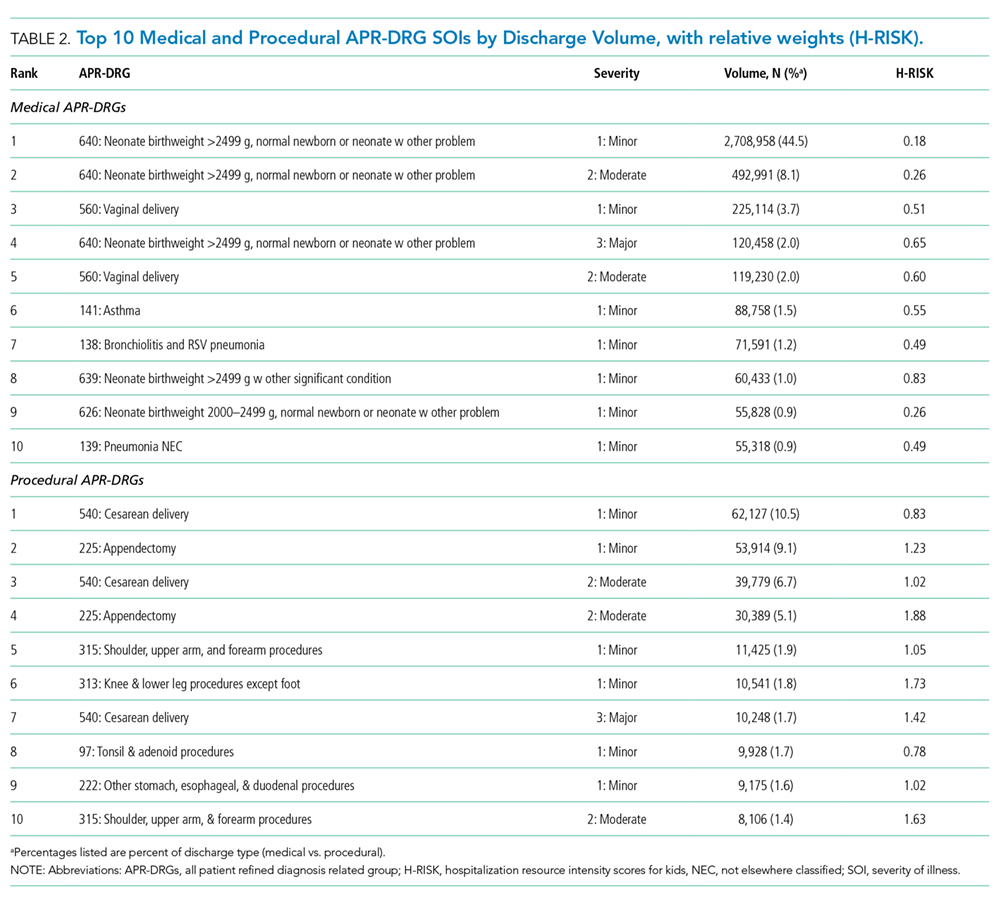
H-RISK Generation
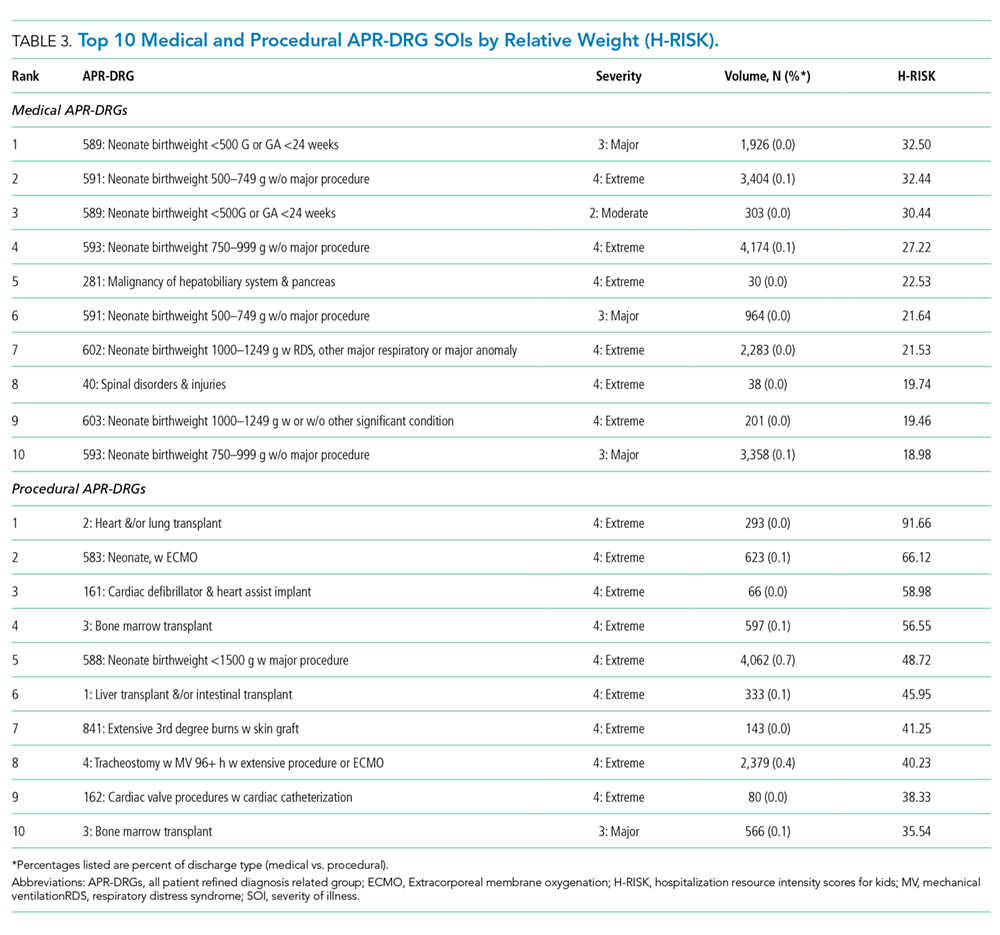
The weighted Winsorized mean cost of all discharges was $6,135 per discharge. The majority of cost-based H-RISK were higher than 1, with 1,038 (82.5%) of APR-DRG SOIs incurring an estimated cost higher than $6,135. Solid organ and bone marrow transplantations represented 4 of the 10 highest cost-based RWs for procedural APR-DRG SOIs (Table 3). Neonatal APR-DRG SOIs accounted for 8 of the 10 highest medical RWs. A list of all APR-DRG SOIs and H-RISK can be found in Appendix A.
Hospital-Level Case-Mix Index for Acute Hospitalizations
After excluding normal newborn and maternal hospitalizations, median CMI of the 3117 hospitals with at least 20 unweighted discharges was 1.0 (interquartile range [IQR]: 0.8, 1.7). CMI varied significantly across hospital types (P < .001). Free-standing children’s hospitals exhibited the highest cost-based CMI (median: 2.7, IQR: 2.2–3.1), followed by urban teaching hospitals (median: 1.8, IQR: 1.3–2.6), urban nonteaching hospitals (median: 1.1, IQR: 0.9–1.5), and rural hospitals (median: 0.9, IQR: 0.7–0.9).
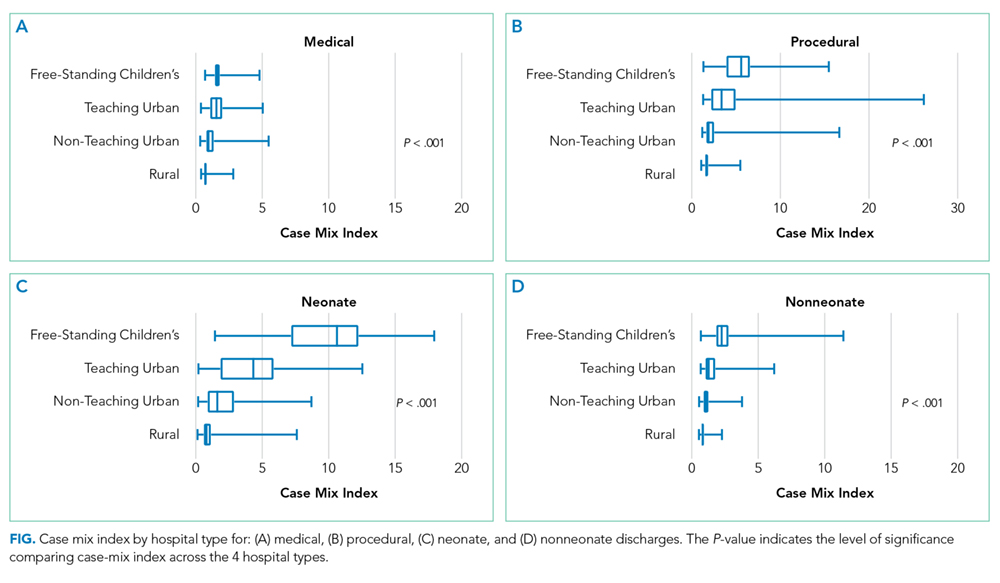
DISCUSSION
Currently, no widely available measures can compare the relative intensity of hospital care specific for inpatient pediatric populations. To meet this important need, we have developed a methodology to determine valid pediatric RWs (H-RISK) which can be used to estimate the intensity of care for applications across entire hospital patient populations and specific subpopulations. H-RISK allow calculation of CMIs for risk adjustment of various outcomes at the discharge- or hospital-level and for comparisons among hospitals and populations. Using this methodology, we demonstrated that the CMI for free-standing children’s hospitals was significantly higher than those of rural, urban, nonteaching and urban teaching hospitals for all discharges and medical or procedural subgroups.
CMS has used RWs based on DRGs since the inception of the prospective payment system in 1983. The sequence of DRGs used by CMS has purposely focused on older adult Medicare population, and CMS itself recommends applying Medicare-focused DRGs (MS-DRGs being the current iteration) only for the >65 year population.6 Nevertheless, many payers, both government and commercial, utilize MS-DRGs and their RWs for payment purposes when reimbursing children’s hospitals. The validity of using weights developed using this grouper in hospitals treating large numbers of pediatric patients and childhood illnesses has been called into question, particularly when such weights are used in reimbursement of children’s hospitals.7
Several factors contribute to the validity of a model for developing RWs. First, the system used to describe patient hospitalizations and illnesses should be appropriate to the population in question. As described above, the original DRG system and its subsequent iterations were designed to describe hospitalizations for adults >65 years of age.8, 9 Over the years, CMS DRGs incorporated rudimentary categories for neonatal and obstetrical hospitalizations. Still, the current MS-DRGs lack sufficient focus on common inpatient pediatric conditions to adequately describe pediatric hospitalizations, particularly those in free-standing children’s hospitals delivering tertiary and quaternary care. Thus, a more appropriate classification schema for developing RWs specific for pediatric hospitalization should include patients across the entire age spectrum. APR-DRGs represent one such classification system.
Once an appropriate patient classification system is selected, then the population of hospitalized patients to be used as the reference group becomes important. For a system targeting a pediatric inpatient population, a hospital discharge database representing a broad sample of pediatric hospitalizations offers the best basis for developing a system of weights applicable to different types of hospitals providing care for children. For this purpose, we selected the 2012 KID database, a nationally representative dataset containing data on newborn and pediatric discharges from the majority of states within the US. This choice assured that the RWs developed were based on and applicable to pediatric hospitalizations across the entire spectrum of SOI and resource intensity.
A number of measures of hospital performance and quality have been developed and are used by various entities, including individual hospitals, CMS, Leapfrog, Magnet, Joint Commission, and payers, for purposes ranging from benchmarking for improvement to payment models to reimbursement penalties. However, SOI of a hospital’s patient population influences not only the intensity of care that a hospital provides but also presents a potential impact on process and outcome measures. Thus, fair and appropriate measures must consider differences in SOI when comparing hospital performances. Using the weights derived in this paper, these adjustments can be possibly made at either the discharge- or hospital-level, depending on the application, and may include comparisons by hospital location, ownership, payer mix, or socioeconomic strata.
It is also common for hospitals to quantitatively express the uniqueness of services that they deliver to payers or the general public. A hospital-level CMI (derived as the average discharge weight for patients within a hospital) is one way that hospitals may differentiate themselves. This can be accomplished by considering the ratio of one hospital’s CMI to another hospital’s (or an average of a group of hospitals) as an expression of the relative intensity of services. For example, if hospital x has a CMI of 2.3, and hospital y has a CMI of 1.4, the population of children hospitalized at hospital x was 64.3% (1–2.3/1.4) more resource intensive than the children seen at hospital y.
This study should be considered in terms of several limitations. We used costs as the basis for determining intensity of service. Thus, the difference in cost structure among children’s hospitals and between children’s hospitals and other hospital types in the KID could have affected the final calculated weights. Also, the RWs calculated in this study rely on hospital discharge data. Thus, complications which were not “present on admission” and occurred during a hospitalization could have reflected poor quality of care yet still increase resource intensity as measured by total costs. Future studies should examine the potential impact of using present-on-admission diagnoses only for the APR-DRG grouping on the values of RWs. Significant variation may have existed among hospitals in resource utilization, and some hospitals may have exhibited significant overutilization of resources for the same conditions. However, as we used Winsorized means, the impact of potential outliers should have been reduced. Some APR-DRG-SOI combinations were seen mainly at children’s hospitals. Thus, cost structure and resource utilization practices of this subset of hospitals would have been the only contributors to weights for these patients. Given that the 2012 KID contained a broad representation of pediatric hospitalizations, with age 0–20 years, newborns accounted for the majority of total cases in the database. While providing a full range of pediatric weights, inclusion of these patients lowered the overall average RW. For this reason, we excluded normal newborn categories and maternal categories from analysis of CMI across hospital types and focused on acute-care hospitalizations. Lastly, as with any study relying on administrative data, there is always the possibility of coding errors or data entry errors in the reference dataset.
CONCLUSIONS
H-RISK can be used to risk adjust measures to account for severity differences across populations. These weights can also be averaged across hospitals’ patient populations to compare relative resource intensities of the patients served.
Disclosures
The authors have nothing to disclose.
1. Pettengill J, Vertrees J. Reliability and Validity in Hospital Case-Mix Measurement. Health Care Financ Rev. 1982; 4(2): 101-128. PubMed
2. Centers for Medicare & Medicaid Services. Details for title: Case Mix Index. https://www.cms.gov/Medicare/Medicare-Fee-for-Service-Payment/AcuteInpatientPPS/Acute-Inpatient-Files-for-Download-Items/CMS022630.html#. Accessed August 30, 2017.
3. Iglehart JK. Medicare begins prospective payment of hospitals. N. Engl. J. Med 1983; 308(23): 1428-1432. PubMed
4. Healthcare Cost Utilization Project. Overview of the Kids’ Inpatient Database (KID). 2017; https://www.hcup-us.ahrq.gov/kidoverview.jsp. Accessed August 30, 2017.
5. Healthcare Cost Utilization Project. Cost-to-Charge Ratio Files: 2012 Kids’ Inpatient Database (KID) User Guide. 2014; https://www.hcup-us.ahrq.gov/db/state/CCR2012KIDUserGuide.pdf. Accessed August 30, 2017.
6. Centers for Medicare & Medicaid Services. Medicare Program; Changes to the Hospital Inpatient Prospective Payment Systems and Fiscal Year 2005 Rates; Final Rule. Federal Register. 2004;69(154):48,939. PubMed
7. Muldoon JH. Structure and performance of different DRG classification systems for neonatal medicine. Pediatrics. 1999; 103(1 Suppl E): 302-318. PubMed
8. Averill R, Goldfield N, Muldoon J, Steinbeck B, Grant T. A Closer Look at All Patient Refined DRGs. J AHIMA. 2002; 73(1): 46-50. PubMed
9. Centers for Medicare & Medicaid Services. Design and development of the Diagnosis Related Group (DRG). https://www.cms.gov/ICD10Manual/version34-fullcode-cms/fullcode_cms/Design_and_development_of_the_Diagnosis_Related_Group_(DRGs)_PBL-038.pdf. Accessed December 6, 2017.
Hospitals are increasingly assessed comparatively in terms of costs and quality for benchmarking purposes. These comparisons can be used by patients and families to determine where to seek care, to report compliance and grant certifications by oversight organizations (eg, Leapfrog, Magnet, Joint Commission), and by payers, to determine reimbursement models and/or to assess financial penalty or bonuses for underperforming or overperforming hospitals. As these efforts can cause substantial reputational and financial consequences for hospitals, these metrics must be contextualized within the population of patients that each hospital serves.
In adult Medicare patient populations, methods have been developed to assess the relative severity of a hospital’s full complement of patients.1,2 These methods assume a relationship between severity and hospital resource intensity (ie, cost) and typically assume the form of relative weights (RWs), which are developed for clinically similar groups of patients (eg, Medicare Diagnosis Related Groups; MS-DRG) from a reference population. A RW for each MS-DRG is calculated as the average cost of patients within the group divided by the average cost for all patients in the reference population. These weights are then applied to a hospital’s discharges over a specific time period and averaged to obtain a hospital-level case-mix index (CMI). A value of 1 indicates that a hospital serves a mix of patients with similar severity (or resource intensity) to that of an “average” hospital discharge in the reference population, whereas a value of 1.2 indicates that a hospital serves a population of patients with 20% more severity than that of an “average” hospital discharge. Since 1983, the Centers for Medicare and Medicaid Services (CMS) has used RWs in their inpatient prospective payment system.3
Similar pediatric methods are less developed and necessitate special consideration as the use of existing weights may be inappropriate for a pediatric population. First, MS-DRGs were developed primarily for the Medicare population and lack sufficient granularity for pediatric populations, specifically newborns. Second, a severity stratification which incorporates important patient characteristics, such as age in pediatrics, does not exist in the MS-DRG system . Finally, although the reference populations that are used to develop MS-DRG weights do not explicitly exclude children, children typically account for approximately 15% of hospitalizations (6% excluding neonatal/maternal) and possibly feature different utilization patterns than adults with similar conditions. Thus, weights developed from a combined pediatric/adult reference population primarily reflect an adult population.
With valid pediatric RWs, stakeholders can assess a hospital’s severity mix of patients in a comparable fashion and contextualize outcome metrics. Additionally, these same weights can be used to estimate expected costs for hospitalizations or for risk adjusting various outcomes at the discharge- or hospital-level. Thus, we sought to develop hospitalization resource intensity scores for kids (H-RISK) using pediatric-specific weights and compare hospital-level CMIs across various hospital types and locations as an example of the application of this novel methodology.
METHODS
Dataset
Data for this analysis were obtained from the 2012 Healthcare Cost and Utilization Project (HCUP) Kids’ Inpatient Database (KID).4 KID is the largest publicly available all-payer inpatient administrative database in the United States and is sponsored by the Agency for Healthcare Research and Quality as part of the HCUP. The 2012 KID included a sample of approximately 3.2 million discharge records of children <21 years old from 44 states and 4,179 community, nonrehabilitation hospitals weighted for national estimates.
Hospital discharge costs were estimated from charges using cost-to-charge ratios (CCR) provided by HCUP as a supplement to the 2012 KID.5 Cost estimates associated with a specific discharge were estimated by multiplying the total charges reported in the data by the appropriate hospital-specific CCR and then adjusted for price factors beyond a hospital’s control using the area wage index also provided by HCUP as a supplement.
H-RISK and Case-Mix Index Calculations
We calculated H-RISK as pediatric-specific RWs based on version 30 of 3M’s All Patient Refined DRG (APR-DRG; 3M Health Information Systems, Salt Lake City, Utah) system as a measure of resource intensity. The APR-DRG system classifies hospital discharges into over 300 base DRGs based on demographic, diagnostic, and therapeutic characteristics. Each APR-DRG is further sub-divided into 4 subclasses of severity of illness (SOI; eg, minor, moderate, major, and extreme) to indicate the intensity of resource utilization during hospitalization. However, SOI levels for differing APR-DRGs are not comparable.
For every APR-DRG SOI combinations available in the 2012 KID, calculation of RW was based on the ratio of the mean cost for patients assigned to a particular APR-DRG SOI compared with the mean cost for all patients in the database. Inpatient costs less than $0.50 were set to missing and removed from analysis. Mortalities and discharges with missing CCR and wage index values were also excluded from analysis. We required that estimates for RWs be based on a reasonable set of data (ie, 10 or more discharges) for each APR-DRG SOI, and that estimates across the 4 SOI levels within an APR-DRG be monotonically nondecreasing (ie, as SOI level increases, weights must either be the same or increasing). Winsorized means were used as point estimates for mean cost in both the numerator and denominator of RW computation. Winsorizing refers to an analytic transformation by which the influence of outliers (eg, values beyond a certain threshold) is mitigated by replacing the value of outliers with the value of the threshold. We used the 5th and 95th percentiles as thresholds for Winsorizing our point estimates.
Winsorized point estimates failing to meet the minimum sample size of 10 or nondecreasing monotonicity requirement were modified by one of the two following methods:
- Cost data were modeled using a generalized linear model assuming an exponential distribution. Covariates in the model included APR-DRG and SOI within APR-DRG as a continuous variable. Where applicable, Winsorized estimates of the mean were replaced with modeled estimates.
- Data from an APR-DRG SOI in question were combined with other SOIs within the same APR-DRG with the closest Winsorized mean value. Once data were combined, a common Winsorized value was re-computed and values across SOIs were checked to ensure that nondecreasing monotonicity was maintained. In some APR-DRGs with sparse data, this involved combining pairs of severity levels; in others, it involved combining three or four severity levels together.
For APR-DRGs in which no discharges at any SOI were recorded in the 2012 KID, we used the Winsorized mean of all encounters with a common major diagnostic category (MDC) as the missing APR-DRG as point estimate for all 4 SOI levels.
To calculate the CMI for a set of discharges (eg, discharges at a hospital in a year), RWs were assigned to each discharge based on APR-DRG SOI designation. Consequently, all discharges from a specific APR-DRG SOI were assigned the same RW. Once RWs were assigned, CMI was calculated as the mean RW across all discharges. To compare hospital types based on acute-care hospital stays which are usually considered with the realm of pediatric care, we excluded RWs for normal newborns, defined as APR-DRG 626 (neonate birthweight of 2000–2499 g, normal newborn or neonate with other problems) and 640 (neonate birthweight >2499 g, normal newborn or neonate with other problems), and maternal hospitalizations, defined as APR-DRG 540 (cesarean delivery) and 560 (vaginal delivery), from our CMI calculations.
Statistical Methodology
Categorical variables were summarized using frequencies and percentages; continuous variables were summarized using medians and interquartile ranges. Differences between hospital
types (eg, rural, urban nonteaching, urban teaching, and
free-standing) were assessed using a Chi-square test for association for categorical variables. Differences in continuous variables including comparisons of neonatal (MDC 15) and nonneonatal discharges, and medical versus procedural discharges as defined by the APR-DRG grouper were assessed using a Kruskal–Wallis test. All analyses were performed using SAS, Version 9.4 (SAS Institute, Cary, North Carolina); P values <.05 were considered statistically significant.
This study was considered nonhuman subjects research by the Institutional Review Board of Vanderbilt University Medical Center.
RESULTS
Patient Population
Table 1 summarizes the patient characteristics for all 4 hospital types. All comparisons of patient characteristics across the four hospital types are significant (P < .001). Of the 6,675,222 weighted discharges in HCUP KID 2012, almost two-thirds were less than one year old (4,269,984). Three-quarters of those infant discharges (3,733,760) were in-hospital births. The South was the Census region with the most number of discharges (38.8%), and over half of discharges (53.2%) included patients who lived in metro areas with more than 1 million residents. Patients disproportionately originated from lower-income areas with 30.9% living in zip codes with median incomes in the first quartile.
H-RISK Generation
The weighted Winsorized mean cost of all discharges was $6,135 per discharge. The majority of cost-based H-RISK were higher than 1, with 1,038 (82.5%) of APR-DRG SOIs incurring an estimated cost higher than $6,135. Solid organ and bone marrow transplantations represented 4 of the 10 highest cost-based RWs for procedural APR-DRG SOIs (Table 3). Neonatal APR-DRG SOIs accounted for 8 of the 10 highest medical RWs. A list of all APR-DRG SOIs and H-RISK can be found in Appendix A.
Hospital-Level Case-Mix Index for Acute Hospitalizations
After excluding normal newborn and maternal hospitalizations, median CMI of the 3117 hospitals with at least 20 unweighted discharges was 1.0 (interquartile range [IQR]: 0.8, 1.7). CMI varied significantly across hospital types (P < .001). Free-standing children’s hospitals exhibited the highest cost-based CMI (median: 2.7, IQR: 2.2–3.1), followed by urban teaching hospitals (median: 1.8, IQR: 1.3–2.6), urban nonteaching hospitals (median: 1.1, IQR: 0.9–1.5), and rural hospitals (median: 0.9, IQR: 0.7–0.9).
DISCUSSION
Currently, no widely available measures can compare the relative intensity of hospital care specific for inpatient pediatric populations. To meet this important need, we have developed a methodology to determine valid pediatric RWs (H-RISK) which can be used to estimate the intensity of care for applications across entire hospital patient populations and specific subpopulations. H-RISK allow calculation of CMIs for risk adjustment of various outcomes at the discharge- or hospital-level and for comparisons among hospitals and populations. Using this methodology, we demonstrated that the CMI for free-standing children’s hospitals was significantly higher than those of rural, urban, nonteaching and urban teaching hospitals for all discharges and medical or procedural subgroups.
CMS has used RWs based on DRGs since the inception of the prospective payment system in 1983. The sequence of DRGs used by CMS has purposely focused on older adult Medicare population, and CMS itself recommends applying Medicare-focused DRGs (MS-DRGs being the current iteration) only for the >65 year population.6 Nevertheless, many payers, both government and commercial, utilize MS-DRGs and their RWs for payment purposes when reimbursing children’s hospitals. The validity of using weights developed using this grouper in hospitals treating large numbers of pediatric patients and childhood illnesses has been called into question, particularly when such weights are used in reimbursement of children’s hospitals.7
Several factors contribute to the validity of a model for developing RWs. First, the system used to describe patient hospitalizations and illnesses should be appropriate to the population in question. As described above, the original DRG system and its subsequent iterations were designed to describe hospitalizations for adults >65 years of age.8, 9 Over the years, CMS DRGs incorporated rudimentary categories for neonatal and obstetrical hospitalizations. Still, the current MS-DRGs lack sufficient focus on common inpatient pediatric conditions to adequately describe pediatric hospitalizations, particularly those in free-standing children’s hospitals delivering tertiary and quaternary care. Thus, a more appropriate classification schema for developing RWs specific for pediatric hospitalization should include patients across the entire age spectrum. APR-DRGs represent one such classification system.
Once an appropriate patient classification system is selected, then the population of hospitalized patients to be used as the reference group becomes important. For a system targeting a pediatric inpatient population, a hospital discharge database representing a broad sample of pediatric hospitalizations offers the best basis for developing a system of weights applicable to different types of hospitals providing care for children. For this purpose, we selected the 2012 KID database, a nationally representative dataset containing data on newborn and pediatric discharges from the majority of states within the US. This choice assured that the RWs developed were based on and applicable to pediatric hospitalizations across the entire spectrum of SOI and resource intensity.
A number of measures of hospital performance and quality have been developed and are used by various entities, including individual hospitals, CMS, Leapfrog, Magnet, Joint Commission, and payers, for purposes ranging from benchmarking for improvement to payment models to reimbursement penalties. However, SOI of a hospital’s patient population influences not only the intensity of care that a hospital provides but also presents a potential impact on process and outcome measures. Thus, fair and appropriate measures must consider differences in SOI when comparing hospital performances. Using the weights derived in this paper, these adjustments can be possibly made at either the discharge- or hospital-level, depending on the application, and may include comparisons by hospital location, ownership, payer mix, or socioeconomic strata.
It is also common for hospitals to quantitatively express the uniqueness of services that they deliver to payers or the general public. A hospital-level CMI (derived as the average discharge weight for patients within a hospital) is one way that hospitals may differentiate themselves. This can be accomplished by considering the ratio of one hospital’s CMI to another hospital’s (or an average of a group of hospitals) as an expression of the relative intensity of services. For example, if hospital x has a CMI of 2.3, and hospital y has a CMI of 1.4, the population of children hospitalized at hospital x was 64.3% (1–2.3/1.4) more resource intensive than the children seen at hospital y.
This study should be considered in terms of several limitations. We used costs as the basis for determining intensity of service. Thus, the difference in cost structure among children’s hospitals and between children’s hospitals and other hospital types in the KID could have affected the final calculated weights. Also, the RWs calculated in this study rely on hospital discharge data. Thus, complications which were not “present on admission” and occurred during a hospitalization could have reflected poor quality of care yet still increase resource intensity as measured by total costs. Future studies should examine the potential impact of using present-on-admission diagnoses only for the APR-DRG grouping on the values of RWs. Significant variation may have existed among hospitals in resource utilization, and some hospitals may have exhibited significant overutilization of resources for the same conditions. However, as we used Winsorized means, the impact of potential outliers should have been reduced. Some APR-DRG-SOI combinations were seen mainly at children’s hospitals. Thus, cost structure and resource utilization practices of this subset of hospitals would have been the only contributors to weights for these patients. Given that the 2012 KID contained a broad representation of pediatric hospitalizations, with age 0–20 years, newborns accounted for the majority of total cases in the database. While providing a full range of pediatric weights, inclusion of these patients lowered the overall average RW. For this reason, we excluded normal newborn categories and maternal categories from analysis of CMI across hospital types and focused on acute-care hospitalizations. Lastly, as with any study relying on administrative data, there is always the possibility of coding errors or data entry errors in the reference dataset.
CONCLUSIONS
H-RISK can be used to risk adjust measures to account for severity differences across populations. These weights can also be averaged across hospitals’ patient populations to compare relative resource intensities of the patients served.
Disclosures
The authors have nothing to disclose.
1. Pettengill J, Vertrees J. Reliability and Validity in Hospital Case-Mix Measurement. Health Care Financ Rev. 1982; 4(2): 101-128. PubMed
2. Centers for Medicare & Medicaid Services. Details for title: Case Mix Index. https://www.cms.gov/Medicare/Medicare-Fee-for-Service-Payment/AcuteInpatientPPS/Acute-Inpatient-Files-for-Download-Items/CMS022630.html#. Accessed August 30, 2017.
3. Iglehart JK. Medicare begins prospective payment of hospitals. N. Engl. J. Med 1983; 308(23): 1428-1432. PubMed
4. Healthcare Cost Utilization Project. Overview of the Kids’ Inpatient Database (KID). 2017; https://www.hcup-us.ahrq.gov/kidoverview.jsp. Accessed August 30, 2017.
5. Healthcare Cost Utilization Project. Cost-to-Charge Ratio Files: 2012 Kids’ Inpatient Database (KID) User Guide. 2014; https://www.hcup-us.ahrq.gov/db/state/CCR2012KIDUserGuide.pdf. Accessed August 30, 2017.
6. Centers for Medicare & Medicaid Services. Medicare Program; Changes to the Hospital Inpatient Prospective Payment Systems and Fiscal Year 2005 Rates; Final Rule. Federal Register. 2004;69(154):48,939. PubMed
7. Muldoon JH. Structure and performance of different DRG classification systems for neonatal medicine. Pediatrics. 1999; 103(1 Suppl E): 302-318. PubMed
8. Averill R, Goldfield N, Muldoon J, Steinbeck B, Grant T. A Closer Look at All Patient Refined DRGs. J AHIMA. 2002; 73(1): 46-50. PubMed
9. Centers for Medicare & Medicaid Services. Design and development of the Diagnosis Related Group (DRG). https://www.cms.gov/ICD10Manual/version34-fullcode-cms/fullcode_cms/Design_and_development_of_the_Diagnosis_Related_Group_(DRGs)_PBL-038.pdf. Accessed December 6, 2017.
© 2018 Society of Hospital Medicine