User login
Association of Weekend Admission and Weekend Discharge with Length of Stay and 30-Day Readmission in Children’s Hospitals
Increasingly, metrics such as length of stay (LOS) and readmissions are being utilized in the United States to assess quality of healthcare because these factors may represent opportunities to reduce cost and improve healthcare delivery.1-8 However, the relatively low rate of pediatric readmissions,9 coupled with limited data regarding recommended LOS or best practices to prevent readmissions in children, challenges the ability of hospitals to safely reduce LOS and readmission rates for children.10–12
In adults, weekend admission is associated with prolonged LOS, increased readmission rates, and increased risk of mortality.13-21 This association is referred to as the “weekend effect.” While the weekend effect has been examined in children, the results of these studies have been variable, with some studies supporting this association and others refuting it.22-31 In contrast to patient demographic and clinical characteristics that are known to affect LOS and readmissions,32 the weekend effect represents a potentially modifiable aspect of a hospitalization that could be targeted to improve healthcare delivery.
With increasing national attention toward improving quality of care and reducing LOS and healthcare costs, more definitive evidence of the weekend effect is necessary to prioritize resource use at both the local and national levels. Therefore, we sought to determine the association of weekend admission and weekend discharge on LOS and 30-day readmissions, respectively, among a national cohort of children. We hypothesized that children admitted on the weekend would have longer LOS, whereas those discharged on the weekend would have higher readmission rates.
METHODS
Study Design and Data Source
We conducted a multicenter, retrospective, cross-sectional study. Data were obtained from the Pediatric Health Information System (PHIS), an administrative and billing database of 46 free-standing tertiary care pediatric hospitals affiliated with the Children’s Hospital Association (Lenexa, Kansas). Patient data are de-identified within PHIS; however, encrypted patient identifiers allow individual patients to be followed across visits. This study was not considered human subjects research by the policies of the Cincinnati Children’s Hospital Institutional Review Board.
Participants
We included hospitalizations to a PHIS-participating hospital for children aged 0-17 years between October 1, 2014 and September 30, 2015. We excluded children who were transferred from/to another institution, left against medical advice, or died in the hospital because these indications may result in incomplete LOS information and would not consistently contribute to readmission rates. We also excluded birth hospitalizations and children admitted for planned procedures. Birth hospitalizations were defined as hospitalizations that began on the day of birth.
Main Exposures
No standard definition of weekend admission or discharge was identified in the literature.33 Thus, we defined a weekend admission as an admission between 3:00
Main Outcomes
Our outcomes included LOS for weekend admission and 30-day readmissions for weekend discharge. LOS, measured in hours, was defined using the reported admission and discharge times. Readmissions were defined as a return to the same hospital within the subsequent 30 days following discharge.
Patient Demographics and Other Study Variables
Patient demographics included age, gender, race/ethnicity, payer, and median household income quartile based on the patient’s home ZIP code. Other study variables included presence of a complex chronic condition (CCC),34 technology dependence,34 number of chronic conditions of any complexity, admission through the emergency department, intensive care unit (ICU) admission, and case mix index. ICU admission and case mix index were chosen as markers for severity of illness. ICU admission was defined as any child who incurred ICU charges at any time following admission. Case mix index in PHIS is a relative weight assigned to each discharge based on the All-Patient Refined Diagnostic Group (APR-DRG; 3M) assignment and APR-DRG severity of illness, which ranges from 1 (minor) to 4 (extreme). The weights are derived by the Children’s Hospital Association from the HCUP KID 2012 database as the ratio of the average cost for discharges within a specific APR-DRG severity of illness combination to the average cost for all discharges in the database.
Statistical Analysis
Continuous variables were summarized with medians and interquartile ranges, while categorical variables were summarized with frequencies and percentages. Differences in admission and discharge characteristics between weekend and weekday were assessed using Wilcoxon rank sum tests for continuous variables and chi-square tests of association for categorical variables. We used generalized linear mixed modeling (GLMM) techniques to assess the impact of weekend admission on LOS and weekend discharge on readmission, adjusting for important patient demographic and clinical characteristics. Furthermore, we used GLMM point estimates to describe the variation across hospitals of the impact of weekday versus weekend care on LOS and readmissions. We assumed an underlying log-normal distribution for LOS and an underlying binomial distribution for 30-day readmission. All GLMMs included a random intercept for each hospital to account for patient clustering within a hospital. All statistical analyses were performed using SAS v.9.4 (SAS Institute, Cary, North Carolina), and P values <.05 were considered statistically significant.
RESULTS
We identified 390,745 hospitalizations that met inclusion criteria (Supplementary Figure 1). The median LOS among our cohort was 41 hours (interquartile range [IQR] 24-71) and the median 30-day readmission rate was 8.2% (IQR 7.2-9.4).
Admission Demographics for Weekends and Weekdays
Among the included hospitalizations, 92,266 (23.6%) admissions occurred on a weekend (Supplementary Table 1). Overall, a higher percentage of children <5 years of age were admitted on a weekend compared with those admitted on a weekday (53.3% vs 49.1%, P < .001). We observed a small but statistically significant difference in the proportion of weekend versus weekday admissions according to gender, race/ethnicity, payer, and median household income quartile. Children with medical complexity and those with technology dependence were admitted less frequently on a weekend. A higher proportion of children were admitted through the emergency department on a weekend and a higher frequency of ICU utilization was observed for children admitted on a weekend compared with those admitted on a weekday.
Association Between Study Variables and Length of Stay
In comparing adjusted LOS for weekend versus weekday admissions across 43 hospitals, not only did LOS vary across hospitals (P < .001), but the association between LOS and weekend versus weekday care also varied across hospitals (P < .001) (Figure 1). Weekend admission was associated with a significantly longer LOS at eight (18.6%) hospitals and a significantly shorter LOS at four (9.3%) hospitals with nonstatistically significant differences at the remaining hospitals.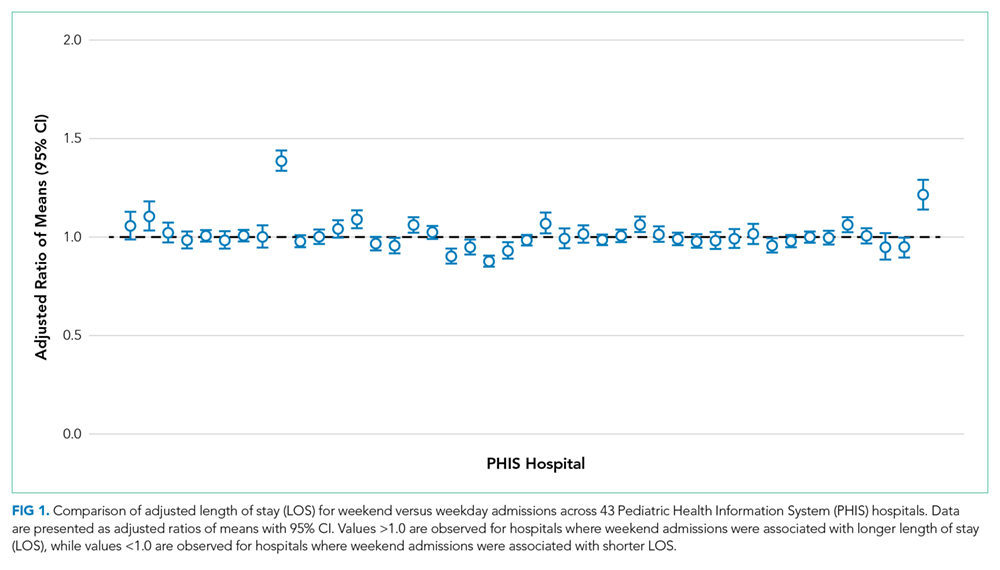
In adjusted analyses, we observed that infants ≤30 days of age, on average, had an adjusted LOS that was 24% longer than that of 15- to 17-year-olds, while children aged 1-14 years had an adjusted LOS that was 6%-18% shorter (Table 1). ICU utilization, admission through the emergency department, and number of chronic conditions had the greatest association with LOS. As the number of chronic conditions increased, the LOS increased. No association was found between weekend versus weekday admission and LOS (adjusted LOS [95% CI]: weekend 63.70 [61.01-66.52] hours versus weekday 63.40 [60.73-66.19] hours, P = .112).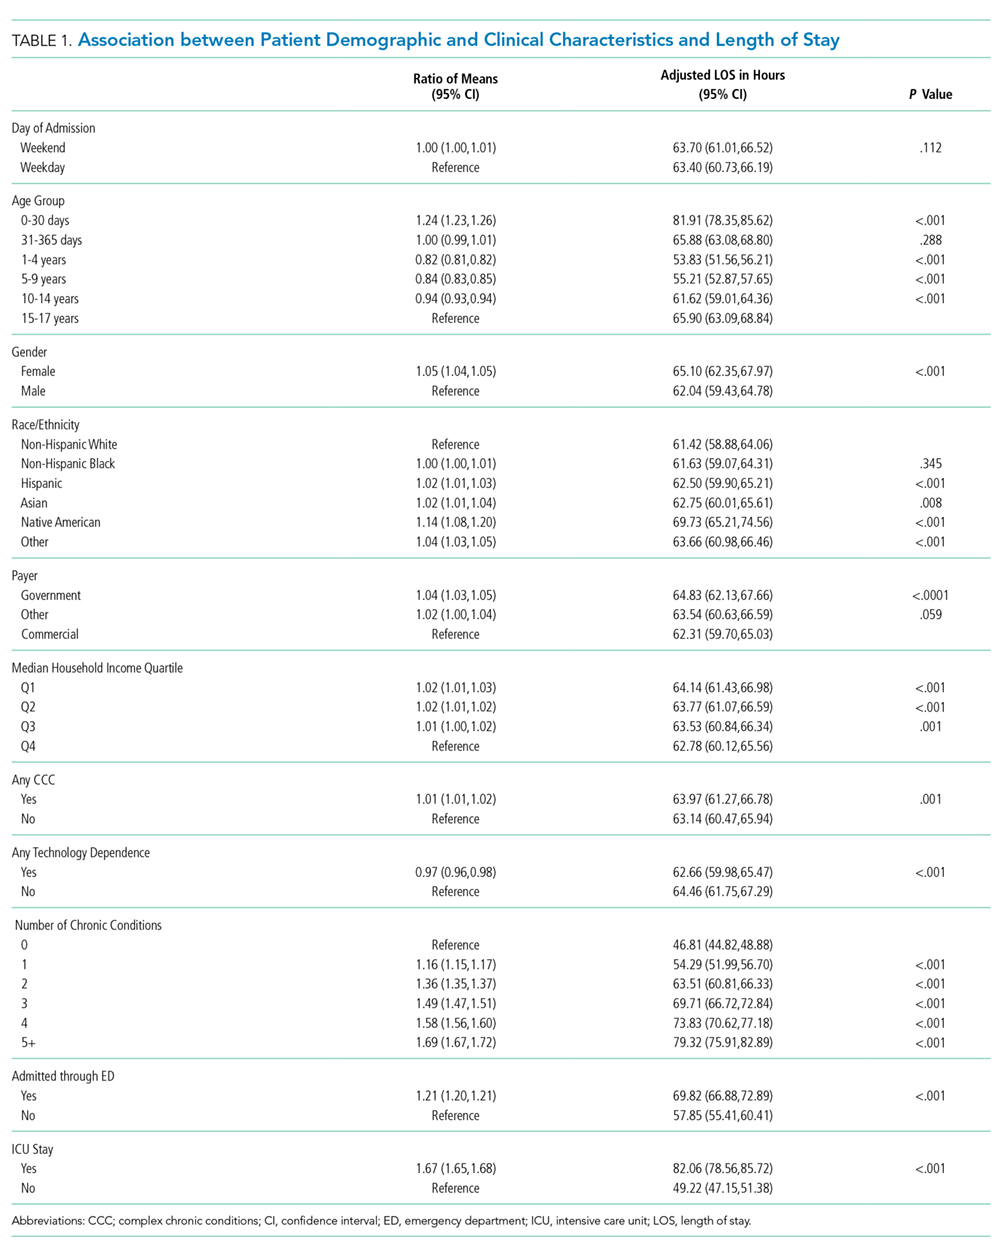
Discharge Demographics for Weekends and Weekdays
Of the included hospitalizations, 127,421 (32.6%) discharges occurred on a weekend (Supplementary Table 2). Overall, a greater percentage of weekend discharges comprised children <5 years of age compared with the percentage of weekday discharges for children <5 years of age (51.5% vs 49.5%, P < .001). No statistically significant differences were found in gender, payer, or median household income quartile between those children discharged on a weekend versus those discharged on a weekday. We found small, statistically significant differences in the proportion of weekend versus weekday discharges according to race/ethnicity, with fewer non-Hispanic white children being discharged on the weekend versus weekday. Children with medical complexity, technology dependence, and patients with ICU utilization were less frequently discharged on a weekend compared with those discharged on a weekday.
Association Between Study Variables and Readmissions
In comparing the adjusted odds of readmissions for weekend versus weekday discharges across 43 PHIS hospitals, we observed significant variation (P < .001) in readmission rates from hospital to hospital (Figure 2). However, the direction of impact of weekend care on readmissions was similar (P = .314) across hospitals (ie, for 37 of 43 hospitals, the readmission rate was greater for weekend discharges compared with that for weekday discharges). For 17 (39.5%) of 43 hospitals, weekend discharge was associated with a significantly higher readmission rate, while the differences between weekday and weekend discharge were not statistically significant for the remaining hospitals.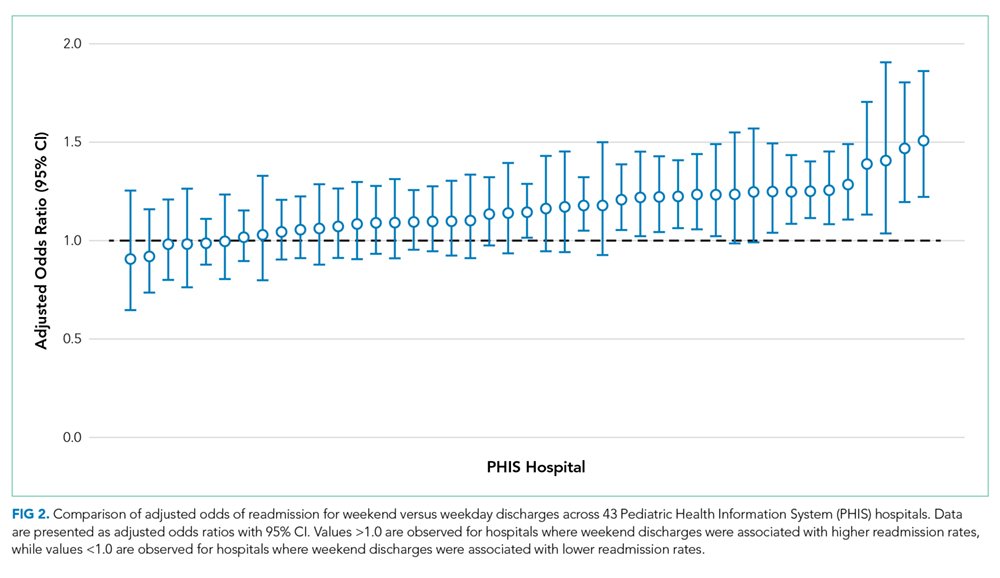
In adjusted analyses, we observed that infants <1 year were more likely to be readmitted compared with 15- to 17-year-olds, while children 5-14 years of age were less likely to be readmitted (Table 2). Medical complexity and the number of chronic conditions had the greatest association with readmissions, with increased likelihood of readmission observed as the number of chronic conditions increased. Weekend discharge was associated with increased probability of readmission compared with weekday discharge (adjusted probability of readmission [95% CI]: weekend 0.13 [0.12-0.13] vs weekday 0.11 [0.11-0.12], P < .001).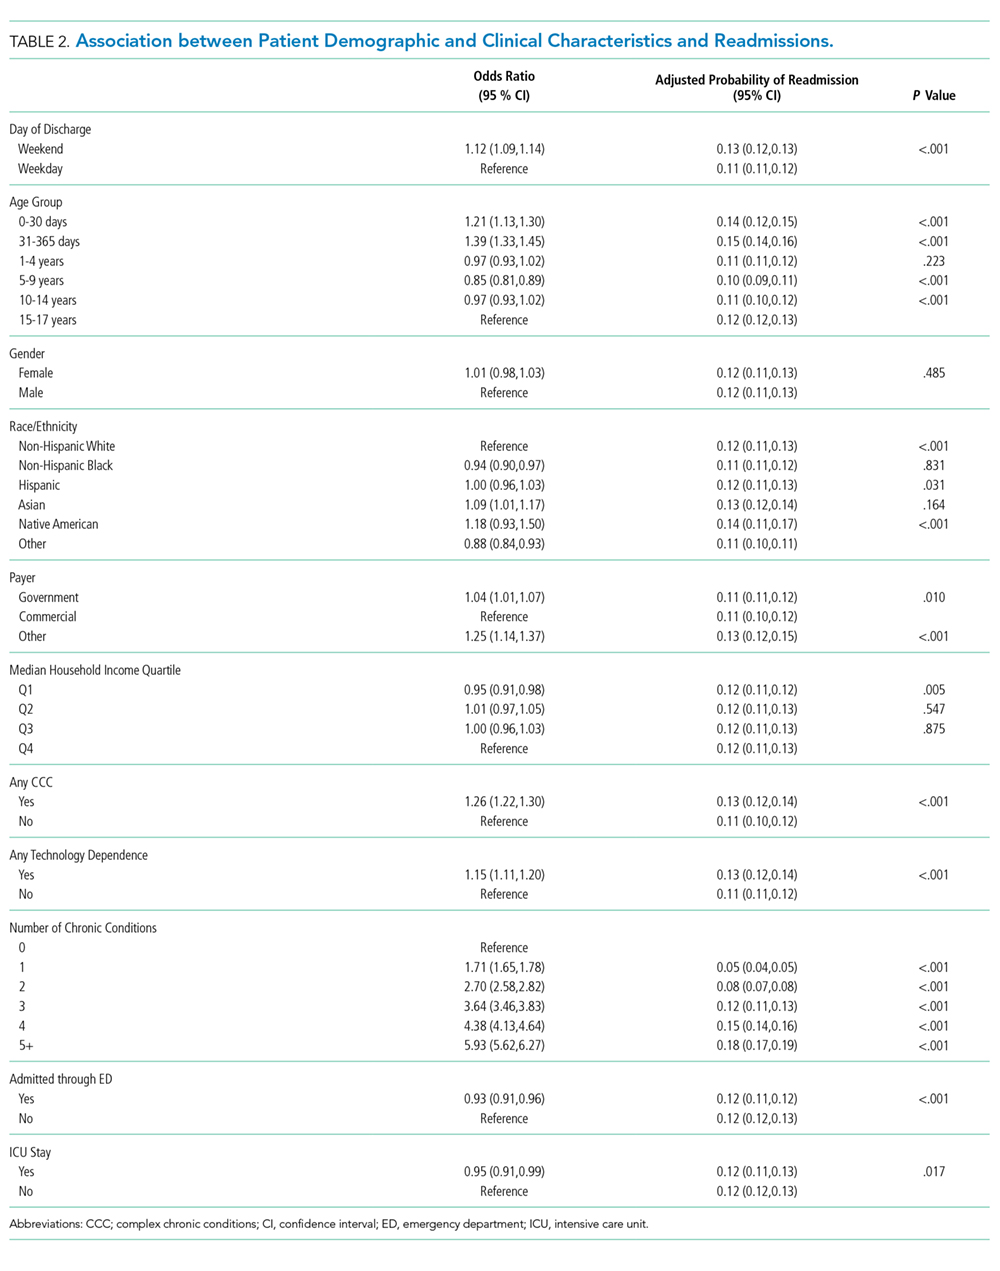
DISCUSSION
While the reasons for the weekend effect are unclear, data supporting this difference have been observed across many diverse patient groups and health systems both nationally and internationally.13-27,31 Weekend care is thought to differ from weekday care because of differences in physician and nurse staffing, availability of ancillary services, access to diagnostic testing and therapeutic interventions, ability to arrange outpatient follow-up, and individual patient clinical factors, including acuity of illness. Few studies have assessed the effect of weekend discharges on patient or system outcomes. Among children within a single health system, readmission risk was associated with weekend admission but not with weekend discharge.22 This observation suggests that if differential care exists, then it occurs during initial clinical management rather than during discharge planning. Consequently, understanding the interaction of weekend admission and LOS is important. In addition, the relative paucity of pediatric data examining a weekend discharge effect limits the ability to generalize these findings across other hospitals or health systems.
In contrast to prior work, we observed a modest increased risk for readmission among those discharged on the weekend in a large sample of children. Auger and Davis reported a lack of association between weekend discharge and readmissions at one tertiary care children’s hospital, citing reduced discharge volumes on the weekend, especially among children with medical complexity, as a possible driver for their observation.22 The inclusion of a much larger population across 43 hospitals in our study may explain our different findings compared with previous research. In addition, the inclusion/exclusion criteria differed between the two studies; we excluded index admissions for planned procedures in this study (which are more likely to occur during the week), which may have contributed to the differing conclusions. Although Auger and Davis suggest that differences in initial clinical management may be responsible for the weekend effect,22 our observations suggest that discharge planning practices may also contribute to readmission risk. For example, a family’s inability to access compounded medications at a local pharmacy or to access primary care following discharge could reasonably contribute to treatment failure and increased readmission risk. Attention to improving and standardizing discharge practices may alleviate differences in readmission risk among children discharged on a weekend.
Individual patient characteristics greatly influence LOS and readmission risk. Congruent with prior studies, medical complexity and technology dependence were among the factors in our study that had the strongest association with LOS and readmission risk.32 As with prior studies22, we observed that children with medical complexity and technology dependence were less frequently admitted and discharged on a weekend than on a weekday, which suggests that physicians may avoid complicated discharges on the weekend. Children with medical complexity present a unique challenge to physicians when assessing discharge readiness, given that these children frequently require careful coordination of durable medical equipment, obtainment of special medication preparations, and possibly the resumption or establishment of home health services. Notably, we cannot discern from our data what proportion of discharges may be delayed over the weekend secondary to challenges involved in coordinating care for children with medical complexity. Future investigations aimed at assessing physician decision making and discharge readiness in relation to discharge timing among children with medical complexity may establish this relationship more clearly.
We observed substantial variation in LOS and readmission risk across 43 tertiary care children’s hospitals. Since the 1970s, numerous studies have reported worse outcomes among patients admitted on the weekend. While the majority of studies support the weekend effect, several recent studies suggest that patients admitted on the weekend are at no greater risk of adverse outcomes than those admitted during the week.35-37 Our work builds on the existing literature, demonstrating a complex and variable relationship between weekend admission/discharge, LOS, and readmission risk across hospitals. Notably, while many hospitals in our study experienced a significant weekend effect in LOS or readmission risk, only four hospitals experienced a statistically significant weekend effect for both LOS and readmission risk (three hospitals experienced increased risk for both, while one hospital experienced increased readmission risk but decreased LOS). Future investigations of the weekend effect should focus on exploring the differences in admission/discharge practices and staffing patterns of hospitals that did or did not experience a weekend effect.
This study has several limitations
CONCLUSION
In a study of 43 children’s hospitals, children discharged on the weekend had a slightly increased readmission risk compared with children discharged on a weekday. Wide variation in the weekend effect on LOS and readmission risk was evident across hospitals. Individual patient characteristics had a greater impact on LOS and readmission risk than the weekend effect. Future investigations aimed at understanding which factors contribute most strongly to a weekend effect within individual hospitals (eg, differences in institutional admission/discharge practices) may help alleviate the weekend effect and improve healthcare quality.
Acknowledgments
This manuscript resulted from “Paper in a Day,” a Pediatric Research in Inpatient Settings (PRIS) Network-sponsored workshop presented at the Pediatric Hospital Medicine 2017 annual meeting. Workshop participants learned how to ask and answer a health services research question and efficiently prepare a manuscript for publication. The following are the members of the PRIS Network who contributed to this work: Jessica L. Bettenhausen, MD; Rebecca M. Cantu, MD, MPH; Jillian M Cotter, MD; Megan Deisz, MD; Teresa Frazer, MD; Pratichi Goenka, MD; Ashley Jenkins, MD; Kathryn E. Kyler, MD; Janet T. Lau, MD; Brian E. Lee, MD; Christiane Lenzen, MD; Trisha Marshall, MD; John M. Morrison MD, PhD; Lauren Nassetta, MD; Raymond Parlar-Chun, MD; Sonya Tang Girdwood MD, PhD; Tony R Tarchichi, MD; Irina G. Trifonova, MD; Jacqueline M. Walker, MD, MHPE; and Susan C. Walley, MD. See appendix for contact information for members of the PRIS Network
Funding
The authors have no financial relationships relevant to this article to disclose.
Disclosures
The authors have no conflicts of interest to disclose.
1. Crossing the Quality Chasm: The IOM Health Care Quality Initiative : Health and Medicine Division. http://www.nationalacademies.org/hmd/Global/News%20Announcements/Crossing-the-Quality-Chasm-The-IOM-Health-Care-Quality-Initiative.aspx. Accessed November 20, 2017.
2. Institute for Healthcare Improvement: IHI Home Page. http://www.ihi.org:80/Pages/default.aspx. Accessed November 20, 2017.
3. Berry JG, Zaslavsky AM, Toomey SL, et al. Recognizing differences in hospital quality performance for pediatric inpatient care. Pediatrics. 2015;136(2):251-262. doi:10.1542/peds.2014-3131
4. NQF: All-Cause Admissions and Readmissions Measures - Final Report. http://www.qualityforum.org/Publications/2015/04/All-Cause_Admissions_and_Readmissions_Measures_-_Final_Report.aspx. Accessed March 24, 2018.
5. Hospital Inpatient Potentially Preventable Readmissions Information and Reports. https://www.illinois.gov/hfs/MedicalProviders/hospitals/PPRReports/Pages/default.aspx. Accessed November 6, 2016.
6. Potentially Preventable Readmissions in Texas Medicaid and CHIP Programs - Fiscal Year 2013 | Texas Health and Human Services. https://hhs.texas.gov/reports/2016/08/potentially-preventable-readmissions-texas-medicaid-and-chip-programs-fiscal-year. Accessed November 6, 2016.
7. Statewide Planning and Research Cooperative System. http://www.health.ny.gov/statistics/sparcs/sb/. Accessed November 6, 2016.
8. HCA Implements Potentially Preventable Readmission (PPR) Adjustments. Wash State Hosp Assoc. http://www.wsha.org/articles/hca-implements-potentially-preventable-readmission-ppr-adjustments/. Accessed November 8, 2016.
9. Berry JG, Toomey SL, Zaslavsky AM, et al. Pediatric readmission prevalence and variability across hospitals. JAMA. 2013;309(4):372-380. doi:10.1001/jama.2012.188351 PubMed
10. Bardach NS, Vittinghoff E, Asteria-Peñaloza R, et al. Measuring hospital quality using pediatric readmission and revisit rates. Pediatrics. 2013;132(3):429-436. doi:10.1542/peds.2012-3527 PubMed
11. Berry JG, Blaine K, Rogers J, et al. A framework of pediatric hospital discharge care informed by legislation, research, and practice. JAMA Pediatr. 2014;168(10):955-962; quiz 965-966. doi:10.1001/jamapediatrics.2014.891 PubMed
12. Auger KA, Simon TD, Cooperberg D, et al. Summary of STARNet: seamless transitions and (Re)admissions network. Pediatrics. 2015;135(1):164. doi:10.1542/peds.2014-1887 PubMed
13. Freemantle N, Ray D, McNulty D, et al. Increased mortality associated with weekend hospital admission: a case for expanded seven day services? BMJ. 2015;351:h4596. doi:10.1136/bmj.h4596 PubMed
14. Schilling PL, Campbell DA, Englesbe MJ, Davis MM. A comparison of in-hospital mortality risk conferred by high hospital occupancy, differences in nurse staffing levels, weekend admission, and seasonal influenza. Med Care. 2010;48(3):224-232. doi:10.1097/MLR.0b013e3181c162c0 PubMed
15. Cram P, Hillis SL, Barnett M, Rosenthal GE. Effects of weekend admission and hospital teaching status on in-hospital mortality. Am J Med. 2004;117(3):151-157. doi:10.1016/j.amjmed.2004.02.035 PubMed
16. Zapf MAC, Kothari AN, Markossian T, et al. The “weekend effect” in urgent general operative procedures. Surgery. 2015;158(2):508-514. doi:10.1016/j.surg.2015.02.024 PubMed
17. Freemantle N, Richardson M, Wood J, et al. Weekend hospitalization and additional risk of death: an analysis of inpatient data. J R Soc Med. 2012;105(2):74-84. doi:10.1258/jrsm.2012.120009 PubMed
18. Bell CM, Redelmeier DA. Mortality among patients admitted to hospitals on weekends as compared with weekdays. N Engl J Med. 2001;345(9):663-668. doi:10.1056/NEJMsa003376 PubMed
19. Coiera E, Wang Y, Magrabi F, Concha OP, Gallego B, Runciman W. Predicting the cumulative risk of death during hospitalization by modeling weekend, weekday and diurnal mortality risks. BMC Health Serv Res. 2014;14:226. doi:10.1186/1472-6963-14-226 PubMed
20. Powell ES, Khare RK, Courtney DM, Feinglass J. The weekend effect for patients with sepsis presenting to the emergency department. J Emerg Med. 2013;45(5):641-648. doi:10.1016/j.jemermed.2013.04.042 PubMed
21. Ananthakrishnan AN, McGinley EL, Saeian K. Outcomes of weekend admissions for upper gastrointestinal hemorrhage: a nationwide analysis. Clin Gastroenterol Hepatol Off Clin Pract J Am Gastroenterol Assoc. 2009;7(3):296-302e1. doi:10.1016/j.cgh.2008.08.013 PubMed
22. Auger KA, Davis MM. Pediatric weekend admission and increased unplanned readmission rates. J Hosp Med. 2015;10(11):743-745. doi:10.1002/jhm.2426 PubMed
23. Goldstein SD, Papandria DJ, Aboagye J, et al. The “weekend effect” in pediatric surgery - increased mortality for children undergoing urgent surgery during the weekend. J Pediatr Surg. 2014;49(7):1087-1091. doi:10.1016/j.jpedsurg.2014.01.001 PubMed
24. Adil MM, Vidal G, Beslow LA. Weekend effect in children with stroke in the nationwide inpatient sample. Stroke. 2016;47(6):1436-1443. doi:10.1161/STROKEAHA.116.013453 PubMed
25. McCrory MC, Spaeder MC, Gower EW, et al. Time of admission to the PICU and mortality. Pediatr Crit Care Med J Soc Crit Care Med World Fed Pediatr Intensive Crit Care Soc. 2017;18(10):915-923. doi:10.1097/PCC.0000000000001268 PubMed
26. Mangold WD. Neonatal mortality by the day of the week in the 1974-75 Arkansas live birth cohort. Am J Public Health. 1981;71(6):601-605. PubMed
27. MacFarlane A. Variations in number of births and perinatal mortality by day of week in England and Wales. Br Med J. 1978;2(6153):1670-1673. PubMed
28. McShane P, Draper ES, McKinney PA, McFadzean J, Parslow RC, Paediatric intensive care audit network (PICANet). Effects of out-of-hours and winter admissions and number of patients per unit on mortality in pediatric intensive care. J Pediatr. 2013;163(4):1039-1044.e5. doi:10.1016/j.jpeds.2013.03.061 PubMed
29. Hixson ED, Davis S, Morris S, Harrison AM. Do weekends or evenings matter in a pediatric intensive care unit? Pediatr Crit Care Med J Soc Crit Care Med World Fed Pediatr Intensive Crit Care Soc. 2005;6(5):523-530. PubMed
30. Gonzalez KW, Dalton BGA, Weaver KL, Sherman AK, St Peter SD, Snyder CL. Effect of timing of cannulation on outcome for pediatric extracorporeal life support. Pediatr Surg Int. 2016;32(7):665-669. doi:10.1007/s00383-016-3901-6 PubMed
31. Desai V, Gonda D, Ryan SL, et al. The effect of weekend and after-hours surgery on morbidity and mortality rates in pediatric neurosurgery patients. J Neurosurg Pediatr. 2015;16(6):726-731. doi:10.3171/2015.6.PEDS15184 PubMed
32. Berry JG, Hall DE, Kuo DZ, et al. Hospital utilization and characteristics of patients experiencing recurrent readmissions within children’s hospitals. JAMA. 2011;305(7):682-690. doi:10.1001/jama.2011.122 PubMed
33. Hoshijima H, Takeuchi R, Mihara T, et al. Weekend versus weekday admission and short-term mortality: A meta-analysis of 88 cohort studies including 56,934,649 participants. Medicine (Baltimore). 2017;96(17):e6685. doi:10.1097/MD.0000000000006685 PubMed
34. Feudtner C, Feinstein JA, Zhong W, Hall M, Dai D. Pediatric complex chronic conditions classification system version 2: updated for ICD-10 and complex medical technology dependence and transplantation. BMC Pediatr. 2014;14:199. doi:10.1186/1471-2431-14-199 PubMed
35. Li L, Rothwell PM, Oxford Vascular Study. Biases in detection of apparent “weekend effect” on outcome with administrative coding data: population based study of stroke. BMJ. 2016;353:i2648. doi: https://doi.org/10.1136/bmj.i2648 PubMed
36. Bray BD, Cloud GC, James MA, et al. Weekly variation in health-care quality by day and time of admission: a nationwide, registry-based, prospective cohort study of acute stroke care. The Lancet. 2016;388(10040):170-177. doi:10.1016/S0140-6736(16)30443-3 PubMed
37. Ko SQ, Strom JB, Shen C, Yeh RW. Mortality, Length of Stay, and Cost of Weekend Admissions. J Hosp Med. 2018. doi:10.12788/jhm.2906 PubMed
38. Tubbs-Cooley HL, Cimiotti JP, Silber JH, Sloane DM, Aiken LH. An observational study of nurse staffing ratios and hospital readmission among children admitted for common conditions. BMJ Qual Saf. 2013;22(9):735-742. doi:10.1136/bmjqs-2012-001610 PubMed
39. Ong M, Bostrom A, Vidyarthi A, McCulloch C, Auerbach A. House staff team workload and organization effects on patient outcomes in an academic general internal medicine inpatient service. Arch Intern Med. 2007;167(1):47-52. doi:10.1001/archinte.167.1.47 PubMed
Increasingly, metrics such as length of stay (LOS) and readmissions are being utilized in the United States to assess quality of healthcare because these factors may represent opportunities to reduce cost and improve healthcare delivery.1-8 However, the relatively low rate of pediatric readmissions,9 coupled with limited data regarding recommended LOS or best practices to prevent readmissions in children, challenges the ability of hospitals to safely reduce LOS and readmission rates for children.10–12
In adults, weekend admission is associated with prolonged LOS, increased readmission rates, and increased risk of mortality.13-21 This association is referred to as the “weekend effect.” While the weekend effect has been examined in children, the results of these studies have been variable, with some studies supporting this association and others refuting it.22-31 In contrast to patient demographic and clinical characteristics that are known to affect LOS and readmissions,32 the weekend effect represents a potentially modifiable aspect of a hospitalization that could be targeted to improve healthcare delivery.
With increasing national attention toward improving quality of care and reducing LOS and healthcare costs, more definitive evidence of the weekend effect is necessary to prioritize resource use at both the local and national levels. Therefore, we sought to determine the association of weekend admission and weekend discharge on LOS and 30-day readmissions, respectively, among a national cohort of children. We hypothesized that children admitted on the weekend would have longer LOS, whereas those discharged on the weekend would have higher readmission rates.
METHODS
Study Design and Data Source
We conducted a multicenter, retrospective, cross-sectional study. Data were obtained from the Pediatric Health Information System (PHIS), an administrative and billing database of 46 free-standing tertiary care pediatric hospitals affiliated with the Children’s Hospital Association (Lenexa, Kansas). Patient data are de-identified within PHIS; however, encrypted patient identifiers allow individual patients to be followed across visits. This study was not considered human subjects research by the policies of the Cincinnati Children’s Hospital Institutional Review Board.
Participants
We included hospitalizations to a PHIS-participating hospital for children aged 0-17 years between October 1, 2014 and September 30, 2015. We excluded children who were transferred from/to another institution, left against medical advice, or died in the hospital because these indications may result in incomplete LOS information and would not consistently contribute to readmission rates. We also excluded birth hospitalizations and children admitted for planned procedures. Birth hospitalizations were defined as hospitalizations that began on the day of birth.
Main Exposures
No standard definition of weekend admission or discharge was identified in the literature.33 Thus, we defined a weekend admission as an admission between 3:00
Main Outcomes
Our outcomes included LOS for weekend admission and 30-day readmissions for weekend discharge. LOS, measured in hours, was defined using the reported admission and discharge times. Readmissions were defined as a return to the same hospital within the subsequent 30 days following discharge.
Patient Demographics and Other Study Variables
Patient demographics included age, gender, race/ethnicity, payer, and median household income quartile based on the patient’s home ZIP code. Other study variables included presence of a complex chronic condition (CCC),34 technology dependence,34 number of chronic conditions of any complexity, admission through the emergency department, intensive care unit (ICU) admission, and case mix index. ICU admission and case mix index were chosen as markers for severity of illness. ICU admission was defined as any child who incurred ICU charges at any time following admission. Case mix index in PHIS is a relative weight assigned to each discharge based on the All-Patient Refined Diagnostic Group (APR-DRG; 3M) assignment and APR-DRG severity of illness, which ranges from 1 (minor) to 4 (extreme). The weights are derived by the Children’s Hospital Association from the HCUP KID 2012 database as the ratio of the average cost for discharges within a specific APR-DRG severity of illness combination to the average cost for all discharges in the database.
Statistical Analysis
Continuous variables were summarized with medians and interquartile ranges, while categorical variables were summarized with frequencies and percentages. Differences in admission and discharge characteristics between weekend and weekday were assessed using Wilcoxon rank sum tests for continuous variables and chi-square tests of association for categorical variables. We used generalized linear mixed modeling (GLMM) techniques to assess the impact of weekend admission on LOS and weekend discharge on readmission, adjusting for important patient demographic and clinical characteristics. Furthermore, we used GLMM point estimates to describe the variation across hospitals of the impact of weekday versus weekend care on LOS and readmissions. We assumed an underlying log-normal distribution for LOS and an underlying binomial distribution for 30-day readmission. All GLMMs included a random intercept for each hospital to account for patient clustering within a hospital. All statistical analyses were performed using SAS v.9.4 (SAS Institute, Cary, North Carolina), and P values <.05 were considered statistically significant.
RESULTS
We identified 390,745 hospitalizations that met inclusion criteria (Supplementary Figure 1). The median LOS among our cohort was 41 hours (interquartile range [IQR] 24-71) and the median 30-day readmission rate was 8.2% (IQR 7.2-9.4).
Admission Demographics for Weekends and Weekdays
Among the included hospitalizations, 92,266 (23.6%) admissions occurred on a weekend (Supplementary Table 1). Overall, a higher percentage of children <5 years of age were admitted on a weekend compared with those admitted on a weekday (53.3% vs 49.1%, P < .001). We observed a small but statistically significant difference in the proportion of weekend versus weekday admissions according to gender, race/ethnicity, payer, and median household income quartile. Children with medical complexity and those with technology dependence were admitted less frequently on a weekend. A higher proportion of children were admitted through the emergency department on a weekend and a higher frequency of ICU utilization was observed for children admitted on a weekend compared with those admitted on a weekday.
Association Between Study Variables and Length of Stay
In comparing adjusted LOS for weekend versus weekday admissions across 43 hospitals, not only did LOS vary across hospitals (P < .001), but the association between LOS and weekend versus weekday care also varied across hospitals (P < .001) (Figure 1). Weekend admission was associated with a significantly longer LOS at eight (18.6%) hospitals and a significantly shorter LOS at four (9.3%) hospitals with nonstatistically significant differences at the remaining hospitals.
In adjusted analyses, we observed that infants ≤30 days of age, on average, had an adjusted LOS that was 24% longer than that of 15- to 17-year-olds, while children aged 1-14 years had an adjusted LOS that was 6%-18% shorter (Table 1). ICU utilization, admission through the emergency department, and number of chronic conditions had the greatest association with LOS. As the number of chronic conditions increased, the LOS increased. No association was found between weekend versus weekday admission and LOS (adjusted LOS [95% CI]: weekend 63.70 [61.01-66.52] hours versus weekday 63.40 [60.73-66.19] hours, P = .112).
Discharge Demographics for Weekends and Weekdays
Of the included hospitalizations, 127,421 (32.6%) discharges occurred on a weekend (Supplementary Table 2). Overall, a greater percentage of weekend discharges comprised children <5 years of age compared with the percentage of weekday discharges for children <5 years of age (51.5% vs 49.5%, P < .001). No statistically significant differences were found in gender, payer, or median household income quartile between those children discharged on a weekend versus those discharged on a weekday. We found small, statistically significant differences in the proportion of weekend versus weekday discharges according to race/ethnicity, with fewer non-Hispanic white children being discharged on the weekend versus weekday. Children with medical complexity, technology dependence, and patients with ICU utilization were less frequently discharged on a weekend compared with those discharged on a weekday.
Association Between Study Variables and Readmissions
In comparing the adjusted odds of readmissions for weekend versus weekday discharges across 43 PHIS hospitals, we observed significant variation (P < .001) in readmission rates from hospital to hospital (Figure 2). However, the direction of impact of weekend care on readmissions was similar (P = .314) across hospitals (ie, for 37 of 43 hospitals, the readmission rate was greater for weekend discharges compared with that for weekday discharges). For 17 (39.5%) of 43 hospitals, weekend discharge was associated with a significantly higher readmission rate, while the differences between weekday and weekend discharge were not statistically significant for the remaining hospitals.
In adjusted analyses, we observed that infants <1 year were more likely to be readmitted compared with 15- to 17-year-olds, while children 5-14 years of age were less likely to be readmitted (Table 2). Medical complexity and the number of chronic conditions had the greatest association with readmissions, with increased likelihood of readmission observed as the number of chronic conditions increased. Weekend discharge was associated with increased probability of readmission compared with weekday discharge (adjusted probability of readmission [95% CI]: weekend 0.13 [0.12-0.13] vs weekday 0.11 [0.11-0.12], P < .001).
DISCUSSION
While the reasons for the weekend effect are unclear, data supporting this difference have been observed across many diverse patient groups and health systems both nationally and internationally.13-27,31 Weekend care is thought to differ from weekday care because of differences in physician and nurse staffing, availability of ancillary services, access to diagnostic testing and therapeutic interventions, ability to arrange outpatient follow-up, and individual patient clinical factors, including acuity of illness. Few studies have assessed the effect of weekend discharges on patient or system outcomes. Among children within a single health system, readmission risk was associated with weekend admission but not with weekend discharge.22 This observation suggests that if differential care exists, then it occurs during initial clinical management rather than during discharge planning. Consequently, understanding the interaction of weekend admission and LOS is important. In addition, the relative paucity of pediatric data examining a weekend discharge effect limits the ability to generalize these findings across other hospitals or health systems.
In contrast to prior work, we observed a modest increased risk for readmission among those discharged on the weekend in a large sample of children. Auger and Davis reported a lack of association between weekend discharge and readmissions at one tertiary care children’s hospital, citing reduced discharge volumes on the weekend, especially among children with medical complexity, as a possible driver for their observation.22 The inclusion of a much larger population across 43 hospitals in our study may explain our different findings compared with previous research. In addition, the inclusion/exclusion criteria differed between the two studies; we excluded index admissions for planned procedures in this study (which are more likely to occur during the week), which may have contributed to the differing conclusions. Although Auger and Davis suggest that differences in initial clinical management may be responsible for the weekend effect,22 our observations suggest that discharge planning practices may also contribute to readmission risk. For example, a family’s inability to access compounded medications at a local pharmacy or to access primary care following discharge could reasonably contribute to treatment failure and increased readmission risk. Attention to improving and standardizing discharge practices may alleviate differences in readmission risk among children discharged on a weekend.
Individual patient characteristics greatly influence LOS and readmission risk. Congruent with prior studies, medical complexity and technology dependence were among the factors in our study that had the strongest association with LOS and readmission risk.32 As with prior studies22, we observed that children with medical complexity and technology dependence were less frequently admitted and discharged on a weekend than on a weekday, which suggests that physicians may avoid complicated discharges on the weekend. Children with medical complexity present a unique challenge to physicians when assessing discharge readiness, given that these children frequently require careful coordination of durable medical equipment, obtainment of special medication preparations, and possibly the resumption or establishment of home health services. Notably, we cannot discern from our data what proportion of discharges may be delayed over the weekend secondary to challenges involved in coordinating care for children with medical complexity. Future investigations aimed at assessing physician decision making and discharge readiness in relation to discharge timing among children with medical complexity may establish this relationship more clearly.
We observed substantial variation in LOS and readmission risk across 43 tertiary care children’s hospitals. Since the 1970s, numerous studies have reported worse outcomes among patients admitted on the weekend. While the majority of studies support the weekend effect, several recent studies suggest that patients admitted on the weekend are at no greater risk of adverse outcomes than those admitted during the week.35-37 Our work builds on the existing literature, demonstrating a complex and variable relationship between weekend admission/discharge, LOS, and readmission risk across hospitals. Notably, while many hospitals in our study experienced a significant weekend effect in LOS or readmission risk, only four hospitals experienced a statistically significant weekend effect for both LOS and readmission risk (three hospitals experienced increased risk for both, while one hospital experienced increased readmission risk but decreased LOS). Future investigations of the weekend effect should focus on exploring the differences in admission/discharge practices and staffing patterns of hospitals that did or did not experience a weekend effect.
This study has several limitations
CONCLUSION
In a study of 43 children’s hospitals, children discharged on the weekend had a slightly increased readmission risk compared with children discharged on a weekday. Wide variation in the weekend effect on LOS and readmission risk was evident across hospitals. Individual patient characteristics had a greater impact on LOS and readmission risk than the weekend effect. Future investigations aimed at understanding which factors contribute most strongly to a weekend effect within individual hospitals (eg, differences in institutional admission/discharge practices) may help alleviate the weekend effect and improve healthcare quality.
Acknowledgments
This manuscript resulted from “Paper in a Day,” a Pediatric Research in Inpatient Settings (PRIS) Network-sponsored workshop presented at the Pediatric Hospital Medicine 2017 annual meeting. Workshop participants learned how to ask and answer a health services research question and efficiently prepare a manuscript for publication. The following are the members of the PRIS Network who contributed to this work: Jessica L. Bettenhausen, MD; Rebecca M. Cantu, MD, MPH; Jillian M Cotter, MD; Megan Deisz, MD; Teresa Frazer, MD; Pratichi Goenka, MD; Ashley Jenkins, MD; Kathryn E. Kyler, MD; Janet T. Lau, MD; Brian E. Lee, MD; Christiane Lenzen, MD; Trisha Marshall, MD; John M. Morrison MD, PhD; Lauren Nassetta, MD; Raymond Parlar-Chun, MD; Sonya Tang Girdwood MD, PhD; Tony R Tarchichi, MD; Irina G. Trifonova, MD; Jacqueline M. Walker, MD, MHPE; and Susan C. Walley, MD. See appendix for contact information for members of the PRIS Network
Funding
The authors have no financial relationships relevant to this article to disclose.
Disclosures
The authors have no conflicts of interest to disclose.
1. Crossing the Quality Chasm: The IOM Health Care Quality Initiative : Health and Medicine Division. http://www.nationalacademies.org/hmd/Global/News%20Announcements/Crossing-the-Quality-Chasm-The-IOM-Health-Care-Quality-Initiative.aspx. Accessed November 20, 2017.
2. Institute for Healthcare Improvement: IHI Home Page. http://www.ihi.org:80/Pages/default.aspx. Accessed November 20, 2017.
3. Berry JG, Zaslavsky AM, Toomey SL, et al. Recognizing differences in hospital quality performance for pediatric inpatient care. Pediatrics. 2015;136(2):251-262. doi:10.1542/peds.2014-3131
4. NQF: All-Cause Admissions and Readmissions Measures - Final Report. http://www.qualityforum.org/Publications/2015/04/All-Cause_Admissions_and_Readmissions_Measures_-_Final_Report.aspx. Accessed March 24, 2018.
5. Hospital Inpatient Potentially Preventable Readmissions Information and Reports. https://www.illinois.gov/hfs/MedicalProviders/hospitals/PPRReports/Pages/default.aspx. Accessed November 6, 2016.
6. Potentially Preventable Readmissions in Texas Medicaid and CHIP Programs - Fiscal Year 2013 | Texas Health and Human Services. https://hhs.texas.gov/reports/2016/08/potentially-preventable-readmissions-texas-medicaid-and-chip-programs-fiscal-year. Accessed November 6, 2016.
7. Statewide Planning and Research Cooperative System. http://www.health.ny.gov/statistics/sparcs/sb/. Accessed November 6, 2016.
8. HCA Implements Potentially Preventable Readmission (PPR) Adjustments. Wash State Hosp Assoc. http://www.wsha.org/articles/hca-implements-potentially-preventable-readmission-ppr-adjustments/. Accessed November 8, 2016.
9. Berry JG, Toomey SL, Zaslavsky AM, et al. Pediatric readmission prevalence and variability across hospitals. JAMA. 2013;309(4):372-380. doi:10.1001/jama.2012.188351 PubMed
10. Bardach NS, Vittinghoff E, Asteria-Peñaloza R, et al. Measuring hospital quality using pediatric readmission and revisit rates. Pediatrics. 2013;132(3):429-436. doi:10.1542/peds.2012-3527 PubMed
11. Berry JG, Blaine K, Rogers J, et al. A framework of pediatric hospital discharge care informed by legislation, research, and practice. JAMA Pediatr. 2014;168(10):955-962; quiz 965-966. doi:10.1001/jamapediatrics.2014.891 PubMed
12. Auger KA, Simon TD, Cooperberg D, et al. Summary of STARNet: seamless transitions and (Re)admissions network. Pediatrics. 2015;135(1):164. doi:10.1542/peds.2014-1887 PubMed
13. Freemantle N, Ray D, McNulty D, et al. Increased mortality associated with weekend hospital admission: a case for expanded seven day services? BMJ. 2015;351:h4596. doi:10.1136/bmj.h4596 PubMed
14. Schilling PL, Campbell DA, Englesbe MJ, Davis MM. A comparison of in-hospital mortality risk conferred by high hospital occupancy, differences in nurse staffing levels, weekend admission, and seasonal influenza. Med Care. 2010;48(3):224-232. doi:10.1097/MLR.0b013e3181c162c0 PubMed
15. Cram P, Hillis SL, Barnett M, Rosenthal GE. Effects of weekend admission and hospital teaching status on in-hospital mortality. Am J Med. 2004;117(3):151-157. doi:10.1016/j.amjmed.2004.02.035 PubMed
16. Zapf MAC, Kothari AN, Markossian T, et al. The “weekend effect” in urgent general operative procedures. Surgery. 2015;158(2):508-514. doi:10.1016/j.surg.2015.02.024 PubMed
17. Freemantle N, Richardson M, Wood J, et al. Weekend hospitalization and additional risk of death: an analysis of inpatient data. J R Soc Med. 2012;105(2):74-84. doi:10.1258/jrsm.2012.120009 PubMed
18. Bell CM, Redelmeier DA. Mortality among patients admitted to hospitals on weekends as compared with weekdays. N Engl J Med. 2001;345(9):663-668. doi:10.1056/NEJMsa003376 PubMed
19. Coiera E, Wang Y, Magrabi F, Concha OP, Gallego B, Runciman W. Predicting the cumulative risk of death during hospitalization by modeling weekend, weekday and diurnal mortality risks. BMC Health Serv Res. 2014;14:226. doi:10.1186/1472-6963-14-226 PubMed
20. Powell ES, Khare RK, Courtney DM, Feinglass J. The weekend effect for patients with sepsis presenting to the emergency department. J Emerg Med. 2013;45(5):641-648. doi:10.1016/j.jemermed.2013.04.042 PubMed
21. Ananthakrishnan AN, McGinley EL, Saeian K. Outcomes of weekend admissions for upper gastrointestinal hemorrhage: a nationwide analysis. Clin Gastroenterol Hepatol Off Clin Pract J Am Gastroenterol Assoc. 2009;7(3):296-302e1. doi:10.1016/j.cgh.2008.08.013 PubMed
22. Auger KA, Davis MM. Pediatric weekend admission and increased unplanned readmission rates. J Hosp Med. 2015;10(11):743-745. doi:10.1002/jhm.2426 PubMed
23. Goldstein SD, Papandria DJ, Aboagye J, et al. The “weekend effect” in pediatric surgery - increased mortality for children undergoing urgent surgery during the weekend. J Pediatr Surg. 2014;49(7):1087-1091. doi:10.1016/j.jpedsurg.2014.01.001 PubMed
24. Adil MM, Vidal G, Beslow LA. Weekend effect in children with stroke in the nationwide inpatient sample. Stroke. 2016;47(6):1436-1443. doi:10.1161/STROKEAHA.116.013453 PubMed
25. McCrory MC, Spaeder MC, Gower EW, et al. Time of admission to the PICU and mortality. Pediatr Crit Care Med J Soc Crit Care Med World Fed Pediatr Intensive Crit Care Soc. 2017;18(10):915-923. doi:10.1097/PCC.0000000000001268 PubMed
26. Mangold WD. Neonatal mortality by the day of the week in the 1974-75 Arkansas live birth cohort. Am J Public Health. 1981;71(6):601-605. PubMed
27. MacFarlane A. Variations in number of births and perinatal mortality by day of week in England and Wales. Br Med J. 1978;2(6153):1670-1673. PubMed
28. McShane P, Draper ES, McKinney PA, McFadzean J, Parslow RC, Paediatric intensive care audit network (PICANet). Effects of out-of-hours and winter admissions and number of patients per unit on mortality in pediatric intensive care. J Pediatr. 2013;163(4):1039-1044.e5. doi:10.1016/j.jpeds.2013.03.061 PubMed
29. Hixson ED, Davis S, Morris S, Harrison AM. Do weekends or evenings matter in a pediatric intensive care unit? Pediatr Crit Care Med J Soc Crit Care Med World Fed Pediatr Intensive Crit Care Soc. 2005;6(5):523-530. PubMed
30. Gonzalez KW, Dalton BGA, Weaver KL, Sherman AK, St Peter SD, Snyder CL. Effect of timing of cannulation on outcome for pediatric extracorporeal life support. Pediatr Surg Int. 2016;32(7):665-669. doi:10.1007/s00383-016-3901-6 PubMed
31. Desai V, Gonda D, Ryan SL, et al. The effect of weekend and after-hours surgery on morbidity and mortality rates in pediatric neurosurgery patients. J Neurosurg Pediatr. 2015;16(6):726-731. doi:10.3171/2015.6.PEDS15184 PubMed
32. Berry JG, Hall DE, Kuo DZ, et al. Hospital utilization and characteristics of patients experiencing recurrent readmissions within children’s hospitals. JAMA. 2011;305(7):682-690. doi:10.1001/jama.2011.122 PubMed
33. Hoshijima H, Takeuchi R, Mihara T, et al. Weekend versus weekday admission and short-term mortality: A meta-analysis of 88 cohort studies including 56,934,649 participants. Medicine (Baltimore). 2017;96(17):e6685. doi:10.1097/MD.0000000000006685 PubMed
34. Feudtner C, Feinstein JA, Zhong W, Hall M, Dai D. Pediatric complex chronic conditions classification system version 2: updated for ICD-10 and complex medical technology dependence and transplantation. BMC Pediatr. 2014;14:199. doi:10.1186/1471-2431-14-199 PubMed
35. Li L, Rothwell PM, Oxford Vascular Study. Biases in detection of apparent “weekend effect” on outcome with administrative coding data: population based study of stroke. BMJ. 2016;353:i2648. doi: https://doi.org/10.1136/bmj.i2648 PubMed
36. Bray BD, Cloud GC, James MA, et al. Weekly variation in health-care quality by day and time of admission: a nationwide, registry-based, prospective cohort study of acute stroke care. The Lancet. 2016;388(10040):170-177. doi:10.1016/S0140-6736(16)30443-3 PubMed
37. Ko SQ, Strom JB, Shen C, Yeh RW. Mortality, Length of Stay, and Cost of Weekend Admissions. J Hosp Med. 2018. doi:10.12788/jhm.2906 PubMed
38. Tubbs-Cooley HL, Cimiotti JP, Silber JH, Sloane DM, Aiken LH. An observational study of nurse staffing ratios and hospital readmission among children admitted for common conditions. BMJ Qual Saf. 2013;22(9):735-742. doi:10.1136/bmjqs-2012-001610 PubMed
39. Ong M, Bostrom A, Vidyarthi A, McCulloch C, Auerbach A. House staff team workload and organization effects on patient outcomes in an academic general internal medicine inpatient service. Arch Intern Med. 2007;167(1):47-52. doi:10.1001/archinte.167.1.47 PubMed
© 2018 Society of Hospital Medicine
Prevalence of Staphylococcus aureus and Use of Antistaphylococcal Therapy in Children Hospitalized with Pneumonia
Although Staphylococcus aureus pneumonia is common in children with cystic fibrosis and those with healthcare-associated infections (eg, ventilator-associated pneumonia),1,2 S. aureus is an uncommon cause of community-acquired pneumonia in children. In recent years, concerns have arisen about the increasing frequency and severity of staphylococcal pneumonia, largely fueled by the emergence of community-associated methicillin-resistant S. aureus (MRSA).3,4 Thus, therapy with clindamycin or vancomycin, both active against MRSA, has been recommended when S. aureus is suspected.5 Given the lack of rapid and sensitive approaches to the detection of the etiologies of pneumonia, antibiotic selection is most often empirical, contributing to overuse of anti-MRSA antibiotics. In addition, resistance against these antibiotics, especially clindamycin, has been increasing.6,7
A better understanding of the likelihood of staphylococcal pneumonia would help to optimize empirical antibiotic selection, allowing for judicious use of antistaphylococcal antibiotics, while also avoiding poor outcomes due to delays in effective treatment when S. aureus is present.8 Using data from a multicenter, population-based study of pneumonia hospitalizations in children, we sought to describe the prevalence, clinical characteristics, and in-hospital outcomes of staphylococcal pneumonia and the prevalence of antistaphylococcal antibiotic use.
METHODS
The Etiology of Pneumonia in the Community (EPIC) study was a prospective, active, population-based surveillance study of pneumonia hospitalizations among children (age <18 years) conducted between 2010 and 2012 at three children’s hospitals, including two in Tennessee and one in Utah.9 Children hospitalized with clinical evidence of pneumonia and radiographic evidence confirmed by a blinded review by study radiologists were enrolled. Etiologic assessments included blood analysis for bacterial culture, serology for eight respiratory viruses, pneumococcal and group A streptococcal polymerase chain reaction (PCR), and naso/oro-pharyngeal swabs for PCR for 13 respiratory viruses, Mycoplasma pneumoniae, and Chlamydophila pneumoniae. Data from other clinical specimens (pleural fluid, high-quality endotracheal aspirate, or quantified bronchoalveolar lavage fluid) were also recorded. For this study, we included only children with at least one bacterial culture and complete information about antibiotic use. Those with confirmed fungal pneumonia were excluded. Additional details regarding the study population and methods have been published previously.9
Staphylococcal pneumonia was defined based on the detection of S. aureus by culture (any site) or PCR (pleural fluid only), regardless of codetection of other pathogens. Antibiotic susceptibility profiles were used to classify S. aureus isolates as MRSA or methicillin-sensitive S. aureus (MSSA). The remaining children were classified as nonstaphylococcal pneumonia including children with other bacterial pathogens detected (classified as other bacterial pneumonia, excludes atypical bacteria), atypical bacteria, viruses, and no pathogens detected.
Use of anti-MRSA antibiotics (vancomycin, clindamycin, linezolid, doxycycline, and trimethoprim-sulfamethoxazole) and any antistaphylococcal antibiotics (anti-MRSA agents plus oxacillin, nafcillin, and cefazolin) during and after the first two calendar days of admission was identified by medical record review.
Descriptive statistics included number (%) and median (interquartile range, [IQR]) for categorical and continuous variables, respectively. Baseline clinical characteristics and outcomes were compared between children with staphylococcal versus nonstaphylococcal pneumonia, those with staphylococcal versus other bacterial pneumonia, and those with MRSA versus MSSA pneumonia using Wilcoxon rank-sum and Pearson’s chi-square tests where appropriate. To account for multiple comparisons, we used a Bonferroni corrected P value threshold of <.001 to determine statistical significance.
RESULTS
Of the 2,358 children enrolled in the EPIC study hospitalized with radiographically confirmed pneumonia, 2,146 (91.0%) had ≥1 bacterial culture obtained. Two children with Histoplasma capsulatum fungal infection and six children with incomplete antibiotic utilization data were excluded, yielding a final study population of 2,138 children. Among these, blood samples were obtained from 2,134 (>99%) children for culture, pleural fluid from 87 (4%) children, bronchoalveolar lavage fluid from 31 (1%) children, and endotracheal aspirate from 80 (4%) children. Across all culture types, there were 2,332 initial cultures; 2,150 (92%) were collected within the first 24 hours.
Staphylococcal pneumonia was detected in 23 of the 2,138 children (1% [95% CI 0.7, 1.6]; 17 MRSA, 6 MSSA). Of these, 6/23 (26%) had bacteremia, 12/23 (52%) had a positive pleural fluid, and 9/23 (39%) had a positive culture from bronchoalveolar lavage fluid or endotracheal aspirate; 4/23 (17%) children had S. aureus detected from more than one site. Three children (13%) with S. aureus had a viral codetection, including two with influenza.
Compared with children with nonstaphylococcal pneumonia, those with staphylococcal pneumonia were more likely to have a parapneumonic effusion (78% vs 12%, P < .001), but less likely to have cough (78% vs 95%, P < .001). Other baseline characteristics were similar between the two groups. Children with staphylococcal pneumonia had more adverse outcomes than those without (Table), including longer median length of stay (10 vs 3 days, P < .001), more frequent admission to intensive care (83% vs 21%, P < .001), and more frequent invasive mechanical ventilation (65% vs 7%, P < .001). Similar findings were noted when staphylococcal pneumonia was compared with pneumonia caused due to other bacterial pathogens (n = 124). There were no significant differences in baseline characteristics or clinical course between children with MRSA and MSSA pneumonia, although the numbers were small. Overall, S. aureus was detected in 18/267 (7%) children with parapneumonic effusion and 19/462 (4%) children admitted to intensive care. Importantly, there were no confirmed S. aureus cases among children with less severe pneumonia, defined as lacking both parapneumonic effusion and intensive care admission (n = 1,488).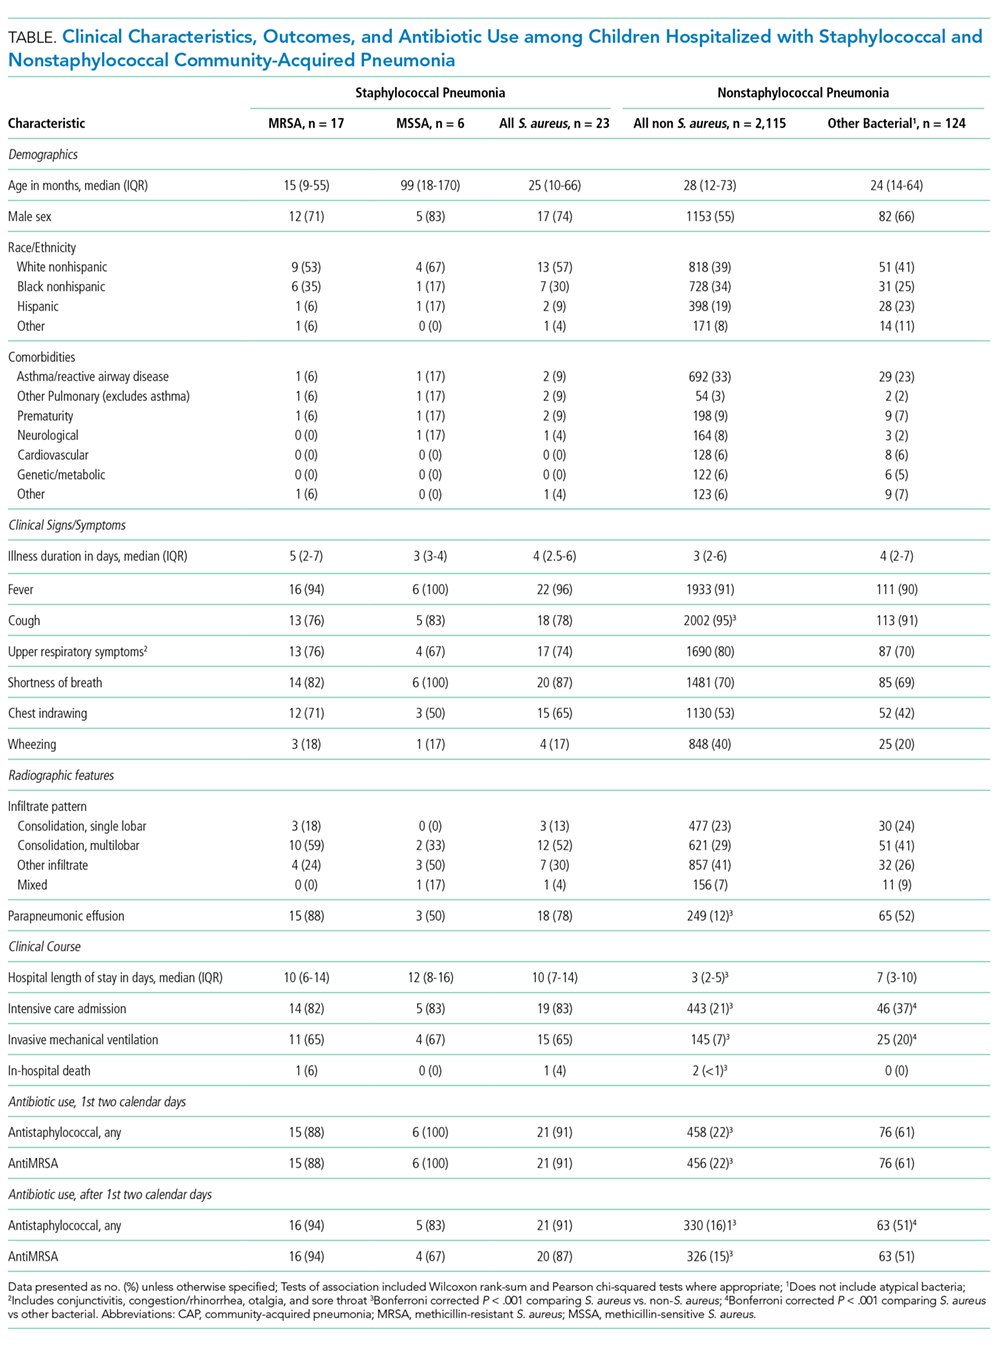
Overall, 519 children (24%) received antistaphylococcal therapy during their hospitalization (512/519, 99% received anti-MRSA therapy), including 22 of the 23 children with S. aureus detected (the only child without antistaphylococcal therapy had S. aureus detected from a high-quality endotracheal tube aspirate only and also had respiratory syncytial virus detected). Clindamycin was most often used (n = 266, 51%), followed by vancomycin (n = 128, 24%), clindamycin plus vancomycin (n = 83, 16%), and others (n = 42, 8%). During the first two days of hospitalization, 479 children (22%) received antistaphylococcal therapy (477 received anti-MRSA therapy). After the first two days, 351 children (16%) received antistaphylococcal therapy (346/351, 99% received anti-MRSA therapy). Use of antistaphylococcal therapy was very common in those admitted to intensive care (182/462, 39%; all but two received anti-MRSA therapy) and in those requiring invasive mechanical ventilation (103/159, 65%). Among those lacking both parapneumonic effusion and intensive care admission (n = 1488), 232 (16%) received antistaphylococcal therapy.
DISCUSSION
In our large, population-based study of >2,000 children hospitalized with community-acquired pneumonia, S. aureus was identified in only 1% of children. Compared with children with other pneumonia etiologies, staphylococcal pneumonia was associated with increased disease severity. Among the small numbers studied, no differences in outcomes were found between children with MRSA and MSSA disease. Despite the low prevalence of staphylococcal pneumonia, almost 1 in 4 children received antistaphylococcal antibiotic therapy; anti-MRSA therapy was used almost exclusively.
The severity of staphylococcal pneumonia was striking, with >80% of children with S. aureus detected being admitted to intensive care, about 65% requiring invasive mechanical ventilation, and >75% with parapneumonic effusion. These findings are similar to those of prior retrospective studies.4,10 The association between staphylococcal pneumonia and adverse outcomes underscores the importance of prompt institution of antimicrobial therapy targeting S. aureus in high-risk patients. This is noteworthy given recent epidemiological data demonstrating increases in MSSA relative to MRSA infections in children,6 and the known superiority of beta-lactam versus vancomycin for MSSA infections, including pneumonia.11
Although detection of staphylococcal infection was rare, almost a quarter of children received antistaphylococcal therapy; nearly all of these children received anti-MRSA therapy. Confirming a bacterial etiology of pneumonia, however, is challenging. Given the severity associated with staphylococcal pneumonia, it is not surprising that use of antistaphylococcal therapy outpaced staphylococcal detections. Antistaphylococcal therapy was especially common in those with severe pneumonia, suggesting that disease severity is an important factor that influences initial antibiotic treatment decisions. Even so, two children with MRSA detected did not initially receive anti-MRSA therapy, highlighting the challenge of balancing judicious antibiotic selection along with ensuring effective treatment. Perhaps more striking is the finding that 16% of children received antistaphylococcal therapy beyond the first two days of hospitalization, presumably after the initial culture results were available. This suggests that clinicians are reluctant to stop antistaphylococcal therapy when the etiology is unknown, although certain features, such as negative cultures, rapid clinical improvement, and lack of risk factors for staphylococcal disease, may provide important clues to support de-escalation of empiric antibiotic therapy. It is also possible that some antibiotics with antistaphylococcal activity were used for alternative indications (eg, clindamycin for penicillin allergy or concern for aspiration pneumonia).
A simple strategy for tailoring antibiotic treatment is maximizing opportunities to identify a causative pathogen. Despite the very low yield of blood cultures in children with pneumonia overall, bacteremia is more common in children with severe pneumonia and those with parapneumonic effusion, especially when cultures are obtained prior to antibiotic use.12,13 Similarly, obtaining pleural fluid is often therapeutic and significantly improves the chances of identifying a bacterial pathogen.14 Moreover, at least one study suggests that S. aureus is much less likely in cases of culture-negative parapneumonic effusions.15 Institutional guidelines, order sets, and antimicrobial stewardship teams are also effective strategies that can facilitate judicious antibiotic use. In particular, stewardship experts can be very useful in assisting clinicians around de-escalation of therapy.16 Use of procalcitonin, a biomarker associated with bacterial infections,17 and prognostic tools to identify risk for adverse outcomes,18 may also inform treatment decisions and are deserving of further study.
Our study must be considered in
Our study demonstrates a very low prevalence of S. aureus detection among children hospitalized with pneumonia and highlights the association between staphylococcal disease and adverse in-hospital outcomes. We also document important discrepancies between disease prevalence and utilization of antistaphylococcal therapy, especially anti-MRSA therapy. Improved approaches are needed to minimize overuse of antistaphylococcal antibiotics while also ensuring adequate therapy for those who need it.
Disclosures
Drs. Zhu, Edwards, Self, Ampofo, Arnold, McCullers, and Williams report grants from the Centers for Disease Control and Prevention during the conduct of the study. Ms. Frush has nothing to disclose. Dr. Jain has nothing to disclose. Dr. Grijalva reports other from Merck, grants and other from Sanofi, other from Pfizer, grants from CDC, grants from AHRQ, grants from NIH, and grants from Campbell Alliance, outside the submitted work. Dr. Self reports grants from CDC, during the conduct of the study; personal fees from Cempra Pharmaceuticals, grants and personal fees from Ferring Pharmaceuticals, personal fees from BioTest AG, personal fees from Abbott Point of Care, personal fees from Gilead Pharmaceuticals, personal fees from Pfizer, grants from Merck, outside the submitted work. Dr. Thomsen has nothing to disclose. Dr. Ampofo reports grants from CDC, during the conduct of the study; other from GlaxoSmithKline, other from Cubist Pharmaceuticals outside the submitted work; and KA collaborate with BioFire Diagnostics, Inc. (formerly Idaho Technology, Inc.) on several NIH grants. Dr. Pavia reports grants from NAID/NIH, grants from NAID/NIH, grants from CDC, personal fees from WebMD, personal fees from Antimicrobial Therapy Inc., outside the submitted work.
Funding
This work was supported by the National Institute of Allergy and Infectious Diseases of the National Institutes of Health under Award Number K23AI104779 to D.J.W. and Award 1K23AI113150 to I.P.T., the National Institute of General Medical Sciences under Award K23GM110469 to W.H.S., and the Agency for Healthcare Research and Quality under Award R03HS022342 to C.G.G. The EPIC study was supported by the Influenza Division in the National Center for Immunizations and Respiratory Diseases at the Centers for Disease Control and Prevention through cooperative agreements with each study site and was based on a competitive research funding opportunity. The findings and conclusions in this report are those of the authors and do not necessarily represent the views of the National Institute of Allergy and Infectious Diseases, the National Institute of General Medical Sciences, the Agency for Healthcare Research and Quality, or the Centers for Disease Control and Prevention.
1. Akil N, Muhlebach MS. Biology and management of methicillin resistant Staphylococcus aureus in cystic fibrosis. Pediatr Pulmonol. 2018. doi: 10.1002/ppul.24139. PubMed
2. Srinivasan R, Asselin J, Gildengorin G, Wiener-Kronish J, Flori HR. A prospective study of ventilator-associated pneumonia in children. Pediatrics.
2009;123(4):1108-1115. doi: 10.1542/peds.2008-1211. PubMed
3. Gonzalez BE, Martinez-Aguilar G, Hulten KG, et al. Severe Staphylococcal sepsis in adolescents in the era of community-acquired methicillin-resistant Staphylococcus aureus. Pediatrics. 2005;115(3):642-648. doi: 10.1542/peds.2004-2300. PubMed
4. Carrillo-Marquez MA, Hulten KG, Hammerman W, Lamberth L, Mason EO, Kaplan SL. Staphylococcus aureus pneumonia in children in the era of community-acquired methicillin-resistance at Texas Children’s Hospital. Pediatr Infect Dis J. 2011;30(7):545-550. doi: 10.1097/INF.0b013e31821618be. PubMed
5. Bradley JS, Byington CL, Shah SS, et al. The management of community-acquired pneumonia in infants and children older than 3 months of age: clinical practice guidelines by the pediatric infectious diseases society and the infectious diseases society of America. Clin Infect Dis. 2011;53(7):e25-e76. doi: 10.1093/cid/cir531. PubMed
6. Sutter DE, Milburn E, Chukwuma U, Dzialowy N, Maranich AM, Hospenthal DR. Changing susceptibility of Staphylococcus aureus in a US pediatric population. Pediatrics. 2016;137(4):e20153099–e20153099. doi: 10.1542/peds.2015-3099. PubMed
7. Sakoulas G, Moellering RC, Jr. Increasing antibiotic resistance among methicillin-resistant Staphylococcus aureus strains. Clin Infect Dis. 2008;46(Suppl 5):S360-S367. doi: 10.1086/533592. PubMed
8. Rubinstein E, Kollef MH, Nathwani D. Pneumonia caused by methicillin-resistant
Staphylococcus aureus. Clin Infect Dis. 2008;46(Suppl 5):S378-S385. doi: 10.1086/533594. PubMed
9. Jain S, Williams DJ, Arnold SR, et al. Community-acquired pneumonia requiring hospitalization among U.S. children. N Engl J Med. 2015;372(9):835-845. doi: 10.1056/NEJMoa1405870. PubMed
10. Kallen AJ, Reed C, Patton M, Arnold KE, Finelli L, Hageman J. Staphylococcus aureus community-onset pneumonia in patients admitted to children’s hospitals during autumn and winter of 2006-2007. Epidemiol Infect. 2010;138(5):666-672. doi: 10.1017/S095026880999135X. PubMed
11. González C, Rubio M, Romero-Vivas J, González M, Picazo JJ. Bacteremic pneumonia due to Staphylococcus aureus: A comparison of disease caused by methicillin-resistant and methicillin-susceptible organisms. Clin Infect Dis. 1999;29(5):1171-1177. doi: 10.1086/313440. PubMed
12. Myers AL, Hall M, Williams DJ, et al. Prevalence of bacteremia in hospitalized pediatric patients with community-acquired pneumonia. Pediatr Infect Dis J. 2013;32(7):736-740. doi: 10.1097/INF.0b013e318290bf63. PubMed
13. Iroh Tam PY, Bernstein E, Ma X, Ferrieri P. Blood culture in evaluation of pediatric community-acquired pneumonia: A systematic review and meta-analysis. Hosp Pediatr. 2015;5(6):324-336. doi: 10.1542/hpeds.2014-0138. PubMed
14. Byington CL, Spencer LY, Johnson TA, et al. An epidemiological investigation of a sustained high rate of pediatric parapneumonic empyema: risk factors and microbiological associations. Clin Infect Dis. 2002;34(4):434-440. doi: 10.1086/338460. PubMed
15. Blaschke AJ, Heyrend C, Byington CL, et al. Molecular analysis improves pathogen identifi cation and epidemiologic study of pediatric parapneumonic empyema. Pediatr Infect Dis J. 2011;30(4):289-294. doi: 10.1097/INF.0b013e3182002d14. PubMed
16. Banerjee R, Teng CB, Cunningham SA, et al. Randomized trial of rapid multiplex polymerase chain reaction-based blood culture identifi cation and susceptibility testing. Clin Infect Dis. 2015;61(7):1071-1080. doi: 10.1093/cid/civ447. PubMed
17. Stockmann C, Ampofo K, Killpack J, et al. Procalcitonin accurately identifies hospitalized children with low risk of bacterial community-acquired pneumonia. J Pediatr Infect Dis Soc. 2018;7(1):46–53. doi: 10.1093/jpids/piw091. PubMed
18. Williams DJ, Zhu Y, Grijalva CG, et al. Predicting severe pneumonia outcomes in children. Pediatrics. 2016;138(4). doi: 10.1542/peds.2016-1019. PubMed
19. Brogan TV, Hall M, Williams DJ, et al. Variability in processes of care and outcomes among children hospitalized with community-acquired pneumonia. Pediatr Infect Dis J. 2012;31(10):1036-1041. doi: 10.1097/INF.0b013e-31825f2b10. PubMed
Although Staphylococcus aureus pneumonia is common in children with cystic fibrosis and those with healthcare-associated infections (eg, ventilator-associated pneumonia),1,2 S. aureus is an uncommon cause of community-acquired pneumonia in children. In recent years, concerns have arisen about the increasing frequency and severity of staphylococcal pneumonia, largely fueled by the emergence of community-associated methicillin-resistant S. aureus (MRSA).3,4 Thus, therapy with clindamycin or vancomycin, both active against MRSA, has been recommended when S. aureus is suspected.5 Given the lack of rapid and sensitive approaches to the detection of the etiologies of pneumonia, antibiotic selection is most often empirical, contributing to overuse of anti-MRSA antibiotics. In addition, resistance against these antibiotics, especially clindamycin, has been increasing.6,7
A better understanding of the likelihood of staphylococcal pneumonia would help to optimize empirical antibiotic selection, allowing for judicious use of antistaphylococcal antibiotics, while also avoiding poor outcomes due to delays in effective treatment when S. aureus is present.8 Using data from a multicenter, population-based study of pneumonia hospitalizations in children, we sought to describe the prevalence, clinical characteristics, and in-hospital outcomes of staphylococcal pneumonia and the prevalence of antistaphylococcal antibiotic use.
METHODS
The Etiology of Pneumonia in the Community (EPIC) study was a prospective, active, population-based surveillance study of pneumonia hospitalizations among children (age <18 years) conducted between 2010 and 2012 at three children’s hospitals, including two in Tennessee and one in Utah.9 Children hospitalized with clinical evidence of pneumonia and radiographic evidence confirmed by a blinded review by study radiologists were enrolled. Etiologic assessments included blood analysis for bacterial culture, serology for eight respiratory viruses, pneumococcal and group A streptococcal polymerase chain reaction (PCR), and naso/oro-pharyngeal swabs for PCR for 13 respiratory viruses, Mycoplasma pneumoniae, and Chlamydophila pneumoniae. Data from other clinical specimens (pleural fluid, high-quality endotracheal aspirate, or quantified bronchoalveolar lavage fluid) were also recorded. For this study, we included only children with at least one bacterial culture and complete information about antibiotic use. Those with confirmed fungal pneumonia were excluded. Additional details regarding the study population and methods have been published previously.9
Staphylococcal pneumonia was defined based on the detection of S. aureus by culture (any site) or PCR (pleural fluid only), regardless of codetection of other pathogens. Antibiotic susceptibility profiles were used to classify S. aureus isolates as MRSA or methicillin-sensitive S. aureus (MSSA). The remaining children were classified as nonstaphylococcal pneumonia including children with other bacterial pathogens detected (classified as other bacterial pneumonia, excludes atypical bacteria), atypical bacteria, viruses, and no pathogens detected.
Use of anti-MRSA antibiotics (vancomycin, clindamycin, linezolid, doxycycline, and trimethoprim-sulfamethoxazole) and any antistaphylococcal antibiotics (anti-MRSA agents plus oxacillin, nafcillin, and cefazolin) during and after the first two calendar days of admission was identified by medical record review.
Descriptive statistics included number (%) and median (interquartile range, [IQR]) for categorical and continuous variables, respectively. Baseline clinical characteristics and outcomes were compared between children with staphylococcal versus nonstaphylococcal pneumonia, those with staphylococcal versus other bacterial pneumonia, and those with MRSA versus MSSA pneumonia using Wilcoxon rank-sum and Pearson’s chi-square tests where appropriate. To account for multiple comparisons, we used a Bonferroni corrected P value threshold of <.001 to determine statistical significance.
RESULTS
Of the 2,358 children enrolled in the EPIC study hospitalized with radiographically confirmed pneumonia, 2,146 (91.0%) had ≥1 bacterial culture obtained. Two children with Histoplasma capsulatum fungal infection and six children with incomplete antibiotic utilization data were excluded, yielding a final study population of 2,138 children. Among these, blood samples were obtained from 2,134 (>99%) children for culture, pleural fluid from 87 (4%) children, bronchoalveolar lavage fluid from 31 (1%) children, and endotracheal aspirate from 80 (4%) children. Across all culture types, there were 2,332 initial cultures; 2,150 (92%) were collected within the first 24 hours.
Staphylococcal pneumonia was detected in 23 of the 2,138 children (1% [95% CI 0.7, 1.6]; 17 MRSA, 6 MSSA). Of these, 6/23 (26%) had bacteremia, 12/23 (52%) had a positive pleural fluid, and 9/23 (39%) had a positive culture from bronchoalveolar lavage fluid or endotracheal aspirate; 4/23 (17%) children had S. aureus detected from more than one site. Three children (13%) with S. aureus had a viral codetection, including two with influenza.
Compared with children with nonstaphylococcal pneumonia, those with staphylococcal pneumonia were more likely to have a parapneumonic effusion (78% vs 12%, P < .001), but less likely to have cough (78% vs 95%, P < .001). Other baseline characteristics were similar between the two groups. Children with staphylococcal pneumonia had more adverse outcomes than those without (Table), including longer median length of stay (10 vs 3 days, P < .001), more frequent admission to intensive care (83% vs 21%, P < .001), and more frequent invasive mechanical ventilation (65% vs 7%, P < .001). Similar findings were noted when staphylococcal pneumonia was compared with pneumonia caused due to other bacterial pathogens (n = 124). There were no significant differences in baseline characteristics or clinical course between children with MRSA and MSSA pneumonia, although the numbers were small. Overall, S. aureus was detected in 18/267 (7%) children with parapneumonic effusion and 19/462 (4%) children admitted to intensive care. Importantly, there were no confirmed S. aureus cases among children with less severe pneumonia, defined as lacking both parapneumonic effusion and intensive care admission (n = 1,488).
Overall, 519 children (24%) received antistaphylococcal therapy during their hospitalization (512/519, 99% received anti-MRSA therapy), including 22 of the 23 children with S. aureus detected (the only child without antistaphylococcal therapy had S. aureus detected from a high-quality endotracheal tube aspirate only and also had respiratory syncytial virus detected). Clindamycin was most often used (n = 266, 51%), followed by vancomycin (n = 128, 24%), clindamycin plus vancomycin (n = 83, 16%), and others (n = 42, 8%). During the first two days of hospitalization, 479 children (22%) received antistaphylococcal therapy (477 received anti-MRSA therapy). After the first two days, 351 children (16%) received antistaphylococcal therapy (346/351, 99% received anti-MRSA therapy). Use of antistaphylococcal therapy was very common in those admitted to intensive care (182/462, 39%; all but two received anti-MRSA therapy) and in those requiring invasive mechanical ventilation (103/159, 65%). Among those lacking both parapneumonic effusion and intensive care admission (n = 1488), 232 (16%) received antistaphylococcal therapy.
DISCUSSION
In our large, population-based study of >2,000 children hospitalized with community-acquired pneumonia, S. aureus was identified in only 1% of children. Compared with children with other pneumonia etiologies, staphylococcal pneumonia was associated with increased disease severity. Among the small numbers studied, no differences in outcomes were found between children with MRSA and MSSA disease. Despite the low prevalence of staphylococcal pneumonia, almost 1 in 4 children received antistaphylococcal antibiotic therapy; anti-MRSA therapy was used almost exclusively.
The severity of staphylococcal pneumonia was striking, with >80% of children with S. aureus detected being admitted to intensive care, about 65% requiring invasive mechanical ventilation, and >75% with parapneumonic effusion. These findings are similar to those of prior retrospective studies.4,10 The association between staphylococcal pneumonia and adverse outcomes underscores the importance of prompt institution of antimicrobial therapy targeting S. aureus in high-risk patients. This is noteworthy given recent epidemiological data demonstrating increases in MSSA relative to MRSA infections in children,6 and the known superiority of beta-lactam versus vancomycin for MSSA infections, including pneumonia.11
Although detection of staphylococcal infection was rare, almost a quarter of children received antistaphylococcal therapy; nearly all of these children received anti-MRSA therapy. Confirming a bacterial etiology of pneumonia, however, is challenging. Given the severity associated with staphylococcal pneumonia, it is not surprising that use of antistaphylococcal therapy outpaced staphylococcal detections. Antistaphylococcal therapy was especially common in those with severe pneumonia, suggesting that disease severity is an important factor that influences initial antibiotic treatment decisions. Even so, two children with MRSA detected did not initially receive anti-MRSA therapy, highlighting the challenge of balancing judicious antibiotic selection along with ensuring effective treatment. Perhaps more striking is the finding that 16% of children received antistaphylococcal therapy beyond the first two days of hospitalization, presumably after the initial culture results were available. This suggests that clinicians are reluctant to stop antistaphylococcal therapy when the etiology is unknown, although certain features, such as negative cultures, rapid clinical improvement, and lack of risk factors for staphylococcal disease, may provide important clues to support de-escalation of empiric antibiotic therapy. It is also possible that some antibiotics with antistaphylococcal activity were used for alternative indications (eg, clindamycin for penicillin allergy or concern for aspiration pneumonia).
A simple strategy for tailoring antibiotic treatment is maximizing opportunities to identify a causative pathogen. Despite the very low yield of blood cultures in children with pneumonia overall, bacteremia is more common in children with severe pneumonia and those with parapneumonic effusion, especially when cultures are obtained prior to antibiotic use.12,13 Similarly, obtaining pleural fluid is often therapeutic and significantly improves the chances of identifying a bacterial pathogen.14 Moreover, at least one study suggests that S. aureus is much less likely in cases of culture-negative parapneumonic effusions.15 Institutional guidelines, order sets, and antimicrobial stewardship teams are also effective strategies that can facilitate judicious antibiotic use. In particular, stewardship experts can be very useful in assisting clinicians around de-escalation of therapy.16 Use of procalcitonin, a biomarker associated with bacterial infections,17 and prognostic tools to identify risk for adverse outcomes,18 may also inform treatment decisions and are deserving of further study.
Our study must be considered in
Our study demonstrates a very low prevalence of S. aureus detection among children hospitalized with pneumonia and highlights the association between staphylococcal disease and adverse in-hospital outcomes. We also document important discrepancies between disease prevalence and utilization of antistaphylococcal therapy, especially anti-MRSA therapy. Improved approaches are needed to minimize overuse of antistaphylococcal antibiotics while also ensuring adequate therapy for those who need it.
Disclosures
Drs. Zhu, Edwards, Self, Ampofo, Arnold, McCullers, and Williams report grants from the Centers for Disease Control and Prevention during the conduct of the study. Ms. Frush has nothing to disclose. Dr. Jain has nothing to disclose. Dr. Grijalva reports other from Merck, grants and other from Sanofi, other from Pfizer, grants from CDC, grants from AHRQ, grants from NIH, and grants from Campbell Alliance, outside the submitted work. Dr. Self reports grants from CDC, during the conduct of the study; personal fees from Cempra Pharmaceuticals, grants and personal fees from Ferring Pharmaceuticals, personal fees from BioTest AG, personal fees from Abbott Point of Care, personal fees from Gilead Pharmaceuticals, personal fees from Pfizer, grants from Merck, outside the submitted work. Dr. Thomsen has nothing to disclose. Dr. Ampofo reports grants from CDC, during the conduct of the study; other from GlaxoSmithKline, other from Cubist Pharmaceuticals outside the submitted work; and KA collaborate with BioFire Diagnostics, Inc. (formerly Idaho Technology, Inc.) on several NIH grants. Dr. Pavia reports grants from NAID/NIH, grants from NAID/NIH, grants from CDC, personal fees from WebMD, personal fees from Antimicrobial Therapy Inc., outside the submitted work.
Funding
This work was supported by the National Institute of Allergy and Infectious Diseases of the National Institutes of Health under Award Number K23AI104779 to D.J.W. and Award 1K23AI113150 to I.P.T., the National Institute of General Medical Sciences under Award K23GM110469 to W.H.S., and the Agency for Healthcare Research and Quality under Award R03HS022342 to C.G.G. The EPIC study was supported by the Influenza Division in the National Center for Immunizations and Respiratory Diseases at the Centers for Disease Control and Prevention through cooperative agreements with each study site and was based on a competitive research funding opportunity. The findings and conclusions in this report are those of the authors and do not necessarily represent the views of the National Institute of Allergy and Infectious Diseases, the National Institute of General Medical Sciences, the Agency for Healthcare Research and Quality, or the Centers for Disease Control and Prevention.
1. Akil N, Muhlebach MS. Biology and management of methicillin resistant Staphylococcus aureus in cystic fibrosis. Pediatr Pulmonol. 2018. doi: 10.1002/ppul.24139. PubMed
2. Srinivasan R, Asselin J, Gildengorin G, Wiener-Kronish J, Flori HR. A prospective study of ventilator-associated pneumonia in children. Pediatrics.
2009;123(4):1108-1115. doi: 10.1542/peds.2008-1211. PubMed
3. Gonzalez BE, Martinez-Aguilar G, Hulten KG, et al. Severe Staphylococcal sepsis in adolescents in the era of community-acquired methicillin-resistant Staphylococcus aureus. Pediatrics. 2005;115(3):642-648. doi: 10.1542/peds.2004-2300. PubMed
4. Carrillo-Marquez MA, Hulten KG, Hammerman W, Lamberth L, Mason EO, Kaplan SL. Staphylococcus aureus pneumonia in children in the era of community-acquired methicillin-resistance at Texas Children’s Hospital. Pediatr Infect Dis J. 2011;30(7):545-550. doi: 10.1097/INF.0b013e31821618be. PubMed
5. Bradley JS, Byington CL, Shah SS, et al. The management of community-acquired pneumonia in infants and children older than 3 months of age: clinical practice guidelines by the pediatric infectious diseases society and the infectious diseases society of America. Clin Infect Dis. 2011;53(7):e25-e76. doi: 10.1093/cid/cir531. PubMed
6. Sutter DE, Milburn E, Chukwuma U, Dzialowy N, Maranich AM, Hospenthal DR. Changing susceptibility of Staphylococcus aureus in a US pediatric population. Pediatrics. 2016;137(4):e20153099–e20153099. doi: 10.1542/peds.2015-3099. PubMed
7. Sakoulas G, Moellering RC, Jr. Increasing antibiotic resistance among methicillin-resistant Staphylococcus aureus strains. Clin Infect Dis. 2008;46(Suppl 5):S360-S367. doi: 10.1086/533592. PubMed
8. Rubinstein E, Kollef MH, Nathwani D. Pneumonia caused by methicillin-resistant
Staphylococcus aureus. Clin Infect Dis. 2008;46(Suppl 5):S378-S385. doi: 10.1086/533594. PubMed
9. Jain S, Williams DJ, Arnold SR, et al. Community-acquired pneumonia requiring hospitalization among U.S. children. N Engl J Med. 2015;372(9):835-845. doi: 10.1056/NEJMoa1405870. PubMed
10. Kallen AJ, Reed C, Patton M, Arnold KE, Finelli L, Hageman J. Staphylococcus aureus community-onset pneumonia in patients admitted to children’s hospitals during autumn and winter of 2006-2007. Epidemiol Infect. 2010;138(5):666-672. doi: 10.1017/S095026880999135X. PubMed
11. González C, Rubio M, Romero-Vivas J, González M, Picazo JJ. Bacteremic pneumonia due to Staphylococcus aureus: A comparison of disease caused by methicillin-resistant and methicillin-susceptible organisms. Clin Infect Dis. 1999;29(5):1171-1177. doi: 10.1086/313440. PubMed
12. Myers AL, Hall M, Williams DJ, et al. Prevalence of bacteremia in hospitalized pediatric patients with community-acquired pneumonia. Pediatr Infect Dis J. 2013;32(7):736-740. doi: 10.1097/INF.0b013e318290bf63. PubMed
13. Iroh Tam PY, Bernstein E, Ma X, Ferrieri P. Blood culture in evaluation of pediatric community-acquired pneumonia: A systematic review and meta-analysis. Hosp Pediatr. 2015;5(6):324-336. doi: 10.1542/hpeds.2014-0138. PubMed
14. Byington CL, Spencer LY, Johnson TA, et al. An epidemiological investigation of a sustained high rate of pediatric parapneumonic empyema: risk factors and microbiological associations. Clin Infect Dis. 2002;34(4):434-440. doi: 10.1086/338460. PubMed
15. Blaschke AJ, Heyrend C, Byington CL, et al. Molecular analysis improves pathogen identifi cation and epidemiologic study of pediatric parapneumonic empyema. Pediatr Infect Dis J. 2011;30(4):289-294. doi: 10.1097/INF.0b013e3182002d14. PubMed
16. Banerjee R, Teng CB, Cunningham SA, et al. Randomized trial of rapid multiplex polymerase chain reaction-based blood culture identifi cation and susceptibility testing. Clin Infect Dis. 2015;61(7):1071-1080. doi: 10.1093/cid/civ447. PubMed
17. Stockmann C, Ampofo K, Killpack J, et al. Procalcitonin accurately identifies hospitalized children with low risk of bacterial community-acquired pneumonia. J Pediatr Infect Dis Soc. 2018;7(1):46–53. doi: 10.1093/jpids/piw091. PubMed
18. Williams DJ, Zhu Y, Grijalva CG, et al. Predicting severe pneumonia outcomes in children. Pediatrics. 2016;138(4). doi: 10.1542/peds.2016-1019. PubMed
19. Brogan TV, Hall M, Williams DJ, et al. Variability in processes of care and outcomes among children hospitalized with community-acquired pneumonia. Pediatr Infect Dis J. 2012;31(10):1036-1041. doi: 10.1097/INF.0b013e-31825f2b10. PubMed
©2018 Society of Hospital Medicine
The Pipeline From Abstract Presentation to Publication in Pediatric Hospital Medicine
Pediatric hospital medicine (PHM) is one of the most rapidly growing disciplines in pediatrics,1 with 8% of pediatric residency graduates each year entering the field.2 Research plays an important role in advancing care in the field and is a critical component for board certification and fellowship accreditation.3-6 The annual PHM conference, which has been jointly sponsored by the Academic Pediatric Association, the American Academy of Pediatrics, and the Society of Hospital Medicine, is an important venue for the dissemination of research findings. Abstract selection is determined by peer review; however, reviewers are provided with only a brief snapshot of the research, which may not contain sufficient information to fully evaluate the methodological quality of the work.7-10 Additionally, while instructions are provided, reviewers often lack formal training in abstract review. Consequently, scores may vary.9
Publication in a peer-reviewed journal is considered a measure of research success because it requires more rigorous peer review than the abstract selection process at scientific meetings.11-16 Rates of subsequent journal publication differ based on specialty and meeting, and they have been reported at 23% to 78%.10,12,14-18 In pediatrics, publication rates after presentation at scientific meetings range from 36% to 63%, with mean time to publication ranging from 20 to 26 months following the meeting.11,19,20 No studies have reviewed abstract submissions to the annual PHM meeting to determine if selection or presentation format is associated with subsequent publication in a peer-reviewed journal.
We sought to identify the publication rate of abstracts submitted to the 2014 PHM conference and determine whether presentation format was associated with the likelihood of subsequent journal publication or time to publication.
METHODS
Study Design
Data for this retrospective cohort study were obtained from a database of all abstracts submitted for presentation at the 2014 PHM conference in Lake Buena Vista, Florida.
Main Exposures
The main exposure was presentation format, which was categorized as not presented (ie, rejected), poster presentation, or oral presentation. PHM has a blinded abstract peer-review process; in 2014, an average of 10 reviewers scored each abstract. Reviewers graded abstracts on a scale of 1 (best in category) to 7 (unacceptable for presentation) according to the following criteria: originality, scientific importance, methodological rigor, and quality of presentation. Abstracts with the lowest average scores in each content area, usually less than or equal to 3, were accepted as oral presentations while most abstracts with scores greater than 5 were rejected. For this study, information collected from each abstract included authors, if the primary author was a trainee, title, content area, and presentation format. Content areas included clinical research, educational research, health services research (HSR) and/or epidemiology, practice management research, and quality improvement. Abstracts were then grouped by presentation format and content area for analysis. The Pediatric Academic Societies (PAS) annual meeting, another common venue for the presentation of pediatric research, precedes the PHM conference. Because acceptance for PAS presentation may represent more strongly developed abstract submissions for PHM, we identified which abstracts had also been presented at the PAS conference that same year by cross-referencing authors and abstract titles with the PAS 2014 program.
Main Outcome Measures
All submissions were assessed for subsequent publication in peer-reviewed journals through January 2017 (30 months following the July 2014 PHM conference). To identify abstracts that went on to full publication, 2 authors (JC and LEH) independently searched for the lead author’s name and the presentation title in PubMed, Google Scholar, and MedEdPORTAL in January 2017. PubMed was searched using both the general search box and an advanced search for author and title. Google Scholar was added to capture manuscripts that may not have been indexed in PubMed at the time of our search. MedEdPORTAL, a common venue for the publication of educational initiatives that are not currently indexed in PubMed, was searched by lead author name via the general search box. If a full manuscript was published discussing similar outcomes or results and was written by the same authors who had submitted a PHM conference abstract, it was considered to have been published. The journal, month, and year of publication were recorded. For journals published every 2 months, the date of publication was recorded as falling between the 2 months. For those journals with biannual publication in the spring and fall, the months of March and October were used, respectively. The impact factor of the publication journal was also recorded for the year preceding publication. A journal’s impact factor is frequently used as a quantitative measure of journal quality and reflects the frequency with which a journal’s articles are cited in the scientific literature.21 Journals without an impact factor (eg, newer journals) were assigned a 0.
Data Analysis
All abstracts submitted to the PHM conference were analyzed based on content area and presentation format. The proportion of all abstracts subsequently published was determined for each format type and content area, and the odds ratio (OR) for publication after abstract submission was calculated using logistic regression. We calculated an adjusted OR for subsequent publication controlling for PAS presentation and the trainee status of the primary author. The journals most frequently publishing abstracts submitted to the PHM conference were identified. Median time to publication was calculated using the number of months elapsed between the PHM conference and publication date and compared across all abstract formats using Cox proportional hazards models adjusted for PAS presentation and trainee status. Kaplan-Meier survival curves were also generated for each of the 3 formats and compared using log-rank tests. The median impact factor was determined for each abstract format and compared using Wilcoxon rank-sum tests. Median impact factor by content area was compared using a Kruskal-Wallis test. All statistical analyses were performed using SAS version 9.2 (SAS Institute, Cary, NC). P values < 0.05 were considered statistically significant. In accordance with the Common Rule22 and the policies of the Cincinnati Children’s Hospital Medical Center Institutional Review Board, this research was not considered human subjects research.

RESULTS
For the 2014 PHM meeting, 226 abstracts were submitted, of which 183 (81.0%) were selected for presentation, including 154 (68.0%) as poster presentations and 29 (12.8%) as oral presentations. Of all submitted abstracts, 82 (36.3%) were published within 30 months following the meeting. Eighty-one of these (98.8%) were identified via PubMed, and 1 was found only in MedEdPORTAL. No additional publications were found via Google Scholar. The presenting author for the PHM abstract was the first author for 87.8% (n = 72) of the publications. A trainee was the presenting author for only 2 of these abstracts. For the publications in which the first author was not the presenting author, the presenting author was the senior author in 2 of the publications and the second or third author on the remaining 8. Of the abstracts accepted for presentation, 70 (38.3%) were subsequently published. Abstracts accepted for oral presentation had almost 7-fold greater odds of subsequent publication than those that were rejected (Table 1; OR 6.8; 95% confidence interval [CI], 2.4-19.4). Differences in the odds of publication for rejected abstracts compared with those accepted for poster presentation were not statistically significant (OR 1.2; 95% CI, 0.5-2.5).
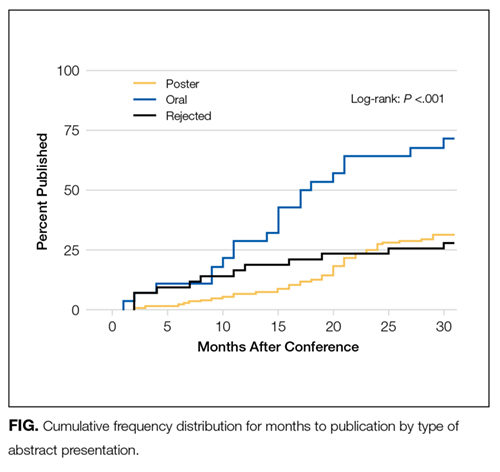
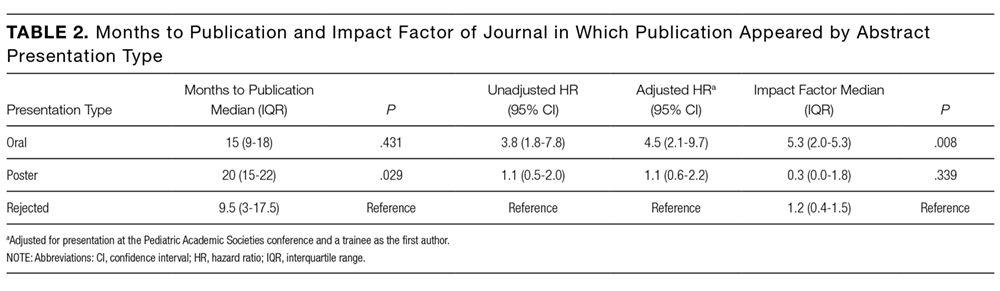
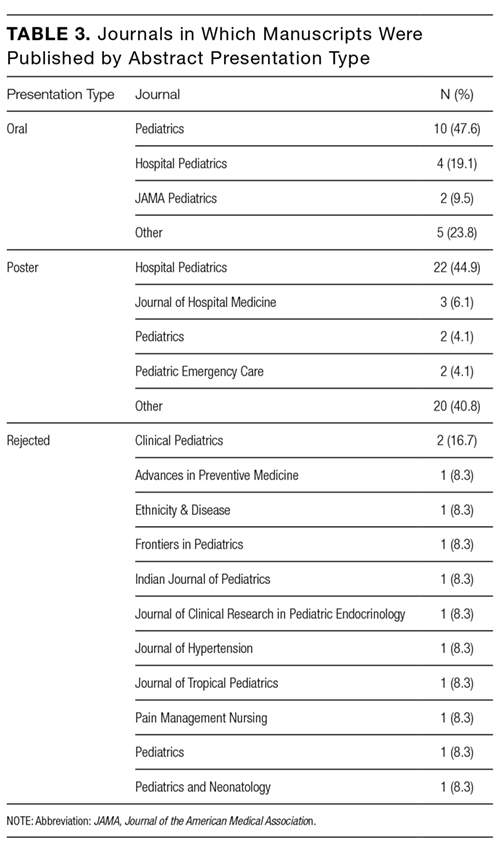
DISCUSSION
About one-third of abstracts submitted to the 2014 PHM conference were subsequently published in peer-reviewed journals within 30 months of the conference. Compared with rejected abstracts, the rate of publication was significantly higher for abstracts selected for oral presentation but not for those selected for poster presentation. For abstracts ultimately published in journals, selection for oral presentation was significantly associated with both a shorter time to publication and a higher median journal impact factor compared with rejected abstracts. Time to publication and median journal impact factor were similar between rejected abstracts and those accepted for poster presentation. Our findings suggest that abstract reviewers may be able to identify which abstracts will ultimately withstand more stringent peer review in the publication process when accepting abstracts for oral presentation. However, the selection for poster presentation versus rejection may not be indicative of future publication or the impact factor of the subsequent publication journal.
Previous studies have reviewed publication rates after meetings of the European Society for Pediatric Urology (publication rate of 47%),11 the Ambulatory Pediatric Association (now the Academic Pediatric Association; publication rate of 47%), the American Pediatric Society/Society for Pediatric Research (publication rate of 54%), and the PAS (publication rate of 45%).19,20 Our lower publication rate of 36.3% may be attributed to the shorter follow-up time in our study (30 months from the PHM conference), whereas prior studies monitored for publication up to 60 months after the PAS conference.20 Factors associated with subsequent publication include statistically significant results, a large sample size, and a randomized controlled trial study design.15,16 The primary reason for nonpublication for up to 80% of abstracts is failure to submit a manuscript for publication.23 A lack of time and fear of rejection after peer review are commonly cited explanations.18,23,24 Individuals may view acceptance for an oral presentation as positive reinforcement and be more motivated to pursue subsequent manuscript publication than individuals whose abstracts are offered poster presentations or are rejected. Trainees frequently present abstracts at scientific meetings, representing 40.3% of primary authors submitting abstracts to PHM in 2014, but may not have sufficient time or mentorship to develop a complete manuscript.18 To our knowledge, there have been no publications that assess the impact of trainee status on subsequent publication after conference submission.
Our study demonstrated that selection for oral presentation was associated with subsequent publication, shorter time to publication, and publication in journals with higher impact factors. A 2005 Cochrane review also demonstrated that selection for oral presentation was associated with subsequent journal publication.16 Abstracts accepted for oral publication may represent work further along in the research process, with more developed methodology and results. The shorter time to publication for abstracts accepted for oral presentation could also reflect feedback provided by conference attendees after the presentation, whereas poster sessions frequently lack a formalized process for critique.
Carroll et al. found no difference in time to publication between abstracts accepted for presentation at the PAS and rejected abstracts.20 Previous studies demonstrate that most abstracts presented at scientific meetings that are subsequently accepted for publication are published within 2 to 3 years of the meeting,12 with publication rates as high as 98% within 3 years of presentation.17 In contrast to Carroll et al., we found that abstracts accepted for oral presentation had a 4-fold greater likelihood of publication at each month than rejected abstracts. However, abstracts accepted for poster presentation did not have a significant difference in the proportional hazard ratio models for publication compared with rejected abstracts. Because space considerations limit the number of abstracts that can be accepted for presentation at a conference, some abstracts that are suitable for future publication may have been rejected due to a lack of space. Because researchers often use scientific meetings as a forum to receive peer feedback,12 authors who present at conferences may take more time to write a manuscript in order to incorporate this feedback.
The most common journal in which submitted abstracts were subsequently published was Hospital Pediatrics, representing twice as many published manuscripts as the second most frequent journal, Pediatrics. Hospital Pediatrics, which was first published in 2011, did not have an impact factor assigned during the study period. Yet, as a peer-reviewed journal dedicated to the field of PHM, it is well aligned with the research presented at the PHM meeting. It is unclear if Hospital Pediatrics is a journal to which pediatric hospitalists tend to submit manuscripts initially or if manuscripts are frequently submitted elsewhere prior to their publication in Hospital Pediatrics. Submission to other journals first likely extends the time to publication, especially for abstracts accepted for poster presentation, which may describe studies with less developed methods or results.
This study has several limitations. Previous studies have demonstrated mean time to publication of 12 to 32 months following abstract presentation with a median time of 19.6 months.16 Because we only have a 30-month follow-up, there may be abstracts still in the review process that are yet to be published, especially because the length of the review process varies by journal. We based our literature search on the first author of each PHM conference abstract submission, assuming that this presenting author would be one of the publishing authors even if not remaining first author; if this was not the case, we may have missed some abstracts that were subsequently published in full. Likewise, if a presenting author’s last name changed prior to the publication of a manuscript, a publication may have been missed. This limitation would cause us to underestimate the overall publication rate. It is not clear whether this would differentially affect the method of presentation. However, in this study, there was concordance between the presenting author and the publication’s first author in 87.8% of the abstracts subsequently published in full. Presenting authors who did not remain the first author on the published manuscript maintained authorship as either the senior author or second or third author, which may represent changes in the degree of involvement or a division of responsibilities for individuals working on a project together. While our search methods were comprehensive, there is a possibility that abstracts may have been published in a venue that was not searched. Additionally, we only reviewed abstracts submitted to PHM for 1 year. As the field matures and the number of fellowship programs increases, the quality of submitted abstracts may increase, leading to higher publication rates or shorter times to publication. It is also possible that the publication rate may not be reflective of PHM as a field because hospitalists may submit their work to conferences other than the PHM. Lastly, it may be more challenging to interpret any differences in impact factor because some journals, including Hospital Pediatrics (which represented a plurality of poster presentation abstracts that were subsequently published and is a relatively new journal), did not have an impact factor assigned during the study period. Assigning a 0 to journals without an impact factor may artificially lower the average impact factor reported. Furthermore, an impact factor, which is based on the frequency with which an individual journal’s articles are cited in scientific or medical publications, may not necessarily reflect a journal’s quality.
CONCLUSIONS
Of the 226 abstracts submitted to the 2014 PHM conference, approximately one-third were published in peer-reviewed journals within 30 months of the conference. Selection for oral presentation was found to be associated with subsequent publication as well as publication in journals with higher impact factors. The overall low publication rate may indicate a need for increased mentorship and resources for research development in this growing specialty. Improved mechanisms for author feedback at poster sessions may provide constructive suggestions for further development of these projects into full manuscripts or opportunities for trainees and early-career hospitalists to network with more experienced researchers in the field.
Disclosure
Drs. Herrmann, Hall, Kyler, Andrews, Williams, and Shah and Mr. Cochran have nothing to disclose. Dr. Wilson reports personal fees from the American Academy of Pediatrics during the conduct of the study. The authors have no financial relationships relevant to this article to disclose.
1. Stucky ER, Ottolini MC, Maniscalco J. Pediatric hospital medicine core competencies: development and methodology. J Hosp Med. 2010;5(6):339-343. PubMed
2. Freed GL, McGuinness GA, Althouse LA, Moran LM, Spera L. Long-term plans for those selecting hospital medicine as an initial career choice. Hosp Pediatr. 2015;5(4):169-174. PubMed
3. Rauch D. Pediatric Hospital Medicine Subspecialty. 2016; https://www.aap.org/en-us/about-the-aap/Committees-Councils-Sections/Section-on-Hospital-Medicine/Pages/Pediatric-Hospital-Medicine-Subspecialty.aspx. Accessed November 28, 2016.
4. Bekmezian A, Teufel RJ, Wilson KM. Research needs of pediatric hospitalists. Hosp Pediatr. 2011;1(1):38-44. PubMed
5. Teufel RJ, Bekmezian A, Wilson K. Pediatric hospitalist research productivity: predictors of success at presenting abstracts and publishing peer-reviewed manuscripts among pediatric hospitalists. Hosp Pediatr. 2012;2(3):149-160. PubMed
6. Wilson KM, Shah SS, Simon TD, Srivastava R, Tieder JS. The challenge of pediatric hospital medicine research. Hosp Pediatr. 2012;2(1):8-9. PubMed
7. Froom P, Froom J. Presentation Deficiencies in structured medical abstracts. J Clin Epidemiol. 1993;46(7):591-594. PubMed
8. Relman AS. News reports of medical meetings: how reliable are abstracts? N Engl J Med. 1980;303(5):277-278. PubMed
9. Soffer A. Beware the 200-word abstract! Arch Intern Med. 1976;136(11):1232-1233. PubMed
10. Bhandari M, Devereaux P, Guyatt GH, et al. An observational study of orthopaedic abstracts and subsequent full-text publications. J Bone Joint Surg Am. 2002;84(4):615-621. PubMed
11. Castagnetti M, Subramaniam R, El-Ghoneimi A. Abstracts presented at the European Society for Pediatric Urology (ESPU) meetings (2003–2010): Characteristics and outcome. J Pediatr Urol. 2014;10(2):355-360. PubMed
12. Halikman R, Scolnik D, Rimon A, Glatstein MM. Peer-Reviewed Journal Publication of Abstracts Presented at an International Emergency Medicine Scientific Meeting: Outcomes and Comparison With the Previous Meeting. Pediatr Emerg Care. 2016. PubMed
13. Relman AS. Peer review in scientific journals--what good is it? West J Med. 1990;153(5):520. PubMed
14. Riordan F. Do presenters to paediatric meetings get their work published? Arch Dis Child. 2000;83(6):524-526. PubMed
15. Scherer RW, Dickersin K, Langenberg P. Full publication of results initially presented in abstracts: a meta-analysis. JAMA. 1994;272(2):158-162. PubMed
16. Scherer RW, Langenberg P, Elm E. Full publication of results initially presented in abstracts. Cochrane Database Syst Rev. 2005. PubMed
17. Marx WF, Cloft HJ, Do HM, Kallmes DF. The fate of neuroradiologic abstracts presented at national meetings in 1993: rate of subsequent publication in peer-reviewed, indexed journals. Am J Neuroradiol. 1999;20(6):1173-1177. PubMed
18. Roy D, Sankar V, Hughes J, Jones A, Fenton J. Publication rates of scientific papers presented at the Otorhinolarygological Research Society meetings. Clin Otolaryngol Allied Sci. 2001;26(3):253-256. PubMed
19. McCormick MC, Holmes JH. Publication of research presented at the pediatric meetings: change in selection. Am J Dis Child. 1985;139(2):122-126. PubMed
20. Carroll AE, Sox CM, Tarini BA, Ringold S, Christakis DA. Does presentation format at the Pediatric Academic Societies’ annual meeting predict subsequent publication? Pediatrics. 2003;112(6):1238-1241. PubMed
21. Saha S, Saint S, Christakis DA. Impact factor: a valid measure of journal quality? J Med Libr Assoc. 2003;91(1):42. PubMed
22. Office for Human Research Protections. Code of Federal Regulations, Title 45 Public Welfare: Part 46, Protection of Human Subjects, §46.102(f ). http://www.hhs.gov/ohrp/regulations-and-policy/regulations/45-cfr-46/index.html#46.102. Accessed October 21, 2016.
23. Weber EJ, Callaham ML, Wears RL, Barton C, Young G. Unpublished research from a medical specialty meeting: why investigators fail to publish. JAMA. 1998;280(3):257-259. PubMed
24. Timmer A, Hilsden RJ, Cole J, Hailey D, Sutherland LR. Publication bias in gastroenterological research–a retrospective cohort study based on abstracts submitted to a scientific meeting. BMC Med Res Methodol. 2002;2(1):1. PubMed
Pediatric hospital medicine (PHM) is one of the most rapidly growing disciplines in pediatrics,1 with 8% of pediatric residency graduates each year entering the field.2 Research plays an important role in advancing care in the field and is a critical component for board certification and fellowship accreditation.3-6 The annual PHM conference, which has been jointly sponsored by the Academic Pediatric Association, the American Academy of Pediatrics, and the Society of Hospital Medicine, is an important venue for the dissemination of research findings. Abstract selection is determined by peer review; however, reviewers are provided with only a brief snapshot of the research, which may not contain sufficient information to fully evaluate the methodological quality of the work.7-10 Additionally, while instructions are provided, reviewers often lack formal training in abstract review. Consequently, scores may vary.9
Publication in a peer-reviewed journal is considered a measure of research success because it requires more rigorous peer review than the abstract selection process at scientific meetings.11-16 Rates of subsequent journal publication differ based on specialty and meeting, and they have been reported at 23% to 78%.10,12,14-18 In pediatrics, publication rates after presentation at scientific meetings range from 36% to 63%, with mean time to publication ranging from 20 to 26 months following the meeting.11,19,20 No studies have reviewed abstract submissions to the annual PHM meeting to determine if selection or presentation format is associated with subsequent publication in a peer-reviewed journal.
We sought to identify the publication rate of abstracts submitted to the 2014 PHM conference and determine whether presentation format was associated with the likelihood of subsequent journal publication or time to publication.
METHODS
Study Design
Data for this retrospective cohort study were obtained from a database of all abstracts submitted for presentation at the 2014 PHM conference in Lake Buena Vista, Florida.
Main Exposures
The main exposure was presentation format, which was categorized as not presented (ie, rejected), poster presentation, or oral presentation. PHM has a blinded abstract peer-review process; in 2014, an average of 10 reviewers scored each abstract. Reviewers graded abstracts on a scale of 1 (best in category) to 7 (unacceptable for presentation) according to the following criteria: originality, scientific importance, methodological rigor, and quality of presentation. Abstracts with the lowest average scores in each content area, usually less than or equal to 3, were accepted as oral presentations while most abstracts with scores greater than 5 were rejected. For this study, information collected from each abstract included authors, if the primary author was a trainee, title, content area, and presentation format. Content areas included clinical research, educational research, health services research (HSR) and/or epidemiology, practice management research, and quality improvement. Abstracts were then grouped by presentation format and content area for analysis. The Pediatric Academic Societies (PAS) annual meeting, another common venue for the presentation of pediatric research, precedes the PHM conference. Because acceptance for PAS presentation may represent more strongly developed abstract submissions for PHM, we identified which abstracts had also been presented at the PAS conference that same year by cross-referencing authors and abstract titles with the PAS 2014 program.
Main Outcome Measures
All submissions were assessed for subsequent publication in peer-reviewed journals through January 2017 (30 months following the July 2014 PHM conference). To identify abstracts that went on to full publication, 2 authors (JC and LEH) independently searched for the lead author’s name and the presentation title in PubMed, Google Scholar, and MedEdPORTAL in January 2017. PubMed was searched using both the general search box and an advanced search for author and title. Google Scholar was added to capture manuscripts that may not have been indexed in PubMed at the time of our search. MedEdPORTAL, a common venue for the publication of educational initiatives that are not currently indexed in PubMed, was searched by lead author name via the general search box. If a full manuscript was published discussing similar outcomes or results and was written by the same authors who had submitted a PHM conference abstract, it was considered to have been published. The journal, month, and year of publication were recorded. For journals published every 2 months, the date of publication was recorded as falling between the 2 months. For those journals with biannual publication in the spring and fall, the months of March and October were used, respectively. The impact factor of the publication journal was also recorded for the year preceding publication. A journal’s impact factor is frequently used as a quantitative measure of journal quality and reflects the frequency with which a journal’s articles are cited in the scientific literature.21 Journals without an impact factor (eg, newer journals) were assigned a 0.
Data Analysis
All abstracts submitted to the PHM conference were analyzed based on content area and presentation format. The proportion of all abstracts subsequently published was determined for each format type and content area, and the odds ratio (OR) for publication after abstract submission was calculated using logistic regression. We calculated an adjusted OR for subsequent publication controlling for PAS presentation and the trainee status of the primary author. The journals most frequently publishing abstracts submitted to the PHM conference were identified. Median time to publication was calculated using the number of months elapsed between the PHM conference and publication date and compared across all abstract formats using Cox proportional hazards models adjusted for PAS presentation and trainee status. Kaplan-Meier survival curves were also generated for each of the 3 formats and compared using log-rank tests. The median impact factor was determined for each abstract format and compared using Wilcoxon rank-sum tests. Median impact factor by content area was compared using a Kruskal-Wallis test. All statistical analyses were performed using SAS version 9.2 (SAS Institute, Cary, NC). P values < 0.05 were considered statistically significant. In accordance with the Common Rule22 and the policies of the Cincinnati Children’s Hospital Medical Center Institutional Review Board, this research was not considered human subjects research.
RESULTS
For the 2014 PHM meeting, 226 abstracts were submitted, of which 183 (81.0%) were selected for presentation, including 154 (68.0%) as poster presentations and 29 (12.8%) as oral presentations. Of all submitted abstracts, 82 (36.3%) were published within 30 months following the meeting. Eighty-one of these (98.8%) were identified via PubMed, and 1 was found only in MedEdPORTAL. No additional publications were found via Google Scholar. The presenting author for the PHM abstract was the first author for 87.8% (n = 72) of the publications. A trainee was the presenting author for only 2 of these abstracts. For the publications in which the first author was not the presenting author, the presenting author was the senior author in 2 of the publications and the second or third author on the remaining 8. Of the abstracts accepted for presentation, 70 (38.3%) were subsequently published. Abstracts accepted for oral presentation had almost 7-fold greater odds of subsequent publication than those that were rejected (Table 1; OR 6.8; 95% confidence interval [CI], 2.4-19.4). Differences in the odds of publication for rejected abstracts compared with those accepted for poster presentation were not statistically significant (OR 1.2; 95% CI, 0.5-2.5).
DISCUSSION
About one-third of abstracts submitted to the 2014 PHM conference were subsequently published in peer-reviewed journals within 30 months of the conference. Compared with rejected abstracts, the rate of publication was significantly higher for abstracts selected for oral presentation but not for those selected for poster presentation. For abstracts ultimately published in journals, selection for oral presentation was significantly associated with both a shorter time to publication and a higher median journal impact factor compared with rejected abstracts. Time to publication and median journal impact factor were similar between rejected abstracts and those accepted for poster presentation. Our findings suggest that abstract reviewers may be able to identify which abstracts will ultimately withstand more stringent peer review in the publication process when accepting abstracts for oral presentation. However, the selection for poster presentation versus rejection may not be indicative of future publication or the impact factor of the subsequent publication journal.
Previous studies have reviewed publication rates after meetings of the European Society for Pediatric Urology (publication rate of 47%),11 the Ambulatory Pediatric Association (now the Academic Pediatric Association; publication rate of 47%), the American Pediatric Society/Society for Pediatric Research (publication rate of 54%), and the PAS (publication rate of 45%).19,20 Our lower publication rate of 36.3% may be attributed to the shorter follow-up time in our study (30 months from the PHM conference), whereas prior studies monitored for publication up to 60 months after the PAS conference.20 Factors associated with subsequent publication include statistically significant results, a large sample size, and a randomized controlled trial study design.15,16 The primary reason for nonpublication for up to 80% of abstracts is failure to submit a manuscript for publication.23 A lack of time and fear of rejection after peer review are commonly cited explanations.18,23,24 Individuals may view acceptance for an oral presentation as positive reinforcement and be more motivated to pursue subsequent manuscript publication than individuals whose abstracts are offered poster presentations or are rejected. Trainees frequently present abstracts at scientific meetings, representing 40.3% of primary authors submitting abstracts to PHM in 2014, but may not have sufficient time or mentorship to develop a complete manuscript.18 To our knowledge, there have been no publications that assess the impact of trainee status on subsequent publication after conference submission.
Our study demonstrated that selection for oral presentation was associated with subsequent publication, shorter time to publication, and publication in journals with higher impact factors. A 2005 Cochrane review also demonstrated that selection for oral presentation was associated with subsequent journal publication.16 Abstracts accepted for oral publication may represent work further along in the research process, with more developed methodology and results. The shorter time to publication for abstracts accepted for oral presentation could also reflect feedback provided by conference attendees after the presentation, whereas poster sessions frequently lack a formalized process for critique.
Carroll et al. found no difference in time to publication between abstracts accepted for presentation at the PAS and rejected abstracts.20 Previous studies demonstrate that most abstracts presented at scientific meetings that are subsequently accepted for publication are published within 2 to 3 years of the meeting,12 with publication rates as high as 98% within 3 years of presentation.17 In contrast to Carroll et al., we found that abstracts accepted for oral presentation had a 4-fold greater likelihood of publication at each month than rejected abstracts. However, abstracts accepted for poster presentation did not have a significant difference in the proportional hazard ratio models for publication compared with rejected abstracts. Because space considerations limit the number of abstracts that can be accepted for presentation at a conference, some abstracts that are suitable for future publication may have been rejected due to a lack of space. Because researchers often use scientific meetings as a forum to receive peer feedback,12 authors who present at conferences may take more time to write a manuscript in order to incorporate this feedback.
The most common journal in which submitted abstracts were subsequently published was Hospital Pediatrics, representing twice as many published manuscripts as the second most frequent journal, Pediatrics. Hospital Pediatrics, which was first published in 2011, did not have an impact factor assigned during the study period. Yet, as a peer-reviewed journal dedicated to the field of PHM, it is well aligned with the research presented at the PHM meeting. It is unclear if Hospital Pediatrics is a journal to which pediatric hospitalists tend to submit manuscripts initially or if manuscripts are frequently submitted elsewhere prior to their publication in Hospital Pediatrics. Submission to other journals first likely extends the time to publication, especially for abstracts accepted for poster presentation, which may describe studies with less developed methods or results.
This study has several limitations. Previous studies have demonstrated mean time to publication of 12 to 32 months following abstract presentation with a median time of 19.6 months.16 Because we only have a 30-month follow-up, there may be abstracts still in the review process that are yet to be published, especially because the length of the review process varies by journal. We based our literature search on the first author of each PHM conference abstract submission, assuming that this presenting author would be one of the publishing authors even if not remaining first author; if this was not the case, we may have missed some abstracts that were subsequently published in full. Likewise, if a presenting author’s last name changed prior to the publication of a manuscript, a publication may have been missed. This limitation would cause us to underestimate the overall publication rate. It is not clear whether this would differentially affect the method of presentation. However, in this study, there was concordance between the presenting author and the publication’s first author in 87.8% of the abstracts subsequently published in full. Presenting authors who did not remain the first author on the published manuscript maintained authorship as either the senior author or second or third author, which may represent changes in the degree of involvement or a division of responsibilities for individuals working on a project together. While our search methods were comprehensive, there is a possibility that abstracts may have been published in a venue that was not searched. Additionally, we only reviewed abstracts submitted to PHM for 1 year. As the field matures and the number of fellowship programs increases, the quality of submitted abstracts may increase, leading to higher publication rates or shorter times to publication. It is also possible that the publication rate may not be reflective of PHM as a field because hospitalists may submit their work to conferences other than the PHM. Lastly, it may be more challenging to interpret any differences in impact factor because some journals, including Hospital Pediatrics (which represented a plurality of poster presentation abstracts that were subsequently published and is a relatively new journal), did not have an impact factor assigned during the study period. Assigning a 0 to journals without an impact factor may artificially lower the average impact factor reported. Furthermore, an impact factor, which is based on the frequency with which an individual journal’s articles are cited in scientific or medical publications, may not necessarily reflect a journal’s quality.
CONCLUSIONS
Of the 226 abstracts submitted to the 2014 PHM conference, approximately one-third were published in peer-reviewed journals within 30 months of the conference. Selection for oral presentation was found to be associated with subsequent publication as well as publication in journals with higher impact factors. The overall low publication rate may indicate a need for increased mentorship and resources for research development in this growing specialty. Improved mechanisms for author feedback at poster sessions may provide constructive suggestions for further development of these projects into full manuscripts or opportunities for trainees and early-career hospitalists to network with more experienced researchers in the field.
Disclosure
Drs. Herrmann, Hall, Kyler, Andrews, Williams, and Shah and Mr. Cochran have nothing to disclose. Dr. Wilson reports personal fees from the American Academy of Pediatrics during the conduct of the study. The authors have no financial relationships relevant to this article to disclose.
1. Stucky ER, Ottolini MC, Maniscalco J. Pediatric hospital medicine core competencies: development and methodology. J Hosp Med. 2010;5(6):339-343. PubMed
2. Freed GL, McGuinness GA, Althouse LA, Moran LM, Spera L. Long-term plans for those selecting hospital medicine as an initial career choice. Hosp Pediatr. 2015;5(4):169-174. PubMed
3. Rauch D. Pediatric Hospital Medicine Subspecialty. 2016; https://www.aap.org/en-us/about-the-aap/Committees-Councils-Sections/Section-on-Hospital-Medicine/Pages/Pediatric-Hospital-Medicine-Subspecialty.aspx. Accessed November 28, 2016.
4. Bekmezian A, Teufel RJ, Wilson KM. Research needs of pediatric hospitalists. Hosp Pediatr. 2011;1(1):38-44. PubMed
5. Teufel RJ, Bekmezian A, Wilson K. Pediatric hospitalist research productivity: predictors of success at presenting abstracts and publishing peer-reviewed manuscripts among pediatric hospitalists. Hosp Pediatr. 2012;2(3):149-160. PubMed
6. Wilson KM, Shah SS, Simon TD, Srivastava R, Tieder JS. The challenge of pediatric hospital medicine research. Hosp Pediatr. 2012;2(1):8-9. PubMed
7. Froom P, Froom J. Presentation Deficiencies in structured medical abstracts. J Clin Epidemiol. 1993;46(7):591-594. PubMed
8. Relman AS. News reports of medical meetings: how reliable are abstracts? N Engl J Med. 1980;303(5):277-278. PubMed
9. Soffer A. Beware the 200-word abstract! Arch Intern Med. 1976;136(11):1232-1233. PubMed
10. Bhandari M, Devereaux P, Guyatt GH, et al. An observational study of orthopaedic abstracts and subsequent full-text publications. J Bone Joint Surg Am. 2002;84(4):615-621. PubMed
11. Castagnetti M, Subramaniam R, El-Ghoneimi A. Abstracts presented at the European Society for Pediatric Urology (ESPU) meetings (2003–2010): Characteristics and outcome. J Pediatr Urol. 2014;10(2):355-360. PubMed
12. Halikman R, Scolnik D, Rimon A, Glatstein MM. Peer-Reviewed Journal Publication of Abstracts Presented at an International Emergency Medicine Scientific Meeting: Outcomes and Comparison With the Previous Meeting. Pediatr Emerg Care. 2016. PubMed
13. Relman AS. Peer review in scientific journals--what good is it? West J Med. 1990;153(5):520. PubMed
14. Riordan F. Do presenters to paediatric meetings get their work published? Arch Dis Child. 2000;83(6):524-526. PubMed
15. Scherer RW, Dickersin K, Langenberg P. Full publication of results initially presented in abstracts: a meta-analysis. JAMA. 1994;272(2):158-162. PubMed
16. Scherer RW, Langenberg P, Elm E. Full publication of results initially presented in abstracts. Cochrane Database Syst Rev. 2005. PubMed
17. Marx WF, Cloft HJ, Do HM, Kallmes DF. The fate of neuroradiologic abstracts presented at national meetings in 1993: rate of subsequent publication in peer-reviewed, indexed journals. Am J Neuroradiol. 1999;20(6):1173-1177. PubMed
18. Roy D, Sankar V, Hughes J, Jones A, Fenton J. Publication rates of scientific papers presented at the Otorhinolarygological Research Society meetings. Clin Otolaryngol Allied Sci. 2001;26(3):253-256. PubMed
19. McCormick MC, Holmes JH. Publication of research presented at the pediatric meetings: change in selection. Am J Dis Child. 1985;139(2):122-126. PubMed
20. Carroll AE, Sox CM, Tarini BA, Ringold S, Christakis DA. Does presentation format at the Pediatric Academic Societies’ annual meeting predict subsequent publication? Pediatrics. 2003;112(6):1238-1241. PubMed
21. Saha S, Saint S, Christakis DA. Impact factor: a valid measure of journal quality? J Med Libr Assoc. 2003;91(1):42. PubMed
22. Office for Human Research Protections. Code of Federal Regulations, Title 45 Public Welfare: Part 46, Protection of Human Subjects, §46.102(f ). http://www.hhs.gov/ohrp/regulations-and-policy/regulations/45-cfr-46/index.html#46.102. Accessed October 21, 2016.
23. Weber EJ, Callaham ML, Wears RL, Barton C, Young G. Unpublished research from a medical specialty meeting: why investigators fail to publish. JAMA. 1998;280(3):257-259. PubMed
24. Timmer A, Hilsden RJ, Cole J, Hailey D, Sutherland LR. Publication bias in gastroenterological research–a retrospective cohort study based on abstracts submitted to a scientific meeting. BMC Med Res Methodol. 2002;2(1):1. PubMed
© 2018 Society of Hospital Medicine
Impact of Pneumonia Guidelines
Overutilization of resources is a significant, yet underappreciated, problem in medicine. Many interventions target underutilization (eg, immunizations) or misuse (eg, antibiotic prescribing for viral pharyngitis), yet overutilization remains as a significant contributor to healthcare waste.[1] In an effort to reduce waste, the Choosing Wisely campaign created a work group to highlight areas of overutilization, specifically noting both diagnostic tests and therapies for common pediatric conditions with no proven benefit and possible harm to the patient.[2] Respiratory illnesses have been a target of many quality‐improvement efforts, and pneumonia represents a common diagnosis in pediatrics.[3] The use of diagnostic testing for pneumonia is an area where care can be optimized and aligned with evidence.
Laboratory testing and diagnostic imaging are routinely used for the management of children with community‐acquired pneumonia (CAP). Several studies have documented substantial variability in the use of these resources for pneumonia management, with higher resource use associated with a higher chance of hospitalization after emergency department (ED) evaluation and a longer length of stay among those requiring hospitalization.[4, 5] This variation in diagnostic resource utilization has been attributed, at least in part, to a lack of consensus on the management of pneumonia. There is wide variability in diagnostic testing, and due to potential consequences for patients presenting with pneumonia, efforts to standardize care offer an opportunity to improve healthcare value.
In August 2011, the first national, evidence‐based consensus guidelines for the management of childhood CAP were published jointly by the Pediatric Infectious Diseases Society (PIDS) and the Infectious Diseases Society of America (IDSA).[6] A primary focus of these guidelines was the recommendation for the use of narrow spectrum antibiotics for the management of uncomplicated pneumonia. Previous studies have assessed the impact of the publication of the PIDS/IDSA guidelines on empiric antibiotic selection for the management of pneumonia.[7, 8] In addition, the guidelines provided recommendations regarding diagnostic test utilization, in particular discouraging blood tests (eg, complete blood counts) and radiologic studies for nontoxic, fully immunized children treated as outpatients, as well as repeat testing for children hospitalized with CAP who are improving.
Although single centers have demonstrated changes in utilization patterns based on clinical practice guidelines,[9, 10, 11, 12] whether these guidelines have impacted diagnostic test utilization among US children with CAP in a larger scale remains unknown. Therefore, we sought to determine the impact of the PIDS/IDSA guidelines on the use of diagnostic testing among children with CAP using a national sample of US children's hospitals. Because the guidelines discourage repeat diagnostic testing in patients who are improving, we also evaluated the association between repeat diagnostic studies and severity of illness.
METHODS
This retrospective cohort study used data from the Pediatric Health Information System (PHIS) (Children's Hospital Association, Overland Park, KS). The PHIS database contains deidentified administrative data, detailing demographic, diagnostic, procedure, and billing data from 47 freestanding, tertiary care children's hospitals. This database accounts for approximately 20% of all annual pediatric hospitalizations in the United States. Data quality is ensured through a joint effort between the Children's Hospital Association and participating hospitals.
Patient Population
Data from 32 (of the 47) hospitals included in PHIS with complete inpatient and ED data were used to evaluate hospital‐level resource utilization for children 1 to 18 years of age discharged January 1, 2008 to June 30, 2014 with a diagnosis of pneumonia (International Classification of Diseases, 9th Revision [ICD‐9] codes 480.x‐486.x, 487.0).[13] Our goal was to identify previously healthy children with uncomplicated pneumonia, so we excluded patients with complex chronic conditions,[14] billing charges for intensive care management and/or pleural drainage procedure (IDC‐9 codes 510.0, 510.9, 511.0, 511.1, 511.8, 511.9, 513.x) on day of admission or the next day, or prior pneumonia admission in the last 30 days. We studied 2 mutually exclusive populations: children with pneumonia treated in the ED (ie, patients who were evaluated in the ED and discharged to home), and children hospitalized with pneumonia, including those admitted through the ED.
Guideline Publication and Study Periods
For an exploratory before and after comparison, patients were grouped into 2 cohorts based on a guideline online publication date of August 1, 2011: preguideline (January 1, 2008 to July 31, 2011) and postguideline (August 1, 2011 to June 30, 2014).
Study Outcomes
The measured outcomes were the monthly proportion of pneumonia patients for whom specific diagnostic tests were performed, as determined from billing data. The diagnostic tests evaluated were complete blood count (CBC), blood culture, C‐reactive protein (CRP), and chest radiograph (CXR). Standardized costs were also calculated from PHIS charges as previously described to standardize the cost of the individual tests and remove interhospital cost variation.[3]
Relationship of Repeat Testing and Severity of Illness
Because higher illness severity and clinical deterioration may warrant repeat testing, we also explored the association of repeat diagnostic testing for inpatients with severity of illness by using the following variables as measures of severity: length of stay (LOS), transfer to intensive care unit (ICU), or pleural drainage procedure after admission (>2 calendar days after admission). Repeat diagnostic testing was stratified by number of tests.
Statistical Analysis
The categorical demographic characteristics of the pre‐ and postguideline populations were summarized using frequencies and percentages, and compared using 2 tests. Continuous demographics were summarized with medians and interquartile ranges (IQRs) and compared with the Wilcoxon rank sum test. Segmented regression, clustered by hospital, was used to assess trends in monthly resource utilization as well as associated standardized costs before and after guidelines publication. To estimate the impact of the guidelines overall, we compared the observed diagnostic resource use at the end of the study period with expected use projected from trends in the preguidelines period (ie, if there were no new guidelines). Individual interrupted time series were also built for each hospital. From these models, we assessed which hospitals had a significant difference between the rate observed at the end of the study and that estimated from their preguideline trajectory. To assess the relationship between the number of positive improvements at a hospital and hospital characteristics, we used Spearman's correlation and Kruskal‐Wallis tests. All analyses were performed with SAS version 9.3 (SAS Institute, Inc., Cary, NC), and P values <0.05 were considered statistically significant. In accordance with the policies of the Cincinnati Children's Hospital Medical Center Institutional Review Board, this research, using a deidentified dataset, was not considered human subjects research.
RESULTS
There were 275,288 hospital admissions meeting study inclusion criteria of 1 to 18 years of age with a diagnosis of pneumonia from 2008 to 2014. Of these, 54,749 met exclusion criteria (1874 had pleural drainage procedure on day 0 or 1, 51,306 had complex chronic conditions, 1569 were hospitalized with pneumonia in the last 30 days). Characteristics of the remaining 220,539 patients in the final sample are shown in Table 1. The median age was 4 years (IQR, 27 years); a majority of the children were male (53%) and had public insurance (58%). There were 128,855 patients in the preguideline period (January 1, 2008 to July 31, 2011) and 91,684 in the post guideline period (August 1, 2011June 30, 2014).
| Overall | Preguideline | Postguideline | P | |
|---|---|---|---|---|
| ||||
| No. of discharges | 220,539 | 128,855 | 91,684 | |
| Type of encounter | ||||
| ED only | 150,215 (68.1) | 88,790 (68.9) | 61,425 (67) | <0.001 |
| Inpatient | 70,324 (31.9) | 40,065 (31.1) | 30,259 (33) | |
| Age | ||||
| 14 years | 129,360 (58.7) | 77,802 (60.4) | 51,558 (56.2) | <0.001 |
| 59 years | 58,609 (26.6) | 32,708 (25.4) | 25,901 (28.3) | |
| 1018 years | 32,570 (14.8) | 18,345 (14.2) | 14,225 (15.5) | |
| Median [IQR] | 4 [27] | 3 [27] | 4 [27] | <0.001 |
| Gender | ||||
| Male | 116,718 (52.9) | 68,319 (53) | 48,399 (52.8) | 00.285 |
| Female | 103,813 (47.1) | 60,532 (47) | 43,281 (47.2) | |
| Race | ||||
| Non‐Hispanic white | 84,423 (38.3) | 47,327 (36.7) | 37,096 (40.5) | <0.001 |
| Non‐Hispanic black | 60,062 (27.2) | 35,870 (27.8) | 24,192 (26.4) | |
| Hispanic | 51,184 (23.2) | 31,167 (24.2) | 20,017 (21.8) | |
| Asian | 6,444 (2.9) | 3,691 (2.9) | 2,753 (3) | |
| Other | 18,426 (8.4) | 10,800 (8.4) | 7,626 (8.3) | |
| Payer | ||||
| Government | 128,047 (58.1) | 70,742 (54.9) | 57,305 (62.5) | <0.001 |
| Private | 73,338 (33.3) | 44,410 (34.5) | 28,928 (31.6) | |
| Other | 19,154 (8.7) | 13,703 (10.6) | 5,451 (5.9) | |
| Disposition | ||||
| HHS | 684 (0.3) | 411 (0.3) | 273 (0.3) | <0.001 |
| Home | 209,710 (95.1) | 123,236 (95.6) | 86,474 (94.3) | |
| Other | 9,749 (4.4) | 4,962 (3.9) | 4,787 (5.2) | |
| SNF | 396 (0.2) | 246 (0.2) | 150 (0.2) | |
| Season | ||||
| Spring | 60,171 (27.3) | 36,709 (28.5) | 23,462 (25.6) | <0.001 |
| Summer | 29,891 (13.6) | 17,748 (13.8) | 12,143 (13.2) | |
| Fall | 52,161 (23.7) | 28,332 (22) | 23,829 (26) | |
| Winter | 78,316 (35.5) | 46,066 (35.8) | 32,250 (35.2) | |
| LOS | ||||
| 13 days | 204,812 (92.9) | 119,497 (92.7) | 85,315 (93.1) | <0.001 |
| 46 days | 10,454 (4.7) | 6,148 (4.8) | 4,306 (4.7) | |
| 7+ days | 5,273 (2.4) | 3,210 (2.5) | 2,063 (2.3) | |
| Median [IQR] | 1 [11] | 1 [11] | 1 [11] | 0.144 |
| Admitted patients, median [IQR] | 2 [13] | 2 [13] | 2 [13] | <0.001 |
Discharged From the ED
Throughout the study, utilization of CBC, blood cultures, and CRP was <20%, whereas CXR use was >75%. In segmented regression analysis, CRP utilization was relatively stable before the guidelines publication. However, by the end of the study period, the projected estimate of CRP utilization without guidelines (expected) was 2.9% compared with 4.8% with the guidelines (observed) (P < 0.05) (Figure 1). A similar pattern of higher rates of diagnostic utilization after the guidelines compared with projected estimates without the guidelines was also seen in the ED utilization of CBC, blood cultures, and CXR (Figure 1); however, these trends did not achieve statistical significance. Table 2 provides specific values. Using a standard cost of $19.52 for CRP testing, annual costs across all hospitals increased $11,783 for ED evaluation of CAP.
Baseline (%) | Preguideline Trend | Level Change at Guideline | Change in Trend After Guideline | Estimates at End of Study* | |||
|---|---|---|---|---|---|---|---|
Without Guideline (%) | With Guideline (%) | P | |||||
| |||||||
| ED‐only encounters | |||||||
| Blood culture | 14.6 | 0.1 | 0.8 | 0.1 | 5.5 | 8.6 | NS |
| CBC | 19.2 | 0.1 | 0.4 | 0.1 | 10.7 | 14.0 | NS |
| CRP | 5.4 | 0.0 | 0.6 | 0.1 | 2.9 | 4.8 | <0.05 |
| Chest x‐ray | 85.4 | 0.1 | 0.1 | 0.0 | 80.9 | 81.1 | NS |
| Inpatient encounters | |||||||
| Blood culture | 50.6 | 0.0 | 1.7 | 0.2 | 49.2 | 41.4 | <0.05 |
| Repeat blood culture | 6.5 | 0.0 | 1.0 | 0.1 | 8.9 | 5.8 | NS |
| CBC | 65.2 | 0.0 | 3.1 | 0.0 | 65.0 | 62.2 | NS |
| Repeat CBC | 23.4 | 0.0 | 4.2 | 0.0 | 20.8 | 16.0 | NS |
| CRP | 25.7 | 0.0 | 1.1 | 0.0 | 23.8 | 23.5 | NS |
| Repeat CRP | 12.5 | 0.1 | 2.2 | 0.1 | 7.1 | 7.3 | NS |
| Chest x‐ray | 89.4 | 0.1 | 0.7 | 0.0 | 85.4 | 83.9 | NS |
| Repeat chest x‐ray | 25.5 | 0.0 | 2.0 | 0.1 | 24.1 | 17.7 | <0.05 |
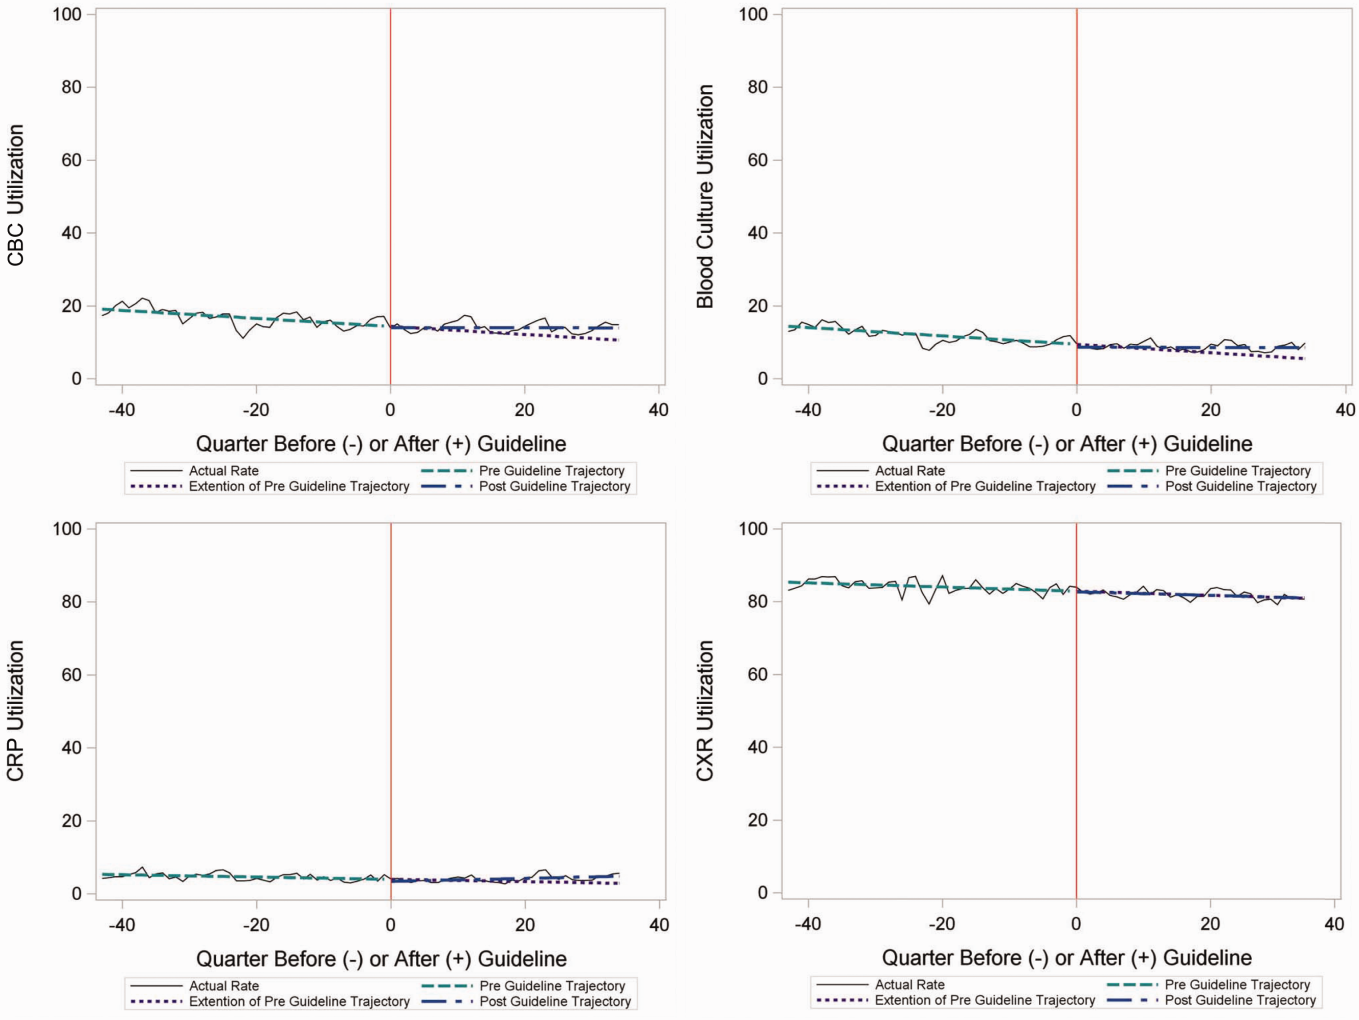
Inpatient Encounters
In the segmented regression analysis of children hospitalized with CAP, guideline publication was associated with changes in the monthly use of some diagnostic tests. For example, by the end of the study period, the use of blood culture was 41.4% (observed), whereas the projected estimated use in the absence of the guidelines was 49.2% (expected) (P < 0.05) (Figure 2). Table 2 includes the data for the other tests, CBC, CRP, and CXR, in which similar patterns are noted with lower utilization rates after the guidelines, compared with expected utilization rates without the guidelines; however, these trends did not achieve statistical significance. Evaluating the utilization of repeat testing for inpatients, only repeat CXR achieved statistical significance (P < 0.05), with utilization rates of 17.7% with the guidelines (actual) compared with 24.1% without the guidelines (predicted).
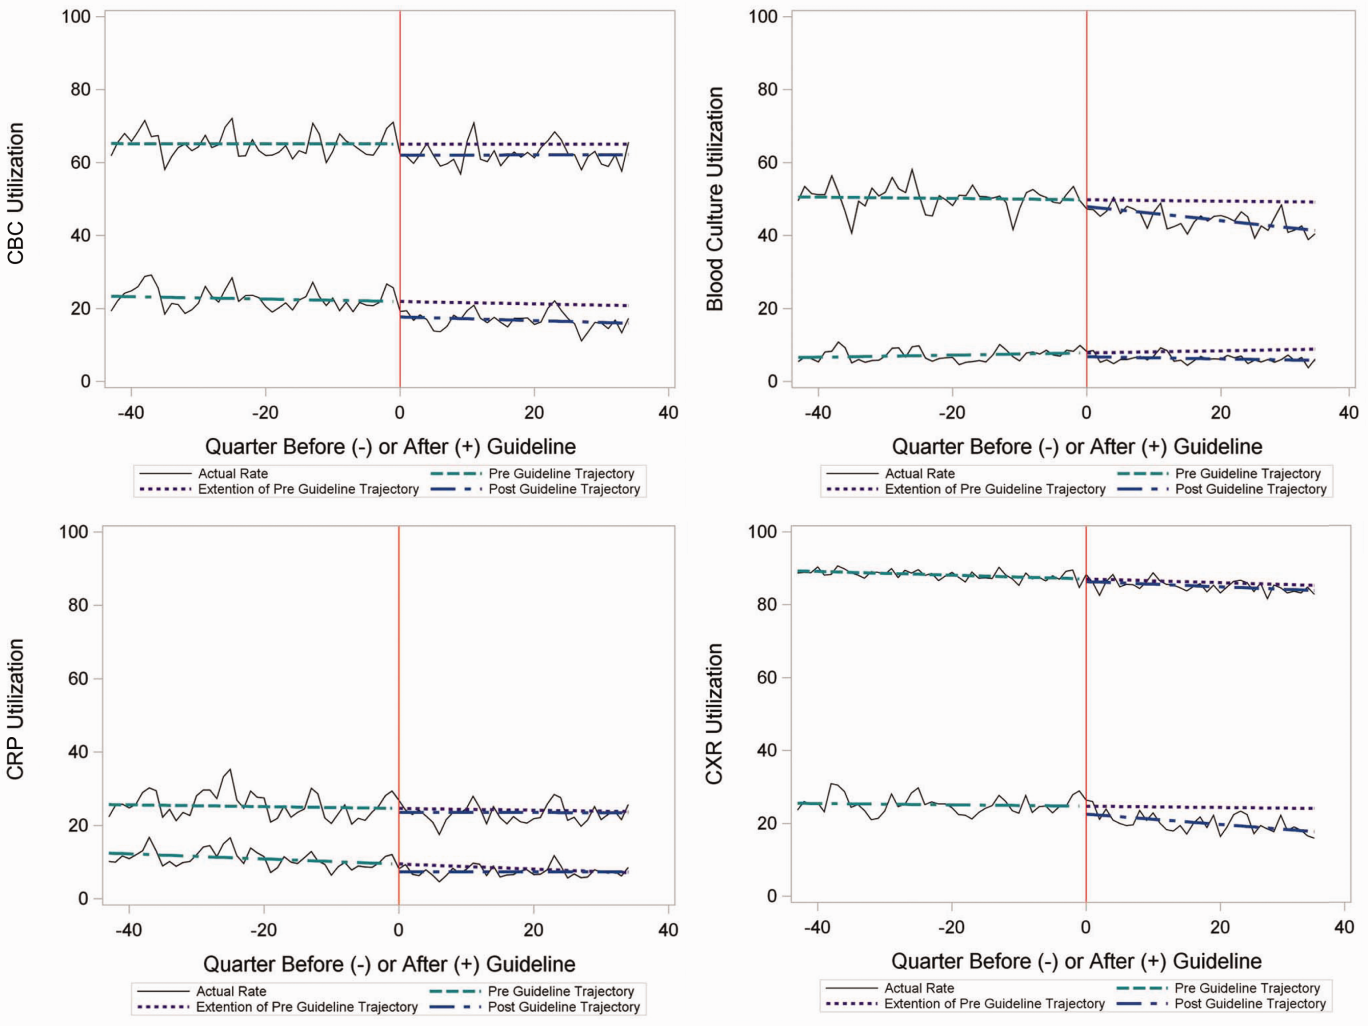
To better understand the use of repeat testing, a comparison of severity outcomesLOS, ICU transfer, and pleural drainage procedureswas performed between patients with no repeat testing (70%) and patients with 1 or more repeat tests (30%). Patients with repeat testing had longer LOS (no repeat testing LOS 1 [IQR, 12]) versus 1 repeat test LOS 3 ([IQR, 24] vs 2+ repeat tests LOS 5 [IQR, 38]), higher rate of ICU transfer (no repeat testing 4.6% vs 1 repeat test 14.6% vs 2+ repeat test 35.6%), and higher rate of pleural drainage (no repeat testing 0% vs 1 repeat test 0.1% vs 2+ repeat test 5.9%] (all P < 0.001).
Using standard costs of $37.57 for blood cultures and $73.28 for CXR, annual costs for children with CAP across all hospitals decreased by $91,512 due to decreased utilization of blood cultures, and by $146,840 due to decreased utilization of CXR.
Hospital‐Level Variation in the Impact of the National Guideline
Figure 3 is a visual representation (heat map) of the impact of the guidelines at the hospital level at the end of the study from the individual interrupted time series. Based on this heat map (Figure 3), there was wide variability between hospitals in the impact of the guideline on each test in different settings (ED or inpatient). By diagnostic testing, 7 hospitals significantly decreased utilization of blood cultures for inpatients, and 5 hospitals significantly decreased utilization for repeat blood cultures and repeat CXR. Correlation between the number of positive improvements at a hospital and region (P = 0.974), number of CAP cases (P = 0.731), or percentage of public insurance (P = 0.241) were all nonsignificant.
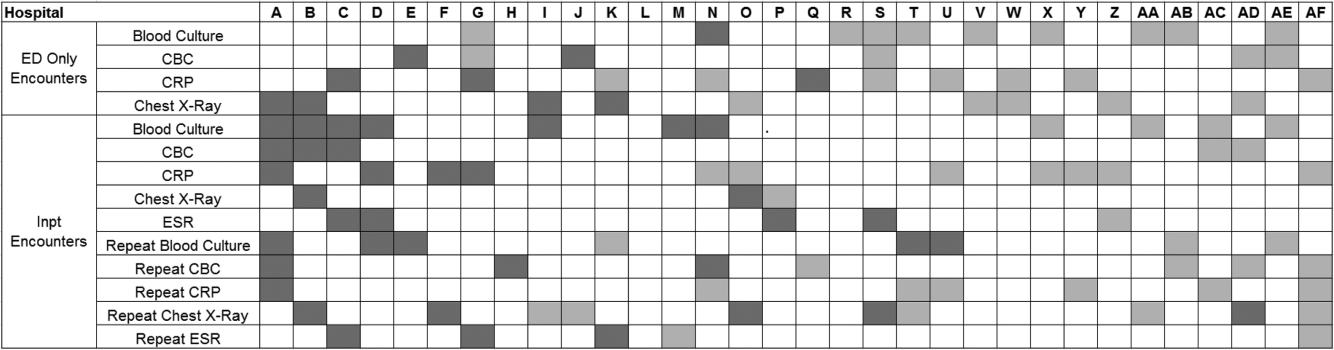
DISCUSSION
This study complements previous assessments by evaluating the impact of the 2011 IDSA/PIDS consensus guidelines on the management of children with CAP cared for at US children's hospitals. Prior studies have shown increased use of narrow‐spectrum antibiotics for children with CAP after the publication of these guidelines.[7] The current study focused on diagnostic testing for CAP before and after the publication of the 2011 guidelines. In the ED setting, use of some diagnostic tests (blood culture, CBC, CXR, CRP) was declining prior to guideline publication, but appeared to plateau and/or increase after 2011. Among children admitted with CAP, use of diagnostic testing was relatively stable prior to 2011, and use of these tests (blood culture, CBC, CXR, CRP) declined after guideline publication. Overall, changes in diagnostic resource utilization 3 years after publication were modest, with few changes achieving statistical significance. There was a large variability in the impact of guidelines on test use between hospitals.
For outpatients, including those managed in the ED, the PIDS/IDSA guidelines recommend limited laboratory testing in nontoxic, fully immunized patients. The guidelines discourage the use of diagnostic testing among outpatients because of their low yield (eg, blood culture), and because test results may not impact management (eg, CBC).[6] In the years prior to guideline publication, there was already a declining trend in testing rates, including blood cultures, CBC, and CRP, for patients in the ED. After guideline publication, the rate of blood cultures, CBC, and CRP increased, but only the increase in CRP utilization achieved statistical significance. We would not expect utilization for common diagnostic tests (eg, CBC for outpatients with CAP) to be at or close to 0% because of the complexity of clinical decision making regarding admission that factors in aspects of patient history, exam findings, and underlying risk.[15] ED utilization of blood cultures was <10%, CBC <15%, and CRP <5% after guideline publication, which may represent the lowest testing limit that could be achieved.
CXRs obtained in the ED did not decrease over the entire study period. The rates of CXR use (close to 80%) seen in our study are similar to prior ED studies.[5, 16] Management of children with CAP in the ED might be different than outpatient primary care management because (1) unlike primary care providers, ED providers do not have an established relationship with their patients and do not have the opportunity for follow‐up and serial exams, making them less likely to tolerate diagnostic uncertainty; and (2) ED providers may see sicker patients. However, use of CXR in the ED does represent an opportunity for further study to understand if decreased utilization is feasible without adversely impacting clinical outcomes.
The CAP guidelines provide a strong recommendation to obtain blood culture in moderate to severe pneumonia. Despite this, blood culture utilization declined after guideline publication. Less than 10% of children hospitalized with uncomplicated CAP have positive blood cultures, which calls into question the utility of blood cultures for all admitted patients.[17, 18, 19] The recent EPIC (Epidemiology of Pneumonia in the Community) study showed that a majority of children hospitalized with pneumonia do not have growth of bacteria in culture, but there may be a role for blood cultures in patients with a strong suspicion of complicated CAP or in the patient with moderate to severe disease.[20] In addition to blood cultures, the guidelines also recommend CBC and CXR in moderate to severely ill children. This observed decline in testing in CBC and CXR may be related to individual physician assessments of which patients are moderately to severely ill, as the guidelines do not recommend testing for children with less severe disease. Our exclusion of patients requiring intensive care management or pleural drainage on admission might have selected children with a milder course of illness, although still requiring admission.
The guidelines discourage repeat diagnostic testing among children hospitalized with CAP who are improving. In this study, repeat CXR and CBC occurred in approximately 20% of patients, but repeat blood culture and CRP was much lower. As with initial diagnostic testing for inpatients with CAP, the rates of some repeat testing decreased with the guidelines. However, those with repeat testing had longer LOS and were more likely to require ICU transfer or a pleural drainage procedure compared to children without repeat testing. This suggests that repeat testing is used more often in children with a severe presentation or a worsening clinical course, and not done routinely on hospitalized patients.
The financial impact of decreased testing is modest, because the tests themselves are relatively inexpensive. However, the lack of substantial cost savings should not preclude efforts to continue to improve adherence to the guidelines. Not only is increased testing associated with higher hospitalization rates,[5] potentially yielding higher costs and family stress, increased testing may also lead to patient discomfort and possibly increased radiation exposure through chest radiography.
Many of the diagnostic testing recommendations in the CAP guidelines are based on weak evidence, which may contribute to the lack of substantial adoption. Nevertheless, adherence to guideline recommendations requires sustained effort on the part of individual physicians that should be encouraged through institutional support.[21] Continuous education and clinical decision support, as well as reminders in the electronic medical record, would make guideline recommendations more visible and may help overcome the inertia of previous practice.[15] The hospital‐level heat map (Figure 3) included in this study demonstrates that the impact of the guidelines was variable across sites. Although a few sites had decreased diagnostic testing in many areas with no increased testing in any category, there were several sites that had no improvement in any diagnostic testing category. In addition, hospital‐level factors like size, geography, and insurance status were not associated with number of improvements. To better understand drivers of change at individual hospitals, future studies should evaluate specific strategies utilized by the rapid guideline adopters.
This study is subject to several limitations. The use of ICD‐9 codes to identify patients with CAP may not capture all patients with this diagnosis; however, these codes have been previously validated.[13] Additionally, because patients were identified using ICD‐9 coding assigned at the time of discharge, testing performed in the ED setting may not reflect care for a child with known pneumonia, but rather may reflect testing for a child with fever or other signs of infection. PHIS collects data from freestanding children's hospitals, which care for a majority of children with CAP in the US, but our findings may not be generalizable to other hospitals. In addition, we did not examine drivers of trends within individual institutions. We did not have detailed information to examine whether the PHIS hospitals in our study had actively worked to adopt the CAP guidelines. We were also unable to assess physician's familiarity with guidelines or the level of disagreement with the recommendations. Furthermore, the PHIS database does not permit detailed correlation of diagnostic testing with clinical parameters. In contrast to the diagnostic testing evaluated in this study, which is primarily discouraged by the IDSA/PIDS guidelines, respiratory viral testing for children with CAP is recommended but could not be evaluated, as data on such testing are not readily available in PHIS.
CONCLUSION
Publication of the IDSA/PIDS evidence‐based guidelines for the management of CAP was associated with modest, variable changes in use of diagnostic testing. Further adoption of the CAP guidelines should reduce variation in care and decrease unnecessary resource utilization in the management of CAP. Our study demonstrates that efforts to promote decreased resource utilization should target specific situations (eg, repeat testing for inpatients who are improving). Adherence to guidelines may be improved by the adoption of local practices that integrate and improve daily workflow, like order sets and clinical decision support tools.
Disclosure: Nothing to report.
- , . Eliminating waste in US health care. JAMA. 2012;307(14):1513–1516.
- , , , et al. Choosing wisely in pediatric hospital medicine: five opportunities for improved healthcare value. J Hosp Med. 2013;8(9):479–485.
- , , , et al.; Pediatric Research in Inpatient Settings (PRIS) Network. Prioritization of comparative effectiveness research topics in hospital pediatrics. Arch Pediatr Adolesc Med. 2012;166(12):1155–1164.
- , , , et al. Variability in processes of care and outcomes among children hospitalized with community‐acquired pneumonia. Pediatr Infect Dis J. 2012;31(10):1036–1041.
- , , , , . Variation in emergency department diagnostic testing and disposition outcomes in pneumonia. Pediatrics. 2013;132(2):237–244.
- , , , et al.; Pediatric Infectious Diseases Society and the Infectious Diseases Society of America. The management of community‐acquired pneumonia in infants and children older than 3 months of age: clinical practice guidelines by the Pediatric Infectious Diseases Society and the Infectious Diseases Society of America. Clin Infect Dis. 2011;53(7):e25–e76.
- , , , et al., Impact of Infectious Diseases Society of America/Pediatric Infectious Diseases Society guidelines on treatment of community‐acquired pneumonia in hospitalized children. Clin Infect Dis. 2014;58(6):834–838.
- , , , et al. Antibiotic choice for children hospitalized with pneumonia and adherence to national guidelines. Pediatrics. 2015;136(1):44–52.
- , , , et al. Quality improvement methods increase appropriate antibiotic prescribing for childhood pneumonia. Pediatrics. 2013;131(5):e1623–e1631.
- , , , et al. Improvement methodology increases guideline recommended blood cultures in children with pneumonia. Pediatrics. 2015;135(4):e1052–e1059.
- , , , , , . Impact of a guideline on management of children hospitalized with community‐acquired pneumonia. Pediatrics. 2012;129(3):e597–e604.
- , , , . Effectiveness of antimicrobial guidelines for community‐acquired pneumonia in children. Pediatrics. 2012;129(5):e1326–e1333.
- , , , et al. Identifying pediatric community‐acquired pneumonia hospitalizations: accuracy of administrative billing codes. JAMA Pediatr. 2013;167(9):851–858.
- , , , , . Pediatric complex chronic conditions classification system version 2: updated for ICD‐10 and complex medical technology dependence and transplantation. BMC Pediatr. 2014;14:199.
- , . Establishing superior benchmarks of care in clinical practice: a proposal to drive achievable health care value. JAMA Pediatr. 2015;169(4):301–302.
- , , , . Emergency department management of childhood pneumonia in the United States prior to publication of national guidelines. Acad Emerg Med. 2013;20(3):240–246.
- , , , et al. Prevalence of bacteremia in hospitalized pediatric patients with community‐acquired pneumonia. Pediatr Infect Dis J. 2013;32(7):736–740.
- , , , , . The prevalence of bacteremia in pediatric patients with community‐acquired pneumonia: guidelines to reduce the frequency of obtaining blood cultures. Hosp Pediatr. 2013;3(2):92–96.
- . Do all children hospitalized with community‐acquired pneumonia require blood cultures? Hosp Pediatr. 2013;3(2):177–179.
- , , , et al.; CDC EPIC Study Team. Community‐acquired pneumonia requiring hospitalization among U.S. children. N Engl J Med. 2015;372(9):835–845.
- , , , et al. Influence of hospital guidelines on management of children hospitalized with pneumonia. Pediatrics. 2012;130(5):e823–e830.
Overutilization of resources is a significant, yet underappreciated, problem in medicine. Many interventions target underutilization (eg, immunizations) or misuse (eg, antibiotic prescribing for viral pharyngitis), yet overutilization remains as a significant contributor to healthcare waste.[1] In an effort to reduce waste, the Choosing Wisely campaign created a work group to highlight areas of overutilization, specifically noting both diagnostic tests and therapies for common pediatric conditions with no proven benefit and possible harm to the patient.[2] Respiratory illnesses have been a target of many quality‐improvement efforts, and pneumonia represents a common diagnosis in pediatrics.[3] The use of diagnostic testing for pneumonia is an area where care can be optimized and aligned with evidence.
Laboratory testing and diagnostic imaging are routinely used for the management of children with community‐acquired pneumonia (CAP). Several studies have documented substantial variability in the use of these resources for pneumonia management, with higher resource use associated with a higher chance of hospitalization after emergency department (ED) evaluation and a longer length of stay among those requiring hospitalization.[4, 5] This variation in diagnostic resource utilization has been attributed, at least in part, to a lack of consensus on the management of pneumonia. There is wide variability in diagnostic testing, and due to potential consequences for patients presenting with pneumonia, efforts to standardize care offer an opportunity to improve healthcare value.
In August 2011, the first national, evidence‐based consensus guidelines for the management of childhood CAP were published jointly by the Pediatric Infectious Diseases Society (PIDS) and the Infectious Diseases Society of America (IDSA).[6] A primary focus of these guidelines was the recommendation for the use of narrow spectrum antibiotics for the management of uncomplicated pneumonia. Previous studies have assessed the impact of the publication of the PIDS/IDSA guidelines on empiric antibiotic selection for the management of pneumonia.[7, 8] In addition, the guidelines provided recommendations regarding diagnostic test utilization, in particular discouraging blood tests (eg, complete blood counts) and radiologic studies for nontoxic, fully immunized children treated as outpatients, as well as repeat testing for children hospitalized with CAP who are improving.
Although single centers have demonstrated changes in utilization patterns based on clinical practice guidelines,[9, 10, 11, 12] whether these guidelines have impacted diagnostic test utilization among US children with CAP in a larger scale remains unknown. Therefore, we sought to determine the impact of the PIDS/IDSA guidelines on the use of diagnostic testing among children with CAP using a national sample of US children's hospitals. Because the guidelines discourage repeat diagnostic testing in patients who are improving, we also evaluated the association between repeat diagnostic studies and severity of illness.
METHODS
This retrospective cohort study used data from the Pediatric Health Information System (PHIS) (Children's Hospital Association, Overland Park, KS). The PHIS database contains deidentified administrative data, detailing demographic, diagnostic, procedure, and billing data from 47 freestanding, tertiary care children's hospitals. This database accounts for approximately 20% of all annual pediatric hospitalizations in the United States. Data quality is ensured through a joint effort between the Children's Hospital Association and participating hospitals.
Patient Population
Data from 32 (of the 47) hospitals included in PHIS with complete inpatient and ED data were used to evaluate hospital‐level resource utilization for children 1 to 18 years of age discharged January 1, 2008 to June 30, 2014 with a diagnosis of pneumonia (International Classification of Diseases, 9th Revision [ICD‐9] codes 480.x‐486.x, 487.0).[13] Our goal was to identify previously healthy children with uncomplicated pneumonia, so we excluded patients with complex chronic conditions,[14] billing charges for intensive care management and/or pleural drainage procedure (IDC‐9 codes 510.0, 510.9, 511.0, 511.1, 511.8, 511.9, 513.x) on day of admission or the next day, or prior pneumonia admission in the last 30 days. We studied 2 mutually exclusive populations: children with pneumonia treated in the ED (ie, patients who were evaluated in the ED and discharged to home), and children hospitalized with pneumonia, including those admitted through the ED.
Guideline Publication and Study Periods
For an exploratory before and after comparison, patients were grouped into 2 cohorts based on a guideline online publication date of August 1, 2011: preguideline (January 1, 2008 to July 31, 2011) and postguideline (August 1, 2011 to June 30, 2014).
Study Outcomes
The measured outcomes were the monthly proportion of pneumonia patients for whom specific diagnostic tests were performed, as determined from billing data. The diagnostic tests evaluated were complete blood count (CBC), blood culture, C‐reactive protein (CRP), and chest radiograph (CXR). Standardized costs were also calculated from PHIS charges as previously described to standardize the cost of the individual tests and remove interhospital cost variation.[3]
Relationship of Repeat Testing and Severity of Illness
Because higher illness severity and clinical deterioration may warrant repeat testing, we also explored the association of repeat diagnostic testing for inpatients with severity of illness by using the following variables as measures of severity: length of stay (LOS), transfer to intensive care unit (ICU), or pleural drainage procedure after admission (>2 calendar days after admission). Repeat diagnostic testing was stratified by number of tests.
Statistical Analysis
The categorical demographic characteristics of the pre‐ and postguideline populations were summarized using frequencies and percentages, and compared using 2 tests. Continuous demographics were summarized with medians and interquartile ranges (IQRs) and compared with the Wilcoxon rank sum test. Segmented regression, clustered by hospital, was used to assess trends in monthly resource utilization as well as associated standardized costs before and after guidelines publication. To estimate the impact of the guidelines overall, we compared the observed diagnostic resource use at the end of the study period with expected use projected from trends in the preguidelines period (ie, if there were no new guidelines). Individual interrupted time series were also built for each hospital. From these models, we assessed which hospitals had a significant difference between the rate observed at the end of the study and that estimated from their preguideline trajectory. To assess the relationship between the number of positive improvements at a hospital and hospital characteristics, we used Spearman's correlation and Kruskal‐Wallis tests. All analyses were performed with SAS version 9.3 (SAS Institute, Inc., Cary, NC), and P values <0.05 were considered statistically significant. In accordance with the policies of the Cincinnati Children's Hospital Medical Center Institutional Review Board, this research, using a deidentified dataset, was not considered human subjects research.
RESULTS
There were 275,288 hospital admissions meeting study inclusion criteria of 1 to 18 years of age with a diagnosis of pneumonia from 2008 to 2014. Of these, 54,749 met exclusion criteria (1874 had pleural drainage procedure on day 0 or 1, 51,306 had complex chronic conditions, 1569 were hospitalized with pneumonia in the last 30 days). Characteristics of the remaining 220,539 patients in the final sample are shown in Table 1. The median age was 4 years (IQR, 27 years); a majority of the children were male (53%) and had public insurance (58%). There were 128,855 patients in the preguideline period (January 1, 2008 to July 31, 2011) and 91,684 in the post guideline period (August 1, 2011June 30, 2014).
| Overall | Preguideline | Postguideline | P | |
|---|---|---|---|---|
| ||||
| No. of discharges | 220,539 | 128,855 | 91,684 | |
| Type of encounter | ||||
| ED only | 150,215 (68.1) | 88,790 (68.9) | 61,425 (67) | <0.001 |
| Inpatient | 70,324 (31.9) | 40,065 (31.1) | 30,259 (33) | |
| Age | ||||
| 14 years | 129,360 (58.7) | 77,802 (60.4) | 51,558 (56.2) | <0.001 |
| 59 years | 58,609 (26.6) | 32,708 (25.4) | 25,901 (28.3) | |
| 1018 years | 32,570 (14.8) | 18,345 (14.2) | 14,225 (15.5) | |
| Median [IQR] | 4 [27] | 3 [27] | 4 [27] | <0.001 |
| Gender | ||||
| Male | 116,718 (52.9) | 68,319 (53) | 48,399 (52.8) | 00.285 |
| Female | 103,813 (47.1) | 60,532 (47) | 43,281 (47.2) | |
| Race | ||||
| Non‐Hispanic white | 84,423 (38.3) | 47,327 (36.7) | 37,096 (40.5) | <0.001 |
| Non‐Hispanic black | 60,062 (27.2) | 35,870 (27.8) | 24,192 (26.4) | |
| Hispanic | 51,184 (23.2) | 31,167 (24.2) | 20,017 (21.8) | |
| Asian | 6,444 (2.9) | 3,691 (2.9) | 2,753 (3) | |
| Other | 18,426 (8.4) | 10,800 (8.4) | 7,626 (8.3) | |
| Payer | ||||
| Government | 128,047 (58.1) | 70,742 (54.9) | 57,305 (62.5) | <0.001 |
| Private | 73,338 (33.3) | 44,410 (34.5) | 28,928 (31.6) | |
| Other | 19,154 (8.7) | 13,703 (10.6) | 5,451 (5.9) | |
| Disposition | ||||
| HHS | 684 (0.3) | 411 (0.3) | 273 (0.3) | <0.001 |
| Home | 209,710 (95.1) | 123,236 (95.6) | 86,474 (94.3) | |
| Other | 9,749 (4.4) | 4,962 (3.9) | 4,787 (5.2) | |
| SNF | 396 (0.2) | 246 (0.2) | 150 (0.2) | |
| Season | ||||
| Spring | 60,171 (27.3) | 36,709 (28.5) | 23,462 (25.6) | <0.001 |
| Summer | 29,891 (13.6) | 17,748 (13.8) | 12,143 (13.2) | |
| Fall | 52,161 (23.7) | 28,332 (22) | 23,829 (26) | |
| Winter | 78,316 (35.5) | 46,066 (35.8) | 32,250 (35.2) | |
| LOS | ||||
| 13 days | 204,812 (92.9) | 119,497 (92.7) | 85,315 (93.1) | <0.001 |
| 46 days | 10,454 (4.7) | 6,148 (4.8) | 4,306 (4.7) | |
| 7+ days | 5,273 (2.4) | 3,210 (2.5) | 2,063 (2.3) | |
| Median [IQR] | 1 [11] | 1 [11] | 1 [11] | 0.144 |
| Admitted patients, median [IQR] | 2 [13] | 2 [13] | 2 [13] | <0.001 |
Discharged From the ED
Throughout the study, utilization of CBC, blood cultures, and CRP was <20%, whereas CXR use was >75%. In segmented regression analysis, CRP utilization was relatively stable before the guidelines publication. However, by the end of the study period, the projected estimate of CRP utilization without guidelines (expected) was 2.9% compared with 4.8% with the guidelines (observed) (P < 0.05) (Figure 1). A similar pattern of higher rates of diagnostic utilization after the guidelines compared with projected estimates without the guidelines was also seen in the ED utilization of CBC, blood cultures, and CXR (Figure 1); however, these trends did not achieve statistical significance. Table 2 provides specific values. Using a standard cost of $19.52 for CRP testing, annual costs across all hospitals increased $11,783 for ED evaluation of CAP.
Baseline (%) | Preguideline Trend | Level Change at Guideline | Change in Trend After Guideline | Estimates at End of Study* | |||
|---|---|---|---|---|---|---|---|
Without Guideline (%) | With Guideline (%) | P | |||||
| |||||||
| ED‐only encounters | |||||||
| Blood culture | 14.6 | 0.1 | 0.8 | 0.1 | 5.5 | 8.6 | NS |
| CBC | 19.2 | 0.1 | 0.4 | 0.1 | 10.7 | 14.0 | NS |
| CRP | 5.4 | 0.0 | 0.6 | 0.1 | 2.9 | 4.8 | <0.05 |
| Chest x‐ray | 85.4 | 0.1 | 0.1 | 0.0 | 80.9 | 81.1 | NS |
| Inpatient encounters | |||||||
| Blood culture | 50.6 | 0.0 | 1.7 | 0.2 | 49.2 | 41.4 | <0.05 |
| Repeat blood culture | 6.5 | 0.0 | 1.0 | 0.1 | 8.9 | 5.8 | NS |
| CBC | 65.2 | 0.0 | 3.1 | 0.0 | 65.0 | 62.2 | NS |
| Repeat CBC | 23.4 | 0.0 | 4.2 | 0.0 | 20.8 | 16.0 | NS |
| CRP | 25.7 | 0.0 | 1.1 | 0.0 | 23.8 | 23.5 | NS |
| Repeat CRP | 12.5 | 0.1 | 2.2 | 0.1 | 7.1 | 7.3 | NS |
| Chest x‐ray | 89.4 | 0.1 | 0.7 | 0.0 | 85.4 | 83.9 | NS |
| Repeat chest x‐ray | 25.5 | 0.0 | 2.0 | 0.1 | 24.1 | 17.7 | <0.05 |
Inpatient Encounters
In the segmented regression analysis of children hospitalized with CAP, guideline publication was associated with changes in the monthly use of some diagnostic tests. For example, by the end of the study period, the use of blood culture was 41.4% (observed), whereas the projected estimated use in the absence of the guidelines was 49.2% (expected) (P < 0.05) (Figure 2). Table 2 includes the data for the other tests, CBC, CRP, and CXR, in which similar patterns are noted with lower utilization rates after the guidelines, compared with expected utilization rates without the guidelines; however, these trends did not achieve statistical significance. Evaluating the utilization of repeat testing for inpatients, only repeat CXR achieved statistical significance (P < 0.05), with utilization rates of 17.7% with the guidelines (actual) compared with 24.1% without the guidelines (predicted).
To better understand the use of repeat testing, a comparison of severity outcomesLOS, ICU transfer, and pleural drainage procedureswas performed between patients with no repeat testing (70%) and patients with 1 or more repeat tests (30%). Patients with repeat testing had longer LOS (no repeat testing LOS 1 [IQR, 12]) versus 1 repeat test LOS 3 ([IQR, 24] vs 2+ repeat tests LOS 5 [IQR, 38]), higher rate of ICU transfer (no repeat testing 4.6% vs 1 repeat test 14.6% vs 2+ repeat test 35.6%), and higher rate of pleural drainage (no repeat testing 0% vs 1 repeat test 0.1% vs 2+ repeat test 5.9%] (all P < 0.001).
Using standard costs of $37.57 for blood cultures and $73.28 for CXR, annual costs for children with CAP across all hospitals decreased by $91,512 due to decreased utilization of blood cultures, and by $146,840 due to decreased utilization of CXR.
Hospital‐Level Variation in the Impact of the National Guideline
Figure 3 is a visual representation (heat map) of the impact of the guidelines at the hospital level at the end of the study from the individual interrupted time series. Based on this heat map (Figure 3), there was wide variability between hospitals in the impact of the guideline on each test in different settings (ED or inpatient). By diagnostic testing, 7 hospitals significantly decreased utilization of blood cultures for inpatients, and 5 hospitals significantly decreased utilization for repeat blood cultures and repeat CXR. Correlation between the number of positive improvements at a hospital and region (P = 0.974), number of CAP cases (P = 0.731), or percentage of public insurance (P = 0.241) were all nonsignificant.
DISCUSSION
This study complements previous assessments by evaluating the impact of the 2011 IDSA/PIDS consensus guidelines on the management of children with CAP cared for at US children's hospitals. Prior studies have shown increased use of narrow‐spectrum antibiotics for children with CAP after the publication of these guidelines.[7] The current study focused on diagnostic testing for CAP before and after the publication of the 2011 guidelines. In the ED setting, use of some diagnostic tests (blood culture, CBC, CXR, CRP) was declining prior to guideline publication, but appeared to plateau and/or increase after 2011. Among children admitted with CAP, use of diagnostic testing was relatively stable prior to 2011, and use of these tests (blood culture, CBC, CXR, CRP) declined after guideline publication. Overall, changes in diagnostic resource utilization 3 years after publication were modest, with few changes achieving statistical significance. There was a large variability in the impact of guidelines on test use between hospitals.
For outpatients, including those managed in the ED, the PIDS/IDSA guidelines recommend limited laboratory testing in nontoxic, fully immunized patients. The guidelines discourage the use of diagnostic testing among outpatients because of their low yield (eg, blood culture), and because test results may not impact management (eg, CBC).[6] In the years prior to guideline publication, there was already a declining trend in testing rates, including blood cultures, CBC, and CRP, for patients in the ED. After guideline publication, the rate of blood cultures, CBC, and CRP increased, but only the increase in CRP utilization achieved statistical significance. We would not expect utilization for common diagnostic tests (eg, CBC for outpatients with CAP) to be at or close to 0% because of the complexity of clinical decision making regarding admission that factors in aspects of patient history, exam findings, and underlying risk.[15] ED utilization of blood cultures was <10%, CBC <15%, and CRP <5% after guideline publication, which may represent the lowest testing limit that could be achieved.
CXRs obtained in the ED did not decrease over the entire study period. The rates of CXR use (close to 80%) seen in our study are similar to prior ED studies.[5, 16] Management of children with CAP in the ED might be different than outpatient primary care management because (1) unlike primary care providers, ED providers do not have an established relationship with their patients and do not have the opportunity for follow‐up and serial exams, making them less likely to tolerate diagnostic uncertainty; and (2) ED providers may see sicker patients. However, use of CXR in the ED does represent an opportunity for further study to understand if decreased utilization is feasible without adversely impacting clinical outcomes.
The CAP guidelines provide a strong recommendation to obtain blood culture in moderate to severe pneumonia. Despite this, blood culture utilization declined after guideline publication. Less than 10% of children hospitalized with uncomplicated CAP have positive blood cultures, which calls into question the utility of blood cultures for all admitted patients.[17, 18, 19] The recent EPIC (Epidemiology of Pneumonia in the Community) study showed that a majority of children hospitalized with pneumonia do not have growth of bacteria in culture, but there may be a role for blood cultures in patients with a strong suspicion of complicated CAP or in the patient with moderate to severe disease.[20] In addition to blood cultures, the guidelines also recommend CBC and CXR in moderate to severely ill children. This observed decline in testing in CBC and CXR may be related to individual physician assessments of which patients are moderately to severely ill, as the guidelines do not recommend testing for children with less severe disease. Our exclusion of patients requiring intensive care management or pleural drainage on admission might have selected children with a milder course of illness, although still requiring admission.
The guidelines discourage repeat diagnostic testing among children hospitalized with CAP who are improving. In this study, repeat CXR and CBC occurred in approximately 20% of patients, but repeat blood culture and CRP was much lower. As with initial diagnostic testing for inpatients with CAP, the rates of some repeat testing decreased with the guidelines. However, those with repeat testing had longer LOS and were more likely to require ICU transfer or a pleural drainage procedure compared to children without repeat testing. This suggests that repeat testing is used more often in children with a severe presentation or a worsening clinical course, and not done routinely on hospitalized patients.
The financial impact of decreased testing is modest, because the tests themselves are relatively inexpensive. However, the lack of substantial cost savings should not preclude efforts to continue to improve adherence to the guidelines. Not only is increased testing associated with higher hospitalization rates,[5] potentially yielding higher costs and family stress, increased testing may also lead to patient discomfort and possibly increased radiation exposure through chest radiography.
Many of the diagnostic testing recommendations in the CAP guidelines are based on weak evidence, which may contribute to the lack of substantial adoption. Nevertheless, adherence to guideline recommendations requires sustained effort on the part of individual physicians that should be encouraged through institutional support.[21] Continuous education and clinical decision support, as well as reminders in the electronic medical record, would make guideline recommendations more visible and may help overcome the inertia of previous practice.[15] The hospital‐level heat map (Figure 3) included in this study demonstrates that the impact of the guidelines was variable across sites. Although a few sites had decreased diagnostic testing in many areas with no increased testing in any category, there were several sites that had no improvement in any diagnostic testing category. In addition, hospital‐level factors like size, geography, and insurance status were not associated with number of improvements. To better understand drivers of change at individual hospitals, future studies should evaluate specific strategies utilized by the rapid guideline adopters.
This study is subject to several limitations. The use of ICD‐9 codes to identify patients with CAP may not capture all patients with this diagnosis; however, these codes have been previously validated.[13] Additionally, because patients were identified using ICD‐9 coding assigned at the time of discharge, testing performed in the ED setting may not reflect care for a child with known pneumonia, but rather may reflect testing for a child with fever or other signs of infection. PHIS collects data from freestanding children's hospitals, which care for a majority of children with CAP in the US, but our findings may not be generalizable to other hospitals. In addition, we did not examine drivers of trends within individual institutions. We did not have detailed information to examine whether the PHIS hospitals in our study had actively worked to adopt the CAP guidelines. We were also unable to assess physician's familiarity with guidelines or the level of disagreement with the recommendations. Furthermore, the PHIS database does not permit detailed correlation of diagnostic testing with clinical parameters. In contrast to the diagnostic testing evaluated in this study, which is primarily discouraged by the IDSA/PIDS guidelines, respiratory viral testing for children with CAP is recommended but could not be evaluated, as data on such testing are not readily available in PHIS.
CONCLUSION
Publication of the IDSA/PIDS evidence‐based guidelines for the management of CAP was associated with modest, variable changes in use of diagnostic testing. Further adoption of the CAP guidelines should reduce variation in care and decrease unnecessary resource utilization in the management of CAP. Our study demonstrates that efforts to promote decreased resource utilization should target specific situations (eg, repeat testing for inpatients who are improving). Adherence to guidelines may be improved by the adoption of local practices that integrate and improve daily workflow, like order sets and clinical decision support tools.
Disclosure: Nothing to report.
- , . Eliminating waste in US health care. JAMA. 2012;307(14):1513–1516.
- , , , et al. Choosing wisely in pediatric hospital medicine: five opportunities for improved healthcare value. J Hosp Med. 2013;8(9):479–485.
- , , , et al.; Pediatric Research in Inpatient Settings (PRIS) Network. Prioritization of comparative effectiveness research topics in hospital pediatrics. Arch Pediatr Adolesc Med. 2012;166(12):1155–1164.
- , , , et al. Variability in processes of care and outcomes among children hospitalized with community‐acquired pneumonia. Pediatr Infect Dis J. 2012;31(10):1036–1041.
- , , , , . Variation in emergency department diagnostic testing and disposition outcomes in pneumonia. Pediatrics. 2013;132(2):237–244.
- , , , et al.; Pediatric Infectious Diseases Society and the Infectious Diseases Society of America. The management of community‐acquired pneumonia in infants and children older than 3 months of age: clinical practice guidelines by the Pediatric Infectious Diseases Society and the Infectious Diseases Society of America. Clin Infect Dis. 2011;53(7):e25–e76.
- , , , et al., Impact of Infectious Diseases Society of America/Pediatric Infectious Diseases Society guidelines on treatment of community‐acquired pneumonia in hospitalized children. Clin Infect Dis. 2014;58(6):834–838.
- , , , et al. Antibiotic choice for children hospitalized with pneumonia and adherence to national guidelines. Pediatrics. 2015;136(1):44–52.
- , , , et al. Quality improvement methods increase appropriate antibiotic prescribing for childhood pneumonia. Pediatrics. 2013;131(5):e1623–e1631.
- , , , et al. Improvement methodology increases guideline recommended blood cultures in children with pneumonia. Pediatrics. 2015;135(4):e1052–e1059.
- , , , , , . Impact of a guideline on management of children hospitalized with community‐acquired pneumonia. Pediatrics. 2012;129(3):e597–e604.
- , , , . Effectiveness of antimicrobial guidelines for community‐acquired pneumonia in children. Pediatrics. 2012;129(5):e1326–e1333.
- , , , et al. Identifying pediatric community‐acquired pneumonia hospitalizations: accuracy of administrative billing codes. JAMA Pediatr. 2013;167(9):851–858.
- , , , , . Pediatric complex chronic conditions classification system version 2: updated for ICD‐10 and complex medical technology dependence and transplantation. BMC Pediatr. 2014;14:199.
- , . Establishing superior benchmarks of care in clinical practice: a proposal to drive achievable health care value. JAMA Pediatr. 2015;169(4):301–302.
- , , , . Emergency department management of childhood pneumonia in the United States prior to publication of national guidelines. Acad Emerg Med. 2013;20(3):240–246.
- , , , et al. Prevalence of bacteremia in hospitalized pediatric patients with community‐acquired pneumonia. Pediatr Infect Dis J. 2013;32(7):736–740.
- , , , , . The prevalence of bacteremia in pediatric patients with community‐acquired pneumonia: guidelines to reduce the frequency of obtaining blood cultures. Hosp Pediatr. 2013;3(2):92–96.
- . Do all children hospitalized with community‐acquired pneumonia require blood cultures? Hosp Pediatr. 2013;3(2):177–179.
- , , , et al.; CDC EPIC Study Team. Community‐acquired pneumonia requiring hospitalization among U.S. children. N Engl J Med. 2015;372(9):835–845.
- , , , et al. Influence of hospital guidelines on management of children hospitalized with pneumonia. Pediatrics. 2012;130(5):e823–e830.
© 2015 Society of Hospital Medicine

Febrile Infant Diagnosis Code Accuracy
Fever is one of the most common reasons for emergency department (ED) evaluation of infants under 90 days of age.[1] Up to 10% to 20% of febrile young infants will have a serious bacterial infection (SBI),[2, 3, 4] but infants with SBI are difficult to distinguish from those without SBI based upon symptoms and physical examination findings alone.[5] Previously developed clinical prediction algorithms can help to identify febrile infants at low risk for SBI, but differ in age range as well as recommendations for testing and empiric treatment.[6, 7, 8] Consequently, there is widespread variation in management of febrile young infants at US children's hospitals,[9, 10, 11] and defining optimal management strategies remains an important issue in pediatric healthcare.[12] Administrative datasets are convenient and inexpensive, and can be used to evaluate practice variation, trends, and outcomes of a large, diverse group of patients within and across institutions.[9, 10] Accurately identifying febrile infants evaluated for suspected SBI in administrative databases would facilitate comparative effectiveness research, quality improvement initiatives, and institutional benchmarking.
Prior studies have validated the accuracy of administrative billing codes for identification of other common childhood illnesses, including urinary tract infection (UTI)[13] and pneumonia.[14] The accuracy of International Classification of Diseases, Ninth Revision (ICD‐9) diagnosis codes in identifying febrile young infants evaluated for SBI is not known. Reliance on administrative ICD‐9 diagnosis codes for patient identification can lead to misclassification of patients due to variable database quality, the validity of the diagnosis codes being utilized, and hospital coding practices.[15] Additionally, fever is a symptom and not a specific diagnosis. If a particular bacterial or viral diagnosis is established (eg, enterovirus meningitis), a discharge diagnosis of fever may not be attributed to the patient encounter. Thus, evaluating the performance characteristics and capture of clinical outcomes of different combinations of ICD‐9 diagnosis codes for identifying febrile infants is necessary for both the conduct and interpretation of studies that utilize administrative databases. The primary objective of this investigation was to identify the most accurate ICD‐9 coding strategies for the identification of febrile infants aged <90 days using administrative data. We also sought to evaluate capture of clinically important outcomes across identification strategies.
METHODS
Study Design and Setting
For this multicenter retrospective study, we used the Pediatric Health Information System (PHIS) database to identify infants <90 days of age[16] who presented between July 1, 2012 and June 30, 2013 to 1 of 8 EDs. We assessed performance characteristics of ICD‐9 diagnosis code case‐identification algorithms by comparing ICD‐9 code combinations to a fever reference standard determined by medical record review. The institutional review board at each participating site approved the study protocol.
Data Source
Data were obtained from 2 sources: the PHIS database and medical record review. We used the PHIS database to identify eligible patients by ICD‐9 diagnosis codes; patient encounters were randomly selected using a random number generator. The PHIS database contains demographic, diagnosis, and billing data from 44 hospitals affiliated with the Children's Hospital Association (Overland Park, Kansas) and represents 85% of freestanding children's hospitals in the United States.[17] Data are deidentified; encrypted unique patient identifiers permit tracking of patients across visits within a site.[18] The Children's Hospital Association and participating hospitals jointly assure the quality and integrity of the data.[19]
For each patient encounter identified in the PHIS database, detailed medical record review was performed by trained investigators at each of the 8 study sites (see Supporting Information, Appendix, in the online version of this article). A standardized data collection instrument was pilot tested by all investigators prior to use. Data were collected and managed using the Research Electronic Data Capture (REDCap) tool hosted at Boston Children's Hospital.[20]
Exclusions
Using PHIS data, prior to medical record review we excluded infants with a complex chronic condition as defined previously[21] and those transferred from another institution, as these infants may warrant a nonstandard evaluation and/or may have incomplete data.
ICD‐9 Diagnosis Code Groups
In the PHIS database, all patients discharged from the hospital (including hospitalized patients as well as patients discharged from the ED) receive 1 or more ICD‐9 discharge diagnosis codes. These diagnosis codes are ascribed after discharge from the hospital, or for ED patients, after ED discharge. Additionally, patients may receive an admission diagnosis, which reflects the diagnosis ascribed at the time of ED discharge or transfer to the inpatient unit.
We reviewed medical records of infants selected from the following ICD‐9 diagnosis code groups (Figure 1): (1) discharge diagnosis code of fever (780.6 [fever and other physiologic disturbances of temperature regulation], 778.4 [other disturbances of temperature regulation of newborn], 780.60 [fever, unspecified], or 780.61 [fever presenting with conditions classified elsewhere])[9, 10] regardless of the presence of admission diagnosis of fever or diagnosis of serious infection, (2) admission diagnosis code of fever without associated discharge diagnosis code of fever,[10] (3) discharge diagnosis code of serious infection determined a priori (see Supporting Information, Appendix, in the online version of this article) without discharge or admission diagnosis code of fever, and (4) infants without any diagnosis code of fever or serious infection.

Medical records reviewed in each of the 4 ICD‐9 diagnosis code groups were randomly selected from the overall set of ED encounters in the population of infants <90 days of age evaluated during the study period. Twenty‐five percent population sampling was used for 3 of the ICD‐9 diagnosis code groups, whereas 5% sampling was used for the no fever/no serious infection code group. The number of medical records reviewed in each ICD‐9 diagnosis code group was proportional to the distribution of ICD‐9 codes across the entire population of infants <90 days of age. These records were distributed equally across sites (228 records per site), except for 1 site that does not assign admission diagnoses (201 records).
Investigators were blinded to ICD‐9 diagnosis code groups during medical record review. Infants with multiple visits during the study period were eligible to be included more than once if the visits occurred more than 3 days apart. For infants with more than 1 ED visit on a particular calendar day, investigators were instructed to review the initial visit.
For each encounter, we also abstracted demographic characteristics (gender, race/ethnicity), insurance status, hospital region (using US Census categories[22]), and season from the PHIS database.
Reference Standard
The presence of fever was determined by medical record review. We defined fever as any documented temperature 100.4F (38.0C) at home or in the ED.[16]
ICD‐9 Code Case‐Identification Algorithms
Using the aforementioned ICD‐9 diagnosis code groups individually and in combination, the following 4 case‐identification algorithms, determined from prior study or group consensus, were compared to the reference standard: (1) ICD‐9 discharge diagnosis code of fever,[9] (2) ICD‐9 admission or discharge diagnosis code of fever,[10, 11] (3) ICD‐9 discharge diagnosis code of fever or serious infection, and (4) ICD‐9 discharge or admission diagnosis code of fever or serious infection. Algorithms were compared overall, separately for discharged and hospitalized infants, and across 3 distinct age groups (28 days, 2956 days, and 5789 days).
Patient‐Level Outcomes
To compare differences in outcomes by case‐identification algorithm, from the PHIS database we abstracted hospitalization rates, rates of UTI/pyelonephritis,[13] bacteremia/sepsis, and bacterial meningitis.[19] Severe outcomes were defined as intensive care unit admission, mechanical ventilation, central line placement, receipt of extracorporeal membrane oxygenation, or death. We assessed hospital length of stay for admitted infants and 3‐day revisits,[23, 24] and revisits resulting in hospitalization for infants discharged from the ED at the index visit. Patients billed for observation care were classified as being hospitalized.[25, 26]
Data Analysis
Accuracy of the 4 case‐identification algorithms (compared with the reference standard) was calculated using sensitivity, specificity, negative predictive value (NPV), and positive predictive value (PPV), along with 95% confidence interval (CI). Prior to analysis, a 5‐fold weighting factor was applied to the no fever/no serious infection group to account for the differential sampling used for this group (5% vs 25% for the other 3 ICD‐9 diagnosis code groups). This weighting was done to approximate the true prevalence of each ICD‐9 code group within the larger population, so that an accurate rate of false negatives (infants with fever who had neither a diagnosis of fever nor serious infection) could be calculated.
We described continuous variables using median and interquartile range or range values and categorical variables using frequencies with 95% CIs. We compared categorical variables using a 2 test. We determined statistical significance as a 2‐tailed P value <0.05. Statistical analyses were performed using SAS version 9.3 (SAS Institute, Cary, NC).
RESULTS
Study Patients
During the 1‐year study period, 23,753 ED encounters for infants <90 days of age were identified in the PHIS database at the 8 participating sites. Of these infant encounters, 2166 (9.2%) were excluded (1658 infants who had a complex chronic condition and 508 transferred into the ED), leaving 21,587 infants available for selection. After applying our sampling strategy, we identified 1797 encounters for medical record review. Seven encounters from 3 hospitals with missing medical records were excluded, resulting in a final cohort of 1790 encounters (Figure 1). Among included infants, 552 (30.8%) were 28 days, 743 (41.5%) were 29 to 56 days, and 495 (27.8%) were 57 to 89 days of age; 737 (41.2%) infants were hospitalized. Patients differed in age, race, payer, and season across ICD‐9 diagnosis code groups (see Supporting Information, Table 1, in the online version of this article).
| ICD‐9 Diagnosis Code Algorithm | Overall | |||
|---|---|---|---|---|
| Sensitivity, % (95% CI) | Specificity, % (95% CI) | Negative Predictive Value, % (95% CI) | Positive Predictive Value, % (95% CI) | |
| ||||
| Discharge diagnosis of fever | 53.2 (50.056.4) | 98.2 (97.898.6) | 90.8 (90.091.6) | 86.1 (83.388.9) |
| Hospitalized | 47.3 (43.151.5) | 97.7 (96.998.5) | 80.6 (78.682.6) | 90.2 (86.893.6) |
| Discharged from ED | 61.4 (56.666.2) | 98.4 (98.098.8) | 95.4 (94.796.1) | 82.1 (77.786.5) |
| Discharge or admission diagnosis of Fever | 71.1 (68.274.0) | 97.7 (97.398.1) | 94.1 (93.494.8) | 86.9 (84.589.3) |
| Hospitalized | 72.5 (68.876.2) | 97.1 (96.298.0) | 88.8 (87.190.5) | 91.7 (89.194.3) |
| Discharged from ED | 69.2 (64.773.7) | 98.0 (97.598.5) | 96.3 (95.796.9) | 80.8 (76.685.0) |
| Discharge diagnosis of fever or serious infection | 63.7 (60.666.8) | 96.5 (96.097.0) | 92.6 (91.893.4) | 79.6 (76.782.5) |
| Hospitalized | 63.9 (59.967.9) | 92.5 (91.094.0) | 85.1 (83.287.0) | 79.1 (75.382.9) |
| Discharged from ED | 63.4 (58.768.1) | 98.1 (97.698.6) | 95.6 (94.996.3) | 80.2 (75.884.6) |
| Discharge or admission diagnosis of fever or serious infection | 76.6 (73.979.3) | 96.2 (95.696.8) | 95.1 (94.595.7) | 81.0 (78.483.6) |
| Hospitalized | 80.8 (77.584.1) | 92.1 (90.693.6) | 91.5 (89.993.1) | 82.1 (78.985.3) |
| Discharged from ED | 71.0 (66.575.5) | 97.7 (97.298.2) | 96.5 (95.997.1) | 79.4 (75.283.6) |
Among the 1790 patient encounters reviewed, a total of 766 infants (42.8%) met the reference standard definition for fever in the cohort. An additional 47 infants had abnormal temperature reported (documentation of tactile fever, history of fever without a specific temperature described, or hypothermia) but were classified as having no fever by the reference standard.
ICD‐9 Code Case‐Identification Algorithm Performance
Compared with the reference standard, the 4 case‐identification algorithms demonstrated specificity of 96.2% to 98.2% but lower sensitivity overall (Figure 2). Discharge diagnosis of fever alone demonstrated the lowest sensitivity. The algorithm of discharge or admission diagnosis of fever resulted in increased sensitivity and the highest PPV of all 4 algorithms (86.9%, 95% CI: 84.5‐89.3). Addition of serious infection codes to this algorithm resulted in a marginal increase in sensitivity and a similar decrease in PPV (Table 1). When limited to hospitalized infants, specificity was highest for the case‐identification algorithm of discharge diagnosis of fever and similarly high for discharge or admission diagnosis of fever; sensitivity was highest for the algorithm of discharge or admission diagnosis of fever or diagnosis of serious infection. For infants discharged from the ED, algorithm specificity was 97.7% to 98.4%, with lower sensitivity for all 4 algorithms (Table 1). Inclusion of the 47 infants with abnormal temperature as fever did not materially change algorithm performance (data not shown).
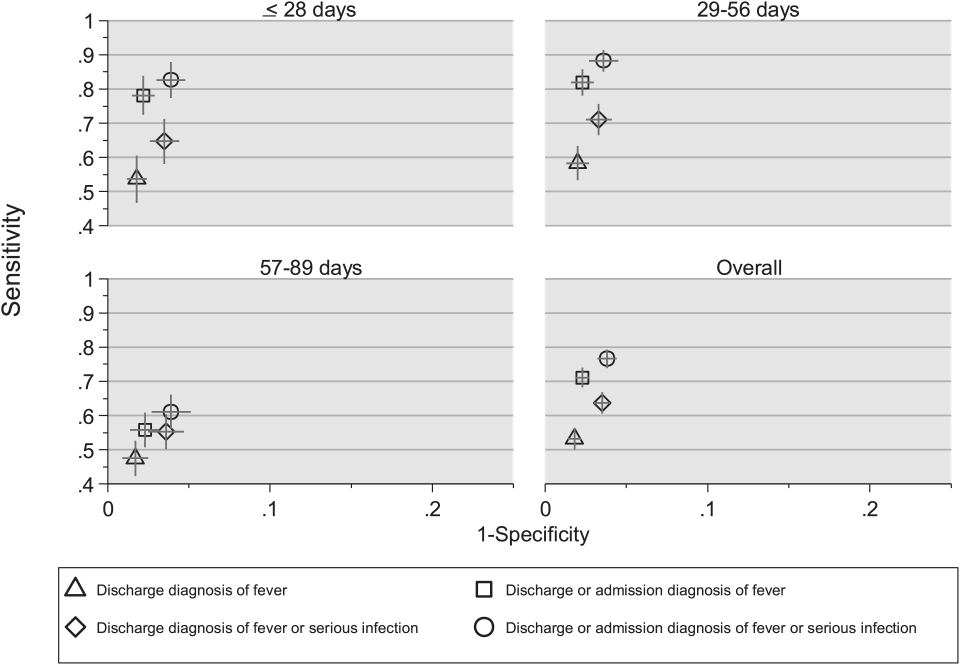
Across all 3 age groups (28 days, 2956 days, and 5789 days), the 4 case‐identification algorithms demonstrated specificity >96%, whereas algorithm sensitivity was highest in the 29‐ to 56‐days‐old age group and lowest among infants 57 to 89 days old across all 4 algorithms (Figure 2). Similar to the overall cohort, an algorithm of discharge or admission diagnosis of fever demonstrated specificity of nearly 98% in all age groups; addition of serious infection codes to this algorithm increased sensitivity, highest in the 29‐ to 56‐days‐old age group (Figure 2; see also Supporting Information, Table 2, in the online version of this article).
| ICD‐9 Diagnosis Code Algorithm | Sensitivity, Median % (Range) | Specificity, Median % (Range) | Negative Predictive Value, Median % (Range) | Positive Predictive Value, Median % (Range) |
|---|---|---|---|---|
| ||||
| Discharge diagnosis of fever | 56.2 (34.681.0) | 98.3 (96.499.1) | 92.1 (83.297.4) | 87.7 (74.093.2) |
| Discharge or Admission diagnosis of Fever | 76.7 (51.385.0) | 97.8 (96.298.7) | 95.6 (86.997.4) | 87.4 (80.092.9) |
| Discharge diagnosis of fever or serious infection | 68.3 (44.287.3) | 96.5 (95.498.0) | 93.6 (85.298.2) | 78.3 (74.289.0) |
| Discharge or admission diagnosis of fever or serious infection | 83.1 (58.390.7) | 95.8 (95.498.0) | 96.5 (88.598.2) | 79.1 (77.490.4) |
Across the 8 study sites, median specificity was 95.8% to 98.3% for the 4 algorithms, with little interhospital variability; however, algorithm sensitivity varied widely by site. Median PPV was highest for discharge diagnosis of fever alone at 87.7% but ranged from 74.0% to 93.2% across sites. Median PPV for an algorithm of discharge or admission diagnosis of fever was similar (87.4%) but with less variation by site (range 80.0%92.9%) (Table 2).
Outcomes by ICD‐9 Diagnosis Code Group and Case‐Identification Algorithm
When compared with discharge diagnosis of fever, adding admission diagnosis of fever captured a higher proportion of hospitalized infants with SBIs (UTI/pyelonephritis, bacteremia/sepsis, or bacterial meningitis). However, median hospital length of stay, severe outcomes, and 3‐day revisits and revisits with hospitalization did not materially differ when including infants with admission diagnosis of fever in addition to discharge diagnosis of fever. Addition of infants with a diagnosis code for serious infection substantially increased the number of infants with SBIs and severe outcomes but did not capture additional 3‐day revisits (Table 3). There were no additional cases of SBI in the no fever/no serious illness diagnosis code group.
| ICD‐9 Diagnosis Code Algorithm | Outcome | 3‐Day Revisit, % (95% CI) | 3‐Day Revisit With Hospitalization, % (95% CI) | |||
|---|---|---|---|---|---|---|
| Hospitalized, % (95% CI) | UTI/Pyelonephritis, Bacteremia/Sepsis, or Bacterial Meningitis, % (95% CI) | Severe Outcome, % (95% CI)* | Length of Stay in Days, Median (IQR) | |||
| ||||||
| Discharge diagnosis of fever | 44.3 (40.348.4) | 3.3 (1.84.7) | 1.4 (0.42.3) | 3 (23) | 11.7 (8.215.2) | 5.9 (3.38.4) |
| Discharge or admission diagnosis of fever | 52.4 (48.955.9) | 6.1 (4.47.8) | 1.9 (1.02.9) | 3 (23) | 10.9 (7.714.1) | 5.4 (3.17.8) |
| Discharge diagnosis of fever or serious infection | 54.0 (50.457.5) | 15.3 (12.717.8) | 3.8 (2.55.2) | 3 (24) | 11.0 (7.714.2) | 5.5 (3.17.9) |
| Discharge or admission diagnosis of fever or serious infection | 56.5 (53.259.7) | 12.9 (10.715.1) | 3.6 (2.44.8) | 3 (24) | 10.3 (7.313.3) | 5.2 (3.07.4) |
Among infants who met the reference standard for fever but did not have a discharge or admission diagnosis of fever (false negatives), 11.8% had a diagnosis of SBI. Overall, 43.2% of febrile infants (and 84.4% of hospitalized infants) with SBI did not have an ICD‐9 discharge or admission diagnosis of fever. Addition of ICD‐9 diagnosis codes of serious infection to the algorithm of discharge or admission diagnosis of fever captured all additional SBIs, and no false negativeinfants missed with this algorithm had an SBI.
DISCUSSION
We described the performance of 4 ICD‐9 diagnosis code case‐identification algorithms for the identification of febrile young infants <90 days of age at US children's hospitals. Although the specificity was high across algorithms and institutions, the sensitivity was relatively low, particularly for discharge diagnosis of fever, and varied by institution. Given the high specificity, ICD‐9 diagnosis code case‐identification algorithms for fever reliably identify febrile infants using administrative data with low rates of inclusion of infants without fever. However, underidentification of patients, particularly those more prone to SBIs and severe outcomes depending on the algorithm utilized, can impact interpretation of comparative effectiveness studies or the quality of care delivered by an institution.
ICD‐9 discharge diagnosis codes are frequently used to identify pediatric patients across a variety of administrative databases, diseases, and symptoms.[19, 27, 28, 29, 30, 31] Although discharge diagnosis of fever is highly specific, sensitivity is substantially lower than other case‐identification algorithms we studied, particularly for hospitalized infants. This may be due to a fever code sometimes being omitted in favor of a more specific diagnosis (eg, bacteremia) prior to hospital discharge. Therefore, case identification relying only on ICD‐9 discharge diagnosis codes for fever may under‐report clinically important SBI or severe outcomes as demonstrated in our study. This is in contrast to ICD‐9 diagnosis code identification strategies for childhood UTI and pneumonia, which largely have higher sensitivity but lower specificity than fever codes.[13, 14]
Admission diagnosis of fever is important for febrile infants as they may not have an explicit diagnosis at the time of disposition from the ED. Addition of admission diagnosis of fever to an algorithm relying on discharge diagnosis code alone increased sensitivity without a demonstrable reduction in specificity and PPV, likely due to capture of infants with a fever diagnosis at presentation before a specific infection was identified. Although using an algorithm of discharge or admission diagnosis of fever captured a higher percentage of hospitalized febrile infants with SBIs, sensitivity was only 71% overall with this algorithm, and 43% of febrile infants with SBI would still have been missed. Importantly, though, addition of various ICD‐9 codes for serious infection to this algorithm resulted in capture of all febrile infants with SBI and should be used as a sensitivity analysis.
The test characteristics of diagnosis codes were highest in the 29‐ to 56‐days‐old age group. Given the differing low‐risk criteria[6, 7, 8] and lack of best practice guidelines[16] in this age group, the use of administrative data may allow for the comparison of testing and treatment strategies across a large cohort of febrile infants aged 29 to 56 days. However, individual hospital coding practices may affect algorithm performance, in particular sensitivity, which varied substantially by hospital. This variation in algorithm sensitivity may impact comparisons of outcomes across institutions. Therefore, when conducting studies of febrile infants using administrative data, sensitivity analyses or use of chart review should be considered to augment the use of ICD‐9 code‐based identification strategies, particularly for comparative benchmarking and outcomes studies. These additional analyses are particularly important for studies of febrile infants >56 days of age, in whom the sensitivity of diagnosis codes is particularly low. We speculate that the lower sensitivity in older febrile infants may relate to a lack of consensus on the clinical significance of fever in this age group and the varying management strategies employed.[10]
Strengths of this study include the assessment of ICD‐9 code algorithms across multiple institutions for identification of fever in young infants, and the patterns of our findings remained robust when comparing median performance characteristics of the algorithms across hospitals to our overall findings. We were also able to accurately estimate PPV and NPV using a case‐identification strategy weighted to the actual population sizes. Although sensitivity and specificity are the primary measures of test performance, predictive values are highly informative for investigators using administrative data. Additionally, our findings may inform public health efforts including disease surveillance, assessment of seasonal variation, and identification and monitoring of healthcare‐associated infections among febrile infants.
Our study has limitations. We did not review all identified records, which raises the possibility that our evaluated cohort may not be representative of the entire febrile infant population. We attempted to mitigate this possibility by using a random sampling strategy for our population selection that was weighted to the actual population sizes. Second, we identified serious infections using ICD‐9 diagnosis codes determined by group consensus, which may not capture all serious infection codes that identify febrile infants whose fever code was omitted. Third, 47 infants had abnormal temperature that did not meet our reference standard criteria for fever and were included in the no fever group. Although there may be disagreement regarding what constitutes a fever, we used a widely accepted reference standard to define fever.[16] Further, inclusion of these 47 infants as fever did not materially change algorithm performance. Last, our study was conducted at 8 large tertiary‐care children's hospitals, and our results may not be generalizable to other children's hospitals and community‐based hospitals.
CONCLUSIONS
Studies of febrile young infants that rely on ICD‐9 discharge diagnosis code of fever for case ascertainment have high specificity but low sensitivity for the identification of febrile infants, particularly among hospitalized patients. A case‐identification strategy that includes discharge or admission diagnosis of fever demonstrated higher sensitivity, and should be considered for studies of febrile infants using administrative data. However, additional strategies such as incorporation of ICD‐9 codes for serious infection should be used when comparing outcomes across institutions.
Acknowledgements
The Febrile Young Infant Research Collaborative includes the following additional collaborators who are acknowledged for their work on this study: Erica DiLeo, MA, Department of Medical Education and Research, Danbury Hospital, Danbury, Connecticut; Janet Flores, BS, Division of Emergency Medicine, Ann and Robert H. Lurie Children's Hospital of Chicago, Chicago, Illinois.
Disclosures: This project funded in part by The Gerber Foundation Novice Researcher Award, (Ref No. 1827‐3835). Dr. Fran Balamuth received career development support from the National Institutes of Health (NHLBI K12‐HL109009). Funders were not involved in the design or conduct of the study; collection, management, analysis, or interpretation of the data; or preparation, review, or approval of the manuscript. The authors have no conflicts of interest relevant to this article to disclose.
- . The prevalence of serious bacterial infections by age in febrile infants during the first 3 months of life. Pediatr Ann. 1993;22:462–466.
- , , . Performance of low‐risk criteria in the evaluation of young infants with fever: review of the literature. Pediatrics. 2010;125:228–233.
- , , , , , . A week‐by‐week analysis of the low‐risk criteria for serious bacterial infection in febrile neonates. Arch Dis Child. 2009;94:287–292.
- , , , et al. Is 15 days an appropriate cut‐off age for considering serious bacterial infection in the management of febrile infants? Pediatr Infect Dis J. 2012;31:455–458.
- , , . Failure of infant observation scales in detecting serious illness in febrile, 4‐ to 8‐week‐old infants. Pediatrics. 1990;85:1040–1043.
- , , . Outpatient management without antibiotics of fever in selected infants. N Engl J Med. 1993;329:1437–1441.
- , , . Identifying febrile infants at risk for a serious bacterial infection. J Pediatr. 1993;123:489–490.
- , , , et al. Febrile infants at low risk for serious bacterial infection—an appraisal of the Rochester criteria and implications for management. Febrile Infant Collaborative Study Group. Pediatrics. 1994;94:390–396.
- , , , et al. Management of febrile neonates in US pediatric emergency departments. Pediatrics. 2014;133:187–195.
- , , , et al. Variation in care of the febrile young infant <90 days in US pediatric emergency departments. Pediatrics. 2014;134:667–677.
- , , , et al. Association of clinical practice guidelines with emergency department management of febrile infants ≤56 days of age. J Hosp Med. 2015;10:358–365.
- , , , et al. Diagnosis and management of febrile infants (0‐3 months). Evid Rep Technol Assess (Full Rep). 2012;(205):1–297.
- , , , et al. Accuracy of administrative billing codes to detect urinary tract infection hospitalizations. Pediatrics. 2011;128:323–330.
- , , , et al. Identifying pediatric community‐acquired pneumonia hospitalizations: accuracy of administrative billing codes. JAMA Pediatr. 2013;167:851–858.
- , , , , , . Development and use of reporting guidelines for assessing the quality of validation studies of health administrative data. J Clin Epidemiol. 2011;64:821–829.
- American College of Emergency Physicians Clinical Policies Committee; American College of Emergency Physicians Clinical Policies Subcommittee on Pediatric Fever. Clinical policy for children younger than three years presenting to the emergency department with fever. Ann Emerg Med. 2003;42:530–545.
- , , , , , . Variation in occult injury screening for children with suspected abuse in selected US children's hospitals. Pediatrics. 2012;130:853–860.
- . Achieving data quality. How data from a pediatric health information system earns the trust of its users. J AHIMA. 2004;75:22–26.
- , , , . Corticosteroids and mortality in children with bacterial meningitis. JAMA. 2008;299:2048–2055.
- , , , , , . Research electronic data capture (REDCap)—a metadata‐driven methodology and workflow process for providing translational research informatics support. J Biomed Inform. 2009;42:377–381.
- , , , , , . Deaths attributed to pediatric complex chronic conditions: national trends and implications for supportive care services. Pediatrics. 2001;107:E99.
- US Census Bureau. Geographic terms and concepts—census divisions and census regions. Available at: https://www.census.gov/geo/reference/gtc/gtc_census_divreg.html. Accessed October 20, 2014.
- , , , . Initial emergency department diagnosis and return visits: risk versus perception. Ann Emerg Med. 1998;32:569–573.
- , , , , . A national depiction of children with return visits to the emergency department within 72 hours, 2001–2007. Pediatr Emerg Care. 2012;28:606–610.
- , , , et al. Pediatric observation status: are we overlooking a growing population in children's hospitals? J Hosp Med. 2012;7:530–536.
- , , , et al. Differences in designations of observation care in US freestanding children's hospitals: are they virtual or real? J Hosp Med. 2012;7:287–293.
- , , , , . Trends in the management of viral meningitis at United States children's hospitals. Pediatrics. 2013;131:670–676.
- , , , et al. Impact of increasing ondansetron use on clinical outcomes in children with gastroenteritis. JAMA Pediatr. 2014;168:321–329.
- , , , , . Race, otitis media, and antibiotic selection. Pediatrics. 2014;134:1059–1066.
- , , , et al. Establishing benchmarks for the hospitalized care of children with asthma, bronchiolitis, and pneumonia. Pediatrics. 2014;134:555–562.
- , , , , . Diagnostic testing and treatment of pediatric headache in the emergency department. J Pediatr. 2013;163:1634–1637.
Fever is one of the most common reasons for emergency department (ED) evaluation of infants under 90 days of age.[1] Up to 10% to 20% of febrile young infants will have a serious bacterial infection (SBI),[2, 3, 4] but infants with SBI are difficult to distinguish from those without SBI based upon symptoms and physical examination findings alone.[5] Previously developed clinical prediction algorithms can help to identify febrile infants at low risk for SBI, but differ in age range as well as recommendations for testing and empiric treatment.[6, 7, 8] Consequently, there is widespread variation in management of febrile young infants at US children's hospitals,[9, 10, 11] and defining optimal management strategies remains an important issue in pediatric healthcare.[12] Administrative datasets are convenient and inexpensive, and can be used to evaluate practice variation, trends, and outcomes of a large, diverse group of patients within and across institutions.[9, 10] Accurately identifying febrile infants evaluated for suspected SBI in administrative databases would facilitate comparative effectiveness research, quality improvement initiatives, and institutional benchmarking.
Prior studies have validated the accuracy of administrative billing codes for identification of other common childhood illnesses, including urinary tract infection (UTI)[13] and pneumonia.[14] The accuracy of International Classification of Diseases, Ninth Revision (ICD‐9) diagnosis codes in identifying febrile young infants evaluated for SBI is not known. Reliance on administrative ICD‐9 diagnosis codes for patient identification can lead to misclassification of patients due to variable database quality, the validity of the diagnosis codes being utilized, and hospital coding practices.[15] Additionally, fever is a symptom and not a specific diagnosis. If a particular bacterial or viral diagnosis is established (eg, enterovirus meningitis), a discharge diagnosis of fever may not be attributed to the patient encounter. Thus, evaluating the performance characteristics and capture of clinical outcomes of different combinations of ICD‐9 diagnosis codes for identifying febrile infants is necessary for both the conduct and interpretation of studies that utilize administrative databases. The primary objective of this investigation was to identify the most accurate ICD‐9 coding strategies for the identification of febrile infants aged <90 days using administrative data. We also sought to evaluate capture of clinically important outcomes across identification strategies.
METHODS
Study Design and Setting
For this multicenter retrospective study, we used the Pediatric Health Information System (PHIS) database to identify infants <90 days of age[16] who presented between July 1, 2012 and June 30, 2013 to 1 of 8 EDs. We assessed performance characteristics of ICD‐9 diagnosis code case‐identification algorithms by comparing ICD‐9 code combinations to a fever reference standard determined by medical record review. The institutional review board at each participating site approved the study protocol.
Data Source
Data were obtained from 2 sources: the PHIS database and medical record review. We used the PHIS database to identify eligible patients by ICD‐9 diagnosis codes; patient encounters were randomly selected using a random number generator. The PHIS database contains demographic, diagnosis, and billing data from 44 hospitals affiliated with the Children's Hospital Association (Overland Park, Kansas) and represents 85% of freestanding children's hospitals in the United States.[17] Data are deidentified; encrypted unique patient identifiers permit tracking of patients across visits within a site.[18] The Children's Hospital Association and participating hospitals jointly assure the quality and integrity of the data.[19]
For each patient encounter identified in the PHIS database, detailed medical record review was performed by trained investigators at each of the 8 study sites (see Supporting Information, Appendix, in the online version of this article). A standardized data collection instrument was pilot tested by all investigators prior to use. Data were collected and managed using the Research Electronic Data Capture (REDCap) tool hosted at Boston Children's Hospital.[20]
Exclusions
Using PHIS data, prior to medical record review we excluded infants with a complex chronic condition as defined previously[21] and those transferred from another institution, as these infants may warrant a nonstandard evaluation and/or may have incomplete data.
ICD‐9 Diagnosis Code Groups
In the PHIS database, all patients discharged from the hospital (including hospitalized patients as well as patients discharged from the ED) receive 1 or more ICD‐9 discharge diagnosis codes. These diagnosis codes are ascribed after discharge from the hospital, or for ED patients, after ED discharge. Additionally, patients may receive an admission diagnosis, which reflects the diagnosis ascribed at the time of ED discharge or transfer to the inpatient unit.
We reviewed medical records of infants selected from the following ICD‐9 diagnosis code groups (Figure 1): (1) discharge diagnosis code of fever (780.6 [fever and other physiologic disturbances of temperature regulation], 778.4 [other disturbances of temperature regulation of newborn], 780.60 [fever, unspecified], or 780.61 [fever presenting with conditions classified elsewhere])[9, 10] regardless of the presence of admission diagnosis of fever or diagnosis of serious infection, (2) admission diagnosis code of fever without associated discharge diagnosis code of fever,[10] (3) discharge diagnosis code of serious infection determined a priori (see Supporting Information, Appendix, in the online version of this article) without discharge or admission diagnosis code of fever, and (4) infants without any diagnosis code of fever or serious infection.
Medical records reviewed in each of the 4 ICD‐9 diagnosis code groups were randomly selected from the overall set of ED encounters in the population of infants <90 days of age evaluated during the study period. Twenty‐five percent population sampling was used for 3 of the ICD‐9 diagnosis code groups, whereas 5% sampling was used for the no fever/no serious infection code group. The number of medical records reviewed in each ICD‐9 diagnosis code group was proportional to the distribution of ICD‐9 codes across the entire population of infants <90 days of age. These records were distributed equally across sites (228 records per site), except for 1 site that does not assign admission diagnoses (201 records).
Investigators were blinded to ICD‐9 diagnosis code groups during medical record review. Infants with multiple visits during the study period were eligible to be included more than once if the visits occurred more than 3 days apart. For infants with more than 1 ED visit on a particular calendar day, investigators were instructed to review the initial visit.
For each encounter, we also abstracted demographic characteristics (gender, race/ethnicity), insurance status, hospital region (using US Census categories[22]), and season from the PHIS database.
Reference Standard
The presence of fever was determined by medical record review. We defined fever as any documented temperature 100.4F (38.0C) at home or in the ED.[16]
ICD‐9 Code Case‐Identification Algorithms
Using the aforementioned ICD‐9 diagnosis code groups individually and in combination, the following 4 case‐identification algorithms, determined from prior study or group consensus, were compared to the reference standard: (1) ICD‐9 discharge diagnosis code of fever,[9] (2) ICD‐9 admission or discharge diagnosis code of fever,[10, 11] (3) ICD‐9 discharge diagnosis code of fever or serious infection, and (4) ICD‐9 discharge or admission diagnosis code of fever or serious infection. Algorithms were compared overall, separately for discharged and hospitalized infants, and across 3 distinct age groups (28 days, 2956 days, and 5789 days).
Patient‐Level Outcomes
To compare differences in outcomes by case‐identification algorithm, from the PHIS database we abstracted hospitalization rates, rates of UTI/pyelonephritis,[13] bacteremia/sepsis, and bacterial meningitis.[19] Severe outcomes were defined as intensive care unit admission, mechanical ventilation, central line placement, receipt of extracorporeal membrane oxygenation, or death. We assessed hospital length of stay for admitted infants and 3‐day revisits,[23, 24] and revisits resulting in hospitalization for infants discharged from the ED at the index visit. Patients billed for observation care were classified as being hospitalized.[25, 26]
Data Analysis
Accuracy of the 4 case‐identification algorithms (compared with the reference standard) was calculated using sensitivity, specificity, negative predictive value (NPV), and positive predictive value (PPV), along with 95% confidence interval (CI). Prior to analysis, a 5‐fold weighting factor was applied to the no fever/no serious infection group to account for the differential sampling used for this group (5% vs 25% for the other 3 ICD‐9 diagnosis code groups). This weighting was done to approximate the true prevalence of each ICD‐9 code group within the larger population, so that an accurate rate of false negatives (infants with fever who had neither a diagnosis of fever nor serious infection) could be calculated.
We described continuous variables using median and interquartile range or range values and categorical variables using frequencies with 95% CIs. We compared categorical variables using a 2 test. We determined statistical significance as a 2‐tailed P value <0.05. Statistical analyses were performed using SAS version 9.3 (SAS Institute, Cary, NC).
RESULTS
Study Patients
During the 1‐year study period, 23,753 ED encounters for infants <90 days of age were identified in the PHIS database at the 8 participating sites. Of these infant encounters, 2166 (9.2%) were excluded (1658 infants who had a complex chronic condition and 508 transferred into the ED), leaving 21,587 infants available for selection. After applying our sampling strategy, we identified 1797 encounters for medical record review. Seven encounters from 3 hospitals with missing medical records were excluded, resulting in a final cohort of 1790 encounters (Figure 1). Among included infants, 552 (30.8%) were 28 days, 743 (41.5%) were 29 to 56 days, and 495 (27.8%) were 57 to 89 days of age; 737 (41.2%) infants were hospitalized. Patients differed in age, race, payer, and season across ICD‐9 diagnosis code groups (see Supporting Information, Table 1, in the online version of this article).
| ICD‐9 Diagnosis Code Algorithm | Overall | |||
|---|---|---|---|---|
| Sensitivity, % (95% CI) | Specificity, % (95% CI) | Negative Predictive Value, % (95% CI) | Positive Predictive Value, % (95% CI) | |
| ||||
| Discharge diagnosis of fever | 53.2 (50.056.4) | 98.2 (97.898.6) | 90.8 (90.091.6) | 86.1 (83.388.9) |
| Hospitalized | 47.3 (43.151.5) | 97.7 (96.998.5) | 80.6 (78.682.6) | 90.2 (86.893.6) |
| Discharged from ED | 61.4 (56.666.2) | 98.4 (98.098.8) | 95.4 (94.796.1) | 82.1 (77.786.5) |
| Discharge or admission diagnosis of Fever | 71.1 (68.274.0) | 97.7 (97.398.1) | 94.1 (93.494.8) | 86.9 (84.589.3) |
| Hospitalized | 72.5 (68.876.2) | 97.1 (96.298.0) | 88.8 (87.190.5) | 91.7 (89.194.3) |
| Discharged from ED | 69.2 (64.773.7) | 98.0 (97.598.5) | 96.3 (95.796.9) | 80.8 (76.685.0) |
| Discharge diagnosis of fever or serious infection | 63.7 (60.666.8) | 96.5 (96.097.0) | 92.6 (91.893.4) | 79.6 (76.782.5) |
| Hospitalized | 63.9 (59.967.9) | 92.5 (91.094.0) | 85.1 (83.287.0) | 79.1 (75.382.9) |
| Discharged from ED | 63.4 (58.768.1) | 98.1 (97.698.6) | 95.6 (94.996.3) | 80.2 (75.884.6) |
| Discharge or admission diagnosis of fever or serious infection | 76.6 (73.979.3) | 96.2 (95.696.8) | 95.1 (94.595.7) | 81.0 (78.483.6) |
| Hospitalized | 80.8 (77.584.1) | 92.1 (90.693.6) | 91.5 (89.993.1) | 82.1 (78.985.3) |
| Discharged from ED | 71.0 (66.575.5) | 97.7 (97.298.2) | 96.5 (95.997.1) | 79.4 (75.283.6) |
Among the 1790 patient encounters reviewed, a total of 766 infants (42.8%) met the reference standard definition for fever in the cohort. An additional 47 infants had abnormal temperature reported (documentation of tactile fever, history of fever without a specific temperature described, or hypothermia) but were classified as having no fever by the reference standard.
ICD‐9 Code Case‐Identification Algorithm Performance
Compared with the reference standard, the 4 case‐identification algorithms demonstrated specificity of 96.2% to 98.2% but lower sensitivity overall (Figure 2). Discharge diagnosis of fever alone demonstrated the lowest sensitivity. The algorithm of discharge or admission diagnosis of fever resulted in increased sensitivity and the highest PPV of all 4 algorithms (86.9%, 95% CI: 84.5‐89.3). Addition of serious infection codes to this algorithm resulted in a marginal increase in sensitivity and a similar decrease in PPV (Table 1). When limited to hospitalized infants, specificity was highest for the case‐identification algorithm of discharge diagnosis of fever and similarly high for discharge or admission diagnosis of fever; sensitivity was highest for the algorithm of discharge or admission diagnosis of fever or diagnosis of serious infection. For infants discharged from the ED, algorithm specificity was 97.7% to 98.4%, with lower sensitivity for all 4 algorithms (Table 1). Inclusion of the 47 infants with abnormal temperature as fever did not materially change algorithm performance (data not shown).
Across all 3 age groups (28 days, 2956 days, and 5789 days), the 4 case‐identification algorithms demonstrated specificity >96%, whereas algorithm sensitivity was highest in the 29‐ to 56‐days‐old age group and lowest among infants 57 to 89 days old across all 4 algorithms (Figure 2). Similar to the overall cohort, an algorithm of discharge or admission diagnosis of fever demonstrated specificity of nearly 98% in all age groups; addition of serious infection codes to this algorithm increased sensitivity, highest in the 29‐ to 56‐days‐old age group (Figure 2; see also Supporting Information, Table 2, in the online version of this article).
| ICD‐9 Diagnosis Code Algorithm | Sensitivity, Median % (Range) | Specificity, Median % (Range) | Negative Predictive Value, Median % (Range) | Positive Predictive Value, Median % (Range) |
|---|---|---|---|---|
| ||||
| Discharge diagnosis of fever | 56.2 (34.681.0) | 98.3 (96.499.1) | 92.1 (83.297.4) | 87.7 (74.093.2) |
| Discharge or Admission diagnosis of Fever | 76.7 (51.385.0) | 97.8 (96.298.7) | 95.6 (86.997.4) | 87.4 (80.092.9) |
| Discharge diagnosis of fever or serious infection | 68.3 (44.287.3) | 96.5 (95.498.0) | 93.6 (85.298.2) | 78.3 (74.289.0) |
| Discharge or admission diagnosis of fever or serious infection | 83.1 (58.390.7) | 95.8 (95.498.0) | 96.5 (88.598.2) | 79.1 (77.490.4) |
Across the 8 study sites, median specificity was 95.8% to 98.3% for the 4 algorithms, with little interhospital variability; however, algorithm sensitivity varied widely by site. Median PPV was highest for discharge diagnosis of fever alone at 87.7% but ranged from 74.0% to 93.2% across sites. Median PPV for an algorithm of discharge or admission diagnosis of fever was similar (87.4%) but with less variation by site (range 80.0%92.9%) (Table 2).
Outcomes by ICD‐9 Diagnosis Code Group and Case‐Identification Algorithm
When compared with discharge diagnosis of fever, adding admission diagnosis of fever captured a higher proportion of hospitalized infants with SBIs (UTI/pyelonephritis, bacteremia/sepsis, or bacterial meningitis). However, median hospital length of stay, severe outcomes, and 3‐day revisits and revisits with hospitalization did not materially differ when including infants with admission diagnosis of fever in addition to discharge diagnosis of fever. Addition of infants with a diagnosis code for serious infection substantially increased the number of infants with SBIs and severe outcomes but did not capture additional 3‐day revisits (Table 3). There were no additional cases of SBI in the no fever/no serious illness diagnosis code group.
| ICD‐9 Diagnosis Code Algorithm | Outcome | 3‐Day Revisit, % (95% CI) | 3‐Day Revisit With Hospitalization, % (95% CI) | |||
|---|---|---|---|---|---|---|
| Hospitalized, % (95% CI) | UTI/Pyelonephritis, Bacteremia/Sepsis, or Bacterial Meningitis, % (95% CI) | Severe Outcome, % (95% CI)* | Length of Stay in Days, Median (IQR) | |||
| ||||||
| Discharge diagnosis of fever | 44.3 (40.348.4) | 3.3 (1.84.7) | 1.4 (0.42.3) | 3 (23) | 11.7 (8.215.2) | 5.9 (3.38.4) |
| Discharge or admission diagnosis of fever | 52.4 (48.955.9) | 6.1 (4.47.8) | 1.9 (1.02.9) | 3 (23) | 10.9 (7.714.1) | 5.4 (3.17.8) |
| Discharge diagnosis of fever or serious infection | 54.0 (50.457.5) | 15.3 (12.717.8) | 3.8 (2.55.2) | 3 (24) | 11.0 (7.714.2) | 5.5 (3.17.9) |
| Discharge or admission diagnosis of fever or serious infection | 56.5 (53.259.7) | 12.9 (10.715.1) | 3.6 (2.44.8) | 3 (24) | 10.3 (7.313.3) | 5.2 (3.07.4) |
Among infants who met the reference standard for fever but did not have a discharge or admission diagnosis of fever (false negatives), 11.8% had a diagnosis of SBI. Overall, 43.2% of febrile infants (and 84.4% of hospitalized infants) with SBI did not have an ICD‐9 discharge or admission diagnosis of fever. Addition of ICD‐9 diagnosis codes of serious infection to the algorithm of discharge or admission diagnosis of fever captured all additional SBIs, and no false negativeinfants missed with this algorithm had an SBI.
DISCUSSION
We described the performance of 4 ICD‐9 diagnosis code case‐identification algorithms for the identification of febrile young infants <90 days of age at US children's hospitals. Although the specificity was high across algorithms and institutions, the sensitivity was relatively low, particularly for discharge diagnosis of fever, and varied by institution. Given the high specificity, ICD‐9 diagnosis code case‐identification algorithms for fever reliably identify febrile infants using administrative data with low rates of inclusion of infants without fever. However, underidentification of patients, particularly those more prone to SBIs and severe outcomes depending on the algorithm utilized, can impact interpretation of comparative effectiveness studies or the quality of care delivered by an institution.
ICD‐9 discharge diagnosis codes are frequently used to identify pediatric patients across a variety of administrative databases, diseases, and symptoms.[19, 27, 28, 29, 30, 31] Although discharge diagnosis of fever is highly specific, sensitivity is substantially lower than other case‐identification algorithms we studied, particularly for hospitalized infants. This may be due to a fever code sometimes being omitted in favor of a more specific diagnosis (eg, bacteremia) prior to hospital discharge. Therefore, case identification relying only on ICD‐9 discharge diagnosis codes for fever may under‐report clinically important SBI or severe outcomes as demonstrated in our study. This is in contrast to ICD‐9 diagnosis code identification strategies for childhood UTI and pneumonia, which largely have higher sensitivity but lower specificity than fever codes.[13, 14]
Admission diagnosis of fever is important for febrile infants as they may not have an explicit diagnosis at the time of disposition from the ED. Addition of admission diagnosis of fever to an algorithm relying on discharge diagnosis code alone increased sensitivity without a demonstrable reduction in specificity and PPV, likely due to capture of infants with a fever diagnosis at presentation before a specific infection was identified. Although using an algorithm of discharge or admission diagnosis of fever captured a higher percentage of hospitalized febrile infants with SBIs, sensitivity was only 71% overall with this algorithm, and 43% of febrile infants with SBI would still have been missed. Importantly, though, addition of various ICD‐9 codes for serious infection to this algorithm resulted in capture of all febrile infants with SBI and should be used as a sensitivity analysis.
The test characteristics of diagnosis codes were highest in the 29‐ to 56‐days‐old age group. Given the differing low‐risk criteria[6, 7, 8] and lack of best practice guidelines[16] in this age group, the use of administrative data may allow for the comparison of testing and treatment strategies across a large cohort of febrile infants aged 29 to 56 days. However, individual hospital coding practices may affect algorithm performance, in particular sensitivity, which varied substantially by hospital. This variation in algorithm sensitivity may impact comparisons of outcomes across institutions. Therefore, when conducting studies of febrile infants using administrative data, sensitivity analyses or use of chart review should be considered to augment the use of ICD‐9 code‐based identification strategies, particularly for comparative benchmarking and outcomes studies. These additional analyses are particularly important for studies of febrile infants >56 days of age, in whom the sensitivity of diagnosis codes is particularly low. We speculate that the lower sensitivity in older febrile infants may relate to a lack of consensus on the clinical significance of fever in this age group and the varying management strategies employed.[10]
Strengths of this study include the assessment of ICD‐9 code algorithms across multiple institutions for identification of fever in young infants, and the patterns of our findings remained robust when comparing median performance characteristics of the algorithms across hospitals to our overall findings. We were also able to accurately estimate PPV and NPV using a case‐identification strategy weighted to the actual population sizes. Although sensitivity and specificity are the primary measures of test performance, predictive values are highly informative for investigators using administrative data. Additionally, our findings may inform public health efforts including disease surveillance, assessment of seasonal variation, and identification and monitoring of healthcare‐associated infections among febrile infants.
Our study has limitations. We did not review all identified records, which raises the possibility that our evaluated cohort may not be representative of the entire febrile infant population. We attempted to mitigate this possibility by using a random sampling strategy for our population selection that was weighted to the actual population sizes. Second, we identified serious infections using ICD‐9 diagnosis codes determined by group consensus, which may not capture all serious infection codes that identify febrile infants whose fever code was omitted. Third, 47 infants had abnormal temperature that did not meet our reference standard criteria for fever and were included in the no fever group. Although there may be disagreement regarding what constitutes a fever, we used a widely accepted reference standard to define fever.[16] Further, inclusion of these 47 infants as fever did not materially change algorithm performance. Last, our study was conducted at 8 large tertiary‐care children's hospitals, and our results may not be generalizable to other children's hospitals and community‐based hospitals.
CONCLUSIONS
Studies of febrile young infants that rely on ICD‐9 discharge diagnosis code of fever for case ascertainment have high specificity but low sensitivity for the identification of febrile infants, particularly among hospitalized patients. A case‐identification strategy that includes discharge or admission diagnosis of fever demonstrated higher sensitivity, and should be considered for studies of febrile infants using administrative data. However, additional strategies such as incorporation of ICD‐9 codes for serious infection should be used when comparing outcomes across institutions.
Acknowledgements
The Febrile Young Infant Research Collaborative includes the following additional collaborators who are acknowledged for their work on this study: Erica DiLeo, MA, Department of Medical Education and Research, Danbury Hospital, Danbury, Connecticut; Janet Flores, BS, Division of Emergency Medicine, Ann and Robert H. Lurie Children's Hospital of Chicago, Chicago, Illinois.
Disclosures: This project funded in part by The Gerber Foundation Novice Researcher Award, (Ref No. 1827‐3835). Dr. Fran Balamuth received career development support from the National Institutes of Health (NHLBI K12‐HL109009). Funders were not involved in the design or conduct of the study; collection, management, analysis, or interpretation of the data; or preparation, review, or approval of the manuscript. The authors have no conflicts of interest relevant to this article to disclose.
- . The prevalence of serious bacterial infections by age in febrile infants during the first 3 months of life. Pediatr Ann. 1993;22:462–466.
- , , . Performance of low‐risk criteria in the evaluation of young infants with fever: review of the literature. Pediatrics. 2010;125:228–233.
- , , , , , . A week‐by‐week analysis of the low‐risk criteria for serious bacterial infection in febrile neonates. Arch Dis Child. 2009;94:287–292.
- , , , et al. Is 15 days an appropriate cut‐off age for considering serious bacterial infection in the management of febrile infants? Pediatr Infect Dis J. 2012;31:455–458.
- , , . Failure of infant observation scales in detecting serious illness in febrile, 4‐ to 8‐week‐old infants. Pediatrics. 1990;85:1040–1043.
- , , . Outpatient management without antibiotics of fever in selected infants. N Engl J Med. 1993;329:1437–1441.
- , , . Identifying febrile infants at risk for a serious bacterial infection. J Pediatr. 1993;123:489–490.
- , , , et al. Febrile infants at low risk for serious bacterial infection—an appraisal of the Rochester criteria and implications for management. Febrile Infant Collaborative Study Group. Pediatrics. 1994;94:390–396.
- , , , et al. Management of febrile neonates in US pediatric emergency departments. Pediatrics. 2014;133:187–195.
- , , , et al. Variation in care of the febrile young infant <90 days in US pediatric emergency departments. Pediatrics. 2014;134:667–677.
- , , , et al. Association of clinical practice guidelines with emergency department management of febrile infants ≤56 days of age. J Hosp Med. 2015;10:358–365.
- , , , et al. Diagnosis and management of febrile infants (0‐3 months). Evid Rep Technol Assess (Full Rep). 2012;(205):1–297.
- , , , et al. Accuracy of administrative billing codes to detect urinary tract infection hospitalizations. Pediatrics. 2011;128:323–330.
- , , , et al. Identifying pediatric community‐acquired pneumonia hospitalizations: accuracy of administrative billing codes. JAMA Pediatr. 2013;167:851–858.
- , , , , , . Development and use of reporting guidelines for assessing the quality of validation studies of health administrative data. J Clin Epidemiol. 2011;64:821–829.
- American College of Emergency Physicians Clinical Policies Committee; American College of Emergency Physicians Clinical Policies Subcommittee on Pediatric Fever. Clinical policy for children younger than three years presenting to the emergency department with fever. Ann Emerg Med. 2003;42:530–545.
- , , , , , . Variation in occult injury screening for children with suspected abuse in selected US children's hospitals. Pediatrics. 2012;130:853–860.
- . Achieving data quality. How data from a pediatric health information system earns the trust of its users. J AHIMA. 2004;75:22–26.
- , , , . Corticosteroids and mortality in children with bacterial meningitis. JAMA. 2008;299:2048–2055.
- , , , , , . Research electronic data capture (REDCap)—a metadata‐driven methodology and workflow process for providing translational research informatics support. J Biomed Inform. 2009;42:377–381.
- , , , , , . Deaths attributed to pediatric complex chronic conditions: national trends and implications for supportive care services. Pediatrics. 2001;107:E99.
- US Census Bureau. Geographic terms and concepts—census divisions and census regions. Available at: https://www.census.gov/geo/reference/gtc/gtc_census_divreg.html. Accessed October 20, 2014.
- , , , . Initial emergency department diagnosis and return visits: risk versus perception. Ann Emerg Med. 1998;32:569–573.
- , , , , . A national depiction of children with return visits to the emergency department within 72 hours, 2001–2007. Pediatr Emerg Care. 2012;28:606–610.
- , , , et al. Pediatric observation status: are we overlooking a growing population in children's hospitals? J Hosp Med. 2012;7:530–536.
- , , , et al. Differences in designations of observation care in US freestanding children's hospitals: are they virtual or real? J Hosp Med. 2012;7:287–293.
- , , , , . Trends in the management of viral meningitis at United States children's hospitals. Pediatrics. 2013;131:670–676.
- , , , et al. Impact of increasing ondansetron use on clinical outcomes in children with gastroenteritis. JAMA Pediatr. 2014;168:321–329.
- , , , , . Race, otitis media, and antibiotic selection. Pediatrics. 2014;134:1059–1066.
- , , , et al. Establishing benchmarks for the hospitalized care of children with asthma, bronchiolitis, and pneumonia. Pediatrics. 2014;134:555–562.
- , , , , . Diagnostic testing and treatment of pediatric headache in the emergency department. J Pediatr. 2013;163:1634–1637.
© 2015 Society of Hospital Medicine
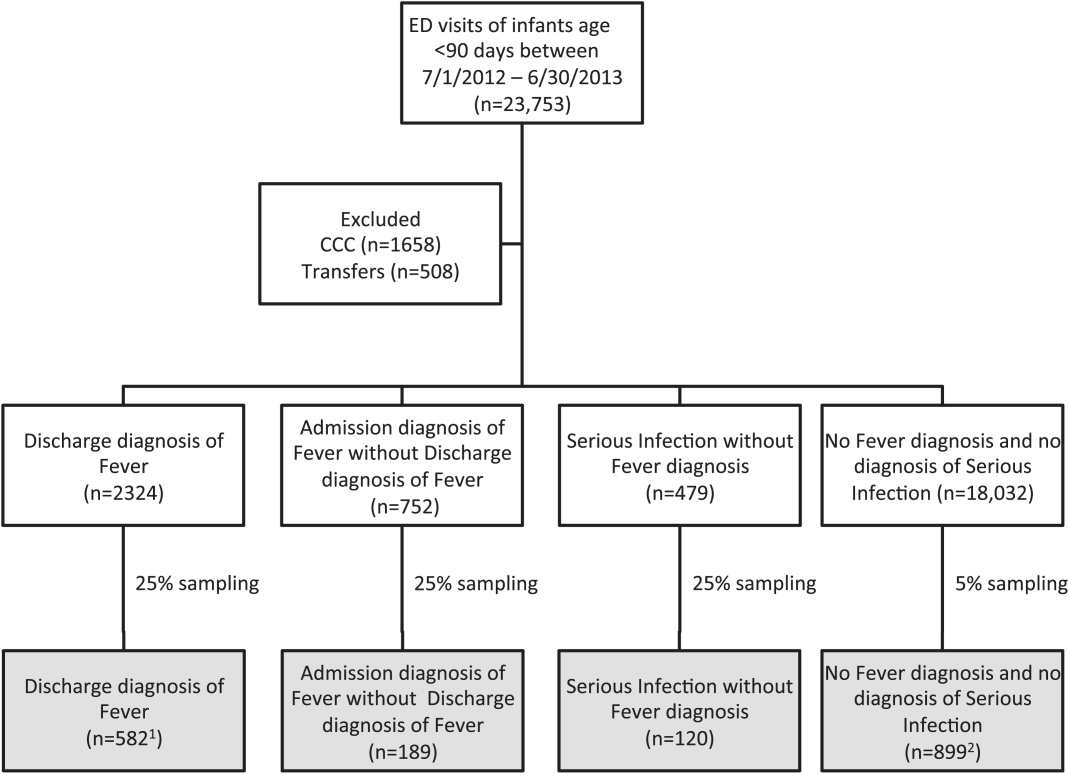
TCS Among Children with Pneumonia
National guidelines for the management of childhood pneumonia highlight the need for the development of objective outcome measures to inform clinical decision making, establish benchmarks of care, and compare treatments and interventions.[1] Time to clinical stability (TCS) is a measure reported in adult pneumonia studies that incorporates vital signs, ability to eat, and mental status to objectively assess readiness for discharge.[2, 3, 4] TCS has not been validated among children as it has in adults,[5, 6, 7, 8] although such measures could prove useful for assessing discharge readiness with applications in both clinical and research settings. The objective of our study was to test the performance of pediatric TCS measures among children hospitalized with pneumonia.
METHODS
Study Population
We studied children hospitalized with community‐acquired pneumonia at Monroe Carell Jr. Children's Hospital at Vanderbilt between January 6, 2010 and May 9, 2011. Study children were enrolled as part of the Centers for Disease Control & Prevention (CDC) Etiology of Pneumonia in the Community (EPIC) study, a prospective, population‐based study of community‐acquired pneumonia hospitalizations. Detailed enrollment criteria for the EPIC study were reported previously.[9] Institutional review boards at Vanderbilt University and the CDC approved this study. Informed consent was obtained from enrolled families.
Data Elements and Study Definitions
Baseline data, including demographics, illness history, comorbidities, and clinical outcomes (eg, length of stay [LOS], intensive care admission), were systematically and prospectively collected. Additionally, data for 4 physiologic parameters, including temperature, heart rate, respiratory rate, and use of supplemental oxygen were obtained from the electronic medical record. These parameters were measured at least every 6 hours from admission through discharge as part of routine care. Readmissions within 7 calendar days of discharge were also obtained from the electronic medical record.
Stability for each parameter was defined as follows: normal temperature (36.037.9C), normal respiratory and heart rates in accordance with Pediatric Advanced Life Support age‐based values (see Supporting Table 1 in the online version of this article),[10] and no administration of supplemental oxygen. If the last recorded value for a given parameter was abnormal, that parameter was considered unstable at discharge. Otherwise, the time and date of the last abnormal value for each parameter was subtracted from admission time and date to determine TCS for that parameter in hours.
To determine overall stability, we evaluated 4 combination TCS measures, each incorporating 2 individual parameters. All combinations included respiratory rate and need for supplemental oxygen, as these parameters are the most explicit clinical indicators of pneumonia. Stability for each combination measure was defined as normalization of all included measures.
Clinical Outcomes for the Combined TCS Measures
The 4 combined TCS measures were compared against clinical outcomes including hospital LOS (measured in hours) and an ordinal severity scale. The ordinal scale categorized children into 3 mutually exclusive groups as follows: nonsevere (hospitalization without need for intensive care or empyema requiring drainage), severe (intensive care admission without invasive mechanical ventilation or vasopressor support and no empyema requiring drainage), and very severe (invasive mechanical ventilation, vasopressor support, or empyema requiring drainage).
Statistical Analysis
Categorical and continuous variables were summarized using frequencies and percentages and median and interquartile range (IQR) values, respectively. Analyses were stratified by age (<2 years, 24 years, 517 years). We also plotted summary statistics for the combined measures and LOS, and computed the median absolute difference between these measures for each level of the ordinal severity scale. Analyses were conducted using Stata 13 (StataCorp, College Station, TX).
RESULTS
Study Population
Among 336 children enrolled in the EPIC study at Vanderbilt during the study period, 334 (99.4%) with complete data were included. Median age was 33 months (IQR, 1480). Median LOS was 56.4 hours (IQR, 41.591.7). There were 249 (74.5%) children classified as nonsevere, 39 (11.7) as severe, and 46 (13.8) as very severe (for age‐based characteristics see Supporting Table 2 in the online version of this article). Overall, 12 (3.6%) children were readmitted within 7 days of discharge.
Individual Stability Parameters
Overall, 323 (96.7%) children had 1 parameter abnormal on admission. Respiratory rate (81.4%) was the most common abnormal parameter, followed by abnormal temperature (71.4%), use of supplemental oxygen (63.8%), and abnormal heart rate (54.4%). Overall, use of supplemental oxygen had the longest TCS, followed by respiratory rate (Table 1). In comparison, heart rate and temperature stabilized relatively quickly.
| Parameter | <2 Years, n=130 | 24 Years, n=90 | 517 Years, n=101 | |||
|---|---|---|---|---|---|---|
| No. (%)* | Median (IQR) TCS, h | No. (%) | Median (IQR) TCS, h | No. (%) | Median (IQR) TCS, h | |
| ||||||
| Respiratory rate | 97 (74.6) | 38.6 (18.768.9) | 63 (70.0) | 31.6 (9.561.9) | 63 (62.4) | 24.3 (10.859.2) |
| Oxygen | 90 (69.2) | 39.5 (19.273.6) | 58 (64.4) | 44.2 (2477.6) | 61 (60.4) | 38.3 (1870.6) |
| Heart rate | 21 (16.2) | 4.5 (0.318.4) | 73 (81.1) | 21.8 (5.751.9) | 62 (61.4) | 18 (5.842.2) |
| Temperature | 101 (77.7) | 14.5 (4.545.3) | 61 (67.8) | 18.4 (2.842.8) | 62 (61.4) | 10.6 (0.834) |
Seventy children (21.0%) had 1 parameter abnormal at discharge, including abnormal respiratory rate in 13.7%, heart rate in 7.0%, and temperature in 3.3%. One child (0.3%) was discharged with supplemental oxygen. Ten children (3.0%) had 2 parameters abnormal at discharge. There was no difference in 7‐day readmissions for children with 1 parameter abnormal at discharge (1.4%) compared to those with no abnormal parameters at discharge (4.4%, P=0.253).
Combination TCS Measures
Within each age group, the percentage of children achieving stability was relatively consistent across the 4 combined TCS measures (Table 2); however, more children were considered unstable at discharge (and fewer classified as stable on admission) as the number of included parameters increased. More children <5 years of age reached stability (range, 80.0%85.6%) compared to children 5 years of age (range, 68.3%72.3%). We also noted increasing median TCS with increasing disease severity (Figure 1, P<0.01) (see Supporting Fig. 1AC in the online version of this article); TCS was only slightly shorter than LOS across all 3 levels of the severity scale.
| TCS Measures | <2 Years, n=130 | 24 Years, n=90 | 517 Years, n=101 | P Value | |||
|---|---|---|---|---|---|---|---|
| No. (%)* | Median (IQR) TCS, h | No. (%) | Median (IQR) TCS, h | No. (%) | Median (IQR) TCS, h | ||
| |||||||
| RR+O2 | 108 (83.1) | 40.5 (20.175.0) | 72 (80.0) | 39.6 (15.679.2) | 69 (68.3) | 30.4 (14.759.2) | 0.08 |
| RR+O2+HR | 109 (83.8) | 40.2 (19.573.9) | 73 (81.1) | 35.9 (15.977.6) | 68 (67.3) | 29.8 (17.256.6) | 0.11 |
| RR+O2+T | 110 (84.6) | 40.5 (20.770.1) | 77 (85.6) | 39.1 (18.477.6) | 73 (72.3) | 28.2 (14.744.7) | 0.03 |
| RR+O2+HR+T | 110 (84.6) | 40.5 (20.770.1) | 72 (80.0) | 39.7 (20.177.5) | 71 (70.3) | 29.2 (18.254) | 0.05 |

DISCUSSION
Our study demonstrates that longitudinal TCS measures consisting of routinely collected physiologic parameters may be useful for objectively assessing disease recovery and clinical readiness for discharge among children hospitalized with pneumonia. A simple TCS measure incorporating respiratory rate and oxygen requirement performed similarly to the more complex combinations and classified fewer children as unstable at discharge. However, we also note several challenges that deserve additional study prior to the application of a pediatric TCS measure in clinical and research settings.
Vital signs and supplemental oxygen use are used clinically to assess disease severity and response to therapy among children with acute respiratory illness. Because these objective parameters are routinely collected among hospitalized children, the systematization of these data could inform clinical decision making around hospital discharge. Similar to early warning scores used to detect impending clinical deterioration,[11] TCS measures, by signaling normalization of stability parameters in a consistent and objective manner, could serve as an early signal of readiness for discharge. However, maximizing the clinical utility of TCS would require embedding the process within the electronic health record, a tool that could also have implications for the Centers for Medicare and Medicaid Services' meaningful use regulations.[12]
TCS could also serve as an outcome measure in research and quality efforts. Increased disease severity was associated with longer TCS for the 4 combined measures; TCS also demonstrated strong agreement with LOS. Furthermore, TCS minimizes the influence of factors unrelated to disease that may impact LOS (eg, frequency of hospital rounds, transportation difficulties, or social impediments to discharge), an advantage when studying outcomes for research and quality benchmarking.
The percentage of children reaching stability and the median TCS for the combined measures demonstrated little variation within each age group, likely because respiratory rate and need for supplemental oxygen, 2 of the parameters with the longest individual time to stability, were also included in each of the combination measures. This suggests that less‐complex measures incorporating only respiratory rate and need for supplemental oxygen may be sufficient to assess clinical stability, particularly because these parameters are objectively measured and possess a direct physiological link to pneumonia. In contrast, the other parameters may be more often influenced by factors unrelated to disease severity.
Our study also highlights several shortcomings of the pediatric TCS measures. Despite use of published, age‐based reference values,[13] we noted wide variation in the achievement of stability across individual parameters, especially for children 5 years old. Overall, 21% of children had 1 abnormal parameter at discharge. Even the simplest combined measure classified 13.4% of children as unstable at discharge. Discharge with unstable parameters was not associated with 7‐day readmission, although our study was underpowered to detect small differences. Additional study is therefore needed to evaluate less restrictive cutoff values on calculated TCS and the impact of hospital discharge prior to reaching stability. In particular, relaxing the upper limit for normal respiratory rate in adolescents (16 breaths per minute) to more closely approximate the adult TCS parameter (24 breaths per minute) should be explored. Refinement and standardization of age‐based vital sign reference values specific to hospitalized children may also improve the performance of these measures.[14]
Several limitations deserve discussion. TCS parameters and readmission data were abstracted retrospectively from a single institution, and our findings may not be generalizable. Although clinical staff routinely measured these data, measurement variation likely exists. Nevertheless, such variation is likely systematic, limiting the impact of potential misclassification. TCS was calculated based on the last abnormal value for each parameter; prior fluctuations between normal and abnormal periods of stability were not captured. We were unable to assess room air oxygen saturations. Instead, supplemental oxygen use served as a surrogate for hypoxia. At our institution, oxygen therapy is provided for children with pneumonia to maintain oxygen saturations of 90% to 92%. We did not assess work of breathing (a marker of severe pneumonia) or ability to eat (a component of adult TCS measures). We initially considered the evaluation of intravenous fluids as a proxy for ability to eat (addition of this parameter to the 4 parameter TCS resulted in a modest increase in median time to stability, data not shown); however, we felt the lack of institutional policy and subjective nature of this parameter detracted from our study's objectives. Finally, we were not able to determine clinical readiness for discharge beyond the measurement of vital sign parameters. Therefore, prospective evaluation of the proposed pediatric TCS measures in broader populations will be important to build upon our findings, refine stability parameters, and test the utility of new parameters (eg, ability to eat, work of breathing) prior to use in clinical settings.
Our study provides an initial evaluation of TCS measures for assessing severity and recovery among children hospitalized with pneumonia. Similar to adults, such validated TCS measures may ultimately prove useful for improving the quality of both clinical care and research, although additional study to more clearly define stability criteria is needed prior to implementation.
Disclosures
This work was supported by the National Institute of Allergy and Infectious Diseases of the National Institutes of Health under Award Number K23AI104779 to Dr. Williams. The EPIC study was supported by the Influenza Division in the National Center for Immunizations and Respiratory Diseases at the Centers for Disease Control and Prevention through cooperative agreements with each study site and was based on a competitive research funding opportunity. The findings and conclusions in this report are those of the authors and do not necessarily represent the views of the Centers for Disease Control and Prevention or the National Institutes of Health. Dr. Grijalva serves as a consultant to Glaxo‐Smith‐Kline and Pfizer outside of the scope of this article. Dr. Edwards is supported through grants from Novartis for the conduction of a Group B strep vaccine study and serves as the Chair of the Data Safety and Monitoring Data Committee for Influenza Study outside the scope of this article. Dr. Self reports grants from CareFusion, BioMerieux, Affinium Pharmaceuticals, Astute Medical, Crucell Holland BV, BRAHMS GmbH, Pfizer, Rapid Pathogen Screening, Venaxis, BioAegis Inc., Sphingotec GmbH, and Cempra Pharmaceuticals; personal fees from BioFire Diagnostics and Venaxis, Inc; and patent 13/632,874 (Sterile Blood Culture Collection System) pending; all outside the scope of this article.
- Healthcare Cost and Utilization Project. Available at: http://www.ahrq.gov/research/data/hcup/index.html. Accessed February 1, 2014.
- , , , et al. Time to clinical stability in patients hospitalized with community‐acquired pneumonia: implications for practice guidelines. JAMA. 1998;279:1452–1457.
- , , , et al.; Neumofail Group. Reaching stability in community‐acquired pneumonia: the effects of the severity of disease, treatment, and the characteristics of patients. Clin Infect Dis. 2004;39:1783–1790.
- , , , et al.; Community‐Acquired Pneumonia Organization. The pneumonia severity index predicts time to clinical stability in patients with community‐acquired pneumonia. Int J Tuberc Lung Dis. 2006;10:739–743.
- , , , , . Efficacy of corticosteroids in community‐acquired pneumonia: a randomized double‐blinded clinical trial. Am J Respir Crit Care Med. 2010;181:975–982.
- , , , et al. Early administration of antibiotics does not shorten time to clinical stability in patients with moderate‐to‐severe community‐acquired pneumonia. Chest 2003;124:1798–1804.
- , , , . A comparison between time to clinical stability in community‐acquired aspiration pneumonia and community‐acquired pneumonia. Intern Emerg Med. 2014;9:143–150.
- , , , et al.; Community‐Acquired Pneumonia Organization (CAPO) Investigators. A worldwide perspective of atypical pathogens in community‐acquired pneumonia. Am J Respir Crit Care Med. 2007;175:1086–1093.
- , , , et al.; CDC EPIC Study Team. Community‐acquired pneumonia requiring hospitalization among U.S. children. N Engl J Med. 2015;372:835–845.
- American Heart Association. 2005 American Heart Association (AHA) guidelines for cardiopulmonary resuscitation (CPR) and emergency cardiovascular care (ECC) of pediatric and neonatal patients: pediatric basic life support. Pediatrics. 2006;117:e989–e1004.
- , , . Development and initial validation of the Bedside Paediatric Early Warning System score. Crit Care. 2009;13:R135.
- Centers for Medicare and Medicaid Services. Regulations and guidance. EHR incentive programs. Available at: http://www.cms.gov/Regulations‐and‐Guidance/Legislation/EHRIncentivePrograms/index.html. Accessed February 20, 2015
- , , , , , . Development of heart and respiratory rate percentile curves for hospitalized children. Pediatrics. 2013;131:e1150–e1157.
- , , , et al. Length of stay after reaching clinical stability drives hospital costs associated with adult community‐acquired pneumonia. Scand J Infect Dis. 2013;45:219–226.
National guidelines for the management of childhood pneumonia highlight the need for the development of objective outcome measures to inform clinical decision making, establish benchmarks of care, and compare treatments and interventions.[1] Time to clinical stability (TCS) is a measure reported in adult pneumonia studies that incorporates vital signs, ability to eat, and mental status to objectively assess readiness for discharge.[2, 3, 4] TCS has not been validated among children as it has in adults,[5, 6, 7, 8] although such measures could prove useful for assessing discharge readiness with applications in both clinical and research settings. The objective of our study was to test the performance of pediatric TCS measures among children hospitalized with pneumonia.
METHODS
Study Population
We studied children hospitalized with community‐acquired pneumonia at Monroe Carell Jr. Children's Hospital at Vanderbilt between January 6, 2010 and May 9, 2011. Study children were enrolled as part of the Centers for Disease Control & Prevention (CDC) Etiology of Pneumonia in the Community (EPIC) study, a prospective, population‐based study of community‐acquired pneumonia hospitalizations. Detailed enrollment criteria for the EPIC study were reported previously.[9] Institutional review boards at Vanderbilt University and the CDC approved this study. Informed consent was obtained from enrolled families.
Data Elements and Study Definitions
Baseline data, including demographics, illness history, comorbidities, and clinical outcomes (eg, length of stay [LOS], intensive care admission), were systematically and prospectively collected. Additionally, data for 4 physiologic parameters, including temperature, heart rate, respiratory rate, and use of supplemental oxygen were obtained from the electronic medical record. These parameters were measured at least every 6 hours from admission through discharge as part of routine care. Readmissions within 7 calendar days of discharge were also obtained from the electronic medical record.
Stability for each parameter was defined as follows: normal temperature (36.037.9C), normal respiratory and heart rates in accordance with Pediatric Advanced Life Support age‐based values (see Supporting Table 1 in the online version of this article),[10] and no administration of supplemental oxygen. If the last recorded value for a given parameter was abnormal, that parameter was considered unstable at discharge. Otherwise, the time and date of the last abnormal value for each parameter was subtracted from admission time and date to determine TCS for that parameter in hours.
To determine overall stability, we evaluated 4 combination TCS measures, each incorporating 2 individual parameters. All combinations included respiratory rate and need for supplemental oxygen, as these parameters are the most explicit clinical indicators of pneumonia. Stability for each combination measure was defined as normalization of all included measures.
Clinical Outcomes for the Combined TCS Measures
The 4 combined TCS measures were compared against clinical outcomes including hospital LOS (measured in hours) and an ordinal severity scale. The ordinal scale categorized children into 3 mutually exclusive groups as follows: nonsevere (hospitalization without need for intensive care or empyema requiring drainage), severe (intensive care admission without invasive mechanical ventilation or vasopressor support and no empyema requiring drainage), and very severe (invasive mechanical ventilation, vasopressor support, or empyema requiring drainage).
Statistical Analysis
Categorical and continuous variables were summarized using frequencies and percentages and median and interquartile range (IQR) values, respectively. Analyses were stratified by age (<2 years, 24 years, 517 years). We also plotted summary statistics for the combined measures and LOS, and computed the median absolute difference between these measures for each level of the ordinal severity scale. Analyses were conducted using Stata 13 (StataCorp, College Station, TX).
RESULTS
Study Population
Among 336 children enrolled in the EPIC study at Vanderbilt during the study period, 334 (99.4%) with complete data were included. Median age was 33 months (IQR, 1480). Median LOS was 56.4 hours (IQR, 41.591.7). There were 249 (74.5%) children classified as nonsevere, 39 (11.7) as severe, and 46 (13.8) as very severe (for age‐based characteristics see Supporting Table 2 in the online version of this article). Overall, 12 (3.6%) children were readmitted within 7 days of discharge.
Individual Stability Parameters
Overall, 323 (96.7%) children had 1 parameter abnormal on admission. Respiratory rate (81.4%) was the most common abnormal parameter, followed by abnormal temperature (71.4%), use of supplemental oxygen (63.8%), and abnormal heart rate (54.4%). Overall, use of supplemental oxygen had the longest TCS, followed by respiratory rate (Table 1). In comparison, heart rate and temperature stabilized relatively quickly.
| Parameter | <2 Years, n=130 | 24 Years, n=90 | 517 Years, n=101 | |||
|---|---|---|---|---|---|---|
| No. (%)* | Median (IQR) TCS, h | No. (%) | Median (IQR) TCS, h | No. (%) | Median (IQR) TCS, h | |
| ||||||
| Respiratory rate | 97 (74.6) | 38.6 (18.768.9) | 63 (70.0) | 31.6 (9.561.9) | 63 (62.4) | 24.3 (10.859.2) |
| Oxygen | 90 (69.2) | 39.5 (19.273.6) | 58 (64.4) | 44.2 (2477.6) | 61 (60.4) | 38.3 (1870.6) |
| Heart rate | 21 (16.2) | 4.5 (0.318.4) | 73 (81.1) | 21.8 (5.751.9) | 62 (61.4) | 18 (5.842.2) |
| Temperature | 101 (77.7) | 14.5 (4.545.3) | 61 (67.8) | 18.4 (2.842.8) | 62 (61.4) | 10.6 (0.834) |
Seventy children (21.0%) had 1 parameter abnormal at discharge, including abnormal respiratory rate in 13.7%, heart rate in 7.0%, and temperature in 3.3%. One child (0.3%) was discharged with supplemental oxygen. Ten children (3.0%) had 2 parameters abnormal at discharge. There was no difference in 7‐day readmissions for children with 1 parameter abnormal at discharge (1.4%) compared to those with no abnormal parameters at discharge (4.4%, P=0.253).
Combination TCS Measures
Within each age group, the percentage of children achieving stability was relatively consistent across the 4 combined TCS measures (Table 2); however, more children were considered unstable at discharge (and fewer classified as stable on admission) as the number of included parameters increased. More children <5 years of age reached stability (range, 80.0%85.6%) compared to children 5 years of age (range, 68.3%72.3%). We also noted increasing median TCS with increasing disease severity (Figure 1, P<0.01) (see Supporting Fig. 1AC in the online version of this article); TCS was only slightly shorter than LOS across all 3 levels of the severity scale.
| TCS Measures | <2 Years, n=130 | 24 Years, n=90 | 517 Years, n=101 | P Value | |||
|---|---|---|---|---|---|---|---|
| No. (%)* | Median (IQR) TCS, h | No. (%) | Median (IQR) TCS, h | No. (%) | Median (IQR) TCS, h | ||
| |||||||
| RR+O2 | 108 (83.1) | 40.5 (20.175.0) | 72 (80.0) | 39.6 (15.679.2) | 69 (68.3) | 30.4 (14.759.2) | 0.08 |
| RR+O2+HR | 109 (83.8) | 40.2 (19.573.9) | 73 (81.1) | 35.9 (15.977.6) | 68 (67.3) | 29.8 (17.256.6) | 0.11 |
| RR+O2+T | 110 (84.6) | 40.5 (20.770.1) | 77 (85.6) | 39.1 (18.477.6) | 73 (72.3) | 28.2 (14.744.7) | 0.03 |
| RR+O2+HR+T | 110 (84.6) | 40.5 (20.770.1) | 72 (80.0) | 39.7 (20.177.5) | 71 (70.3) | 29.2 (18.254) | 0.05 |
DISCUSSION
Our study demonstrates that longitudinal TCS measures consisting of routinely collected physiologic parameters may be useful for objectively assessing disease recovery and clinical readiness for discharge among children hospitalized with pneumonia. A simple TCS measure incorporating respiratory rate and oxygen requirement performed similarly to the more complex combinations and classified fewer children as unstable at discharge. However, we also note several challenges that deserve additional study prior to the application of a pediatric TCS measure in clinical and research settings.
Vital signs and supplemental oxygen use are used clinically to assess disease severity and response to therapy among children with acute respiratory illness. Because these objective parameters are routinely collected among hospitalized children, the systematization of these data could inform clinical decision making around hospital discharge. Similar to early warning scores used to detect impending clinical deterioration,[11] TCS measures, by signaling normalization of stability parameters in a consistent and objective manner, could serve as an early signal of readiness for discharge. However, maximizing the clinical utility of TCS would require embedding the process within the electronic health record, a tool that could also have implications for the Centers for Medicare and Medicaid Services' meaningful use regulations.[12]
TCS could also serve as an outcome measure in research and quality efforts. Increased disease severity was associated with longer TCS for the 4 combined measures; TCS also demonstrated strong agreement with LOS. Furthermore, TCS minimizes the influence of factors unrelated to disease that may impact LOS (eg, frequency of hospital rounds, transportation difficulties, or social impediments to discharge), an advantage when studying outcomes for research and quality benchmarking.
The percentage of children reaching stability and the median TCS for the combined measures demonstrated little variation within each age group, likely because respiratory rate and need for supplemental oxygen, 2 of the parameters with the longest individual time to stability, were also included in each of the combination measures. This suggests that less‐complex measures incorporating only respiratory rate and need for supplemental oxygen may be sufficient to assess clinical stability, particularly because these parameters are objectively measured and possess a direct physiological link to pneumonia. In contrast, the other parameters may be more often influenced by factors unrelated to disease severity.
Our study also highlights several shortcomings of the pediatric TCS measures. Despite use of published, age‐based reference values,[13] we noted wide variation in the achievement of stability across individual parameters, especially for children 5 years old. Overall, 21% of children had 1 abnormal parameter at discharge. Even the simplest combined measure classified 13.4% of children as unstable at discharge. Discharge with unstable parameters was not associated with 7‐day readmission, although our study was underpowered to detect small differences. Additional study is therefore needed to evaluate less restrictive cutoff values on calculated TCS and the impact of hospital discharge prior to reaching stability. In particular, relaxing the upper limit for normal respiratory rate in adolescents (16 breaths per minute) to more closely approximate the adult TCS parameter (24 breaths per minute) should be explored. Refinement and standardization of age‐based vital sign reference values specific to hospitalized children may also improve the performance of these measures.[14]
Several limitations deserve discussion. TCS parameters and readmission data were abstracted retrospectively from a single institution, and our findings may not be generalizable. Although clinical staff routinely measured these data, measurement variation likely exists. Nevertheless, such variation is likely systematic, limiting the impact of potential misclassification. TCS was calculated based on the last abnormal value for each parameter; prior fluctuations between normal and abnormal periods of stability were not captured. We were unable to assess room air oxygen saturations. Instead, supplemental oxygen use served as a surrogate for hypoxia. At our institution, oxygen therapy is provided for children with pneumonia to maintain oxygen saturations of 90% to 92%. We did not assess work of breathing (a marker of severe pneumonia) or ability to eat (a component of adult TCS measures). We initially considered the evaluation of intravenous fluids as a proxy for ability to eat (addition of this parameter to the 4 parameter TCS resulted in a modest increase in median time to stability, data not shown); however, we felt the lack of institutional policy and subjective nature of this parameter detracted from our study's objectives. Finally, we were not able to determine clinical readiness for discharge beyond the measurement of vital sign parameters. Therefore, prospective evaluation of the proposed pediatric TCS measures in broader populations will be important to build upon our findings, refine stability parameters, and test the utility of new parameters (eg, ability to eat, work of breathing) prior to use in clinical settings.
Our study provides an initial evaluation of TCS measures for assessing severity and recovery among children hospitalized with pneumonia. Similar to adults, such validated TCS measures may ultimately prove useful for improving the quality of both clinical care and research, although additional study to more clearly define stability criteria is needed prior to implementation.
Disclosures
This work was supported by the National Institute of Allergy and Infectious Diseases of the National Institutes of Health under Award Number K23AI104779 to Dr. Williams. The EPIC study was supported by the Influenza Division in the National Center for Immunizations and Respiratory Diseases at the Centers for Disease Control and Prevention through cooperative agreements with each study site and was based on a competitive research funding opportunity. The findings and conclusions in this report are those of the authors and do not necessarily represent the views of the Centers for Disease Control and Prevention or the National Institutes of Health. Dr. Grijalva serves as a consultant to Glaxo‐Smith‐Kline and Pfizer outside of the scope of this article. Dr. Edwards is supported through grants from Novartis for the conduction of a Group B strep vaccine study and serves as the Chair of the Data Safety and Monitoring Data Committee for Influenza Study outside the scope of this article. Dr. Self reports grants from CareFusion, BioMerieux, Affinium Pharmaceuticals, Astute Medical, Crucell Holland BV, BRAHMS GmbH, Pfizer, Rapid Pathogen Screening, Venaxis, BioAegis Inc., Sphingotec GmbH, and Cempra Pharmaceuticals; personal fees from BioFire Diagnostics and Venaxis, Inc; and patent 13/632,874 (Sterile Blood Culture Collection System) pending; all outside the scope of this article.
- Healthcare Cost and Utilization Project. Available at: http://www.ahrq.gov/research/data/hcup/index.html. Accessed February 1, 2014.
- , , , et al. Time to clinical stability in patients hospitalized with community‐acquired pneumonia: implications for practice guidelines. JAMA. 1998;279:1452–1457.
- , , , et al.; Neumofail Group. Reaching stability in community‐acquired pneumonia: the effects of the severity of disease, treatment, and the characteristics of patients. Clin Infect Dis. 2004;39:1783–1790.
- , , , et al.; Community‐Acquired Pneumonia Organization. The pneumonia severity index predicts time to clinical stability in patients with community‐acquired pneumonia. Int J Tuberc Lung Dis. 2006;10:739–743.
- , , , , . Efficacy of corticosteroids in community‐acquired pneumonia: a randomized double‐blinded clinical trial. Am J Respir Crit Care Med. 2010;181:975–982.
- , , , et al. Early administration of antibiotics does not shorten time to clinical stability in patients with moderate‐to‐severe community‐acquired pneumonia. Chest 2003;124:1798–1804.
- , , , . A comparison between time to clinical stability in community‐acquired aspiration pneumonia and community‐acquired pneumonia. Intern Emerg Med. 2014;9:143–150.
- , , , et al.; Community‐Acquired Pneumonia Organization (CAPO) Investigators. A worldwide perspective of atypical pathogens in community‐acquired pneumonia. Am J Respir Crit Care Med. 2007;175:1086–1093.
- , , , et al.; CDC EPIC Study Team. Community‐acquired pneumonia requiring hospitalization among U.S. children. N Engl J Med. 2015;372:835–845.
- American Heart Association. 2005 American Heart Association (AHA) guidelines for cardiopulmonary resuscitation (CPR) and emergency cardiovascular care (ECC) of pediatric and neonatal patients: pediatric basic life support. Pediatrics. 2006;117:e989–e1004.
- , , . Development and initial validation of the Bedside Paediatric Early Warning System score. Crit Care. 2009;13:R135.
- Centers for Medicare and Medicaid Services. Regulations and guidance. EHR incentive programs. Available at: http://www.cms.gov/Regulations‐and‐Guidance/Legislation/EHRIncentivePrograms/index.html. Accessed February 20, 2015
- , , , , , . Development of heart and respiratory rate percentile curves for hospitalized children. Pediatrics. 2013;131:e1150–e1157.
- , , , et al. Length of stay after reaching clinical stability drives hospital costs associated with adult community‐acquired pneumonia. Scand J Infect Dis. 2013;45:219–226.
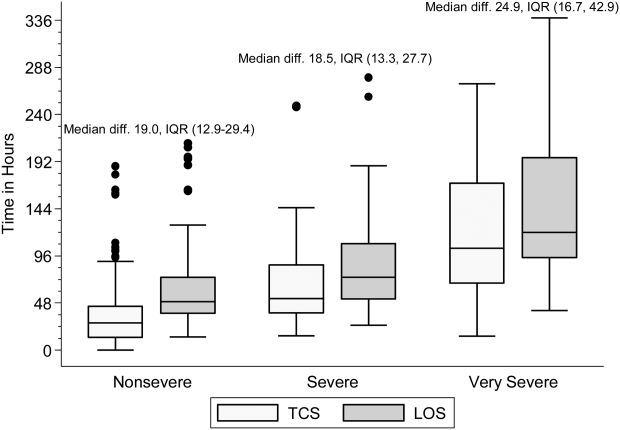
Febrile Infant CPGs
Febrile young infants are at high risk for serious bacterial infection (SBI) with reported rates of 8.5% to 12%, even higher in neonates 28 days of age.[1, 2, 3] As a result, febrile infants often undergo extensive diagnostic evaluation consisting of a combination of urine, blood, and cerebrospinal fluid (CSF) testing.[4, 5, 6] Several clinical prediction algorithms use this diagnostic testing to identify febrile infants at low risk for SBI, but they differ with respect to age range, recommended testing, antibiotic administration, and threshold for hospitalization.[4, 5, 6] Additionally, the optimal management strategy for this population has not been defined.[7] Consequently, laboratory testing, antibiotic use, and hospitalization for febrile young infants vary widely among hospitals.[8, 9, 10]
Clinical practice guidelines (CPGs) are designed to implement evidence‐based care and reduce practice variability, with the goal of improving quality of care and optimizing costs.[11] Implementation of a CPG for management of febrile young infants in the Intermountain Healthcare System was associated with greater adherence to evidence‐based care and lower costs.[12] However, when strong evidence is lacking, different interpretations of febrile infant risk classification incorporated into local CPGs may be a major driver of the across‐hospital practice variation observed in prior studies.[8, 9] Understanding sources of variability as well as determining the association of CPGs with clinicians' practice patterns can help identify quality improvement opportunities, either through national benchmarking or local efforts.
Our primary objectives were to compare (1) recommendations of pediatric emergency departmentbased institutional CPGs for febrile young infants and (2) rates of urine, blood, CSF testing, hospitalization, and ceftriaxone use at emergency department (ED) discharge based upon CPG presence and the specific CPG recommendations. Our secondary objectives were to describe the association of CPGs with healthcare costs and return visits for SBI.
METHODS
Study Design
We used the Pediatric Health Information System (PHIS) to identify febrile infants 56 days of age who presented to the ED between January 1, 2013 and December 31, 2013. We also surveyed ED providers at participating PHIS hospitals. Informed consent was obtained from survey respondents. The institutional review board at Boston Children's Hospital approved the study protocol.
Clinical Practice Guideline Survey
We sent an electronic survey to medical directors or division directors at 37 pediatric EDs to determine whether their ED utilized a CPG for the management of the febrile young infant in 2013. If no response was received after the second attempt, we queried ED fellowship directors or other ED attending physicians at nonresponding hospitals. Survey items included the presence of a febrile young infant CPG, and if present, the year of implementation, ages targeted, and CPG content. As applicable, respondents were asked to share their CPG and/or provide the specific CPG recommendations.
We collected and managed survey data using the Research Electronic Data Capture (REDCap) electronic data capture tools hosted at Boston Children's Hospital. REDCap is a secure, Web‐based application designed to support data capture for research studies.[13]
Data Source
The PHIS database contains administrative data from 44 US children's hospitals. These hospitals, affiliated with the Children's Hospital Association, represent 85% of freestanding US children's hospitals.[14] Encrypted patient identifiers permit tracking of patients across encounters.[15] Data quality and integrity are assured jointly by the Children's Hospital Association and participating hospitals.[16] For this study, 7 hospitals were excluded due to incomplete ED data or known data‐quality issues.[17]
Patients
We identified study infants using the following International Classification of Diseases, 9th Revision (ICD‐9) admission or discharge diagnosis codes for fever as defined previously[8, 9]: 780.6, 778.4, 780.60, or 780.61. We excluded infants with a complex chronic condition[18] and those transferred from another institution, as these infants may warrant a nonstandard evaluation and/or may have incomplete data. For infants with >1 ED visit for fever during the study period, repeat visits within 3 days of an index visit were considered a revisit for the same episode of illness; visits >3 days following an index visit were considered as a new index visit.
Study Definitions
From the PHIS database, we abstracted demographic characteristics (gender, race/ethnicity), insurance status, and region where the hospital was located (using US Census categories[19]). Billing codes were used to assess whether urine, blood, and CSF testing (as defined previously[9]) were performed during the ED evaluation. To account for ED visits that spanned the midnight hour, for hospitalized patients we considered any testing or treatment occurring on the initial or second hospital day to be performed in the ED; billing code data in PHIS are based upon calendar day and do not distinguish testing performed in the ED versus inpatient setting.[8, 9] Patients billed for observation care were classified as being hospitalized.[20, 21]
We identified the presence of an SBI using ICD‐9 diagnosis codes for the following infections as described previously[9]: urinary tract infection or pyelonephritis,[22] bacteremia or sepsis, bacterial meningitis,[16] pneumonia,[23] or bacterial enteritis. To assess return visits for SBI that required inpatient management, we defined an ED revisit for an SBI as a return visit within 3 days of ED discharge[24, 25] that resulted in hospitalization with an associated ICD‐9 discharge diagnosis code for an SBI.
Hospitals charges in PHIS database were adjusted for hospital location by using the Centers for Medicare and Medicaid Services price/wage index. Costs were estimated by applying hospital‐level cost‐to‐charge ratios to charge data.[26]
Measured Exposures
The primary exposure was the presence of an ED‐based CPG for management of the febrile young infant aged 28 days and 29 to 56 days; 56 days was used as the upper age limit as all of the CPGs included infants up to this age or beyond. Six institutions utilized CPGs with different thresholds to define the age categories (eg, dichotomized at 27 or 30 days); these CPGs were classified into the aforementioned age groups to permit comparisons across standardized age groups. We classified institutions based on the presence of a CPG. To assess differences in the application of low‐risk criteria, the CPGs were further classified a priori based upon specific recommendations around laboratory testing and hospitalization, as well as ceftriaxone use for infants aged 29 to 56 days discharged from the ED. CPGs were categorized based upon whether testing, hospitalization, and ceftriaxone use were: (1) recommended for all patients, (2) recommended only if patients were classified as high risk (absence of low‐risk criteria), (3) recommended against, or (4) recommended to consider at clinician discretion.
Outcome Measures
Measured outcomes were performance of urine, blood, CSF testing, and hospitalization rate, as well as rate of ceftriaxone use for discharged infants aged 29 to 56 days, 3‐day revisits for SBI, and costs per visit, which included hospitalization costs for admitted patients.
Data Analysis
We described continuous variables using median and interquartile range or range values and categorical variables using frequencies. We compared medians using Wilcoxon rank sum and categorical variables using a [2] test. We compared rates of testing, hospitalization, ceftriaxone use, and 3‐day revisits for SBI based on the presence of a CPG, and when present, the specific CPG recommendations. Costs per visit were compared between institutions with and without CPGs and assessed separately for admitted and discharged patients. To adjust for potential confounders and clustering of patients within hospitals, we used generalized estimating equations with logistic regression to generate adjusted odd ratios (aORs) and 95% confidence intervals (CIs). Models were adjusted for geographic region, payer, race, and gender. Statistical analyses were performed by using SAS version 9.3 (SAS Institute, Cary, NC). We determined statistical significance as a 2‐tailed P value <0.05.
Febrile infants with bronchiolitis or a history of prematurity may be managed differently from full‐term febrile young infants without bronchiolitis.[6, 27] Therefore, we performed a subgroup analysis after exclusion of infants with an ICD‐9 discharge diagnosis code for bronchiolitis (466.11 and 466.19)[28] or prematurity (765).
Because our study included ED encounters in 2013, we repeated our analyses after exclusion of hospitals with CPGs implemented during the 2013 calendar year.
RESULTS
CPG by Institution
Thirty‐three (89.2%) of the 37 EDs surveyed completed the questionnaire. Overall, 21 (63.6%) of the 33 EDs had a CPG; 15 (45.5%) had a CPG for all infants 56 days of age, 5 (15.2%) had a CPG for infants 28 days only, and 1 (3.0%) had a CPG for infants 29 to 56 days but not 28 days of age (Figure 1). Seventeen EDs had an established CPG prior to 2013, and 4 hospitals implemented a CPG during the 2013 calendar year, 2 with CPGs for neonates 28 days and 2 with CPGs for both 28 days and 29 to 56 days of age. Hospitals with CPGs were more likely to be located in the Northeast and West regions of the United States and provide care to a higher proportion of non‐Hispanic white patients, as well as those with commercial insurance (Table 1).
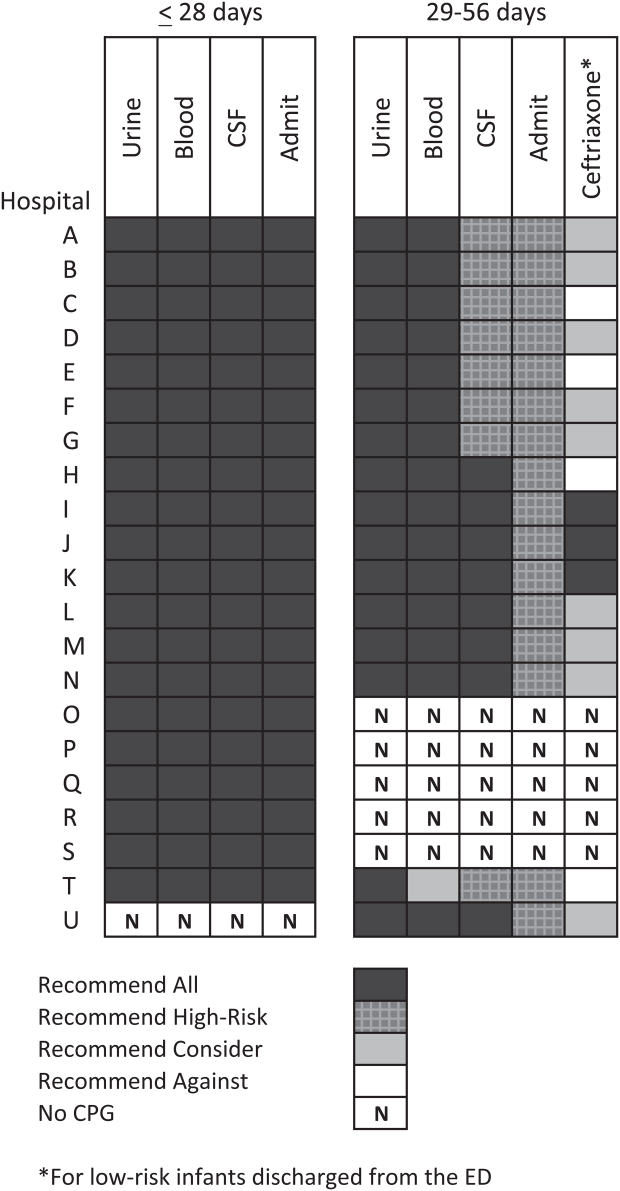
| Characteristic | 28 Days | 2956 Days | ||||
|---|---|---|---|---|---|---|
| No CPG, n=996, N (%) | CPG, n=2,149, N (%) | P Value | No CPG, n=2,460, N (%) | CPG, n=3,772, N (%) | P Value | |
| ||||||
| Race | ||||||
| Non‐Hispanic white | 325 (32.6) | 996 (46.3) | 867 (35.2) | 1,728 (45.8) | ||
| Non‐Hispanic black | 248 (24.9) | 381 (17.7) | 593 (24.1) | 670 (17.8) | ||
| Hispanic | 243 (24.4) | 531 (24.7) | 655 (26.6) | 986 (26.1) | ||
| Asian | 28 (2.8) | 78 (3.6) | 40 (1.6) | 122 (3.2) | ||
| Other Race | 152 (15.3) | 163 (7.6) | <0.001 | 305 (12.4) | 266 (7.1) | <0.001 |
| Gender | ||||||
| Female | 435 (43.7) | 926 (43.1) | 0.76 | 1,067 (43.4) | 1,714 (45.4) | 0.22 |
| Payer | ||||||
| Commercial | 243 (24.4) | 738 (34.3) | 554 (22.5) | 1,202 (31.9) | ||
| Government | 664 (66.7) | 1,269 (59.1) | 1,798 (73.1) | 2,342 (62.1) | ||
| Other payer | 89 (8.9) | 142 (6.6) | <0.001 | 108 (4.4) | 228 (6.0) | <0.001 |
| Region | ||||||
| Northeast | 39 (3.9) | 245 (11.4) | 77 (3.1) | 572 (15.2) | ||
| South | 648 (65.1) | 915 (42.6) | 1,662 (67.6) | 1,462 (38.8) | ||
| Midwest | 271 (27.2) | 462 (21.5) | 506 (20.6) | 851 (22.6) | ||
| West | 38 (3.8) | 527 (24.5) | <0.001 | 215 (8.7) | 887 (23.5) | <0.001 |
| Serious bacterial infection | ||||||
| Overall* | 131 (13.2) | 242 (11.3) | 0.14 | 191 (7.8) | 237 (6.3) | 0.03 |
| UTI/pyelonephritis | 73 (7.3) | 153 (7.1) | 103 (4.2) | 154 (4.1) | ||
| Bacteremia/sepsis | 56 (5.6) | 91 (4.2) | 78 (3.2) | 61 (1.6) | ||
| Bacterial meningitis | 15 (1.5) | 15 (0.7) | 4 (0.2) | 14 (0.4) | ||
| Age, d, median (IQR) | 18 (11, 24) | 18 (11, 23) | 0.67 | 46 (37, 53) | 45 (37, 53) | 0.11 |
All 20 CPGs for the febrile young infant 28 days of age recommended urine, blood, CSF testing, and hospitalization for all infants (Figure 1). Of the 16 hospitals with CPGs for febrile infants aged 29 to 56 days, all recommended urine and blood testing for all patients, except for 1 CPG, which recommended consideration of blood testing but not to obtain routinely. Hospitals varied in recommendations for CSF testing among infants aged 29 to 56 days: 8 (50%) recommended CSF testing in all patients and 8 (50%) recommended CSF testing only if the patient was high risk per defined criteria (based on history, physical examination, urine, and blood testing). In all 16 CPGs, hospitalization was recommended only for high‐risk infants. For low‐risk infants aged 2956 days being discharged from the ED, 3 hospitals recommended ceftriaxone for all, 9 recommended consideration of ceftriaxone, and 4 recommended against antibiotics (Figure 1).
Study Patients
During the study period, there were 10,415 infants 56 days old with a diagnosis of fever at the 33 participating hospitals. After exclusion of 635 (6.1%) infants with a complex chronic condition and 445 (4.3%) transferred from another institution (including 42 with a complex chronic condition), 9377 infants remained in our study cohort. Approximately one‐third of the cohort was 28 days of age and two‐thirds aged 29 to 56 days. The overall SBI rate was 8.5% but varied by age (11.9% in infants 28 days and 6.9% in infants 29 to 56 days of age) (Table 1).
CPGs and Use of Diagnostic Testing, Hospitalization Rates, Ceftriaxone Use, and Revisits for SBI
For infants 28 days of age, the presence of a CPG was not associated with urine, blood, CSF testing, or hospitalization after multivariable adjustment (Table 2). Among infants aged 29 to 56 days, urine testing did not differ based on the presence of a CPG, whereas blood testing was performed less often at the 1 hospital whose CPG recommended to consider, but not routinely obtain, testing (aOR: 0.4, 95% CI: 0.3‐0.7, P=0.001). Compared to hospitals without a CPG, CSF testing was performed less often at hospitals with CPG recommendations to only obtain CSF if high risk (aOR: 0.5, 95% CI: 0.3‐0.8, P=0.002). However, the odds of hospitalization did not differ at institutions with and without a febrile infant CPG (aOR: 0.7, 95% CI: 0.5‐1.1, P=0.10). For infants aged 29 to 56 days discharged from the ED, ceftriaxone was administered more often at hospitals with CPGs that recommended ceftriaxone for all discharged patients (aOR: 4.6, 95% CI: 2.39.3, P<0.001) and less often at hospitals whose CPGs recommended against antibiotics (aOR: 0.3, 95% CI: 0.1‐0.9, P=0.03) (Table 3). Our findings were similar in the subgroup of infants without bronchiolitis or prematurity (see Supporting Tables 1 and 2 in the online version of this article). After exclusion of hospitals with a CPG implemented during the 2013 calendar year (4 hospitals excluded in the 28 days age group and 2 hospitals excluded in the 29 to 56 days age group), infants aged 29 to 56 days cared for at a hospital with a CPG experienced a lower odds of hospitalization (aOR: 0.7, 95% CI: 0.4‐0.98, P=0.04). Otherwise, our findings in both age groups did not materially differ from the main analyses.
| Testing/Hospitalization | No. of Hospitals | No. of Patients | % Received* | aOR (95% CI) | P Value |
|---|---|---|---|---|---|
| |||||
| Laboratory testing | |||||
| Urine testing | |||||
| No CPG | 13 | 996 | 75.6 | Ref | |
| CPG: recommend for all | 20 | 2,149 | 80.7 | 1.2 (0.9‐1.7) | 0.22 |
| Blood testing | |||||
| No CPG | 13 | 996 | 76.9 | Ref | |
| CPG: recommend for all | 20 | 2,149 | 81.8 | 1.2 (0.9‐1.7) | 0.25 |
| CSF testing‖ | |||||
| No CPG | 13 | 996 | 71.0 | Ref | |
| CPG: recommend for all | 20 | 2,149 | 77.5 | 1.3 (1.01.7) | 0.08 |
| Disposition | |||||
| Hospitalization | |||||
| No CPG | 13 | 996 | 75.4 | Ref | |
| CPG: recommend for all | 20 | 2,149 | 81.6 | 1.2 (0.9‐1.8) | 0.26 |
| Testing/Hospitalization | No. of Hospitals | No. of Patients | % Received* | aOR (95% CI) | P Value |
|---|---|---|---|---|---|
| |||||
| Laboratory resting | |||||
| Urine testing | |||||
| No CPG | 17 | 2,460 | 81.1 | Ref | |
| CPG: recommend for all | 16 | 3,772 | 82.1 | 0.9 (0.7‐1.4) | 0.76 |
| Blood testing | |||||
| No CPG | 17 | 2,460 | 79.4 | Ref | |
| CPG: recommend for all | 15 | 3,628 | 82.6 | 1.1 (0.7‐1.6) | 0.70 |
| CPG: recommend consider | 1 | 144 | 62.5 | 0.4 (0.3‐0.7) | 0.001 |
| CSF testing‖ | |||||
| No CPG | 17 | 2,460 | 46.3 | Ref | |
| CPG: recommend for all | 8 | 1,517 | 70.3 | 1.3 (0.9‐1.9) | 0.11 |
| CPG: recommend if high‐risk | 8 | 2,255 | 39.9 | 0.5 (0.3‐0.8) | 0.002 |
| Disposition | |||||
| Hospitalization | |||||
| No CPG | 17 | 2,460 | 47.0 | Ref | |
| CPG: recommend if high‐risk | 16 | 3,772 | 42.0 | 0.7 (0.5‐1.1) | 0.10 |
| Ceftriaxone if discharged | |||||
| No CPG | 17 | 1,304 | 11.7 | Ref | |
| CPG: recommend against | 4 | 313 | 10.9 | 0.3 (0.1‐0.9) | 0.03 |
| CPG: recommend consider | 9 | 1,567 | 14.4 | 1.5 (0.9‐2.4) | 0.09 |
| CPG: recommend for all | 3 | 306 | 64.1 | 4.6 (2.39.3) | < 0.001 |
Three‐day revisits for SBI were similarly low at hospitals with and without CPGs among infants 28 days (1.5% vs 0.8%, P=0.44) and 29 to 56 days of age (1.4% vs 1.1%, P=0.44) and did not differ after exclusion of hospitals with a CPG implemented in 2013.
CPGs and Costs
Among infants 28 days of age, costs per visit did not differ for admitted and discharged patients based on CPG presence. The presence of an ED febrile infant CPG was associated with higher costs for both admitted and discharged infants 29 to 56 days of age (Table 4). The cost analysis did not significantly differ after exclusion of hospitals with CPGs implemented in 2013.
| 28 Days, Cost, Median (IQR) | 29 to 56 Days, Cost, Median (IQR) | |||||
|---|---|---|---|---|---|---|
| No CPG | CPG | P Value | No CPG | CPG | P Value | |
| ||||||
| Admitted | $4,979 ($3,408$6,607) [n=751] | $4,715 ($3,472$6,526) [n=1,753] | 0.79 | $3,756 ($2,725$5,041) [n=1,156] | $3,923 ($3,077$5,243) [n=1,586] | <0.001 |
| Discharged | $298 ($166$510) [n=245] | $231 ($160$464) [n=396] | 0.10 | $681($398$982) [n=1,304)] | $764 ($412$1,100) [n=2,186] | <0.001 |
DISCUSSION
We described the content and association of CPGs with management of the febrile infant 56 days of age across a large sample of children's hospitals. Nearly two‐thirds of included pediatric EDs have a CPG for the management of young febrile infants. Management of febrile infants 28 days was uniform, with a majority hospitalized after urine, blood, and CSF testing regardless of the presence of a CPG. In contrast, CPGs for infants 29 to 56 days of age varied in their recommendations for CSF testing as well as ceftriaxone use for infants discharged from the ED. Consequently, we observed considerable hospital variability in CSF testing and ceftriaxone use for discharged infants, which correlates with variation in the presence and content of CPGs. Institutional CPGs may be a source of the across‐hospital variation in care of febrile young infants observed in prior study.[9]
Febrile infants 28 days of age are at particularly high risk for SBI, with a prevalence of nearly 20% or higher.[2, 3, 29] The high prevalence of SBI, combined with the inherent difficulty in distinguishing neonates with and without SBI,[2, 30] has resulted in uniform CPG recommendations to perform the full‐sepsis workup in this young age group. Similar to prior studies,[8, 9] we observed that most febrile infants 28 days undergo the full sepsis evaluation, including CSF testing, and are hospitalized regardless of the presence of a CPG.
However, given the conflicting recommendations for febrile infants 29 to 56 days of age,[4, 5, 6] the optimal management strategy is less certain.[7] The Rochester, Philadelphia, and Boston criteria, 3 published models to identify infants at low risk for SBI, primarily differ in their recommendations for CSF testing and ceftriaxone use in this age group.[4, 5, 6] Half of the CPGs recommended CSF testing for all febrile infants, and half recommended CSF testing only if the infant was high risk. Institutional guidelines that recommended selective CSF testing for febrile infants aged 29 to 56 days were associated with lower rates of CSF testing. Furthermore, ceftriaxone use varied based on CPG recommendations for low‐risk infants discharged from the ED. Therefore, the influence of febrile infant CPGs mainly relates to the limiting of CSF testing and targeted ceftriaxone use in low‐risk infants. As the rate of return visits for SBI is low across hospitals, future study should assess outcomes at hospitals with CPGs recommending selective CSF testing. Of note, infants 29 to 56 days of age were less likely to be hospitalized when cared for at a hospital with an established CPG prior to 2013 without increase in 3‐day revisits for SBI. This finding may indicate that longer duration of CPG implementation is associated with lower rates of hospitalization for low‐risk infants; this finding merits further study.
The presence of a CPG was not associated with lower costs for febrile infants in either age group. Although individual healthcare systems have achieved lower costs with CPG implementation,[12] the mere presence of a CPG is not associated with lower costs when assessed across institutions. Higher costs for admitted and discharged infants 29 to 56 days of age in the presence of a CPG likely reflects the higher rate of CSF testing at hospitals whose CPGs recommend testing for all febrile infants, as well as inpatient management strategies for hospitalized infants not captured in our study. Future investigation should include an assessment of the cost‐effectiveness of the various testing and treatment strategies employed for the febrile young infant.
Our study has several limitations. First, the validity of ICD‐9 diagnosis codes for identifying young infants with fever is not well established, and thus our study is subject to misclassification bias. To minimize missed patients, we included infants with either an ICD‐9 admission or discharge diagnosis of fever; however, utilization of diagnosis codes for patient identification may have resulted in undercapture of infants with a measured temperature of 38.0C. It is also possible that some patients who did not undergo testing were misclassified as having a fever or had temperatures below standard thresholds to prompt diagnostic testing. This is a potential reason that testing was not performed in 100% of infants, even at hospitals with CPGs that recommended testing for all patients. Additionally, some febrile infants diagnosed with SBI may not have an associated ICD‐9 diagnosis code for fever. Although the overall SBI rate observed in our study was similar to prior studies,[4, 31] the rate in neonates 28 days of age was lower than reported in recent investigations,[2, 3] which may indicate inclusion of a higher proportion of low‐risk febrile infants. With the exception of bronchiolitis, we also did not assess diagnostic testing in the presence of other identified sources of infection such as herpes simplex virus.
Second, we were unable to assess the presence or absence of a CPG at the 4 excluded EDs that did not respond to the survey or the institutions excluded for data‐quality issues. However, included and excluded hospitals did not differ in region or annual ED volume (data not shown).
Third, although we classified hospitals based upon the presence and content of CPGs, we were unable to fully evaluate adherence to the CPG at each site.
Last, though PHIS hospitals represent 85% of freestanding children's hospitals, many febrile infants are hospitalized at non‐PHIS institutions; our results may not be generalizable to care provided at nonchildren's hospitals.
CONCLUSIONS
Management of febrile neonates 28 days of age does not vary based on CPG presence. However, CPGs for the febrile infant aged 29 to 56 days vary in recommendations for CSF testing as well as ceftriaxone use for low‐risk patients, which significantly contributes to practice variation and healthcare costs across institutions.
Acknowledgements
The Febrile Young Infant Research Collaborative includes the following additional investigators who are acknowledged for their work on this study: Kao‐Ping Chua, MD, Harvard PhD Program in Health Policy, Harvard University, Cambridge, Massachusetts, and Division of Emergency Medicine, Department of Pediatrics, Boston Children's Hospital, Boston, Massachusetts; Elana A. Feldman, BA, University of Washington School of Medicine, Seattle, Washington; and Katie L. Hayes, BS, Division of Emergency Medicine, Department of Pediatrics, The Children's Hospital of Philadelphia, Philadelphia, Pennsylvania.
Disclosures
This project was funded in part by The Gerber Foundation Novice Researcher Award (Ref #18273835). Dr. Fran Balamuth received career development support from the National Institutes of Health (NHLBI K12‐HL109009). Funders were not involved in design or conduct of the study; collection, management, analysis, or interpretation of the data; preparation, review, or approval of the manuscript. The authors have no financial relationships relevant to this article to disclose. No payment was received for the production of this article. The authors have no conflicts of interest relevant to this article to disclose.
- , , . Performance of low‐risk criteria in the evaluation of young infants with fever: review of the literature. Pediatrics. 2010;125:228–233.
- , , , , , . A week‐by‐week analysis of the low‐risk criteria for serious bacterial infection in febrile neonates. Arch Dis Child. 2009;94:287–292.
- , , , et al. Is 15 days an appropriate cut‐off age for considering serious bacterial infection in the management of febrile infants? Pediatr Infect Dis J. 2012;31:455–458.
- , , . Outpatient management without antibiotics of fever in selected infants. N Engl J Med. 1993;329:1437–1441.
- , , . Identifying febrile infants at risk for a serious bacterial infection. J Pediatr. 1993;123:489–490.
- , , , et al. Febrile infants at low risk for serious bacterial infection—an appraisal of the Rochester criteria and implications for management. Febrile Infant Collaborative Study Group. Pediatrics. 1994;94:390–396.
- American College of Emergency Physicians Clinical Policies Committee; American College of Emergency Physicians Clinical Policies Subcommittee on Pediatric Fever. Clinical policy for children younger than three years presenting to the emergency department with fever. Ann Emerg Med. 2003;42:530–545.
- , , , et al. Management of febrile neonates in US pediatric emergency departments. Pediatrics. 2014;133:187–195.
- , , , et al. Variation in care of the febrile young infant <90 days in US pediatric emergency departments. Pediatrics. 2014;134:667–677.
- , , , , . Fever survey highlights significant variations in how infants aged ≤60 days are evaluated and underline the need for guidelines. Acta Paediatr. 2014;103:379–385.
- . Evidence‐based guidelines and critical pathways for quality improvement. Pediatrics. 1999;103:225–232.
- , , , et al. Costs and infant outcomes after implementation of a care process model for febrile infants. Pediatrics. 2012;130:e16–e24.
- , , , , , . Research electronic data capture (REDCap)—a metadata‐driven methodology and workflow process for providing translational research informatics support. J Biomed Inform. 2009;42:377–381.
- , , , , , . Variation in occult injury screening for children with suspected abuse in selected US children's hospitals. Pediatrics. 2012;130:853–860.
- . Achieving data quality. How data from a pediatric health information system earns the trust of its users. J AHIMA. 2004;75:22–26.
- , , , . Corticosteroids and mortality in children with bacterial meningitis. JAMA. 2008;299:2048–2055.
- , , , et al. Variation in resource utilization across a national sample of pediatric emergency departments. J Pediatr. 2013;163:230–236.
- , , , , , . Deaths attributed to pediatric complex chronic conditions: national trends and implications for supportive care services. Pediatrics. 2001;107:E99.
- US Census Bureau. Geographic terms and concepts—census divisions and census regions. Available at: https://www.census.gov/geo/reference/gtc/gtc_census_divreg.html. Accessed September 10, 2014.
- , , , et al. Pediatric observation status: are we overlooking a growing population in children's hospitals? J Hosp Med. 2012;7:530–536.
- , , , et al. Differences in designations of observation care in US freestanding children's hospitals: are they virtual or real? J Hosp Med. 2012;7:287–293.
- , , , et al. Accuracy of administrative billing codes to detect urinary tract infection hospitalizations. Pediatrics. 2011;128:323–330.
- , , , et al. Identifying pediatric community‐acquired pneumonia hospitalizations: accuracy of administrative billing codes. JAMA Pediatr. 2013;167:851–858.
- , , , . Initial emergency department diagnosis and return visits: risk versus perception. Ann Emerg Med. 1998;32:569–573.
- , , , , . A national depiction of children with return visits to the emergency department within 72 hours, 2001–2007. Pediatr Emerg Care. 2012;28:606–610.
- Healthcare Cost and Utilization Project. Cost‐to‐charge ratio files. Available at: http://www.hcup‐us.ahrq.gov/db/state/costtocharge.jsp. Accessed September 11, 2014.
- , , , et al. Risk of serious bacterial infection in young febrile infants with respiratory syncytial virus infections. Pediatrics. 2004;113:1728–1734.
- , , , et al. Establishing benchmarks for the hospitalized care of children with asthma, bronchiolitis, and pneumonia. Pediatrics. 2014;134:555–562.
- , , , , , . Well appearing young infants with fever without known source in the emergency department: are lumbar punctures always necessary? Eur J Emerg Med. 2010;17:167–169.
- , . Unpredictability of serious bacterial illness in febrile infants from birth to 1 month of age. Arch Pediatr Adolesc Med. 1999;153:508–511.
- , , , et al. Management and outcomes of care of fever in early infancy. JAMA. 2004;291:1203–1212.
Febrile young infants are at high risk for serious bacterial infection (SBI) with reported rates of 8.5% to 12%, even higher in neonates 28 days of age.[1, 2, 3] As a result, febrile infants often undergo extensive diagnostic evaluation consisting of a combination of urine, blood, and cerebrospinal fluid (CSF) testing.[4, 5, 6] Several clinical prediction algorithms use this diagnostic testing to identify febrile infants at low risk for SBI, but they differ with respect to age range, recommended testing, antibiotic administration, and threshold for hospitalization.[4, 5, 6] Additionally, the optimal management strategy for this population has not been defined.[7] Consequently, laboratory testing, antibiotic use, and hospitalization for febrile young infants vary widely among hospitals.[8, 9, 10]
Clinical practice guidelines (CPGs) are designed to implement evidence‐based care and reduce practice variability, with the goal of improving quality of care and optimizing costs.[11] Implementation of a CPG for management of febrile young infants in the Intermountain Healthcare System was associated with greater adherence to evidence‐based care and lower costs.[12] However, when strong evidence is lacking, different interpretations of febrile infant risk classification incorporated into local CPGs may be a major driver of the across‐hospital practice variation observed in prior studies.[8, 9] Understanding sources of variability as well as determining the association of CPGs with clinicians' practice patterns can help identify quality improvement opportunities, either through national benchmarking or local efforts.
Our primary objectives were to compare (1) recommendations of pediatric emergency departmentbased institutional CPGs for febrile young infants and (2) rates of urine, blood, CSF testing, hospitalization, and ceftriaxone use at emergency department (ED) discharge based upon CPG presence and the specific CPG recommendations. Our secondary objectives were to describe the association of CPGs with healthcare costs and return visits for SBI.
METHODS
Study Design
We used the Pediatric Health Information System (PHIS) to identify febrile infants 56 days of age who presented to the ED between January 1, 2013 and December 31, 2013. We also surveyed ED providers at participating PHIS hospitals. Informed consent was obtained from survey respondents. The institutional review board at Boston Children's Hospital approved the study protocol.
Clinical Practice Guideline Survey
We sent an electronic survey to medical directors or division directors at 37 pediatric EDs to determine whether their ED utilized a CPG for the management of the febrile young infant in 2013. If no response was received after the second attempt, we queried ED fellowship directors or other ED attending physicians at nonresponding hospitals. Survey items included the presence of a febrile young infant CPG, and if present, the year of implementation, ages targeted, and CPG content. As applicable, respondents were asked to share their CPG and/or provide the specific CPG recommendations.
We collected and managed survey data using the Research Electronic Data Capture (REDCap) electronic data capture tools hosted at Boston Children's Hospital. REDCap is a secure, Web‐based application designed to support data capture for research studies.[13]
Data Source
The PHIS database contains administrative data from 44 US children's hospitals. These hospitals, affiliated with the Children's Hospital Association, represent 85% of freestanding US children's hospitals.[14] Encrypted patient identifiers permit tracking of patients across encounters.[15] Data quality and integrity are assured jointly by the Children's Hospital Association and participating hospitals.[16] For this study, 7 hospitals were excluded due to incomplete ED data or known data‐quality issues.[17]
Patients
We identified study infants using the following International Classification of Diseases, 9th Revision (ICD‐9) admission or discharge diagnosis codes for fever as defined previously[8, 9]: 780.6, 778.4, 780.60, or 780.61. We excluded infants with a complex chronic condition[18] and those transferred from another institution, as these infants may warrant a nonstandard evaluation and/or may have incomplete data. For infants with >1 ED visit for fever during the study period, repeat visits within 3 days of an index visit were considered a revisit for the same episode of illness; visits >3 days following an index visit were considered as a new index visit.
Study Definitions
From the PHIS database, we abstracted demographic characteristics (gender, race/ethnicity), insurance status, and region where the hospital was located (using US Census categories[19]). Billing codes were used to assess whether urine, blood, and CSF testing (as defined previously[9]) were performed during the ED evaluation. To account for ED visits that spanned the midnight hour, for hospitalized patients we considered any testing or treatment occurring on the initial or second hospital day to be performed in the ED; billing code data in PHIS are based upon calendar day and do not distinguish testing performed in the ED versus inpatient setting.[8, 9] Patients billed for observation care were classified as being hospitalized.[20, 21]
We identified the presence of an SBI using ICD‐9 diagnosis codes for the following infections as described previously[9]: urinary tract infection or pyelonephritis,[22] bacteremia or sepsis, bacterial meningitis,[16] pneumonia,[23] or bacterial enteritis. To assess return visits for SBI that required inpatient management, we defined an ED revisit for an SBI as a return visit within 3 days of ED discharge[24, 25] that resulted in hospitalization with an associated ICD‐9 discharge diagnosis code for an SBI.
Hospitals charges in PHIS database were adjusted for hospital location by using the Centers for Medicare and Medicaid Services price/wage index. Costs were estimated by applying hospital‐level cost‐to‐charge ratios to charge data.[26]
Measured Exposures
The primary exposure was the presence of an ED‐based CPG for management of the febrile young infant aged 28 days and 29 to 56 days; 56 days was used as the upper age limit as all of the CPGs included infants up to this age or beyond. Six institutions utilized CPGs with different thresholds to define the age categories (eg, dichotomized at 27 or 30 days); these CPGs were classified into the aforementioned age groups to permit comparisons across standardized age groups. We classified institutions based on the presence of a CPG. To assess differences in the application of low‐risk criteria, the CPGs were further classified a priori based upon specific recommendations around laboratory testing and hospitalization, as well as ceftriaxone use for infants aged 29 to 56 days discharged from the ED. CPGs were categorized based upon whether testing, hospitalization, and ceftriaxone use were: (1) recommended for all patients, (2) recommended only if patients were classified as high risk (absence of low‐risk criteria), (3) recommended against, or (4) recommended to consider at clinician discretion.
Outcome Measures
Measured outcomes were performance of urine, blood, CSF testing, and hospitalization rate, as well as rate of ceftriaxone use for discharged infants aged 29 to 56 days, 3‐day revisits for SBI, and costs per visit, which included hospitalization costs for admitted patients.
Data Analysis
We described continuous variables using median and interquartile range or range values and categorical variables using frequencies. We compared medians using Wilcoxon rank sum and categorical variables using a [2] test. We compared rates of testing, hospitalization, ceftriaxone use, and 3‐day revisits for SBI based on the presence of a CPG, and when present, the specific CPG recommendations. Costs per visit were compared between institutions with and without CPGs and assessed separately for admitted and discharged patients. To adjust for potential confounders and clustering of patients within hospitals, we used generalized estimating equations with logistic regression to generate adjusted odd ratios (aORs) and 95% confidence intervals (CIs). Models were adjusted for geographic region, payer, race, and gender. Statistical analyses were performed by using SAS version 9.3 (SAS Institute, Cary, NC). We determined statistical significance as a 2‐tailed P value <0.05.
Febrile infants with bronchiolitis or a history of prematurity may be managed differently from full‐term febrile young infants without bronchiolitis.[6, 27] Therefore, we performed a subgroup analysis after exclusion of infants with an ICD‐9 discharge diagnosis code for bronchiolitis (466.11 and 466.19)[28] or prematurity (765).
Because our study included ED encounters in 2013, we repeated our analyses after exclusion of hospitals with CPGs implemented during the 2013 calendar year.
RESULTS
CPG by Institution
Thirty‐three (89.2%) of the 37 EDs surveyed completed the questionnaire. Overall, 21 (63.6%) of the 33 EDs had a CPG; 15 (45.5%) had a CPG for all infants 56 days of age, 5 (15.2%) had a CPG for infants 28 days only, and 1 (3.0%) had a CPG for infants 29 to 56 days but not 28 days of age (Figure 1). Seventeen EDs had an established CPG prior to 2013, and 4 hospitals implemented a CPG during the 2013 calendar year, 2 with CPGs for neonates 28 days and 2 with CPGs for both 28 days and 29 to 56 days of age. Hospitals with CPGs were more likely to be located in the Northeast and West regions of the United States and provide care to a higher proportion of non‐Hispanic white patients, as well as those with commercial insurance (Table 1).
| Characteristic | 28 Days | 2956 Days | ||||
|---|---|---|---|---|---|---|
| No CPG, n=996, N (%) | CPG, n=2,149, N (%) | P Value | No CPG, n=2,460, N (%) | CPG, n=3,772, N (%) | P Value | |
| ||||||
| Race | ||||||
| Non‐Hispanic white | 325 (32.6) | 996 (46.3) | 867 (35.2) | 1,728 (45.8) | ||
| Non‐Hispanic black | 248 (24.9) | 381 (17.7) | 593 (24.1) | 670 (17.8) | ||
| Hispanic | 243 (24.4) | 531 (24.7) | 655 (26.6) | 986 (26.1) | ||
| Asian | 28 (2.8) | 78 (3.6) | 40 (1.6) | 122 (3.2) | ||
| Other Race | 152 (15.3) | 163 (7.6) | <0.001 | 305 (12.4) | 266 (7.1) | <0.001 |
| Gender | ||||||
| Female | 435 (43.7) | 926 (43.1) | 0.76 | 1,067 (43.4) | 1,714 (45.4) | 0.22 |
| Payer | ||||||
| Commercial | 243 (24.4) | 738 (34.3) | 554 (22.5) | 1,202 (31.9) | ||
| Government | 664 (66.7) | 1,269 (59.1) | 1,798 (73.1) | 2,342 (62.1) | ||
| Other payer | 89 (8.9) | 142 (6.6) | <0.001 | 108 (4.4) | 228 (6.0) | <0.001 |
| Region | ||||||
| Northeast | 39 (3.9) | 245 (11.4) | 77 (3.1) | 572 (15.2) | ||
| South | 648 (65.1) | 915 (42.6) | 1,662 (67.6) | 1,462 (38.8) | ||
| Midwest | 271 (27.2) | 462 (21.5) | 506 (20.6) | 851 (22.6) | ||
| West | 38 (3.8) | 527 (24.5) | <0.001 | 215 (8.7) | 887 (23.5) | <0.001 |
| Serious bacterial infection | ||||||
| Overall* | 131 (13.2) | 242 (11.3) | 0.14 | 191 (7.8) | 237 (6.3) | 0.03 |
| UTI/pyelonephritis | 73 (7.3) | 153 (7.1) | 103 (4.2) | 154 (4.1) | ||
| Bacteremia/sepsis | 56 (5.6) | 91 (4.2) | 78 (3.2) | 61 (1.6) | ||
| Bacterial meningitis | 15 (1.5) | 15 (0.7) | 4 (0.2) | 14 (0.4) | ||
| Age, d, median (IQR) | 18 (11, 24) | 18 (11, 23) | 0.67 | 46 (37, 53) | 45 (37, 53) | 0.11 |
All 20 CPGs for the febrile young infant 28 days of age recommended urine, blood, CSF testing, and hospitalization for all infants (Figure 1). Of the 16 hospitals with CPGs for febrile infants aged 29 to 56 days, all recommended urine and blood testing for all patients, except for 1 CPG, which recommended consideration of blood testing but not to obtain routinely. Hospitals varied in recommendations for CSF testing among infants aged 29 to 56 days: 8 (50%) recommended CSF testing in all patients and 8 (50%) recommended CSF testing only if the patient was high risk per defined criteria (based on history, physical examination, urine, and blood testing). In all 16 CPGs, hospitalization was recommended only for high‐risk infants. For low‐risk infants aged 2956 days being discharged from the ED, 3 hospitals recommended ceftriaxone for all, 9 recommended consideration of ceftriaxone, and 4 recommended against antibiotics (Figure 1).
Study Patients
During the study period, there were 10,415 infants 56 days old with a diagnosis of fever at the 33 participating hospitals. After exclusion of 635 (6.1%) infants with a complex chronic condition and 445 (4.3%) transferred from another institution (including 42 with a complex chronic condition), 9377 infants remained in our study cohort. Approximately one‐third of the cohort was 28 days of age and two‐thirds aged 29 to 56 days. The overall SBI rate was 8.5% but varied by age (11.9% in infants 28 days and 6.9% in infants 29 to 56 days of age) (Table 1).
CPGs and Use of Diagnostic Testing, Hospitalization Rates, Ceftriaxone Use, and Revisits for SBI
For infants 28 days of age, the presence of a CPG was not associated with urine, blood, CSF testing, or hospitalization after multivariable adjustment (Table 2). Among infants aged 29 to 56 days, urine testing did not differ based on the presence of a CPG, whereas blood testing was performed less often at the 1 hospital whose CPG recommended to consider, but not routinely obtain, testing (aOR: 0.4, 95% CI: 0.3‐0.7, P=0.001). Compared to hospitals without a CPG, CSF testing was performed less often at hospitals with CPG recommendations to only obtain CSF if high risk (aOR: 0.5, 95% CI: 0.3‐0.8, P=0.002). However, the odds of hospitalization did not differ at institutions with and without a febrile infant CPG (aOR: 0.7, 95% CI: 0.5‐1.1, P=0.10). For infants aged 29 to 56 days discharged from the ED, ceftriaxone was administered more often at hospitals with CPGs that recommended ceftriaxone for all discharged patients (aOR: 4.6, 95% CI: 2.39.3, P<0.001) and less often at hospitals whose CPGs recommended against antibiotics (aOR: 0.3, 95% CI: 0.1‐0.9, P=0.03) (Table 3). Our findings were similar in the subgroup of infants without bronchiolitis or prematurity (see Supporting Tables 1 and 2 in the online version of this article). After exclusion of hospitals with a CPG implemented during the 2013 calendar year (4 hospitals excluded in the 28 days age group and 2 hospitals excluded in the 29 to 56 days age group), infants aged 29 to 56 days cared for at a hospital with a CPG experienced a lower odds of hospitalization (aOR: 0.7, 95% CI: 0.4‐0.98, P=0.04). Otherwise, our findings in both age groups did not materially differ from the main analyses.
| Testing/Hospitalization | No. of Hospitals | No. of Patients | % Received* | aOR (95% CI) | P Value |
|---|---|---|---|---|---|
| |||||
| Laboratory testing | |||||
| Urine testing | |||||
| No CPG | 13 | 996 | 75.6 | Ref | |
| CPG: recommend for all | 20 | 2,149 | 80.7 | 1.2 (0.9‐1.7) | 0.22 |
| Blood testing | |||||
| No CPG | 13 | 996 | 76.9 | Ref | |
| CPG: recommend for all | 20 | 2,149 | 81.8 | 1.2 (0.9‐1.7) | 0.25 |
| CSF testing‖ | |||||
| No CPG | 13 | 996 | 71.0 | Ref | |
| CPG: recommend for all | 20 | 2,149 | 77.5 | 1.3 (1.01.7) | 0.08 |
| Disposition | |||||
| Hospitalization | |||||
| No CPG | 13 | 996 | 75.4 | Ref | |
| CPG: recommend for all | 20 | 2,149 | 81.6 | 1.2 (0.9‐1.8) | 0.26 |
| Testing/Hospitalization | No. of Hospitals | No. of Patients | % Received* | aOR (95% CI) | P Value |
|---|---|---|---|---|---|
| |||||
| Laboratory resting | |||||
| Urine testing | |||||
| No CPG | 17 | 2,460 | 81.1 | Ref | |
| CPG: recommend for all | 16 | 3,772 | 82.1 | 0.9 (0.7‐1.4) | 0.76 |
| Blood testing | |||||
| No CPG | 17 | 2,460 | 79.4 | Ref | |
| CPG: recommend for all | 15 | 3,628 | 82.6 | 1.1 (0.7‐1.6) | 0.70 |
| CPG: recommend consider | 1 | 144 | 62.5 | 0.4 (0.3‐0.7) | 0.001 |
| CSF testing‖ | |||||
| No CPG | 17 | 2,460 | 46.3 | Ref | |
| CPG: recommend for all | 8 | 1,517 | 70.3 | 1.3 (0.9‐1.9) | 0.11 |
| CPG: recommend if high‐risk | 8 | 2,255 | 39.9 | 0.5 (0.3‐0.8) | 0.002 |
| Disposition | |||||
| Hospitalization | |||||
| No CPG | 17 | 2,460 | 47.0 | Ref | |
| CPG: recommend if high‐risk | 16 | 3,772 | 42.0 | 0.7 (0.5‐1.1) | 0.10 |
| Ceftriaxone if discharged | |||||
| No CPG | 17 | 1,304 | 11.7 | Ref | |
| CPG: recommend against | 4 | 313 | 10.9 | 0.3 (0.1‐0.9) | 0.03 |
| CPG: recommend consider | 9 | 1,567 | 14.4 | 1.5 (0.9‐2.4) | 0.09 |
| CPG: recommend for all | 3 | 306 | 64.1 | 4.6 (2.39.3) | < 0.001 |
Three‐day revisits for SBI were similarly low at hospitals with and without CPGs among infants 28 days (1.5% vs 0.8%, P=0.44) and 29 to 56 days of age (1.4% vs 1.1%, P=0.44) and did not differ after exclusion of hospitals with a CPG implemented in 2013.
CPGs and Costs
Among infants 28 days of age, costs per visit did not differ for admitted and discharged patients based on CPG presence. The presence of an ED febrile infant CPG was associated with higher costs for both admitted and discharged infants 29 to 56 days of age (Table 4). The cost analysis did not significantly differ after exclusion of hospitals with CPGs implemented in 2013.
| 28 Days, Cost, Median (IQR) | 29 to 56 Days, Cost, Median (IQR) | |||||
|---|---|---|---|---|---|---|
| No CPG | CPG | P Value | No CPG | CPG | P Value | |
| ||||||
| Admitted | $4,979 ($3,408$6,607) [n=751] | $4,715 ($3,472$6,526) [n=1,753] | 0.79 | $3,756 ($2,725$5,041) [n=1,156] | $3,923 ($3,077$5,243) [n=1,586] | <0.001 |
| Discharged | $298 ($166$510) [n=245] | $231 ($160$464) [n=396] | 0.10 | $681($398$982) [n=1,304)] | $764 ($412$1,100) [n=2,186] | <0.001 |
DISCUSSION
We described the content and association of CPGs with management of the febrile infant 56 days of age across a large sample of children's hospitals. Nearly two‐thirds of included pediatric EDs have a CPG for the management of young febrile infants. Management of febrile infants 28 days was uniform, with a majority hospitalized after urine, blood, and CSF testing regardless of the presence of a CPG. In contrast, CPGs for infants 29 to 56 days of age varied in their recommendations for CSF testing as well as ceftriaxone use for infants discharged from the ED. Consequently, we observed considerable hospital variability in CSF testing and ceftriaxone use for discharged infants, which correlates with variation in the presence and content of CPGs. Institutional CPGs may be a source of the across‐hospital variation in care of febrile young infants observed in prior study.[9]
Febrile infants 28 days of age are at particularly high risk for SBI, with a prevalence of nearly 20% or higher.[2, 3, 29] The high prevalence of SBI, combined with the inherent difficulty in distinguishing neonates with and without SBI,[2, 30] has resulted in uniform CPG recommendations to perform the full‐sepsis workup in this young age group. Similar to prior studies,[8, 9] we observed that most febrile infants 28 days undergo the full sepsis evaluation, including CSF testing, and are hospitalized regardless of the presence of a CPG.
However, given the conflicting recommendations for febrile infants 29 to 56 days of age,[4, 5, 6] the optimal management strategy is less certain.[7] The Rochester, Philadelphia, and Boston criteria, 3 published models to identify infants at low risk for SBI, primarily differ in their recommendations for CSF testing and ceftriaxone use in this age group.[4, 5, 6] Half of the CPGs recommended CSF testing for all febrile infants, and half recommended CSF testing only if the infant was high risk. Institutional guidelines that recommended selective CSF testing for febrile infants aged 29 to 56 days were associated with lower rates of CSF testing. Furthermore, ceftriaxone use varied based on CPG recommendations for low‐risk infants discharged from the ED. Therefore, the influence of febrile infant CPGs mainly relates to the limiting of CSF testing and targeted ceftriaxone use in low‐risk infants. As the rate of return visits for SBI is low across hospitals, future study should assess outcomes at hospitals with CPGs recommending selective CSF testing. Of note, infants 29 to 56 days of age were less likely to be hospitalized when cared for at a hospital with an established CPG prior to 2013 without increase in 3‐day revisits for SBI. This finding may indicate that longer duration of CPG implementation is associated with lower rates of hospitalization for low‐risk infants; this finding merits further study.
The presence of a CPG was not associated with lower costs for febrile infants in either age group. Although individual healthcare systems have achieved lower costs with CPG implementation,[12] the mere presence of a CPG is not associated with lower costs when assessed across institutions. Higher costs for admitted and discharged infants 29 to 56 days of age in the presence of a CPG likely reflects the higher rate of CSF testing at hospitals whose CPGs recommend testing for all febrile infants, as well as inpatient management strategies for hospitalized infants not captured in our study. Future investigation should include an assessment of the cost‐effectiveness of the various testing and treatment strategies employed for the febrile young infant.
Our study has several limitations. First, the validity of ICD‐9 diagnosis codes for identifying young infants with fever is not well established, and thus our study is subject to misclassification bias. To minimize missed patients, we included infants with either an ICD‐9 admission or discharge diagnosis of fever; however, utilization of diagnosis codes for patient identification may have resulted in undercapture of infants with a measured temperature of 38.0C. It is also possible that some patients who did not undergo testing were misclassified as having a fever or had temperatures below standard thresholds to prompt diagnostic testing. This is a potential reason that testing was not performed in 100% of infants, even at hospitals with CPGs that recommended testing for all patients. Additionally, some febrile infants diagnosed with SBI may not have an associated ICD‐9 diagnosis code for fever. Although the overall SBI rate observed in our study was similar to prior studies,[4, 31] the rate in neonates 28 days of age was lower than reported in recent investigations,[2, 3] which may indicate inclusion of a higher proportion of low‐risk febrile infants. With the exception of bronchiolitis, we also did not assess diagnostic testing in the presence of other identified sources of infection such as herpes simplex virus.
Second, we were unable to assess the presence or absence of a CPG at the 4 excluded EDs that did not respond to the survey or the institutions excluded for data‐quality issues. However, included and excluded hospitals did not differ in region or annual ED volume (data not shown).
Third, although we classified hospitals based upon the presence and content of CPGs, we were unable to fully evaluate adherence to the CPG at each site.
Last, though PHIS hospitals represent 85% of freestanding children's hospitals, many febrile infants are hospitalized at non‐PHIS institutions; our results may not be generalizable to care provided at nonchildren's hospitals.
CONCLUSIONS
Management of febrile neonates 28 days of age does not vary based on CPG presence. However, CPGs for the febrile infant aged 29 to 56 days vary in recommendations for CSF testing as well as ceftriaxone use for low‐risk patients, which significantly contributes to practice variation and healthcare costs across institutions.
Acknowledgements
The Febrile Young Infant Research Collaborative includes the following additional investigators who are acknowledged for their work on this study: Kao‐Ping Chua, MD, Harvard PhD Program in Health Policy, Harvard University, Cambridge, Massachusetts, and Division of Emergency Medicine, Department of Pediatrics, Boston Children's Hospital, Boston, Massachusetts; Elana A. Feldman, BA, University of Washington School of Medicine, Seattle, Washington; and Katie L. Hayes, BS, Division of Emergency Medicine, Department of Pediatrics, The Children's Hospital of Philadelphia, Philadelphia, Pennsylvania.
Disclosures
This project was funded in part by The Gerber Foundation Novice Researcher Award (Ref #18273835). Dr. Fran Balamuth received career development support from the National Institutes of Health (NHLBI K12‐HL109009). Funders were not involved in design or conduct of the study; collection, management, analysis, or interpretation of the data; preparation, review, or approval of the manuscript. The authors have no financial relationships relevant to this article to disclose. No payment was received for the production of this article. The authors have no conflicts of interest relevant to this article to disclose.
- , , . Performance of low‐risk criteria in the evaluation of young infants with fever: review of the literature. Pediatrics. 2010;125:228–233.
- , , , , , . A week‐by‐week analysis of the low‐risk criteria for serious bacterial infection in febrile neonates. Arch Dis Child. 2009;94:287–292.
- , , , et al. Is 15 days an appropriate cut‐off age for considering serious bacterial infection in the management of febrile infants? Pediatr Infect Dis J. 2012;31:455–458.
- , , . Outpatient management without antibiotics of fever in selected infants. N Engl J Med. 1993;329:1437–1441.
- , , . Identifying febrile infants at risk for a serious bacterial infection. J Pediatr. 1993;123:489–490.
- , , , et al. Febrile infants at low risk for serious bacterial infection—an appraisal of the Rochester criteria and implications for management. Febrile Infant Collaborative Study Group. Pediatrics. 1994;94:390–396.
- American College of Emergency Physicians Clinical Policies Committee; American College of Emergency Physicians Clinical Policies Subcommittee on Pediatric Fever. Clinical policy for children younger than three years presenting to the emergency department with fever. Ann Emerg Med. 2003;42:530–545.
- , , , et al. Management of febrile neonates in US pediatric emergency departments. Pediatrics. 2014;133:187–195.
- , , , et al. Variation in care of the febrile young infant <90 days in US pediatric emergency departments. Pediatrics. 2014;134:667–677.
- , , , , . Fever survey highlights significant variations in how infants aged ≤60 days are evaluated and underline the need for guidelines. Acta Paediatr. 2014;103:379–385.
- . Evidence‐based guidelines and critical pathways for quality improvement. Pediatrics. 1999;103:225–232.
- , , , et al. Costs and infant outcomes after implementation of a care process model for febrile infants. Pediatrics. 2012;130:e16–e24.
- , , , , , . Research electronic data capture (REDCap)—a metadata‐driven methodology and workflow process for providing translational research informatics support. J Biomed Inform. 2009;42:377–381.
- , , , , , . Variation in occult injury screening for children with suspected abuse in selected US children's hospitals. Pediatrics. 2012;130:853–860.
- . Achieving data quality. How data from a pediatric health information system earns the trust of its users. J AHIMA. 2004;75:22–26.
- , , , . Corticosteroids and mortality in children with bacterial meningitis. JAMA. 2008;299:2048–2055.
- , , , et al. Variation in resource utilization across a national sample of pediatric emergency departments. J Pediatr. 2013;163:230–236.
- , , , , , . Deaths attributed to pediatric complex chronic conditions: national trends and implications for supportive care services. Pediatrics. 2001;107:E99.
- US Census Bureau. Geographic terms and concepts—census divisions and census regions. Available at: https://www.census.gov/geo/reference/gtc/gtc_census_divreg.html. Accessed September 10, 2014.
- , , , et al. Pediatric observation status: are we overlooking a growing population in children's hospitals? J Hosp Med. 2012;7:530–536.
- , , , et al. Differences in designations of observation care in US freestanding children's hospitals: are they virtual or real? J Hosp Med. 2012;7:287–293.
- , , , et al. Accuracy of administrative billing codes to detect urinary tract infection hospitalizations. Pediatrics. 2011;128:323–330.
- , , , et al. Identifying pediatric community‐acquired pneumonia hospitalizations: accuracy of administrative billing codes. JAMA Pediatr. 2013;167:851–858.
- , , , . Initial emergency department diagnosis and return visits: risk versus perception. Ann Emerg Med. 1998;32:569–573.
- , , , , . A national depiction of children with return visits to the emergency department within 72 hours, 2001–2007. Pediatr Emerg Care. 2012;28:606–610.
- Healthcare Cost and Utilization Project. Cost‐to‐charge ratio files. Available at: http://www.hcup‐us.ahrq.gov/db/state/costtocharge.jsp. Accessed September 11, 2014.
- , , , et al. Risk of serious bacterial infection in young febrile infants with respiratory syncytial virus infections. Pediatrics. 2004;113:1728–1734.
- , , , et al. Establishing benchmarks for the hospitalized care of children with asthma, bronchiolitis, and pneumonia. Pediatrics. 2014;134:555–562.
- , , , , , . Well appearing young infants with fever without known source in the emergency department: are lumbar punctures always necessary? Eur J Emerg Med. 2010;17:167–169.
- , . Unpredictability of serious bacterial illness in febrile infants from birth to 1 month of age. Arch Pediatr Adolesc Med. 1999;153:508–511.
- , , , et al. Management and outcomes of care of fever in early infancy. JAMA. 2004;291:1203–1212.
© 2015 Society of Hospital Medicine

Radiographs Predict Pneumonia Severity
The 2011 Pediatric Infectious Diseases Society and Infectious Diseases Society of America (PIDS/IDSA) guidelines for management of pediatric community‐acquired pneumonia (CAP) recommend that admission chest radiographs be obtained in all children hospitalized with CAP to document the presence and extent of infiltrates and to identify complications.[1] Findings from chest radiographs may also provide clues to etiology and assist with predicting disease outcomes. In adults with CAP, clinical prediction tools use radiographic findings to inform triage decisions, guide management strategies, and predict outcomes.[2, 3, 4, 5, 6, 7] Whether or not radiographic findings could have similar utility among children with CAP is unknown.
Several retrospective studies have examined the ability of chest radiographs to predict pediatric pneumonia disease severity.[8, 9, 10, 11, 12] However, these studies used several different measures of severe pneumonia and/or were limited to young children <5 years of age, leading to inconsistent findings. These studies also rarely considered very severe disease (eg, need for invasive mechanical ventilation) or longitudinal outcome measures such as hospital length of stay. Finally, all of these prior studies were conducted outside of the United States, and most were single‐center investigations, potentially limiting generalizability. We sought to examine associations between admission chest radiographic findings and subsequent hospital care processes and clinical outcomes, including length of stay and resource utilization measures, among children hospitalized with CAP at 4 children's hospitals in the United States.
METHODS
Design and Setting
This study was nested within a multicenter retrospective cohort designed to validate International Classification of Diseases, 9th Revision, Clinical Modification (ICD9‐CM) diagnostic codes for pediatric CAP hospitalizations.[13] The Pediatric Health Information System database (Children's Hospital Association, Overland Park, KS) was used to identify children from 4 freestanding pediatric hospitals (Monroe Carell, Jr. Children's Hospital at Vanderbilt, Nashville, Tennessee; Children's Mercy Hospitals & Clinics, Kansas City, Missouri; Seattle Children's Hospital, Seattle, Washington; and Cincinnati Children's Hospital Medical Center, Cincinnati, Ohio). The institutional review boards at each participating institution approved the study. The validation study included a 25% random sampling of children 60 days to 18 years of age (n=998) who were hospitalized between January 1, 2010 and December 31, 2010 with at least 1 ICD9‐CM discharge code indicating pneumonia. The diagnosis of CAP was confirmed by medical record review.
Study Population
This study was limited to children from the validation study who met criteria for clinical and radiographic CAP, defined as: (1) abnormal temperature or white blood cell count, (2) signs and symptoms of acute respiratory illness (eg, cough, tachypnea), and (3) chest radiograph indicating pneumonia within 48 hours of admission. Children with atelectasis as the only abnormal radiographic finding and those with complex chronic conditions (eg, cystic fibrosis, malignancy) were excluded using a previously described algorithm.[14]
Outcomes
Several measures of disease severity were assessed. Dichotomous outcomes included supplemental oxygen use, need for intensive care unit (ICU) admission, and need for invasive mechanical ventilation. Continuous outcomes included hospital length of stay, and for those requiring supplemental oxygen, duration of oxygen supplementation, measured in hours.
Exposure
To categorize infiltrate patterns and the presence and size of pleural effusions, we reviewed the final report from admission chest radiographs to obtain the final clinical interpretation performed by the attending pediatric radiologist. Infiltrate patterns were classified as single lobar (reference), unilateral multilobar, bilateral multilobar, or interstitial. Children with both lobar and interstitial infiltrates, and those with mention of atelectasis, were classified according to the type of lobar infiltrate. Those with atelectasis only were excluded. Pleural effusions were classified as absent, small, or moderate/large.
Analysis
Descriptive statistics were summarized using frequencies and percentages for categorical variables and median and interquartile range (IQR) values for continuous variables. Our primary exposures were infiltrate pattern and presence and size of pleural effusion on admission chest radiograph. Associations between radiographic findings and disease outcomes were analyzed using logistic and linear regression for dichotomous and continuous variables, respectively. Continuous outcomes were log‐transformed and normality assumptions verified prior to model development.
Due to the large number of covariates relative to outcome events, we used propensity score methods to adjust for potential confounding. The propensity score estimates the likelihood of a given exposure (ie, infiltrate pattern) conditional on a set of covariates. In this way, the propensity score summarizes potential confounding effects from a large number of covariates into a single variable. Including the propensity score as a covariate in multivariable regression improves model efficiency and helps protect against overfitting.[15] Covariates included in the estimation of the propensity score included age, sex, race/ethnicity, payer, hospital, asthma history, hospital transfer, recent hospitalization (within 30 days), recent emergency department or clinic visit (within 2 weeks), recent antibiotics for acute illness (within 5 days), illness duration prior to admission, tachypnea and/or increased work of breathing (retractions, nasal flaring, or grunting) at presentation, receipt of albuterol and/or corticosteroids during the first 2 calendar days of hospitalization, and concurrent diagnosis of bronchiolitis. All analyses included the estimated propensity score, infiltrate pattern, and pleural effusion (absent, small, or moderate/large).
RESULTS
Study Population
The median age of the 406 children with clinical and radiographic CAP was 3 years (IQR, 16 years) (Table 1). Single lobar infiltrate was the most common radiographic pattern (61%). Children with interstitial infiltrates (10%) were younger than those with lobar infiltrates of any type (median age 1 vs 3 years, P=0.02). A concomitant diagnosis of bronchiolitis was assigned to 34% of children with interstitial infiltrates but only 17% of those with lobar infiltrate patterns (range, 11%20%, P=0.03). Pleural effusion was present in 21% of children and was more common among those with lobar infiltrates, particularly multilobar disease. Only 1 child with interstitial infiltrate had a pleural effusion. Overall, 63% of children required supplemental oxygen, 8% required ICU admission, and 3% required invasive mechanical ventilation. Median length of stay was 51.5 hours (IQR, 3991) and median oxygen duration was 31.5 hours [IQR, 1365]. There were no deaths.
| Characteristic | Infiltrate Patterna | P Valueb | |||
|---|---|---|---|---|---|
| Single Lobar | Multilobar, Unilateral | Multilobar, Bilateral | Interstitial | ||
| |||||
| No. | 247 (60.8) | 54 (13.3) | 64 (15.8) | 41 (10.1) | |
| Median age, y | 3 [16] | 3 [17] | 3 [15] | 1 [03] | 0.02 |
| Male sex | 124 (50.2) | 32 (59.3) | 41 (64.1) | 30 (73.2) | 0.02 |
| Race | |||||
| Non‐Hispanic white | 133 (53.8) | 36 (66.7) | 37 (57.8) | 17 (41.5) | 0.69 |
| Non‐Hispanic black | 40 (16.2) | 6 (11.1) | 9 (14.1) | 8 (19.5) | |
| Hispanic | 25 (10.1) | 4 (7.4) | 5 (7.8) | 7 (17.1) | |
| Other | 49 (19.9) | 8 (14.8) | 13 (20.4) | 9 (22) | |
| Insurance | |||||
| Public | 130 (52.6) | 26 (48.1) | 33 (51.6) | 25 (61) | 0.90 |
| Private | 116 (47) | 28 (51.9) | 31 (48.4) | 16 (39) | |
| Concurrent diagnosis | |||||
| Asthma | 80 (32.4) | 16 (29.6) | 17 (26.6) | 12 (29.3) | 0.82 |
| Bronchiolitis | 43 (17.4) | 6 (11.1) | 13 (20.3) | 14 (34.1) | 0.03 |
| Effusion | |||||
| None | 201 (81.4) | 31 (57.4) | 48 (75) | 40 (97.6) | <.01 |
| Small | 34 (13.8) | 20 (37) | 11 (17.2) | 0 | |
| Moderate/large | 12 (4.9) | 3 (5.6) | 5 (7.8) | 1 (2.4) | |
Outcomes According to Radiographic Infiltrate Pattern
Compared to children with single lobar infiltrates, the odds of ICU admission was significantly increased for those with either unilateral or bilateral multilobar infiltrates (unilateral, adjusted odds ratio [aOR]: 8.0, 95% confidence interval [CI]: 2.922.2; bilateral, aOR: 6.6, 95% CI: 2.14.5) (Figure 1, Table 2). Patients with bilateral multilobar infiltrates also had higher odds for supplemental oxygen use (aOR: 2.7, 95% CI: 1.25.8) and need for invasive mechanical ventilation (aOR: 3.0, 95% CI: 1.27.9). There were no differences in duration of oxygen supplementation or hospital length of stay for children with single versus multilobar infiltrates.

| Outcome | Infiltrate Patterna | P Valueb | |||
|---|---|---|---|---|---|
| Single Lobar, n=247 | Multilobar, Unilateral, n=54 | Multilobar, Bilateral, n=64 | Interstitial, n=41 | ||
| |||||
| Supplemental O2 requirement | 143 (57.9) | 34 (63) | 46 (71.9) | 31 (75.6) | 0.05 |
| ICU admission | 10 (4) | 9 (16.7) | 9 (14.1) | 4 (9.8) | <0.01 |
| Mechanical ventilation | 5 (2) | 4 (7.4) | 4 (6.3) | 1 (2.4) | 0.13 |
| Hospital length of stay, h | 47 [3779] | 63 [45114] | 56.5 [39.5101] | 62 [3993] | <0.01 |
| O2 duration, h | 27 [1059] | 38 [1777] | 38 [2381] | 34.5 [1765] | 0.18 |
Compared to those with single lobar infiltrates, children with interstitial infiltrates had higher odds of need for supplemental oxygen (aOR: 3.1, 95% CI: 1.37.6) and ICU admission (aOR: 4.4, 95% CI: 1.314.3) but not invasive mechanical ventilation. There were also no differences in duration of oxygen supplementation or hospital length of stay.
Outcomes According to Presence and Size of Pleural Effusion
Compared to those without pleural effusion, children with moderate to large effusion had a higher odds of ICU admission (aOR: 3.2, 95% CI: 1.18.9) and invasive mechanical ventilation (aOR: 14.8, 95% CI: 9.822.4), and also had a longer duration of oxygen supplementation (aOR: 3.0, 95% CI: 1.46.5) and hospital length of stay (aOR: 2.6, 95% CI: 1.9‐3.6) (Table 3, Figure 2). The presence of a small pleural effusion was not associated with increased need for supplemental oxygen, ICU admission, or mechanical ventilation compared to those without effusion. However, small effusion was associated with a longer duration of oxygen supplementation (aOR: 1.7, 95% CI: 12.7) and hospital length of stay (aOR: 1.6, 95% CI: 1.3‐1.9).
| Outcome | Pleural Effusion | P Valuea | ||
|---|---|---|---|---|
| None, n=320 | Small, n=65 | Moderate/Large, n=21 | ||
| ||||
| Supplemental O2 requirement | 200 (62.5) | 40 (61.5) | 14 (66.7) | 0.91 |
| ICU admission | 22 (6.9) | 6 (9.2) | 4 (19) | 0.12 |
| Mechanical ventilation | 5 (1.6) | 5 (7.7) | 4 (19) | <0.01 |
| Hospital length of stay, h | 48 [37.576] | 72 [45142] | 160 [82191] | <0.01 |
| Oxygen duration, h | 31 [1157] | 38.5 [1887] | 111 [27154] | <0.01 |
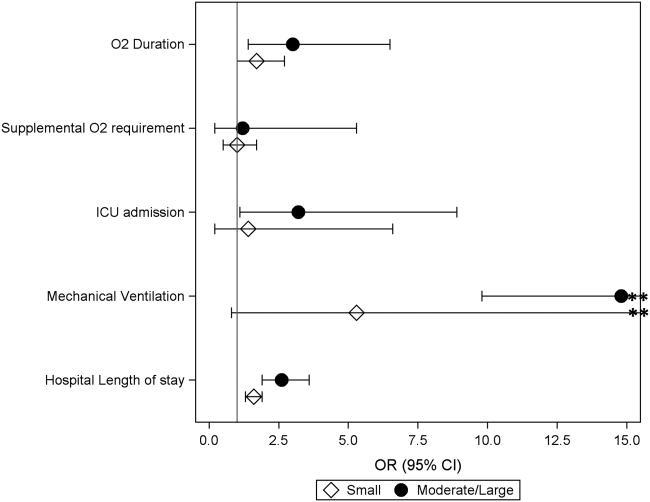
DISCUSSION
We evaluated the association between admission chest radiographic findings and subsequent clinical outcomes and hospital care processes for children hospitalized with CAP at 4 children's hospitals in the United States. We conclude that radiographic findings are associated with important inpatient outcomes. Similar to data from adults, findings of moderate to large pleural effusions and bilateral multilobar infiltrates had the strongest associations with severe disease. Such information, in combination with other prognostic factors, may help clinicians identify high‐risk patients and support management decisions, while also helping to inform families about the expected hospital course.
Previous pediatric studies examining the association between radiographic findings and outcomes have produced inconsistent results.[8, 9, 10, 11, 12] All but 1 of these studies documented 1 radiographic characteristics associated with pneumonia disease severity.[11] Further, although most contrasted lobar/alveolar and interstitial infiltrates, only Patria et al. distinguished among lobar infiltrate patterns (eg, single lobar vs multilobar).[12] Similar to our findings, that study demonstrated increased disease severity among children with bilateral multifocal lobar infiltrates. Of the studies that considered the presence of pleural effusion, only 1 demonstrated this finding to be associated with more severe disease.[9] However, none of these prior studies examined size of the pleural effusion.
In our study, the strongest association with severe pneumonia outcomes was among children with moderate to large pleural effusion. Significant pleural effusions are much more commonly due to infection with bacterial pathogens, particularly Streptococcus pneumoniae, Staphylococcus aureus, and Streptococcus pyogenes, and may also indicate infection with more virulent and/or difficult to treat strains.[16, 17, 18, 19] Surgical intervention is also often required. As such, children with significant pleural effusions are often more ill on presentation and may have a prolonged period of recovery.[20, 21, 22]
Similarly, multilobar infiltrates, particularly bilateral, were associated with increased disease severity in terms of need for supplemental oxygen, ICU admission, and need for invasive mechanical ventilation. Although this finding may be expected, it is interesting to note that the duration of supplemental oxygen and hospital length of stay were similar to those with single lobar disease. One potential explanation is that, although children with multilobar disease are more severe at presentation, rates of recovery are similar to those with less extensive radiographic findings, owing to rapidly effective antimicrobials for uncomplicated bacterial pneumonia. This hypothesis also agrees with the 2011 PIDS/IDSA guidelines, which state that children receiving adequate therapy typically show signs of improvement within 48 to 72 hours regardless of initial severity.[1]
Interstitial infiltrate was also associated with increased severity at presentation but similar length of stay and duration of oxygen requirement compared with single lobar disease. We note that these children were substantially younger than those presenting with any pattern of lobar disease (median age, 1 vs 3 years), were more likely to have a concurrent diagnosis of bronchiolitis (34% vs 17%), and only 1 child with interstitial infiltrates had a documented pleural effusion (vs 23% of children with lobar infiltrates). Primary viral pneumonia is considered more likely to produce interstitial infiltrates on chest radiograph compared to bacterial disease, and although detailed etiologic data are unavailable for this study, our findings above strongly support this assertion.[23, 24]
The 2011 PIDS/IDSA guidelines recommend admission chest radiographs for all children hospitalized with pneumonia to assess extent of disease and identify complications that may requiring additional evaluation or surgical intervention.[1] Our findings highlight additional potential benefits of admission radiographs in terms of disease prognosis and management decisions. In the initial evaluation of a sick child with pneumonia, clinicians are often presented with a number of potential prognostic factors that may influence disease outcomes. However, it is sometimes difficult for providers to consider all available information and/or the relative importance of a single factor, resulting in inaccurate risk perceptions and management decisions that may contribute to poor outcomes.[25] Similar to adults, the development of clinical prediction rules, which incorporate a variety of important predictors including admission radiographic findings, likely would improve risk assessments and potentially outcomes for children with pneumonia. Such prognostic information is also helpful for clinicians who may use these data to inform and prepare families regarding the expected course of hospitalization.
Our study has several limitations. This study was retrospective and only included a sample of pneumonia hospitalizations during the study period, which may raise confounding concerns and potential for selection bias. However, detailed medical record reviews using standardized case definitions for radiographic CAP were used, and a large sample of children was randomly selected from each institution. In addition, a large number of potential confounders were selected a priori and included in multivariable analyses; propensity score adjustment was used to reduce model complexity and avoid overfitting. Radiographic findings were based on clinical interpretation by pediatric radiologists independent of a study protocol. Prior studies have demonstrated good agreement for identification of alveolar/lobar infiltrates and pleural effusion by trained radiologists, although agreement for interstitial infiltrate is poor.[26, 27] This limitation could result in either over‐ or underestimation of the prevalence of interstitial infiltrates likely resulting in a nondifferential bias toward the null. Microbiologic information, which may inform radiographic findings and disease severity, was also not available. However, because pneumonia etiology is frequently unknown in the clinical setting, our study reflects typical practice. We also did not include children from community or nonteaching hospitals. Thus, although findings may have relevance to community or nonteaching hospitals, our results cannot be generalized.
CONCLUSION
Our study demonstrates that among children hospitalized with CAP, admission chest radiographic findings are associated with important clinical outcomes and hospital care processes, highlighting additional benefits of the 2011 PIDS/IDSA guidelines' recommendation for admission chest radiographs for all children hospitalized with pneumonia. These data, in conjunction with other important prognostic information, may help clinicians more rapidly identify children at increased risk for severe illness, and could also offer guidance regarding disease management strategies and facilitate shared decision making with families. Thus, routine admission chest radiography in this population represents a valuable tool that contributes to improved quality of care.
Disclosures
Dr. Williams is supported by funds from the National Institutes of HealthNational Institute of Allergy and Infectious Diseases (K23AI104779). The authors report no conflicts of interest.
- , , , et al. The management of community‐acquired pneumonia in infants and children older than 3 months of age: clinical practice guidelines by the Pediatric Infectious Diseases Society and the Infectious Diseases Society of America. Clin Infect Dis. 2011;53(7):e25–e76.
- , , , et al. A prediction rule to identify low‐risk patients with community‐acquired pneumonia. N Engl J Med. 1997;336(4):243–250.
- , , , et al. SMART‐COP: a tool for predicting the need for intensive respiratory or vasopressor support in community‐acquired pneumonia. Clin Infect Dis. 2008;47(3):375–384.
- , , , et al. Development and validation of a clinical prediction rule for severe community‐acquired pneumonia. Am J Respir Crit Care Med. 2006;174(11):1249–1256.
- , , , et al. Risk stratification of early admission to the intensive care unit of patients with no major criteria of severe community‐acquired pneumonia: development of an international prediction rule. Crit Care. 2009;13(2):R54.
- , , , et al. Do pulmonary radiographic findings at presentation predict mortality in patients with community‐acquired pneumonia? Arch Intern Med. 1996;156(19):2206–2212.
- , , , , , . Safety and efficacy of CURB65‐guided antibiotic therapy in community‐acquired pneumonia. J Antimicrob Chemother. 2011;66(2):416–423.
- , , . Severity of childhood community‐acquired pneumonia and chest radiographic findings. Pediatr Pulmonol. 2009;44(3):249–252.
- , , , et al. Can chest x‐ray predict pneumonia severity? Pediatr Pulmonol. 2004;38(6):465–469.
- , , , . Children with pneumonia: how do they present and how are they managed? Arch Dis Child. 2007;92(5):394–398.
- , , . Role of chest X‐ray in predicting outcome of acute severe pneumonia. Indian Pediatr. 2008;45(11):893–898.
- , , , , , . Association between radiological findings and severity of community‐acquired pneumonia in children. Ital J Pediatr. 2013;39:56.
- , , , et al. Identifying pediatric community‐acquired pneumonia hospitalizations: accuracy of administrative billing codes. JAMA Pediatrics. 2013;167(9):851–858.
- , , , , , . Deaths attributed to pediatric complex chronic conditions: national trends and implications for supportive care services. Pediatrics. 2001;107(6):E99.
- , . Invited commentary: propensity scores. Am J Epidemiol. 1999;150(4):327–333.
- , , , . Increasing incidence of empyema complicating childhood community‐acquired pneumonia in the United States. Clin Infect Dis. 2010;50(6):805–813.
- , , , et al. Epidemiology and clinical characteristics of community‐acquired pneumonia in hospitalized children. Pediatrics. 2004;113(4):701–707.
- , , , et al. Molecular analysis improves pathogen identification and epidemiologic study of pediatric parapneumonic empyema. Pediatr Infect Dis J. 2011;30(4):289–294.
- , . Parapneumonic pleural effusion and empyema in children. Review of a 19‐year experience, 1962–1980. Clin Pediatr (Phila). 1983;22(6):414–419.
- , , , et al. Risk factors of progressive community‐acquired pneumonia in hospitalized children: a prospective study [published online ahead of print August 28, 2013]. J Microbiol Immunol Infect. doi: 10.1016/j.jmii.2013.06.009.
- , , , , . Community‐acquired lobar pneumonia in children in the era of universal 7‐valent pneumococcal vaccination: a review of clinical presentations and antimicrobial treatment from a Canadian pediatric hospital. BMC Pediatr. 2012;12:133.
- , , , et al. Clinical characteristics and outcome of complicated pneumococcal pneumonia in a pediatric population. Pediatr Pulmonol. 2006;41(8):726–734.
- , , , , , . Differentiation of bacterial and viral pneumonia in children. Thorax. 2002;57(5):438–441.
- , , , et al. British Thoracic Society guidelines for the management of community acquired pneumonia in children: update 2011. Thorax. 2011;66(suppl 2):ii1–ii23.
- , , , et al. Community acquired pneumonia: aetiology and usefulness of severity criteria on admission. Thorax. 1996;51(10):1010–1016.
- , , , et al. Variability in the interpretation of chest radiographs for the diagnosis of pneumonia in children. J Hosp Med. 2012;7(4):294–298.
- , , , et al. Interobserver reliability of the chest radiograph in community‐acquired pneumonia. PORT Investigators. Chest. 1996;110(2):343–350.
The 2011 Pediatric Infectious Diseases Society and Infectious Diseases Society of America (PIDS/IDSA) guidelines for management of pediatric community‐acquired pneumonia (CAP) recommend that admission chest radiographs be obtained in all children hospitalized with CAP to document the presence and extent of infiltrates and to identify complications.[1] Findings from chest radiographs may also provide clues to etiology and assist with predicting disease outcomes. In adults with CAP, clinical prediction tools use radiographic findings to inform triage decisions, guide management strategies, and predict outcomes.[2, 3, 4, 5, 6, 7] Whether or not radiographic findings could have similar utility among children with CAP is unknown.
Several retrospective studies have examined the ability of chest radiographs to predict pediatric pneumonia disease severity.[8, 9, 10, 11, 12] However, these studies used several different measures of severe pneumonia and/or were limited to young children <5 years of age, leading to inconsistent findings. These studies also rarely considered very severe disease (eg, need for invasive mechanical ventilation) or longitudinal outcome measures such as hospital length of stay. Finally, all of these prior studies were conducted outside of the United States, and most were single‐center investigations, potentially limiting generalizability. We sought to examine associations between admission chest radiographic findings and subsequent hospital care processes and clinical outcomes, including length of stay and resource utilization measures, among children hospitalized with CAP at 4 children's hospitals in the United States.
METHODS
Design and Setting
This study was nested within a multicenter retrospective cohort designed to validate International Classification of Diseases, 9th Revision, Clinical Modification (ICD9‐CM) diagnostic codes for pediatric CAP hospitalizations.[13] The Pediatric Health Information System database (Children's Hospital Association, Overland Park, KS) was used to identify children from 4 freestanding pediatric hospitals (Monroe Carell, Jr. Children's Hospital at Vanderbilt, Nashville, Tennessee; Children's Mercy Hospitals & Clinics, Kansas City, Missouri; Seattle Children's Hospital, Seattle, Washington; and Cincinnati Children's Hospital Medical Center, Cincinnati, Ohio). The institutional review boards at each participating institution approved the study. The validation study included a 25% random sampling of children 60 days to 18 years of age (n=998) who were hospitalized between January 1, 2010 and December 31, 2010 with at least 1 ICD9‐CM discharge code indicating pneumonia. The diagnosis of CAP was confirmed by medical record review.
Study Population
This study was limited to children from the validation study who met criteria for clinical and radiographic CAP, defined as: (1) abnormal temperature or white blood cell count, (2) signs and symptoms of acute respiratory illness (eg, cough, tachypnea), and (3) chest radiograph indicating pneumonia within 48 hours of admission. Children with atelectasis as the only abnormal radiographic finding and those with complex chronic conditions (eg, cystic fibrosis, malignancy) were excluded using a previously described algorithm.[14]
Outcomes
Several measures of disease severity were assessed. Dichotomous outcomes included supplemental oxygen use, need for intensive care unit (ICU) admission, and need for invasive mechanical ventilation. Continuous outcomes included hospital length of stay, and for those requiring supplemental oxygen, duration of oxygen supplementation, measured in hours.
Exposure
To categorize infiltrate patterns and the presence and size of pleural effusions, we reviewed the final report from admission chest radiographs to obtain the final clinical interpretation performed by the attending pediatric radiologist. Infiltrate patterns were classified as single lobar (reference), unilateral multilobar, bilateral multilobar, or interstitial. Children with both lobar and interstitial infiltrates, and those with mention of atelectasis, were classified according to the type of lobar infiltrate. Those with atelectasis only were excluded. Pleural effusions were classified as absent, small, or moderate/large.
Analysis
Descriptive statistics were summarized using frequencies and percentages for categorical variables and median and interquartile range (IQR) values for continuous variables. Our primary exposures were infiltrate pattern and presence and size of pleural effusion on admission chest radiograph. Associations between radiographic findings and disease outcomes were analyzed using logistic and linear regression for dichotomous and continuous variables, respectively. Continuous outcomes were log‐transformed and normality assumptions verified prior to model development.
Due to the large number of covariates relative to outcome events, we used propensity score methods to adjust for potential confounding. The propensity score estimates the likelihood of a given exposure (ie, infiltrate pattern) conditional on a set of covariates. In this way, the propensity score summarizes potential confounding effects from a large number of covariates into a single variable. Including the propensity score as a covariate in multivariable regression improves model efficiency and helps protect against overfitting.[15] Covariates included in the estimation of the propensity score included age, sex, race/ethnicity, payer, hospital, asthma history, hospital transfer, recent hospitalization (within 30 days), recent emergency department or clinic visit (within 2 weeks), recent antibiotics for acute illness (within 5 days), illness duration prior to admission, tachypnea and/or increased work of breathing (retractions, nasal flaring, or grunting) at presentation, receipt of albuterol and/or corticosteroids during the first 2 calendar days of hospitalization, and concurrent diagnosis of bronchiolitis. All analyses included the estimated propensity score, infiltrate pattern, and pleural effusion (absent, small, or moderate/large).
RESULTS
Study Population
The median age of the 406 children with clinical and radiographic CAP was 3 years (IQR, 16 years) (Table 1). Single lobar infiltrate was the most common radiographic pattern (61%). Children with interstitial infiltrates (10%) were younger than those with lobar infiltrates of any type (median age 1 vs 3 years, P=0.02). A concomitant diagnosis of bronchiolitis was assigned to 34% of children with interstitial infiltrates but only 17% of those with lobar infiltrate patterns (range, 11%20%, P=0.03). Pleural effusion was present in 21% of children and was more common among those with lobar infiltrates, particularly multilobar disease. Only 1 child with interstitial infiltrate had a pleural effusion. Overall, 63% of children required supplemental oxygen, 8% required ICU admission, and 3% required invasive mechanical ventilation. Median length of stay was 51.5 hours (IQR, 3991) and median oxygen duration was 31.5 hours [IQR, 1365]. There were no deaths.
| Characteristic | Infiltrate Patterna | P Valueb | |||
|---|---|---|---|---|---|
| Single Lobar | Multilobar, Unilateral | Multilobar, Bilateral | Interstitial | ||
| |||||
| No. | 247 (60.8) | 54 (13.3) | 64 (15.8) | 41 (10.1) | |
| Median age, y | 3 [16] | 3 [17] | 3 [15] | 1 [03] | 0.02 |
| Male sex | 124 (50.2) | 32 (59.3) | 41 (64.1) | 30 (73.2) | 0.02 |
| Race | |||||
| Non‐Hispanic white | 133 (53.8) | 36 (66.7) | 37 (57.8) | 17 (41.5) | 0.69 |
| Non‐Hispanic black | 40 (16.2) | 6 (11.1) | 9 (14.1) | 8 (19.5) | |
| Hispanic | 25 (10.1) | 4 (7.4) | 5 (7.8) | 7 (17.1) | |
| Other | 49 (19.9) | 8 (14.8) | 13 (20.4) | 9 (22) | |
| Insurance | |||||
| Public | 130 (52.6) | 26 (48.1) | 33 (51.6) | 25 (61) | 0.90 |
| Private | 116 (47) | 28 (51.9) | 31 (48.4) | 16 (39) | |
| Concurrent diagnosis | |||||
| Asthma | 80 (32.4) | 16 (29.6) | 17 (26.6) | 12 (29.3) | 0.82 |
| Bronchiolitis | 43 (17.4) | 6 (11.1) | 13 (20.3) | 14 (34.1) | 0.03 |
| Effusion | |||||
| None | 201 (81.4) | 31 (57.4) | 48 (75) | 40 (97.6) | <.01 |
| Small | 34 (13.8) | 20 (37) | 11 (17.2) | 0 | |
| Moderate/large | 12 (4.9) | 3 (5.6) | 5 (7.8) | 1 (2.4) | |
Outcomes According to Radiographic Infiltrate Pattern
Compared to children with single lobar infiltrates, the odds of ICU admission was significantly increased for those with either unilateral or bilateral multilobar infiltrates (unilateral, adjusted odds ratio [aOR]: 8.0, 95% confidence interval [CI]: 2.922.2; bilateral, aOR: 6.6, 95% CI: 2.14.5) (Figure 1, Table 2). Patients with bilateral multilobar infiltrates also had higher odds for supplemental oxygen use (aOR: 2.7, 95% CI: 1.25.8) and need for invasive mechanical ventilation (aOR: 3.0, 95% CI: 1.27.9). There were no differences in duration of oxygen supplementation or hospital length of stay for children with single versus multilobar infiltrates.
| Outcome | Infiltrate Patterna | P Valueb | |||
|---|---|---|---|---|---|
| Single Lobar, n=247 | Multilobar, Unilateral, n=54 | Multilobar, Bilateral, n=64 | Interstitial, n=41 | ||
| |||||
| Supplemental O2 requirement | 143 (57.9) | 34 (63) | 46 (71.9) | 31 (75.6) | 0.05 |
| ICU admission | 10 (4) | 9 (16.7) | 9 (14.1) | 4 (9.8) | <0.01 |
| Mechanical ventilation | 5 (2) | 4 (7.4) | 4 (6.3) | 1 (2.4) | 0.13 |
| Hospital length of stay, h | 47 [3779] | 63 [45114] | 56.5 [39.5101] | 62 [3993] | <0.01 |
| O2 duration, h | 27 [1059] | 38 [1777] | 38 [2381] | 34.5 [1765] | 0.18 |
Compared to those with single lobar infiltrates, children with interstitial infiltrates had higher odds of need for supplemental oxygen (aOR: 3.1, 95% CI: 1.37.6) and ICU admission (aOR: 4.4, 95% CI: 1.314.3) but not invasive mechanical ventilation. There were also no differences in duration of oxygen supplementation or hospital length of stay.
Outcomes According to Presence and Size of Pleural Effusion
Compared to those without pleural effusion, children with moderate to large effusion had a higher odds of ICU admission (aOR: 3.2, 95% CI: 1.18.9) and invasive mechanical ventilation (aOR: 14.8, 95% CI: 9.822.4), and also had a longer duration of oxygen supplementation (aOR: 3.0, 95% CI: 1.46.5) and hospital length of stay (aOR: 2.6, 95% CI: 1.9‐3.6) (Table 3, Figure 2). The presence of a small pleural effusion was not associated with increased need for supplemental oxygen, ICU admission, or mechanical ventilation compared to those without effusion. However, small effusion was associated with a longer duration of oxygen supplementation (aOR: 1.7, 95% CI: 12.7) and hospital length of stay (aOR: 1.6, 95% CI: 1.3‐1.9).
| Outcome | Pleural Effusion | P Valuea | ||
|---|---|---|---|---|
| None, n=320 | Small, n=65 | Moderate/Large, n=21 | ||
| ||||
| Supplemental O2 requirement | 200 (62.5) | 40 (61.5) | 14 (66.7) | 0.91 |
| ICU admission | 22 (6.9) | 6 (9.2) | 4 (19) | 0.12 |
| Mechanical ventilation | 5 (1.6) | 5 (7.7) | 4 (19) | <0.01 |
| Hospital length of stay, h | 48 [37.576] | 72 [45142] | 160 [82191] | <0.01 |
| Oxygen duration, h | 31 [1157] | 38.5 [1887] | 111 [27154] | <0.01 |
DISCUSSION
We evaluated the association between admission chest radiographic findings and subsequent clinical outcomes and hospital care processes for children hospitalized with CAP at 4 children's hospitals in the United States. We conclude that radiographic findings are associated with important inpatient outcomes. Similar to data from adults, findings of moderate to large pleural effusions and bilateral multilobar infiltrates had the strongest associations with severe disease. Such information, in combination with other prognostic factors, may help clinicians identify high‐risk patients and support management decisions, while also helping to inform families about the expected hospital course.
Previous pediatric studies examining the association between radiographic findings and outcomes have produced inconsistent results.[8, 9, 10, 11, 12] All but 1 of these studies documented 1 radiographic characteristics associated with pneumonia disease severity.[11] Further, although most contrasted lobar/alveolar and interstitial infiltrates, only Patria et al. distinguished among lobar infiltrate patterns (eg, single lobar vs multilobar).[12] Similar to our findings, that study demonstrated increased disease severity among children with bilateral multifocal lobar infiltrates. Of the studies that considered the presence of pleural effusion, only 1 demonstrated this finding to be associated with more severe disease.[9] However, none of these prior studies examined size of the pleural effusion.
In our study, the strongest association with severe pneumonia outcomes was among children with moderate to large pleural effusion. Significant pleural effusions are much more commonly due to infection with bacterial pathogens, particularly Streptococcus pneumoniae, Staphylococcus aureus, and Streptococcus pyogenes, and may also indicate infection with more virulent and/or difficult to treat strains.[16, 17, 18, 19] Surgical intervention is also often required. As such, children with significant pleural effusions are often more ill on presentation and may have a prolonged period of recovery.[20, 21, 22]
Similarly, multilobar infiltrates, particularly bilateral, were associated with increased disease severity in terms of need for supplemental oxygen, ICU admission, and need for invasive mechanical ventilation. Although this finding may be expected, it is interesting to note that the duration of supplemental oxygen and hospital length of stay were similar to those with single lobar disease. One potential explanation is that, although children with multilobar disease are more severe at presentation, rates of recovery are similar to those with less extensive radiographic findings, owing to rapidly effective antimicrobials for uncomplicated bacterial pneumonia. This hypothesis also agrees with the 2011 PIDS/IDSA guidelines, which state that children receiving adequate therapy typically show signs of improvement within 48 to 72 hours regardless of initial severity.[1]
Interstitial infiltrate was also associated with increased severity at presentation but similar length of stay and duration of oxygen requirement compared with single lobar disease. We note that these children were substantially younger than those presenting with any pattern of lobar disease (median age, 1 vs 3 years), were more likely to have a concurrent diagnosis of bronchiolitis (34% vs 17%), and only 1 child with interstitial infiltrates had a documented pleural effusion (vs 23% of children with lobar infiltrates). Primary viral pneumonia is considered more likely to produce interstitial infiltrates on chest radiograph compared to bacterial disease, and although detailed etiologic data are unavailable for this study, our findings above strongly support this assertion.[23, 24]
The 2011 PIDS/IDSA guidelines recommend admission chest radiographs for all children hospitalized with pneumonia to assess extent of disease and identify complications that may requiring additional evaluation or surgical intervention.[1] Our findings highlight additional potential benefits of admission radiographs in terms of disease prognosis and management decisions. In the initial evaluation of a sick child with pneumonia, clinicians are often presented with a number of potential prognostic factors that may influence disease outcomes. However, it is sometimes difficult for providers to consider all available information and/or the relative importance of a single factor, resulting in inaccurate risk perceptions and management decisions that may contribute to poor outcomes.[25] Similar to adults, the development of clinical prediction rules, which incorporate a variety of important predictors including admission radiographic findings, likely would improve risk assessments and potentially outcomes for children with pneumonia. Such prognostic information is also helpful for clinicians who may use these data to inform and prepare families regarding the expected course of hospitalization.
Our study has several limitations. This study was retrospective and only included a sample of pneumonia hospitalizations during the study period, which may raise confounding concerns and potential for selection bias. However, detailed medical record reviews using standardized case definitions for radiographic CAP were used, and a large sample of children was randomly selected from each institution. In addition, a large number of potential confounders were selected a priori and included in multivariable analyses; propensity score adjustment was used to reduce model complexity and avoid overfitting. Radiographic findings were based on clinical interpretation by pediatric radiologists independent of a study protocol. Prior studies have demonstrated good agreement for identification of alveolar/lobar infiltrates and pleural effusion by trained radiologists, although agreement for interstitial infiltrate is poor.[26, 27] This limitation could result in either over‐ or underestimation of the prevalence of interstitial infiltrates likely resulting in a nondifferential bias toward the null. Microbiologic information, which may inform radiographic findings and disease severity, was also not available. However, because pneumonia etiology is frequently unknown in the clinical setting, our study reflects typical practice. We also did not include children from community or nonteaching hospitals. Thus, although findings may have relevance to community or nonteaching hospitals, our results cannot be generalized.
CONCLUSION
Our study demonstrates that among children hospitalized with CAP, admission chest radiographic findings are associated with important clinical outcomes and hospital care processes, highlighting additional benefits of the 2011 PIDS/IDSA guidelines' recommendation for admission chest radiographs for all children hospitalized with pneumonia. These data, in conjunction with other important prognostic information, may help clinicians more rapidly identify children at increased risk for severe illness, and could also offer guidance regarding disease management strategies and facilitate shared decision making with families. Thus, routine admission chest radiography in this population represents a valuable tool that contributes to improved quality of care.
Disclosures
Dr. Williams is supported by funds from the National Institutes of HealthNational Institute of Allergy and Infectious Diseases (K23AI104779). The authors report no conflicts of interest.
- , , , et al. The management of community‐acquired pneumonia in infants and children older than 3 months of age: clinical practice guidelines by the Pediatric Infectious Diseases Society and the Infectious Diseases Society of America. Clin Infect Dis. 2011;53(7):e25–e76.
- , , , et al. A prediction rule to identify low‐risk patients with community‐acquired pneumonia. N Engl J Med. 1997;336(4):243–250.
- , , , et al. SMART‐COP: a tool for predicting the need for intensive respiratory or vasopressor support in community‐acquired pneumonia. Clin Infect Dis. 2008;47(3):375–384.
- , , , et al. Development and validation of a clinical prediction rule for severe community‐acquired pneumonia. Am J Respir Crit Care Med. 2006;174(11):1249–1256.
- , , , et al. Risk stratification of early admission to the intensive care unit of patients with no major criteria of severe community‐acquired pneumonia: development of an international prediction rule. Crit Care. 2009;13(2):R54.
- , , , et al. Do pulmonary radiographic findings at presentation predict mortality in patients with community‐acquired pneumonia? Arch Intern Med. 1996;156(19):2206–2212.
- , , , , , . Safety and efficacy of CURB65‐guided antibiotic therapy in community‐acquired pneumonia. J Antimicrob Chemother. 2011;66(2):416–423.
- , , . Severity of childhood community‐acquired pneumonia and chest radiographic findings. Pediatr Pulmonol. 2009;44(3):249–252.
- , , , et al. Can chest x‐ray predict pneumonia severity? Pediatr Pulmonol. 2004;38(6):465–469.
- , , , . Children with pneumonia: how do they present and how are they managed? Arch Dis Child. 2007;92(5):394–398.
- , , . Role of chest X‐ray in predicting outcome of acute severe pneumonia. Indian Pediatr. 2008;45(11):893–898.
- , , , , , . Association between radiological findings and severity of community‐acquired pneumonia in children. Ital J Pediatr. 2013;39:56.
- , , , et al. Identifying pediatric community‐acquired pneumonia hospitalizations: accuracy of administrative billing codes. JAMA Pediatrics. 2013;167(9):851–858.
- , , , , , . Deaths attributed to pediatric complex chronic conditions: national trends and implications for supportive care services. Pediatrics. 2001;107(6):E99.
- , . Invited commentary: propensity scores. Am J Epidemiol. 1999;150(4):327–333.
- , , , . Increasing incidence of empyema complicating childhood community‐acquired pneumonia in the United States. Clin Infect Dis. 2010;50(6):805–813.
- , , , et al. Epidemiology and clinical characteristics of community‐acquired pneumonia in hospitalized children. Pediatrics. 2004;113(4):701–707.
- , , , et al. Molecular analysis improves pathogen identification and epidemiologic study of pediatric parapneumonic empyema. Pediatr Infect Dis J. 2011;30(4):289–294.
- , . Parapneumonic pleural effusion and empyema in children. Review of a 19‐year experience, 1962–1980. Clin Pediatr (Phila). 1983;22(6):414–419.
- , , , et al. Risk factors of progressive community‐acquired pneumonia in hospitalized children: a prospective study [published online ahead of print August 28, 2013]. J Microbiol Immunol Infect. doi: 10.1016/j.jmii.2013.06.009.
- , , , , . Community‐acquired lobar pneumonia in children in the era of universal 7‐valent pneumococcal vaccination: a review of clinical presentations and antimicrobial treatment from a Canadian pediatric hospital. BMC Pediatr. 2012;12:133.
- , , , et al. Clinical characteristics and outcome of complicated pneumococcal pneumonia in a pediatric population. Pediatr Pulmonol. 2006;41(8):726–734.
- , , , , , . Differentiation of bacterial and viral pneumonia in children. Thorax. 2002;57(5):438–441.
- , , , et al. British Thoracic Society guidelines for the management of community acquired pneumonia in children: update 2011. Thorax. 2011;66(suppl 2):ii1–ii23.
- , , , et al. Community acquired pneumonia: aetiology and usefulness of severity criteria on admission. Thorax. 1996;51(10):1010–1016.
- , , , et al. Variability in the interpretation of chest radiographs for the diagnosis of pneumonia in children. J Hosp Med. 2012;7(4):294–298.
- , , , et al. Interobserver reliability of the chest radiograph in community‐acquired pneumonia. PORT Investigators. Chest. 1996;110(2):343–350.
© 2014 Society of Hospital Medicine
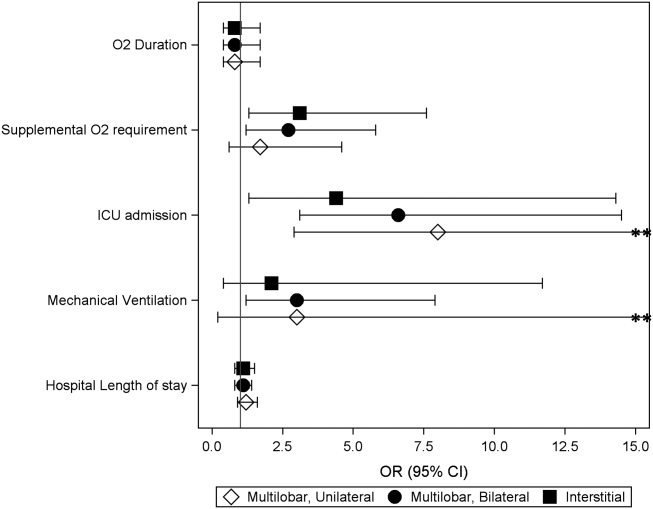
Discordant Antibiotics in Pediatric UTI
Urinary tract infections (UTIs) are one of the most common reasons for pediatric hospitalizations.1 Bacterial infections require prompt treatment with appropriate antimicrobial agents. Results from culture and susceptibility testing, however, are often unavailable until 48 hours after initial presentation. Therefore, the clinician must select antimicrobials empirically, basing decisions on likely pathogens and local resistance patterns.2 This decision is challenging because the effect of treatment delay on clinical outcomes is difficult to determine and resistance among uropathogens is increasing. Resistance rates have doubled over the past several years.3, 4 For common first‐line antibiotics, such as ampicillin and trimethoprim‐sulfamethoxazole, resistance rates for Escherichia coli, the most common uropathogen, exceed 25%.4, 5 While resistance to third‐generation cephalosporins remains low, rates in the United States have increased from <1% in 1999 to 4% in 2010. International data shows much higher resistance rates for cephalosporins in general.6, 7 This high prevalence of resistance may prompt the use of broad‐spectrum antibiotics for patients with UTI. For example, the use of third‐generation cephalosporins for UTI has doubled in recent years.3 Untreated, UTIs can lead to serious illness, but the consequences of inadequate initial antibiotic coverage are unknown.8, 9
Discordant antibiotic therapy, initial antibiotic therapy to which the causative bacterium is not susceptible, occurs in up to 9% of children hospitalized for UTI.10 However, there is reason to believe that discordant therapy may matter less for UTIs than for infections at other sites. First, in adults hospitalized with UTIs, discordant initial therapy did not affect the time to resolution of symptoms.11, 12 Second, most antibiotics used to treat UTIs are renally excreted and, thus, antibiotic concentrations at the site of infection are higher than can be achieved in the serum or cerebrospinal fluid.13 The Clinical and Laboratory Standard Institute has acknowledged that traditional susceptibility breakpoints may be too conservative for some non‐central nervous system infections; such as non‐central nervous system infections caused by Streptococcus pneumoniae.14
As resistance rates increase, more patients are likely to be treated with discordant therapy. Therefore, we sought to identify the clinical consequences of discordant antimicrobial therapy for patients hospitalized with a UTI.
METHODS
Design and Setting
We conducted a multicenter, retrospective cohort study. Data for this study were originally collected for a study that determined the accuracy of individual and combined International Classification of Diseases, Ninth Revision (ICD‐9) discharge diagnosis codes for children with laboratory tests for a UTI, in order to develop national quality measures for children hospitalized with UTIs.15 The institutional review board for each hospital (Seattle Children's Hospital, Seattle, WA; Monroe Carell Jr Children's Hospital at Vanderbilt, Nashville, TN; Cincinnati Children's Hospital Medical Center, Cincinnati, OH; Children's Mercy Hospital, Kansas City, MO; Children's Hospital of Philadelphia, Philadelphia, PA) approved the study.
Data Sources
Data were obtained from the Pediatric Health Information System (PHIS) and medical records for patients at the 5 participating hospitals. PHIS contains clinical and billing data from hospitalized children at 43 freestanding children's hospitals. Data quality and coding reliability are assured through a joint effort between the Children's Hospital Association (Shawnee Mission, KS) and participating hospitals.16 PHIS was used to identify participants based on presence of discharge diagnosis code and laboratory tests indicating possible UTI, patient demographics, antibiotic administration date, and utilization of hospital resources (length of stay [LOS], laboratory testing).
Medical records for each participant were reviewed to obtain laboratory and clinical information such as past medical history (including vesicoureteral reflux [VUR], abnormal genitourinary [GU] anatomy, use of prophylactic antibiotic), culture data, and fever data. Data were entered into a secured centrally housed web‐based data collection system. To assure consistency of chart review, all investigators responsible for data collection underwent training. In addition, 2 pilot medical record reviews were performed, followed by group discussion, to reach consensus on questions, preselected answers, interpretation of medical record data, and parameters for free text data entry.
Subjects
The initial cohort included 460 hospitalized patients, aged 3 days to 18 years of age, discharged from participating hospitals between July 1, 2008 and June 30, 2009 with a positive urine culture at any time during hospitalization.15 We excluded patients under 3 days of age because patients this young are more likely to have been transferred from the birthing hospital for a complication related to birth or a congenital anomaly. For this secondary analysis of patients from a prior study, our target population included patients admitted for management of UTI.15 We excluded patients with a negative initial urine culture (n = 59) or if their initial urine culture did not meet definition of laboratory‐confirmed UTI, defined as urine culture with >50,000 colony‐forming units (CFU) with an abnormal urinalysis (UA) (n = 77).1, 1719 An abnormal UA was defined by presence of white blood cells, leukocyte esterase, bacteria, and/or nitrites. For our cohort, all cultures with >50,000 CFU also had an abnormal urinalysis. We excluded 19 patients with cultures classified as 10,000100,000 CFU because we could not confirm that the CFU was >50,000. We excluded 30 patients with urine cultures classified as normal or mixed flora, positive for a mixture of organisms not further identified, or if results were unavailable. Additionally, coagulase‐negative Staphylococcus species (n = 8) were excluded, as these are typically considered contaminants in the setting of urine cultures.2 Patients likely to have received antibiotics prior to admission, or develop a UTI after admission, were identified and removed from the cohort if they had a urine culture performed more than 1 day before, or 2 days after, admission (n = 35). Cultures without resistance testing to the initial antibiotic selection were also excluded (n = 16).
Main Outcome Measures
The primary outcome measure was hospital LOS. Time to fever resolution was a secondary outcome measure. Fever was defined as temperature 38C. Fever duration was defined as number of hours until resolution of fever; only patients with fever at admission were included in this subanalysis.
Main Exposure
The main exposure was initial antibiotic therapy. Patients were classified into 3 groups according to initial antibiotic selection: those receiving 1) concordant; 2) discordant; or 3) delayed initial therapy. Concordance was defined as in vitro susceptibility to the initial antibiotic or class of antibiotic. If the uropathogen was sensitive to a narrow‐spectrum antibiotic (eg, first‐generation cephalosporin), but was not tested against a more broad‐spectrum antibiotic of the same class (eg, third‐generation cephalosporin), concordance was based on the sensitivity to the narrow‐spectrum antibiotic. If the uropathogen was sensitive to a broad‐spectrum antibiotic (eg, third‐generation cephalosporin), concordance to a more narrow‐spectrum antibiotic was not assumed. Discordance was defined as laboratory confirmation of in vitro resistance, or intermediate sensitivity of the pathogen to the initial antibiotic or class of antibiotics. Patients were considered to have a delay in antibiotic therapy if they did not receive antibiotics on the day of, or day after, collection of UA and culture. Patients with more than 1 uropathogen identified in a single culture were classified as discordant if any of the organisms was discordant to the initial antibiotic; they were classified as concordant if all organisms were concordant to the initial antibiotic. Antibiotic susceptibility was not tested in some cases (n = 16).
Initial antibiotic was defined as the antibiotic(s) billed on the same day or day after the UA was billed. If the patient had the UA completed on the day prior to admission, we used the antibiotic administered on the day of admission as the initial antibiotic.
Covariates
Covariates were selected a priori to include patient characteristics likely to affect patient outcomes; all were included in the final analysis. These were age, race, sex, insurance, disposition, prophylactic antibiotic use for any reason (VUR, oncologic process, etc), presence of a chronic care condition, and presence of VUR or GU anatomic abnormality. Age, race, sex, and insurance were obtained from PHIS. Medical record review was used to determine prophylactic antibiotic use, and presence of VUR or GU abnormalities (eg, posterior urethral valves). Chronic care conditions were defined using a previously reported method.20
Data Analysis
Continuous variables were described using median and interquartile range (IQR). Categorical variables were described using frequencies. Multivariable analyses were used to determine the independent association of discordant antibiotic therapy and the outcomes of interest. Poisson regression was used to fit the skewed LOS distribution. The effect of antibiotic concordance or discordance on LOS was determined for all patients in our sample, as well as for those with a urine culture positive for a single identified organism. We used the KruskalWallis test statistic to determine the association between duration of fever and discordant antibiotic therapy, given that duration of fever is a continuous variable. Generalized estimating equations accounted for clustering by hospital and the variability that exists between hospitals.
RESULTS
Of the initial 460 cases with positive urine culture growth at any time during admission, 216 met inclusion criteria for a laboratory‐confirmed UTI from urine culture completed at admission. The median age was 2.46 years (IQR: 0.27,8.89). In the study population, 25.0% were male, 31.0% were receiving prophylactic antibiotics, 13.0% had any grade of VUR, and 16.7% had abnormal GU anatomy (Table 1). A total of 82.4% of patients were treated with concordant initial therapy, 10.2% with discordant initial therapy, and 7.4% received delayed initial antibiotic therapy. There were no significant differences between the groups for any of the covariates. Discordant antibiotic cases ranged from 4.9% to 21.7% across hospitals.
| Overall | Concordant* | Discordant | Delayed Antibiotics | P Value | |
|---|---|---|---|---|---|
| |||||
| N | 216 | 178 (82.4) | 22 (10.2) | 16 (7.4) | |
| Gender | |||||
| Male | 54 (25.0) | 40 (22.5) | 8 (36.4) | 6 (37.5) | 0.18 |
| Female | 162 (75.0) | 138 (77.5) | 14 (63.64) | 10 (62.5) | |
| Race | |||||
| Non‐Hispanic white | 136 (63.9) | 110 (62.5) | 15 (71.4) | 11 (68.8) | 0.83 |
| Non‐Hispanic black | 28 (13.2) | 24 (13.6) | 2 (9.5) | 2 (12.5) | |
| Hispanic | 20 (9.4) | 16 (9.1) | 3 (14.3) | 1 (6.3) | |
| Asian | 10 (4.7) | 9 (5.1) | 1 (4.7) | ||
| Other | 19 (8.9) | 17 (9.7) | 2 (12.5) | ||
| Payor | |||||
| Government | 97 (44.9) | 80 (44.9) | 11 (50.0) | 6 (37.5) | 0.58 |
| Private | 70 (32.4) | 56 (31.5) | 6 (27.3) | 8 (50.0) | |
| Other | 49 (22.7) | 42 (23.6) | 5 (22.7) | 2 (12.5) | |
| Disposition | |||||
| Home | 204 (94.4) | 168 (94.4) | 21 (95.5) | 15 (93.8) | 0.99 |
| Died | 1 (0.5) | 1 (0.6) | |||
| Other | 11 (5.1) | 9 (5.1) | 1 (4.6) | 1 (6.3) | |
| Age | |||||
| 3 d60 d | 40 (18.5) | 35 (19.7) | 3 (13.6) | 2 (12.5) | 0.53 |
| 61 d2 y | 62 (28.7) | 54 (30.3) | 4 (18.2) | 4 (25.0) | |
| 3 y12 y | 75 (34.7) | 61 (34.3) | 8 (36.4) | 6 (37.5) | |
| 13 y18 y | 39 (18.1) | 28 (15.7) | 7 (31.8) | 4 (25.0) | |
| Length of stay | |||||
| 1 d5 d | 171 (79.2) | 147 (82.6) | 12 (54.6) | 12 (75.0) | 0.03 |
| 6 d10 d | 24 (11.1) | 17 (9.6) | 5 (22.7) | 2 (12.5) | |
| 11 d15 d | 10 (4.6) | 5 (2.8) | 3 (13.6) | 2 (12.5) | |
| 16 d+ | 11 (5.1) | 9 (5.1) | 2 (9.1) | 0 | |
| Complex chronic conditions | |||||
| Any CCC | 94 (43.5) | 77 (43.3) | 12 (54.6) | 5 (31.3) | 0.35 |
| Cardiovascular | 20 (9.3) | 19 (10.7) | 1 (6.3) | 0.24 | |
| Neuromuscular | 34 (15.7) | 26 (14.6) | 7 (31.8) | 1 (6.3) | 0.06 |
| Respiratory | 6 (2.8) | 6 (3.4) | 0.52 | ||
| Renal | 26 (12.0) | 21 (11.8) | 4 (18.2) | 1 (6.3) | 0.52 |
| Gastrointestinal | 3 (1.4) | 3 (1.7) | 0.72 | ||
| Hematologic/ immunologic | 1 (0.5) | 1 (4.6) | 0.01 | ||
| Metabolic | 8 (3.7) | 6 (3.4) | 1 (4.6) | 1 (6.3) | 0.82 |
| Congenital or genetic | 15 (6.9) | 11 (6.2) | 3 (13.6) | 1 (6.3) | 0.43 |
| Malignancy | 5 (2.3) | 3 (1.7) | 2 (9.1) | 0.08 | |
| VUR | 28 (13.0) | 23 (12.9) | 3 (13.6) | 2 (12.5) | 0.99 |
| Abnormal GU | 36 (16.7) | 31 (17.4) | 4 (18.2) | 1 (6.3) | 0.51 |
| Prophylactic antibiotics | 67 (31.0) | 53 (29.8) | 10 (45.5) | 4 (25.0) | 0.28 |
The most common causative organisms were E. coli (65.7%) and Klebsiella spp (9.7%) (Table 2). The most common initial antibiotics were a third‐generation cephalosporin (39.1%), combination of ampicillin and a third‐ or fourth‐generation cephalosporin (16.7%), and combination of ampicillin with gentamicin (11.1%). A third‐generation cephalosporin was the initial antibiotic for 46.1% of the E. coli and 56.9% of Klebsiella spp UTIs. Resistance to third‐generation cephalosporins but carbapenem susceptibility was noted for 4.5% of E. coli and 7.7% of Klebsiella spp isolates. Patients with UTIs caused by Klebsiella spp, mixed organisms, and Enterobacter spp were more likely to receive discordant antibiotic therapy. Patients with Enterobacter spp and mixed‐organism UTIs were more likely to have delayed antibiotic therapy. Nineteen patients (8.8%) had positive blood cultures. Fifteen (6.9%) required intensive care unit (ICU) admission during hospitalization.
| Organism | Cases | Concordant* No. (%) | Discordant No. (%) | Delayed Antibiotics No. (%) |
|---|---|---|---|---|
| ||||
| E. coli | 142 | 129 (90.8) | 3 (2.1) | 10 (7.0) |
| Klebsiella spp | 21 | 14 (66.7) | 7 (33.3) | 0 (0) |
| Enterococcus spp | 12 | 9 (75.0) | 3 (25.0) | 0 (0) |
| Enterobacter spp | 10 | 5 (50.0) | 3 (30.0) | 2 (20.0) |
| Pseudomonas spp | 10 | 9 (90.0) | 1 (10.0) | 0 (0) |
| Other single organisms | 6 | 5 (83.3) | 0 (0) | 1 (16.7) |
| Other identified multiple organisms | 15 | 7 (46.7) | 5 (33.3) | 3 (20.0) |
Unadjusted results are shown in Supporting Appendix 1, in the online version of this article. In the adjusted analysis, discordant antibiotic therapy was associated with a significantly longer LOS, compared with concordant therapy for all UTIs and for all UTIs caused by a single organism (Table 3). In adjusted analysis, discordant therapy was also associated with a 3.1 day (IQR: 2.0, 4.7) longer length of stay compared with concordant therapy for all E. coli UTIs.
| Bacteria | Difference in LOS (95% CI)* | P Value |
|---|---|---|
| ||
| All organisms | ||
| Concordant vs discordant | 1.8 (2.1, 1.5) | <0.0001 |
| Concordant vs delayed antibiotics | 1.4 (1.7, 1.1) | 0.01 |
| Single organisms | ||
| Concordant vs discordant | 1.9 (2.4, 1.5) | <0.0001 |
| Concordant vs delayed antibiotics | 1.2 (1.6, 1.2) | 0.37 |
Time to fever resolution was analyzed for patients with a documented fever at presentation for each treatment subgroup. One hundred thirty‐six patients were febrile at admission and 122 were febrile beyond the first recorded vital signs. Fever was present at admission in 60% of the concordant group and 55% of the discordant group (P = 0.6). The median duration of fever was 48 hours for the concordant group (n = 107; IQR: 24, 240) and 78 hours for the discordant group (n = 12; IQR: 48, 132). All patients were afebrile at discharge. Differences in fever duration between treatment groups were not statistically significant (P = 0.7).
DISCUSSION
Across 5 children's hospitals, 1 out of every 10 children hospitalized for UTI received discordant initial antibiotic therapy. Children receiving discordant antibiotic therapy had a 1.8 day longer LOS when compared with those on concordant therapy. However, there was no significant difference in time to fever resolution between the groups, suggesting that the increase in LOS was not explained by increased fever duration.
The overall rate of discordant therapy in this study is consistent with prior studies, as was the more common association of discordant therapy with non‐E. coli UTIs.10 According to the Kids' Inpatient Database 2009, there are 48,100 annual admissions for patients less than 20 years of age with a discharge diagnosis code of UTI in the United States.1 This suggests that nearly 4800 children with UTI could be affected by discordant therapy annually.
Children treated with discordant antibiotic therapy had a significantly longer LOS compared to those treated with concordant therapy. However, differences in time to fever resolution between the groups were not statistically significant. While resolution of fever may suggest clinical improvement and adequate empiric therapy, the lack of association with antibiotic concordance was not unexpected, since the relationship between fever resolution, clinical improvement, and LOS is complex and thus challenging to measure.21 These results support the notion that fever resolution alone may not be an adequate measure of clinical response.
It is possible that variability in discharge decision‐making may contribute to increased length of stay. Some clinicians may delay a patient's discharge until complete resolution of symptoms or knowledge of susceptibilities, while others may discharge patients that are still febrile and/or still receiving empiric antibiotics. Evidence‐based guidelines that address the appropriate time to discharge a patient with UTI are lacking. The American Academy of Pediatrics provides recommendations for use of parenteral antibiotics and hospital admission for patients with UTI, but does not address discharge decision‐making or patient management in the setting of discordant antibiotic therapy.2, 21
This study must be interpreted in the context of several limitations. First, our primary and secondary outcomes, LOS and fever duration, were surrogate measures for clinical response. We were not able to measure all clinical factors that may contribute to LOS, such as the patient's ability to tolerate oral fluids and antibiotics. Also, there may have been too few patients to detect a clinically important difference in fever duration between the concordant and discordant groups, especially for individual organisms. Although we did find a significant difference in LOS between patients treated with concordant compared with discordant therapy, there may be residual confounding from unobserved differences. This confounding, in conjunction with the small sample size, may cause us to underestimate the magnitude of the difference in LOS resulting from discordant therapy. Second, short‐term outcomes such as ICU admission were not investigated in this study; however, the proportion of patients admitted to the ICU in our population was quite small, precluding its use as a meaningful outcome measure. Third, the potential benefits to patients who were not exposed to unnecessary antibiotics, or harm to those that were exposed, could not be measured. Finally, our study was obtained using data from 5 free‐standing tertiary care pediatric facilities, thereby limiting its generalizability to other settings. Still, our rates of prophylactic antibiotic use, VUR, and GU abnormalities are similar to others reported in tertiary care children's hospitals, and we accounted for these covariates in our model.2225
As the frequency of infections caused by resistant bacteria increase, so will the number of patients receiving discordant antibiotics for UTI, compounding the challenge of empiric antimicrobial selection. Further research is needed to better understand how discordant initial antibiotic therapy contributes to LOS and whether it is associated with adverse short‐ and long‐term clinical outcomes. Such research could also aid in weighing the risk of broader‐spectrum prescribing on antimicrobial resistance patterns. While we identified an association between discordant initial antibiotic therapy and LOS, we were unable to determine the ideal empiric antibiotic therapy for patients hospitalized with UTI. Further investigation is needed to inform local and national practice guidelines for empiric antibiotic selection in patients with UTIs. This may also be an opportunity to decrease discordant empiric antibiotic selection, perhaps through use of antibiograms that stratify patients based on known factors, to lead to more specific initial therapy.
CONCLUSIONS
This study demonstrates that discordant antibiotic selection for UTI at admission is associated with longer hospital stay, but not fever duration. The full clinical consequences of discordant therapy, and the effects on length of stay, need to be better understood. Our findings, taken in combination with careful consideration of patient characteristics and prior history, may provide an opportunity to improve the hospital care for patients with UTIs.
Acknowledgements
Disclosure: Nothing to report.
- HCUP Kids' Inpatient Database (KID). Healthcare Cost and Utilization Project (HCUP). Rockville, MD: Agency for Healthcare Research and Quality; 2006 and 2009. Available at: http://www.hcup‐us.ahrq.gov/kidoverview.jsp.
- Subcommitee on Urinary Tract Infection, Steering Committee on Quality Improvement and Management. Urinary tract infection: clinical practice guideline for the diagnosis and management of the initial UTI in febrile infants and children 2 to 24 months. Pediatrics. 2011;128(3)595–610. doi: 10.1542/peds.2011–1330. Available at: http://pediatrics.aappublications.org/content/128/3/595.full.html.
- , , . National ambulatory antibiotic prescribing patterns for pediatric urinary tract infection, 1998–2007. Pediatrics. 2011;127(6):1027–1033.
- , , , , . Previous antimicrobial exposure is associated with drug‐resistant urinary tract infections in children. Pediatrics. 2010;125(4):664–672.
- CDC. National Antimicrobial Resistance Monitoring System for Enteric Bacteria (NARMS): Human Isolates Final Report. Atlanta, GA: US Department of Health and Human Services, CDC; 2009.
- , , , , . Increasing antibiotic resistance among uropathogens isolated during years 2006–2009: impact on the empirical management. Int Braz J Urol. 2012;38(1):25–32.
- . 3rd Generation Cephalosporin‐Resistant Escherichia coli. 2010. Available at: http://www.cddep.org/ResistanceMap/bug‐drug/EC‐CS. Accessed May 14, 2012.
- , , , . Risk of renal scarring in children with a first urinary tract infection: a systematic review. Pediatrics. 2010;126(6):1084–1091.
- , . Treatment of urinary tract infections. Pediatr Infect Dis J. 1999;18(11):1020–1021.
- , , , , . Non‐Escherichia coli versus Escherichia coli community‐acquired urinary tract infections in children hospitalized in a tertiary center: relative frequency, risk factors, antimicrobial resistance and outcome. Pediatr Infect Dis J. 2005;24(7):581–585.
- , , , , , . Prognosis of urinary tract infections with discordant antibiotic treatment [in Spanish]. Rev Clin Esp. 2010;210(11):545–549.
- , , , et al. Appropriateness of empiric antibiotic therapy in urinary tract infection in emergency room [in Spanish]. Rev Clin Esp. 2010;210(1):11–16.
- , , . Principles and Practice of Pediatric Infectious Diseases. 3rd ed. New York, NY: Churchill Livingstone/Elsevier; 2009.
- National Committee for Clinical Laboratory Standards. Performance Standards for Antimicrobial Susceptibility Testing; Twelfth Informational Supplement.Vol M100‐S12. Wayne, PA: NCCLS; 2002.
- , , , et al. Accuracy of administrative billing codes to detect urinary tract infection hospitalizations. Pediatrics. 2011;128(2):323–330.
- , , , . Corticosteroids and mortality in children with bacterial meningitis. JAMA. 2008;299(17):2048–2055.
- , , , , . Enhanced urinalysis as a screening test for urinary tract infection. Pediatrics. 1993;91(6):1196–1199.
- , , , , . Pyuria and bacteriuria in urine specimens obtained by catheter from young children with fever. J Pediatr. 1994;124(4):513–519.
- , , , et al. Clinical and demographic factors associated with urinary tract infection in young febrile infants. Pediatrics. 2005;116(3):644–648.
- , , , , , . Deaths attributed to pediatric complex chronic conditions: national trends and implications for supportive care services. Pediatrics. 2001;107(6):E99.
- Committee on Quality Improvement. Subcommittee on Urinary Tract Infection. Practice parameter: the diagnosis, treatment, and evaluation of the initial urinary tract infection in febrile infants and young children. Pediatrics. 1999;103:843–852.
- , . Antibiotics or surgery for vesicoureteric reflux in children. Lancet. 2004;364(9446):1720–1722.
- , , , et al. Randomized intervention for children with vesicoureteral reflux (RIVUR): background commentary of RIVUR investigators. Pediatrics. 2008;122(suppl 5):S233–S239.
- , , . Length of intravenous antibiotic therapy and treatment failure in infants with urinary tract infections. Pediatrics. 2010;126(2):196–203.
- , , , , , . Vesicoureteral reflux in children with suspected and proven urinary tract infection. Pediatr Nephrol. 2010;25(8):1463–1469.
Urinary tract infections (UTIs) are one of the most common reasons for pediatric hospitalizations.1 Bacterial infections require prompt treatment with appropriate antimicrobial agents. Results from culture and susceptibility testing, however, are often unavailable until 48 hours after initial presentation. Therefore, the clinician must select antimicrobials empirically, basing decisions on likely pathogens and local resistance patterns.2 This decision is challenging because the effect of treatment delay on clinical outcomes is difficult to determine and resistance among uropathogens is increasing. Resistance rates have doubled over the past several years.3, 4 For common first‐line antibiotics, such as ampicillin and trimethoprim‐sulfamethoxazole, resistance rates for Escherichia coli, the most common uropathogen, exceed 25%.4, 5 While resistance to third‐generation cephalosporins remains low, rates in the United States have increased from <1% in 1999 to 4% in 2010. International data shows much higher resistance rates for cephalosporins in general.6, 7 This high prevalence of resistance may prompt the use of broad‐spectrum antibiotics for patients with UTI. For example, the use of third‐generation cephalosporins for UTI has doubled in recent years.3 Untreated, UTIs can lead to serious illness, but the consequences of inadequate initial antibiotic coverage are unknown.8, 9
Discordant antibiotic therapy, initial antibiotic therapy to which the causative bacterium is not susceptible, occurs in up to 9% of children hospitalized for UTI.10 However, there is reason to believe that discordant therapy may matter less for UTIs than for infections at other sites. First, in adults hospitalized with UTIs, discordant initial therapy did not affect the time to resolution of symptoms.11, 12 Second, most antibiotics used to treat UTIs are renally excreted and, thus, antibiotic concentrations at the site of infection are higher than can be achieved in the serum or cerebrospinal fluid.13 The Clinical and Laboratory Standard Institute has acknowledged that traditional susceptibility breakpoints may be too conservative for some non‐central nervous system infections; such as non‐central nervous system infections caused by Streptococcus pneumoniae.14
As resistance rates increase, more patients are likely to be treated with discordant therapy. Therefore, we sought to identify the clinical consequences of discordant antimicrobial therapy for patients hospitalized with a UTI.
METHODS
Design and Setting
We conducted a multicenter, retrospective cohort study. Data for this study were originally collected for a study that determined the accuracy of individual and combined International Classification of Diseases, Ninth Revision (ICD‐9) discharge diagnosis codes for children with laboratory tests for a UTI, in order to develop national quality measures for children hospitalized with UTIs.15 The institutional review board for each hospital (Seattle Children's Hospital, Seattle, WA; Monroe Carell Jr Children's Hospital at Vanderbilt, Nashville, TN; Cincinnati Children's Hospital Medical Center, Cincinnati, OH; Children's Mercy Hospital, Kansas City, MO; Children's Hospital of Philadelphia, Philadelphia, PA) approved the study.
Data Sources
Data were obtained from the Pediatric Health Information System (PHIS) and medical records for patients at the 5 participating hospitals. PHIS contains clinical and billing data from hospitalized children at 43 freestanding children's hospitals. Data quality and coding reliability are assured through a joint effort between the Children's Hospital Association (Shawnee Mission, KS) and participating hospitals.16 PHIS was used to identify participants based on presence of discharge diagnosis code and laboratory tests indicating possible UTI, patient demographics, antibiotic administration date, and utilization of hospital resources (length of stay [LOS], laboratory testing).
Medical records for each participant were reviewed to obtain laboratory and clinical information such as past medical history (including vesicoureteral reflux [VUR], abnormal genitourinary [GU] anatomy, use of prophylactic antibiotic), culture data, and fever data. Data were entered into a secured centrally housed web‐based data collection system. To assure consistency of chart review, all investigators responsible for data collection underwent training. In addition, 2 pilot medical record reviews were performed, followed by group discussion, to reach consensus on questions, preselected answers, interpretation of medical record data, and parameters for free text data entry.
Subjects
The initial cohort included 460 hospitalized patients, aged 3 days to 18 years of age, discharged from participating hospitals between July 1, 2008 and June 30, 2009 with a positive urine culture at any time during hospitalization.15 We excluded patients under 3 days of age because patients this young are more likely to have been transferred from the birthing hospital for a complication related to birth or a congenital anomaly. For this secondary analysis of patients from a prior study, our target population included patients admitted for management of UTI.15 We excluded patients with a negative initial urine culture (n = 59) or if their initial urine culture did not meet definition of laboratory‐confirmed UTI, defined as urine culture with >50,000 colony‐forming units (CFU) with an abnormal urinalysis (UA) (n = 77).1, 1719 An abnormal UA was defined by presence of white blood cells, leukocyte esterase, bacteria, and/or nitrites. For our cohort, all cultures with >50,000 CFU also had an abnormal urinalysis. We excluded 19 patients with cultures classified as 10,000100,000 CFU because we could not confirm that the CFU was >50,000. We excluded 30 patients with urine cultures classified as normal or mixed flora, positive for a mixture of organisms not further identified, or if results were unavailable. Additionally, coagulase‐negative Staphylococcus species (n = 8) were excluded, as these are typically considered contaminants in the setting of urine cultures.2 Patients likely to have received antibiotics prior to admission, or develop a UTI after admission, were identified and removed from the cohort if they had a urine culture performed more than 1 day before, or 2 days after, admission (n = 35). Cultures without resistance testing to the initial antibiotic selection were also excluded (n = 16).
Main Outcome Measures
The primary outcome measure was hospital LOS. Time to fever resolution was a secondary outcome measure. Fever was defined as temperature 38C. Fever duration was defined as number of hours until resolution of fever; only patients with fever at admission were included in this subanalysis.
Main Exposure
The main exposure was initial antibiotic therapy. Patients were classified into 3 groups according to initial antibiotic selection: those receiving 1) concordant; 2) discordant; or 3) delayed initial therapy. Concordance was defined as in vitro susceptibility to the initial antibiotic or class of antibiotic. If the uropathogen was sensitive to a narrow‐spectrum antibiotic (eg, first‐generation cephalosporin), but was not tested against a more broad‐spectrum antibiotic of the same class (eg, third‐generation cephalosporin), concordance was based on the sensitivity to the narrow‐spectrum antibiotic. If the uropathogen was sensitive to a broad‐spectrum antibiotic (eg, third‐generation cephalosporin), concordance to a more narrow‐spectrum antibiotic was not assumed. Discordance was defined as laboratory confirmation of in vitro resistance, or intermediate sensitivity of the pathogen to the initial antibiotic or class of antibiotics. Patients were considered to have a delay in antibiotic therapy if they did not receive antibiotics on the day of, or day after, collection of UA and culture. Patients with more than 1 uropathogen identified in a single culture were classified as discordant if any of the organisms was discordant to the initial antibiotic; they were classified as concordant if all organisms were concordant to the initial antibiotic. Antibiotic susceptibility was not tested in some cases (n = 16).
Initial antibiotic was defined as the antibiotic(s) billed on the same day or day after the UA was billed. If the patient had the UA completed on the day prior to admission, we used the antibiotic administered on the day of admission as the initial antibiotic.
Covariates
Covariates were selected a priori to include patient characteristics likely to affect patient outcomes; all were included in the final analysis. These were age, race, sex, insurance, disposition, prophylactic antibiotic use for any reason (VUR, oncologic process, etc), presence of a chronic care condition, and presence of VUR or GU anatomic abnormality. Age, race, sex, and insurance were obtained from PHIS. Medical record review was used to determine prophylactic antibiotic use, and presence of VUR or GU abnormalities (eg, posterior urethral valves). Chronic care conditions were defined using a previously reported method.20
Data Analysis
Continuous variables were described using median and interquartile range (IQR). Categorical variables were described using frequencies. Multivariable analyses were used to determine the independent association of discordant antibiotic therapy and the outcomes of interest. Poisson regression was used to fit the skewed LOS distribution. The effect of antibiotic concordance or discordance on LOS was determined for all patients in our sample, as well as for those with a urine culture positive for a single identified organism. We used the KruskalWallis test statistic to determine the association between duration of fever and discordant antibiotic therapy, given that duration of fever is a continuous variable. Generalized estimating equations accounted for clustering by hospital and the variability that exists between hospitals.
RESULTS
Of the initial 460 cases with positive urine culture growth at any time during admission, 216 met inclusion criteria for a laboratory‐confirmed UTI from urine culture completed at admission. The median age was 2.46 years (IQR: 0.27,8.89). In the study population, 25.0% were male, 31.0% were receiving prophylactic antibiotics, 13.0% had any grade of VUR, and 16.7% had abnormal GU anatomy (Table 1). A total of 82.4% of patients were treated with concordant initial therapy, 10.2% with discordant initial therapy, and 7.4% received delayed initial antibiotic therapy. There were no significant differences between the groups for any of the covariates. Discordant antibiotic cases ranged from 4.9% to 21.7% across hospitals.
| Overall | Concordant* | Discordant | Delayed Antibiotics | P Value | |
|---|---|---|---|---|---|
| |||||
| N | 216 | 178 (82.4) | 22 (10.2) | 16 (7.4) | |
| Gender | |||||
| Male | 54 (25.0) | 40 (22.5) | 8 (36.4) | 6 (37.5) | 0.18 |
| Female | 162 (75.0) | 138 (77.5) | 14 (63.64) | 10 (62.5) | |
| Race | |||||
| Non‐Hispanic white | 136 (63.9) | 110 (62.5) | 15 (71.4) | 11 (68.8) | 0.83 |
| Non‐Hispanic black | 28 (13.2) | 24 (13.6) | 2 (9.5) | 2 (12.5) | |
| Hispanic | 20 (9.4) | 16 (9.1) | 3 (14.3) | 1 (6.3) | |
| Asian | 10 (4.7) | 9 (5.1) | 1 (4.7) | ||
| Other | 19 (8.9) | 17 (9.7) | 2 (12.5) | ||
| Payor | |||||
| Government | 97 (44.9) | 80 (44.9) | 11 (50.0) | 6 (37.5) | 0.58 |
| Private | 70 (32.4) | 56 (31.5) | 6 (27.3) | 8 (50.0) | |
| Other | 49 (22.7) | 42 (23.6) | 5 (22.7) | 2 (12.5) | |
| Disposition | |||||
| Home | 204 (94.4) | 168 (94.4) | 21 (95.5) | 15 (93.8) | 0.99 |
| Died | 1 (0.5) | 1 (0.6) | |||
| Other | 11 (5.1) | 9 (5.1) | 1 (4.6) | 1 (6.3) | |
| Age | |||||
| 3 d60 d | 40 (18.5) | 35 (19.7) | 3 (13.6) | 2 (12.5) | 0.53 |
| 61 d2 y | 62 (28.7) | 54 (30.3) | 4 (18.2) | 4 (25.0) | |
| 3 y12 y | 75 (34.7) | 61 (34.3) | 8 (36.4) | 6 (37.5) | |
| 13 y18 y | 39 (18.1) | 28 (15.7) | 7 (31.8) | 4 (25.0) | |
| Length of stay | |||||
| 1 d5 d | 171 (79.2) | 147 (82.6) | 12 (54.6) | 12 (75.0) | 0.03 |
| 6 d10 d | 24 (11.1) | 17 (9.6) | 5 (22.7) | 2 (12.5) | |
| 11 d15 d | 10 (4.6) | 5 (2.8) | 3 (13.6) | 2 (12.5) | |
| 16 d+ | 11 (5.1) | 9 (5.1) | 2 (9.1) | 0 | |
| Complex chronic conditions | |||||
| Any CCC | 94 (43.5) | 77 (43.3) | 12 (54.6) | 5 (31.3) | 0.35 |
| Cardiovascular | 20 (9.3) | 19 (10.7) | 1 (6.3) | 0.24 | |
| Neuromuscular | 34 (15.7) | 26 (14.6) | 7 (31.8) | 1 (6.3) | 0.06 |
| Respiratory | 6 (2.8) | 6 (3.4) | 0.52 | ||
| Renal | 26 (12.0) | 21 (11.8) | 4 (18.2) | 1 (6.3) | 0.52 |
| Gastrointestinal | 3 (1.4) | 3 (1.7) | 0.72 | ||
| Hematologic/ immunologic | 1 (0.5) | 1 (4.6) | 0.01 | ||
| Metabolic | 8 (3.7) | 6 (3.4) | 1 (4.6) | 1 (6.3) | 0.82 |
| Congenital or genetic | 15 (6.9) | 11 (6.2) | 3 (13.6) | 1 (6.3) | 0.43 |
| Malignancy | 5 (2.3) | 3 (1.7) | 2 (9.1) | 0.08 | |
| VUR | 28 (13.0) | 23 (12.9) | 3 (13.6) | 2 (12.5) | 0.99 |
| Abnormal GU | 36 (16.7) | 31 (17.4) | 4 (18.2) | 1 (6.3) | 0.51 |
| Prophylactic antibiotics | 67 (31.0) | 53 (29.8) | 10 (45.5) | 4 (25.0) | 0.28 |
The most common causative organisms were E. coli (65.7%) and Klebsiella spp (9.7%) (Table 2). The most common initial antibiotics were a third‐generation cephalosporin (39.1%), combination of ampicillin and a third‐ or fourth‐generation cephalosporin (16.7%), and combination of ampicillin with gentamicin (11.1%). A third‐generation cephalosporin was the initial antibiotic for 46.1% of the E. coli and 56.9% of Klebsiella spp UTIs. Resistance to third‐generation cephalosporins but carbapenem susceptibility was noted for 4.5% of E. coli and 7.7% of Klebsiella spp isolates. Patients with UTIs caused by Klebsiella spp, mixed organisms, and Enterobacter spp were more likely to receive discordant antibiotic therapy. Patients with Enterobacter spp and mixed‐organism UTIs were more likely to have delayed antibiotic therapy. Nineteen patients (8.8%) had positive blood cultures. Fifteen (6.9%) required intensive care unit (ICU) admission during hospitalization.
| Organism | Cases | Concordant* No. (%) | Discordant No. (%) | Delayed Antibiotics No. (%) |
|---|---|---|---|---|
| ||||
| E. coli | 142 | 129 (90.8) | 3 (2.1) | 10 (7.0) |
| Klebsiella spp | 21 | 14 (66.7) | 7 (33.3) | 0 (0) |
| Enterococcus spp | 12 | 9 (75.0) | 3 (25.0) | 0 (0) |
| Enterobacter spp | 10 | 5 (50.0) | 3 (30.0) | 2 (20.0) |
| Pseudomonas spp | 10 | 9 (90.0) | 1 (10.0) | 0 (0) |
| Other single organisms | 6 | 5 (83.3) | 0 (0) | 1 (16.7) |
| Other identified multiple organisms | 15 | 7 (46.7) | 5 (33.3) | 3 (20.0) |
Unadjusted results are shown in Supporting Appendix 1, in the online version of this article. In the adjusted analysis, discordant antibiotic therapy was associated with a significantly longer LOS, compared with concordant therapy for all UTIs and for all UTIs caused by a single organism (Table 3). In adjusted analysis, discordant therapy was also associated with a 3.1 day (IQR: 2.0, 4.7) longer length of stay compared with concordant therapy for all E. coli UTIs.
| Bacteria | Difference in LOS (95% CI)* | P Value |
|---|---|---|
| ||
| All organisms | ||
| Concordant vs discordant | 1.8 (2.1, 1.5) | <0.0001 |
| Concordant vs delayed antibiotics | 1.4 (1.7, 1.1) | 0.01 |
| Single organisms | ||
| Concordant vs discordant | 1.9 (2.4, 1.5) | <0.0001 |
| Concordant vs delayed antibiotics | 1.2 (1.6, 1.2) | 0.37 |
Time to fever resolution was analyzed for patients with a documented fever at presentation for each treatment subgroup. One hundred thirty‐six patients were febrile at admission and 122 were febrile beyond the first recorded vital signs. Fever was present at admission in 60% of the concordant group and 55% of the discordant group (P = 0.6). The median duration of fever was 48 hours for the concordant group (n = 107; IQR: 24, 240) and 78 hours for the discordant group (n = 12; IQR: 48, 132). All patients were afebrile at discharge. Differences in fever duration between treatment groups were not statistically significant (P = 0.7).
DISCUSSION
Across 5 children's hospitals, 1 out of every 10 children hospitalized for UTI received discordant initial antibiotic therapy. Children receiving discordant antibiotic therapy had a 1.8 day longer LOS when compared with those on concordant therapy. However, there was no significant difference in time to fever resolution between the groups, suggesting that the increase in LOS was not explained by increased fever duration.
The overall rate of discordant therapy in this study is consistent with prior studies, as was the more common association of discordant therapy with non‐E. coli UTIs.10 According to the Kids' Inpatient Database 2009, there are 48,100 annual admissions for patients less than 20 years of age with a discharge diagnosis code of UTI in the United States.1 This suggests that nearly 4800 children with UTI could be affected by discordant therapy annually.
Children treated with discordant antibiotic therapy had a significantly longer LOS compared to those treated with concordant therapy. However, differences in time to fever resolution between the groups were not statistically significant. While resolution of fever may suggest clinical improvement and adequate empiric therapy, the lack of association with antibiotic concordance was not unexpected, since the relationship between fever resolution, clinical improvement, and LOS is complex and thus challenging to measure.21 These results support the notion that fever resolution alone may not be an adequate measure of clinical response.
It is possible that variability in discharge decision‐making may contribute to increased length of stay. Some clinicians may delay a patient's discharge until complete resolution of symptoms or knowledge of susceptibilities, while others may discharge patients that are still febrile and/or still receiving empiric antibiotics. Evidence‐based guidelines that address the appropriate time to discharge a patient with UTI are lacking. The American Academy of Pediatrics provides recommendations for use of parenteral antibiotics and hospital admission for patients with UTI, but does not address discharge decision‐making or patient management in the setting of discordant antibiotic therapy.2, 21
This study must be interpreted in the context of several limitations. First, our primary and secondary outcomes, LOS and fever duration, were surrogate measures for clinical response. We were not able to measure all clinical factors that may contribute to LOS, such as the patient's ability to tolerate oral fluids and antibiotics. Also, there may have been too few patients to detect a clinically important difference in fever duration between the concordant and discordant groups, especially for individual organisms. Although we did find a significant difference in LOS between patients treated with concordant compared with discordant therapy, there may be residual confounding from unobserved differences. This confounding, in conjunction with the small sample size, may cause us to underestimate the magnitude of the difference in LOS resulting from discordant therapy. Second, short‐term outcomes such as ICU admission were not investigated in this study; however, the proportion of patients admitted to the ICU in our population was quite small, precluding its use as a meaningful outcome measure. Third, the potential benefits to patients who were not exposed to unnecessary antibiotics, or harm to those that were exposed, could not be measured. Finally, our study was obtained using data from 5 free‐standing tertiary care pediatric facilities, thereby limiting its generalizability to other settings. Still, our rates of prophylactic antibiotic use, VUR, and GU abnormalities are similar to others reported in tertiary care children's hospitals, and we accounted for these covariates in our model.2225
As the frequency of infections caused by resistant bacteria increase, so will the number of patients receiving discordant antibiotics for UTI, compounding the challenge of empiric antimicrobial selection. Further research is needed to better understand how discordant initial antibiotic therapy contributes to LOS and whether it is associated with adverse short‐ and long‐term clinical outcomes. Such research could also aid in weighing the risk of broader‐spectrum prescribing on antimicrobial resistance patterns. While we identified an association between discordant initial antibiotic therapy and LOS, we were unable to determine the ideal empiric antibiotic therapy for patients hospitalized with UTI. Further investigation is needed to inform local and national practice guidelines for empiric antibiotic selection in patients with UTIs. This may also be an opportunity to decrease discordant empiric antibiotic selection, perhaps through use of antibiograms that stratify patients based on known factors, to lead to more specific initial therapy.
CONCLUSIONS
This study demonstrates that discordant antibiotic selection for UTI at admission is associated with longer hospital stay, but not fever duration. The full clinical consequences of discordant therapy, and the effects on length of stay, need to be better understood. Our findings, taken in combination with careful consideration of patient characteristics and prior history, may provide an opportunity to improve the hospital care for patients with UTIs.
Acknowledgements
Disclosure: Nothing to report.
- HCUP Kids' Inpatient Database (KID). Healthcare Cost and Utilization Project (HCUP). Rockville, MD: Agency for Healthcare Research and Quality; 2006 and 2009. Available at: http://www.hcup‐us.ahrq.gov/kidoverview.jsp.
- Subcommitee on Urinary Tract Infection, Steering Committee on Quality Improvement and Management. Urinary tract infection: clinical practice guideline for the diagnosis and management of the initial UTI in febrile infants and children 2 to 24 months. Pediatrics. 2011;128(3)595–610. doi: 10.1542/peds.2011–1330. Available at: http://pediatrics.aappublications.org/content/128/3/595.full.html.
- , , . National ambulatory antibiotic prescribing patterns for pediatric urinary tract infection, 1998–2007. Pediatrics. 2011;127(6):1027–1033.
- , , , , . Previous antimicrobial exposure is associated with drug‐resistant urinary tract infections in children. Pediatrics. 2010;125(4):664–672.
- CDC. National Antimicrobial Resistance Monitoring System for Enteric Bacteria (NARMS): Human Isolates Final Report. Atlanta, GA: US Department of Health and Human Services, CDC; 2009.
- , , , , . Increasing antibiotic resistance among uropathogens isolated during years 2006–2009: impact on the empirical management. Int Braz J Urol. 2012;38(1):25–32.
- . 3rd Generation Cephalosporin‐Resistant Escherichia coli. 2010. Available at: http://www.cddep.org/ResistanceMap/bug‐drug/EC‐CS. Accessed May 14, 2012.
- , , , . Risk of renal scarring in children with a first urinary tract infection: a systematic review. Pediatrics. 2010;126(6):1084–1091.
- , . Treatment of urinary tract infections. Pediatr Infect Dis J. 1999;18(11):1020–1021.
- , , , , . Non‐Escherichia coli versus Escherichia coli community‐acquired urinary tract infections in children hospitalized in a tertiary center: relative frequency, risk factors, antimicrobial resistance and outcome. Pediatr Infect Dis J. 2005;24(7):581–585.
- , , , , , . Prognosis of urinary tract infections with discordant antibiotic treatment [in Spanish]. Rev Clin Esp. 2010;210(11):545–549.
- , , , et al. Appropriateness of empiric antibiotic therapy in urinary tract infection in emergency room [in Spanish]. Rev Clin Esp. 2010;210(1):11–16.
- , , . Principles and Practice of Pediatric Infectious Diseases. 3rd ed. New York, NY: Churchill Livingstone/Elsevier; 2009.
- National Committee for Clinical Laboratory Standards. Performance Standards for Antimicrobial Susceptibility Testing; Twelfth Informational Supplement.Vol M100‐S12. Wayne, PA: NCCLS; 2002.
- , , , et al. Accuracy of administrative billing codes to detect urinary tract infection hospitalizations. Pediatrics. 2011;128(2):323–330.
- , , , . Corticosteroids and mortality in children with bacterial meningitis. JAMA. 2008;299(17):2048–2055.
- , , , , . Enhanced urinalysis as a screening test for urinary tract infection. Pediatrics. 1993;91(6):1196–1199.
- , , , , . Pyuria and bacteriuria in urine specimens obtained by catheter from young children with fever. J Pediatr. 1994;124(4):513–519.
- , , , et al. Clinical and demographic factors associated with urinary tract infection in young febrile infants. Pediatrics. 2005;116(3):644–648.
- , , , , , . Deaths attributed to pediatric complex chronic conditions: national trends and implications for supportive care services. Pediatrics. 2001;107(6):E99.
- Committee on Quality Improvement. Subcommittee on Urinary Tract Infection. Practice parameter: the diagnosis, treatment, and evaluation of the initial urinary tract infection in febrile infants and young children. Pediatrics. 1999;103:843–852.
- , . Antibiotics or surgery for vesicoureteric reflux in children. Lancet. 2004;364(9446):1720–1722.
- , , , et al. Randomized intervention for children with vesicoureteral reflux (RIVUR): background commentary of RIVUR investigators. Pediatrics. 2008;122(suppl 5):S233–S239.
- , , . Length of intravenous antibiotic therapy and treatment failure in infants with urinary tract infections. Pediatrics. 2010;126(2):196–203.
- , , , , , . Vesicoureteral reflux in children with suspected and proven urinary tract infection. Pediatr Nephrol. 2010;25(8):1463–1469.
Copyright © 2012 Society of Hospital Medicine
Treatment of Complicated Pneumonia
Community‐acquired pneumonia, the most common serious bacterial infection in childhood, may be complicated by parapneumonic effusion (ie, complicated pneumonia).1 Children with complicated pneumonia require prolonged hospitalization and frequently undergo multiple pleural fluid drainage procedures.2 Additionally, the incidence of complicated pneumonia has increased,37 making the need to define appropriate therapy even more pressing. Defining appropriate therapy is challenging for the individual physician as a result of inconsistent and insufficient evidence, and wide variation in treatment practices.2, 8
Historically, thoracotomy was performed only if initial chest tube placement did not lead to clinical improvement.9, 10 Several authors, noting the rapid resolution of symptoms in children undergoing earlier thoracotomy, advocated for the use of thoracotomy as initial therapy rather than as a procedure of last resort.114 The advent of less invasive techniques such as video‐assisted thoracoscopic surgery (VATS) has served as an additional impetus to consider surgical drainage as the initial treatment strategy.1518 Few well‐designed studies have examined the relative efficacy of these interventions.2, 1922 Published randomized trials were single center, enrolled few patients, and arrived at different conclusions.19, 21, 22 In addition, these trials did not examine other important outcomes such as requirement for additional pleural fluid drainage procedures and hospital readmission. Two large retrospective multicenter studies found modest reductions in length of stay (LOS) and substantial decreases in the requirement for additional pleural fluid drainage procedures in children undergoing initial VATS compared with initial chest tube placement.2, 20 However, Shah et al2 included relatively few patients undergoing VATS. Li et al20 combined patients undergoing initial thoracentesis, initial chest tube placement, late pleural fluid drainage (by any method), and no pleural fluid drainage into a single non‐operative management category, precluding conclusions about the relative benefits of chest tube placement compared with VATS. Neither study2, 20 examined the role of chemical fibrinolysis, a therapy which has been associated with outcomes comparable to VATS in two small randomized trials.21, 22
The objectives of this multicenter study were to describe the variation in the initial management strategy along with associated outcomes of complicated pneumonia in childhood and to determine the comparative effectiveness of different pleural fluid drainage procedures.
Methods
Data Source
The Pediatric Health Information System (PHIS), which contains resource utilization data from 40 freestanding children's hospitals, provided data for this multicenter retrospective cohort study. Participating hospitals are located in noncompeting markets of 27 states plus the District of Columbia. The PHIS database includes patient demographics, diagnoses, and procedures as well as data for all drugs, radiologic studies, laboratory tests, and supplies charged to each patient. Data are de‐identified, however encrypted medical record numbers allow for tracking individual patients across admissions. The Child Health Corporation of America (Shawnee Mission, KS) and participating hospitals jointly assure data quality and reliability as described previously.23, 24 The Children's Hospital of Philadelphia Institutional Review Board reviewed and approved this study.
Patients
Children 18 years of age receiving a pleural drainage procedure for complicated pneumonia were eligible if they were discharged from participating hospitals between January 1, 2004 and June 30, 2009. Study participants met the following criteria: 1) discharge diagnosis of pneumonia (International Classification of Diseases, 9th revision [ICD‐9] discharge diagnosis codes 480.x‐483.x, 485.x‐487.x), 2) discharge diagnosis of pleural effusion (ICD‐9 codes 510.0, 510.9, 511.0, 511.1, or 511.9), and 3) billing charge for antibiotics on the first day of hospitalization. Additionally, the primary discharge diagnosis had to be either pneumonia or pleural effusion. Patients were excluded if they did not undergo pleural fluid drainage or if their initial pleural fluid drainage procedure was thoracentesis.
Study Definitions
Pleural drainage procedures were identified using ICD‐9 procedure codes for thoracentesis (34.91), chest tube placement (34.04), VATS (34.21), and thoracotomy (34.02 or 34.09). Fibrinolysis was defined as receipt of urokinase, streptokinase, or alteplase within two days of initial chest tube placement.
Acute conditions or complications included influenza (487, 487.0, 487.1, 487.8, 488, or V04.81) and hemolytic‐uremic syndrome (283.11). Chronic comorbid conditions (CCCs) (eg, malignancy) were identified using a previously reported classification scheme.25 Billing data were used to classify receipt of mechanical ventilation and medications on the first day of hospitalization.
Measured Outcomes
The primary outcomes were hospital LOS (both overall and post‐initial procedure), requirement for additional pleural drainage procedures, total cost for index hospitalization, all‐cause readmission within 14 days after index hospital discharge, and total cost of the episode (accounting for the cost of readmissions).
Measured Exposures
The primary exposure of interest was the initial pleural fluid drainage procedure, classified as chest tube placement without fibrinolysis, chest tube placement with fibrinolysis, VATS, or thoracotomy.
Statistical Analysis
Variables were summarized using frequencies and percentages for categorical variables, and median, interquartile range (IQR), and range for continuous variables. Outcomes by initial pleural drainage procedure were compared using chi‐squared tests for categorical variables and Kruskal‐Wallis tests for continuous variables.
Multivariable analysis was performed to account for potential confounding by observed baseline variables. For dichotomous outcome variables, modeling consisted of logistic regression using generalized estimating equations to account for hospital clustering. For continuous variables, a mixed model approach was used, treating hospital as a random effect. Log transformation was applied to the right‐skewed outcome variables (LOS and cost). Cost outcomes remained skewed following log transformation, thus gamma mixed models were applied.2629 Odds ratios and 95% confidence intervals (CIs) were reported for comparison of dichotomous outcomes and the adjusted means and 95% CIs were reported for continuous outcomes after appropriate back transformation.
Additional analyses addressed the potential impact of confounding by indication inherent in any observational study. First, patients with an underlying CCC were excluded to ensure that our results would be generalizable to otherwise healthy children with community‐acquired pneumonia. Second, patients undergoing pleural drainage >2 days after hospitalization were excluded to minimize the effect of residual confounding related to differences in timing of the initial drainage procedure. Third, the analysis was repeated using a generalized propensity score as an additional method to account for confounding by indication for the initial drainage procedure.30 Propensity scores, constructed using a multivariable generalized logit model, included all variables listed in Table 1. The inverse of the propensity score was included as a weight in each multivariable model described previously. Only the primary multivariable analyses are presented as the results of the propensity score analysis were nearly identical to the primary analyses.
| Overall | Chest Tube Without Fibrinolysis | Chest Tube With Fibrinolysis | Thoracotomy | VATS | P Value | |
|---|---|---|---|---|---|---|
| ||||||
| N | 3500 | 1672 (47.8) | 623 (17.8) | 797 (22.8) | 408 (11.7) | |
| Age | ||||||
| <1 year | 335 (9.6) | 176 (10.5) | 56 (9.0) | 78 (9.8) | 25 (6.1) | |
| 1 year | 475 (13.6) | 238 (14.2) | 98 (15.7) | 92 (11.5) | 47 (11.5) | 0.003 |
| 24 years | 1230 (35.1) | 548 (32.8) | 203 (32.6) | 310 (38.9) | 169 (41.4) | |
| 59 years | 897 (25.6) | 412 (24.6) | 170 (27.3) | 199 (25.0) | 116 (28.4) | |
| 1014 years | 324 (9.3) | 167 (10.0) | 61 (9.8) | 65 (8.2) | 31 (7.6) | |
| 1518 years | 193 (5.5) | 106 (6.3) | 29 (4.6) | 40 (5.0) | 18 (4.4) | |
| >18 years | 46 (1.3) | 25 (1.5) | 6 (0.96) | 13 (1.6) | 2 (0.5) | |
| Comorbid Conditions | ||||||
| Cardiac | 69 (2.0) | 43 (2.6) | 14 (2.3) | 12 (1.5) | 0 (0.0) | 0.006 |
| Malignancy | 81 (2.3) | 31 (1.9) | 18 (2.9) | 21 (2.6) | 11 (2.7) | 0.375 |
| Neurological | 138 (3.9) | 73 (4.4) | 20 (3.2) | 34 (4.3) | 11 (2.7) | 0.313 |
| Any Other Condition | 202 (5.8) | 96 (5.7) | 40 (6.4) | 47 (5.9) | 19 (4.7) | 0.696 |
| Payer | ||||||
| Government | 1240 (35.6) | 630 (37.8) | 224 (36.0) | 259 (32.7) | 127 (31.3) | <0.001 |
| Private | 1383 (39.7) | 607 (36.4) | 283 (45.4) | 310 (39.2) | 183 (45.07) | |
| Other | 864 (24.8) | 430 (25.8) | 116 (18.6) | 222 (28.1) | 96 (23.65) | |
| Race | ||||||
| Non‐Hispanic White | 1746 (51.9) | 838 (51.6) | 358 (59.7) | 361 (47.8) | 189 (48.7) | <0.001 |
| Non‐Hispanic Black | 601 (17.9) | 318 (19.6) | 90 (15.0) | 128 (17.0) | 65 (16.8) | |
| Hispanic | 588 (17.5) | 280 (17.3) | 73 (12.2) | 155 (20.5) | 80 (20.6) | |
| Asian | 117 (3.5) | 47 (2.9) | 20 (3.3) | 37 (4.9) | 13 (3.4) | |
| Other | 314 (9.3) | 140 (8.6) | 59 (9.8) | 74 (9.8) | 41 (10.6) | |
| Male Sex | 1912 (54.6) | 923 (55.2) | 336 (53.9) | 439 (55.1) | 214 (52.5) | 0.755 |
| Radiology | ||||||
| CT, no US | 1200 (34.3) | 600 (35.9) | 184 (29.5) | 280 (35.1) | 136 (33.3) | <0.001 |
| CT and US | 221 (6.3) | 84 (5.0) | 53 (8.5) | 61 (7.7) | 23 (5.6) | |
| US, no CT | 799 (22.8) | 324 (19.4) | 178 (28.6) | 200 (25.1) | 97 (23.8) | |
| No US, no CT | 1280 (36.6) | 664 (39.7) | 208 (33.4) | 256 (32.1) | 152 (37.3) | |
| Empiric Antibiotic Regimen | ||||||
| Cephalosporins alone | 448 (12.8) | 181 (10.83) | 126 (20.2) | 73 (9.2) | 68 (16.7) | <0.001 |
| Cephalosporin and clindamycin | 797 (22.8) | 359 (21.5) | 145 (23.3) | 184 (23.1) | 109 (26.7) | |
| Other antibiotic combination | 167 (4.8) | 82 (4.9) | 30 (4.8) | 38 (4.8) | 17 (4.2) | |
| Cephalosporin and vancomycin | 2088 (59.7) | 1050 (62.8) | 322 (51.7) | 502 (63.0) | 214 (52.5) | |
| Mechanical ventilation | 494 (14.1) | 251 (15.0) | 75 (12.0) | 114 (14.3) | 54 (13.2) | 0.307 |
| Corticosteroids | 520 (14.9) | 291 (17.4) | 72 (11.6) | 114 (14.3) | 43 (10.5) | <0.001 |
| Blood product transfusionsb | 761 (21.7) | 387 (23.2) | 145 (23.3) | 161 (20.2) | 68 (16.7) | 0.018 |
| Vasoactive infusionsc | 381 (10.9) | 223 (13.3) | 63 (10.1) | 72 (9.0) | 23 (5.6) | <0.001 |
| Admission to intensive care | 1397 (39.9) | 731 (43.7) | 234 (37.6) | 296 (37.1) | 136 (33.3) | <0.001 |
| Extracorporeal membranous oxygenation | 18 (0.5) | 13 (0.8) | 2 (0.3) | 3 (0.4) | 0 (0.0) | 0.163 |
| Hemolytic‐uremic syndrome | 31 (0.9) | 15 (0.9) | 6 (1.0) | 7 (0.9) | 3 (0.7) | 0.985 |
| Influenza | 108 (3.1) | 53 (3.2) | 27 (4.3) | 23 (2.9) | 5 (1.2) | 0.044 |
| Arterial blood gas measurements | 0 (0,1) | 0 (0, 2) | 0 (0,1) | 0 (0, 1) | 0 (0, 1) | <0.001 |
| Days to first procedure | 1 (0, 3) | 1 (0, 2) | 1 (1, 3) | 1 (1, 3) | 1 (1, 3) | <0.001 |
Medical records of a randomly selected subset of subjects from 6 hospitals were reviewed to determine the accuracy of our algorithm in identifying patients with complicated pneumonia; these subjects represented 1% of the study population. For the purposes of medical record review, complicated pneumonia was defined by the following: 1) radiologically‐confirmed lung infiltrate; 2) moderate or large pleural effusion; and 3) signs and symptoms of lower respiratory tract infection. Complicated pneumonia was identified in 118 of 120 reviewed subjects for a positive predictive value of 98.3%.
All analyses were clustered by hospital. Analyses were performed using SAS version 9.2 (SAS Institute, Cary, NC). A two‐tailed P < 0.05 was considered statistically significant.
Results
Patient Characteristics
During the study period, 9,680 subjects had complicated pneumonia. Subjects were excluded if they did not have a pleural drainage procedure (n = 5798), or if thoracentesis was the first pleural fluid drainage procedure performed (n = 382). The remaining 3500 patients were included. Demographic characteristics are summarized in Table 1. The median patient age was 4.1 years (IQR: 2.17.2 years). An underlying CCC was present in 424 (12.1%) patients. There was no association between type of drainage procedure and mechanical ventilation. However, factors associated with more severe systemic illness, such as blood product transfusion, were more common among those undergoing initial chest tube placement with or without fibrinolysis (Table 1).
Initial Pleural Fluid Drainage Procedures
The primary procedures included chest tube without fibrinolysis (47.8%); chest tube with fibrinolysis (17.8%); thoracotomy (22.8%); and VATS (11.7%) (Table 1). The proportion of patients undergoing primary chest tube placement with fibrinolysis increased over time from 14.2% in 2004 to 30.0% in 2009 (P < 0.001; chi‐squared test for trend). The initial procedure varied by hospital with the greatest proportion of patients undergoing primary chest tube placement without fibrinolysis at 28 (70.0%) hospitals, chest tube placement with fibrinolysis at 5 (12.5%) hospitals, thoracotomy at 5 (12.5%) hospitals, and VATS at 2 (5.0%) hospitals (Figure 1). The median proportion of patients undergoing primary VATS across all hospitals was 11.5% (IQR: 3.9%‐26.5%) (Figure 1). The median time to first procedure was 1 day (IQR: 03 days).
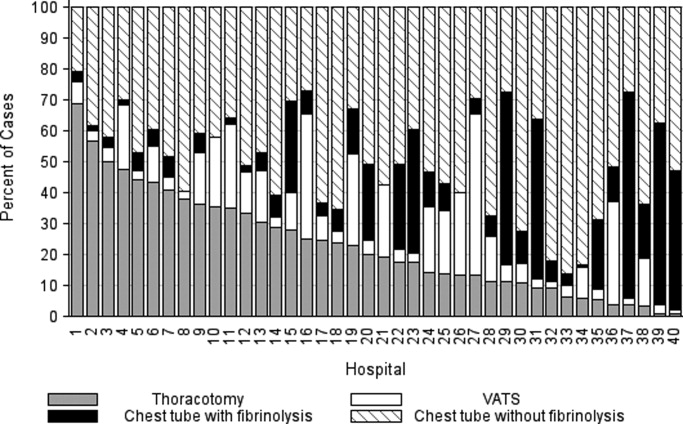
Outcome Measures
Variation in outcomes occurred across hospitals. Additional pleural drainage procedures were performed in a median of 20.9% of patients with a range of 6.8% to 44.8% (IQR: 14.5%‐25.3%) of patients across all hospitals. Median LOS was 10 days with a range of 714 days (IQR: 8.511 days) and the median LOS following the initial pleural fluid drainage procedure was 8 days with a range of 6 to 13 days (IQR: 78 days). Variation in timing of the initial pleural fluid drainage procedure explained 9.6% of the variability in LOS (Spearman rho, 0.31; P < 0.001).
Overall, 118 (3.4%) patients were readmitted within 14 days of index discharge; the median readmission rate was 3.8% with a range of 0.8% to 33.3% (IQR: 2.1%‐5.8%) across hospitals. The median total cost of the index hospitalization was $19,574 (IQR: $13,791‐$31,063). The total cost for the index hospitalization exceeded $54,215 for 10% of patients and the total cost of the episode exceeded $55,208 for 10% of patients. Unadjusted outcomes, stratified by primary pleural fluid drainage procedure, are summarized in Table 2.
| Overall | Chest Tube Without Fibrinolysis | Chest Tube With Fibrinolysis | Thoracotomy | VATS | P Valueb | |
|---|---|---|---|---|---|---|
| ||||||
| Additional Procedure | 716 (20.5) | 331 (19.8) | 144 (23.1) | 197 (24.7) | 44 (10.8) | <0.001 |
| Readmission within 14 days | 118 (3.4) | 54 (3.3) | 13 (2.1) | 32 (4.0) | 19 (4.7) | 0.096 |
| Total LOS (days) | 10 (7, 14) | 10 (7, 14) | 9 (7, 13) | 10 (7, 14) | 9 (7, 12) | <.001 |
| Post‐initial Procedure LOS (days) | 8 (5, 12) | 8 (6, 12) | 7 (5, 10) | 8 (5, 12) | 7 (5, 10) | <0.001 |
| Total Cost, Index Hospitalization ($)e | 19319 (13358, 30955) | 19951 (13576, 32018)c | 19565 (13209, 32778)d | 20352 (14351, 31343) | 17918 (13531, 25166) | 0.016 |
| Total Cost, Episode of Illness ($)e | 19831 (13927, 31749) | 20151 (13764, 32653) | 19593 (13210, 32861) | 20573 (14419, 31753) | 18344 (13835, 25462) | 0.029 |
In multivariable analysis, differences in total LOS and post‐procedure LOS were not significant (Table 3). The odds of additional drainage procedures were higher for all drainage procedures compared with initial VATS (Table 3). Patients undergoing initial chest tube placement with fibrinolysis were less likely to require readmission compared with patients undergoing initial VATS (Table 3). The total cost for the episode of illness (including the cost of readmission) was significantly less for those undergoing primary chest tube placement without fibrinolysis compared with primary VATS. The results of subanalyses excluding patients with an underlying CCC (Supporting Appendix online, Table 4) and restricting the cohort to patients undergoing pleural drainage within two days of admission (Supporting Appendix online, Table 5) were similar to the results of our primary analysis with one exception; in the latter subanalysis, children undergoing initial chest tube placement without fibrinolysis were also less likely to require readmission compared with patients undergoing initial VATS.
| Adjusted OR (95% CI)a | P Value | |
|---|---|---|
| ||
| Additional pleural drainage procedure | ||
| Chest tube without fibrinolysis | 1.82 (1.103.00) | .019 |
| Chest tube with fibrinolysis | 2.31 (1.443.72) | <0.001 |
| Thoracotomy | 2.59 (1.624.14) | <0.001 |
| VATS | Reference | |
| Readmission within 14 days | ||
| Chest tube without fibrinolysis | 0.61 (0.361.05) | .077 |
| Chest tube with fibrinolysis | 0.45 (0.230.86) | .015 |
| Thoracotomy | 0.85 (0.521.39) | .521 |
| VATS | Reference | |
| Adjusted Mean (95% CI)a | P Value | |
| Total LOS (days) | ||
| Chest tube without fibrinolysis | 8.0 (7.88.2) | .339 |
| Chest tube with fibrinolysis | 8.1 (7.98.3) | .812 |
| Thoracotomy | 8.1 (7.98.3) | .632 |
| VATS | 8.1 (7.98.3) | Ref |
| Post‐initial procedure LOS (days) | ||
| Chest tube without fibrinolysis | 7.3 (7.07.5) | .512 |
| Chest tube with fibrinolysis | 7.5 (7.27.8) | .239 |
| Thoracotomy | 7.3 (7.07.6) | .841 |
| VATS | 7.3 (7.17.6) | Reference |
| Total cost, index hospitalization ($) | ||
| Chest tube without fibrinolysis | 22928 (2200023895 | .012 |
| Chest tube with fibrinolysis | 23621 (2263124655) | .657 |
| Thoracotomy | 23386 (2241924395 | .262 |
| VATS | 23820 (2280824878) | Reference |
| Total cost, episode of illness ($) | ||
| Chest tube without fibrinolysis | 23218 (2227824199) | .004 |
| Chest tube with fibrinolysis | 23749 (2275224790) | .253 |
| Thoracotomy | 23673 (2269324696) | .131 |
| VATS | 24280 (2324425362) | Reference |
Discussion
This multicenter study is the largest to evaluate the management of children hospitalized with complicated pneumonia. We found considerable variation in initial management and outcomes across hospitals. Differences in timing of the initial drainage procedure explained only a small amount of the variability in outcomes. Children undergoing initial VATS less commonly required additional drainage procedures while children undergoing initial chest tube placement with fibrinolysis less commonly required readmission. Differences in total and post‐procedure LOS were not statistically significant. Differences in cost, while statistically significant, were of marginal relevance.
Previous studies have also shown significant variation in treatment and outcomes of children with complicated pneumonia across hospitals.2, 8 Our study provides data from additional hospitals, includes a substantially larger number of patients undergoing initial VATS, distinguishes between fibrinolysis recipients and nonrecipients, and is the first to compare outcomes between four different initial drainage strategies. The creation of national consensus guidelines might reduce variability in initial management strategies, although the variability in outcomes across hospitals in the current study could not be explained simply by differences in the type or timing of the initial drainage procedure. Thus, future studies examining hospital‐level factors may play an important role in improving quality of care for children with complicated pneumonia.
Patients with initial thoracotomy or chest tube placement with or without fibrinolysis more commonly received additional drainage procedures than patients with initial VATS. This difference remained when patients with CCCs were excluded from the analysis and when the analysis was limited to patients undergoing pleural fluid drainage within 2 days of hospitalization. Several small, randomized trials demonstrated conflicting results when comparing initial chest tube placement with fibrinolysis and VATS. St. Peter et al22 reported that 3 (17%) of 18 patients undergoing initial chest tube placement with fibrinolysis and none of the 18 patients undergoing initial VATS received additional pleural drainage procedures. Sonnappa et al21 found no differences between the two groups. Kurt et al19 did not state the proportion of patients receiving additional procedures. However, the mean number of drainage procedures was 2.25 among the 8 patients undergoing initial chest tube placement while none of the 10 patients with VATS received additional drainage.19
Thoracotomy is often perceived as a definitive procedure for treatment of complicated pneumonia. However, several possibilities exist to explain why additional procedures were performed less frequently in patients undergoing initial VATS compared with initial thoracotomy. The limited visual field in thoracotomy may lead to greater residual disease post‐operatively in those receiving thoracotomy compared with VATS.31 Additionally, thoracotomy substantially disrupts the integrity of the chest wall and is consequently associated with complications such as bleeding and air leak into the pleural cavity more often than VATS.31, 32 It is thus possible that some of the additional procedures in patients receiving initial thoracotomy were necessary for management of thoracotomy‐associated complications rather than for failure of the initial drainage procedure.
Similar to the randomized trials by Sonnappa et al21 and St. Peter et al,22 differences in the overall and post‐procedure LOS were not significant among patients undergoing initial VATS compared with initial chest tube placement with fibrinolysis. However, chest tube placement without fibrinolysis did not result in significant differences in LOS compared with initial VATS. In the only pediatric randomized trial, the 29 intrapleural urokinase recipients had a 2 day shorter LOS compared with the 29 intrapleural saline recipients.33 Several small, randomized controlled trials of adults with complicated pneumonia reported improved pleural fluid drainage among intrapleural fibrinolysis recipients compared with non‐recipients.3436 However, a large multicenter randomized trial in adults found no differences in mortality, requirement for surgical drainage, or LOS between intrapleural streptokinase and placebo recipients.37 Subsequent meta‐analyses of randomized trials in adults also demonstrated no benefit to fibrinolysis.38, 39 In the context of the increasing use of intrapleural fibrinolysis in children with complicated pneumonia, our results highlight the need for a large, multicenter randomized controlled trial to determine whether chest tube with fibrinolysis is superior to chest tube alone.
Two small randomized trials21, 22 and a decision analysis40 identified chest tube with fibrinolysis as the most economical approach to children with complicated pneumonia. However, the costs did not differ significantly between patients undergoing initial VATS or initial chest tube placement with fibrinolysis in our study. The least costly approach was initial chest tube placement without fibrinolysis. Unlike the randomized controlled trials, we considered costs associated with readmissions in determining the total costs. Shah et al41 found no difference in total charges for patients undergoing initial VATS compared with initial chest tube placement; however, patients undergoing initial VATS were concentrated in a few centers, making it difficult to determine the relative importance of procedural and hospital factors.
This multicenter observational study has several limitations. First, discharge diagnosis coding may be unreliable for specific diseases. However, our rigorous definition of complicated pneumonia, supported by the high positive predictive value as verified by medical record review, minimizes the likelihood of misclassification.
Second, unmeasured confounding or residual confounding by indication for the method of pleural drainage may occur, potentially influencing our results in two disparate ways. If patients with more severe systemic illness were too unstable for operative interventions, then our results would be biased towards worse outcomes for children undergoing initial chest tube placement. We adjusted for several variables associated with a greater systemic severity of illness, including intensive care unit admission, making this possibility less likely. We also could not account for some factors associated with more severe local disease such as the size and character of the effusion. We suspect that patients with more extensive local disease (ie, loculated effusions) would have worse outcomes than other patients, regardless of initial procedure, and that these patients would also be more likely to undergo primary surgical drainage. Thus, this study may have underestimated the benefit of initial surgical drainage (eg, VATS) compared with nonsurgical drainage (ie, chest tube placement).
Third, misclassification of the method of initial pleural drainage may have occurred. Patients transferred from another institution following chest tube placement could either be classified as not receiving pleural drainage and thus excluded from the study or classified as having initial VATS or thoracotomy if the reason for transfer was chest tube treatment failure. Additionally, we could not distinguish routine use of fibrinolysis from fibrinolysis to maintain chest tube patency. Whether such misclassification would falsely minimize or maximize differences in outcomes between the various groups remains uncertain. Fourth, because this study only included tertiary care children's hospitals, these data are not generalizable to community settings. VATS requires specialized surgical training that may be unavailable in some areas. Finally, this study demonstrates the relative efficacy of various pleural fluid drainage procedures on short‐term clinical outcomes and resource utilization. However, long‐term functional outcomes should be measured in future prospective studies.
Conclusions
In conclusion, emphasis on evidence driven treatment to optimize care has led to an increasing examination of unwarranted practice variation.42 The lack of evidence for best practice makes it difficult to define unwarranted variation in the treatment of complicated pneumonia. Our study demonstrates the large variability in practice and raises additional questions regarding the optimal drainage strategies. Published randomized trials have focused on comparisons between chest tube placement with fibrinolysis and VATS. However, our data suggest that future randomized trials should include chest tube placement without fibrinolysis as a treatment strategy. In determining the current best treatment for patients with complicated pneumonia, a clinician must weigh the impact of needing an additional procedure in approximately one‐quarter of patients undergoing initial chest tube placement (with or without fibrinolysis) with the risks of general anesthesia and readmission in patients undergoing initial VATS.
Acknowledgements
Dr. Hall had full access to all the data in the study and takes responsibility for the integrity of the data and accuracy of the analysis.
- ,.Parapneumonic pleural effusion and empyema in children. Review of a 19‐year experience, 1962–1980.Clin Pediatr (Phila).1983;22:414–419.
- ,,,,.Primary early thoracoscopy and reduction in length of hospital stay and additional procedures among children with complicated pneumonia: Results of a multicenter retrospective cohort study.Arch Pediatr Adolesc Med.2008;162:675–681.
- ,.Empyema hospitalizations increased in US children despite pneumococcal conjugate vaccine.Pediatrics.2010;125:26–33.
- ,,, et al.Impact of the pneumococcal conjugate vaccine on pneumococcal parapneumonic empyema.Pediatr Infect Dis J.2006;25:250–254.
- ,,,,.Five‐fold increase in pediatric parapneumonic empyema since introduction of pneumococcal conjugate vaccine.Pediatric Infect Dis J.2008;27:1030–1032.
- ,,,.Increasing incidence of empyema complicating childhood community‐acquired pneumonia in the United States.Clin Infect Dis.2010;50:805–813.
- ,,,,.National hospitalization trends for pediatric pneumonia and associated complications.Pediatrics.2010;126:204–213.
- ,,, et al.Empyema associated with community‐acquired pneumonia: A Pediatric Investigator's Collaborative Network on Infections in Canada (PICNIC) study.BMC Infect Dis.2008;8:129.
- ,,,,.Pleural empyema in children.Ann Thorac Surg.1970;10:37–44.
- ,,.Management of streptococcal empyema.Ann Thorac Surg.1966;2:658–664.
- ,.Thoracoscopy in the management of empyema in children.J Pediatr Surg.1993;28:1128–1132.
- ,,,.Surgical treatment of parapneumonic empyema.Pediatr Pulmonol.1996;22:348–356.
- ,.The controversial role of decortication in the management of pediatric empyema.J Thorac Cardiovasc Surg.1988;96:166–170.
- ,,,,,.Postpneumonic empyema in children treated by early decortication.Eur J Pediatr Surg.1997;7:135–137.
- ,.Video‐assisted thoracoscopic surgery in the management of pediatric empyema.JSLS.1997;1:251–3.
- ,,,.Early video‐assisted thoracic surgery in the management of empyema.Pediatrics.1999;103:e63.
- ,,,,.Early definitive intervention by thoracoscopy in pediatric empyema.J Pediatr Surg.1999;34:178–180; discussion80–81.
- ,,,,.Thoracoscopy in the management of pediatric empyema.J Pediatr Surg.1995;30:1211–1215.
- ,,,,.Therapy of parapneumonic effusions in children: Video‐assisted thoracoscopic surgery versus conventional thoracostomy drainage.Pediatrics.2006;118:e547–e553.
- ,.Primary operative management for pediatric empyema: Decreases in hospital length of stay and charges in a national sample.Arch Pediatr Adolesc Med.2008;162:44–48.
- ,,, et al.Comparison of urokinase and video‐assisted thoracoscopic surgery for treatment of childhood empyema.Am J Respir Crit Care Med.2006;174:221–227.
- ,,, et al.Thoracoscopic decortication vs tube thoracostomy with fibrinolysis for empyema in children: A prospective, randomized trial.J Pediatr Surg.2009;44:106–111; discussion11.
- ,,,.Corticosteroids and mortality in children with bacterial meningitis.JAMA.2008;299:2048–2055.
- ,,,,.Intravenous immunoglobulin in children with streptococcal toxic shock syndrome.Clin Infect Dis.2009;49:1369–1376.
- ,,, et al.Deaths attributed to pediatric complex chronic conditions: National trends and implications for supportive care services.Pediatrics.2001;107:e99.
- ,.Multiple regression of cost data: Use of generalised linear models.J Health Serv Res Policy.2004;9:197–204.
- ,,,.A robustified modeling approach to analyze pediatric length of stay.Ann Epidemiol.2005;15:673–677.
- ,,.Correlates of length of stay, cost of care, and mortality among patients hospitalized for necrotizing fasciitis.Epidemiol Infect.2007;135:868–876.
- ,,,,,.Health care costs of adults treated for attention‐deficit/hyperactivity disorder who received alternative drug therapies.J Manag Care Pharm.2007;13:561–569.
- .The role of the propensity score in estimating dose‐response functions.Biometrika.2000;87:706–710.
- ,,,,.Experience with video‐assisted thoracoscopic surgery in the management of complicated pneumonia in children.J Pediatr Surg.2001;36:316–319.
- ,,, et al.VATS debridement versus thoracotomy in the treatment of loculated postpneumonia empyema.Ann Thorac Surg.1996;61:1626–1630.
- ,,,,.Randomised trial of intrapleural urokinase in the treatment of childhood empyema.Thorax.2002;57:343–347.
- ,,,,,.Intrapleural urokinase versus normal saline in the treatment of complicated parapneumonic effusions and empyema. A randomized, double‐blind study.Am J Respir Crit Care Med.1999;159:37–42.
- ,,.Randomised controlled trial of intrapleural streptokinase in community acquired pleural infection.Thorax.1997;52:416–421.
- ,,,,.Intrapleural streptokinase for empyema and complicated parapneumonic effusions.Am J Respir Crit Care Med.2004;170:49–53.
- ,,, et al.U.K. Controlled trial of intrapleural streptokinase for pleural infection.N Engl J Med.2005;352:865–874.
- ,.Intra‐pleural fibrinolytic therapy versus conservative management in the treatment of adult parapneumonic effusions and empyema.Cochrane Database Syst Rev.2008:CD002312.
- ,,,.Intrapleural fibrinolytic agents for empyema and complicated parapneumonic effusions: A meta‐analysis.Chest.2006;129:783–790.
- ,,.Cost‐effectiveness of competing strategies for the treatment of pediatric empyema.Pediatrics.2008;121:e1250–e1257.
- ,,.Costs of treating children with complicated pneumonia: A comparison of primary video‐assisted thoracoscopic surgery and chest tube placement.Pediatr Pulmonol.2010;45:71–77.
- .Unwarranted variation in pediatric medical care.Pediatr Clin North Am.2009;56:745–755.
Community‐acquired pneumonia, the most common serious bacterial infection in childhood, may be complicated by parapneumonic effusion (ie, complicated pneumonia).1 Children with complicated pneumonia require prolonged hospitalization and frequently undergo multiple pleural fluid drainage procedures.2 Additionally, the incidence of complicated pneumonia has increased,37 making the need to define appropriate therapy even more pressing. Defining appropriate therapy is challenging for the individual physician as a result of inconsistent and insufficient evidence, and wide variation in treatment practices.2, 8
Historically, thoracotomy was performed only if initial chest tube placement did not lead to clinical improvement.9, 10 Several authors, noting the rapid resolution of symptoms in children undergoing earlier thoracotomy, advocated for the use of thoracotomy as initial therapy rather than as a procedure of last resort.114 The advent of less invasive techniques such as video‐assisted thoracoscopic surgery (VATS) has served as an additional impetus to consider surgical drainage as the initial treatment strategy.1518 Few well‐designed studies have examined the relative efficacy of these interventions.2, 1922 Published randomized trials were single center, enrolled few patients, and arrived at different conclusions.19, 21, 22 In addition, these trials did not examine other important outcomes such as requirement for additional pleural fluid drainage procedures and hospital readmission. Two large retrospective multicenter studies found modest reductions in length of stay (LOS) and substantial decreases in the requirement for additional pleural fluid drainage procedures in children undergoing initial VATS compared with initial chest tube placement.2, 20 However, Shah et al2 included relatively few patients undergoing VATS. Li et al20 combined patients undergoing initial thoracentesis, initial chest tube placement, late pleural fluid drainage (by any method), and no pleural fluid drainage into a single non‐operative management category, precluding conclusions about the relative benefits of chest tube placement compared with VATS. Neither study2, 20 examined the role of chemical fibrinolysis, a therapy which has been associated with outcomes comparable to VATS in two small randomized trials.21, 22
The objectives of this multicenter study were to describe the variation in the initial management strategy along with associated outcomes of complicated pneumonia in childhood and to determine the comparative effectiveness of different pleural fluid drainage procedures.
Methods
Data Source
The Pediatric Health Information System (PHIS), which contains resource utilization data from 40 freestanding children's hospitals, provided data for this multicenter retrospective cohort study. Participating hospitals are located in noncompeting markets of 27 states plus the District of Columbia. The PHIS database includes patient demographics, diagnoses, and procedures as well as data for all drugs, radiologic studies, laboratory tests, and supplies charged to each patient. Data are de‐identified, however encrypted medical record numbers allow for tracking individual patients across admissions. The Child Health Corporation of America (Shawnee Mission, KS) and participating hospitals jointly assure data quality and reliability as described previously.23, 24 The Children's Hospital of Philadelphia Institutional Review Board reviewed and approved this study.
Patients
Children 18 years of age receiving a pleural drainage procedure for complicated pneumonia were eligible if they were discharged from participating hospitals between January 1, 2004 and June 30, 2009. Study participants met the following criteria: 1) discharge diagnosis of pneumonia (International Classification of Diseases, 9th revision [ICD‐9] discharge diagnosis codes 480.x‐483.x, 485.x‐487.x), 2) discharge diagnosis of pleural effusion (ICD‐9 codes 510.0, 510.9, 511.0, 511.1, or 511.9), and 3) billing charge for antibiotics on the first day of hospitalization. Additionally, the primary discharge diagnosis had to be either pneumonia or pleural effusion. Patients were excluded if they did not undergo pleural fluid drainage or if their initial pleural fluid drainage procedure was thoracentesis.
Study Definitions
Pleural drainage procedures were identified using ICD‐9 procedure codes for thoracentesis (34.91), chest tube placement (34.04), VATS (34.21), and thoracotomy (34.02 or 34.09). Fibrinolysis was defined as receipt of urokinase, streptokinase, or alteplase within two days of initial chest tube placement.
Acute conditions or complications included influenza (487, 487.0, 487.1, 487.8, 488, or V04.81) and hemolytic‐uremic syndrome (283.11). Chronic comorbid conditions (CCCs) (eg, malignancy) were identified using a previously reported classification scheme.25 Billing data were used to classify receipt of mechanical ventilation and medications on the first day of hospitalization.
Measured Outcomes
The primary outcomes were hospital LOS (both overall and post‐initial procedure), requirement for additional pleural drainage procedures, total cost for index hospitalization, all‐cause readmission within 14 days after index hospital discharge, and total cost of the episode (accounting for the cost of readmissions).
Measured Exposures
The primary exposure of interest was the initial pleural fluid drainage procedure, classified as chest tube placement without fibrinolysis, chest tube placement with fibrinolysis, VATS, or thoracotomy.
Statistical Analysis
Variables were summarized using frequencies and percentages for categorical variables, and median, interquartile range (IQR), and range for continuous variables. Outcomes by initial pleural drainage procedure were compared using chi‐squared tests for categorical variables and Kruskal‐Wallis tests for continuous variables.
Multivariable analysis was performed to account for potential confounding by observed baseline variables. For dichotomous outcome variables, modeling consisted of logistic regression using generalized estimating equations to account for hospital clustering. For continuous variables, a mixed model approach was used, treating hospital as a random effect. Log transformation was applied to the right‐skewed outcome variables (LOS and cost). Cost outcomes remained skewed following log transformation, thus gamma mixed models were applied.2629 Odds ratios and 95% confidence intervals (CIs) were reported for comparison of dichotomous outcomes and the adjusted means and 95% CIs were reported for continuous outcomes after appropriate back transformation.
Additional analyses addressed the potential impact of confounding by indication inherent in any observational study. First, patients with an underlying CCC were excluded to ensure that our results would be generalizable to otherwise healthy children with community‐acquired pneumonia. Second, patients undergoing pleural drainage >2 days after hospitalization were excluded to minimize the effect of residual confounding related to differences in timing of the initial drainage procedure. Third, the analysis was repeated using a generalized propensity score as an additional method to account for confounding by indication for the initial drainage procedure.30 Propensity scores, constructed using a multivariable generalized logit model, included all variables listed in Table 1. The inverse of the propensity score was included as a weight in each multivariable model described previously. Only the primary multivariable analyses are presented as the results of the propensity score analysis were nearly identical to the primary analyses.
| Overall | Chest Tube Without Fibrinolysis | Chest Tube With Fibrinolysis | Thoracotomy | VATS | P Value | |
|---|---|---|---|---|---|---|
| ||||||
| N | 3500 | 1672 (47.8) | 623 (17.8) | 797 (22.8) | 408 (11.7) | |
| Age | ||||||
| <1 year | 335 (9.6) | 176 (10.5) | 56 (9.0) | 78 (9.8) | 25 (6.1) | |
| 1 year | 475 (13.6) | 238 (14.2) | 98 (15.7) | 92 (11.5) | 47 (11.5) | 0.003 |
| 24 years | 1230 (35.1) | 548 (32.8) | 203 (32.6) | 310 (38.9) | 169 (41.4) | |
| 59 years | 897 (25.6) | 412 (24.6) | 170 (27.3) | 199 (25.0) | 116 (28.4) | |
| 1014 years | 324 (9.3) | 167 (10.0) | 61 (9.8) | 65 (8.2) | 31 (7.6) | |
| 1518 years | 193 (5.5) | 106 (6.3) | 29 (4.6) | 40 (5.0) | 18 (4.4) | |
| >18 years | 46 (1.3) | 25 (1.5) | 6 (0.96) | 13 (1.6) | 2 (0.5) | |
| Comorbid Conditions | ||||||
| Cardiac | 69 (2.0) | 43 (2.6) | 14 (2.3) | 12 (1.5) | 0 (0.0) | 0.006 |
| Malignancy | 81 (2.3) | 31 (1.9) | 18 (2.9) | 21 (2.6) | 11 (2.7) | 0.375 |
| Neurological | 138 (3.9) | 73 (4.4) | 20 (3.2) | 34 (4.3) | 11 (2.7) | 0.313 |
| Any Other Condition | 202 (5.8) | 96 (5.7) | 40 (6.4) | 47 (5.9) | 19 (4.7) | 0.696 |
| Payer | ||||||
| Government | 1240 (35.6) | 630 (37.8) | 224 (36.0) | 259 (32.7) | 127 (31.3) | <0.001 |
| Private | 1383 (39.7) | 607 (36.4) | 283 (45.4) | 310 (39.2) | 183 (45.07) | |
| Other | 864 (24.8) | 430 (25.8) | 116 (18.6) | 222 (28.1) | 96 (23.65) | |
| Race | ||||||
| Non‐Hispanic White | 1746 (51.9) | 838 (51.6) | 358 (59.7) | 361 (47.8) | 189 (48.7) | <0.001 |
| Non‐Hispanic Black | 601 (17.9) | 318 (19.6) | 90 (15.0) | 128 (17.0) | 65 (16.8) | |
| Hispanic | 588 (17.5) | 280 (17.3) | 73 (12.2) | 155 (20.5) | 80 (20.6) | |
| Asian | 117 (3.5) | 47 (2.9) | 20 (3.3) | 37 (4.9) | 13 (3.4) | |
| Other | 314 (9.3) | 140 (8.6) | 59 (9.8) | 74 (9.8) | 41 (10.6) | |
| Male Sex | 1912 (54.6) | 923 (55.2) | 336 (53.9) | 439 (55.1) | 214 (52.5) | 0.755 |
| Radiology | ||||||
| CT, no US | 1200 (34.3) | 600 (35.9) | 184 (29.5) | 280 (35.1) | 136 (33.3) | <0.001 |
| CT and US | 221 (6.3) | 84 (5.0) | 53 (8.5) | 61 (7.7) | 23 (5.6) | |
| US, no CT | 799 (22.8) | 324 (19.4) | 178 (28.6) | 200 (25.1) | 97 (23.8) | |
| No US, no CT | 1280 (36.6) | 664 (39.7) | 208 (33.4) | 256 (32.1) | 152 (37.3) | |
| Empiric Antibiotic Regimen | ||||||
| Cephalosporins alone | 448 (12.8) | 181 (10.83) | 126 (20.2) | 73 (9.2) | 68 (16.7) | <0.001 |
| Cephalosporin and clindamycin | 797 (22.8) | 359 (21.5) | 145 (23.3) | 184 (23.1) | 109 (26.7) | |
| Other antibiotic combination | 167 (4.8) | 82 (4.9) | 30 (4.8) | 38 (4.8) | 17 (4.2) | |
| Cephalosporin and vancomycin | 2088 (59.7) | 1050 (62.8) | 322 (51.7) | 502 (63.0) | 214 (52.5) | |
| Mechanical ventilation | 494 (14.1) | 251 (15.0) | 75 (12.0) | 114 (14.3) | 54 (13.2) | 0.307 |
| Corticosteroids | 520 (14.9) | 291 (17.4) | 72 (11.6) | 114 (14.3) | 43 (10.5) | <0.001 |
| Blood product transfusionsb | 761 (21.7) | 387 (23.2) | 145 (23.3) | 161 (20.2) | 68 (16.7) | 0.018 |
| Vasoactive infusionsc | 381 (10.9) | 223 (13.3) | 63 (10.1) | 72 (9.0) | 23 (5.6) | <0.001 |
| Admission to intensive care | 1397 (39.9) | 731 (43.7) | 234 (37.6) | 296 (37.1) | 136 (33.3) | <0.001 |
| Extracorporeal membranous oxygenation | 18 (0.5) | 13 (0.8) | 2 (0.3) | 3 (0.4) | 0 (0.0) | 0.163 |
| Hemolytic‐uremic syndrome | 31 (0.9) | 15 (0.9) | 6 (1.0) | 7 (0.9) | 3 (0.7) | 0.985 |
| Influenza | 108 (3.1) | 53 (3.2) | 27 (4.3) | 23 (2.9) | 5 (1.2) | 0.044 |
| Arterial blood gas measurements | 0 (0,1) | 0 (0, 2) | 0 (0,1) | 0 (0, 1) | 0 (0, 1) | <0.001 |
| Days to first procedure | 1 (0, 3) | 1 (0, 2) | 1 (1, 3) | 1 (1, 3) | 1 (1, 3) | <0.001 |
Medical records of a randomly selected subset of subjects from 6 hospitals were reviewed to determine the accuracy of our algorithm in identifying patients with complicated pneumonia; these subjects represented 1% of the study population. For the purposes of medical record review, complicated pneumonia was defined by the following: 1) radiologically‐confirmed lung infiltrate; 2) moderate or large pleural effusion; and 3) signs and symptoms of lower respiratory tract infection. Complicated pneumonia was identified in 118 of 120 reviewed subjects for a positive predictive value of 98.3%.
All analyses were clustered by hospital. Analyses were performed using SAS version 9.2 (SAS Institute, Cary, NC). A two‐tailed P < 0.05 was considered statistically significant.
Results
Patient Characteristics
During the study period, 9,680 subjects had complicated pneumonia. Subjects were excluded if they did not have a pleural drainage procedure (n = 5798), or if thoracentesis was the first pleural fluid drainage procedure performed (n = 382). The remaining 3500 patients were included. Demographic characteristics are summarized in Table 1. The median patient age was 4.1 years (IQR: 2.17.2 years). An underlying CCC was present in 424 (12.1%) patients. There was no association between type of drainage procedure and mechanical ventilation. However, factors associated with more severe systemic illness, such as blood product transfusion, were more common among those undergoing initial chest tube placement with or without fibrinolysis (Table 1).
Initial Pleural Fluid Drainage Procedures
The primary procedures included chest tube without fibrinolysis (47.8%); chest tube with fibrinolysis (17.8%); thoracotomy (22.8%); and VATS (11.7%) (Table 1). The proportion of patients undergoing primary chest tube placement with fibrinolysis increased over time from 14.2% in 2004 to 30.0% in 2009 (P < 0.001; chi‐squared test for trend). The initial procedure varied by hospital with the greatest proportion of patients undergoing primary chest tube placement without fibrinolysis at 28 (70.0%) hospitals, chest tube placement with fibrinolysis at 5 (12.5%) hospitals, thoracotomy at 5 (12.5%) hospitals, and VATS at 2 (5.0%) hospitals (Figure 1). The median proportion of patients undergoing primary VATS across all hospitals was 11.5% (IQR: 3.9%‐26.5%) (Figure 1). The median time to first procedure was 1 day (IQR: 03 days).
Outcome Measures
Variation in outcomes occurred across hospitals. Additional pleural drainage procedures were performed in a median of 20.9% of patients with a range of 6.8% to 44.8% (IQR: 14.5%‐25.3%) of patients across all hospitals. Median LOS was 10 days with a range of 714 days (IQR: 8.511 days) and the median LOS following the initial pleural fluid drainage procedure was 8 days with a range of 6 to 13 days (IQR: 78 days). Variation in timing of the initial pleural fluid drainage procedure explained 9.6% of the variability in LOS (Spearman rho, 0.31; P < 0.001).
Overall, 118 (3.4%) patients were readmitted within 14 days of index discharge; the median readmission rate was 3.8% with a range of 0.8% to 33.3% (IQR: 2.1%‐5.8%) across hospitals. The median total cost of the index hospitalization was $19,574 (IQR: $13,791‐$31,063). The total cost for the index hospitalization exceeded $54,215 for 10% of patients and the total cost of the episode exceeded $55,208 for 10% of patients. Unadjusted outcomes, stratified by primary pleural fluid drainage procedure, are summarized in Table 2.
| Overall | Chest Tube Without Fibrinolysis | Chest Tube With Fibrinolysis | Thoracotomy | VATS | P Valueb | |
|---|---|---|---|---|---|---|
| ||||||
| Additional Procedure | 716 (20.5) | 331 (19.8) | 144 (23.1) | 197 (24.7) | 44 (10.8) | <0.001 |
| Readmission within 14 days | 118 (3.4) | 54 (3.3) | 13 (2.1) | 32 (4.0) | 19 (4.7) | 0.096 |
| Total LOS (days) | 10 (7, 14) | 10 (7, 14) | 9 (7, 13) | 10 (7, 14) | 9 (7, 12) | <.001 |
| Post‐initial Procedure LOS (days) | 8 (5, 12) | 8 (6, 12) | 7 (5, 10) | 8 (5, 12) | 7 (5, 10) | <0.001 |
| Total Cost, Index Hospitalization ($)e | 19319 (13358, 30955) | 19951 (13576, 32018)c | 19565 (13209, 32778)d | 20352 (14351, 31343) | 17918 (13531, 25166) | 0.016 |
| Total Cost, Episode of Illness ($)e | 19831 (13927, 31749) | 20151 (13764, 32653) | 19593 (13210, 32861) | 20573 (14419, 31753) | 18344 (13835, 25462) | 0.029 |
In multivariable analysis, differences in total LOS and post‐procedure LOS were not significant (Table 3). The odds of additional drainage procedures were higher for all drainage procedures compared with initial VATS (Table 3). Patients undergoing initial chest tube placement with fibrinolysis were less likely to require readmission compared with patients undergoing initial VATS (Table 3). The total cost for the episode of illness (including the cost of readmission) was significantly less for those undergoing primary chest tube placement without fibrinolysis compared with primary VATS. The results of subanalyses excluding patients with an underlying CCC (Supporting Appendix online, Table 4) and restricting the cohort to patients undergoing pleural drainage within two days of admission (Supporting Appendix online, Table 5) were similar to the results of our primary analysis with one exception; in the latter subanalysis, children undergoing initial chest tube placement without fibrinolysis were also less likely to require readmission compared with patients undergoing initial VATS.
| Adjusted OR (95% CI)a | P Value | |
|---|---|---|
| ||
| Additional pleural drainage procedure | ||
| Chest tube without fibrinolysis | 1.82 (1.103.00) | .019 |
| Chest tube with fibrinolysis | 2.31 (1.443.72) | <0.001 |
| Thoracotomy | 2.59 (1.624.14) | <0.001 |
| VATS | Reference | |
| Readmission within 14 days | ||
| Chest tube without fibrinolysis | 0.61 (0.361.05) | .077 |
| Chest tube with fibrinolysis | 0.45 (0.230.86) | .015 |
| Thoracotomy | 0.85 (0.521.39) | .521 |
| VATS | Reference | |
| Adjusted Mean (95% CI)a | P Value | |
| Total LOS (days) | ||
| Chest tube without fibrinolysis | 8.0 (7.88.2) | .339 |
| Chest tube with fibrinolysis | 8.1 (7.98.3) | .812 |
| Thoracotomy | 8.1 (7.98.3) | .632 |
| VATS | 8.1 (7.98.3) | Ref |
| Post‐initial procedure LOS (days) | ||
| Chest tube without fibrinolysis | 7.3 (7.07.5) | .512 |
| Chest tube with fibrinolysis | 7.5 (7.27.8) | .239 |
| Thoracotomy | 7.3 (7.07.6) | .841 |
| VATS | 7.3 (7.17.6) | Reference |
| Total cost, index hospitalization ($) | ||
| Chest tube without fibrinolysis | 22928 (2200023895 | .012 |
| Chest tube with fibrinolysis | 23621 (2263124655) | .657 |
| Thoracotomy | 23386 (2241924395 | .262 |
| VATS | 23820 (2280824878) | Reference |
| Total cost, episode of illness ($) | ||
| Chest tube without fibrinolysis | 23218 (2227824199) | .004 |
| Chest tube with fibrinolysis | 23749 (2275224790) | .253 |
| Thoracotomy | 23673 (2269324696) | .131 |
| VATS | 24280 (2324425362) | Reference |
Discussion
This multicenter study is the largest to evaluate the management of children hospitalized with complicated pneumonia. We found considerable variation in initial management and outcomes across hospitals. Differences in timing of the initial drainage procedure explained only a small amount of the variability in outcomes. Children undergoing initial VATS less commonly required additional drainage procedures while children undergoing initial chest tube placement with fibrinolysis less commonly required readmission. Differences in total and post‐procedure LOS were not statistically significant. Differences in cost, while statistically significant, were of marginal relevance.
Previous studies have also shown significant variation in treatment and outcomes of children with complicated pneumonia across hospitals.2, 8 Our study provides data from additional hospitals, includes a substantially larger number of patients undergoing initial VATS, distinguishes between fibrinolysis recipients and nonrecipients, and is the first to compare outcomes between four different initial drainage strategies. The creation of national consensus guidelines might reduce variability in initial management strategies, although the variability in outcomes across hospitals in the current study could not be explained simply by differences in the type or timing of the initial drainage procedure. Thus, future studies examining hospital‐level factors may play an important role in improving quality of care for children with complicated pneumonia.
Patients with initial thoracotomy or chest tube placement with or without fibrinolysis more commonly received additional drainage procedures than patients with initial VATS. This difference remained when patients with CCCs were excluded from the analysis and when the analysis was limited to patients undergoing pleural fluid drainage within 2 days of hospitalization. Several small, randomized trials demonstrated conflicting results when comparing initial chest tube placement with fibrinolysis and VATS. St. Peter et al22 reported that 3 (17%) of 18 patients undergoing initial chest tube placement with fibrinolysis and none of the 18 patients undergoing initial VATS received additional pleural drainage procedures. Sonnappa et al21 found no differences between the two groups. Kurt et al19 did not state the proportion of patients receiving additional procedures. However, the mean number of drainage procedures was 2.25 among the 8 patients undergoing initial chest tube placement while none of the 10 patients with VATS received additional drainage.19
Thoracotomy is often perceived as a definitive procedure for treatment of complicated pneumonia. However, several possibilities exist to explain why additional procedures were performed less frequently in patients undergoing initial VATS compared with initial thoracotomy. The limited visual field in thoracotomy may lead to greater residual disease post‐operatively in those receiving thoracotomy compared with VATS.31 Additionally, thoracotomy substantially disrupts the integrity of the chest wall and is consequently associated with complications such as bleeding and air leak into the pleural cavity more often than VATS.31, 32 It is thus possible that some of the additional procedures in patients receiving initial thoracotomy were necessary for management of thoracotomy‐associated complications rather than for failure of the initial drainage procedure.
Similar to the randomized trials by Sonnappa et al21 and St. Peter et al,22 differences in the overall and post‐procedure LOS were not significant among patients undergoing initial VATS compared with initial chest tube placement with fibrinolysis. However, chest tube placement without fibrinolysis did not result in significant differences in LOS compared with initial VATS. In the only pediatric randomized trial, the 29 intrapleural urokinase recipients had a 2 day shorter LOS compared with the 29 intrapleural saline recipients.33 Several small, randomized controlled trials of adults with complicated pneumonia reported improved pleural fluid drainage among intrapleural fibrinolysis recipients compared with non‐recipients.3436 However, a large multicenter randomized trial in adults found no differences in mortality, requirement for surgical drainage, or LOS between intrapleural streptokinase and placebo recipients.37 Subsequent meta‐analyses of randomized trials in adults also demonstrated no benefit to fibrinolysis.38, 39 In the context of the increasing use of intrapleural fibrinolysis in children with complicated pneumonia, our results highlight the need for a large, multicenter randomized controlled trial to determine whether chest tube with fibrinolysis is superior to chest tube alone.
Two small randomized trials21, 22 and a decision analysis40 identified chest tube with fibrinolysis as the most economical approach to children with complicated pneumonia. However, the costs did not differ significantly between patients undergoing initial VATS or initial chest tube placement with fibrinolysis in our study. The least costly approach was initial chest tube placement without fibrinolysis. Unlike the randomized controlled trials, we considered costs associated with readmissions in determining the total costs. Shah et al41 found no difference in total charges for patients undergoing initial VATS compared with initial chest tube placement; however, patients undergoing initial VATS were concentrated in a few centers, making it difficult to determine the relative importance of procedural and hospital factors.
This multicenter observational study has several limitations. First, discharge diagnosis coding may be unreliable for specific diseases. However, our rigorous definition of complicated pneumonia, supported by the high positive predictive value as verified by medical record review, minimizes the likelihood of misclassification.
Second, unmeasured confounding or residual confounding by indication for the method of pleural drainage may occur, potentially influencing our results in two disparate ways. If patients with more severe systemic illness were too unstable for operative interventions, then our results would be biased towards worse outcomes for children undergoing initial chest tube placement. We adjusted for several variables associated with a greater systemic severity of illness, including intensive care unit admission, making this possibility less likely. We also could not account for some factors associated with more severe local disease such as the size and character of the effusion. We suspect that patients with more extensive local disease (ie, loculated effusions) would have worse outcomes than other patients, regardless of initial procedure, and that these patients would also be more likely to undergo primary surgical drainage. Thus, this study may have underestimated the benefit of initial surgical drainage (eg, VATS) compared with nonsurgical drainage (ie, chest tube placement).
Third, misclassification of the method of initial pleural drainage may have occurred. Patients transferred from another institution following chest tube placement could either be classified as not receiving pleural drainage and thus excluded from the study or classified as having initial VATS or thoracotomy if the reason for transfer was chest tube treatment failure. Additionally, we could not distinguish routine use of fibrinolysis from fibrinolysis to maintain chest tube patency. Whether such misclassification would falsely minimize or maximize differences in outcomes between the various groups remains uncertain. Fourth, because this study only included tertiary care children's hospitals, these data are not generalizable to community settings. VATS requires specialized surgical training that may be unavailable in some areas. Finally, this study demonstrates the relative efficacy of various pleural fluid drainage procedures on short‐term clinical outcomes and resource utilization. However, long‐term functional outcomes should be measured in future prospective studies.
Conclusions
In conclusion, emphasis on evidence driven treatment to optimize care has led to an increasing examination of unwarranted practice variation.42 The lack of evidence for best practice makes it difficult to define unwarranted variation in the treatment of complicated pneumonia. Our study demonstrates the large variability in practice and raises additional questions regarding the optimal drainage strategies. Published randomized trials have focused on comparisons between chest tube placement with fibrinolysis and VATS. However, our data suggest that future randomized trials should include chest tube placement without fibrinolysis as a treatment strategy. In determining the current best treatment for patients with complicated pneumonia, a clinician must weigh the impact of needing an additional procedure in approximately one‐quarter of patients undergoing initial chest tube placement (with or without fibrinolysis) with the risks of general anesthesia and readmission in patients undergoing initial VATS.
Acknowledgements
Dr. Hall had full access to all the data in the study and takes responsibility for the integrity of the data and accuracy of the analysis.
- ,.Parapneumonic pleural effusion and empyema in children. Review of a 19‐year experience, 1962–1980.Clin Pediatr (Phila).1983;22:414–419.
- ,,,,.Primary early thoracoscopy and reduction in length of hospital stay and additional procedures among children with complicated pneumonia: Results of a multicenter retrospective cohort study.Arch Pediatr Adolesc Med.2008;162:675–681.
- ,.Empyema hospitalizations increased in US children despite pneumococcal conjugate vaccine.Pediatrics.2010;125:26–33.
- ,,, et al.Impact of the pneumococcal conjugate vaccine on pneumococcal parapneumonic empyema.Pediatr Infect Dis J.2006;25:250–254.
- ,,,,.Five‐fold increase in pediatric parapneumonic empyema since introduction of pneumococcal conjugate vaccine.Pediatric Infect Dis J.2008;27:1030–1032.
- ,,,.Increasing incidence of empyema complicating childhood community‐acquired pneumonia in the United States.Clin Infect Dis.2010;50:805–813.
- ,,,,.National hospitalization trends for pediatric pneumonia and associated complications.Pediatrics.2010;126:204–213.
- ,,, et al.Empyema associated with community‐acquired pneumonia: A Pediatric Investigator's Collaborative Network on Infections in Canada (PICNIC) study.BMC Infect Dis.2008;8:129.
- ,,,,.Pleural empyema in children.Ann Thorac Surg.1970;10:37–44.
- ,,.Management of streptococcal empyema.Ann Thorac Surg.1966;2:658–664.
- ,.Thoracoscopy in the management of empyema in children.J Pediatr Surg.1993;28:1128–1132.
- ,,,.Surgical treatment of parapneumonic empyema.Pediatr Pulmonol.1996;22:348–356.
- ,.The controversial role of decortication in the management of pediatric empyema.J Thorac Cardiovasc Surg.1988;96:166–170.
- ,,,,,.Postpneumonic empyema in children treated by early decortication.Eur J Pediatr Surg.1997;7:135–137.
- ,.Video‐assisted thoracoscopic surgery in the management of pediatric empyema.JSLS.1997;1:251–3.
- ,,,.Early video‐assisted thoracic surgery in the management of empyema.Pediatrics.1999;103:e63.
- ,,,,.Early definitive intervention by thoracoscopy in pediatric empyema.J Pediatr Surg.1999;34:178–180; discussion80–81.
- ,,,,.Thoracoscopy in the management of pediatric empyema.J Pediatr Surg.1995;30:1211–1215.
- ,,,,.Therapy of parapneumonic effusions in children: Video‐assisted thoracoscopic surgery versus conventional thoracostomy drainage.Pediatrics.2006;118:e547–e553.
- ,.Primary operative management for pediatric empyema: Decreases in hospital length of stay and charges in a national sample.Arch Pediatr Adolesc Med.2008;162:44–48.
- ,,, et al.Comparison of urokinase and video‐assisted thoracoscopic surgery for treatment of childhood empyema.Am J Respir Crit Care Med.2006;174:221–227.
- ,,, et al.Thoracoscopic decortication vs tube thoracostomy with fibrinolysis for empyema in children: A prospective, randomized trial.J Pediatr Surg.2009;44:106–111; discussion11.
- ,,,.Corticosteroids and mortality in children with bacterial meningitis.JAMA.2008;299:2048–2055.
- ,,,,.Intravenous immunoglobulin in children with streptococcal toxic shock syndrome.Clin Infect Dis.2009;49:1369–1376.
- ,,, et al.Deaths attributed to pediatric complex chronic conditions: National trends and implications for supportive care services.Pediatrics.2001;107:e99.
- ,.Multiple regression of cost data: Use of generalised linear models.J Health Serv Res Policy.2004;9:197–204.
- ,,,.A robustified modeling approach to analyze pediatric length of stay.Ann Epidemiol.2005;15:673–677.
- ,,.Correlates of length of stay, cost of care, and mortality among patients hospitalized for necrotizing fasciitis.Epidemiol Infect.2007;135:868–876.
- ,,,,,.Health care costs of adults treated for attention‐deficit/hyperactivity disorder who received alternative drug therapies.J Manag Care Pharm.2007;13:561–569.
- .The role of the propensity score in estimating dose‐response functions.Biometrika.2000;87:706–710.
- ,,,,.Experience with video‐assisted thoracoscopic surgery in the management of complicated pneumonia in children.J Pediatr Surg.2001;36:316–319.
- ,,, et al.VATS debridement versus thoracotomy in the treatment of loculated postpneumonia empyema.Ann Thorac Surg.1996;61:1626–1630.
- ,,,,.Randomised trial of intrapleural urokinase in the treatment of childhood empyema.Thorax.2002;57:343–347.
- ,,,,,.Intrapleural urokinase versus normal saline in the treatment of complicated parapneumonic effusions and empyema. A randomized, double‐blind study.Am J Respir Crit Care Med.1999;159:37–42.
- ,,.Randomised controlled trial of intrapleural streptokinase in community acquired pleural infection.Thorax.1997;52:416–421.
- ,,,,.Intrapleural streptokinase for empyema and complicated parapneumonic effusions.Am J Respir Crit Care Med.2004;170:49–53.
- ,,, et al.U.K. Controlled trial of intrapleural streptokinase for pleural infection.N Engl J Med.2005;352:865–874.
- ,.Intra‐pleural fibrinolytic therapy versus conservative management in the treatment of adult parapneumonic effusions and empyema.Cochrane Database Syst Rev.2008:CD002312.
- ,,,.Intrapleural fibrinolytic agents for empyema and complicated parapneumonic effusions: A meta‐analysis.Chest.2006;129:783–790.
- ,,.Cost‐effectiveness of competing strategies for the treatment of pediatric empyema.Pediatrics.2008;121:e1250–e1257.
- ,,.Costs of treating children with complicated pneumonia: A comparison of primary video‐assisted thoracoscopic surgery and chest tube placement.Pediatr Pulmonol.2010;45:71–77.
- .Unwarranted variation in pediatric medical care.Pediatr Clin North Am.2009;56:745–755.
Copyright © 2011 Society of Hospital Medicine
