User login
Discharge by Noon: The Time Has Come for More Times to be the Right Time
Hospitalists have become well versed in campaigns championing safe, efficient, and timely discharges, as well as in the pragmatic challenges of achieving them. Successfully discharging a patient from the hospital requires synchronizing several elements; as a result, improvement efforts focus on promoting shared mental models and team identification of early discharges. The urgency for timely discharges, much like (and unlike1) hotel check-out times, becomes increasingly relevant when hospitals are functioning at or beyond full capacity. As inpatient medical care grows increasingly more specialized, promoting high-quality discharges theoretically allows for not only more beds, but also that the right bed is available for the right patient at the right time. In addition, financial realities in terms of reimbursement and the high cost of adding capacity imply that hospitals need to maximize throughput from the beds they already have. For these reasons, hospital administrators and operational leaders have focused on early discharges as a goal—and have often used discharge before noon (DCBN) as the metric to measure performance.
In this issue of the Journal of Hospital Medicine, Destino et al. reported that it is possible to achieve a higher percentage of early discharges, which allowed for decompression of post-anesthesia care and emergency areas without a measurable negative impact on patient or family satisfaction or length of stay (LOS).2 The improvement they report is remarkable. However, it will be important for them to report back, as quality improvement projects often revert to prior state unless the processes are reinforced and embedded in hospital culture. In addition, what goes unreported in Destino et al. are the unmeasured and unanticipated outcomes related to focusing on a single, laudable goal. This study and others have yet to confirm that systems have enough resiliency to improve discharge timeliness without diverting resources from other aspects of care.3 In other words, can inpatient teams do everything at the same time without sacrificing quality; ie, improve discharge timeliness, accept and admit new patients faster, respond to deteriorating patients, spend enough time with patients and families to meet their needs (and validated survey expectations), and in educational settings, meet the learning needs of trainees?4 This may prove to be true if implementation techniques are individualized to hospitals, services, and units and are incorporated into existing workflows, minimizing extraneous “asks” on already overtaxed providers. Evidence to support this would go a long way in engaging stakeholders to prioritize quality discharges.
In this issue, too, James, et al. ask the question “if DCBN is a good indicator of shorter LOS or is DCBN an arbitrary indicator.”5 The answer may be yes, no, both, maybe, and it depends. Certainly, no pathophysiological reasons exist for a certain time of day to be the “right” time for discharge. The key question for hospitalists and health systems leaders is whether setting time goals leads clinicians to delay discharges of medically and logistically ready patients in the afternoon or evening, particularly if the metric is linked to monetary performance incentives. This is also likely a matter of degrees, ie, set the DCBN goal at 80%-100% and gaming is much more likely; set the goal at 20%-30% and this might reflect a realistic range and be less likely to incentivize gaming. Notably, the hospital in the James study did not have a DCBN goal. It would be interesting to see what would happen in that hospital or another hospital before and after implementing a DCBN goal—and further assess a dose-response curve. Another approach would be to perform qualitative analysis of readiness for discharge via chart reviews and determine if patients could have left in the afternoon or evening but might have been delayed to buff up the performance on the DCBN metric.
James et al. additionally demonstrate differences for medical and surgical patients, underscoring that a DCBN goal is unlikely to yield the same results in different patient cohorts or settings. The authors note several workflow reasons for this variation, but other considerations are regularity of timelines for recovery being different for surgical patients, role of elective admissions scheduled in advance, and the potential use of conditional orders (ie, orders entered before dawn that nurses can activate as patients meet criteria).
Much as we have adopted cultural changes over the years to raise awareness regarding patient safety such as nosocomial infections and hand hygiene, an emphasis on high-quality discharges too needs to become integral to hospital practices to sustain performance and any associated metrics. As to what to measure? A validated “medical readiness to discharge” may be the gold standard but may be difficult to attain. Until then, carefully constructed approaches to prioritizing early discharges through proactive planning, shared mental models, interdisciplinary teamwork, and appropriate incentives to those who do it well could yield the results we want as hospitalists, as patients, and as families.
Disclosures
Dr. Kane and Dr. Fieldston have nothing to disclose.
1. Iantorno S, Fieldston E. Hospitals are not hotels: high-quality discharges occur around the clock. JAMA Pediatr. 2013;167(7):596-597. doi: 10.1001/jamapediatrics.2013.2252. PubMed
2. Destino L BD, Acuna C, Asch S, Platchek T. Improving patient flow: analysis of an initiative to improve early discharge. J Hosp Med. 2019;14(1):22-27. doi: 10.12788/JHM.3133.
3. Lorch SA, Millman AM, Zhang X, et.al. Impact of admission-day crowding on the length of stay of pediatric hospitalizations. Pediatrics. 2008;121(4):e718-e730. doi: 10.1542/peds.2007-1280. PubMed
4. Haferbecker D, Fakeye O, Medina SP, Fieldston ES. Perceptions of educational experience and inpatient workload among pediatric residents. Hosp Pediatri. 2013;3(3):276-284. doi: 10.1542/hpeds.2012-0068. PubMed
5. James H, Steiner MJ, Holmes GM, Stephens JR. The association of discharge before noon and length of stay in hospitalized pediatric patients. J Hosp Med. 2019:14(1):28-32. doi: 10.12788/jhm.3111.
6. White CM, Statile AM, White DL, et al. Using quality improvement to optimize paediatric discharge efficiency. BMJ Qual Saf. 2014;23(5):428-436. doi: 10.1136/bmjqs-2013-002556.
Hospitalists have become well versed in campaigns championing safe, efficient, and timely discharges, as well as in the pragmatic challenges of achieving them. Successfully discharging a patient from the hospital requires synchronizing several elements; as a result, improvement efforts focus on promoting shared mental models and team identification of early discharges. The urgency for timely discharges, much like (and unlike1) hotel check-out times, becomes increasingly relevant when hospitals are functioning at or beyond full capacity. As inpatient medical care grows increasingly more specialized, promoting high-quality discharges theoretically allows for not only more beds, but also that the right bed is available for the right patient at the right time. In addition, financial realities in terms of reimbursement and the high cost of adding capacity imply that hospitals need to maximize throughput from the beds they already have. For these reasons, hospital administrators and operational leaders have focused on early discharges as a goal—and have often used discharge before noon (DCBN) as the metric to measure performance.
In this issue of the Journal of Hospital Medicine, Destino et al. reported that it is possible to achieve a higher percentage of early discharges, which allowed for decompression of post-anesthesia care and emergency areas without a measurable negative impact on patient or family satisfaction or length of stay (LOS).2 The improvement they report is remarkable. However, it will be important for them to report back, as quality improvement projects often revert to prior state unless the processes are reinforced and embedded in hospital culture. In addition, what goes unreported in Destino et al. are the unmeasured and unanticipated outcomes related to focusing on a single, laudable goal. This study and others have yet to confirm that systems have enough resiliency to improve discharge timeliness without diverting resources from other aspects of care.3 In other words, can inpatient teams do everything at the same time without sacrificing quality; ie, improve discharge timeliness, accept and admit new patients faster, respond to deteriorating patients, spend enough time with patients and families to meet their needs (and validated survey expectations), and in educational settings, meet the learning needs of trainees?4 This may prove to be true if implementation techniques are individualized to hospitals, services, and units and are incorporated into existing workflows, minimizing extraneous “asks” on already overtaxed providers. Evidence to support this would go a long way in engaging stakeholders to prioritize quality discharges.
In this issue, too, James, et al. ask the question “if DCBN is a good indicator of shorter LOS or is DCBN an arbitrary indicator.”5 The answer may be yes, no, both, maybe, and it depends. Certainly, no pathophysiological reasons exist for a certain time of day to be the “right” time for discharge. The key question for hospitalists and health systems leaders is whether setting time goals leads clinicians to delay discharges of medically and logistically ready patients in the afternoon or evening, particularly if the metric is linked to monetary performance incentives. This is also likely a matter of degrees, ie, set the DCBN goal at 80%-100% and gaming is much more likely; set the goal at 20%-30% and this might reflect a realistic range and be less likely to incentivize gaming. Notably, the hospital in the James study did not have a DCBN goal. It would be interesting to see what would happen in that hospital or another hospital before and after implementing a DCBN goal—and further assess a dose-response curve. Another approach would be to perform qualitative analysis of readiness for discharge via chart reviews and determine if patients could have left in the afternoon or evening but might have been delayed to buff up the performance on the DCBN metric.
James et al. additionally demonstrate differences for medical and surgical patients, underscoring that a DCBN goal is unlikely to yield the same results in different patient cohorts or settings. The authors note several workflow reasons for this variation, but other considerations are regularity of timelines for recovery being different for surgical patients, role of elective admissions scheduled in advance, and the potential use of conditional orders (ie, orders entered before dawn that nurses can activate as patients meet criteria).
Much as we have adopted cultural changes over the years to raise awareness regarding patient safety such as nosocomial infections and hand hygiene, an emphasis on high-quality discharges too needs to become integral to hospital practices to sustain performance and any associated metrics. As to what to measure? A validated “medical readiness to discharge” may be the gold standard but may be difficult to attain. Until then, carefully constructed approaches to prioritizing early discharges through proactive planning, shared mental models, interdisciplinary teamwork, and appropriate incentives to those who do it well could yield the results we want as hospitalists, as patients, and as families.
Disclosures
Dr. Kane and Dr. Fieldston have nothing to disclose.
1. Iantorno S, Fieldston E. Hospitals are not hotels: high-quality discharges occur around the clock. JAMA Pediatr. 2013;167(7):596-597. doi: 10.1001/jamapediatrics.2013.2252. PubMed
2. Destino L BD, Acuna C, Asch S, Platchek T. Improving patient flow: analysis of an initiative to improve early discharge. J Hosp Med. 2019;14(1):22-27. doi: 10.12788/JHM.3133.
3. Lorch SA, Millman AM, Zhang X, et.al. Impact of admission-day crowding on the length of stay of pediatric hospitalizations. Pediatrics. 2008;121(4):e718-e730. doi: 10.1542/peds.2007-1280. PubMed
4. Haferbecker D, Fakeye O, Medina SP, Fieldston ES. Perceptions of educational experience and inpatient workload among pediatric residents. Hosp Pediatri. 2013;3(3):276-284. doi: 10.1542/hpeds.2012-0068. PubMed
5. James H, Steiner MJ, Holmes GM, Stephens JR. The association of discharge before noon and length of stay in hospitalized pediatric patients. J Hosp Med. 2019:14(1):28-32. doi: 10.12788/jhm.3111.
6. White CM, Statile AM, White DL, et al. Using quality improvement to optimize paediatric discharge efficiency. BMJ Qual Saf. 2014;23(5):428-436. doi: 10.1136/bmjqs-2013-002556.
© 2019 Society of Hospital Medicine
Radiographs Predict Pneumonia Severity
The 2011 Pediatric Infectious Diseases Society and Infectious Diseases Society of America (PIDS/IDSA) guidelines for management of pediatric community‐acquired pneumonia (CAP) recommend that admission chest radiographs be obtained in all children hospitalized with CAP to document the presence and extent of infiltrates and to identify complications.[1] Findings from chest radiographs may also provide clues to etiology and assist with predicting disease outcomes. In adults with CAP, clinical prediction tools use radiographic findings to inform triage decisions, guide management strategies, and predict outcomes.[2, 3, 4, 5, 6, 7] Whether or not radiographic findings could have similar utility among children with CAP is unknown.
Several retrospective studies have examined the ability of chest radiographs to predict pediatric pneumonia disease severity.[8, 9, 10, 11, 12] However, these studies used several different measures of severe pneumonia and/or were limited to young children <5 years of age, leading to inconsistent findings. These studies also rarely considered very severe disease (eg, need for invasive mechanical ventilation) or longitudinal outcome measures such as hospital length of stay. Finally, all of these prior studies were conducted outside of the United States, and most were single‐center investigations, potentially limiting generalizability. We sought to examine associations between admission chest radiographic findings and subsequent hospital care processes and clinical outcomes, including length of stay and resource utilization measures, among children hospitalized with CAP at 4 children's hospitals in the United States.
METHODS
Design and Setting
This study was nested within a multicenter retrospective cohort designed to validate International Classification of Diseases, 9th Revision, Clinical Modification (ICD9‐CM) diagnostic codes for pediatric CAP hospitalizations.[13] The Pediatric Health Information System database (Children's Hospital Association, Overland Park, KS) was used to identify children from 4 freestanding pediatric hospitals (Monroe Carell, Jr. Children's Hospital at Vanderbilt, Nashville, Tennessee; Children's Mercy Hospitals & Clinics, Kansas City, Missouri; Seattle Children's Hospital, Seattle, Washington; and Cincinnati Children's Hospital Medical Center, Cincinnati, Ohio). The institutional review boards at each participating institution approved the study. The validation study included a 25% random sampling of children 60 days to 18 years of age (n=998) who were hospitalized between January 1, 2010 and December 31, 2010 with at least 1 ICD9‐CM discharge code indicating pneumonia. The diagnosis of CAP was confirmed by medical record review.
Study Population
This study was limited to children from the validation study who met criteria for clinical and radiographic CAP, defined as: (1) abnormal temperature or white blood cell count, (2) signs and symptoms of acute respiratory illness (eg, cough, tachypnea), and (3) chest radiograph indicating pneumonia within 48 hours of admission. Children with atelectasis as the only abnormal radiographic finding and those with complex chronic conditions (eg, cystic fibrosis, malignancy) were excluded using a previously described algorithm.[14]
Outcomes
Several measures of disease severity were assessed. Dichotomous outcomes included supplemental oxygen use, need for intensive care unit (ICU) admission, and need for invasive mechanical ventilation. Continuous outcomes included hospital length of stay, and for those requiring supplemental oxygen, duration of oxygen supplementation, measured in hours.
Exposure
To categorize infiltrate patterns and the presence and size of pleural effusions, we reviewed the final report from admission chest radiographs to obtain the final clinical interpretation performed by the attending pediatric radiologist. Infiltrate patterns were classified as single lobar (reference), unilateral multilobar, bilateral multilobar, or interstitial. Children with both lobar and interstitial infiltrates, and those with mention of atelectasis, were classified according to the type of lobar infiltrate. Those with atelectasis only were excluded. Pleural effusions were classified as absent, small, or moderate/large.
Analysis
Descriptive statistics were summarized using frequencies and percentages for categorical variables and median and interquartile range (IQR) values for continuous variables. Our primary exposures were infiltrate pattern and presence and size of pleural effusion on admission chest radiograph. Associations between radiographic findings and disease outcomes were analyzed using logistic and linear regression for dichotomous and continuous variables, respectively. Continuous outcomes were log‐transformed and normality assumptions verified prior to model development.
Due to the large number of covariates relative to outcome events, we used propensity score methods to adjust for potential confounding. The propensity score estimates the likelihood of a given exposure (ie, infiltrate pattern) conditional on a set of covariates. In this way, the propensity score summarizes potential confounding effects from a large number of covariates into a single variable. Including the propensity score as a covariate in multivariable regression improves model efficiency and helps protect against overfitting.[15] Covariates included in the estimation of the propensity score included age, sex, race/ethnicity, payer, hospital, asthma history, hospital transfer, recent hospitalization (within 30 days), recent emergency department or clinic visit (within 2 weeks), recent antibiotics for acute illness (within 5 days), illness duration prior to admission, tachypnea and/or increased work of breathing (retractions, nasal flaring, or grunting) at presentation, receipt of albuterol and/or corticosteroids during the first 2 calendar days of hospitalization, and concurrent diagnosis of bronchiolitis. All analyses included the estimated propensity score, infiltrate pattern, and pleural effusion (absent, small, or moderate/large).
RESULTS
Study Population
The median age of the 406 children with clinical and radiographic CAP was 3 years (IQR, 16 years) (Table 1). Single lobar infiltrate was the most common radiographic pattern (61%). Children with interstitial infiltrates (10%) were younger than those with lobar infiltrates of any type (median age 1 vs 3 years, P=0.02). A concomitant diagnosis of bronchiolitis was assigned to 34% of children with interstitial infiltrates but only 17% of those with lobar infiltrate patterns (range, 11%20%, P=0.03). Pleural effusion was present in 21% of children and was more common among those with lobar infiltrates, particularly multilobar disease. Only 1 child with interstitial infiltrate had a pleural effusion. Overall, 63% of children required supplemental oxygen, 8% required ICU admission, and 3% required invasive mechanical ventilation. Median length of stay was 51.5 hours (IQR, 3991) and median oxygen duration was 31.5 hours [IQR, 1365]. There were no deaths.
| Characteristic | Infiltrate Patterna | P Valueb | |||
|---|---|---|---|---|---|
| Single Lobar | Multilobar, Unilateral | Multilobar, Bilateral | Interstitial | ||
| |||||
| No. | 247 (60.8) | 54 (13.3) | 64 (15.8) | 41 (10.1) | |
| Median age, y | 3 [16] | 3 [17] | 3 [15] | 1 [03] | 0.02 |
| Male sex | 124 (50.2) | 32 (59.3) | 41 (64.1) | 30 (73.2) | 0.02 |
| Race | |||||
| Non‐Hispanic white | 133 (53.8) | 36 (66.7) | 37 (57.8) | 17 (41.5) | 0.69 |
| Non‐Hispanic black | 40 (16.2) | 6 (11.1) | 9 (14.1) | 8 (19.5) | |
| Hispanic | 25 (10.1) | 4 (7.4) | 5 (7.8) | 7 (17.1) | |
| Other | 49 (19.9) | 8 (14.8) | 13 (20.4) | 9 (22) | |
| Insurance | |||||
| Public | 130 (52.6) | 26 (48.1) | 33 (51.6) | 25 (61) | 0.90 |
| Private | 116 (47) | 28 (51.9) | 31 (48.4) | 16 (39) | |
| Concurrent diagnosis | |||||
| Asthma | 80 (32.4) | 16 (29.6) | 17 (26.6) | 12 (29.3) | 0.82 |
| Bronchiolitis | 43 (17.4) | 6 (11.1) | 13 (20.3) | 14 (34.1) | 0.03 |
| Effusion | |||||
| None | 201 (81.4) | 31 (57.4) | 48 (75) | 40 (97.6) | <.01 |
| Small | 34 (13.8) | 20 (37) | 11 (17.2) | 0 | |
| Moderate/large | 12 (4.9) | 3 (5.6) | 5 (7.8) | 1 (2.4) | |
Outcomes According to Radiographic Infiltrate Pattern
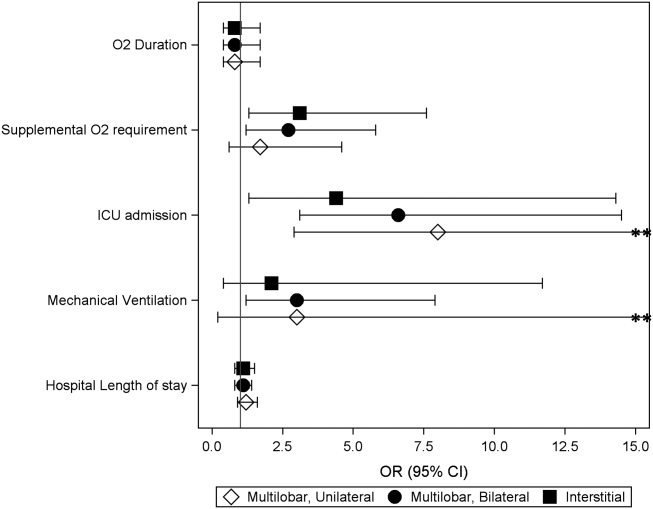
Compared to children with single lobar infiltrates, the odds of ICU admission was significantly increased for those with either unilateral or bilateral multilobar infiltrates (unilateral, adjusted odds ratio [aOR]: 8.0, 95% confidence interval [CI]: 2.922.2; bilateral, aOR: 6.6, 95% CI: 2.14.5) (Figure 1, Table 2). Patients with bilateral multilobar infiltrates also had higher odds for supplemental oxygen use (aOR: 2.7, 95% CI: 1.25.8) and need for invasive mechanical ventilation (aOR: 3.0, 95% CI: 1.27.9). There were no differences in duration of oxygen supplementation or hospital length of stay for children with single versus multilobar infiltrates.

| Outcome | Infiltrate Patterna | P Valueb | |||
|---|---|---|---|---|---|
| Single Lobar, n=247 | Multilobar, Unilateral, n=54 | Multilobar, Bilateral, n=64 | Interstitial, n=41 | ||
| |||||
| Supplemental O2 requirement | 143 (57.9) | 34 (63) | 46 (71.9) | 31 (75.6) | 0.05 |
| ICU admission | 10 (4) | 9 (16.7) | 9 (14.1) | 4 (9.8) | <0.01 |
| Mechanical ventilation | 5 (2) | 4 (7.4) | 4 (6.3) | 1 (2.4) | 0.13 |
| Hospital length of stay, h | 47 [3779] | 63 [45114] | 56.5 [39.5101] | 62 [3993] | <0.01 |
| O2 duration, h | 27 [1059] | 38 [1777] | 38 [2381] | 34.5 [1765] | 0.18 |
Compared to those with single lobar infiltrates, children with interstitial infiltrates had higher odds of need for supplemental oxygen (aOR: 3.1, 95% CI: 1.37.6) and ICU admission (aOR: 4.4, 95% CI: 1.314.3) but not invasive mechanical ventilation. There were also no differences in duration of oxygen supplementation or hospital length of stay.
Outcomes According to Presence and Size of Pleural Effusion
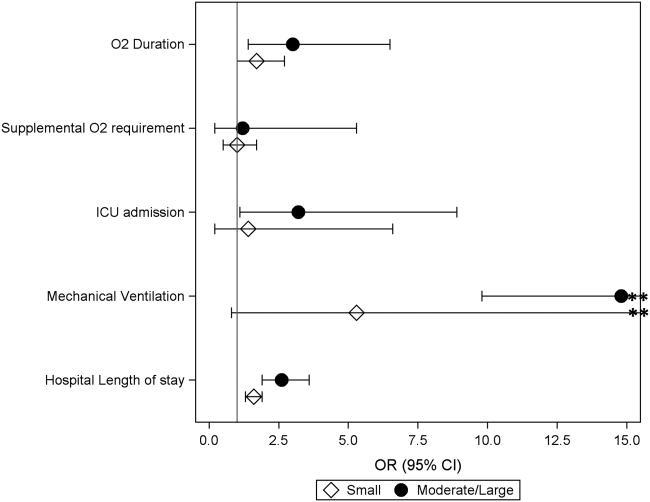
Compared to those without pleural effusion, children with moderate to large effusion had a higher odds of ICU admission (aOR: 3.2, 95% CI: 1.18.9) and invasive mechanical ventilation (aOR: 14.8, 95% CI: 9.822.4), and also had a longer duration of oxygen supplementation (aOR: 3.0, 95% CI: 1.46.5) and hospital length of stay (aOR: 2.6, 95% CI: 1.9‐3.6) (Table 3, Figure 2). The presence of a small pleural effusion was not associated with increased need for supplemental oxygen, ICU admission, or mechanical ventilation compared to those without effusion. However, small effusion was associated with a longer duration of oxygen supplementation (aOR: 1.7, 95% CI: 12.7) and hospital length of stay (aOR: 1.6, 95% CI: 1.3‐1.9).
| Outcome | Pleural Effusion | P Valuea | ||
|---|---|---|---|---|
| None, n=320 | Small, n=65 | Moderate/Large, n=21 | ||
| ||||
| Supplemental O2 requirement | 200 (62.5) | 40 (61.5) | 14 (66.7) | 0.91 |
| ICU admission | 22 (6.9) | 6 (9.2) | 4 (19) | 0.12 |
| Mechanical ventilation | 5 (1.6) | 5 (7.7) | 4 (19) | <0.01 |
| Hospital length of stay, h | 48 [37.576] | 72 [45142] | 160 [82191] | <0.01 |
| Oxygen duration, h | 31 [1157] | 38.5 [1887] | 111 [27154] | <0.01 |
DISCUSSION
We evaluated the association between admission chest radiographic findings and subsequent clinical outcomes and hospital care processes for children hospitalized with CAP at 4 children's hospitals in the United States. We conclude that radiographic findings are associated with important inpatient outcomes. Similar to data from adults, findings of moderate to large pleural effusions and bilateral multilobar infiltrates had the strongest associations with severe disease. Such information, in combination with other prognostic factors, may help clinicians identify high‐risk patients and support management decisions, while also helping to inform families about the expected hospital course.
Previous pediatric studies examining the association between radiographic findings and outcomes have produced inconsistent results.[8, 9, 10, 11, 12] All but 1 of these studies documented 1 radiographic characteristics associated with pneumonia disease severity.[11] Further, although most contrasted lobar/alveolar and interstitial infiltrates, only Patria et al. distinguished among lobar infiltrate patterns (eg, single lobar vs multilobar).[12] Similar to our findings, that study demonstrated increased disease severity among children with bilateral multifocal lobar infiltrates. Of the studies that considered the presence of pleural effusion, only 1 demonstrated this finding to be associated with more severe disease.[9] However, none of these prior studies examined size of the pleural effusion.
In our study, the strongest association with severe pneumonia outcomes was among children with moderate to large pleural effusion. Significant pleural effusions are much more commonly due to infection with bacterial pathogens, particularly Streptococcus pneumoniae, Staphylococcus aureus, and Streptococcus pyogenes, and may also indicate infection with more virulent and/or difficult to treat strains.[16, 17, 18, 19] Surgical intervention is also often required. As such, children with significant pleural effusions are often more ill on presentation and may have a prolonged period of recovery.[20, 21, 22]
Similarly, multilobar infiltrates, particularly bilateral, were associated with increased disease severity in terms of need for supplemental oxygen, ICU admission, and need for invasive mechanical ventilation. Although this finding may be expected, it is interesting to note that the duration of supplemental oxygen and hospital length of stay were similar to those with single lobar disease. One potential explanation is that, although children with multilobar disease are more severe at presentation, rates of recovery are similar to those with less extensive radiographic findings, owing to rapidly effective antimicrobials for uncomplicated bacterial pneumonia. This hypothesis also agrees with the 2011 PIDS/IDSA guidelines, which state that children receiving adequate therapy typically show signs of improvement within 48 to 72 hours regardless of initial severity.[1]
Interstitial infiltrate was also associated with increased severity at presentation but similar length of stay and duration of oxygen requirement compared with single lobar disease. We note that these children were substantially younger than those presenting with any pattern of lobar disease (median age, 1 vs 3 years), were more likely to have a concurrent diagnosis of bronchiolitis (34% vs 17%), and only 1 child with interstitial infiltrates had a documented pleural effusion (vs 23% of children with lobar infiltrates). Primary viral pneumonia is considered more likely to produce interstitial infiltrates on chest radiograph compared to bacterial disease, and although detailed etiologic data are unavailable for this study, our findings above strongly support this assertion.[23, 24]
The 2011 PIDS/IDSA guidelines recommend admission chest radiographs for all children hospitalized with pneumonia to assess extent of disease and identify complications that may requiring additional evaluation or surgical intervention.[1] Our findings highlight additional potential benefits of admission radiographs in terms of disease prognosis and management decisions. In the initial evaluation of a sick child with pneumonia, clinicians are often presented with a number of potential prognostic factors that may influence disease outcomes. However, it is sometimes difficult for providers to consider all available information and/or the relative importance of a single factor, resulting in inaccurate risk perceptions and management decisions that may contribute to poor outcomes.[25] Similar to adults, the development of clinical prediction rules, which incorporate a variety of important predictors including admission radiographic findings, likely would improve risk assessments and potentially outcomes for children with pneumonia. Such prognostic information is also helpful for clinicians who may use these data to inform and prepare families regarding the expected course of hospitalization.
Our study has several limitations. This study was retrospective and only included a sample of pneumonia hospitalizations during the study period, which may raise confounding concerns and potential for selection bias. However, detailed medical record reviews using standardized case definitions for radiographic CAP were used, and a large sample of children was randomly selected from each institution. In addition, a large number of potential confounders were selected a priori and included in multivariable analyses; propensity score adjustment was used to reduce model complexity and avoid overfitting. Radiographic findings were based on clinical interpretation by pediatric radiologists independent of a study protocol. Prior studies have demonstrated good agreement for identification of alveolar/lobar infiltrates and pleural effusion by trained radiologists, although agreement for interstitial infiltrate is poor.[26, 27] This limitation could result in either over‐ or underestimation of the prevalence of interstitial infiltrates likely resulting in a nondifferential bias toward the null. Microbiologic information, which may inform radiographic findings and disease severity, was also not available. However, because pneumonia etiology is frequently unknown in the clinical setting, our study reflects typical practice. We also did not include children from community or nonteaching hospitals. Thus, although findings may have relevance to community or nonteaching hospitals, our results cannot be generalized.
CONCLUSION
Our study demonstrates that among children hospitalized with CAP, admission chest radiographic findings are associated with important clinical outcomes and hospital care processes, highlighting additional benefits of the 2011 PIDS/IDSA guidelines' recommendation for admission chest radiographs for all children hospitalized with pneumonia. These data, in conjunction with other important prognostic information, may help clinicians more rapidly identify children at increased risk for severe illness, and could also offer guidance regarding disease management strategies and facilitate shared decision making with families. Thus, routine admission chest radiography in this population represents a valuable tool that contributes to improved quality of care.
Disclosures
Dr. Williams is supported by funds from the National Institutes of HealthNational Institute of Allergy and Infectious Diseases (K23AI104779). The authors report no conflicts of interest.
- , , , et al. The management of community‐acquired pneumonia in infants and children older than 3 months of age: clinical practice guidelines by the Pediatric Infectious Diseases Society and the Infectious Diseases Society of America. Clin Infect Dis. 2011;53(7):e25–e76.
- , , , et al. A prediction rule to identify low‐risk patients with community‐acquired pneumonia. N Engl J Med. 1997;336(4):243–250.
- , , , et al. SMART‐COP: a tool for predicting the need for intensive respiratory or vasopressor support in community‐acquired pneumonia. Clin Infect Dis. 2008;47(3):375–384.
- , , , et al. Development and validation of a clinical prediction rule for severe community‐acquired pneumonia. Am J Respir Crit Care Med. 2006;174(11):1249–1256.
- , , , et al. Risk stratification of early admission to the intensive care unit of patients with no major criteria of severe community‐acquired pneumonia: development of an international prediction rule. Crit Care. 2009;13(2):R54.
- , , , et al. Do pulmonary radiographic findings at presentation predict mortality in patients with community‐acquired pneumonia? Arch Intern Med. 1996;156(19):2206–2212.
- , , , , , . Safety and efficacy of CURB65‐guided antibiotic therapy in community‐acquired pneumonia. J Antimicrob Chemother. 2011;66(2):416–423.
- , , . Severity of childhood community‐acquired pneumonia and chest radiographic findings. Pediatr Pulmonol. 2009;44(3):249–252.
- , , , et al. Can chest x‐ray predict pneumonia severity? Pediatr Pulmonol. 2004;38(6):465–469.
- , , , . Children with pneumonia: how do they present and how are they managed? Arch Dis Child. 2007;92(5):394–398.
- , , . Role of chest X‐ray in predicting outcome of acute severe pneumonia. Indian Pediatr. 2008;45(11):893–898.
- , , , , , . Association between radiological findings and severity of community‐acquired pneumonia in children. Ital J Pediatr. 2013;39:56.
- , , , et al. Identifying pediatric community‐acquired pneumonia hospitalizations: accuracy of administrative billing codes. JAMA Pediatrics. 2013;167(9):851–858.
- , , , , , . Deaths attributed to pediatric complex chronic conditions: national trends and implications for supportive care services. Pediatrics. 2001;107(6):E99.
- , . Invited commentary: propensity scores. Am J Epidemiol. 1999;150(4):327–333.
- , , , . Increasing incidence of empyema complicating childhood community‐acquired pneumonia in the United States. Clin Infect Dis. 2010;50(6):805–813.
- , , , et al. Epidemiology and clinical characteristics of community‐acquired pneumonia in hospitalized children. Pediatrics. 2004;113(4):701–707.
- , , , et al. Molecular analysis improves pathogen identification and epidemiologic study of pediatric parapneumonic empyema. Pediatr Infect Dis J. 2011;30(4):289–294.
- , . Parapneumonic pleural effusion and empyema in children. Review of a 19‐year experience, 1962–1980. Clin Pediatr (Phila). 1983;22(6):414–419.
- , , , et al. Risk factors of progressive community‐acquired pneumonia in hospitalized children: a prospective study [published online ahead of print August 28, 2013]. J Microbiol Immunol Infect. doi: 10.1016/j.jmii.2013.06.009.
- , , , , . Community‐acquired lobar pneumonia in children in the era of universal 7‐valent pneumococcal vaccination: a review of clinical presentations and antimicrobial treatment from a Canadian pediatric hospital. BMC Pediatr. 2012;12:133.
- , , , et al. Clinical characteristics and outcome of complicated pneumococcal pneumonia in a pediatric population. Pediatr Pulmonol. 2006;41(8):726–734.
- , , , , , . Differentiation of bacterial and viral pneumonia in children. Thorax. 2002;57(5):438–441.
- , , , et al. British Thoracic Society guidelines for the management of community acquired pneumonia in children: update 2011. Thorax. 2011;66(suppl 2):ii1–ii23.
- , , , et al. Community acquired pneumonia: aetiology and usefulness of severity criteria on admission. Thorax. 1996;51(10):1010–1016.
- , , , et al. Variability in the interpretation of chest radiographs for the diagnosis of pneumonia in children. J Hosp Med. 2012;7(4):294–298.
- , , , et al. Interobserver reliability of the chest radiograph in community‐acquired pneumonia. PORT Investigators. Chest. 1996;110(2):343–350.
The 2011 Pediatric Infectious Diseases Society and Infectious Diseases Society of America (PIDS/IDSA) guidelines for management of pediatric community‐acquired pneumonia (CAP) recommend that admission chest radiographs be obtained in all children hospitalized with CAP to document the presence and extent of infiltrates and to identify complications.[1] Findings from chest radiographs may also provide clues to etiology and assist with predicting disease outcomes. In adults with CAP, clinical prediction tools use radiographic findings to inform triage decisions, guide management strategies, and predict outcomes.[2, 3, 4, 5, 6, 7] Whether or not radiographic findings could have similar utility among children with CAP is unknown.
Several retrospective studies have examined the ability of chest radiographs to predict pediatric pneumonia disease severity.[8, 9, 10, 11, 12] However, these studies used several different measures of severe pneumonia and/or were limited to young children <5 years of age, leading to inconsistent findings. These studies also rarely considered very severe disease (eg, need for invasive mechanical ventilation) or longitudinal outcome measures such as hospital length of stay. Finally, all of these prior studies were conducted outside of the United States, and most were single‐center investigations, potentially limiting generalizability. We sought to examine associations between admission chest radiographic findings and subsequent hospital care processes and clinical outcomes, including length of stay and resource utilization measures, among children hospitalized with CAP at 4 children's hospitals in the United States.
METHODS
Design and Setting
This study was nested within a multicenter retrospective cohort designed to validate International Classification of Diseases, 9th Revision, Clinical Modification (ICD9‐CM) diagnostic codes for pediatric CAP hospitalizations.[13] The Pediatric Health Information System database (Children's Hospital Association, Overland Park, KS) was used to identify children from 4 freestanding pediatric hospitals (Monroe Carell, Jr. Children's Hospital at Vanderbilt, Nashville, Tennessee; Children's Mercy Hospitals & Clinics, Kansas City, Missouri; Seattle Children's Hospital, Seattle, Washington; and Cincinnati Children's Hospital Medical Center, Cincinnati, Ohio). The institutional review boards at each participating institution approved the study. The validation study included a 25% random sampling of children 60 days to 18 years of age (n=998) who were hospitalized between January 1, 2010 and December 31, 2010 with at least 1 ICD9‐CM discharge code indicating pneumonia. The diagnosis of CAP was confirmed by medical record review.
Study Population
This study was limited to children from the validation study who met criteria for clinical and radiographic CAP, defined as: (1) abnormal temperature or white blood cell count, (2) signs and symptoms of acute respiratory illness (eg, cough, tachypnea), and (3) chest radiograph indicating pneumonia within 48 hours of admission. Children with atelectasis as the only abnormal radiographic finding and those with complex chronic conditions (eg, cystic fibrosis, malignancy) were excluded using a previously described algorithm.[14]
Outcomes
Several measures of disease severity were assessed. Dichotomous outcomes included supplemental oxygen use, need for intensive care unit (ICU) admission, and need for invasive mechanical ventilation. Continuous outcomes included hospital length of stay, and for those requiring supplemental oxygen, duration of oxygen supplementation, measured in hours.
Exposure
To categorize infiltrate patterns and the presence and size of pleural effusions, we reviewed the final report from admission chest radiographs to obtain the final clinical interpretation performed by the attending pediatric radiologist. Infiltrate patterns were classified as single lobar (reference), unilateral multilobar, bilateral multilobar, or interstitial. Children with both lobar and interstitial infiltrates, and those with mention of atelectasis, were classified according to the type of lobar infiltrate. Those with atelectasis only were excluded. Pleural effusions were classified as absent, small, or moderate/large.
Analysis
Descriptive statistics were summarized using frequencies and percentages for categorical variables and median and interquartile range (IQR) values for continuous variables. Our primary exposures were infiltrate pattern and presence and size of pleural effusion on admission chest radiograph. Associations between radiographic findings and disease outcomes were analyzed using logistic and linear regression for dichotomous and continuous variables, respectively. Continuous outcomes were log‐transformed and normality assumptions verified prior to model development.
Due to the large number of covariates relative to outcome events, we used propensity score methods to adjust for potential confounding. The propensity score estimates the likelihood of a given exposure (ie, infiltrate pattern) conditional on a set of covariates. In this way, the propensity score summarizes potential confounding effects from a large number of covariates into a single variable. Including the propensity score as a covariate in multivariable regression improves model efficiency and helps protect against overfitting.[15] Covariates included in the estimation of the propensity score included age, sex, race/ethnicity, payer, hospital, asthma history, hospital transfer, recent hospitalization (within 30 days), recent emergency department or clinic visit (within 2 weeks), recent antibiotics for acute illness (within 5 days), illness duration prior to admission, tachypnea and/or increased work of breathing (retractions, nasal flaring, or grunting) at presentation, receipt of albuterol and/or corticosteroids during the first 2 calendar days of hospitalization, and concurrent diagnosis of bronchiolitis. All analyses included the estimated propensity score, infiltrate pattern, and pleural effusion (absent, small, or moderate/large).
RESULTS
Study Population
The median age of the 406 children with clinical and radiographic CAP was 3 years (IQR, 16 years) (Table 1). Single lobar infiltrate was the most common radiographic pattern (61%). Children with interstitial infiltrates (10%) were younger than those with lobar infiltrates of any type (median age 1 vs 3 years, P=0.02). A concomitant diagnosis of bronchiolitis was assigned to 34% of children with interstitial infiltrates but only 17% of those with lobar infiltrate patterns (range, 11%20%, P=0.03). Pleural effusion was present in 21% of children and was more common among those with lobar infiltrates, particularly multilobar disease. Only 1 child with interstitial infiltrate had a pleural effusion. Overall, 63% of children required supplemental oxygen, 8% required ICU admission, and 3% required invasive mechanical ventilation. Median length of stay was 51.5 hours (IQR, 3991) and median oxygen duration was 31.5 hours [IQR, 1365]. There were no deaths.
| Characteristic | Infiltrate Patterna | P Valueb | |||
|---|---|---|---|---|---|
| Single Lobar | Multilobar, Unilateral | Multilobar, Bilateral | Interstitial | ||
| |||||
| No. | 247 (60.8) | 54 (13.3) | 64 (15.8) | 41 (10.1) | |
| Median age, y | 3 [16] | 3 [17] | 3 [15] | 1 [03] | 0.02 |
| Male sex | 124 (50.2) | 32 (59.3) | 41 (64.1) | 30 (73.2) | 0.02 |
| Race | |||||
| Non‐Hispanic white | 133 (53.8) | 36 (66.7) | 37 (57.8) | 17 (41.5) | 0.69 |
| Non‐Hispanic black | 40 (16.2) | 6 (11.1) | 9 (14.1) | 8 (19.5) | |
| Hispanic | 25 (10.1) | 4 (7.4) | 5 (7.8) | 7 (17.1) | |
| Other | 49 (19.9) | 8 (14.8) | 13 (20.4) | 9 (22) | |
| Insurance | |||||
| Public | 130 (52.6) | 26 (48.1) | 33 (51.6) | 25 (61) | 0.90 |
| Private | 116 (47) | 28 (51.9) | 31 (48.4) | 16 (39) | |
| Concurrent diagnosis | |||||
| Asthma | 80 (32.4) | 16 (29.6) | 17 (26.6) | 12 (29.3) | 0.82 |
| Bronchiolitis | 43 (17.4) | 6 (11.1) | 13 (20.3) | 14 (34.1) | 0.03 |
| Effusion | |||||
| None | 201 (81.4) | 31 (57.4) | 48 (75) | 40 (97.6) | <.01 |
| Small | 34 (13.8) | 20 (37) | 11 (17.2) | 0 | |
| Moderate/large | 12 (4.9) | 3 (5.6) | 5 (7.8) | 1 (2.4) | |
Outcomes According to Radiographic Infiltrate Pattern
Compared to children with single lobar infiltrates, the odds of ICU admission was significantly increased for those with either unilateral or bilateral multilobar infiltrates (unilateral, adjusted odds ratio [aOR]: 8.0, 95% confidence interval [CI]: 2.922.2; bilateral, aOR: 6.6, 95% CI: 2.14.5) (Figure 1, Table 2). Patients with bilateral multilobar infiltrates also had higher odds for supplemental oxygen use (aOR: 2.7, 95% CI: 1.25.8) and need for invasive mechanical ventilation (aOR: 3.0, 95% CI: 1.27.9). There were no differences in duration of oxygen supplementation or hospital length of stay for children with single versus multilobar infiltrates.
| Outcome | Infiltrate Patterna | P Valueb | |||
|---|---|---|---|---|---|
| Single Lobar, n=247 | Multilobar, Unilateral, n=54 | Multilobar, Bilateral, n=64 | Interstitial, n=41 | ||
| |||||
| Supplemental O2 requirement | 143 (57.9) | 34 (63) | 46 (71.9) | 31 (75.6) | 0.05 |
| ICU admission | 10 (4) | 9 (16.7) | 9 (14.1) | 4 (9.8) | <0.01 |
| Mechanical ventilation | 5 (2) | 4 (7.4) | 4 (6.3) | 1 (2.4) | 0.13 |
| Hospital length of stay, h | 47 [3779] | 63 [45114] | 56.5 [39.5101] | 62 [3993] | <0.01 |
| O2 duration, h | 27 [1059] | 38 [1777] | 38 [2381] | 34.5 [1765] | 0.18 |
Compared to those with single lobar infiltrates, children with interstitial infiltrates had higher odds of need for supplemental oxygen (aOR: 3.1, 95% CI: 1.37.6) and ICU admission (aOR: 4.4, 95% CI: 1.314.3) but not invasive mechanical ventilation. There were also no differences in duration of oxygen supplementation or hospital length of stay.
Outcomes According to Presence and Size of Pleural Effusion
Compared to those without pleural effusion, children with moderate to large effusion had a higher odds of ICU admission (aOR: 3.2, 95% CI: 1.18.9) and invasive mechanical ventilation (aOR: 14.8, 95% CI: 9.822.4), and also had a longer duration of oxygen supplementation (aOR: 3.0, 95% CI: 1.46.5) and hospital length of stay (aOR: 2.6, 95% CI: 1.9‐3.6) (Table 3, Figure 2). The presence of a small pleural effusion was not associated with increased need for supplemental oxygen, ICU admission, or mechanical ventilation compared to those without effusion. However, small effusion was associated with a longer duration of oxygen supplementation (aOR: 1.7, 95% CI: 12.7) and hospital length of stay (aOR: 1.6, 95% CI: 1.3‐1.9).
| Outcome | Pleural Effusion | P Valuea | ||
|---|---|---|---|---|
| None, n=320 | Small, n=65 | Moderate/Large, n=21 | ||
| ||||
| Supplemental O2 requirement | 200 (62.5) | 40 (61.5) | 14 (66.7) | 0.91 |
| ICU admission | 22 (6.9) | 6 (9.2) | 4 (19) | 0.12 |
| Mechanical ventilation | 5 (1.6) | 5 (7.7) | 4 (19) | <0.01 |
| Hospital length of stay, h | 48 [37.576] | 72 [45142] | 160 [82191] | <0.01 |
| Oxygen duration, h | 31 [1157] | 38.5 [1887] | 111 [27154] | <0.01 |
DISCUSSION
We evaluated the association between admission chest radiographic findings and subsequent clinical outcomes and hospital care processes for children hospitalized with CAP at 4 children's hospitals in the United States. We conclude that radiographic findings are associated with important inpatient outcomes. Similar to data from adults, findings of moderate to large pleural effusions and bilateral multilobar infiltrates had the strongest associations with severe disease. Such information, in combination with other prognostic factors, may help clinicians identify high‐risk patients and support management decisions, while also helping to inform families about the expected hospital course.
Previous pediatric studies examining the association between radiographic findings and outcomes have produced inconsistent results.[8, 9, 10, 11, 12] All but 1 of these studies documented 1 radiographic characteristics associated with pneumonia disease severity.[11] Further, although most contrasted lobar/alveolar and interstitial infiltrates, only Patria et al. distinguished among lobar infiltrate patterns (eg, single lobar vs multilobar).[12] Similar to our findings, that study demonstrated increased disease severity among children with bilateral multifocal lobar infiltrates. Of the studies that considered the presence of pleural effusion, only 1 demonstrated this finding to be associated with more severe disease.[9] However, none of these prior studies examined size of the pleural effusion.
In our study, the strongest association with severe pneumonia outcomes was among children with moderate to large pleural effusion. Significant pleural effusions are much more commonly due to infection with bacterial pathogens, particularly Streptococcus pneumoniae, Staphylococcus aureus, and Streptococcus pyogenes, and may also indicate infection with more virulent and/or difficult to treat strains.[16, 17, 18, 19] Surgical intervention is also often required. As such, children with significant pleural effusions are often more ill on presentation and may have a prolonged period of recovery.[20, 21, 22]
Similarly, multilobar infiltrates, particularly bilateral, were associated with increased disease severity in terms of need for supplemental oxygen, ICU admission, and need for invasive mechanical ventilation. Although this finding may be expected, it is interesting to note that the duration of supplemental oxygen and hospital length of stay were similar to those with single lobar disease. One potential explanation is that, although children with multilobar disease are more severe at presentation, rates of recovery are similar to those with less extensive radiographic findings, owing to rapidly effective antimicrobials for uncomplicated bacterial pneumonia. This hypothesis also agrees with the 2011 PIDS/IDSA guidelines, which state that children receiving adequate therapy typically show signs of improvement within 48 to 72 hours regardless of initial severity.[1]
Interstitial infiltrate was also associated with increased severity at presentation but similar length of stay and duration of oxygen requirement compared with single lobar disease. We note that these children were substantially younger than those presenting with any pattern of lobar disease (median age, 1 vs 3 years), were more likely to have a concurrent diagnosis of bronchiolitis (34% vs 17%), and only 1 child with interstitial infiltrates had a documented pleural effusion (vs 23% of children with lobar infiltrates). Primary viral pneumonia is considered more likely to produce interstitial infiltrates on chest radiograph compared to bacterial disease, and although detailed etiologic data are unavailable for this study, our findings above strongly support this assertion.[23, 24]
The 2011 PIDS/IDSA guidelines recommend admission chest radiographs for all children hospitalized with pneumonia to assess extent of disease and identify complications that may requiring additional evaluation or surgical intervention.[1] Our findings highlight additional potential benefits of admission radiographs in terms of disease prognosis and management decisions. In the initial evaluation of a sick child with pneumonia, clinicians are often presented with a number of potential prognostic factors that may influence disease outcomes. However, it is sometimes difficult for providers to consider all available information and/or the relative importance of a single factor, resulting in inaccurate risk perceptions and management decisions that may contribute to poor outcomes.[25] Similar to adults, the development of clinical prediction rules, which incorporate a variety of important predictors including admission radiographic findings, likely would improve risk assessments and potentially outcomes for children with pneumonia. Such prognostic information is also helpful for clinicians who may use these data to inform and prepare families regarding the expected course of hospitalization.
Our study has several limitations. This study was retrospective and only included a sample of pneumonia hospitalizations during the study period, which may raise confounding concerns and potential for selection bias. However, detailed medical record reviews using standardized case definitions for radiographic CAP were used, and a large sample of children was randomly selected from each institution. In addition, a large number of potential confounders were selected a priori and included in multivariable analyses; propensity score adjustment was used to reduce model complexity and avoid overfitting. Radiographic findings were based on clinical interpretation by pediatric radiologists independent of a study protocol. Prior studies have demonstrated good agreement for identification of alveolar/lobar infiltrates and pleural effusion by trained radiologists, although agreement for interstitial infiltrate is poor.[26, 27] This limitation could result in either over‐ or underestimation of the prevalence of interstitial infiltrates likely resulting in a nondifferential bias toward the null. Microbiologic information, which may inform radiographic findings and disease severity, was also not available. However, because pneumonia etiology is frequently unknown in the clinical setting, our study reflects typical practice. We also did not include children from community or nonteaching hospitals. Thus, although findings may have relevance to community or nonteaching hospitals, our results cannot be generalized.
CONCLUSION
Our study demonstrates that among children hospitalized with CAP, admission chest radiographic findings are associated with important clinical outcomes and hospital care processes, highlighting additional benefits of the 2011 PIDS/IDSA guidelines' recommendation for admission chest radiographs for all children hospitalized with pneumonia. These data, in conjunction with other important prognostic information, may help clinicians more rapidly identify children at increased risk for severe illness, and could also offer guidance regarding disease management strategies and facilitate shared decision making with families. Thus, routine admission chest radiography in this population represents a valuable tool that contributes to improved quality of care.
Disclosures
Dr. Williams is supported by funds from the National Institutes of HealthNational Institute of Allergy and Infectious Diseases (K23AI104779). The authors report no conflicts of interest.
- , , , et al. The management of community‐acquired pneumonia in infants and children older than 3 months of age: clinical practice guidelines by the Pediatric Infectious Diseases Society and the Infectious Diseases Society of America. Clin Infect Dis. 2011;53(7):e25–e76.
- , , , et al. A prediction rule to identify low‐risk patients with community‐acquired pneumonia. N Engl J Med. 1997;336(4):243–250.
- , , , et al. SMART‐COP: a tool for predicting the need for intensive respiratory or vasopressor support in community‐acquired pneumonia. Clin Infect Dis. 2008;47(3):375–384.
- , , , et al. Development and validation of a clinical prediction rule for severe community‐acquired pneumonia. Am J Respir Crit Care Med. 2006;174(11):1249–1256.
- , , , et al. Risk stratification of early admission to the intensive care unit of patients with no major criteria of severe community‐acquired pneumonia: development of an international prediction rule. Crit Care. 2009;13(2):R54.
- , , , et al. Do pulmonary radiographic findings at presentation predict mortality in patients with community‐acquired pneumonia? Arch Intern Med. 1996;156(19):2206–2212.
- , , , , , . Safety and efficacy of CURB65‐guided antibiotic therapy in community‐acquired pneumonia. J Antimicrob Chemother. 2011;66(2):416–423.
- , , . Severity of childhood community‐acquired pneumonia and chest radiographic findings. Pediatr Pulmonol. 2009;44(3):249–252.
- , , , et al. Can chest x‐ray predict pneumonia severity? Pediatr Pulmonol. 2004;38(6):465–469.
- , , , . Children with pneumonia: how do they present and how are they managed? Arch Dis Child. 2007;92(5):394–398.
- , , . Role of chest X‐ray in predicting outcome of acute severe pneumonia. Indian Pediatr. 2008;45(11):893–898.
- , , , , , . Association between radiological findings and severity of community‐acquired pneumonia in children. Ital J Pediatr. 2013;39:56.
- , , , et al. Identifying pediatric community‐acquired pneumonia hospitalizations: accuracy of administrative billing codes. JAMA Pediatrics. 2013;167(9):851–858.
- , , , , , . Deaths attributed to pediatric complex chronic conditions: national trends and implications for supportive care services. Pediatrics. 2001;107(6):E99.
- , . Invited commentary: propensity scores. Am J Epidemiol. 1999;150(4):327–333.
- , , , . Increasing incidence of empyema complicating childhood community‐acquired pneumonia in the United States. Clin Infect Dis. 2010;50(6):805–813.
- , , , et al. Epidemiology and clinical characteristics of community‐acquired pneumonia in hospitalized children. Pediatrics. 2004;113(4):701–707.
- , , , et al. Molecular analysis improves pathogen identification and epidemiologic study of pediatric parapneumonic empyema. Pediatr Infect Dis J. 2011;30(4):289–294.
- , . Parapneumonic pleural effusion and empyema in children. Review of a 19‐year experience, 1962–1980. Clin Pediatr (Phila). 1983;22(6):414–419.
- , , , et al. Risk factors of progressive community‐acquired pneumonia in hospitalized children: a prospective study [published online ahead of print August 28, 2013]. J Microbiol Immunol Infect. doi: 10.1016/j.jmii.2013.06.009.
- , , , , . Community‐acquired lobar pneumonia in children in the era of universal 7‐valent pneumococcal vaccination: a review of clinical presentations and antimicrobial treatment from a Canadian pediatric hospital. BMC Pediatr. 2012;12:133.
- , , , et al. Clinical characteristics and outcome of complicated pneumococcal pneumonia in a pediatric population. Pediatr Pulmonol. 2006;41(8):726–734.
- , , , , , . Differentiation of bacterial and viral pneumonia in children. Thorax. 2002;57(5):438–441.
- , , , et al. British Thoracic Society guidelines for the management of community acquired pneumonia in children: update 2011. Thorax. 2011;66(suppl 2):ii1–ii23.
- , , , et al. Community acquired pneumonia: aetiology and usefulness of severity criteria on admission. Thorax. 1996;51(10):1010–1016.
- , , , et al. Variability in the interpretation of chest radiographs for the diagnosis of pneumonia in children. J Hosp Med. 2012;7(4):294–298.
- , , , et al. Interobserver reliability of the chest radiograph in community‐acquired pneumonia. PORT Investigators. Chest. 1996;110(2):343–350.
© 2014 Society of Hospital Medicine