User login
Antibiotic Regimens and Associated Outcomes in Children Hospitalized With Staphylococcal Scalded Skin Syndrome
Staphylococcal scalded skin syndrome (SSSS) is an exfoliative toxin-mediated dermatitis that predominantly occurs in young children. Multiple recent reports indicate a rising incidence of this disease.1-4 Recommended treatment for SSSS includes antistaphylococcal antibiotics and supportive care measures.5,6 Elimination or reduction of the toxin-producing Staphylococcus aureus is thought to help limit disease progression and promote recovery. Experts advocate for the use of antibiotics even when there is no apparent focal source of infection, such as an abscess.6,7
Several factors may affect antibiotic selection, including the desire to inhibit toxin production and to target the causative pathogen in a bactericidal fashion. Because SSSS is toxin mediated, clindamycin is often recommended because of its inhibition of toxin synthesis.5,8 The clinical utility of adding other antibiotics to clindamycin for coverage of methicillin-sensitive S aureus (MSSA) or methicillin-resistant S aureus (MRSA) is uncertain. Several studies report MSSA to be the predominant pathogen identified by culture2,9; however, SSSS caused by MRSA has been reported.9-11 Additionally, bactericidal antibiotics (eg, nafcillin) have been considered to hold potential clinical advantage as compared with bacteriostatic antibiotics (eg, clindamycin), even though clinical studies have not clearly demonstrated this advantage in the general population.12,13 Some experts recommend additional MRSA or MSSA coverage (such as vancomycin or nafcillin) in patients with high illness severity or nonresponse to therapy, or in areas where there is high prevalence of staphylococcal resistance to clindamycin.5,7,9,14 Alternatively, for areas with low MRSA prevalence, monotherapy with an anti-MSSA antibiotic is another potential option. No recent studies have compared patient outcomes among antibiotic regimens in children with SSSS.
Knowledge of the outcomes associated with different antibiotic regimens for children hospitalized with SSSS is needed and could be used to improve patient outcomes and potentially promote antibiotic stewardship. In this study, our objectives were to (1) describe antibiotic regimens given to children hospitalized with SSSS, and (2) examine the association of three antibiotic regimens commonly used for SSSS (clindamycin monotherapy, clindamycin plus additional MSSA coverage, and clindamycin plus additional MRSA coverage) with patient outcomes of length of stay (LOS), treatment failure, and cost in a large cohort of children at US children’s hospitals.
METHODS
We conducted a multicenter, retrospective cohort study utilizing data within the Pediatric Health Information System (PHIS) database from July 1, 2011, to June 30, 2016. Thirty-five free-standing tertiary care US children’s hospitals within 24 states were included. The Children’s Hospital Association (Lenexa, Kansas) maintains the PHIS database, which contains de-identified patient information, including diagnoses (with International Classification of Diseases, Ninth and Tenth Revision, Clinical Modification [ICD-9-CM, ICD-10-CM]), demographics, procedures, and daily billing records. Data quality and reliability are confirmed by participating institutions and the Children’s Hospital Association.15 The local institutional review board (IRB) deemed the study exempt from formal IRB review, as patient information was de-identified.
Study Population
We included hospitalized children aged newborn to 18 years with a primary or secondary diagnosis of SSSS (ICD-9, 695.81; ICD-10, L00). Children whose primary presentation and admission were to a PHIS hospital were included; children transferred from another hospital were excluded. The following exclusion criteria were based on previously published methodology.16 Children with complex chronic medical conditions as classified by Feudtner et al17 were excluded, since these children may require a different treatment approach than the general pediatric population. In order to decrease diagnostic ambiguity, we excluded children if an alternative dermatologic diagnosis was recorded as a principal or secondary diagnosis (eg, Stevens-Johnson syndrome or scarlet fever).16 Finally, hospitals with fewer than 10 children with SSSS during the study period were excluded.
Antibiotic Regimen Groups
We used PHIS daily billing codes to determine the antibiotics received by the study population. Children were classified into antibiotic regimen groups based on whether they received specific antibiotic combinations. Antibiotics received on any day during the hospitalization, including in the emergency department (ED), were used to assign patients to regimen groups. Antibiotics were classified into regimen groups based on consensus among study investigators, which included two board-certified pediatric infectious diseases specialists (A.C., R.M.). Antibiotic group definitions are listed in Table 1. Oral and intravenous (IV) therapies were grouped together for clindamycin, cephalexin/cefazolin, and linezolid because of good oral bioavailability in most situations.18 The three most common antistaphylococcal groups were chosen for further analysis: clindamycin alone, clindamycin plus MSSA coverage, and clindamycin plus MRSA coverage. The clindamycin group was defined as children with receipt of oral or IV clindamycin. Children who received clindamycin with additional MSSA coverage, such as cefazolin or nafcillin, were categorized as the clindamycin plus MSSA group. Children who received clindamycin with additional MRSA coverage, such as vancomycin or linezolid, were categorized as the clindamycin plus MRSA group. We chose not to include children who received the above regimens plus other antibiotics with partial antistaphylococcal activity, such as ampicillin, gentamicin, or ceftriaxone, in the clindamycin plus MSSA and clindamycin plus MRSA groups. We excluded these antibiotics to decrease the heterogeneity in the definition of regimen groups and allow a more direct comparison for effectiveness.

Covariates
Covariates included age, sex, ethnicity and/or race, payer type, level of care, illness severity, and region. The variable definitions below are in keeping with a prior study of SSSS.16 Age was categorized as: birth to 59 days, 2 to 11 months, 1 to 4 years (preschool age), 5 to 10 years (school age), and 11 to 18 years (adolescent). We examined infants younger than 60 days separately from older infants because this population may warrant additional treatment considerations. Race and ethnicity were categorized as White (non-Hispanic), African American (non-Hispanic), Hispanic, or other. Payer types included government, private, or other. Level of care was assigned as either intensive care or acute care. Illness severity was assigned using the All Patient Refined Diagnosis Related Group (APR-DRG; 3M Corporation, St. Paul, Minnesota) severity levels.19 In line with a prior study,16 we defined “low illness severity” as the APR-DRG minor (1) classification. The moderate (2), major (3), and extreme (4) classifications were defined as “moderate to high illness severity,” since there were very few classifications of major or extreme (<5%) illness severity. We categorized hospitals into the following US regions: Northeast, Midwest, South, and West.
Outcome Measures
The primary outcome was hospital LOS in days, and secondary outcomes were treatment failure and hospital costs. Hospital LOS was chosen as the primary outcome to represent the time needed for the child to show clinical improvement. Treatment failure was defined as a same-cause 14-day ED revisit or hospital readmission, and these were determined to be same-cause if a diagnosis for SSSS (ICD-9, 695.81; ICD-10, L00) was documented for the return encounter. The 14-day interval for readmission and ED revisit was chosen to measure any relapse of symptoms after completion of antibiotic therapy, similar to a prior study of treatment failure in skin and soft tissue infections.20 Total costs of the hospitalization were estimated from charges using hospital- and year-specific cost-to-charge ratios. Subcategories of cost, including clinical, pharmacy, imaging, laboratory, supply, and other, were also compared among the three groups.
Statistical Analysis
Demographic and clinical characteristics of children were summarized using frequencies and percentages for categorical variables and medians with interquartile ranges (IQRs) for continuous variables. These were compared across antibiotic groups using chi-square and Kruskal–Wallis tests, respectively. In unadjusted analyses, outcomes were compared across antibiotic regimen groups using these same statistical tests. In order to account for patient clustering within hospitals, generalized linear mixed-effects models were used to model outcomes with a random intercept for each hospital. Models were adjusted for SSSS being listed as a principal or secondary diagnosis, race, illness severity, and level of care. We log-transformed LOS and cost data prior to modeling because of the nonnormal distributions for these data. Owing to the inability to measure the number of antibiotic doses, and to reduce the possibility of including children who received few regimen-defined combination antibiotics, a post hoc sensitivity analysis was performed. This analysis used an alternative definition for antibiotic regimen groups, for which children admitted for 2 or more calendar days must have received regimen-specified antibiotics on at least 2 days of the admission. Additionally, outcomes were stratified by low and moderate/high illness severity and compared across the three antibiotic regimen groups. All analyses were performed with SAS (SAS 9.4; SAS Institute, Cary, North Carolina), and P values of less than .05 were considered statistically significant.
RESULTS
Overall, 1,815 hospitalized children with SSSS were identified in the PHIS database, and after application of the exclusion criteria, 1,259 children remained, with 1,247 (99%) receiving antibiotics (Figure). The antibiotic regimens received by these children are described in Table 1. Of these, 828 children (66%) received one of the three most common antistaphylococcal regimens (clindamycin, clindamycin + MSSA, and clindamycin + MRSA) and were included for further analysis.

Characteristics of the 828 children are presented in Table 2. Most children (82%) were aged 4 years or younger, and distributions of age, sex, and insurance payer were similar among children receiving the three regimens. Thirty-two percent had moderate to high illness severity, and 3.5% required management in the intensive care setting. Of the three antibiotic regimens, clindamycin monotherapy was most common (47%), followed by clindamycin plus MSSA coverage (33%), and clindamycin plus MRSA coverage (20%). A higher proportion of children in the clindamycin plus MRSA group were African American and were hospitalized in the South. Children receiving clindamycin plus MRSA coverage had higher illness severity (44%) as compared with clindamycin monotherapy (28%) and clindamycin plus MSSA coverage (32%) (P = .001). Additionally, a larger proportion of children treated with clindamycin plus MRSA coverage were managed in the intensive care setting as compared with the clindamycin plus MSSA or clindamycin monotherapy groups.

Among the 828 children with SSSS, the median LOS was 2 days (IQR, 2-3), and treatment failure was 1.1% (95% CI, 0.4-1.8). After adjustment for illness severity, race, payer, and region (Table 3), the three antibiotic regimens were not associated with significant differences in LOS or treatment failure. Costs were significantly different among the three antibiotic regimens. Clindamycin plus MRSA coverage was associated with the greatest costs, whereas clindamycin monotherapy was associated with the lowest costs (mean, $5,348 vs $4,839, respectively; P < .001) (Table 3). In a sensitivity analysis using an alternative antibiotic regimen definition, we found results in line with the primary analysis, with no statistically significant differences in LOS (P = .44) or treatment failure (P = .54), but significant differences in cost (P < .001). Additionally, the same findings were present for LOS, treatment failure, and cost when outcomes were stratified by illness severity (Appendix Table). However, significant contributors to the higher cost in the clindamycin plus MRSA group did vary by illness severity stratification. Laboratory, supply, and pharmacy cost categories differed significantly among antibiotic groups for the low illness severity strata, whereas pharmacy was the only significant cost category difference in moderate/high illness severity.

DISCUSSION
Clindamycin monotherapy, clindamycin plus MSSA coverage, and clindamycin plus MRSA coverage are the most commonly administered antistaphylococcal antibiotic regimens for children hospitalized with SSSS at US children’s hospitals. Our multicenter study found that, across these antistaphylococcal antibiotic regimens, there were no associated differences in hospital LOS or treatment failure. However, the antibiotic regimens were associated with significant differences in overall hospital costs. These findings suggest that the use of clindamycin with additional MSSA or MRSA antibiotic coverage for children with SSSS may not be associated with additional clinical benefit, as compared with clindamycin monotherapy, and could potentially be more costly.
Prior literature describing LOS in relation to antibiotic use for children with SSSS is limited. Authors of a recent case series of 21 children in Philadelphia reported approximately 50% of children received clindamycin monotherapy or combination therapy, but patient outcomes such as LOS were not described.9 Clindamycin use and outcomes have been described in smaller studies and case reports of SSSS, which reported positive outcomes such as patient recovery and lack of disease recurrence.2,9,21 A small retrospective, comparative effectiveness study of 30 neonates with SSSS examined beta-lactamase–resistant penicillin use with and without cephalosporins. They found no effect on LOS, but findings were limited by a small sample size.22 Our study cohort included relatively few neonates, and thus our findings may not be applicable to this population subgroup. We chose not to include regimens with third-generation cephalosporins or ampicillin, which may have limited the number of included neonates, because these antibiotics are frequently administered during evaluation for invasive bacterial infections.23 We found a very low occurrence of treatment failure in our study cohort across all three groups, which is consistent with other studies of SSSS that report an overall good prognosis and low recurrence and/or readmission rates.6,16,24 The low prevalence of treatment failure, however, precluded our ability to detect small differences among antibiotic regimen groups that may exist.
We observed that cost differed significantly across antibiotic regimen groups, with lowest cost associated with clindamycin monotherapy in adjusted analysis despite similar LOS. Even with our illness-severity adjustment, there may have been other unmeasured factors resulting in the higher cost associated with the combination groups. Hence, we also examined cost breakdown with a stratified analysis by illness severity. We found that pharmacy costs were significantly different among antibiotic groups in both illness severity strata, whereas those with low illness severity also differed by laboratory and supply costs. Thus, pharmacy cost differences may be the largest driver in the cost differential among groups. Lower cost in the clindamycin monotherapy group is likely due to administration of a single antibiotic. The reason for supply and laboratory cost differences is uncertain, but higher cost in the clindamycin plus MRSA group could possibly be from laboratory testing related to drug monitoring (eg, renal function testing or drug levels). While other studies have reported costs for hospitalized children with SSSS associated with different patient characteristics or diagnostic testing,1,16 to our knowledge, no other studies have reported cost related to antibiotic regimens for SSSS. As healthcare reimbursements shift to value-based models, identifying treatment regimens with equal efficacy but lower cost will become increasingly important. Future studies should also examine other covariates and outcomes, such as oral vs parenteral antibiotic use, use of monitoring laboratories related to antibiotic choice, and adverse drug effects.
Several strengths and additional limitations apply to our study. Our study is one of the few to describe outcomes associated with antibiotic regimens for children with SSSS. With the PHIS database, we were able to include a large number of children with SSSS from children’s hospitals across the United States. Although the PHIS database affords these strengths, there are limitations inherent to administrative data. Children with SSSS were identified by documented ICD-9 and ICD-10 diagnostic codes, which might lead to misclassification. However, misclassification is less likely because only one ICD-9 and ICD-10 code exists for SSSS, and the characteristics of this condition are specific. Also, diagnostic codes for other dermatologic conditions (eg, scarlet fever) were excluded to further reduce the chance of misclassification. A limitation to our use of PHIS billing codes was the inability to confirm the dosage of antibiotics given, the number of doses, or whether antibiotics were prescribed upon discharge. Another limitation is that children whose antibiotic therapy was changed during hospitalization (eg, from clindamycin monotherapy to cefazolin monotherapy) were categorized into the combination groups. However, the sensitivity analysis performed based on a stricter antibiotic group definition (receipt of both antibiotics on at least 2 calendar days) did not alter the outcomes, which is reassuring. We were unable to assess the use of targeted antibiotic therapy because clinical data (eg, microbiology results) were not available. However, this may be less important because some literature suggests that cultures for S aureus are obtained infrequently2 and may be difficult to interpret when obtained,25 since culture growth can represent colonization rather than causative strains. An additional limitation is that administrative data do not include certain clinical outcomes, such as fever duration or degree of skin involvement, which could have differed among the groups. Last, the PHIS database only captures revisits or readmissions to PHIS hospitals, and so we are unable to exclude the possibility of a child being seen at or readmitted to another hospital.
Due to the observational design of this study and potential for incomplete measurement of illness severity, we recommend a future prospective trial with randomization to confirm these findings. One possible reason that LOS did not differ among groups is that the burden of clindamycin-resistant strains in our cohort could be low, and the addition of MSSA or MRSA coverage does not result in a clinically important increase in S aureus coverage. However, pooled pediatric hospital antibiogram data suggest the overall rate of clindamycin resistance is close to 20% in hospitals located in all US regions.26 Limited studies also suggest that MSSA may be the predominant pathogen associated with SSSS.2,9 To address this, future randomized trials could compare the effectiveness of clindamycin monotherapy to MSSA-specific agents like cefazolin or nafcillin. Unfortunately, anti-MSSA monotherapy was not evaluated in our study because very few children received this treatment. Using monotherapy as opposed to multiple antibiotics has the potential to promote antibiotic stewardship for antistaphylococcal antibiotics in the management of SSSS. Reducing unnecessary antibiotic use not only potentially affects antibiotic resistance, but could also benefit patients in reducing possible side effects, cost, and IV catheter complications.27 However, acknowledging our study limitations, our findings should be applied cautiously in clinical settings, in the context of local antibiogram data, individual culture results, and specific patient factors. The local clindamycin resistance rate for both MSSA and MRSA should be considered. Many antibiotics chosen to treat MRSA—such as vancomycin and trimethoprim/sulfamethoxazole—will also have anti-MSSA activity and may have lower local resistance rates than clindamycin. Practitioners may also consider how each antibiotic kills bacteria; for example, beta-lactams rely on bacterial replication, but clindamycin does not. Each factor should influence how empiric treatment, whether monotherapy or combination, is chosen for children with SSSS.
CONCLUSION
In this large, multicenter cohort of hospitalized children with SSSS, we found that the addition of MSSA or MRSA coverage to clindamycin monotherapy was not associated with differences in outcomes of hospital LOS and treatment failure. Furthermore, clindamycin monotherapy was associated with lower overall cost. Prospective randomized studies are needed to confirm these findings and assess whether clindamycin monotherapy, monotherapy with an anti-MSSA antibiotic, or alternative regimens are most effective for treatment of children with SSSS.
1. Staiman A, Hsu DY, Silverberg JI. Epidemiology of staphylococcal scalded skin syndrome in United States children. Br J Dermatol. 2018;178(3):704-708. https://doi.org/10.1111/bjd.16097
2. Hulten KG, Kok M, King KE, Lamberth LB, Kaplan SL. Increasing numbers of staphylococcal scalded skin syndrome cases caused by ST121 in Houston, TX. Pediatr Infect Dis J. 2020;39(1):30-34. https://doi.org/10.1097/INF.0000000000002499
3. Arnold JD, Hoek SN, Kirkorian AY. Epidemiology of staphylococcal scalded skin syndrome in the United States: A cross-sectional study, 2010-2014. J Am Acad Dermatol. 2018;78(2):404-406. https://doi.org/10.1016/j.jaad.2017.09.023
4. Hayward A, Knott F, Petersen I, et al. Increasing hospitalizations and general practice prescriptions for community-onset staphylococcal disease, England. Emerg Infect Dis. 2008;14(5):720-726. https://doi.org/10.3201/eid1405.070153
5. Berk DR, Bayliss SJ. MRSA, staphylococcal scalded skin syndrome, and other cutaneous bacterial emergencies. Pediatr Ann. 2010;39(10):627-633. https://doi.org/10.3928/00904481-20100922-02
6. Ladhani S, Joannou CL, Lochrie DP, Evans RW, Poston SM. Clinical, microbial, and biochemical aspects of the exfoliative toxins causing staphylococcal scalded-skin syndrome. Clin Microbiol Rev. 1999;12(2):224-242.
7. Handler MZ, Schwartz RA. Staphylococcal scalded skin syndrome: diagnosis and management in children and adults. J Eur Acad Dermatol Venereol. 2014;28(11):1418-1423. https://doi.org/10.1111/jdv.12541
8. Hodille E, Rose W, Diep BA, Goutelle S, Lina G, Dumitrescu O. The role of antibiotics in modulating virulence in Staphylococcus aureus. Clin Microbiol Rev. 2017;30(4):887-917. https://doi.org/10.1128/CMR.00120-16
9. Braunstein I, Wanat KA, Abuabara K, McGowan KL, Yan AC, Treat JR. Antibiotic sensitivity and resistance patterns in pediatric staphylococcal scalded skin syndrome. Pediatr Dermatol. 2014;31(3):305-308. https://doi.org/10.1111/pde.12195
10. Yamaguchi T, Yokota Y, Terajima J, et al. Clonal association of Staphylococcus aureus causing bullous impetigo and the emergence of new methicillin-resistant clonal groups in Kansai district in Japan. J Infect Dis. 2002;185(10):1511-1516. https://doi.org/10.1086/340212
11. Noguchi N, Nakaminami H, Nishijima S, Kurokawa I, So H, Sasatsu M. Antimicrobial agent of susceptibilities and antiseptic resistance gene distribution among methicillin-resistant Staphylococcus aureus isolates from patients with impetigo and staphylococcal scalded skin syndrome. J Clin Microbiol. 2006;44(6):2119-2125. https://doi.org/10.1128/JCM.02690-05
12. Pankey GA, Sabath LD. Clinical relevance of bacteriostatic versus bactericidal mechanisms of action in the treatment of Gram-positive bacterial infections. Clin Infect Dis. 2004;38(6):864-870. https://doi.org/10.1086/381972
13. Wald-Dickler N, Holtom P, Spellberg B. Busting the myth of “static vs cidal”: a systemic literature review. Clin Infect Dis. 2018;66(9):1470-1474. https://doi.org/10.1093/cid/cix1127
14. Ladhani S, Joannou CL. Difficulties in diagnosis and management of the staphylococcal scalded skin syndrome. Pediatr Infect Dis J. 2000;19(9):819-821. https://doi.org/10.1097/00006454-200009000-00002
15. Mongelluzzo J, Mohamad Z, Ten Have TR, Shah SS. Corticosteroids and mortality in children with bacterial meningitis. JAMA. 2008;299(17):2048-2055. https://doi.org/10.1001/jama.299.17.2048
16. Neubauer HC, Hall M, Wallace SS, et al. Variation in diagnostic test use and associated outcomes in staphylococcal scalded skin syndrome at children’s hospitals. Hosp Pediatr. 2018;8(9):530-537. https://doi.org/10.1542/hpeds.2018-0032
17. Feudtner C, Feinstein JA, Zhong W, Hall M, Dai D. Pediatric complex chronic conditions classification system version 2: updated for ICD-10 and complex medical technology dependence and transplantation. BMC Pediatr. 2014;14:199. https://doi.org/10.1186/1471-2431-14-199
18. Sauberan JS, Bradley JS. Antimicrobial agents. In: Long SS, ed. Principles and Practice of Pediatric Infectious Diseases. Elsevier; 2018:1499-1531.
19. Sedman AB, Bahl V, Bunting E, et al. Clinical redesign using all patient refined diagnosis related groups. Pediatrics. 2004;114(4):965-969. https://doi.org/10.1542/peds.2004-0650
20. Williams DJ, Cooper WO, Kaltenbach LA, et al. Comparative effectiveness of antibiotic treatment strategies for pediatric skin and soft-tissue infections. Pediatrics. 2011;128(3):e479-487. https://doi.org/10.1542/peds.2010-3681
21. Haasnoot PJ, De Vries A. Staphylococcal scalded skin syndrome in a 4-year-old child: a case report. J Med Case Rep. 2018;12(1):20. https://doi.org/ 10.1186/s13256-017-1533-7
22. Li MY, Hua Y, Wei GH, Qiu L. Staphylococcal scalded skin syndrome in neonates: an 8-year retrospective study in a single institution. Pediatr Dermatol. 2014;31(1):43-47. https://doi.org/10.1111/pde.12114
23. Markham JL, Hall M, Queen MA, et al. Variation in antibiotic selection and clinical outcomes in infants <60 days hospitalized with skin and soft tissue infections. Hosp Pediatr. 2019;9(1):30-38. https://doi.org/10.1542/hpeds.2017-0237
24. Davidson J, Polly S, Hayes PJ, Fisher KR, Talati AJ, Patel T. Recurrent staphylococcal scalded skin syndrome in an extremely low-birth-weight neonate. AJP Rep. 2017;7(2):e134-e137. https://doi.org/10.1055/s-0037-1603971
25. Ladhani S, Robbie S, Chapple DS, Joannou CL, Evans RW. Isolating Staphylococcus aureus from children with suspected Staphylococcal scalded skin syndrome is not clinically useful. Pediatr Infect Dis J. 2003;22(3):284-286.
26. Tamma PD, Robinson GL, Gerber JS, et al. Pediatric antimicrobial susceptibility trends across the United States. Infect Control Hosp Epidemiol. 2013;34(12):1244-1251. https://doi.org/10.1086/673974
27. Unbeck M, Forberg U, Ygge BM, Ehrenberg A, Petzold M, Johansson E. Peripheral venous catheter related complications are common among paediatric and neonatal patients. Acta Paediatr. 2015;104(6):566-574. https://doi.org/10.1111/apa.12963
Staphylococcal scalded skin syndrome (SSSS) is an exfoliative toxin-mediated dermatitis that predominantly occurs in young children. Multiple recent reports indicate a rising incidence of this disease.1-4 Recommended treatment for SSSS includes antistaphylococcal antibiotics and supportive care measures.5,6 Elimination or reduction of the toxin-producing Staphylococcus aureus is thought to help limit disease progression and promote recovery. Experts advocate for the use of antibiotics even when there is no apparent focal source of infection, such as an abscess.6,7
Several factors may affect antibiotic selection, including the desire to inhibit toxin production and to target the causative pathogen in a bactericidal fashion. Because SSSS is toxin mediated, clindamycin is often recommended because of its inhibition of toxin synthesis.5,8 The clinical utility of adding other antibiotics to clindamycin for coverage of methicillin-sensitive S aureus (MSSA) or methicillin-resistant S aureus (MRSA) is uncertain. Several studies report MSSA to be the predominant pathogen identified by culture2,9; however, SSSS caused by MRSA has been reported.9-11 Additionally, bactericidal antibiotics (eg, nafcillin) have been considered to hold potential clinical advantage as compared with bacteriostatic antibiotics (eg, clindamycin), even though clinical studies have not clearly demonstrated this advantage in the general population.12,13 Some experts recommend additional MRSA or MSSA coverage (such as vancomycin or nafcillin) in patients with high illness severity or nonresponse to therapy, or in areas where there is high prevalence of staphylococcal resistance to clindamycin.5,7,9,14 Alternatively, for areas with low MRSA prevalence, monotherapy with an anti-MSSA antibiotic is another potential option. No recent studies have compared patient outcomes among antibiotic regimens in children with SSSS.
Knowledge of the outcomes associated with different antibiotic regimens for children hospitalized with SSSS is needed and could be used to improve patient outcomes and potentially promote antibiotic stewardship. In this study, our objectives were to (1) describe antibiotic regimens given to children hospitalized with SSSS, and (2) examine the association of three antibiotic regimens commonly used for SSSS (clindamycin monotherapy, clindamycin plus additional MSSA coverage, and clindamycin plus additional MRSA coverage) with patient outcomes of length of stay (LOS), treatment failure, and cost in a large cohort of children at US children’s hospitals.
METHODS
We conducted a multicenter, retrospective cohort study utilizing data within the Pediatric Health Information System (PHIS) database from July 1, 2011, to June 30, 2016. Thirty-five free-standing tertiary care US children’s hospitals within 24 states were included. The Children’s Hospital Association (Lenexa, Kansas) maintains the PHIS database, which contains de-identified patient information, including diagnoses (with International Classification of Diseases, Ninth and Tenth Revision, Clinical Modification [ICD-9-CM, ICD-10-CM]), demographics, procedures, and daily billing records. Data quality and reliability are confirmed by participating institutions and the Children’s Hospital Association.15 The local institutional review board (IRB) deemed the study exempt from formal IRB review, as patient information was de-identified.
Study Population
We included hospitalized children aged newborn to 18 years with a primary or secondary diagnosis of SSSS (ICD-9, 695.81; ICD-10, L00). Children whose primary presentation and admission were to a PHIS hospital were included; children transferred from another hospital were excluded. The following exclusion criteria were based on previously published methodology.16 Children with complex chronic medical conditions as classified by Feudtner et al17 were excluded, since these children may require a different treatment approach than the general pediatric population. In order to decrease diagnostic ambiguity, we excluded children if an alternative dermatologic diagnosis was recorded as a principal or secondary diagnosis (eg, Stevens-Johnson syndrome or scarlet fever).16 Finally, hospitals with fewer than 10 children with SSSS during the study period were excluded.
Antibiotic Regimen Groups
We used PHIS daily billing codes to determine the antibiotics received by the study population. Children were classified into antibiotic regimen groups based on whether they received specific antibiotic combinations. Antibiotics received on any day during the hospitalization, including in the emergency department (ED), were used to assign patients to regimen groups. Antibiotics were classified into regimen groups based on consensus among study investigators, which included two board-certified pediatric infectious diseases specialists (A.C., R.M.). Antibiotic group definitions are listed in Table 1. Oral and intravenous (IV) therapies were grouped together for clindamycin, cephalexin/cefazolin, and linezolid because of good oral bioavailability in most situations.18 The three most common antistaphylococcal groups were chosen for further analysis: clindamycin alone, clindamycin plus MSSA coverage, and clindamycin plus MRSA coverage. The clindamycin group was defined as children with receipt of oral or IV clindamycin. Children who received clindamycin with additional MSSA coverage, such as cefazolin or nafcillin, were categorized as the clindamycin plus MSSA group. Children who received clindamycin with additional MRSA coverage, such as vancomycin or linezolid, were categorized as the clindamycin plus MRSA group. We chose not to include children who received the above regimens plus other antibiotics with partial antistaphylococcal activity, such as ampicillin, gentamicin, or ceftriaxone, in the clindamycin plus MSSA and clindamycin plus MRSA groups. We excluded these antibiotics to decrease the heterogeneity in the definition of regimen groups and allow a more direct comparison for effectiveness.
Covariates
Covariates included age, sex, ethnicity and/or race, payer type, level of care, illness severity, and region. The variable definitions below are in keeping with a prior study of SSSS.16 Age was categorized as: birth to 59 days, 2 to 11 months, 1 to 4 years (preschool age), 5 to 10 years (school age), and 11 to 18 years (adolescent). We examined infants younger than 60 days separately from older infants because this population may warrant additional treatment considerations. Race and ethnicity were categorized as White (non-Hispanic), African American (non-Hispanic), Hispanic, or other. Payer types included government, private, or other. Level of care was assigned as either intensive care or acute care. Illness severity was assigned using the All Patient Refined Diagnosis Related Group (APR-DRG; 3M Corporation, St. Paul, Minnesota) severity levels.19 In line with a prior study,16 we defined “low illness severity” as the APR-DRG minor (1) classification. The moderate (2), major (3), and extreme (4) classifications were defined as “moderate to high illness severity,” since there were very few classifications of major or extreme (<5%) illness severity. We categorized hospitals into the following US regions: Northeast, Midwest, South, and West.
Outcome Measures
The primary outcome was hospital LOS in days, and secondary outcomes were treatment failure and hospital costs. Hospital LOS was chosen as the primary outcome to represent the time needed for the child to show clinical improvement. Treatment failure was defined as a same-cause 14-day ED revisit or hospital readmission, and these were determined to be same-cause if a diagnosis for SSSS (ICD-9, 695.81; ICD-10, L00) was documented for the return encounter. The 14-day interval for readmission and ED revisit was chosen to measure any relapse of symptoms after completion of antibiotic therapy, similar to a prior study of treatment failure in skin and soft tissue infections.20 Total costs of the hospitalization were estimated from charges using hospital- and year-specific cost-to-charge ratios. Subcategories of cost, including clinical, pharmacy, imaging, laboratory, supply, and other, were also compared among the three groups.
Statistical Analysis
Demographic and clinical characteristics of children were summarized using frequencies and percentages for categorical variables and medians with interquartile ranges (IQRs) for continuous variables. These were compared across antibiotic groups using chi-square and Kruskal–Wallis tests, respectively. In unadjusted analyses, outcomes were compared across antibiotic regimen groups using these same statistical tests. In order to account for patient clustering within hospitals, generalized linear mixed-effects models were used to model outcomes with a random intercept for each hospital. Models were adjusted for SSSS being listed as a principal or secondary diagnosis, race, illness severity, and level of care. We log-transformed LOS and cost data prior to modeling because of the nonnormal distributions for these data. Owing to the inability to measure the number of antibiotic doses, and to reduce the possibility of including children who received few regimen-defined combination antibiotics, a post hoc sensitivity analysis was performed. This analysis used an alternative definition for antibiotic regimen groups, for which children admitted for 2 or more calendar days must have received regimen-specified antibiotics on at least 2 days of the admission. Additionally, outcomes were stratified by low and moderate/high illness severity and compared across the three antibiotic regimen groups. All analyses were performed with SAS (SAS 9.4; SAS Institute, Cary, North Carolina), and P values of less than .05 were considered statistically significant.
RESULTS
Overall, 1,815 hospitalized children with SSSS were identified in the PHIS database, and after application of the exclusion criteria, 1,259 children remained, with 1,247 (99%) receiving antibiotics (Figure). The antibiotic regimens received by these children are described in Table 1. Of these, 828 children (66%) received one of the three most common antistaphylococcal regimens (clindamycin, clindamycin + MSSA, and clindamycin + MRSA) and were included for further analysis.
Characteristics of the 828 children are presented in Table 2. Most children (82%) were aged 4 years or younger, and distributions of age, sex, and insurance payer were similar among children receiving the three regimens. Thirty-two percent had moderate to high illness severity, and 3.5% required management in the intensive care setting. Of the three antibiotic regimens, clindamycin monotherapy was most common (47%), followed by clindamycin plus MSSA coverage (33%), and clindamycin plus MRSA coverage (20%). A higher proportion of children in the clindamycin plus MRSA group were African American and were hospitalized in the South. Children receiving clindamycin plus MRSA coverage had higher illness severity (44%) as compared with clindamycin monotherapy (28%) and clindamycin plus MSSA coverage (32%) (P = .001). Additionally, a larger proportion of children treated with clindamycin plus MRSA coverage were managed in the intensive care setting as compared with the clindamycin plus MSSA or clindamycin monotherapy groups.
Among the 828 children with SSSS, the median LOS was 2 days (IQR, 2-3), and treatment failure was 1.1% (95% CI, 0.4-1.8). After adjustment for illness severity, race, payer, and region (Table 3), the three antibiotic regimens were not associated with significant differences in LOS or treatment failure. Costs were significantly different among the three antibiotic regimens. Clindamycin plus MRSA coverage was associated with the greatest costs, whereas clindamycin monotherapy was associated with the lowest costs (mean, $5,348 vs $4,839, respectively; P < .001) (Table 3). In a sensitivity analysis using an alternative antibiotic regimen definition, we found results in line with the primary analysis, with no statistically significant differences in LOS (P = .44) or treatment failure (P = .54), but significant differences in cost (P < .001). Additionally, the same findings were present for LOS, treatment failure, and cost when outcomes were stratified by illness severity (Appendix Table). However, significant contributors to the higher cost in the clindamycin plus MRSA group did vary by illness severity stratification. Laboratory, supply, and pharmacy cost categories differed significantly among antibiotic groups for the low illness severity strata, whereas pharmacy was the only significant cost category difference in moderate/high illness severity.
DISCUSSION
Clindamycin monotherapy, clindamycin plus MSSA coverage, and clindamycin plus MRSA coverage are the most commonly administered antistaphylococcal antibiotic regimens for children hospitalized with SSSS at US children’s hospitals. Our multicenter study found that, across these antistaphylococcal antibiotic regimens, there were no associated differences in hospital LOS or treatment failure. However, the antibiotic regimens were associated with significant differences in overall hospital costs. These findings suggest that the use of clindamycin with additional MSSA or MRSA antibiotic coverage for children with SSSS may not be associated with additional clinical benefit, as compared with clindamycin monotherapy, and could potentially be more costly.
Prior literature describing LOS in relation to antibiotic use for children with SSSS is limited. Authors of a recent case series of 21 children in Philadelphia reported approximately 50% of children received clindamycin monotherapy or combination therapy, but patient outcomes such as LOS were not described.9 Clindamycin use and outcomes have been described in smaller studies and case reports of SSSS, which reported positive outcomes such as patient recovery and lack of disease recurrence.2,9,21 A small retrospective, comparative effectiveness study of 30 neonates with SSSS examined beta-lactamase–resistant penicillin use with and without cephalosporins. They found no effect on LOS, but findings were limited by a small sample size.22 Our study cohort included relatively few neonates, and thus our findings may not be applicable to this population subgroup. We chose not to include regimens with third-generation cephalosporins or ampicillin, which may have limited the number of included neonates, because these antibiotics are frequently administered during evaluation for invasive bacterial infections.23 We found a very low occurrence of treatment failure in our study cohort across all three groups, which is consistent with other studies of SSSS that report an overall good prognosis and low recurrence and/or readmission rates.6,16,24 The low prevalence of treatment failure, however, precluded our ability to detect small differences among antibiotic regimen groups that may exist.
We observed that cost differed significantly across antibiotic regimen groups, with lowest cost associated with clindamycin monotherapy in adjusted analysis despite similar LOS. Even with our illness-severity adjustment, there may have been other unmeasured factors resulting in the higher cost associated with the combination groups. Hence, we also examined cost breakdown with a stratified analysis by illness severity. We found that pharmacy costs were significantly different among antibiotic groups in both illness severity strata, whereas those with low illness severity also differed by laboratory and supply costs. Thus, pharmacy cost differences may be the largest driver in the cost differential among groups. Lower cost in the clindamycin monotherapy group is likely due to administration of a single antibiotic. The reason for supply and laboratory cost differences is uncertain, but higher cost in the clindamycin plus MRSA group could possibly be from laboratory testing related to drug monitoring (eg, renal function testing or drug levels). While other studies have reported costs for hospitalized children with SSSS associated with different patient characteristics or diagnostic testing,1,16 to our knowledge, no other studies have reported cost related to antibiotic regimens for SSSS. As healthcare reimbursements shift to value-based models, identifying treatment regimens with equal efficacy but lower cost will become increasingly important. Future studies should also examine other covariates and outcomes, such as oral vs parenteral antibiotic use, use of monitoring laboratories related to antibiotic choice, and adverse drug effects.
Several strengths and additional limitations apply to our study. Our study is one of the few to describe outcomes associated with antibiotic regimens for children with SSSS. With the PHIS database, we were able to include a large number of children with SSSS from children’s hospitals across the United States. Although the PHIS database affords these strengths, there are limitations inherent to administrative data. Children with SSSS were identified by documented ICD-9 and ICD-10 diagnostic codes, which might lead to misclassification. However, misclassification is less likely because only one ICD-9 and ICD-10 code exists for SSSS, and the characteristics of this condition are specific. Also, diagnostic codes for other dermatologic conditions (eg, scarlet fever) were excluded to further reduce the chance of misclassification. A limitation to our use of PHIS billing codes was the inability to confirm the dosage of antibiotics given, the number of doses, or whether antibiotics were prescribed upon discharge. Another limitation is that children whose antibiotic therapy was changed during hospitalization (eg, from clindamycin monotherapy to cefazolin monotherapy) were categorized into the combination groups. However, the sensitivity analysis performed based on a stricter antibiotic group definition (receipt of both antibiotics on at least 2 calendar days) did not alter the outcomes, which is reassuring. We were unable to assess the use of targeted antibiotic therapy because clinical data (eg, microbiology results) were not available. However, this may be less important because some literature suggests that cultures for S aureus are obtained infrequently2 and may be difficult to interpret when obtained,25 since culture growth can represent colonization rather than causative strains. An additional limitation is that administrative data do not include certain clinical outcomes, such as fever duration or degree of skin involvement, which could have differed among the groups. Last, the PHIS database only captures revisits or readmissions to PHIS hospitals, and so we are unable to exclude the possibility of a child being seen at or readmitted to another hospital.
Due to the observational design of this study and potential for incomplete measurement of illness severity, we recommend a future prospective trial with randomization to confirm these findings. One possible reason that LOS did not differ among groups is that the burden of clindamycin-resistant strains in our cohort could be low, and the addition of MSSA or MRSA coverage does not result in a clinically important increase in S aureus coverage. However, pooled pediatric hospital antibiogram data suggest the overall rate of clindamycin resistance is close to 20% in hospitals located in all US regions.26 Limited studies also suggest that MSSA may be the predominant pathogen associated with SSSS.2,9 To address this, future randomized trials could compare the effectiveness of clindamycin monotherapy to MSSA-specific agents like cefazolin or nafcillin. Unfortunately, anti-MSSA monotherapy was not evaluated in our study because very few children received this treatment. Using monotherapy as opposed to multiple antibiotics has the potential to promote antibiotic stewardship for antistaphylococcal antibiotics in the management of SSSS. Reducing unnecessary antibiotic use not only potentially affects antibiotic resistance, but could also benefit patients in reducing possible side effects, cost, and IV catheter complications.27 However, acknowledging our study limitations, our findings should be applied cautiously in clinical settings, in the context of local antibiogram data, individual culture results, and specific patient factors. The local clindamycin resistance rate for both MSSA and MRSA should be considered. Many antibiotics chosen to treat MRSA—such as vancomycin and trimethoprim/sulfamethoxazole—will also have anti-MSSA activity and may have lower local resistance rates than clindamycin. Practitioners may also consider how each antibiotic kills bacteria; for example, beta-lactams rely on bacterial replication, but clindamycin does not. Each factor should influence how empiric treatment, whether monotherapy or combination, is chosen for children with SSSS.
CONCLUSION
In this large, multicenter cohort of hospitalized children with SSSS, we found that the addition of MSSA or MRSA coverage to clindamycin monotherapy was not associated with differences in outcomes of hospital LOS and treatment failure. Furthermore, clindamycin monotherapy was associated with lower overall cost. Prospective randomized studies are needed to confirm these findings and assess whether clindamycin monotherapy, monotherapy with an anti-MSSA antibiotic, or alternative regimens are most effective for treatment of children with SSSS.
1. Staiman A, Hsu DY, Silverberg JI. Epidemiology of staphylococcal scalded skin syndrome in United States children. Br J Dermatol. 2018;178(3):704-708. https://doi.org/10.1111/bjd.16097
2. Hulten KG, Kok M, King KE, Lamberth LB, Kaplan SL. Increasing numbers of staphylococcal scalded skin syndrome cases caused by ST121 in Houston, TX. Pediatr Infect Dis J. 2020;39(1):30-34. https://doi.org/10.1097/INF.0000000000002499
3. Arnold JD, Hoek SN, Kirkorian AY. Epidemiology of staphylococcal scalded skin syndrome in the United States: A cross-sectional study, 2010-2014. J Am Acad Dermatol. 2018;78(2):404-406. https://doi.org/10.1016/j.jaad.2017.09.023
4. Hayward A, Knott F, Petersen I, et al. Increasing hospitalizations and general practice prescriptions for community-onset staphylococcal disease, England. Emerg Infect Dis. 2008;14(5):720-726. https://doi.org/10.3201/eid1405.070153
5. Berk DR, Bayliss SJ. MRSA, staphylococcal scalded skin syndrome, and other cutaneous bacterial emergencies. Pediatr Ann. 2010;39(10):627-633. https://doi.org/10.3928/00904481-20100922-02
6. Ladhani S, Joannou CL, Lochrie DP, Evans RW, Poston SM. Clinical, microbial, and biochemical aspects of the exfoliative toxins causing staphylococcal scalded-skin syndrome. Clin Microbiol Rev. 1999;12(2):224-242.
7. Handler MZ, Schwartz RA. Staphylococcal scalded skin syndrome: diagnosis and management in children and adults. J Eur Acad Dermatol Venereol. 2014;28(11):1418-1423. https://doi.org/10.1111/jdv.12541
8. Hodille E, Rose W, Diep BA, Goutelle S, Lina G, Dumitrescu O. The role of antibiotics in modulating virulence in Staphylococcus aureus. Clin Microbiol Rev. 2017;30(4):887-917. https://doi.org/10.1128/CMR.00120-16
9. Braunstein I, Wanat KA, Abuabara K, McGowan KL, Yan AC, Treat JR. Antibiotic sensitivity and resistance patterns in pediatric staphylococcal scalded skin syndrome. Pediatr Dermatol. 2014;31(3):305-308. https://doi.org/10.1111/pde.12195
10. Yamaguchi T, Yokota Y, Terajima J, et al. Clonal association of Staphylococcus aureus causing bullous impetigo and the emergence of new methicillin-resistant clonal groups in Kansai district in Japan. J Infect Dis. 2002;185(10):1511-1516. https://doi.org/10.1086/340212
11. Noguchi N, Nakaminami H, Nishijima S, Kurokawa I, So H, Sasatsu M. Antimicrobial agent of susceptibilities and antiseptic resistance gene distribution among methicillin-resistant Staphylococcus aureus isolates from patients with impetigo and staphylococcal scalded skin syndrome. J Clin Microbiol. 2006;44(6):2119-2125. https://doi.org/10.1128/JCM.02690-05
12. Pankey GA, Sabath LD. Clinical relevance of bacteriostatic versus bactericidal mechanisms of action in the treatment of Gram-positive bacterial infections. Clin Infect Dis. 2004;38(6):864-870. https://doi.org/10.1086/381972
13. Wald-Dickler N, Holtom P, Spellberg B. Busting the myth of “static vs cidal”: a systemic literature review. Clin Infect Dis. 2018;66(9):1470-1474. https://doi.org/10.1093/cid/cix1127
14. Ladhani S, Joannou CL. Difficulties in diagnosis and management of the staphylococcal scalded skin syndrome. Pediatr Infect Dis J. 2000;19(9):819-821. https://doi.org/10.1097/00006454-200009000-00002
15. Mongelluzzo J, Mohamad Z, Ten Have TR, Shah SS. Corticosteroids and mortality in children with bacterial meningitis. JAMA. 2008;299(17):2048-2055. https://doi.org/10.1001/jama.299.17.2048
16. Neubauer HC, Hall M, Wallace SS, et al. Variation in diagnostic test use and associated outcomes in staphylococcal scalded skin syndrome at children’s hospitals. Hosp Pediatr. 2018;8(9):530-537. https://doi.org/10.1542/hpeds.2018-0032
17. Feudtner C, Feinstein JA, Zhong W, Hall M, Dai D. Pediatric complex chronic conditions classification system version 2: updated for ICD-10 and complex medical technology dependence and transplantation. BMC Pediatr. 2014;14:199. https://doi.org/10.1186/1471-2431-14-199
18. Sauberan JS, Bradley JS. Antimicrobial agents. In: Long SS, ed. Principles and Practice of Pediatric Infectious Diseases. Elsevier; 2018:1499-1531.
19. Sedman AB, Bahl V, Bunting E, et al. Clinical redesign using all patient refined diagnosis related groups. Pediatrics. 2004;114(4):965-969. https://doi.org/10.1542/peds.2004-0650
20. Williams DJ, Cooper WO, Kaltenbach LA, et al. Comparative effectiveness of antibiotic treatment strategies for pediatric skin and soft-tissue infections. Pediatrics. 2011;128(3):e479-487. https://doi.org/10.1542/peds.2010-3681
21. Haasnoot PJ, De Vries A. Staphylococcal scalded skin syndrome in a 4-year-old child: a case report. J Med Case Rep. 2018;12(1):20. https://doi.org/ 10.1186/s13256-017-1533-7
22. Li MY, Hua Y, Wei GH, Qiu L. Staphylococcal scalded skin syndrome in neonates: an 8-year retrospective study in a single institution. Pediatr Dermatol. 2014;31(1):43-47. https://doi.org/10.1111/pde.12114
23. Markham JL, Hall M, Queen MA, et al. Variation in antibiotic selection and clinical outcomes in infants <60 days hospitalized with skin and soft tissue infections. Hosp Pediatr. 2019;9(1):30-38. https://doi.org/10.1542/hpeds.2017-0237
24. Davidson J, Polly S, Hayes PJ, Fisher KR, Talati AJ, Patel T. Recurrent staphylococcal scalded skin syndrome in an extremely low-birth-weight neonate. AJP Rep. 2017;7(2):e134-e137. https://doi.org/10.1055/s-0037-1603971
25. Ladhani S, Robbie S, Chapple DS, Joannou CL, Evans RW. Isolating Staphylococcus aureus from children with suspected Staphylococcal scalded skin syndrome is not clinically useful. Pediatr Infect Dis J. 2003;22(3):284-286.
26. Tamma PD, Robinson GL, Gerber JS, et al. Pediatric antimicrobial susceptibility trends across the United States. Infect Control Hosp Epidemiol. 2013;34(12):1244-1251. https://doi.org/10.1086/673974
27. Unbeck M, Forberg U, Ygge BM, Ehrenberg A, Petzold M, Johansson E. Peripheral venous catheter related complications are common among paediatric and neonatal patients. Acta Paediatr. 2015;104(6):566-574. https://doi.org/10.1111/apa.12963
©2021 Society of Hospital Medicine
In‐Hospital Asthma Resource Utilization
Pediatric hospitalizations for obesity‐related conditions have doubled in the last decade, mirroring the trend of higher levels of childhood obesity in the United States.[1, 2, 3] Recent studies have demonstrated worsened pediatric in‐hospital outcomes, including mortality and increased resource utilization, for children with obesity across a range of diagnoses.[4, 5, 6, 7, 8, 9, 10] Although the mechanisms driving the association between obesity and in‐hospital outcomes are not fully known, for asthma it is believed that adipocytes expressing inflammatory markers create a low level of systemic inflammation, thereby increasing the severity of allergic‐type illnesses and decreasing the response to anti‐inflammatory medications, such as steroids.[11, 12, 13, 14, 15, 16, 17, 18] The relationship of obesity and in‐hospital asthma outcomes is of particular interest because status asthmaticus is the most common reason for admission in children aged 3 to 12 years, accounting for approximately 150,000 admissions (7.4% of all hospitalizations for children and adolescents) and $835 million in hospital costs annually.[19]
Few prior studies have examined the association of obesity and asthma outcomes in the in‐hospital setting. The studies examining this association have found patients with obesity to have a longer hospital length of stay (LOS) and increased hospital costs.[8, 9, 20] Obesity has also been associated with increased respiratory treatments and supplemental oxygen requirements.[20] Associations between obesity and admission rates from the emergency department (ED) for pediatric asthma have been inconsistent.[21, 22] Most of these prior studies had several limitations in identifying patients with obesity, including using weight‐for‐age percentiles or International Classification of Diseases, Ninth Revision (ICD‐9) codes, rather than body mass index (BMI) percentile for age, the currently recommended method.[23, 24, 25] Methods other than BMI have the potential to either underestimate obesity (ie, ICD‐9 codes)[26] or to confound weight with adiposity (ie, weight‐for‐age percentiles),[27] thereby skewing the primary exposure of interest.
In the present study, we sought to examine associations between obesity and in‐hospital outcomes for pediatric status asthmaticus using the currently endorsed method for identifying obesity in children, BMI percentile for age.[23, 24, 25] The outcomes of interest included a broad range of in‐hospital measures, including resource utilization (medication and radiology use), readmission rates, billed charges, and LOS. We hypothesize that obesity, due to its proinflammatory state, would result in increased LOS, increased resource utilization, and an increased readmission rate for children admitted with status asthmaticus.
METHODS
Data Sources
Data for this retrospective cross‐sectional study were obtained from 2 sources. First, we queried the Pediatric Health Information System (PHIS) administrative database, which draws information from multiple children's hospitals to identify patients at our 2 institutions of interest who met study criteria. The PHIS database also was used to collect patient demographic data. PHIS is an administrative database operated by Children's Hospital Association (Overland Park, KS) containing clinical and billing data from 43 tertiary care, freestanding children's hospitals, including data on 41 ICD‐9 diagnoses, billed charges, and LOS. Based on the primary diagnosis, PHIS assigns each discharge to an All Patient Refined‐Diagnosis Related Group (APR‐DRG v.24) (3M Health information Systems, St. Paul, MN). APR‐DRGs allow similar diagnoses to be grouped together.[28, 29] PHIS also uses ICD‐9 codes to identify patients with a complex chronic condition (CCC).[30, 31] CCCs are those conditions that can be reasonably expected to last at least 12 months (unless death intervenes) and to involve either several different organ systems or one system severely enough to require specialty pediatric care and probably some period of hospitalization in a tertiary care center.[30, 31] PHIS data quality is ensured through a collaborative effort of the participating hospitals, the Children's Hospital Association, and Truven Healthcare.
Second, standardized chart reviews were then performed to collect clinical data not found in PHIS: BMI, LOS in hours, and medications administered, including total number of albuterol treatments administered during both the admission and the associated preceding ED visit.
Study Setting and Participants
All admissions examined in this study were at Children's Mercy Hospitals. Children's Mercy Hospitals includes 2 separate hospitals: 1 hospital is a 354‐bed academic, tertiary care freestanding children's hospital located in Kansas City, Missouri; a second, smaller, 50‐bed freestanding hospital is located in Overland Park, Kansas. Both hospitals have pediatric emergency departments. Inclusion criteria included patients aged 5 to 17 years discharged for status asthmaticus (APR‐DRG 141) at Children's Mercy Hospital from October 1, 2011 to September 30, 2012, with a recorded BMI during the admission or within 30 days of the admission. Patients between the ages of 2 and 5 years old were not included because of the incidence of viral‐induced wheezing in this age group and therefore possible miscoding of the asthma diagnosis. Exclusion criteria included a concurrent diagnosis of a CCC or bacterial pneumonia because these conditions could alter LOS, resource utilization, and readmission rates independent of the subject's status asthmaticus. In addition, to account for differences in the amount of treatment given in the pre‐inpatient setting, patients not initially treated through the hospital's ED were excluded. For patients with multiple admissions during the study period for the same diagnosis, only the index admission was examined. The institutional review board at Children's Mercy Hospital approved this study with waiver of informed consent.
Study Definitions
BMI percentile for age was used as both a continuous and categorical predictor variable. As a categorical variable it was divided into 4 categories: underweight (BMI <5%), normal weight (BMI 5%84%), overweight (BMI 85%94%), and obese (BMI 95%).[23] Race was categorized non‐Hispanic white, non‐Hispanic black, and other. Other included Asian, Pacific Islander, American Indian, and other. Ethnicity was categorized as Hispanic and non‐Hispanic. Insurance categories included private (commercial or TRICARE), public (Medicaid and Title V), and other (uninsured, self‐pay, and other). Adjusted billed charges were calculated for each hospitalization. Adjusted billed charges are the billed charges adjusted by the US Centers of Medicare and Medicaid Services' price/wage index for the study site's location.[32, 33]
To compare albuterol of different delivery methods, albuterol equivalents were calculated. Based upon prior research demonstrating equal efficacy between albuterol administered by nebulizer and metered‐dose inhaler (MDI),[34] every 2.5 mg of albuterol administered by nebulizer was treated as equivalent to 2 sprays of albuterol (90 g/spray) administered by MDI. Therefore, albuterol 2.5 mg nebulized and 2 sprays of albuterol (90 g/spray) were each defined as 1 albuterol equivalent. To compare continuous administration of nebulized albuterol with intermittent administration of albuterol, the total milligrams of continuously nebulized albuterol were examined. Per protocol at the study site, 10 mg per hour of continuous albuterol are administered for patients 5 years and younger and, for children 6 years and older, 15 mg per hour of continuous albuterol are administered. Based upon milligrams of albuterol nebulized, 5‐year‐old subjects receiving an hour of continuous albuterol would equal 4 albuterol equivalents (or 4 treatments of nebulized albuterol 2.5 mg/treatment or 4 treatments of albuterol 90 g/spray 2 sprays/treatment); for patients 6 years and older, an hour of continuous albuterol would equal 6 albuterol equivalents (or 6 treatments of nebulized albuterol 2.5 mg/treatment or 6 treatments of albuterol 90 g/spray 2 sprays/treatment). The variable total albuterol was then created to include albuterol equivalents delivered by metered dose inhaler and as both single and continuous nebulized treatments.
Main Exposure
The main exposure of interest was BMI percentile for age.
Outcome Measures
The main outcome measure was inpatient LOS measured in hours. Secondary outcome measures included the total albuterol (in the inpatient setting as well as combined inpatient and ED settings) and the administration of intravenous IV fluids and intramuscular (IM) or IV systemic steroids. Other secondary measures included readmission for status asthmaticus during the study period, adjusted billed charges, and inpatient chest radiograph utilization.
Statistical Analyses
We summarized categorical variables with frequencies and percentages, and used [2] test across BMI categories. The non‐normal distribution of continuous dependent variables (LOS, number of albuterol treatments, billed charges) were summarized with medians and interquartile ranges (IQRs). Kruskal‐Wallis test was used to examine outcomes across BMI categories. For regression models, BMI percentile for age was divided into deciles and treated as a continuous predictor. Factors used in the regression models included age, gender, race, ethnicity, and insurance. Total albuterol received in the ED was also included in the model to adjust for differences in the amount of treatment received prior to admission. Incidence rate ratios were created using Poisson regression for continuous outcomes (LOS, billed charges, and number of albuterol equivalent treatments administered), and odds ratios were created using logistic regression for dichotomous outcomes. All statistical analyses were performed using IBM SPSS Statistics version 20 (IBM, Armonk, NY), and P values <0.05 were considered statistically significant.
RESULTS
Patient Characteristics
Of 788 patients admitted for status asthmaticus during the study period, 518 (65.7%) met inclusion criteria; 42 (5.3%) did not meet inclusion criteria due to lack of a documented BMI (Table 1). Most patients were normal weight (59.7%). Approximately one‐third (36.7%) were either overweight or obese. The median age was 8 years, with patients with obesity being significantly older than underweight patients (9 vs 7.5 years, P<0.001). The majority of patients were black/African American (56.9%) and non‐Hispanic (88.6%). The percentage of patients who were obese was higher in patients of other race (29.3%) than whites (20.2%) or blacks (16.3%) (P<0.05). Patients of Hispanic ethnicity had a higher rate of obesity compared to non‐Hispanic patients (37.3% vs 17.4%, P<0.01). There were no differences in BMI categories for insurance.
| Patient Characteristics | Total | Category of Body Mass Index Percentile for Age | ||||
|---|---|---|---|---|---|---|
| Underweight | Normal | Overweight | Obese | P* | ||
| ||||||
| Total patients, n (%) | 518 | 18 (3.5) | 310 (59.8) | 88 (17.0) | 102 (19.7) | |
| Age, y, median (IQR) | 8 (611) | 7.5 (5.89) | 8 (610) | 8 (610) | 9 (712) | <0.001 |
| Gender, n (%) | ||||||
| Male | 309 | 12 (3.9) | 184 (59.5) | 46 (14.9) | 67 (21.7) | 0.27 |
| Female | 209 | 6 (2.9) | 126 (60.3) | 42 (20.1) | 35 (16.7) | |
| Race, n (%) | ||||||
| Non‐Hispanic white | 124 | 8 (6.5) | 76 (61.3) | 15 (12.1) | 25 (20.2) | 0.021 |
| Non‐Hispanic black | 295 | 7 (2.4) | 182 (61.7) | 58 (19.7) | 48 (16.3) | |
| Other | 99 | 3 (3.0) | 52 (52.5) | 15 (15.2) | 29 (29.3) | |
| Ethnicity, n (%) | ||||||
| Hispanic | 59 | 1 (1.7) | 25 (42.4) | 11 (18.6) | 22 (37.3) | 0.002 |
| Non‐Hispanic | 459 | 17 (3.7) | 285 (62.1) | 77 (16.8) | 80 (17.4) | |
| Insurance, n (%) | ||||||
| Private | 163 | 10 (6.1) | 97 (59.5) | 28 (17.2) | 28 (17.2) | 0.48 |
| Public | 313 | 7 (2.2) | 190 (60.7) | 51 (16.3) | 65 (20.8) | |
| Other | 42 | 1 (2.4) | 23 (54.8) | 9 (21.4) | 9 (21.4) | |
LOS and Resource Utilization
The median LOS for all patients was approximately 1 day (Table 2). The median number of albuterol treatments in the inpatient setting was 14 (IQR, 824). When albuterol treatments given in the ED were included, the median number of treatments increased to 38 (IQR, 2848). Approximately one‐half of patients required supplemental oxygen, one‐third received IV fluids, and one‐fifth received either IV or IM steroids (with all but 1.6% of the remaining patients receiving oral steroids). Less than 5% of the study population received magnesium sulfate, epinephrine, required intensive care unit (ICU) admission, or were readmitted for status asthmaticus within 30 days. Approximately 15% of patients received a chest radiograph. The median adjusted billed charge was approximately $7,000. There were no differences in any of these outcomes by BMI category (P>0.05).
| Total | Body Mass Index Category | ||||
|---|---|---|---|---|---|
| Underweight | Normal | Overweight | Obese | ||
| |||||
| Total Patients, n (%) | 518 | 18 (3.5) | 310 (59.8) | 88 (17.0) | 102 (19.7) |
| LOS, h, median (IQR) | 26 (1841) | 41 (19.560.5) | 26 (1841) | 26 (19.2540) | 31 (1942) |
| Inpatient albuterol equivalents, median (IQR) | 14(824) | 19 (9.528) | 14 (824) | 14 (8.522) | 16 (824) |
| Total albuterol equivalents, median (IQR) | 38 (2848) | 34 (2734) | 36 (2848) | 37 (2849.5) | 40 (3052) |
| Adjusted billed charges, $, median (IQR) | 6,999.5 (52929258) | 7,457 (56048536) | 6876 (52379390) | 7056 (54099061) | 7198 (53319306) |
| All readmits, n (%) | 44 (8.5) | 2 (11.1) | 29 (9.4) | 7 (8.0) | 6 (5.9) |
| Readmits within 30 days, n (%) | 11 (2.1) | 1 (5.6) | 7 (2.3) | 1 (1.1) | 2 (2.0) |
| ICU admissions, n (%) | 24 (4.6) | 0 (0) | 13 (4.2) | 7 (8.0) | 4 (3.9) |
| Chest radiograph, n (%) | 64 (12.4) | 5 (27.8) | 34 (11.0) | 12 (13.6) | 13 (12.7) |
| Oxygen, n (%) | 255 (49.2) | 11 (61.1) | 157 (50.6) | 42 (47.7) | 45 (44.1) |
| IV/IM steroid, n (%) | 93 (18.0) | 2 (11.1) | 53 (17.1) | 18 (20.5) | 20 (19.6) |
| Epinephrine, n (%) | 2 (0.4) | 0 (0) | 2 (0.6) | 0 (0) | 0 (0) |
| Magnesium, n (%) | 15 (2.9) | 0 (0) | 8 (2.6) | 3 (3.4) | 4 (3.9) |
| IV fluids, n (%) | 152 (29.3) | 4 (22.2) | 85 (27.4) | 31 (35.2) | 32 (31.4) |
Multivariable Results
After adjusting for age, gender, race, ethnicity, and insurance, the decile of BMI percentile for age showed a small negative association with LOS. Specifically, for each decile increase for BMI percentile for age, LOS decreased by approximately 2%. BMI percentile for age was not associated with other measures of resource utilization including total albuterol use, adjusted billed charges, readmission, ICU care, receipt of supplemental oxygen or a chest radiograph, IV fluids, or other medications (IV/IM steroids, epinephrine, or magnesium sulfate).
DISCUSSION
Our study suggests that the decile of BMI percentile for age is inversely associated with LOS but did not have a clinically meaningful effect. Secondary measures, such as total albuterol needs and adjusted billed charges, did not show an association with BMI percentile for age. There were also no associations between BMI percentile for age and other resource utilization outcomes.
Our findings differ from previous studies examining in‐hospital status asthmaticus in children who are overweight or obese. In addition, the present study was able to adjust for therapies received prior to admission. Carroll et al. demonstrated an increased LOS of approximately 3 days for overweight or obese asthmatics admitted to the ICU with status asthmaticus as well as increased duration of supplemental oxygen, continuous albuterol, and intravenous steroids.[20] It is possible that differences in methodology (ie, weight‐for‐age percentile vs BMI percentile for age, inclusion of ED treatments), different thresholds for treatment of status asthmaticus outside the ICU, or differences in patient populations studied (ie, only ICU patients vs all in‐hospital patients) explain the difference between their findings and the present study. The present study's use of BMI percentile for age follows current recommendations for classifying a patient as obese or overweight.[23, 24, 25] However, the use of classifications other than BMI percentile for age would tend to bias toward the null hypothesis, whereas in Carroll's study children who were overweight or obese had increased resource utilization. Additionally, in the time frame between this publication and the current study, many hospitals worked to standardize asthma hospitalizations by creating weaning protocols for albuterol, thereby decreasing LOS for all asthmatics, which may also affect the differences in LOS between groups of obese and nonobese patients.[35]
Woolford et al. found approximately a one‐half‐day increase in LOS and $2,000 higher mean charges for patients admitted with status asthmaticus and a secondary diagnosis of obesity.[8, 9] Study location and differing methods for defining obesity may account for the discrepancy between Woolford's findings and our study. We examined children admitted to the inpatient floor of a tertiary care children's hospital compared to Woolford et al.'s examination of pediatric patients admitted to all hospitals via the Kids' Inpatient Database (Healthcare Cost and Utilization Project, Agency for Healthcare Research and Quality). That study also relied on the coding of obesity as an ICD‐9 diagnosis, rather than examining the BMI of all admitted patients. Previous research has demonstrated that relying on a coded diagnosis of obesity is not as sensitive as measurement.[26] By relying on ICD‐9 diagnosis coding, only patients with very high BMIs may be diagnosed with obesity during the admission and therefore only associations between very high BMI and status asthmaticus will be examined.
There are several limitations to our findings. First, our study was limited to a single, tertiary care children's hospital and may not be generalizable to other hospitals. Our hospital standardizes the treatment of inpatient status asthmatics by formation of a respiratory care plan, involving interval scoring of respiratory symptoms and automatic spacing of albuterol treatments. This likely minimizes physician‐to‐physician variation. Second, we included only those patients who were initially treated within the ED associated with the admitting hospital to minimize the effects of timing for treatments prior to admittance. This excluded those patients first cared for by their primary care physician or by an outlying ED. Therefore, our sample may be biased toward a study population less connected to a medical home and therefore possibly poorer asthma control. Third, to utilize the most accurate method to define obesity, we excluded approximately 5% of eligible patients because BMI was unavailable. This may have included children with more severe asthma symptoms, as a height measurement may have been deferred due to their higher acuity. Asthma severity or chronicity would be associated with our outcomes of interest. However, we were unable to collect reliable data on severity or chronicity. Finally, to measure the amount of total albuterol needed by a patient during the ED and inpatient admissions, albuterol treatments delivered by MDI, nebulizer, or continuously were converted into total albuterol. Although based upon total milligram dosing and studies comparing routes of albuterol administration,[34] the validity of this conversion is unknown.
CONCLUSION
Although BMI percentile for age is inversely associated with LOS for in‐hospital pediatric status asthmaticus, the impact of BMI on this outcome likely is not clinically meaningful. Future investigations should examine other elements of BMI and in‐hospital status asthmaticus, such as any associations between BMI and admission rates.
Acknowledgements
The authors offer their appreciation to their research assistant, Amy Lee, for her support and dedication to this project.
Disclosures
Internal funds from Children's Mercy Hospital and Clinics supported the conduct of this work. The authors report no conflicts of interest.
- , , . Incidence of childhood obesity in the United States. N Engl J Med. 2014;370(5):403–411.
- , . Prevalence and trends in obesity and severe obesity among children in the United States, 1999–2012. JAMA Pediatr. 2014;168(6):561–566.
- , , , . Effects of childhood obesity on hospital care and costs, 1999–2005. Health Affairs. 2009;28(4):w751–w760.
- , , , , . Influence of obesity on clinical outcomes in hospitalized children: a systematic review. JAMA Pediatr. 2013;167(5):476–482.
- , . Appendicitis in the obese child. J Pediatr Surg. 2007;42(5):857–861.
- , , , , . Obesity: influence on length of hospital stay for the pediatric burn patient. J Burn Care Res. 2010;31(2):251–256.
- , , , , , . The impact of obesity on severely injured children and adolescents. J Pediatr Surg. 2006;41(1):88–91.
- , , , . Incremental hospital charges associated with obesity as a secondary diagnosis in children. Obesity (Silver Spring). 2007;15(7):1895–1901.
- , , , . Persistent gap of incremental charges for obesity as a secondary diagnosis in common pediatric hospitalizations. J Hosp Med. 2009;4(3):149–156.
- , , , . Resource utilization and expenditures for overweight and obese children. Arch Pediatr Adolesc Med. 2007;161(1):11–14.
- , , , , , . Decreased response to inhaled steroids in overweight and obese asthmatic children. J Allergy Clin Immunol. 2011;127(3):741–749.
- , , , , . Body mass and glucocorticoid response in asthma. Am J Respir Crit Care Med. 2008;178(7):682–687.
- , , , ; National Heart, Lung, and Blood Institute's Asthma Clinical Research Network. Body mass index and phenotype in subjects with mild‐to‐moderate persistent asthma. J Allergy Clin Immunol. 2009;123(6):1328–1334.e1.
- , . Obesity and asthma disease phenotypes. Curr Opin Allergy Clin Immunol. 2012;12(1):76–81.
- , . Obesity and the lung: 4. Obesity and asthma. Thorax. 2008;63(11):1018–1023.
- , , , et al. Body mass index and response to asthma therapy: fluticasone propionate/salmeterol versus montelukast. J Asthma. 2010;47(1):76–82.
- , , , et al. Effect of obesity on clinical presentation and response to treatment in asthma. J Asthma. 2006;43(7):553–558.
- , , , . Asthma and obesity in three‐year‐old urban children: role of sex and home environment. J Pediatr. 2011;159(1):14–20.
- , , , . Care of Children and Adolescents in U.S. Hospitals. Rockville, MD: Agency for Healthcare Research and Quality; 2003. Available at: http://archive.ahrq.gov/data/hcup/factbk4/factbk4.pdf. Accessed February 12, 2014.
- , , , . Childhood obesity increases duration of therapy during severe asthma exacerbations. Pediatr Crit Care Med. 2006;7(6):527–531.
- , , , , . Childhood overweight increases hospital admission rates for asthma. Pediatr. 2007;120(4):734–740.
- , , , . Body mass index and acute asthma severity among children presenting to the emergency department. Pediatr Allergy Immunol. 2009;21(3):480–488.
- Centers for Disease Control and Prevention. Basics about childhood obesity. Available at: http://www.cdc.gov/obesity/childhood/basics.html. Accessed February 12, 2014.
- . Screening and interventions for childhood overweight: a summary of evidence for the US Preventive Services Task Force. Pediatrics. 2005;116(1):e125–e144.
- ; Expert Committee. Expert committee recommendations regarding the prevention, assessment, and treatment of child and adolescent overweight and obesity: summary report. Pediatrics. 2007;120(suppl 4):S164–S192.
- , , , . Comparison of ICD code‐based diagnosis of obesity with measured obesity in children and the implications for health care cost estimates. BMC Med Res Methodol. 2011;11(1):173.
- , ; American Academy of Pediatrics Committee on Nutrition. Prevention of pediatric overweight and obesity. Pediatrics. 2003;112(2):424–430.
- . Development of the 3M all patient‐refined diagnosis‐related groups (APR DRGs). Available at: http//www.ahrq.gov/legacy/qual/mortality/Hughes3.htm. Accessed March 1, 2014.
- . 3M Health Information Systems (HIS) APR‐DRG classification software: overview. Available at: http://www.ahrq.gov/legacy/qual/mortality/Hughessumm.htm. Accessed March 1, 2014.
- , , , , . Shifting place of death among children with complex chronic conditions in the United States, 1989–2003. JAMA. 2007;297(24):2725–2732.
- , , . Pediatric deaths attributable to complex chronic conditions: a population‐based study of Washington State, 1980–1997. Pediatrics. 2000;106(1 pt 2):205–209.
- , , , et al. Comparative effectiveness of pleural drainage procedures for the treatment of complicated pneumonia in childhood. J Hosp Med. 2011;6(5):256–263.
- , , , , , . Adjunct corticosteroids in children hospitalized with community‐acquired pneumonia. Pediatrics. 2011;127(2):e255–e263.
- , , . Holding chambers (spacers) versus nebulisers for beta‐agonist treatment of acute asthma. Cochrane Database Syst Rev. 2013;9:CD000052.
- , , , . Effectiveness of a clinical pathway for inpatient asthma management. Pediatrics. 2000;106(5):1006–1012.
Pediatric hospitalizations for obesity‐related conditions have doubled in the last decade, mirroring the trend of higher levels of childhood obesity in the United States.[1, 2, 3] Recent studies have demonstrated worsened pediatric in‐hospital outcomes, including mortality and increased resource utilization, for children with obesity across a range of diagnoses.[4, 5, 6, 7, 8, 9, 10] Although the mechanisms driving the association between obesity and in‐hospital outcomes are not fully known, for asthma it is believed that adipocytes expressing inflammatory markers create a low level of systemic inflammation, thereby increasing the severity of allergic‐type illnesses and decreasing the response to anti‐inflammatory medications, such as steroids.[11, 12, 13, 14, 15, 16, 17, 18] The relationship of obesity and in‐hospital asthma outcomes is of particular interest because status asthmaticus is the most common reason for admission in children aged 3 to 12 years, accounting for approximately 150,000 admissions (7.4% of all hospitalizations for children and adolescents) and $835 million in hospital costs annually.[19]
Few prior studies have examined the association of obesity and asthma outcomes in the in‐hospital setting. The studies examining this association have found patients with obesity to have a longer hospital length of stay (LOS) and increased hospital costs.[8, 9, 20] Obesity has also been associated with increased respiratory treatments and supplemental oxygen requirements.[20] Associations between obesity and admission rates from the emergency department (ED) for pediatric asthma have been inconsistent.[21, 22] Most of these prior studies had several limitations in identifying patients with obesity, including using weight‐for‐age percentiles or International Classification of Diseases, Ninth Revision (ICD‐9) codes, rather than body mass index (BMI) percentile for age, the currently recommended method.[23, 24, 25] Methods other than BMI have the potential to either underestimate obesity (ie, ICD‐9 codes)[26] or to confound weight with adiposity (ie, weight‐for‐age percentiles),[27] thereby skewing the primary exposure of interest.
In the present study, we sought to examine associations between obesity and in‐hospital outcomes for pediatric status asthmaticus using the currently endorsed method for identifying obesity in children, BMI percentile for age.[23, 24, 25] The outcomes of interest included a broad range of in‐hospital measures, including resource utilization (medication and radiology use), readmission rates, billed charges, and LOS. We hypothesize that obesity, due to its proinflammatory state, would result in increased LOS, increased resource utilization, and an increased readmission rate for children admitted with status asthmaticus.
METHODS
Data Sources
Data for this retrospective cross‐sectional study were obtained from 2 sources. First, we queried the Pediatric Health Information System (PHIS) administrative database, which draws information from multiple children's hospitals to identify patients at our 2 institutions of interest who met study criteria. The PHIS database also was used to collect patient demographic data. PHIS is an administrative database operated by Children's Hospital Association (Overland Park, KS) containing clinical and billing data from 43 tertiary care, freestanding children's hospitals, including data on 41 ICD‐9 diagnoses, billed charges, and LOS. Based on the primary diagnosis, PHIS assigns each discharge to an All Patient Refined‐Diagnosis Related Group (APR‐DRG v.24) (3M Health information Systems, St. Paul, MN). APR‐DRGs allow similar diagnoses to be grouped together.[28, 29] PHIS also uses ICD‐9 codes to identify patients with a complex chronic condition (CCC).[30, 31] CCCs are those conditions that can be reasonably expected to last at least 12 months (unless death intervenes) and to involve either several different organ systems or one system severely enough to require specialty pediatric care and probably some period of hospitalization in a tertiary care center.[30, 31] PHIS data quality is ensured through a collaborative effort of the participating hospitals, the Children's Hospital Association, and Truven Healthcare.
Second, standardized chart reviews were then performed to collect clinical data not found in PHIS: BMI, LOS in hours, and medications administered, including total number of albuterol treatments administered during both the admission and the associated preceding ED visit.
Study Setting and Participants
All admissions examined in this study were at Children's Mercy Hospitals. Children's Mercy Hospitals includes 2 separate hospitals: 1 hospital is a 354‐bed academic, tertiary care freestanding children's hospital located in Kansas City, Missouri; a second, smaller, 50‐bed freestanding hospital is located in Overland Park, Kansas. Both hospitals have pediatric emergency departments. Inclusion criteria included patients aged 5 to 17 years discharged for status asthmaticus (APR‐DRG 141) at Children's Mercy Hospital from October 1, 2011 to September 30, 2012, with a recorded BMI during the admission or within 30 days of the admission. Patients between the ages of 2 and 5 years old were not included because of the incidence of viral‐induced wheezing in this age group and therefore possible miscoding of the asthma diagnosis. Exclusion criteria included a concurrent diagnosis of a CCC or bacterial pneumonia because these conditions could alter LOS, resource utilization, and readmission rates independent of the subject's status asthmaticus. In addition, to account for differences in the amount of treatment given in the pre‐inpatient setting, patients not initially treated through the hospital's ED were excluded. For patients with multiple admissions during the study period for the same diagnosis, only the index admission was examined. The institutional review board at Children's Mercy Hospital approved this study with waiver of informed consent.
Study Definitions
BMI percentile for age was used as both a continuous and categorical predictor variable. As a categorical variable it was divided into 4 categories: underweight (BMI <5%), normal weight (BMI 5%84%), overweight (BMI 85%94%), and obese (BMI 95%).[23] Race was categorized non‐Hispanic white, non‐Hispanic black, and other. Other included Asian, Pacific Islander, American Indian, and other. Ethnicity was categorized as Hispanic and non‐Hispanic. Insurance categories included private (commercial or TRICARE), public (Medicaid and Title V), and other (uninsured, self‐pay, and other). Adjusted billed charges were calculated for each hospitalization. Adjusted billed charges are the billed charges adjusted by the US Centers of Medicare and Medicaid Services' price/wage index for the study site's location.[32, 33]
To compare albuterol of different delivery methods, albuterol equivalents were calculated. Based upon prior research demonstrating equal efficacy between albuterol administered by nebulizer and metered‐dose inhaler (MDI),[34] every 2.5 mg of albuterol administered by nebulizer was treated as equivalent to 2 sprays of albuterol (90 g/spray) administered by MDI. Therefore, albuterol 2.5 mg nebulized and 2 sprays of albuterol (90 g/spray) were each defined as 1 albuterol equivalent. To compare continuous administration of nebulized albuterol with intermittent administration of albuterol, the total milligrams of continuously nebulized albuterol were examined. Per protocol at the study site, 10 mg per hour of continuous albuterol are administered for patients 5 years and younger and, for children 6 years and older, 15 mg per hour of continuous albuterol are administered. Based upon milligrams of albuterol nebulized, 5‐year‐old subjects receiving an hour of continuous albuterol would equal 4 albuterol equivalents (or 4 treatments of nebulized albuterol 2.5 mg/treatment or 4 treatments of albuterol 90 g/spray 2 sprays/treatment); for patients 6 years and older, an hour of continuous albuterol would equal 6 albuterol equivalents (or 6 treatments of nebulized albuterol 2.5 mg/treatment or 6 treatments of albuterol 90 g/spray 2 sprays/treatment). The variable total albuterol was then created to include albuterol equivalents delivered by metered dose inhaler and as both single and continuous nebulized treatments.
Main Exposure
The main exposure of interest was BMI percentile for age.
Outcome Measures
The main outcome measure was inpatient LOS measured in hours. Secondary outcome measures included the total albuterol (in the inpatient setting as well as combined inpatient and ED settings) and the administration of intravenous IV fluids and intramuscular (IM) or IV systemic steroids. Other secondary measures included readmission for status asthmaticus during the study period, adjusted billed charges, and inpatient chest radiograph utilization.
Statistical Analyses
We summarized categorical variables with frequencies and percentages, and used [2] test across BMI categories. The non‐normal distribution of continuous dependent variables (LOS, number of albuterol treatments, billed charges) were summarized with medians and interquartile ranges (IQRs). Kruskal‐Wallis test was used to examine outcomes across BMI categories. For regression models, BMI percentile for age was divided into deciles and treated as a continuous predictor. Factors used in the regression models included age, gender, race, ethnicity, and insurance. Total albuterol received in the ED was also included in the model to adjust for differences in the amount of treatment received prior to admission. Incidence rate ratios were created using Poisson regression for continuous outcomes (LOS, billed charges, and number of albuterol equivalent treatments administered), and odds ratios were created using logistic regression for dichotomous outcomes. All statistical analyses were performed using IBM SPSS Statistics version 20 (IBM, Armonk, NY), and P values <0.05 were considered statistically significant.
RESULTS
Patient Characteristics
Of 788 patients admitted for status asthmaticus during the study period, 518 (65.7%) met inclusion criteria; 42 (5.3%) did not meet inclusion criteria due to lack of a documented BMI (Table 1). Most patients were normal weight (59.7%). Approximately one‐third (36.7%) were either overweight or obese. The median age was 8 years, with patients with obesity being significantly older than underweight patients (9 vs 7.5 years, P<0.001). The majority of patients were black/African American (56.9%) and non‐Hispanic (88.6%). The percentage of patients who were obese was higher in patients of other race (29.3%) than whites (20.2%) or blacks (16.3%) (P<0.05). Patients of Hispanic ethnicity had a higher rate of obesity compared to non‐Hispanic patients (37.3% vs 17.4%, P<0.01). There were no differences in BMI categories for insurance.
| Patient Characteristics | Total | Category of Body Mass Index Percentile for Age | ||||
|---|---|---|---|---|---|---|
| Underweight | Normal | Overweight | Obese | P* | ||
| ||||||
| Total patients, n (%) | 518 | 18 (3.5) | 310 (59.8) | 88 (17.0) | 102 (19.7) | |
| Age, y, median (IQR) | 8 (611) | 7.5 (5.89) | 8 (610) | 8 (610) | 9 (712) | <0.001 |
| Gender, n (%) | ||||||
| Male | 309 | 12 (3.9) | 184 (59.5) | 46 (14.9) | 67 (21.7) | 0.27 |
| Female | 209 | 6 (2.9) | 126 (60.3) | 42 (20.1) | 35 (16.7) | |
| Race, n (%) | ||||||
| Non‐Hispanic white | 124 | 8 (6.5) | 76 (61.3) | 15 (12.1) | 25 (20.2) | 0.021 |
| Non‐Hispanic black | 295 | 7 (2.4) | 182 (61.7) | 58 (19.7) | 48 (16.3) | |
| Other | 99 | 3 (3.0) | 52 (52.5) | 15 (15.2) | 29 (29.3) | |
| Ethnicity, n (%) | ||||||
| Hispanic | 59 | 1 (1.7) | 25 (42.4) | 11 (18.6) | 22 (37.3) | 0.002 |
| Non‐Hispanic | 459 | 17 (3.7) | 285 (62.1) | 77 (16.8) | 80 (17.4) | |
| Insurance, n (%) | ||||||
| Private | 163 | 10 (6.1) | 97 (59.5) | 28 (17.2) | 28 (17.2) | 0.48 |
| Public | 313 | 7 (2.2) | 190 (60.7) | 51 (16.3) | 65 (20.8) | |
| Other | 42 | 1 (2.4) | 23 (54.8) | 9 (21.4) | 9 (21.4) | |
LOS and Resource Utilization
The median LOS for all patients was approximately 1 day (Table 2). The median number of albuterol treatments in the inpatient setting was 14 (IQR, 824). When albuterol treatments given in the ED were included, the median number of treatments increased to 38 (IQR, 2848). Approximately one‐half of patients required supplemental oxygen, one‐third received IV fluids, and one‐fifth received either IV or IM steroids (with all but 1.6% of the remaining patients receiving oral steroids). Less than 5% of the study population received magnesium sulfate, epinephrine, required intensive care unit (ICU) admission, or were readmitted for status asthmaticus within 30 days. Approximately 15% of patients received a chest radiograph. The median adjusted billed charge was approximately $7,000. There were no differences in any of these outcomes by BMI category (P>0.05).
| Total | Body Mass Index Category | ||||
|---|---|---|---|---|---|
| Underweight | Normal | Overweight | Obese | ||
| |||||
| Total Patients, n (%) | 518 | 18 (3.5) | 310 (59.8) | 88 (17.0) | 102 (19.7) |
| LOS, h, median (IQR) | 26 (1841) | 41 (19.560.5) | 26 (1841) | 26 (19.2540) | 31 (1942) |
| Inpatient albuterol equivalents, median (IQR) | 14(824) | 19 (9.528) | 14 (824) | 14 (8.522) | 16 (824) |
| Total albuterol equivalents, median (IQR) | 38 (2848) | 34 (2734) | 36 (2848) | 37 (2849.5) | 40 (3052) |
| Adjusted billed charges, $, median (IQR) | 6,999.5 (52929258) | 7,457 (56048536) | 6876 (52379390) | 7056 (54099061) | 7198 (53319306) |
| All readmits, n (%) | 44 (8.5) | 2 (11.1) | 29 (9.4) | 7 (8.0) | 6 (5.9) |
| Readmits within 30 days, n (%) | 11 (2.1) | 1 (5.6) | 7 (2.3) | 1 (1.1) | 2 (2.0) |
| ICU admissions, n (%) | 24 (4.6) | 0 (0) | 13 (4.2) | 7 (8.0) | 4 (3.9) |
| Chest radiograph, n (%) | 64 (12.4) | 5 (27.8) | 34 (11.0) | 12 (13.6) | 13 (12.7) |
| Oxygen, n (%) | 255 (49.2) | 11 (61.1) | 157 (50.6) | 42 (47.7) | 45 (44.1) |
| IV/IM steroid, n (%) | 93 (18.0) | 2 (11.1) | 53 (17.1) | 18 (20.5) | 20 (19.6) |
| Epinephrine, n (%) | 2 (0.4) | 0 (0) | 2 (0.6) | 0 (0) | 0 (0) |
| Magnesium, n (%) | 15 (2.9) | 0 (0) | 8 (2.6) | 3 (3.4) | 4 (3.9) |
| IV fluids, n (%) | 152 (29.3) | 4 (22.2) | 85 (27.4) | 31 (35.2) | 32 (31.4) |
Multivariable Results
After adjusting for age, gender, race, ethnicity, and insurance, the decile of BMI percentile for age showed a small negative association with LOS. Specifically, for each decile increase for BMI percentile for age, LOS decreased by approximately 2%. BMI percentile for age was not associated with other measures of resource utilization including total albuterol use, adjusted billed charges, readmission, ICU care, receipt of supplemental oxygen or a chest radiograph, IV fluids, or other medications (IV/IM steroids, epinephrine, or magnesium sulfate).
DISCUSSION
Our study suggests that the decile of BMI percentile for age is inversely associated with LOS but did not have a clinically meaningful effect. Secondary measures, such as total albuterol needs and adjusted billed charges, did not show an association with BMI percentile for age. There were also no associations between BMI percentile for age and other resource utilization outcomes.
Our findings differ from previous studies examining in‐hospital status asthmaticus in children who are overweight or obese. In addition, the present study was able to adjust for therapies received prior to admission. Carroll et al. demonstrated an increased LOS of approximately 3 days for overweight or obese asthmatics admitted to the ICU with status asthmaticus as well as increased duration of supplemental oxygen, continuous albuterol, and intravenous steroids.[20] It is possible that differences in methodology (ie, weight‐for‐age percentile vs BMI percentile for age, inclusion of ED treatments), different thresholds for treatment of status asthmaticus outside the ICU, or differences in patient populations studied (ie, only ICU patients vs all in‐hospital patients) explain the difference between their findings and the present study. The present study's use of BMI percentile for age follows current recommendations for classifying a patient as obese or overweight.[23, 24, 25] However, the use of classifications other than BMI percentile for age would tend to bias toward the null hypothesis, whereas in Carroll's study children who were overweight or obese had increased resource utilization. Additionally, in the time frame between this publication and the current study, many hospitals worked to standardize asthma hospitalizations by creating weaning protocols for albuterol, thereby decreasing LOS for all asthmatics, which may also affect the differences in LOS between groups of obese and nonobese patients.[35]
Woolford et al. found approximately a one‐half‐day increase in LOS and $2,000 higher mean charges for patients admitted with status asthmaticus and a secondary diagnosis of obesity.[8, 9] Study location and differing methods for defining obesity may account for the discrepancy between Woolford's findings and our study. We examined children admitted to the inpatient floor of a tertiary care children's hospital compared to Woolford et al.'s examination of pediatric patients admitted to all hospitals via the Kids' Inpatient Database (Healthcare Cost and Utilization Project, Agency for Healthcare Research and Quality). That study also relied on the coding of obesity as an ICD‐9 diagnosis, rather than examining the BMI of all admitted patients. Previous research has demonstrated that relying on a coded diagnosis of obesity is not as sensitive as measurement.[26] By relying on ICD‐9 diagnosis coding, only patients with very high BMIs may be diagnosed with obesity during the admission and therefore only associations between very high BMI and status asthmaticus will be examined.
There are several limitations to our findings. First, our study was limited to a single, tertiary care children's hospital and may not be generalizable to other hospitals. Our hospital standardizes the treatment of inpatient status asthmatics by formation of a respiratory care plan, involving interval scoring of respiratory symptoms and automatic spacing of albuterol treatments. This likely minimizes physician‐to‐physician variation. Second, we included only those patients who were initially treated within the ED associated with the admitting hospital to minimize the effects of timing for treatments prior to admittance. This excluded those patients first cared for by their primary care physician or by an outlying ED. Therefore, our sample may be biased toward a study population less connected to a medical home and therefore possibly poorer asthma control. Third, to utilize the most accurate method to define obesity, we excluded approximately 5% of eligible patients because BMI was unavailable. This may have included children with more severe asthma symptoms, as a height measurement may have been deferred due to their higher acuity. Asthma severity or chronicity would be associated with our outcomes of interest. However, we were unable to collect reliable data on severity or chronicity. Finally, to measure the amount of total albuterol needed by a patient during the ED and inpatient admissions, albuterol treatments delivered by MDI, nebulizer, or continuously were converted into total albuterol. Although based upon total milligram dosing and studies comparing routes of albuterol administration,[34] the validity of this conversion is unknown.
CONCLUSION
Although BMI percentile for age is inversely associated with LOS for in‐hospital pediatric status asthmaticus, the impact of BMI on this outcome likely is not clinically meaningful. Future investigations should examine other elements of BMI and in‐hospital status asthmaticus, such as any associations between BMI and admission rates.
Acknowledgements
The authors offer their appreciation to their research assistant, Amy Lee, for her support and dedication to this project.
Disclosures
Internal funds from Children's Mercy Hospital and Clinics supported the conduct of this work. The authors report no conflicts of interest.
- , , . Incidence of childhood obesity in the United States. N Engl J Med. 2014;370(5):403–411.
- , . Prevalence and trends in obesity and severe obesity among children in the United States, 1999–2012. JAMA Pediatr. 2014;168(6):561–566.
- , , , . Effects of childhood obesity on hospital care and costs, 1999–2005. Health Affairs. 2009;28(4):w751–w760.
- , , , , . Influence of obesity on clinical outcomes in hospitalized children: a systematic review. JAMA Pediatr. 2013;167(5):476–482.
- , . Appendicitis in the obese child. J Pediatr Surg. 2007;42(5):857–861.
- , , , , . Obesity: influence on length of hospital stay for the pediatric burn patient. J Burn Care Res. 2010;31(2):251–256.
- , , , , , . The impact of obesity on severely injured children and adolescents. J Pediatr Surg. 2006;41(1):88–91.
- , , , . Incremental hospital charges associated with obesity as a secondary diagnosis in children. Obesity (Silver Spring). 2007;15(7):1895–1901.
- , , , . Persistent gap of incremental charges for obesity as a secondary diagnosis in common pediatric hospitalizations. J Hosp Med. 2009;4(3):149–156.
- , , , . Resource utilization and expenditures for overweight and obese children. Arch Pediatr Adolesc Med. 2007;161(1):11–14.
- , , , , , . Decreased response to inhaled steroids in overweight and obese asthmatic children. J Allergy Clin Immunol. 2011;127(3):741–749.
- , , , , . Body mass and glucocorticoid response in asthma. Am J Respir Crit Care Med. 2008;178(7):682–687.
- , , , ; National Heart, Lung, and Blood Institute's Asthma Clinical Research Network. Body mass index and phenotype in subjects with mild‐to‐moderate persistent asthma. J Allergy Clin Immunol. 2009;123(6):1328–1334.e1.
- , . Obesity and asthma disease phenotypes. Curr Opin Allergy Clin Immunol. 2012;12(1):76–81.
- , . Obesity and the lung: 4. Obesity and asthma. Thorax. 2008;63(11):1018–1023.
- , , , et al. Body mass index and response to asthma therapy: fluticasone propionate/salmeterol versus montelukast. J Asthma. 2010;47(1):76–82.
- , , , et al. Effect of obesity on clinical presentation and response to treatment in asthma. J Asthma. 2006;43(7):553–558.
- , , , . Asthma and obesity in three‐year‐old urban children: role of sex and home environment. J Pediatr. 2011;159(1):14–20.
- , , , . Care of Children and Adolescents in U.S. Hospitals. Rockville, MD: Agency for Healthcare Research and Quality; 2003. Available at: http://archive.ahrq.gov/data/hcup/factbk4/factbk4.pdf. Accessed February 12, 2014.
- , , , . Childhood obesity increases duration of therapy during severe asthma exacerbations. Pediatr Crit Care Med. 2006;7(6):527–531.
- , , , , . Childhood overweight increases hospital admission rates for asthma. Pediatr. 2007;120(4):734–740.
- , , , . Body mass index and acute asthma severity among children presenting to the emergency department. Pediatr Allergy Immunol. 2009;21(3):480–488.
- Centers for Disease Control and Prevention. Basics about childhood obesity. Available at: http://www.cdc.gov/obesity/childhood/basics.html. Accessed February 12, 2014.
- . Screening and interventions for childhood overweight: a summary of evidence for the US Preventive Services Task Force. Pediatrics. 2005;116(1):e125–e144.
- ; Expert Committee. Expert committee recommendations regarding the prevention, assessment, and treatment of child and adolescent overweight and obesity: summary report. Pediatrics. 2007;120(suppl 4):S164–S192.
- , , , . Comparison of ICD code‐based diagnosis of obesity with measured obesity in children and the implications for health care cost estimates. BMC Med Res Methodol. 2011;11(1):173.
- , ; American Academy of Pediatrics Committee on Nutrition. Prevention of pediatric overweight and obesity. Pediatrics. 2003;112(2):424–430.
- . Development of the 3M all patient‐refined diagnosis‐related groups (APR DRGs). Available at: http//www.ahrq.gov/legacy/qual/mortality/Hughes3.htm. Accessed March 1, 2014.
- . 3M Health Information Systems (HIS) APR‐DRG classification software: overview. Available at: http://www.ahrq.gov/legacy/qual/mortality/Hughessumm.htm. Accessed March 1, 2014.
- , , , , . Shifting place of death among children with complex chronic conditions in the United States, 1989–2003. JAMA. 2007;297(24):2725–2732.
- , , . Pediatric deaths attributable to complex chronic conditions: a population‐based study of Washington State, 1980–1997. Pediatrics. 2000;106(1 pt 2):205–209.
- , , , et al. Comparative effectiveness of pleural drainage procedures for the treatment of complicated pneumonia in childhood. J Hosp Med. 2011;6(5):256–263.
- , , , , , . Adjunct corticosteroids in children hospitalized with community‐acquired pneumonia. Pediatrics. 2011;127(2):e255–e263.
- , , . Holding chambers (spacers) versus nebulisers for beta‐agonist treatment of acute asthma. Cochrane Database Syst Rev. 2013;9:CD000052.
- , , , . Effectiveness of a clinical pathway for inpatient asthma management. Pediatrics. 2000;106(5):1006–1012.
© 2014 Society of Hospital Medicine
Radiographs Predict Pneumonia Severity
The 2011 Pediatric Infectious Diseases Society and Infectious Diseases Society of America (PIDS/IDSA) guidelines for management of pediatric community‐acquired pneumonia (CAP) recommend that admission chest radiographs be obtained in all children hospitalized with CAP to document the presence and extent of infiltrates and to identify complications.[1] Findings from chest radiographs may also provide clues to etiology and assist with predicting disease outcomes. In adults with CAP, clinical prediction tools use radiographic findings to inform triage decisions, guide management strategies, and predict outcomes.[2, 3, 4, 5, 6, 7] Whether or not radiographic findings could have similar utility among children with CAP is unknown.
Several retrospective studies have examined the ability of chest radiographs to predict pediatric pneumonia disease severity.[8, 9, 10, 11, 12] However, these studies used several different measures of severe pneumonia and/or were limited to young children <5 years of age, leading to inconsistent findings. These studies also rarely considered very severe disease (eg, need for invasive mechanical ventilation) or longitudinal outcome measures such as hospital length of stay. Finally, all of these prior studies were conducted outside of the United States, and most were single‐center investigations, potentially limiting generalizability. We sought to examine associations between admission chest radiographic findings and subsequent hospital care processes and clinical outcomes, including length of stay and resource utilization measures, among children hospitalized with CAP at 4 children's hospitals in the United States.
METHODS
Design and Setting
This study was nested within a multicenter retrospective cohort designed to validate International Classification of Diseases, 9th Revision, Clinical Modification (ICD9‐CM) diagnostic codes for pediatric CAP hospitalizations.[13] The Pediatric Health Information System database (Children's Hospital Association, Overland Park, KS) was used to identify children from 4 freestanding pediatric hospitals (Monroe Carell, Jr. Children's Hospital at Vanderbilt, Nashville, Tennessee; Children's Mercy Hospitals & Clinics, Kansas City, Missouri; Seattle Children's Hospital, Seattle, Washington; and Cincinnati Children's Hospital Medical Center, Cincinnati, Ohio). The institutional review boards at each participating institution approved the study. The validation study included a 25% random sampling of children 60 days to 18 years of age (n=998) who were hospitalized between January 1, 2010 and December 31, 2010 with at least 1 ICD9‐CM discharge code indicating pneumonia. The diagnosis of CAP was confirmed by medical record review.
Study Population
This study was limited to children from the validation study who met criteria for clinical and radiographic CAP, defined as: (1) abnormal temperature or white blood cell count, (2) signs and symptoms of acute respiratory illness (eg, cough, tachypnea), and (3) chest radiograph indicating pneumonia within 48 hours of admission. Children with atelectasis as the only abnormal radiographic finding and those with complex chronic conditions (eg, cystic fibrosis, malignancy) were excluded using a previously described algorithm.[14]
Outcomes
Several measures of disease severity were assessed. Dichotomous outcomes included supplemental oxygen use, need for intensive care unit (ICU) admission, and need for invasive mechanical ventilation. Continuous outcomes included hospital length of stay, and for those requiring supplemental oxygen, duration of oxygen supplementation, measured in hours.
Exposure
To categorize infiltrate patterns and the presence and size of pleural effusions, we reviewed the final report from admission chest radiographs to obtain the final clinical interpretation performed by the attending pediatric radiologist. Infiltrate patterns were classified as single lobar (reference), unilateral multilobar, bilateral multilobar, or interstitial. Children with both lobar and interstitial infiltrates, and those with mention of atelectasis, were classified according to the type of lobar infiltrate. Those with atelectasis only were excluded. Pleural effusions were classified as absent, small, or moderate/large.
Analysis
Descriptive statistics were summarized using frequencies and percentages for categorical variables and median and interquartile range (IQR) values for continuous variables. Our primary exposures were infiltrate pattern and presence and size of pleural effusion on admission chest radiograph. Associations between radiographic findings and disease outcomes were analyzed using logistic and linear regression for dichotomous and continuous variables, respectively. Continuous outcomes were log‐transformed and normality assumptions verified prior to model development.
Due to the large number of covariates relative to outcome events, we used propensity score methods to adjust for potential confounding. The propensity score estimates the likelihood of a given exposure (ie, infiltrate pattern) conditional on a set of covariates. In this way, the propensity score summarizes potential confounding effects from a large number of covariates into a single variable. Including the propensity score as a covariate in multivariable regression improves model efficiency and helps protect against overfitting.[15] Covariates included in the estimation of the propensity score included age, sex, race/ethnicity, payer, hospital, asthma history, hospital transfer, recent hospitalization (within 30 days), recent emergency department or clinic visit (within 2 weeks), recent antibiotics for acute illness (within 5 days), illness duration prior to admission, tachypnea and/or increased work of breathing (retractions, nasal flaring, or grunting) at presentation, receipt of albuterol and/or corticosteroids during the first 2 calendar days of hospitalization, and concurrent diagnosis of bronchiolitis. All analyses included the estimated propensity score, infiltrate pattern, and pleural effusion (absent, small, or moderate/large).
RESULTS
Study Population
The median age of the 406 children with clinical and radiographic CAP was 3 years (IQR, 16 years) (Table 1). Single lobar infiltrate was the most common radiographic pattern (61%). Children with interstitial infiltrates (10%) were younger than those with lobar infiltrates of any type (median age 1 vs 3 years, P=0.02). A concomitant diagnosis of bronchiolitis was assigned to 34% of children with interstitial infiltrates but only 17% of those with lobar infiltrate patterns (range, 11%20%, P=0.03). Pleural effusion was present in 21% of children and was more common among those with lobar infiltrates, particularly multilobar disease. Only 1 child with interstitial infiltrate had a pleural effusion. Overall, 63% of children required supplemental oxygen, 8% required ICU admission, and 3% required invasive mechanical ventilation. Median length of stay was 51.5 hours (IQR, 3991) and median oxygen duration was 31.5 hours [IQR, 1365]. There were no deaths.
| Characteristic | Infiltrate Patterna | P Valueb | |||
|---|---|---|---|---|---|
| Single Lobar | Multilobar, Unilateral | Multilobar, Bilateral | Interstitial | ||
| |||||
| No. | 247 (60.8) | 54 (13.3) | 64 (15.8) | 41 (10.1) | |
| Median age, y | 3 [16] | 3 [17] | 3 [15] | 1 [03] | 0.02 |
| Male sex | 124 (50.2) | 32 (59.3) | 41 (64.1) | 30 (73.2) | 0.02 |
| Race | |||||
| Non‐Hispanic white | 133 (53.8) | 36 (66.7) | 37 (57.8) | 17 (41.5) | 0.69 |
| Non‐Hispanic black | 40 (16.2) | 6 (11.1) | 9 (14.1) | 8 (19.5) | |
| Hispanic | 25 (10.1) | 4 (7.4) | 5 (7.8) | 7 (17.1) | |
| Other | 49 (19.9) | 8 (14.8) | 13 (20.4) | 9 (22) | |
| Insurance | |||||
| Public | 130 (52.6) | 26 (48.1) | 33 (51.6) | 25 (61) | 0.90 |
| Private | 116 (47) | 28 (51.9) | 31 (48.4) | 16 (39) | |
| Concurrent diagnosis | |||||
| Asthma | 80 (32.4) | 16 (29.6) | 17 (26.6) | 12 (29.3) | 0.82 |
| Bronchiolitis | 43 (17.4) | 6 (11.1) | 13 (20.3) | 14 (34.1) | 0.03 |
| Effusion | |||||
| None | 201 (81.4) | 31 (57.4) | 48 (75) | 40 (97.6) | <.01 |
| Small | 34 (13.8) | 20 (37) | 11 (17.2) | 0 | |
| Moderate/large | 12 (4.9) | 3 (5.6) | 5 (7.8) | 1 (2.4) | |
Outcomes According to Radiographic Infiltrate Pattern
Compared to children with single lobar infiltrates, the odds of ICU admission was significantly increased for those with either unilateral or bilateral multilobar infiltrates (unilateral, adjusted odds ratio [aOR]: 8.0, 95% confidence interval [CI]: 2.922.2; bilateral, aOR: 6.6, 95% CI: 2.14.5) (Figure 1, Table 2). Patients with bilateral multilobar infiltrates also had higher odds for supplemental oxygen use (aOR: 2.7, 95% CI: 1.25.8) and need for invasive mechanical ventilation (aOR: 3.0, 95% CI: 1.27.9). There were no differences in duration of oxygen supplementation or hospital length of stay for children with single versus multilobar infiltrates.

| Outcome | Infiltrate Patterna | P Valueb | |||
|---|---|---|---|---|---|
| Single Lobar, n=247 | Multilobar, Unilateral, n=54 | Multilobar, Bilateral, n=64 | Interstitial, n=41 | ||
| |||||
| Supplemental O2 requirement | 143 (57.9) | 34 (63) | 46 (71.9) | 31 (75.6) | 0.05 |
| ICU admission | 10 (4) | 9 (16.7) | 9 (14.1) | 4 (9.8) | <0.01 |
| Mechanical ventilation | 5 (2) | 4 (7.4) | 4 (6.3) | 1 (2.4) | 0.13 |
| Hospital length of stay, h | 47 [3779] | 63 [45114] | 56.5 [39.5101] | 62 [3993] | <0.01 |
| O2 duration, h | 27 [1059] | 38 [1777] | 38 [2381] | 34.5 [1765] | 0.18 |
Compared to those with single lobar infiltrates, children with interstitial infiltrates had higher odds of need for supplemental oxygen (aOR: 3.1, 95% CI: 1.37.6) and ICU admission (aOR: 4.4, 95% CI: 1.314.3) but not invasive mechanical ventilation. There were also no differences in duration of oxygen supplementation or hospital length of stay.
Outcomes According to Presence and Size of Pleural Effusion
Compared to those without pleural effusion, children with moderate to large effusion had a higher odds of ICU admission (aOR: 3.2, 95% CI: 1.18.9) and invasive mechanical ventilation (aOR: 14.8, 95% CI: 9.822.4), and also had a longer duration of oxygen supplementation (aOR: 3.0, 95% CI: 1.46.5) and hospital length of stay (aOR: 2.6, 95% CI: 1.9‐3.6) (Table 3, Figure 2). The presence of a small pleural effusion was not associated with increased need for supplemental oxygen, ICU admission, or mechanical ventilation compared to those without effusion. However, small effusion was associated with a longer duration of oxygen supplementation (aOR: 1.7, 95% CI: 12.7) and hospital length of stay (aOR: 1.6, 95% CI: 1.3‐1.9).
| Outcome | Pleural Effusion | P Valuea | ||
|---|---|---|---|---|
| None, n=320 | Small, n=65 | Moderate/Large, n=21 | ||
| ||||
| Supplemental O2 requirement | 200 (62.5) | 40 (61.5) | 14 (66.7) | 0.91 |
| ICU admission | 22 (6.9) | 6 (9.2) | 4 (19) | 0.12 |
| Mechanical ventilation | 5 (1.6) | 5 (7.7) | 4 (19) | <0.01 |
| Hospital length of stay, h | 48 [37.576] | 72 [45142] | 160 [82191] | <0.01 |
| Oxygen duration, h | 31 [1157] | 38.5 [1887] | 111 [27154] | <0.01 |
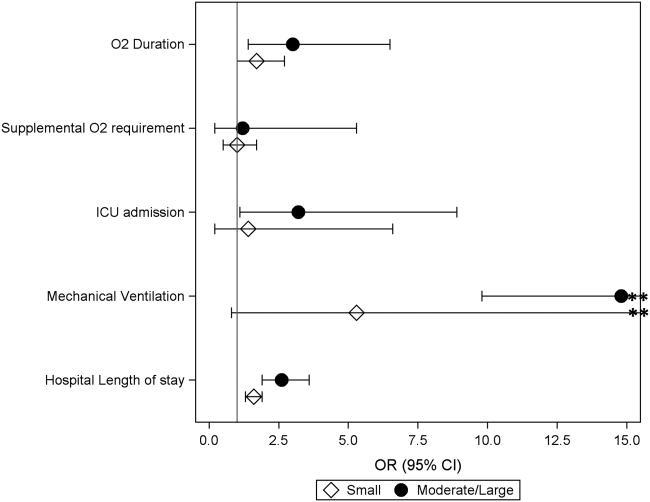
DISCUSSION
We evaluated the association between admission chest radiographic findings and subsequent clinical outcomes and hospital care processes for children hospitalized with CAP at 4 children's hospitals in the United States. We conclude that radiographic findings are associated with important inpatient outcomes. Similar to data from adults, findings of moderate to large pleural effusions and bilateral multilobar infiltrates had the strongest associations with severe disease. Such information, in combination with other prognostic factors, may help clinicians identify high‐risk patients and support management decisions, while also helping to inform families about the expected hospital course.
Previous pediatric studies examining the association between radiographic findings and outcomes have produced inconsistent results.[8, 9, 10, 11, 12] All but 1 of these studies documented 1 radiographic characteristics associated with pneumonia disease severity.[11] Further, although most contrasted lobar/alveolar and interstitial infiltrates, only Patria et al. distinguished among lobar infiltrate patterns (eg, single lobar vs multilobar).[12] Similar to our findings, that study demonstrated increased disease severity among children with bilateral multifocal lobar infiltrates. Of the studies that considered the presence of pleural effusion, only 1 demonstrated this finding to be associated with more severe disease.[9] However, none of these prior studies examined size of the pleural effusion.
In our study, the strongest association with severe pneumonia outcomes was among children with moderate to large pleural effusion. Significant pleural effusions are much more commonly due to infection with bacterial pathogens, particularly Streptococcus pneumoniae, Staphylococcus aureus, and Streptococcus pyogenes, and may also indicate infection with more virulent and/or difficult to treat strains.[16, 17, 18, 19] Surgical intervention is also often required. As such, children with significant pleural effusions are often more ill on presentation and may have a prolonged period of recovery.[20, 21, 22]
Similarly, multilobar infiltrates, particularly bilateral, were associated with increased disease severity in terms of need for supplemental oxygen, ICU admission, and need for invasive mechanical ventilation. Although this finding may be expected, it is interesting to note that the duration of supplemental oxygen and hospital length of stay were similar to those with single lobar disease. One potential explanation is that, although children with multilobar disease are more severe at presentation, rates of recovery are similar to those with less extensive radiographic findings, owing to rapidly effective antimicrobials for uncomplicated bacterial pneumonia. This hypothesis also agrees with the 2011 PIDS/IDSA guidelines, which state that children receiving adequate therapy typically show signs of improvement within 48 to 72 hours regardless of initial severity.[1]
Interstitial infiltrate was also associated with increased severity at presentation but similar length of stay and duration of oxygen requirement compared with single lobar disease. We note that these children were substantially younger than those presenting with any pattern of lobar disease (median age, 1 vs 3 years), were more likely to have a concurrent diagnosis of bronchiolitis (34% vs 17%), and only 1 child with interstitial infiltrates had a documented pleural effusion (vs 23% of children with lobar infiltrates). Primary viral pneumonia is considered more likely to produce interstitial infiltrates on chest radiograph compared to bacterial disease, and although detailed etiologic data are unavailable for this study, our findings above strongly support this assertion.[23, 24]
The 2011 PIDS/IDSA guidelines recommend admission chest radiographs for all children hospitalized with pneumonia to assess extent of disease and identify complications that may requiring additional evaluation or surgical intervention.[1] Our findings highlight additional potential benefits of admission radiographs in terms of disease prognosis and management decisions. In the initial evaluation of a sick child with pneumonia, clinicians are often presented with a number of potential prognostic factors that may influence disease outcomes. However, it is sometimes difficult for providers to consider all available information and/or the relative importance of a single factor, resulting in inaccurate risk perceptions and management decisions that may contribute to poor outcomes.[25] Similar to adults, the development of clinical prediction rules, which incorporate a variety of important predictors including admission radiographic findings, likely would improve risk assessments and potentially outcomes for children with pneumonia. Such prognostic information is also helpful for clinicians who may use these data to inform and prepare families regarding the expected course of hospitalization.
Our study has several limitations. This study was retrospective and only included a sample of pneumonia hospitalizations during the study period, which may raise confounding concerns and potential for selection bias. However, detailed medical record reviews using standardized case definitions for radiographic CAP were used, and a large sample of children was randomly selected from each institution. In addition, a large number of potential confounders were selected a priori and included in multivariable analyses; propensity score adjustment was used to reduce model complexity and avoid overfitting. Radiographic findings were based on clinical interpretation by pediatric radiologists independent of a study protocol. Prior studies have demonstrated good agreement for identification of alveolar/lobar infiltrates and pleural effusion by trained radiologists, although agreement for interstitial infiltrate is poor.[26, 27] This limitation could result in either over‐ or underestimation of the prevalence of interstitial infiltrates likely resulting in a nondifferential bias toward the null. Microbiologic information, which may inform radiographic findings and disease severity, was also not available. However, because pneumonia etiology is frequently unknown in the clinical setting, our study reflects typical practice. We also did not include children from community or nonteaching hospitals. Thus, although findings may have relevance to community or nonteaching hospitals, our results cannot be generalized.
CONCLUSION
Our study demonstrates that among children hospitalized with CAP, admission chest radiographic findings are associated with important clinical outcomes and hospital care processes, highlighting additional benefits of the 2011 PIDS/IDSA guidelines' recommendation for admission chest radiographs for all children hospitalized with pneumonia. These data, in conjunction with other important prognostic information, may help clinicians more rapidly identify children at increased risk for severe illness, and could also offer guidance regarding disease management strategies and facilitate shared decision making with families. Thus, routine admission chest radiography in this population represents a valuable tool that contributes to improved quality of care.
Disclosures
Dr. Williams is supported by funds from the National Institutes of HealthNational Institute of Allergy and Infectious Diseases (K23AI104779). The authors report no conflicts of interest.
- , , , et al. The management of community‐acquired pneumonia in infants and children older than 3 months of age: clinical practice guidelines by the Pediatric Infectious Diseases Society and the Infectious Diseases Society of America. Clin Infect Dis. 2011;53(7):e25–e76.
- , , , et al. A prediction rule to identify low‐risk patients with community‐acquired pneumonia. N Engl J Med. 1997;336(4):243–250.
- , , , et al. SMART‐COP: a tool for predicting the need for intensive respiratory or vasopressor support in community‐acquired pneumonia. Clin Infect Dis. 2008;47(3):375–384.
- , , , et al. Development and validation of a clinical prediction rule for severe community‐acquired pneumonia. Am J Respir Crit Care Med. 2006;174(11):1249–1256.
- , , , et al. Risk stratification of early admission to the intensive care unit of patients with no major criteria of severe community‐acquired pneumonia: development of an international prediction rule. Crit Care. 2009;13(2):R54.
- , , , et al. Do pulmonary radiographic findings at presentation predict mortality in patients with community‐acquired pneumonia? Arch Intern Med. 1996;156(19):2206–2212.
- , , , , , . Safety and efficacy of CURB65‐guided antibiotic therapy in community‐acquired pneumonia. J Antimicrob Chemother. 2011;66(2):416–423.
- , , . Severity of childhood community‐acquired pneumonia and chest radiographic findings. Pediatr Pulmonol. 2009;44(3):249–252.
- , , , et al. Can chest x‐ray predict pneumonia severity? Pediatr Pulmonol. 2004;38(6):465–469.
- , , , . Children with pneumonia: how do they present and how are they managed? Arch Dis Child. 2007;92(5):394–398.
- , , . Role of chest X‐ray in predicting outcome of acute severe pneumonia. Indian Pediatr. 2008;45(11):893–898.
- , , , , , . Association between radiological findings and severity of community‐acquired pneumonia in children. Ital J Pediatr. 2013;39:56.
- , , , et al. Identifying pediatric community‐acquired pneumonia hospitalizations: accuracy of administrative billing codes. JAMA Pediatrics. 2013;167(9):851–858.
- , , , , , . Deaths attributed to pediatric complex chronic conditions: national trends and implications for supportive care services. Pediatrics. 2001;107(6):E99.
- , . Invited commentary: propensity scores. Am J Epidemiol. 1999;150(4):327–333.
- , , , . Increasing incidence of empyema complicating childhood community‐acquired pneumonia in the United States. Clin Infect Dis. 2010;50(6):805–813.
- , , , et al. Epidemiology and clinical characteristics of community‐acquired pneumonia in hospitalized children. Pediatrics. 2004;113(4):701–707.
- , , , et al. Molecular analysis improves pathogen identification and epidemiologic study of pediatric parapneumonic empyema. Pediatr Infect Dis J. 2011;30(4):289–294.
- , . Parapneumonic pleural effusion and empyema in children. Review of a 19‐year experience, 1962–1980. Clin Pediatr (Phila). 1983;22(6):414–419.
- , , , et al. Risk factors of progressive community‐acquired pneumonia in hospitalized children: a prospective study [published online ahead of print August 28, 2013]. J Microbiol Immunol Infect. doi: 10.1016/j.jmii.2013.06.009.
- , , , , . Community‐acquired lobar pneumonia in children in the era of universal 7‐valent pneumococcal vaccination: a review of clinical presentations and antimicrobial treatment from a Canadian pediatric hospital. BMC Pediatr. 2012;12:133.
- , , , et al. Clinical characteristics and outcome of complicated pneumococcal pneumonia in a pediatric population. Pediatr Pulmonol. 2006;41(8):726–734.
- , , , , , . Differentiation of bacterial and viral pneumonia in children. Thorax. 2002;57(5):438–441.
- , , , et al. British Thoracic Society guidelines for the management of community acquired pneumonia in children: update 2011. Thorax. 2011;66(suppl 2):ii1–ii23.
- , , , et al. Community acquired pneumonia: aetiology and usefulness of severity criteria on admission. Thorax. 1996;51(10):1010–1016.
- , , , et al. Variability in the interpretation of chest radiographs for the diagnosis of pneumonia in children. J Hosp Med. 2012;7(4):294–298.
- , , , et al. Interobserver reliability of the chest radiograph in community‐acquired pneumonia. PORT Investigators. Chest. 1996;110(2):343–350.
The 2011 Pediatric Infectious Diseases Society and Infectious Diseases Society of America (PIDS/IDSA) guidelines for management of pediatric community‐acquired pneumonia (CAP) recommend that admission chest radiographs be obtained in all children hospitalized with CAP to document the presence and extent of infiltrates and to identify complications.[1] Findings from chest radiographs may also provide clues to etiology and assist with predicting disease outcomes. In adults with CAP, clinical prediction tools use radiographic findings to inform triage decisions, guide management strategies, and predict outcomes.[2, 3, 4, 5, 6, 7] Whether or not radiographic findings could have similar utility among children with CAP is unknown.
Several retrospective studies have examined the ability of chest radiographs to predict pediatric pneumonia disease severity.[8, 9, 10, 11, 12] However, these studies used several different measures of severe pneumonia and/or were limited to young children <5 years of age, leading to inconsistent findings. These studies also rarely considered very severe disease (eg, need for invasive mechanical ventilation) or longitudinal outcome measures such as hospital length of stay. Finally, all of these prior studies were conducted outside of the United States, and most were single‐center investigations, potentially limiting generalizability. We sought to examine associations between admission chest radiographic findings and subsequent hospital care processes and clinical outcomes, including length of stay and resource utilization measures, among children hospitalized with CAP at 4 children's hospitals in the United States.
METHODS
Design and Setting
This study was nested within a multicenter retrospective cohort designed to validate International Classification of Diseases, 9th Revision, Clinical Modification (ICD9‐CM) diagnostic codes for pediatric CAP hospitalizations.[13] The Pediatric Health Information System database (Children's Hospital Association, Overland Park, KS) was used to identify children from 4 freestanding pediatric hospitals (Monroe Carell, Jr. Children's Hospital at Vanderbilt, Nashville, Tennessee; Children's Mercy Hospitals & Clinics, Kansas City, Missouri; Seattle Children's Hospital, Seattle, Washington; and Cincinnati Children's Hospital Medical Center, Cincinnati, Ohio). The institutional review boards at each participating institution approved the study. The validation study included a 25% random sampling of children 60 days to 18 years of age (n=998) who were hospitalized between January 1, 2010 and December 31, 2010 with at least 1 ICD9‐CM discharge code indicating pneumonia. The diagnosis of CAP was confirmed by medical record review.
Study Population
This study was limited to children from the validation study who met criteria for clinical and radiographic CAP, defined as: (1) abnormal temperature or white blood cell count, (2) signs and symptoms of acute respiratory illness (eg, cough, tachypnea), and (3) chest radiograph indicating pneumonia within 48 hours of admission. Children with atelectasis as the only abnormal radiographic finding and those with complex chronic conditions (eg, cystic fibrosis, malignancy) were excluded using a previously described algorithm.[14]
Outcomes
Several measures of disease severity were assessed. Dichotomous outcomes included supplemental oxygen use, need for intensive care unit (ICU) admission, and need for invasive mechanical ventilation. Continuous outcomes included hospital length of stay, and for those requiring supplemental oxygen, duration of oxygen supplementation, measured in hours.
Exposure
To categorize infiltrate patterns and the presence and size of pleural effusions, we reviewed the final report from admission chest radiographs to obtain the final clinical interpretation performed by the attending pediatric radiologist. Infiltrate patterns were classified as single lobar (reference), unilateral multilobar, bilateral multilobar, or interstitial. Children with both lobar and interstitial infiltrates, and those with mention of atelectasis, were classified according to the type of lobar infiltrate. Those with atelectasis only were excluded. Pleural effusions were classified as absent, small, or moderate/large.
Analysis
Descriptive statistics were summarized using frequencies and percentages for categorical variables and median and interquartile range (IQR) values for continuous variables. Our primary exposures were infiltrate pattern and presence and size of pleural effusion on admission chest radiograph. Associations between radiographic findings and disease outcomes were analyzed using logistic and linear regression for dichotomous and continuous variables, respectively. Continuous outcomes were log‐transformed and normality assumptions verified prior to model development.
Due to the large number of covariates relative to outcome events, we used propensity score methods to adjust for potential confounding. The propensity score estimates the likelihood of a given exposure (ie, infiltrate pattern) conditional on a set of covariates. In this way, the propensity score summarizes potential confounding effects from a large number of covariates into a single variable. Including the propensity score as a covariate in multivariable regression improves model efficiency and helps protect against overfitting.[15] Covariates included in the estimation of the propensity score included age, sex, race/ethnicity, payer, hospital, asthma history, hospital transfer, recent hospitalization (within 30 days), recent emergency department or clinic visit (within 2 weeks), recent antibiotics for acute illness (within 5 days), illness duration prior to admission, tachypnea and/or increased work of breathing (retractions, nasal flaring, or grunting) at presentation, receipt of albuterol and/or corticosteroids during the first 2 calendar days of hospitalization, and concurrent diagnosis of bronchiolitis. All analyses included the estimated propensity score, infiltrate pattern, and pleural effusion (absent, small, or moderate/large).
RESULTS
Study Population
The median age of the 406 children with clinical and radiographic CAP was 3 years (IQR, 16 years) (Table 1). Single lobar infiltrate was the most common radiographic pattern (61%). Children with interstitial infiltrates (10%) were younger than those with lobar infiltrates of any type (median age 1 vs 3 years, P=0.02). A concomitant diagnosis of bronchiolitis was assigned to 34% of children with interstitial infiltrates but only 17% of those with lobar infiltrate patterns (range, 11%20%, P=0.03). Pleural effusion was present in 21% of children and was more common among those with lobar infiltrates, particularly multilobar disease. Only 1 child with interstitial infiltrate had a pleural effusion. Overall, 63% of children required supplemental oxygen, 8% required ICU admission, and 3% required invasive mechanical ventilation. Median length of stay was 51.5 hours (IQR, 3991) and median oxygen duration was 31.5 hours [IQR, 1365]. There were no deaths.
| Characteristic | Infiltrate Patterna | P Valueb | |||
|---|---|---|---|---|---|
| Single Lobar | Multilobar, Unilateral | Multilobar, Bilateral | Interstitial | ||
| |||||
| No. | 247 (60.8) | 54 (13.3) | 64 (15.8) | 41 (10.1) | |
| Median age, y | 3 [16] | 3 [17] | 3 [15] | 1 [03] | 0.02 |
| Male sex | 124 (50.2) | 32 (59.3) | 41 (64.1) | 30 (73.2) | 0.02 |
| Race | |||||
| Non‐Hispanic white | 133 (53.8) | 36 (66.7) | 37 (57.8) | 17 (41.5) | 0.69 |
| Non‐Hispanic black | 40 (16.2) | 6 (11.1) | 9 (14.1) | 8 (19.5) | |
| Hispanic | 25 (10.1) | 4 (7.4) | 5 (7.8) | 7 (17.1) | |
| Other | 49 (19.9) | 8 (14.8) | 13 (20.4) | 9 (22) | |
| Insurance | |||||
| Public | 130 (52.6) | 26 (48.1) | 33 (51.6) | 25 (61) | 0.90 |
| Private | 116 (47) | 28 (51.9) | 31 (48.4) | 16 (39) | |
| Concurrent diagnosis | |||||
| Asthma | 80 (32.4) | 16 (29.6) | 17 (26.6) | 12 (29.3) | 0.82 |
| Bronchiolitis | 43 (17.4) | 6 (11.1) | 13 (20.3) | 14 (34.1) | 0.03 |
| Effusion | |||||
| None | 201 (81.4) | 31 (57.4) | 48 (75) | 40 (97.6) | <.01 |
| Small | 34 (13.8) | 20 (37) | 11 (17.2) | 0 | |
| Moderate/large | 12 (4.9) | 3 (5.6) | 5 (7.8) | 1 (2.4) | |
Outcomes According to Radiographic Infiltrate Pattern
Compared to children with single lobar infiltrates, the odds of ICU admission was significantly increased for those with either unilateral or bilateral multilobar infiltrates (unilateral, adjusted odds ratio [aOR]: 8.0, 95% confidence interval [CI]: 2.922.2; bilateral, aOR: 6.6, 95% CI: 2.14.5) (Figure 1, Table 2). Patients with bilateral multilobar infiltrates also had higher odds for supplemental oxygen use (aOR: 2.7, 95% CI: 1.25.8) and need for invasive mechanical ventilation (aOR: 3.0, 95% CI: 1.27.9). There were no differences in duration of oxygen supplementation or hospital length of stay for children with single versus multilobar infiltrates.
| Outcome | Infiltrate Patterna | P Valueb | |||
|---|---|---|---|---|---|
| Single Lobar, n=247 | Multilobar, Unilateral, n=54 | Multilobar, Bilateral, n=64 | Interstitial, n=41 | ||
| |||||
| Supplemental O2 requirement | 143 (57.9) | 34 (63) | 46 (71.9) | 31 (75.6) | 0.05 |
| ICU admission | 10 (4) | 9 (16.7) | 9 (14.1) | 4 (9.8) | <0.01 |
| Mechanical ventilation | 5 (2) | 4 (7.4) | 4 (6.3) | 1 (2.4) | 0.13 |
| Hospital length of stay, h | 47 [3779] | 63 [45114] | 56.5 [39.5101] | 62 [3993] | <0.01 |
| O2 duration, h | 27 [1059] | 38 [1777] | 38 [2381] | 34.5 [1765] | 0.18 |
Compared to those with single lobar infiltrates, children with interstitial infiltrates had higher odds of need for supplemental oxygen (aOR: 3.1, 95% CI: 1.37.6) and ICU admission (aOR: 4.4, 95% CI: 1.314.3) but not invasive mechanical ventilation. There were also no differences in duration of oxygen supplementation or hospital length of stay.
Outcomes According to Presence and Size of Pleural Effusion
Compared to those without pleural effusion, children with moderate to large effusion had a higher odds of ICU admission (aOR: 3.2, 95% CI: 1.18.9) and invasive mechanical ventilation (aOR: 14.8, 95% CI: 9.822.4), and also had a longer duration of oxygen supplementation (aOR: 3.0, 95% CI: 1.46.5) and hospital length of stay (aOR: 2.6, 95% CI: 1.9‐3.6) (Table 3, Figure 2). The presence of a small pleural effusion was not associated with increased need for supplemental oxygen, ICU admission, or mechanical ventilation compared to those without effusion. However, small effusion was associated with a longer duration of oxygen supplementation (aOR: 1.7, 95% CI: 12.7) and hospital length of stay (aOR: 1.6, 95% CI: 1.3‐1.9).
| Outcome | Pleural Effusion | P Valuea | ||
|---|---|---|---|---|
| None, n=320 | Small, n=65 | Moderate/Large, n=21 | ||
| ||||
| Supplemental O2 requirement | 200 (62.5) | 40 (61.5) | 14 (66.7) | 0.91 |
| ICU admission | 22 (6.9) | 6 (9.2) | 4 (19) | 0.12 |
| Mechanical ventilation | 5 (1.6) | 5 (7.7) | 4 (19) | <0.01 |
| Hospital length of stay, h | 48 [37.576] | 72 [45142] | 160 [82191] | <0.01 |
| Oxygen duration, h | 31 [1157] | 38.5 [1887] | 111 [27154] | <0.01 |
DISCUSSION
We evaluated the association between admission chest radiographic findings and subsequent clinical outcomes and hospital care processes for children hospitalized with CAP at 4 children's hospitals in the United States. We conclude that radiographic findings are associated with important inpatient outcomes. Similar to data from adults, findings of moderate to large pleural effusions and bilateral multilobar infiltrates had the strongest associations with severe disease. Such information, in combination with other prognostic factors, may help clinicians identify high‐risk patients and support management decisions, while also helping to inform families about the expected hospital course.
Previous pediatric studies examining the association between radiographic findings and outcomes have produced inconsistent results.[8, 9, 10, 11, 12] All but 1 of these studies documented 1 radiographic characteristics associated with pneumonia disease severity.[11] Further, although most contrasted lobar/alveolar and interstitial infiltrates, only Patria et al. distinguished among lobar infiltrate patterns (eg, single lobar vs multilobar).[12] Similar to our findings, that study demonstrated increased disease severity among children with bilateral multifocal lobar infiltrates. Of the studies that considered the presence of pleural effusion, only 1 demonstrated this finding to be associated with more severe disease.[9] However, none of these prior studies examined size of the pleural effusion.
In our study, the strongest association with severe pneumonia outcomes was among children with moderate to large pleural effusion. Significant pleural effusions are much more commonly due to infection with bacterial pathogens, particularly Streptococcus pneumoniae, Staphylococcus aureus, and Streptococcus pyogenes, and may also indicate infection with more virulent and/or difficult to treat strains.[16, 17, 18, 19] Surgical intervention is also often required. As such, children with significant pleural effusions are often more ill on presentation and may have a prolonged period of recovery.[20, 21, 22]
Similarly, multilobar infiltrates, particularly bilateral, were associated with increased disease severity in terms of need for supplemental oxygen, ICU admission, and need for invasive mechanical ventilation. Although this finding may be expected, it is interesting to note that the duration of supplemental oxygen and hospital length of stay were similar to those with single lobar disease. One potential explanation is that, although children with multilobar disease are more severe at presentation, rates of recovery are similar to those with less extensive radiographic findings, owing to rapidly effective antimicrobials for uncomplicated bacterial pneumonia. This hypothesis also agrees with the 2011 PIDS/IDSA guidelines, which state that children receiving adequate therapy typically show signs of improvement within 48 to 72 hours regardless of initial severity.[1]
Interstitial infiltrate was also associated with increased severity at presentation but similar length of stay and duration of oxygen requirement compared with single lobar disease. We note that these children were substantially younger than those presenting with any pattern of lobar disease (median age, 1 vs 3 years), were more likely to have a concurrent diagnosis of bronchiolitis (34% vs 17%), and only 1 child with interstitial infiltrates had a documented pleural effusion (vs 23% of children with lobar infiltrates). Primary viral pneumonia is considered more likely to produce interstitial infiltrates on chest radiograph compared to bacterial disease, and although detailed etiologic data are unavailable for this study, our findings above strongly support this assertion.[23, 24]
The 2011 PIDS/IDSA guidelines recommend admission chest radiographs for all children hospitalized with pneumonia to assess extent of disease and identify complications that may requiring additional evaluation or surgical intervention.[1] Our findings highlight additional potential benefits of admission radiographs in terms of disease prognosis and management decisions. In the initial evaluation of a sick child with pneumonia, clinicians are often presented with a number of potential prognostic factors that may influence disease outcomes. However, it is sometimes difficult for providers to consider all available information and/or the relative importance of a single factor, resulting in inaccurate risk perceptions and management decisions that may contribute to poor outcomes.[25] Similar to adults, the development of clinical prediction rules, which incorporate a variety of important predictors including admission radiographic findings, likely would improve risk assessments and potentially outcomes for children with pneumonia. Such prognostic information is also helpful for clinicians who may use these data to inform and prepare families regarding the expected course of hospitalization.
Our study has several limitations. This study was retrospective and only included a sample of pneumonia hospitalizations during the study period, which may raise confounding concerns and potential for selection bias. However, detailed medical record reviews using standardized case definitions for radiographic CAP were used, and a large sample of children was randomly selected from each institution. In addition, a large number of potential confounders were selected a priori and included in multivariable analyses; propensity score adjustment was used to reduce model complexity and avoid overfitting. Radiographic findings were based on clinical interpretation by pediatric radiologists independent of a study protocol. Prior studies have demonstrated good agreement for identification of alveolar/lobar infiltrates and pleural effusion by trained radiologists, although agreement for interstitial infiltrate is poor.[26, 27] This limitation could result in either over‐ or underestimation of the prevalence of interstitial infiltrates likely resulting in a nondifferential bias toward the null. Microbiologic information, which may inform radiographic findings and disease severity, was also not available. However, because pneumonia etiology is frequently unknown in the clinical setting, our study reflects typical practice. We also did not include children from community or nonteaching hospitals. Thus, although findings may have relevance to community or nonteaching hospitals, our results cannot be generalized.
CONCLUSION
Our study demonstrates that among children hospitalized with CAP, admission chest radiographic findings are associated with important clinical outcomes and hospital care processes, highlighting additional benefits of the 2011 PIDS/IDSA guidelines' recommendation for admission chest radiographs for all children hospitalized with pneumonia. These data, in conjunction with other important prognostic information, may help clinicians more rapidly identify children at increased risk for severe illness, and could also offer guidance regarding disease management strategies and facilitate shared decision making with families. Thus, routine admission chest radiography in this population represents a valuable tool that contributes to improved quality of care.
Disclosures
Dr. Williams is supported by funds from the National Institutes of HealthNational Institute of Allergy and Infectious Diseases (K23AI104779). The authors report no conflicts of interest.
- , , , et al. The management of community‐acquired pneumonia in infants and children older than 3 months of age: clinical practice guidelines by the Pediatric Infectious Diseases Society and the Infectious Diseases Society of America. Clin Infect Dis. 2011;53(7):e25–e76.
- , , , et al. A prediction rule to identify low‐risk patients with community‐acquired pneumonia. N Engl J Med. 1997;336(4):243–250.
- , , , et al. SMART‐COP: a tool for predicting the need for intensive respiratory or vasopressor support in community‐acquired pneumonia. Clin Infect Dis. 2008;47(3):375–384.
- , , , et al. Development and validation of a clinical prediction rule for severe community‐acquired pneumonia. Am J Respir Crit Care Med. 2006;174(11):1249–1256.
- , , , et al. Risk stratification of early admission to the intensive care unit of patients with no major criteria of severe community‐acquired pneumonia: development of an international prediction rule. Crit Care. 2009;13(2):R54.
- , , , et al. Do pulmonary radiographic findings at presentation predict mortality in patients with community‐acquired pneumonia? Arch Intern Med. 1996;156(19):2206–2212.
- , , , , , . Safety and efficacy of CURB65‐guided antibiotic therapy in community‐acquired pneumonia. J Antimicrob Chemother. 2011;66(2):416–423.
- , , . Severity of childhood community‐acquired pneumonia and chest radiographic findings. Pediatr Pulmonol. 2009;44(3):249–252.
- , , , et al. Can chest x‐ray predict pneumonia severity? Pediatr Pulmonol. 2004;38(6):465–469.
- , , , . Children with pneumonia: how do they present and how are they managed? Arch Dis Child. 2007;92(5):394–398.
- , , . Role of chest X‐ray in predicting outcome of acute severe pneumonia. Indian Pediatr. 2008;45(11):893–898.
- , , , , , . Association between radiological findings and severity of community‐acquired pneumonia in children. Ital J Pediatr. 2013;39:56.
- , , , et al. Identifying pediatric community‐acquired pneumonia hospitalizations: accuracy of administrative billing codes. JAMA Pediatrics. 2013;167(9):851–858.
- , , , , , . Deaths attributed to pediatric complex chronic conditions: national trends and implications for supportive care services. Pediatrics. 2001;107(6):E99.
- , . Invited commentary: propensity scores. Am J Epidemiol. 1999;150(4):327–333.
- , , , . Increasing incidence of empyema complicating childhood community‐acquired pneumonia in the United States. Clin Infect Dis. 2010;50(6):805–813.
- , , , et al. Epidemiology and clinical characteristics of community‐acquired pneumonia in hospitalized children. Pediatrics. 2004;113(4):701–707.
- , , , et al. Molecular analysis improves pathogen identification and epidemiologic study of pediatric parapneumonic empyema. Pediatr Infect Dis J. 2011;30(4):289–294.
- , . Parapneumonic pleural effusion and empyema in children. Review of a 19‐year experience, 1962–1980. Clin Pediatr (Phila). 1983;22(6):414–419.
- , , , et al. Risk factors of progressive community‐acquired pneumonia in hospitalized children: a prospective study [published online ahead of print August 28, 2013]. J Microbiol Immunol Infect. doi: 10.1016/j.jmii.2013.06.009.
- , , , , . Community‐acquired lobar pneumonia in children in the era of universal 7‐valent pneumococcal vaccination: a review of clinical presentations and antimicrobial treatment from a Canadian pediatric hospital. BMC Pediatr. 2012;12:133.
- , , , et al. Clinical characteristics and outcome of complicated pneumococcal pneumonia in a pediatric population. Pediatr Pulmonol. 2006;41(8):726–734.
- , , , , , . Differentiation of bacterial and viral pneumonia in children. Thorax. 2002;57(5):438–441.
- , , , et al. British Thoracic Society guidelines for the management of community acquired pneumonia in children: update 2011. Thorax. 2011;66(suppl 2):ii1–ii23.
- , , , et al. Community acquired pneumonia: aetiology and usefulness of severity criteria on admission. Thorax. 1996;51(10):1010–1016.
- , , , et al. Variability in the interpretation of chest radiographs for the diagnosis of pneumonia in children. J Hosp Med. 2012;7(4):294–298.
- , , , et al. Interobserver reliability of the chest radiograph in community‐acquired pneumonia. PORT Investigators. Chest. 1996;110(2):343–350.
© 2014 Society of Hospital Medicine