User login
Methodologic Progress Note: A Clinician’s Guide to Logistic Regression
The ability to read and correctly interpret research is an essential skill, but most hospitalists—and physicians in general—do not receive formal training in biostatistics during their medical education.1-3 In addition to straightforward statistical tests that compare a single exposure and outcome, researchers commonly use statistical models to identify and quantify complex relationships among many exposures (eg, demographics, clinical characteristics, interventions, or other variables) and an outcome. Understanding statistical models can be challenging. Still, it is important to recognize the advantages and limitations of statistical models, how to interpret their results, and the potential implications of findings on current clinical practice.
In the article “Rates and Characteristics of Medical Malpractice Claims Against Hospitalists” published in the July 2021 issue of the Journal of Hospital Medicine, Schaffer et al4 used the Comparative Benchmarking System database, which is maintained by a malpractice insurer, to characterize malpractice claims against hospitalists. The authors used multiple logistic regression models to understand the relationship among clinical factors and indemnity payments. In this Progress Note, we describe situations in which logistic regression is the proper statistical method to analyze a data set, explain results from logistic regression analyses, and equip readers with skills to critically appraise conclusions drawn from these models.
Choosing an Appropriate Statistical Model
Statistical models often are used to describe the relationship among one or more exposure variables (ie, independent variables) and an outcome (ie, dependent variable). These models allow researchers to evaluate the effects of multiple exposure variables simultaneously, which in turn allows them to “isolate” the effect of each variable; in other words, models facilitate an understanding of the relationship between each exposure variable and the outcome, adjusted for (ie, independent of) the other exposure variables in the model.
Several statistical models can be used to quantify relationships within the data, but each type of model has certain assumptions that must be satisfied. Two important assumptions include characteristics of the outcome (eg, the type and distribution) and the nature of the relationships among the outcome and independent variables (eg, linear vs nonlinear). Simple linear regression, one of the most basic statistical models used in research,5 assumes that (a) the outcome is continuous (ie, any numeric value is possible) and normally distributed (ie, its histogram is a bell-shaped curve) and (b) the relationship between the independent variable and the outcome is linear (ie, follows a straight line). If an investigator wanted to understand how weight is related to height, a simple linear regression could be used to develop a mathematical equation that tells us how the outcome (weight) generally increases as the independent variable (height) increases.
Often, the outcome in a study is not a continuous variable but a simple success/failure variable (ie, dichotomous variable that can be one of two possible values). Schaffer et al4 examined the binary outcome of whether a malpractice claim case would end in an indemnity payment or no payment. Linear regression models are not equipped to handle dichotomous outcomes. Instead, we need to use a different statistical model: logistic regression. In logistic regression, the probability (p) of a defined outcome event is estimated by creating a regression model.
The Logistic Model
A probability (p) is a measure of how likely an event (eg, a malpractice claim ends in an indemnity payment or not) is to occur. It is always between 0 (ie, the event will definitely not occur) and 1 (ie, the event will definitely occur). A p of 0.5 means there is a 50/50 chance that the event will occur (ie, equivalent to a coin flip). Because p is a probability, we need to make sure it is always between 0 and 1. If we were to try to model p with a linear regression, the model would assume that p could extend beyond 0 and 1. What can we do?
Applying a transformation is a commonly used tool in statistics to make data work better within statistical models.6 In this case, we will transform the variable p. In logistic regression, we model the probability of experiencing the outcome through a transformation called a logit. The logit represents the natural logarithm (ln) of the ratio of the probability of experiencing the outcome (p) vs the probability of not experiencing the outcome (1 – p), with the ratio being the odds of the event occurring.

This transformation works well for dichotomous outcomes because the logit transformation approximates a straight line as long as p is not too large or too small (between 0.05 and 0.95).
If we are performing a logistic regression with only one independent variable (x) and want to understand the relationship between this variable (x) and the probability of an outcome event (p), then our model is the equation of a line. The equation for the base model of logistic regression with one independent variable (x) is
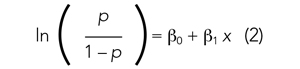
where β0 is the y-intercept and β1 is the slope of the line. Equation (2) is identical to the algebraic equation y = mx + b for a line, just rearranged slightly. In this algebraic equation, m is the slope (the same as β1) and b is the y-intercept (the same as β0). We will see that β0 and β1 are estimated (ie, assigned numeric values) from the data collected to help us understand how x and

are related and are the basis for estimating odds ratios.
We can build more complex models using multivariable logistic regression by adding more independent variables to the right side of equation (2). Essentially, this is what S
There are two notable techniques used frequently with multivariable logistic regression models. The first involves choosing which independent variables to include in the model. One way to select variables for multivariable models is defining them a priori, that is deciding which variables are clinically or conceptually associated with the outcome before looking at the data. With this approach, we can test specific hypotheses about the relationships between the independent variables and the outcome. Another common approach is to look at the data and identify the variables that vary significantly between the two outcome groups. Schaffer et al4 used an a priori approach to define variables in their multivariable model (ie, “variables for inclusion into the multivariable model were determined a priori”).
A second technique is the evaluation of collinearity, which helps us understand whether the i
Understanding the Results of the Logistic Model
Fitting the model is the process by which statistical software (eg, SAS, Stata, R, SPSS) estimates the relationships among independent variables in the model and the outcome within a specific dataset. In equation (2), this essentially means that the software will evaluate the data and provide us with the best estimates for β0 (the y-intercept) and β1 (the slope) that describe the relationship between the variable x and

Modeling can be iterative, and part of the process may include removing variables from the model that are not significantly associated with the outcome to create a simpler solution, a process known as model reduction. The results from models describe the independent association between a specific characteristic and the outcome, meaning that the relationship has been adjusted for all the other characteristics in the model.
The relationships among the independent variables and outcome are most often represented as an odds ratio (OR), which quantifies the strength of the association between two variables and is directly calculated from the β values in the model. As the name suggests, an OR is a ratio of odds. But what are odds? Simply, the odds of an outcome (such as mortality) is the probability of experiencing the event divided by the probability of not experiencing that event; in other words, it is the ratio:

The concept of odds is often unfamiliar, so it can be helpful to consider the definition in the context of games of chance. For example, in horse race betting, the outcome of interest is that a horse will lose a race. Imagine that the probability of a horse losing a race is 0.8 and the probability of winning is 0.2. The odds of losing are
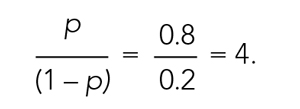
These odds usually are listed as 4-to-1, meaning that out of 5 races (ie, 4 + 1) the horse is expected to lose 4 times and win once. When odds are listed this way, we can easily calculate the associated probability by recognizing that the total number of expected races is the sum of two numbers (probability of losing: 4 races out of 5, or 0.80 vs probability of winning: 1 race out of 5, or 0.20).
In medical research, the OR typically represents the odds for one group of patients (A) compared with the odds for another group of patients (B) experiencing an outcome. If the odds of the outcome are the same for group A and group B, then OR = 1.0, meaning that the probability of the outcome is the same between the two groups. If the patients in group A have greater odds of experiencing the outcome compared with group B patients (and a greater probability of the outcome), then the OR will be >1. If the opposite is true, then the OR will be <1.
Schaffer et al4 estimated that the OR of an indemnity payment in malpractice cases involving errors in clinical judgment as a contributing factor was 5.01 (95% CI, 3.37-7.45). This means that malpractice cases involving errors in clinical judgement had a 5.01 times greater odds of indemnity payment compared with those without these errors after adjusting for all other variables in the model (eg, age, severity). Note that the 95% CI does not include 1.0. This indicates that the OR is statistically >1, and we can conclude that there is a significant relationship between errors in clinical judgment and payment that is unlikely to be attributed to chance alone.
In logistic regression for categorical independent variables, all categories are compared with a reference group within that variable, with the reference group serving as the denominator of the OR. The authors4 did not incorporate continuous independent variables in their multivariable logistic regression model. However, if the authors examined length of hospitalization as a contributing factor in indemnity payments, for example, the OR would represent a 1-unit increase in this variable (eg, 1-day increase in length of stay).
Conclusion
Logistic regression describes the relationships in data and is an important statistical model across many types of research. This Progress Note emphasizes the importance of weighing the advantages and limitations of logistic regression, provides a common approach to data transformation, and guides the correct interpretation of logistic regression model results.
1. Windish DM, Huot SJ, Green ML. Medicine residents’ understanding of the biostatistics and results in the medical literature. JAMA. 2007;298(9):1010. https://doi.org/10.1001/jama.298.9.1010
2. MacDougall M, Cameron HS, Maxwell SRJ. Medical graduate views on statistical learning needs for clinical practice: a comprehensive survey. BMC Med Educ. 2019;20(1):1. https://doi.org/10.1186/s12909-019-1842-1
3. Montori VM. Progress in evidence-based medicine. JAMA. 2008;300(15):1814-1816. https://doi.org/10.1001/jama.300.15.1814
4. Schaffer AC, Yu-Moe CW, Babayan A, Wachter RM, Einbinder JS. Rates and characteristics of medical malpractice claims against hospitalists. J Hosp Med. 2021;16(7):390-396. https://doi.org/10.12788/jhm.3557
5. Lane DM, Scott D, Hebl M, Guerra R, Osherson D, Zimmer H. Introducton to Statistics. Accessed April 13, 2021. https://onlinestatbook.com/Online_Statistics_Education.pdf
6. Marill KA. Advanced statistics: linear regression, part II: multiple linear regression. Acad Emerg Med Off J Soc Acad Emerg Med. 2004;11(1):94-102. https://doi.org/10.1197/j.aem.2003.09.006
The ability to read and correctly interpret research is an essential skill, but most hospitalists—and physicians in general—do not receive formal training in biostatistics during their medical education.1-3 In addition to straightforward statistical tests that compare a single exposure and outcome, researchers commonly use statistical models to identify and quantify complex relationships among many exposures (eg, demographics, clinical characteristics, interventions, or other variables) and an outcome. Understanding statistical models can be challenging. Still, it is important to recognize the advantages and limitations of statistical models, how to interpret their results, and the potential implications of findings on current clinical practice.
In the article “Rates and Characteristics of Medical Malpractice Claims Against Hospitalists” published in the July 2021 issue of the Journal of Hospital Medicine, Schaffer et al4 used the Comparative Benchmarking System database, which is maintained by a malpractice insurer, to characterize malpractice claims against hospitalists. The authors used multiple logistic regression models to understand the relationship among clinical factors and indemnity payments. In this Progress Note, we describe situations in which logistic regression is the proper statistical method to analyze a data set, explain results from logistic regression analyses, and equip readers with skills to critically appraise conclusions drawn from these models.
Choosing an Appropriate Statistical Model
Statistical models often are used to describe the relationship among one or more exposure variables (ie, independent variables) and an outcome (ie, dependent variable). These models allow researchers to evaluate the effects of multiple exposure variables simultaneously, which in turn allows them to “isolate” the effect of each variable; in other words, models facilitate an understanding of the relationship between each exposure variable and the outcome, adjusted for (ie, independent of) the other exposure variables in the model.
Several statistical models can be used to quantify relationships within the data, but each type of model has certain assumptions that must be satisfied. Two important assumptions include characteristics of the outcome (eg, the type and distribution) and the nature of the relationships among the outcome and independent variables (eg, linear vs nonlinear). Simple linear regression, one of the most basic statistical models used in research,5 assumes that (a) the outcome is continuous (ie, any numeric value is possible) and normally distributed (ie, its histogram is a bell-shaped curve) and (b) the relationship between the independent variable and the outcome is linear (ie, follows a straight line). If an investigator wanted to understand how weight is related to height, a simple linear regression could be used to develop a mathematical equation that tells us how the outcome (weight) generally increases as the independent variable (height) increases.
Often, the outcome in a study is not a continuous variable but a simple success/failure variable (ie, dichotomous variable that can be one of two possible values). Schaffer et al4 examined the binary outcome of whether a malpractice claim case would end in an indemnity payment or no payment. Linear regression models are not equipped to handle dichotomous outcomes. Instead, we need to use a different statistical model: logistic regression. In logistic regression, the probability (p) of a defined outcome event is estimated by creating a regression model.
The Logistic Model
A probability (p) is a measure of how likely an event (eg, a malpractice claim ends in an indemnity payment or not) is to occur. It is always between 0 (ie, the event will definitely not occur) and 1 (ie, the event will definitely occur). A p of 0.5 means there is a 50/50 chance that the event will occur (ie, equivalent to a coin flip). Because p is a probability, we need to make sure it is always between 0 and 1. If we were to try to model p with a linear regression, the model would assume that p could extend beyond 0 and 1. What can we do?
Applying a transformation is a commonly used tool in statistics to make data work better within statistical models.6 In this case, we will transform the variable p. In logistic regression, we model the probability of experiencing the outcome through a transformation called a logit. The logit represents the natural logarithm (ln) of the ratio of the probability of experiencing the outcome (p) vs the probability of not experiencing the outcome (1 – p), with the ratio being the odds of the event occurring.
This transformation works well for dichotomous outcomes because the logit transformation approximates a straight line as long as p is not too large or too small (between 0.05 and 0.95).
If we are performing a logistic regression with only one independent variable (x) and want to understand the relationship between this variable (x) and the probability of an outcome event (p), then our model is the equation of a line. The equation for the base model of logistic regression with one independent variable (x) is
where β0 is the y-intercept and β1 is the slope of the line. Equation (2) is identical to the algebraic equation y = mx + b for a line, just rearranged slightly. In this algebraic equation, m is the slope (the same as β1) and b is the y-intercept (the same as β0). We will see that β0 and β1 are estimated (ie, assigned numeric values) from the data collected to help us understand how x and
are related and are the basis for estimating odds ratios.
We can build more complex models using multivariable logistic regression by adding more independent variables to the right side of equation (2). Essentially, this is what S
There are two notable techniques used frequently with multivariable logistic regression models. The first involves choosing which independent variables to include in the model. One way to select variables for multivariable models is defining them a priori, that is deciding which variables are clinically or conceptually associated with the outcome before looking at the data. With this approach, we can test specific hypotheses about the relationships between the independent variables and the outcome. Another common approach is to look at the data and identify the variables that vary significantly between the two outcome groups. Schaffer et al4 used an a priori approach to define variables in their multivariable model (ie, “variables for inclusion into the multivariable model were determined a priori”).
A second technique is the evaluation of collinearity, which helps us understand whether the i
Understanding the Results of the Logistic Model
Fitting the model is the process by which statistical software (eg, SAS, Stata, R, SPSS) estimates the relationships among independent variables in the model and the outcome within a specific dataset. In equation (2), this essentially means that the software will evaluate the data and provide us with the best estimates for β0 (the y-intercept) and β1 (the slope) that describe the relationship between the variable x and
Modeling can be iterative, and part of the process may include removing variables from the model that are not significantly associated with the outcome to create a simpler solution, a process known as model reduction. The results from models describe the independent association between a specific characteristic and the outcome, meaning that the relationship has been adjusted for all the other characteristics in the model.
The relationships among the independent variables and outcome are most often represented as an odds ratio (OR), which quantifies the strength of the association between two variables and is directly calculated from the β values in the model. As the name suggests, an OR is a ratio of odds. But what are odds? Simply, the odds of an outcome (such as mortality) is the probability of experiencing the event divided by the probability of not experiencing that event; in other words, it is the ratio:
The concept of odds is often unfamiliar, so it can be helpful to consider the definition in the context of games of chance. For example, in horse race betting, the outcome of interest is that a horse will lose a race. Imagine that the probability of a horse losing a race is 0.8 and the probability of winning is 0.2. The odds of losing are
These odds usually are listed as 4-to-1, meaning that out of 5 races (ie, 4 + 1) the horse is expected to lose 4 times and win once. When odds are listed this way, we can easily calculate the associated probability by recognizing that the total number of expected races is the sum of two numbers (probability of losing: 4 races out of 5, or 0.80 vs probability of winning: 1 race out of 5, or 0.20).
In medical research, the OR typically represents the odds for one group of patients (A) compared with the odds for another group of patients (B) experiencing an outcome. If the odds of the outcome are the same for group A and group B, then OR = 1.0, meaning that the probability of the outcome is the same between the two groups. If the patients in group A have greater odds of experiencing the outcome compared with group B patients (and a greater probability of the outcome), then the OR will be >1. If the opposite is true, then the OR will be <1.
Schaffer et al4 estimated that the OR of an indemnity payment in malpractice cases involving errors in clinical judgment as a contributing factor was 5.01 (95% CI, 3.37-7.45). This means that malpractice cases involving errors in clinical judgement had a 5.01 times greater odds of indemnity payment compared with those without these errors after adjusting for all other variables in the model (eg, age, severity). Note that the 95% CI does not include 1.0. This indicates that the OR is statistically >1, and we can conclude that there is a significant relationship between errors in clinical judgment and payment that is unlikely to be attributed to chance alone.
In logistic regression for categorical independent variables, all categories are compared with a reference group within that variable, with the reference group serving as the denominator of the OR. The authors4 did not incorporate continuous independent variables in their multivariable logistic regression model. However, if the authors examined length of hospitalization as a contributing factor in indemnity payments, for example, the OR would represent a 1-unit increase in this variable (eg, 1-day increase in length of stay).
Conclusion
Logistic regression describes the relationships in data and is an important statistical model across many types of research. This Progress Note emphasizes the importance of weighing the advantages and limitations of logistic regression, provides a common approach to data transformation, and guides the correct interpretation of logistic regression model results.
1. Windish DM, Huot SJ, Green ML. Medicine residents’ understanding of the biostatistics and results in the medical literature. JAMA. 2007;298(9):1010. https://doi.org/10.1001/jama.298.9.1010
2. MacDougall M, Cameron HS, Maxwell SRJ. Medical graduate views on statistical learning needs for clinical practice: a comprehensive survey. BMC Med Educ. 2019;20(1):1. https://doi.org/10.1186/s12909-019-1842-1
3. Montori VM. Progress in evidence-based medicine. JAMA. 2008;300(15):1814-1816. https://doi.org/10.1001/jama.300.15.1814
4. Schaffer AC, Yu-Moe CW, Babayan A, Wachter RM, Einbinder JS. Rates and characteristics of medical malpractice claims against hospitalists. J Hosp Med. 2021;16(7):390-396. https://doi.org/10.12788/jhm.3557
5. Lane DM, Scott D, Hebl M, Guerra R, Osherson D, Zimmer H. Introducton to Statistics. Accessed April 13, 2021. https://onlinestatbook.com/Online_Statistics_Education.pdf
6. Marill KA. Advanced statistics: linear regression, part II: multiple linear regression. Acad Emerg Med Off J Soc Acad Emerg Med. 2004;11(1):94-102. https://doi.org/10.1197/j.aem.2003.09.006
© 2021 Society of Hospital Medicine
Methodological Progress Note: Interrupted Time Series
Hospital medicine research often asks the question whether an intervention, such as a policy or guideline, has improved quality of care and/or whether there were any unintended consequences. Alternatively, investigators may be interested in understanding the impact of an event, such as a natural disaster or a pandemic, on hospital care. The study design that provides the best estimate of the causal effect of the intervention is the randomized controlled trial (RCT). The goal of randomization, which can be implemented at the patient or cluster level (eg, hospitals), is attaining a balance of the known and unknown confounders between study groups.
However, an RCT may not be feasible for several reasons: complexity, insufficient setup time or funding, ethical barriers to randomization, unwillingness of funders or payers to withhold the intervention from patients (ie, the control group), or anticipated contamination of the intervention into the control group (eg, provider practice change interventions). In addition, it may be impossible to conduct an RCT because the investigator does not have control over the design of an intervention or because they are studying an event, such as a pandemic.
In the June 2020 issue of the Journal of Hospital Medicine, Coon et al1 use a type of quasi-experimental design (QED)—specifically, the interrupted time series (ITS)—to examine the impact of the adoption of ward-based high-flow nasal cannula protocols on intensive care unit (ICU) admission for bronchiolitis at children’s hospitals. In this methodologic progress note, we discuss QEDs for evaluating the impact of healthcare interventions or events and focus on ITS, one of the strongest QEDs.
WHAT IS A QUASI-EXPERIMENTAL DESIGN?
Quasi-experimental design refers to a broad range of nonrandomized or partially randomized pre- vs postintervention studies.2 In order to test a causal hypothesis without randomization, QEDs define a comparison group or a time period in which an intervention has not been implemented, as well as at least one group or time period in which an intervention has been implemented. In a QED, the control may lack similarity with the intervention group or time period because of differences in the patients, sites, or time period (sometimes referred to as having a “nonequivalent control group”). Several design and analytic approaches are available to enhance the extent to which the study is able to make conclusions about the causal impact of the intervention.2,3 Because randomization is not necessary, QEDs allow for inclusion of a broader population than that which is feasible by RCTs, which increases the applicability and generalizability of the results. Therefore, they are a powerful research design to test the effectiveness of interventions in real-world settings.
The choice of which QED depends on whether the investigators are conducting a prospective evaluation and have control over the study design (ie, the ordering of the intervention, selection of sites or individuals, and/or timing and frequency of the data collection) or whether the investigators do not have control over the intervention, which is also known as a “natural experiment.”4,5 Some studies may also incorporate two QEDs in tandem.6 The Table provides a brief summary of different QEDs, ordered by methodologic strength, and distinguishes those that can be used to study natural experiments. In the study by Coon et al,1 an ITS is used as opposed to a methodologically stronger QED, such as the stepped-wedge design, because the investigators did not have control over the rollout of heated high-flow nasal canula protocols across hospitals.

WHAT IS AN INTERRUPTED TIME SERIES?
Interrupted time series designs use repeated observations of an outcome over time. This method then divides, or “interrupts,” the series of data into two time periods: before the intervention or event and after. Using data from the preintervention period, an underlying trend in the outcome is estimated and assumed to continue forward into the postintervention period to estimate what would have occurred without the intervention. Any significant change in the outcome at the beginning of the postintervention period or change in the trend in the postintervention is then attributed to the intervention.
There are several important methodologic considerations when designing an ITS study, as detailed in other review papers.2,3,7,8 An ITS design can be retrospective or prospective. It can be of a single center or include multiple sites, as in Coon et al. It can be conducted with or without a control. The inclusion of a control, when appropriately chosen, improves the strength of the study design because it can account for seasonal trends and potential confounders that vary over time. The control can be a different group of hospitals or participants that are similar but did not receive the intervention, or it can be a different outcome in the same group of hospitals or participants that are not expected to be affected by the intervention. The ITS design may also be set up to estimate the individual effects of multicomponent interventions. If the different components are phased in sequentially over time, then it may be possible to interrupt the time series at these points and estimate the impact of each intervention component.
Other examples of ITS studies in hospital medicine include those that evaluated the impact of a readmission-reduction program,9 of state sepsis regulations on in-hospital mortality,10 of resident duty-hour reform on mortality among hospitalized patients,11 of a quality-improvement initiative on early discharge,12 and of national guidelines on pediatric pneumonia antibiotic selection.13 There are several types of ITS analysis, and in this article, we focus on segmented regression without a control group.7,8
WHAT IS A SEGMENTED REGRESSION ITS?
Segmented regression is the statistical model used to measure (a) the immediate change in the outcome (level) at the start of the intervention and (b) the change in the trend of the outcome (slope) in the postintervention period vs that in the preintervention period. Therefore, the intervention effect size is expressed in terms of the level change and the slope change. To function properly, the models require several repeated (eg, monthly) measurements of the outcome before and after the intervention. Some experts suggest a minimum of 4 to 12 observations, depending on a number of factors including the stability of the outcome and seasonal variations.7,8 If changes before and after more than one intervention are being examined, there should be the minimum number of observations separating them. Unlike typical regression models, time-series models can correct for autocorrelation if it is present in the data. Autocorrelation is the type of correlation that arises when data are collected over time, with those closest in time being more strongly correlated (there are also other types of autocorrelation, such as seasonal patterns). Using available statistical software, autocorrelation can be detected and, if present, it can be controlled for in the segmented regression models.
HOW ARE SEGMENTED REGRESSION RESULTS PRESENTED?
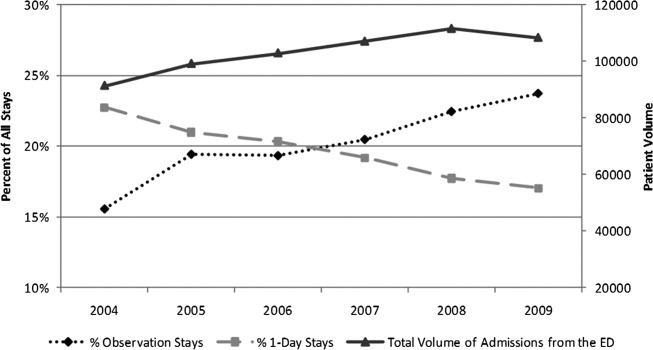
Coon et al present results of their ITS analysis in a panel of figures detailing each study outcome, ICU admission, ICU length of stay, total length of stay, and rates of mechanical ventilation. Each panel shows the rate of change in the outcome per season across hospitals, before and after adoption of heated high-flow nasal cannula protocols, and the level change at the time of adoption.
To further explain how segmented regression results are presented, in the Figure we detail the structure of a segmented regression figure evaluating the impact of an intervention without a control group. In addition to the regression figure, authors typically provide 95% CIs around the rates, level change, and the difference between the postintervention and preintervention periods, along with P values demonstrating whether the rates, level change, and the differences between period slopes differ significantly from zero.

WHAT ARE THE UNDERLYING ASSUMPTIONS OF THE SEGMENTED REGRESSION ITS?
Segmented regression models assume a linear trend in the outcome. If the outcome follows a nonlinear pattern (eg, exponential spread of a disease during a pandemic), then using different distributions in the modeling or transformations of the data may be necessary. The validity of the comparison between the pre- and postintervention groups relies on the similarity between the populations. When there is imbalance, investigators can consider matching based on important characteristics or applying risk adjustment as necessary. Another important assumption is that the outcome of interest is unchanged in the absence of the intervention. Finally, the analysis assumes that the intervention is fully implemented at the time the postintervention period begins. Often, there is a washout period during which the old approach is stopped and the new approach (the intervention) is being implemented and can easily be taken into account.
WHAT ARE THE STRENGTHS OF THE SEGMENTED REGRESSION ITS?
There are several strengths of the ITS analysis and segmented regression.7,8 First, this approach accounts for a possible secular trend in the outcome measure that may have been present prior to the intervention. For example, investigators might conclude that a readmissions program was effective in reducing readmissions if they found that the mean readmission percentage in the period after the intervention was significantly lower than before using a simple pre/post study design. However, what if the readmission rate was already going down prior to the intervention? Using an ITS approach, they may have found that the rate of readmissions simply continued to decrease after the intervention at the same rate that it was decreasing prior to the intervention and, therefore, conclude that the intervention was not effective. Second, because the ITS approach evaluates changes in rates of an outcome at a population level, confounding by individual-level variables will not introduce serious bias unless the confounding occurred at the same time as the intervention. Third, ITS can be used to measure the unintended consequences of interventions or events, and investigators can construct separate time-series analyses for different outcomes. Fourth, ITS can be used to evaluate the impact of the intervention on subpopulations (eg, those grouped by age, sex, race) by conducting stratified analysis. Fifth, ITS provides simple and clear graphical results that can be easily understood by various audiences.
WHAT ARE THE IMPORTANT LIMITATIONS OF AN ITS?
By accounting for preintervention trends, ITS studies permit stronger causal inference than do cross-sectional or simple pre/post QEDs, but they may by prone to confounding by cointerventions or by changes in the population composition. Causal inference based on the ITS analysis is only valid to the extent to which the intervention was the only thing that changed at the point in time between the preintervention and postintervention periods. It is important for investigators to consider this in the design and discuss any coincident interventions. If there are multiple interventions over time, it is possible to account for these changes in the study design by creating multiple points of interruption provided there are sufficient measurements of the outcome between interventions. If the composition of the population changes at the same time as the intervention, this introduces bias. Changes in the ability to measure the outcome or changes to its definition also threaten the validity of the study’s inferences. Finally, it is also important to remember that when the outcome is a population-level measurement, inferences about individual-level outcomes are inappropriate due to ecological fallacies (ie, when inferences about individuals are deduced from inferences about the group to which those individuals belong). For example, Coon et al found that infants with bronchiolitis in the ward-based high-flow nasal cannula protocol group had greater ICU admission rates. It would be inappropriate to conclude that, based on this, an individual infant in a hospital on a ward-based protocol is more likely to be admitted to the ICU.
CONCLUSION
Studies evaluating interventions and events are important for informing healthcare practice, policy, and public health. While an RCT is the preferred method for such evaluations, investigators must often consider alternative study designs when an RCT is not feasible or when more real-world outcome evaluation is desired. Quasi-experimental designs are employed in studies that do not use randomization to study the impact of interventions in real-world settings, and an interrupted time series is a strong QED for the evaluation of interventions and natural experiments.
1. Coon ER, Stoddard G, Brady PW. Intensive care unit utilization after adoption of a ward-based high flow nasal cannula protocol. J Hosp Med. 2020;15(6):325-330. https://doi.org/10.12788/jhm.3417
2. Handley MA, Lyles CR, McCulloch C, Cattamanchi A. Selecting and improving quasi-experimental designs in effectiveness and implementation research. Annu Rev Public Health. 2018;39:5-25. https://doi.org/10.1146/annurev-publhealth-040617-014128
3. Craig P, Katikireddi SV, Leyland A, Popham F. Natural experiments: an overview of methods, approaches, and contributions to public health intervention research. Annu Rev Public Health. 2017;38:39-56. https://doi.org/10.1146/annurev-publhealth-031816-044327
4. Craig P, Cooper C, Gunnell D, et al. Using natural experiments to evaluate population health interventions: new Medical Research Council guidance. J Epidemiol Community Health. 2012;66(12):1182-1186. https://doi.org/10.1136/jech-2011-200375
5. Coly A, Parry G. Evaluating Complex Health Interventions: A Guide to Rigorous Research Designs. AcademyHealth; 2017.
6. Orenstein EW, Rasooly IR, Mai MV, et al. Influence of simulation on electronic health record use patterns among pediatric residents. J Am Med Inform Assoc. 2018;25(11):1501-1506. https://doi.org/10.1093/jamia/ocy105
7. Penfold RB, Zhang F. Use of interrupted time series analysis in evaluating health care quality improvements. Acad Pediatr. 2013;13(6 Suppl):S38-S44. https://doi.org/10.1016/j.acap.2013.08.002
8. Wagner AK, Soumerai SB, Zhang F, Ross‐Degnan D. Segmented regression analysis of interrupted time series studies in medication use research. J Clin Pharm Ther. 2002;27(4):299-309. https://doi.org/10.1046/j.1365-2710.2002.00430.x
9. Desai NR, Ross JS, Kwon JY, et al. Association between hospital penalty status under the hospital readmission reduction program and readmission rates for target and nontarget conditions. JAMA. 2016;316(24):2647-2656. https://doi.org/10.1001/jama.2016.18533
10. Kahn JM, Davis BS, Yabes JG, et al. Association between state-mandated protocolized sepsis care and in-hospital mortality among adults with sepsis. JAMA. 2019;322(3):240-250. https://doi.org/10.1001/jama.2019.9021
11. Volpp KG, Rosen AK, Rosenbaum PR, et al. Mortality among hospitalized Medicare beneficiaries in the first 2 years following ACGME resident duty hour reform. JAMA. 2007;298(9):975-983. https://doi.org/10.1001/jama.298.9.975
12. Destino L, Bennett D, Wood M, et al. Improving patient flow: analysis of an initiative to improve early discharge. J Hosp Med. 2019;14(1):22-27. https://doi.org/10.12788/jhm.3133
13. Williams DJ, Hall M, Gerber JS, et al; Pediatric Research in Inpatient Settings Network. Impact of a national guideline on antibiotic selection for hospitalized pneumonia. Pediatrics. 2017;139(4):e20163231. https://doi.org/10.1542/peds.2016-3231
Hospital medicine research often asks the question whether an intervention, such as a policy or guideline, has improved quality of care and/or whether there were any unintended consequences. Alternatively, investigators may be interested in understanding the impact of an event, such as a natural disaster or a pandemic, on hospital care. The study design that provides the best estimate of the causal effect of the intervention is the randomized controlled trial (RCT). The goal of randomization, which can be implemented at the patient or cluster level (eg, hospitals), is attaining a balance of the known and unknown confounders between study groups.
However, an RCT may not be feasible for several reasons: complexity, insufficient setup time or funding, ethical barriers to randomization, unwillingness of funders or payers to withhold the intervention from patients (ie, the control group), or anticipated contamination of the intervention into the control group (eg, provider practice change interventions). In addition, it may be impossible to conduct an RCT because the investigator does not have control over the design of an intervention or because they are studying an event, such as a pandemic.
In the June 2020 issue of the Journal of Hospital Medicine, Coon et al1 use a type of quasi-experimental design (QED)—specifically, the interrupted time series (ITS)—to examine the impact of the adoption of ward-based high-flow nasal cannula protocols on intensive care unit (ICU) admission for bronchiolitis at children’s hospitals. In this methodologic progress note, we discuss QEDs for evaluating the impact of healthcare interventions or events and focus on ITS, one of the strongest QEDs.
WHAT IS A QUASI-EXPERIMENTAL DESIGN?
Quasi-experimental design refers to a broad range of nonrandomized or partially randomized pre- vs postintervention studies.2 In order to test a causal hypothesis without randomization, QEDs define a comparison group or a time period in which an intervention has not been implemented, as well as at least one group or time period in which an intervention has been implemented. In a QED, the control may lack similarity with the intervention group or time period because of differences in the patients, sites, or time period (sometimes referred to as having a “nonequivalent control group”). Several design and analytic approaches are available to enhance the extent to which the study is able to make conclusions about the causal impact of the intervention.2,3 Because randomization is not necessary, QEDs allow for inclusion of a broader population than that which is feasible by RCTs, which increases the applicability and generalizability of the results. Therefore, they are a powerful research design to test the effectiveness of interventions in real-world settings.
The choice of which QED depends on whether the investigators are conducting a prospective evaluation and have control over the study design (ie, the ordering of the intervention, selection of sites or individuals, and/or timing and frequency of the data collection) or whether the investigators do not have control over the intervention, which is also known as a “natural experiment.”4,5 Some studies may also incorporate two QEDs in tandem.6 The Table provides a brief summary of different QEDs, ordered by methodologic strength, and distinguishes those that can be used to study natural experiments. In the study by Coon et al,1 an ITS is used as opposed to a methodologically stronger QED, such as the stepped-wedge design, because the investigators did not have control over the rollout of heated high-flow nasal canula protocols across hospitals.
WHAT IS AN INTERRUPTED TIME SERIES?
Interrupted time series designs use repeated observations of an outcome over time. This method then divides, or “interrupts,” the series of data into two time periods: before the intervention or event and after. Using data from the preintervention period, an underlying trend in the outcome is estimated and assumed to continue forward into the postintervention period to estimate what would have occurred without the intervention. Any significant change in the outcome at the beginning of the postintervention period or change in the trend in the postintervention is then attributed to the intervention.
There are several important methodologic considerations when designing an ITS study, as detailed in other review papers.2,3,7,8 An ITS design can be retrospective or prospective. It can be of a single center or include multiple sites, as in Coon et al. It can be conducted with or without a control. The inclusion of a control, when appropriately chosen, improves the strength of the study design because it can account for seasonal trends and potential confounders that vary over time. The control can be a different group of hospitals or participants that are similar but did not receive the intervention, or it can be a different outcome in the same group of hospitals or participants that are not expected to be affected by the intervention. The ITS design may also be set up to estimate the individual effects of multicomponent interventions. If the different components are phased in sequentially over time, then it may be possible to interrupt the time series at these points and estimate the impact of each intervention component.
Other examples of ITS studies in hospital medicine include those that evaluated the impact of a readmission-reduction program,9 of state sepsis regulations on in-hospital mortality,10 of resident duty-hour reform on mortality among hospitalized patients,11 of a quality-improvement initiative on early discharge,12 and of national guidelines on pediatric pneumonia antibiotic selection.13 There are several types of ITS analysis, and in this article, we focus on segmented regression without a control group.7,8
WHAT IS A SEGMENTED REGRESSION ITS?
Segmented regression is the statistical model used to measure (a) the immediate change in the outcome (level) at the start of the intervention and (b) the change in the trend of the outcome (slope) in the postintervention period vs that in the preintervention period. Therefore, the intervention effect size is expressed in terms of the level change and the slope change. To function properly, the models require several repeated (eg, monthly) measurements of the outcome before and after the intervention. Some experts suggest a minimum of 4 to 12 observations, depending on a number of factors including the stability of the outcome and seasonal variations.7,8 If changes before and after more than one intervention are being examined, there should be the minimum number of observations separating them. Unlike typical regression models, time-series models can correct for autocorrelation if it is present in the data. Autocorrelation is the type of correlation that arises when data are collected over time, with those closest in time being more strongly correlated (there are also other types of autocorrelation, such as seasonal patterns). Using available statistical software, autocorrelation can be detected and, if present, it can be controlled for in the segmented regression models.
HOW ARE SEGMENTED REGRESSION RESULTS PRESENTED?
Coon et al present results of their ITS analysis in a panel of figures detailing each study outcome, ICU admission, ICU length of stay, total length of stay, and rates of mechanical ventilation. Each panel shows the rate of change in the outcome per season across hospitals, before and after adoption of heated high-flow nasal cannula protocols, and the level change at the time of adoption.
To further explain how segmented regression results are presented, in the Figure we detail the structure of a segmented regression figure evaluating the impact of an intervention without a control group. In addition to the regression figure, authors typically provide 95% CIs around the rates, level change, and the difference between the postintervention and preintervention periods, along with P values demonstrating whether the rates, level change, and the differences between period slopes differ significantly from zero.
WHAT ARE THE UNDERLYING ASSUMPTIONS OF THE SEGMENTED REGRESSION ITS?
Segmented regression models assume a linear trend in the outcome. If the outcome follows a nonlinear pattern (eg, exponential spread of a disease during a pandemic), then using different distributions in the modeling or transformations of the data may be necessary. The validity of the comparison between the pre- and postintervention groups relies on the similarity between the populations. When there is imbalance, investigators can consider matching based on important characteristics or applying risk adjustment as necessary. Another important assumption is that the outcome of interest is unchanged in the absence of the intervention. Finally, the analysis assumes that the intervention is fully implemented at the time the postintervention period begins. Often, there is a washout period during which the old approach is stopped and the new approach (the intervention) is being implemented and can easily be taken into account.
WHAT ARE THE STRENGTHS OF THE SEGMENTED REGRESSION ITS?
There are several strengths of the ITS analysis and segmented regression.7,8 First, this approach accounts for a possible secular trend in the outcome measure that may have been present prior to the intervention. For example, investigators might conclude that a readmissions program was effective in reducing readmissions if they found that the mean readmission percentage in the period after the intervention was significantly lower than before using a simple pre/post study design. However, what if the readmission rate was already going down prior to the intervention? Using an ITS approach, they may have found that the rate of readmissions simply continued to decrease after the intervention at the same rate that it was decreasing prior to the intervention and, therefore, conclude that the intervention was not effective. Second, because the ITS approach evaluates changes in rates of an outcome at a population level, confounding by individual-level variables will not introduce serious bias unless the confounding occurred at the same time as the intervention. Third, ITS can be used to measure the unintended consequences of interventions or events, and investigators can construct separate time-series analyses for different outcomes. Fourth, ITS can be used to evaluate the impact of the intervention on subpopulations (eg, those grouped by age, sex, race) by conducting stratified analysis. Fifth, ITS provides simple and clear graphical results that can be easily understood by various audiences.
WHAT ARE THE IMPORTANT LIMITATIONS OF AN ITS?
By accounting for preintervention trends, ITS studies permit stronger causal inference than do cross-sectional or simple pre/post QEDs, but they may by prone to confounding by cointerventions or by changes in the population composition. Causal inference based on the ITS analysis is only valid to the extent to which the intervention was the only thing that changed at the point in time between the preintervention and postintervention periods. It is important for investigators to consider this in the design and discuss any coincident interventions. If there are multiple interventions over time, it is possible to account for these changes in the study design by creating multiple points of interruption provided there are sufficient measurements of the outcome between interventions. If the composition of the population changes at the same time as the intervention, this introduces bias. Changes in the ability to measure the outcome or changes to its definition also threaten the validity of the study’s inferences. Finally, it is also important to remember that when the outcome is a population-level measurement, inferences about individual-level outcomes are inappropriate due to ecological fallacies (ie, when inferences about individuals are deduced from inferences about the group to which those individuals belong). For example, Coon et al found that infants with bronchiolitis in the ward-based high-flow nasal cannula protocol group had greater ICU admission rates. It would be inappropriate to conclude that, based on this, an individual infant in a hospital on a ward-based protocol is more likely to be admitted to the ICU.
CONCLUSION
Studies evaluating interventions and events are important for informing healthcare practice, policy, and public health. While an RCT is the preferred method for such evaluations, investigators must often consider alternative study designs when an RCT is not feasible or when more real-world outcome evaluation is desired. Quasi-experimental designs are employed in studies that do not use randomization to study the impact of interventions in real-world settings, and an interrupted time series is a strong QED for the evaluation of interventions and natural experiments.
1. Coon ER, Stoddard G, Brady PW. Intensive care unit utilization after adoption of a ward-based high flow nasal cannula protocol. J Hosp Med. 2020;15(6):325-330. https://doi.org/10.12788/jhm.3417
2. Handley MA, Lyles CR, McCulloch C, Cattamanchi A. Selecting and improving quasi-experimental designs in effectiveness and implementation research. Annu Rev Public Health. 2018;39:5-25. https://doi.org/10.1146/annurev-publhealth-040617-014128
3. Craig P, Katikireddi SV, Leyland A, Popham F. Natural experiments: an overview of methods, approaches, and contributions to public health intervention research. Annu Rev Public Health. 2017;38:39-56. https://doi.org/10.1146/annurev-publhealth-031816-044327
4. Craig P, Cooper C, Gunnell D, et al. Using natural experiments to evaluate population health interventions: new Medical Research Council guidance. J Epidemiol Community Health. 2012;66(12):1182-1186. https://doi.org/10.1136/jech-2011-200375
5. Coly A, Parry G. Evaluating Complex Health Interventions: A Guide to Rigorous Research Designs. AcademyHealth; 2017.
6. Orenstein EW, Rasooly IR, Mai MV, et al. Influence of simulation on electronic health record use patterns among pediatric residents. J Am Med Inform Assoc. 2018;25(11):1501-1506. https://doi.org/10.1093/jamia/ocy105
7. Penfold RB, Zhang F. Use of interrupted time series analysis in evaluating health care quality improvements. Acad Pediatr. 2013;13(6 Suppl):S38-S44. https://doi.org/10.1016/j.acap.2013.08.002
8. Wagner AK, Soumerai SB, Zhang F, Ross‐Degnan D. Segmented regression analysis of interrupted time series studies in medication use research. J Clin Pharm Ther. 2002;27(4):299-309. https://doi.org/10.1046/j.1365-2710.2002.00430.x
9. Desai NR, Ross JS, Kwon JY, et al. Association between hospital penalty status under the hospital readmission reduction program and readmission rates for target and nontarget conditions. JAMA. 2016;316(24):2647-2656. https://doi.org/10.1001/jama.2016.18533
10. Kahn JM, Davis BS, Yabes JG, et al. Association between state-mandated protocolized sepsis care and in-hospital mortality among adults with sepsis. JAMA. 2019;322(3):240-250. https://doi.org/10.1001/jama.2019.9021
11. Volpp KG, Rosen AK, Rosenbaum PR, et al. Mortality among hospitalized Medicare beneficiaries in the first 2 years following ACGME resident duty hour reform. JAMA. 2007;298(9):975-983. https://doi.org/10.1001/jama.298.9.975
12. Destino L, Bennett D, Wood M, et al. Improving patient flow: analysis of an initiative to improve early discharge. J Hosp Med. 2019;14(1):22-27. https://doi.org/10.12788/jhm.3133
13. Williams DJ, Hall M, Gerber JS, et al; Pediatric Research in Inpatient Settings Network. Impact of a national guideline on antibiotic selection for hospitalized pneumonia. Pediatrics. 2017;139(4):e20163231. https://doi.org/10.1542/peds.2016-3231
© 2021 Society of Hospital Medicine
Antibiotic Regimens and Associated Outcomes in Children Hospitalized With Staphylococcal Scalded Skin Syndrome
Staphylococcal scalded skin syndrome (SSSS) is an exfoliative toxin-mediated dermatitis that predominantly occurs in young children. Multiple recent reports indicate a rising incidence of this disease.1-4 Recommended treatment for SSSS includes antistaphylococcal antibiotics and supportive care measures.5,6 Elimination or reduction of the toxin-producing Staphylococcus aureus is thought to help limit disease progression and promote recovery. Experts advocate for the use of antibiotics even when there is no apparent focal source of infection, such as an abscess.6,7
Several factors may affect antibiotic selection, including the desire to inhibit toxin production and to target the causative pathogen in a bactericidal fashion. Because SSSS is toxin mediated, clindamycin is often recommended because of its inhibition of toxin synthesis.5,8 The clinical utility of adding other antibiotics to clindamycin for coverage of methicillin-sensitive S aureus (MSSA) or methicillin-resistant S aureus (MRSA) is uncertain. Several studies report MSSA to be the predominant pathogen identified by culture2,9; however, SSSS caused by MRSA has been reported.9-11 Additionally, bactericidal antibiotics (eg, nafcillin) have been considered to hold potential clinical advantage as compared with bacteriostatic antibiotics (eg, clindamycin), even though clinical studies have not clearly demonstrated this advantage in the general population.12,13 Some experts recommend additional MRSA or MSSA coverage (such as vancomycin or nafcillin) in patients with high illness severity or nonresponse to therapy, or in areas where there is high prevalence of staphylococcal resistance to clindamycin.5,7,9,14 Alternatively, for areas with low MRSA prevalence, monotherapy with an anti-MSSA antibiotic is another potential option. No recent studies have compared patient outcomes among antibiotic regimens in children with SSSS.
Knowledge of the outcomes associated with different antibiotic regimens for children hospitalized with SSSS is needed and could be used to improve patient outcomes and potentially promote antibiotic stewardship. In this study, our objectives were to (1) describe antibiotic regimens given to children hospitalized with SSSS, and (2) examine the association of three antibiotic regimens commonly used for SSSS (clindamycin monotherapy, clindamycin plus additional MSSA coverage, and clindamycin plus additional MRSA coverage) with patient outcomes of length of stay (LOS), treatment failure, and cost in a large cohort of children at US children’s hospitals.
METHODS
We conducted a multicenter, retrospective cohort study utilizing data within the Pediatric Health Information System (PHIS) database from July 1, 2011, to June 30, 2016. Thirty-five free-standing tertiary care US children’s hospitals within 24 states were included. The Children’s Hospital Association (Lenexa, Kansas) maintains the PHIS database, which contains de-identified patient information, including diagnoses (with International Classification of Diseases, Ninth and Tenth Revision, Clinical Modification [ICD-9-CM, ICD-10-CM]), demographics, procedures, and daily billing records. Data quality and reliability are confirmed by participating institutions and the Children’s Hospital Association.15 The local institutional review board (IRB) deemed the study exempt from formal IRB review, as patient information was de-identified.
Study Population
We included hospitalized children aged newborn to 18 years with a primary or secondary diagnosis of SSSS (ICD-9, 695.81; ICD-10, L00). Children whose primary presentation and admission were to a PHIS hospital were included; children transferred from another hospital were excluded. The following exclusion criteria were based on previously published methodology.16 Children with complex chronic medical conditions as classified by Feudtner et al17 were excluded, since these children may require a different treatment approach than the general pediatric population. In order to decrease diagnostic ambiguity, we excluded children if an alternative dermatologic diagnosis was recorded as a principal or secondary diagnosis (eg, Stevens-Johnson syndrome or scarlet fever).16 Finally, hospitals with fewer than 10 children with SSSS during the study period were excluded.
Antibiotic Regimen Groups
We used PHIS daily billing codes to determine the antibiotics received by the study population. Children were classified into antibiotic regimen groups based on whether they received specific antibiotic combinations. Antibiotics received on any day during the hospitalization, including in the emergency department (ED), were used to assign patients to regimen groups. Antibiotics were classified into regimen groups based on consensus among study investigators, which included two board-certified pediatric infectious diseases specialists (A.C., R.M.). Antibiotic group definitions are listed in Table 1. Oral and intravenous (IV) therapies were grouped together for clindamycin, cephalexin/cefazolin, and linezolid because of good oral bioavailability in most situations.18 The three most common antistaphylococcal groups were chosen for further analysis: clindamycin alone, clindamycin plus MSSA coverage, and clindamycin plus MRSA coverage. The clindamycin group was defined as children with receipt of oral or IV clindamycin. Children who received clindamycin with additional MSSA coverage, such as cefazolin or nafcillin, were categorized as the clindamycin plus MSSA group. Children who received clindamycin with additional MRSA coverage, such as vancomycin or linezolid, were categorized as the clindamycin plus MRSA group. We chose not to include children who received the above regimens plus other antibiotics with partial antistaphylococcal activity, such as ampicillin, gentamicin, or ceftriaxone, in the clindamycin plus MSSA and clindamycin plus MRSA groups. We excluded these antibiotics to decrease the heterogeneity in the definition of regimen groups and allow a more direct comparison for effectiveness.

Covariates
Covariates included age, sex, ethnicity and/or race, payer type, level of care, illness severity, and region. The variable definitions below are in keeping with a prior study of SSSS.16 Age was categorized as: birth to 59 days, 2 to 11 months, 1 to 4 years (preschool age), 5 to 10 years (school age), and 11 to 18 years (adolescent). We examined infants younger than 60 days separately from older infants because this population may warrant additional treatment considerations. Race and ethnicity were categorized as White (non-Hispanic), African American (non-Hispanic), Hispanic, or other. Payer types included government, private, or other. Level of care was assigned as either intensive care or acute care. Illness severity was assigned using the All Patient Refined Diagnosis Related Group (APR-DRG; 3M Corporation, St. Paul, Minnesota) severity levels.19 In line with a prior study,16 we defined “low illness severity” as the APR-DRG minor (1) classification. The moderate (2), major (3), and extreme (4) classifications were defined as “moderate to high illness severity,” since there were very few classifications of major or extreme (<5%) illness severity. We categorized hospitals into the following US regions: Northeast, Midwest, South, and West.
Outcome Measures
The primary outcome was hospital LOS in days, and secondary outcomes were treatment failure and hospital costs. Hospital LOS was chosen as the primary outcome to represent the time needed for the child to show clinical improvement. Treatment failure was defined as a same-cause 14-day ED revisit or hospital readmission, and these were determined to be same-cause if a diagnosis for SSSS (ICD-9, 695.81; ICD-10, L00) was documented for the return encounter. The 14-day interval for readmission and ED revisit was chosen to measure any relapse of symptoms after completion of antibiotic therapy, similar to a prior study of treatment failure in skin and soft tissue infections.20 Total costs of the hospitalization were estimated from charges using hospital- and year-specific cost-to-charge ratios. Subcategories of cost, including clinical, pharmacy, imaging, laboratory, supply, and other, were also compared among the three groups.
Statistical Analysis
Demographic and clinical characteristics of children were summarized using frequencies and percentages for categorical variables and medians with interquartile ranges (IQRs) for continuous variables. These were compared across antibiotic groups using chi-square and Kruskal–Wallis tests, respectively. In unadjusted analyses, outcomes were compared across antibiotic regimen groups using these same statistical tests. In order to account for patient clustering within hospitals, generalized linear mixed-effects models were used to model outcomes with a random intercept for each hospital. Models were adjusted for SSSS being listed as a principal or secondary diagnosis, race, illness severity, and level of care. We log-transformed LOS and cost data prior to modeling because of the nonnormal distributions for these data. Owing to the inability to measure the number of antibiotic doses, and to reduce the possibility of including children who received few regimen-defined combination antibiotics, a post hoc sensitivity analysis was performed. This analysis used an alternative definition for antibiotic regimen groups, for which children admitted for 2 or more calendar days must have received regimen-specified antibiotics on at least 2 days of the admission. Additionally, outcomes were stratified by low and moderate/high illness severity and compared across the three antibiotic regimen groups. All analyses were performed with SAS (SAS 9.4; SAS Institute, Cary, North Carolina), and P values of less than .05 were considered statistically significant.
RESULTS
Overall, 1,815 hospitalized children with SSSS were identified in the PHIS database, and after application of the exclusion criteria, 1,259 children remained, with 1,247 (99%) receiving antibiotics (Figure). The antibiotic regimens received by these children are described in Table 1. Of these, 828 children (66%) received one of the three most common antistaphylococcal regimens (clindamycin, clindamycin + MSSA, and clindamycin + MRSA) and were included for further analysis.

Characteristics of the 828 children are presented in Table 2. Most children (82%) were aged 4 years or younger, and distributions of age, sex, and insurance payer were similar among children receiving the three regimens. Thirty-two percent had moderate to high illness severity, and 3.5% required management in the intensive care setting. Of the three antibiotic regimens, clindamycin monotherapy was most common (47%), followed by clindamycin plus MSSA coverage (33%), and clindamycin plus MRSA coverage (20%). A higher proportion of children in the clindamycin plus MRSA group were African American and were hospitalized in the South. Children receiving clindamycin plus MRSA coverage had higher illness severity (44%) as compared with clindamycin monotherapy (28%) and clindamycin plus MSSA coverage (32%) (P = .001). Additionally, a larger proportion of children treated with clindamycin plus MRSA coverage were managed in the intensive care setting as compared with the clindamycin plus MSSA or clindamycin monotherapy groups.

Among the 828 children with SSSS, the median LOS was 2 days (IQR, 2-3), and treatment failure was 1.1% (95% CI, 0.4-1.8). After adjustment for illness severity, race, payer, and region (Table 3), the three antibiotic regimens were not associated with significant differences in LOS or treatment failure. Costs were significantly different among the three antibiotic regimens. Clindamycin plus MRSA coverage was associated with the greatest costs, whereas clindamycin monotherapy was associated with the lowest costs (mean, $5,348 vs $4,839, respectively; P < .001) (Table 3). In a sensitivity analysis using an alternative antibiotic regimen definition, we found results in line with the primary analysis, with no statistically significant differences in LOS (P = .44) or treatment failure (P = .54), but significant differences in cost (P < .001). Additionally, the same findings were present for LOS, treatment failure, and cost when outcomes were stratified by illness severity (Appendix Table). However, significant contributors to the higher cost in the clindamycin plus MRSA group did vary by illness severity stratification. Laboratory, supply, and pharmacy cost categories differed significantly among antibiotic groups for the low illness severity strata, whereas pharmacy was the only significant cost category difference in moderate/high illness severity.

DISCUSSION
Clindamycin monotherapy, clindamycin plus MSSA coverage, and clindamycin plus MRSA coverage are the most commonly administered antistaphylococcal antibiotic regimens for children hospitalized with SSSS at US children’s hospitals. Our multicenter study found that, across these antistaphylococcal antibiotic regimens, there were no associated differences in hospital LOS or treatment failure. However, the antibiotic regimens were associated with significant differences in overall hospital costs. These findings suggest that the use of clindamycin with additional MSSA or MRSA antibiotic coverage for children with SSSS may not be associated with additional clinical benefit, as compared with clindamycin monotherapy, and could potentially be more costly.
Prior literature describing LOS in relation to antibiotic use for children with SSSS is limited. Authors of a recent case series of 21 children in Philadelphia reported approximately 50% of children received clindamycin monotherapy or combination therapy, but patient outcomes such as LOS were not described.9 Clindamycin use and outcomes have been described in smaller studies and case reports of SSSS, which reported positive outcomes such as patient recovery and lack of disease recurrence.2,9,21 A small retrospective, comparative effectiveness study of 30 neonates with SSSS examined beta-lactamase–resistant penicillin use with and without cephalosporins. They found no effect on LOS, but findings were limited by a small sample size.22 Our study cohort included relatively few neonates, and thus our findings may not be applicable to this population subgroup. We chose not to include regimens with third-generation cephalosporins or ampicillin, which may have limited the number of included neonates, because these antibiotics are frequently administered during evaluation for invasive bacterial infections.23 We found a very low occurrence of treatment failure in our study cohort across all three groups, which is consistent with other studies of SSSS that report an overall good prognosis and low recurrence and/or readmission rates.6,16,24 The low prevalence of treatment failure, however, precluded our ability to detect small differences among antibiotic regimen groups that may exist.
We observed that cost differed significantly across antibiotic regimen groups, with lowest cost associated with clindamycin monotherapy in adjusted analysis despite similar LOS. Even with our illness-severity adjustment, there may have been other unmeasured factors resulting in the higher cost associated with the combination groups. Hence, we also examined cost breakdown with a stratified analysis by illness severity. We found that pharmacy costs were significantly different among antibiotic groups in both illness severity strata, whereas those with low illness severity also differed by laboratory and supply costs. Thus, pharmacy cost differences may be the largest driver in the cost differential among groups. Lower cost in the clindamycin monotherapy group is likely due to administration of a single antibiotic. The reason for supply and laboratory cost differences is uncertain, but higher cost in the clindamycin plus MRSA group could possibly be from laboratory testing related to drug monitoring (eg, renal function testing or drug levels). While other studies have reported costs for hospitalized children with SSSS associated with different patient characteristics or diagnostic testing,1,16 to our knowledge, no other studies have reported cost related to antibiotic regimens for SSSS. As healthcare reimbursements shift to value-based models, identifying treatment regimens with equal efficacy but lower cost will become increasingly important. Future studies should also examine other covariates and outcomes, such as oral vs parenteral antibiotic use, use of monitoring laboratories related to antibiotic choice, and adverse drug effects.
Several strengths and additional limitations apply to our study. Our study is one of the few to describe outcomes associated with antibiotic regimens for children with SSSS. With the PHIS database, we were able to include a large number of children with SSSS from children’s hospitals across the United States. Although the PHIS database affords these strengths, there are limitations inherent to administrative data. Children with SSSS were identified by documented ICD-9 and ICD-10 diagnostic codes, which might lead to misclassification. However, misclassification is less likely because only one ICD-9 and ICD-10 code exists for SSSS, and the characteristics of this condition are specific. Also, diagnostic codes for other dermatologic conditions (eg, scarlet fever) were excluded to further reduce the chance of misclassification. A limitation to our use of PHIS billing codes was the inability to confirm the dosage of antibiotics given, the number of doses, or whether antibiotics were prescribed upon discharge. Another limitation is that children whose antibiotic therapy was changed during hospitalization (eg, from clindamycin monotherapy to cefazolin monotherapy) were categorized into the combination groups. However, the sensitivity analysis performed based on a stricter antibiotic group definition (receipt of both antibiotics on at least 2 calendar days) did not alter the outcomes, which is reassuring. We were unable to assess the use of targeted antibiotic therapy because clinical data (eg, microbiology results) were not available. However, this may be less important because some literature suggests that cultures for S aureus are obtained infrequently2 and may be difficult to interpret when obtained,25 since culture growth can represent colonization rather than causative strains. An additional limitation is that administrative data do not include certain clinical outcomes, such as fever duration or degree of skin involvement, which could have differed among the groups. Last, the PHIS database only captures revisits or readmissions to PHIS hospitals, and so we are unable to exclude the possibility of a child being seen at or readmitted to another hospital.
Due to the observational design of this study and potential for incomplete measurement of illness severity, we recommend a future prospective trial with randomization to confirm these findings. One possible reason that LOS did not differ among groups is that the burden of clindamycin-resistant strains in our cohort could be low, and the addition of MSSA or MRSA coverage does not result in a clinically important increase in S aureus coverage. However, pooled pediatric hospital antibiogram data suggest the overall rate of clindamycin resistance is close to 20% in hospitals located in all US regions.26 Limited studies also suggest that MSSA may be the predominant pathogen associated with SSSS.2,9 To address this, future randomized trials could compare the effectiveness of clindamycin monotherapy to MSSA-specific agents like cefazolin or nafcillin. Unfortunately, anti-MSSA monotherapy was not evaluated in our study because very few children received this treatment. Using monotherapy as opposed to multiple antibiotics has the potential to promote antibiotic stewardship for antistaphylococcal antibiotics in the management of SSSS. Reducing unnecessary antibiotic use not only potentially affects antibiotic resistance, but could also benefit patients in reducing possible side effects, cost, and IV catheter complications.27 However, acknowledging our study limitations, our findings should be applied cautiously in clinical settings, in the context of local antibiogram data, individual culture results, and specific patient factors. The local clindamycin resistance rate for both MSSA and MRSA should be considered. Many antibiotics chosen to treat MRSA—such as vancomycin and trimethoprim/sulfamethoxazole—will also have anti-MSSA activity and may have lower local resistance rates than clindamycin. Practitioners may also consider how each antibiotic kills bacteria; for example, beta-lactams rely on bacterial replication, but clindamycin does not. Each factor should influence how empiric treatment, whether monotherapy or combination, is chosen for children with SSSS.
CONCLUSION
In this large, multicenter cohort of hospitalized children with SSSS, we found that the addition of MSSA or MRSA coverage to clindamycin monotherapy was not associated with differences in outcomes of hospital LOS and treatment failure. Furthermore, clindamycin monotherapy was associated with lower overall cost. Prospective randomized studies are needed to confirm these findings and assess whether clindamycin monotherapy, monotherapy with an anti-MSSA antibiotic, or alternative regimens are most effective for treatment of children with SSSS.
1. Staiman A, Hsu DY, Silverberg JI. Epidemiology of staphylococcal scalded skin syndrome in United States children. Br J Dermatol. 2018;178(3):704-708. https://doi.org/10.1111/bjd.16097
2. Hulten KG, Kok M, King KE, Lamberth LB, Kaplan SL. Increasing numbers of staphylococcal scalded skin syndrome cases caused by ST121 in Houston, TX. Pediatr Infect Dis J. 2020;39(1):30-34. https://doi.org/10.1097/INF.0000000000002499
3. Arnold JD, Hoek SN, Kirkorian AY. Epidemiology of staphylococcal scalded skin syndrome in the United States: A cross-sectional study, 2010-2014. J Am Acad Dermatol. 2018;78(2):404-406. https://doi.org/10.1016/j.jaad.2017.09.023
4. Hayward A, Knott F, Petersen I, et al. Increasing hospitalizations and general practice prescriptions for community-onset staphylococcal disease, England. Emerg Infect Dis. 2008;14(5):720-726. https://doi.org/10.3201/eid1405.070153
5. Berk DR, Bayliss SJ. MRSA, staphylococcal scalded skin syndrome, and other cutaneous bacterial emergencies. Pediatr Ann. 2010;39(10):627-633. https://doi.org/10.3928/00904481-20100922-02
6. Ladhani S, Joannou CL, Lochrie DP, Evans RW, Poston SM. Clinical, microbial, and biochemical aspects of the exfoliative toxins causing staphylococcal scalded-skin syndrome. Clin Microbiol Rev. 1999;12(2):224-242.
7. Handler MZ, Schwartz RA. Staphylococcal scalded skin syndrome: diagnosis and management in children and adults. J Eur Acad Dermatol Venereol. 2014;28(11):1418-1423. https://doi.org/10.1111/jdv.12541
8. Hodille E, Rose W, Diep BA, Goutelle S, Lina G, Dumitrescu O. The role of antibiotics in modulating virulence in Staphylococcus aureus. Clin Microbiol Rev. 2017;30(4):887-917. https://doi.org/10.1128/CMR.00120-16
9. Braunstein I, Wanat KA, Abuabara K, McGowan KL, Yan AC, Treat JR. Antibiotic sensitivity and resistance patterns in pediatric staphylococcal scalded skin syndrome. Pediatr Dermatol. 2014;31(3):305-308. https://doi.org/10.1111/pde.12195
10. Yamaguchi T, Yokota Y, Terajima J, et al. Clonal association of Staphylococcus aureus causing bullous impetigo and the emergence of new methicillin-resistant clonal groups in Kansai district in Japan. J Infect Dis. 2002;185(10):1511-1516. https://doi.org/10.1086/340212
11. Noguchi N, Nakaminami H, Nishijima S, Kurokawa I, So H, Sasatsu M. Antimicrobial agent of susceptibilities and antiseptic resistance gene distribution among methicillin-resistant Staphylococcus aureus isolates from patients with impetigo and staphylococcal scalded skin syndrome. J Clin Microbiol. 2006;44(6):2119-2125. https://doi.org/10.1128/JCM.02690-05
12. Pankey GA, Sabath LD. Clinical relevance of bacteriostatic versus bactericidal mechanisms of action in the treatment of Gram-positive bacterial infections. Clin Infect Dis. 2004;38(6):864-870. https://doi.org/10.1086/381972
13. Wald-Dickler N, Holtom P, Spellberg B. Busting the myth of “static vs cidal”: a systemic literature review. Clin Infect Dis. 2018;66(9):1470-1474. https://doi.org/10.1093/cid/cix1127
14. Ladhani S, Joannou CL. Difficulties in diagnosis and management of the staphylococcal scalded skin syndrome. Pediatr Infect Dis J. 2000;19(9):819-821. https://doi.org/10.1097/00006454-200009000-00002
15. Mongelluzzo J, Mohamad Z, Ten Have TR, Shah SS. Corticosteroids and mortality in children with bacterial meningitis. JAMA. 2008;299(17):2048-2055. https://doi.org/10.1001/jama.299.17.2048
16. Neubauer HC, Hall M, Wallace SS, et al. Variation in diagnostic test use and associated outcomes in staphylococcal scalded skin syndrome at children’s hospitals. Hosp Pediatr. 2018;8(9):530-537. https://doi.org/10.1542/hpeds.2018-0032
17. Feudtner C, Feinstein JA, Zhong W, Hall M, Dai D. Pediatric complex chronic conditions classification system version 2: updated for ICD-10 and complex medical technology dependence and transplantation. BMC Pediatr. 2014;14:199. https://doi.org/10.1186/1471-2431-14-199
18. Sauberan JS, Bradley JS. Antimicrobial agents. In: Long SS, ed. Principles and Practice of Pediatric Infectious Diseases. Elsevier; 2018:1499-1531.
19. Sedman AB, Bahl V, Bunting E, et al. Clinical redesign using all patient refined diagnosis related groups. Pediatrics. 2004;114(4):965-969. https://doi.org/10.1542/peds.2004-0650
20. Williams DJ, Cooper WO, Kaltenbach LA, et al. Comparative effectiveness of antibiotic treatment strategies for pediatric skin and soft-tissue infections. Pediatrics. 2011;128(3):e479-487. https://doi.org/10.1542/peds.2010-3681
21. Haasnoot PJ, De Vries A. Staphylococcal scalded skin syndrome in a 4-year-old child: a case report. J Med Case Rep. 2018;12(1):20. https://doi.org/ 10.1186/s13256-017-1533-7
22. Li MY, Hua Y, Wei GH, Qiu L. Staphylococcal scalded skin syndrome in neonates: an 8-year retrospective study in a single institution. Pediatr Dermatol. 2014;31(1):43-47. https://doi.org/10.1111/pde.12114
23. Markham JL, Hall M, Queen MA, et al. Variation in antibiotic selection and clinical outcomes in infants <60 days hospitalized with skin and soft tissue infections. Hosp Pediatr. 2019;9(1):30-38. https://doi.org/10.1542/hpeds.2017-0237
24. Davidson J, Polly S, Hayes PJ, Fisher KR, Talati AJ, Patel T. Recurrent staphylococcal scalded skin syndrome in an extremely low-birth-weight neonate. AJP Rep. 2017;7(2):e134-e137. https://doi.org/10.1055/s-0037-1603971
25. Ladhani S, Robbie S, Chapple DS, Joannou CL, Evans RW. Isolating Staphylococcus aureus from children with suspected Staphylococcal scalded skin syndrome is not clinically useful. Pediatr Infect Dis J. 2003;22(3):284-286.
26. Tamma PD, Robinson GL, Gerber JS, et al. Pediatric antimicrobial susceptibility trends across the United States. Infect Control Hosp Epidemiol. 2013;34(12):1244-1251. https://doi.org/10.1086/673974
27. Unbeck M, Forberg U, Ygge BM, Ehrenberg A, Petzold M, Johansson E. Peripheral venous catheter related complications are common among paediatric and neonatal patients. Acta Paediatr. 2015;104(6):566-574. https://doi.org/10.1111/apa.12963
Staphylococcal scalded skin syndrome (SSSS) is an exfoliative toxin-mediated dermatitis that predominantly occurs in young children. Multiple recent reports indicate a rising incidence of this disease.1-4 Recommended treatment for SSSS includes antistaphylococcal antibiotics and supportive care measures.5,6 Elimination or reduction of the toxin-producing Staphylococcus aureus is thought to help limit disease progression and promote recovery. Experts advocate for the use of antibiotics even when there is no apparent focal source of infection, such as an abscess.6,7
Several factors may affect antibiotic selection, including the desire to inhibit toxin production and to target the causative pathogen in a bactericidal fashion. Because SSSS is toxin mediated, clindamycin is often recommended because of its inhibition of toxin synthesis.5,8 The clinical utility of adding other antibiotics to clindamycin for coverage of methicillin-sensitive S aureus (MSSA) or methicillin-resistant S aureus (MRSA) is uncertain. Several studies report MSSA to be the predominant pathogen identified by culture2,9; however, SSSS caused by MRSA has been reported.9-11 Additionally, bactericidal antibiotics (eg, nafcillin) have been considered to hold potential clinical advantage as compared with bacteriostatic antibiotics (eg, clindamycin), even though clinical studies have not clearly demonstrated this advantage in the general population.12,13 Some experts recommend additional MRSA or MSSA coverage (such as vancomycin or nafcillin) in patients with high illness severity or nonresponse to therapy, or in areas where there is high prevalence of staphylococcal resistance to clindamycin.5,7,9,14 Alternatively, for areas with low MRSA prevalence, monotherapy with an anti-MSSA antibiotic is another potential option. No recent studies have compared patient outcomes among antibiotic regimens in children with SSSS.
Knowledge of the outcomes associated with different antibiotic regimens for children hospitalized with SSSS is needed and could be used to improve patient outcomes and potentially promote antibiotic stewardship. In this study, our objectives were to (1) describe antibiotic regimens given to children hospitalized with SSSS, and (2) examine the association of three antibiotic regimens commonly used for SSSS (clindamycin monotherapy, clindamycin plus additional MSSA coverage, and clindamycin plus additional MRSA coverage) with patient outcomes of length of stay (LOS), treatment failure, and cost in a large cohort of children at US children’s hospitals.
METHODS
We conducted a multicenter, retrospective cohort study utilizing data within the Pediatric Health Information System (PHIS) database from July 1, 2011, to June 30, 2016. Thirty-five free-standing tertiary care US children’s hospitals within 24 states were included. The Children’s Hospital Association (Lenexa, Kansas) maintains the PHIS database, which contains de-identified patient information, including diagnoses (with International Classification of Diseases, Ninth and Tenth Revision, Clinical Modification [ICD-9-CM, ICD-10-CM]), demographics, procedures, and daily billing records. Data quality and reliability are confirmed by participating institutions and the Children’s Hospital Association.15 The local institutional review board (IRB) deemed the study exempt from formal IRB review, as patient information was de-identified.
Study Population
We included hospitalized children aged newborn to 18 years with a primary or secondary diagnosis of SSSS (ICD-9, 695.81; ICD-10, L00). Children whose primary presentation and admission were to a PHIS hospital were included; children transferred from another hospital were excluded. The following exclusion criteria were based on previously published methodology.16 Children with complex chronic medical conditions as classified by Feudtner et al17 were excluded, since these children may require a different treatment approach than the general pediatric population. In order to decrease diagnostic ambiguity, we excluded children if an alternative dermatologic diagnosis was recorded as a principal or secondary diagnosis (eg, Stevens-Johnson syndrome or scarlet fever).16 Finally, hospitals with fewer than 10 children with SSSS during the study period were excluded.
Antibiotic Regimen Groups
We used PHIS daily billing codes to determine the antibiotics received by the study population. Children were classified into antibiotic regimen groups based on whether they received specific antibiotic combinations. Antibiotics received on any day during the hospitalization, including in the emergency department (ED), were used to assign patients to regimen groups. Antibiotics were classified into regimen groups based on consensus among study investigators, which included two board-certified pediatric infectious diseases specialists (A.C., R.M.). Antibiotic group definitions are listed in Table 1. Oral and intravenous (IV) therapies were grouped together for clindamycin, cephalexin/cefazolin, and linezolid because of good oral bioavailability in most situations.18 The three most common antistaphylococcal groups were chosen for further analysis: clindamycin alone, clindamycin plus MSSA coverage, and clindamycin plus MRSA coverage. The clindamycin group was defined as children with receipt of oral or IV clindamycin. Children who received clindamycin with additional MSSA coverage, such as cefazolin or nafcillin, were categorized as the clindamycin plus MSSA group. Children who received clindamycin with additional MRSA coverage, such as vancomycin or linezolid, were categorized as the clindamycin plus MRSA group. We chose not to include children who received the above regimens plus other antibiotics with partial antistaphylococcal activity, such as ampicillin, gentamicin, or ceftriaxone, in the clindamycin plus MSSA and clindamycin plus MRSA groups. We excluded these antibiotics to decrease the heterogeneity in the definition of regimen groups and allow a more direct comparison for effectiveness.
Covariates
Covariates included age, sex, ethnicity and/or race, payer type, level of care, illness severity, and region. The variable definitions below are in keeping with a prior study of SSSS.16 Age was categorized as: birth to 59 days, 2 to 11 months, 1 to 4 years (preschool age), 5 to 10 years (school age), and 11 to 18 years (adolescent). We examined infants younger than 60 days separately from older infants because this population may warrant additional treatment considerations. Race and ethnicity were categorized as White (non-Hispanic), African American (non-Hispanic), Hispanic, or other. Payer types included government, private, or other. Level of care was assigned as either intensive care or acute care. Illness severity was assigned using the All Patient Refined Diagnosis Related Group (APR-DRG; 3M Corporation, St. Paul, Minnesota) severity levels.19 In line with a prior study,16 we defined “low illness severity” as the APR-DRG minor (1) classification. The moderate (2), major (3), and extreme (4) classifications were defined as “moderate to high illness severity,” since there were very few classifications of major or extreme (<5%) illness severity. We categorized hospitals into the following US regions: Northeast, Midwest, South, and West.
Outcome Measures
The primary outcome was hospital LOS in days, and secondary outcomes were treatment failure and hospital costs. Hospital LOS was chosen as the primary outcome to represent the time needed for the child to show clinical improvement. Treatment failure was defined as a same-cause 14-day ED revisit or hospital readmission, and these were determined to be same-cause if a diagnosis for SSSS (ICD-9, 695.81; ICD-10, L00) was documented for the return encounter. The 14-day interval for readmission and ED revisit was chosen to measure any relapse of symptoms after completion of antibiotic therapy, similar to a prior study of treatment failure in skin and soft tissue infections.20 Total costs of the hospitalization were estimated from charges using hospital- and year-specific cost-to-charge ratios. Subcategories of cost, including clinical, pharmacy, imaging, laboratory, supply, and other, were also compared among the three groups.
Statistical Analysis
Demographic and clinical characteristics of children were summarized using frequencies and percentages for categorical variables and medians with interquartile ranges (IQRs) for continuous variables. These were compared across antibiotic groups using chi-square and Kruskal–Wallis tests, respectively. In unadjusted analyses, outcomes were compared across antibiotic regimen groups using these same statistical tests. In order to account for patient clustering within hospitals, generalized linear mixed-effects models were used to model outcomes with a random intercept for each hospital. Models were adjusted for SSSS being listed as a principal or secondary diagnosis, race, illness severity, and level of care. We log-transformed LOS and cost data prior to modeling because of the nonnormal distributions for these data. Owing to the inability to measure the number of antibiotic doses, and to reduce the possibility of including children who received few regimen-defined combination antibiotics, a post hoc sensitivity analysis was performed. This analysis used an alternative definition for antibiotic regimen groups, for which children admitted for 2 or more calendar days must have received regimen-specified antibiotics on at least 2 days of the admission. Additionally, outcomes were stratified by low and moderate/high illness severity and compared across the three antibiotic regimen groups. All analyses were performed with SAS (SAS 9.4; SAS Institute, Cary, North Carolina), and P values of less than .05 were considered statistically significant.
RESULTS
Overall, 1,815 hospitalized children with SSSS were identified in the PHIS database, and after application of the exclusion criteria, 1,259 children remained, with 1,247 (99%) receiving antibiotics (Figure). The antibiotic regimens received by these children are described in Table 1. Of these, 828 children (66%) received one of the three most common antistaphylococcal regimens (clindamycin, clindamycin + MSSA, and clindamycin + MRSA) and were included for further analysis.
Characteristics of the 828 children are presented in Table 2. Most children (82%) were aged 4 years or younger, and distributions of age, sex, and insurance payer were similar among children receiving the three regimens. Thirty-two percent had moderate to high illness severity, and 3.5% required management in the intensive care setting. Of the three antibiotic regimens, clindamycin monotherapy was most common (47%), followed by clindamycin plus MSSA coverage (33%), and clindamycin plus MRSA coverage (20%). A higher proportion of children in the clindamycin plus MRSA group were African American and were hospitalized in the South. Children receiving clindamycin plus MRSA coverage had higher illness severity (44%) as compared with clindamycin monotherapy (28%) and clindamycin plus MSSA coverage (32%) (P = .001). Additionally, a larger proportion of children treated with clindamycin plus MRSA coverage were managed in the intensive care setting as compared with the clindamycin plus MSSA or clindamycin monotherapy groups.
Among the 828 children with SSSS, the median LOS was 2 days (IQR, 2-3), and treatment failure was 1.1% (95% CI, 0.4-1.8). After adjustment for illness severity, race, payer, and region (Table 3), the three antibiotic regimens were not associated with significant differences in LOS or treatment failure. Costs were significantly different among the three antibiotic regimens. Clindamycin plus MRSA coverage was associated with the greatest costs, whereas clindamycin monotherapy was associated with the lowest costs (mean, $5,348 vs $4,839, respectively; P < .001) (Table 3). In a sensitivity analysis using an alternative antibiotic regimen definition, we found results in line with the primary analysis, with no statistically significant differences in LOS (P = .44) or treatment failure (P = .54), but significant differences in cost (P < .001). Additionally, the same findings were present for LOS, treatment failure, and cost when outcomes were stratified by illness severity (Appendix Table). However, significant contributors to the higher cost in the clindamycin plus MRSA group did vary by illness severity stratification. Laboratory, supply, and pharmacy cost categories differed significantly among antibiotic groups for the low illness severity strata, whereas pharmacy was the only significant cost category difference in moderate/high illness severity.
DISCUSSION
Clindamycin monotherapy, clindamycin plus MSSA coverage, and clindamycin plus MRSA coverage are the most commonly administered antistaphylococcal antibiotic regimens for children hospitalized with SSSS at US children’s hospitals. Our multicenter study found that, across these antistaphylococcal antibiotic regimens, there were no associated differences in hospital LOS or treatment failure. However, the antibiotic regimens were associated with significant differences in overall hospital costs. These findings suggest that the use of clindamycin with additional MSSA or MRSA antibiotic coverage for children with SSSS may not be associated with additional clinical benefit, as compared with clindamycin monotherapy, and could potentially be more costly.
Prior literature describing LOS in relation to antibiotic use for children with SSSS is limited. Authors of a recent case series of 21 children in Philadelphia reported approximately 50% of children received clindamycin monotherapy or combination therapy, but patient outcomes such as LOS were not described.9 Clindamycin use and outcomes have been described in smaller studies and case reports of SSSS, which reported positive outcomes such as patient recovery and lack of disease recurrence.2,9,21 A small retrospective, comparative effectiveness study of 30 neonates with SSSS examined beta-lactamase–resistant penicillin use with and without cephalosporins. They found no effect on LOS, but findings were limited by a small sample size.22 Our study cohort included relatively few neonates, and thus our findings may not be applicable to this population subgroup. We chose not to include regimens with third-generation cephalosporins or ampicillin, which may have limited the number of included neonates, because these antibiotics are frequently administered during evaluation for invasive bacterial infections.23 We found a very low occurrence of treatment failure in our study cohort across all three groups, which is consistent with other studies of SSSS that report an overall good prognosis and low recurrence and/or readmission rates.6,16,24 The low prevalence of treatment failure, however, precluded our ability to detect small differences among antibiotic regimen groups that may exist.
We observed that cost differed significantly across antibiotic regimen groups, with lowest cost associated with clindamycin monotherapy in adjusted analysis despite similar LOS. Even with our illness-severity adjustment, there may have been other unmeasured factors resulting in the higher cost associated with the combination groups. Hence, we also examined cost breakdown with a stratified analysis by illness severity. We found that pharmacy costs were significantly different among antibiotic groups in both illness severity strata, whereas those with low illness severity also differed by laboratory and supply costs. Thus, pharmacy cost differences may be the largest driver in the cost differential among groups. Lower cost in the clindamycin monotherapy group is likely due to administration of a single antibiotic. The reason for supply and laboratory cost differences is uncertain, but higher cost in the clindamycin plus MRSA group could possibly be from laboratory testing related to drug monitoring (eg, renal function testing or drug levels). While other studies have reported costs for hospitalized children with SSSS associated with different patient characteristics or diagnostic testing,1,16 to our knowledge, no other studies have reported cost related to antibiotic regimens for SSSS. As healthcare reimbursements shift to value-based models, identifying treatment regimens with equal efficacy but lower cost will become increasingly important. Future studies should also examine other covariates and outcomes, such as oral vs parenteral antibiotic use, use of monitoring laboratories related to antibiotic choice, and adverse drug effects.
Several strengths and additional limitations apply to our study. Our study is one of the few to describe outcomes associated with antibiotic regimens for children with SSSS. With the PHIS database, we were able to include a large number of children with SSSS from children’s hospitals across the United States. Although the PHIS database affords these strengths, there are limitations inherent to administrative data. Children with SSSS were identified by documented ICD-9 and ICD-10 diagnostic codes, which might lead to misclassification. However, misclassification is less likely because only one ICD-9 and ICD-10 code exists for SSSS, and the characteristics of this condition are specific. Also, diagnostic codes for other dermatologic conditions (eg, scarlet fever) were excluded to further reduce the chance of misclassification. A limitation to our use of PHIS billing codes was the inability to confirm the dosage of antibiotics given, the number of doses, or whether antibiotics were prescribed upon discharge. Another limitation is that children whose antibiotic therapy was changed during hospitalization (eg, from clindamycin monotherapy to cefazolin monotherapy) were categorized into the combination groups. However, the sensitivity analysis performed based on a stricter antibiotic group definition (receipt of both antibiotics on at least 2 calendar days) did not alter the outcomes, which is reassuring. We were unable to assess the use of targeted antibiotic therapy because clinical data (eg, microbiology results) were not available. However, this may be less important because some literature suggests that cultures for S aureus are obtained infrequently2 and may be difficult to interpret when obtained,25 since culture growth can represent colonization rather than causative strains. An additional limitation is that administrative data do not include certain clinical outcomes, such as fever duration or degree of skin involvement, which could have differed among the groups. Last, the PHIS database only captures revisits or readmissions to PHIS hospitals, and so we are unable to exclude the possibility of a child being seen at or readmitted to another hospital.
Due to the observational design of this study and potential for incomplete measurement of illness severity, we recommend a future prospective trial with randomization to confirm these findings. One possible reason that LOS did not differ among groups is that the burden of clindamycin-resistant strains in our cohort could be low, and the addition of MSSA or MRSA coverage does not result in a clinically important increase in S aureus coverage. However, pooled pediatric hospital antibiogram data suggest the overall rate of clindamycin resistance is close to 20% in hospitals located in all US regions.26 Limited studies also suggest that MSSA may be the predominant pathogen associated with SSSS.2,9 To address this, future randomized trials could compare the effectiveness of clindamycin monotherapy to MSSA-specific agents like cefazolin or nafcillin. Unfortunately, anti-MSSA monotherapy was not evaluated in our study because very few children received this treatment. Using monotherapy as opposed to multiple antibiotics has the potential to promote antibiotic stewardship for antistaphylococcal antibiotics in the management of SSSS. Reducing unnecessary antibiotic use not only potentially affects antibiotic resistance, but could also benefit patients in reducing possible side effects, cost, and IV catheter complications.27 However, acknowledging our study limitations, our findings should be applied cautiously in clinical settings, in the context of local antibiogram data, individual culture results, and specific patient factors. The local clindamycin resistance rate for both MSSA and MRSA should be considered. Many antibiotics chosen to treat MRSA—such as vancomycin and trimethoprim/sulfamethoxazole—will also have anti-MSSA activity and may have lower local resistance rates than clindamycin. Practitioners may also consider how each antibiotic kills bacteria; for example, beta-lactams rely on bacterial replication, but clindamycin does not. Each factor should influence how empiric treatment, whether monotherapy or combination, is chosen for children with SSSS.
CONCLUSION
In this large, multicenter cohort of hospitalized children with SSSS, we found that the addition of MSSA or MRSA coverage to clindamycin monotherapy was not associated with differences in outcomes of hospital LOS and treatment failure. Furthermore, clindamycin monotherapy was associated with lower overall cost. Prospective randomized studies are needed to confirm these findings and assess whether clindamycin monotherapy, monotherapy with an anti-MSSA antibiotic, or alternative regimens are most effective for treatment of children with SSSS.
1. Staiman A, Hsu DY, Silverberg JI. Epidemiology of staphylococcal scalded skin syndrome in United States children. Br J Dermatol. 2018;178(3):704-708. https://doi.org/10.1111/bjd.16097
2. Hulten KG, Kok M, King KE, Lamberth LB, Kaplan SL. Increasing numbers of staphylococcal scalded skin syndrome cases caused by ST121 in Houston, TX. Pediatr Infect Dis J. 2020;39(1):30-34. https://doi.org/10.1097/INF.0000000000002499
3. Arnold JD, Hoek SN, Kirkorian AY. Epidemiology of staphylococcal scalded skin syndrome in the United States: A cross-sectional study, 2010-2014. J Am Acad Dermatol. 2018;78(2):404-406. https://doi.org/10.1016/j.jaad.2017.09.023
4. Hayward A, Knott F, Petersen I, et al. Increasing hospitalizations and general practice prescriptions for community-onset staphylococcal disease, England. Emerg Infect Dis. 2008;14(5):720-726. https://doi.org/10.3201/eid1405.070153
5. Berk DR, Bayliss SJ. MRSA, staphylococcal scalded skin syndrome, and other cutaneous bacterial emergencies. Pediatr Ann. 2010;39(10):627-633. https://doi.org/10.3928/00904481-20100922-02
6. Ladhani S, Joannou CL, Lochrie DP, Evans RW, Poston SM. Clinical, microbial, and biochemical aspects of the exfoliative toxins causing staphylococcal scalded-skin syndrome. Clin Microbiol Rev. 1999;12(2):224-242.
7. Handler MZ, Schwartz RA. Staphylococcal scalded skin syndrome: diagnosis and management in children and adults. J Eur Acad Dermatol Venereol. 2014;28(11):1418-1423. https://doi.org/10.1111/jdv.12541
8. Hodille E, Rose W, Diep BA, Goutelle S, Lina G, Dumitrescu O. The role of antibiotics in modulating virulence in Staphylococcus aureus. Clin Microbiol Rev. 2017;30(4):887-917. https://doi.org/10.1128/CMR.00120-16
9. Braunstein I, Wanat KA, Abuabara K, McGowan KL, Yan AC, Treat JR. Antibiotic sensitivity and resistance patterns in pediatric staphylococcal scalded skin syndrome. Pediatr Dermatol. 2014;31(3):305-308. https://doi.org/10.1111/pde.12195
10. Yamaguchi T, Yokota Y, Terajima J, et al. Clonal association of Staphylococcus aureus causing bullous impetigo and the emergence of new methicillin-resistant clonal groups in Kansai district in Japan. J Infect Dis. 2002;185(10):1511-1516. https://doi.org/10.1086/340212
11. Noguchi N, Nakaminami H, Nishijima S, Kurokawa I, So H, Sasatsu M. Antimicrobial agent of susceptibilities and antiseptic resistance gene distribution among methicillin-resistant Staphylococcus aureus isolates from patients with impetigo and staphylococcal scalded skin syndrome. J Clin Microbiol. 2006;44(6):2119-2125. https://doi.org/10.1128/JCM.02690-05
12. Pankey GA, Sabath LD. Clinical relevance of bacteriostatic versus bactericidal mechanisms of action in the treatment of Gram-positive bacterial infections. Clin Infect Dis. 2004;38(6):864-870. https://doi.org/10.1086/381972
13. Wald-Dickler N, Holtom P, Spellberg B. Busting the myth of “static vs cidal”: a systemic literature review. Clin Infect Dis. 2018;66(9):1470-1474. https://doi.org/10.1093/cid/cix1127
14. Ladhani S, Joannou CL. Difficulties in diagnosis and management of the staphylococcal scalded skin syndrome. Pediatr Infect Dis J. 2000;19(9):819-821. https://doi.org/10.1097/00006454-200009000-00002
15. Mongelluzzo J, Mohamad Z, Ten Have TR, Shah SS. Corticosteroids and mortality in children with bacterial meningitis. JAMA. 2008;299(17):2048-2055. https://doi.org/10.1001/jama.299.17.2048
16. Neubauer HC, Hall M, Wallace SS, et al. Variation in diagnostic test use and associated outcomes in staphylococcal scalded skin syndrome at children’s hospitals. Hosp Pediatr. 2018;8(9):530-537. https://doi.org/10.1542/hpeds.2018-0032
17. Feudtner C, Feinstein JA, Zhong W, Hall M, Dai D. Pediatric complex chronic conditions classification system version 2: updated for ICD-10 and complex medical technology dependence and transplantation. BMC Pediatr. 2014;14:199. https://doi.org/10.1186/1471-2431-14-199
18. Sauberan JS, Bradley JS. Antimicrobial agents. In: Long SS, ed. Principles and Practice of Pediatric Infectious Diseases. Elsevier; 2018:1499-1531.
19. Sedman AB, Bahl V, Bunting E, et al. Clinical redesign using all patient refined diagnosis related groups. Pediatrics. 2004;114(4):965-969. https://doi.org/10.1542/peds.2004-0650
20. Williams DJ, Cooper WO, Kaltenbach LA, et al. Comparative effectiveness of antibiotic treatment strategies for pediatric skin and soft-tissue infections. Pediatrics. 2011;128(3):e479-487. https://doi.org/10.1542/peds.2010-3681
21. Haasnoot PJ, De Vries A. Staphylococcal scalded skin syndrome in a 4-year-old child: a case report. J Med Case Rep. 2018;12(1):20. https://doi.org/ 10.1186/s13256-017-1533-7
22. Li MY, Hua Y, Wei GH, Qiu L. Staphylococcal scalded skin syndrome in neonates: an 8-year retrospective study in a single institution. Pediatr Dermatol. 2014;31(1):43-47. https://doi.org/10.1111/pde.12114
23. Markham JL, Hall M, Queen MA, et al. Variation in antibiotic selection and clinical outcomes in infants <60 days hospitalized with skin and soft tissue infections. Hosp Pediatr. 2019;9(1):30-38. https://doi.org/10.1542/hpeds.2017-0237
24. Davidson J, Polly S, Hayes PJ, Fisher KR, Talati AJ, Patel T. Recurrent staphylococcal scalded skin syndrome in an extremely low-birth-weight neonate. AJP Rep. 2017;7(2):e134-e137. https://doi.org/10.1055/s-0037-1603971
25. Ladhani S, Robbie S, Chapple DS, Joannou CL, Evans RW. Isolating Staphylococcus aureus from children with suspected Staphylococcal scalded skin syndrome is not clinically useful. Pediatr Infect Dis J. 2003;22(3):284-286.
26. Tamma PD, Robinson GL, Gerber JS, et al. Pediatric antimicrobial susceptibility trends across the United States. Infect Control Hosp Epidemiol. 2013;34(12):1244-1251. https://doi.org/10.1086/673974
27. Unbeck M, Forberg U, Ygge BM, Ehrenberg A, Petzold M, Johansson E. Peripheral venous catheter related complications are common among paediatric and neonatal patients. Acta Paediatr. 2015;104(6):566-574. https://doi.org/10.1111/apa.12963
©2021 Society of Hospital Medicine
The Pipeline From Abstract Presentation to Publication in Pediatric Hospital Medicine
Pediatric hospital medicine (PHM) is one of the most rapidly growing disciplines in pediatrics,1 with 8% of pediatric residency graduates each year entering the field.2 Research plays an important role in advancing care in the field and is a critical component for board certification and fellowship accreditation.3-6 The annual PHM conference, which has been jointly sponsored by the Academic Pediatric Association, the American Academy of Pediatrics, and the Society of Hospital Medicine, is an important venue for the dissemination of research findings. Abstract selection is determined by peer review; however, reviewers are provided with only a brief snapshot of the research, which may not contain sufficient information to fully evaluate the methodological quality of the work.7-10 Additionally, while instructions are provided, reviewers often lack formal training in abstract review. Consequently, scores may vary.9
Publication in a peer-reviewed journal is considered a measure of research success because it requires more rigorous peer review than the abstract selection process at scientific meetings.11-16 Rates of subsequent journal publication differ based on specialty and meeting, and they have been reported at 23% to 78%.10,12,14-18 In pediatrics, publication rates after presentation at scientific meetings range from 36% to 63%, with mean time to publication ranging from 20 to 26 months following the meeting.11,19,20 No studies have reviewed abstract submissions to the annual PHM meeting to determine if selection or presentation format is associated with subsequent publication in a peer-reviewed journal.
We sought to identify the publication rate of abstracts submitted to the 2014 PHM conference and determine whether presentation format was associated with the likelihood of subsequent journal publication or time to publication.
METHODS
Study Design
Data for this retrospective cohort study were obtained from a database of all abstracts submitted for presentation at the 2014 PHM conference in Lake Buena Vista, Florida.
Main Exposures
The main exposure was presentation format, which was categorized as not presented (ie, rejected), poster presentation, or oral presentation. PHM has a blinded abstract peer-review process; in 2014, an average of 10 reviewers scored each abstract. Reviewers graded abstracts on a scale of 1 (best in category) to 7 (unacceptable for presentation) according to the following criteria: originality, scientific importance, methodological rigor, and quality of presentation. Abstracts with the lowest average scores in each content area, usually less than or equal to 3, were accepted as oral presentations while most abstracts with scores greater than 5 were rejected. For this study, information collected from each abstract included authors, if the primary author was a trainee, title, content area, and presentation format. Content areas included clinical research, educational research, health services research (HSR) and/or epidemiology, practice management research, and quality improvement. Abstracts were then grouped by presentation format and content area for analysis. The Pediatric Academic Societies (PAS) annual meeting, another common venue for the presentation of pediatric research, precedes the PHM conference. Because acceptance for PAS presentation may represent more strongly developed abstract submissions for PHM, we identified which abstracts had also been presented at the PAS conference that same year by cross-referencing authors and abstract titles with the PAS 2014 program.
Main Outcome Measures
All submissions were assessed for subsequent publication in peer-reviewed journals through January 2017 (30 months following the July 2014 PHM conference). To identify abstracts that went on to full publication, 2 authors (JC and LEH) independently searched for the lead author’s name and the presentation title in PubMed, Google Scholar, and MedEdPORTAL in January 2017. PubMed was searched using both the general search box and an advanced search for author and title. Google Scholar was added to capture manuscripts that may not have been indexed in PubMed at the time of our search. MedEdPORTAL, a common venue for the publication of educational initiatives that are not currently indexed in PubMed, was searched by lead author name via the general search box. If a full manuscript was published discussing similar outcomes or results and was written by the same authors who had submitted a PHM conference abstract, it was considered to have been published. The journal, month, and year of publication were recorded. For journals published every 2 months, the date of publication was recorded as falling between the 2 months. For those journals with biannual publication in the spring and fall, the months of March and October were used, respectively. The impact factor of the publication journal was also recorded for the year preceding publication. A journal’s impact factor is frequently used as a quantitative measure of journal quality and reflects the frequency with which a journal’s articles are cited in the scientific literature.21 Journals without an impact factor (eg, newer journals) were assigned a 0.
Data Analysis
All abstracts submitted to the PHM conference were analyzed based on content area and presentation format. The proportion of all abstracts subsequently published was determined for each format type and content area, and the odds ratio (OR) for publication after abstract submission was calculated using logistic regression. We calculated an adjusted OR for subsequent publication controlling for PAS presentation and the trainee status of the primary author. The journals most frequently publishing abstracts submitted to the PHM conference were identified. Median time to publication was calculated using the number of months elapsed between the PHM conference and publication date and compared across all abstract formats using Cox proportional hazards models adjusted for PAS presentation and trainee status. Kaplan-Meier survival curves were also generated for each of the 3 formats and compared using log-rank tests. The median impact factor was determined for each abstract format and compared using Wilcoxon rank-sum tests. Median impact factor by content area was compared using a Kruskal-Wallis test. All statistical analyses were performed using SAS version 9.2 (SAS Institute, Cary, NC). P values < 0.05 were considered statistically significant. In accordance with the Common Rule22 and the policies of the Cincinnati Children’s Hospital Medical Center Institutional Review Board, this research was not considered human subjects research.

RESULTS
For the 2014 PHM meeting, 226 abstracts were submitted, of which 183 (81.0%) were selected for presentation, including 154 (68.0%) as poster presentations and 29 (12.8%) as oral presentations. Of all submitted abstracts, 82 (36.3%) were published within 30 months following the meeting. Eighty-one of these (98.8%) were identified via PubMed, and 1 was found only in MedEdPORTAL. No additional publications were found via Google Scholar. The presenting author for the PHM abstract was the first author for 87.8% (n = 72) of the publications. A trainee was the presenting author for only 2 of these abstracts. For the publications in which the first author was not the presenting author, the presenting author was the senior author in 2 of the publications and the second or third author on the remaining 8. Of the abstracts accepted for presentation, 70 (38.3%) were subsequently published. Abstracts accepted for oral presentation had almost 7-fold greater odds of subsequent publication than those that were rejected (Table 1; OR 6.8; 95% confidence interval [CI], 2.4-19.4). Differences in the odds of publication for rejected abstracts compared with those accepted for poster presentation were not statistically significant (OR 1.2; 95% CI, 0.5-2.5).
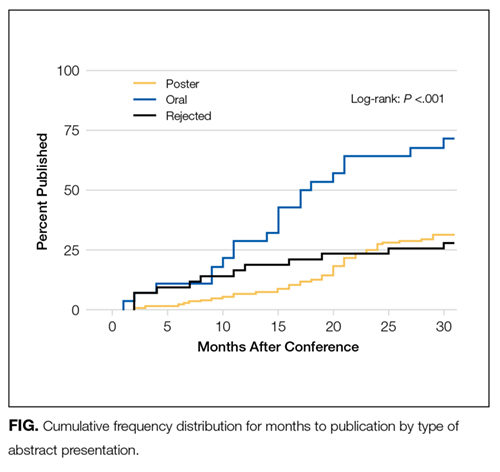
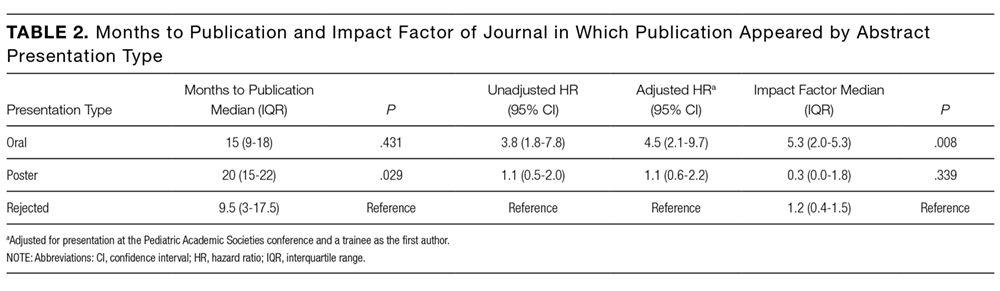
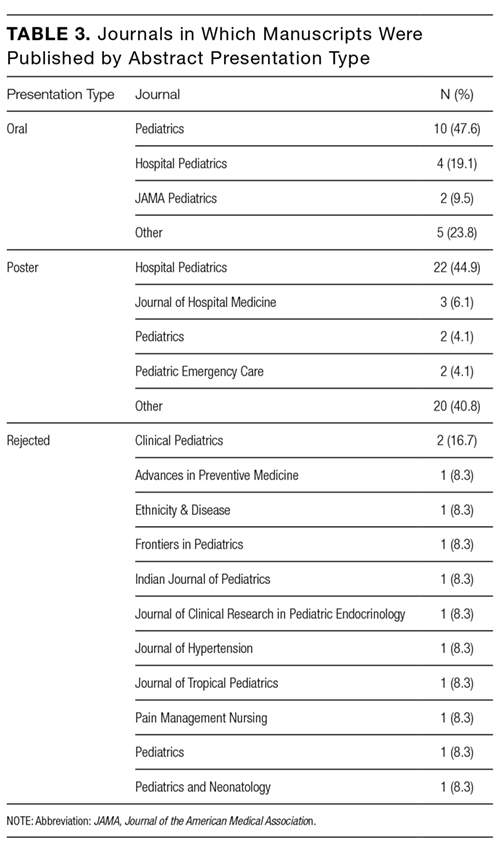
DISCUSSION
About one-third of abstracts submitted to the 2014 PHM conference were subsequently published in peer-reviewed journals within 30 months of the conference. Compared with rejected abstracts, the rate of publication was significantly higher for abstracts selected for oral presentation but not for those selected for poster presentation. For abstracts ultimately published in journals, selection for oral presentation was significantly associated with both a shorter time to publication and a higher median journal impact factor compared with rejected abstracts. Time to publication and median journal impact factor were similar between rejected abstracts and those accepted for poster presentation. Our findings suggest that abstract reviewers may be able to identify which abstracts will ultimately withstand more stringent peer review in the publication process when accepting abstracts for oral presentation. However, the selection for poster presentation versus rejection may not be indicative of future publication or the impact factor of the subsequent publication journal.
Previous studies have reviewed publication rates after meetings of the European Society for Pediatric Urology (publication rate of 47%),11 the Ambulatory Pediatric Association (now the Academic Pediatric Association; publication rate of 47%), the American Pediatric Society/Society for Pediatric Research (publication rate of 54%), and the PAS (publication rate of 45%).19,20 Our lower publication rate of 36.3% may be attributed to the shorter follow-up time in our study (30 months from the PHM conference), whereas prior studies monitored for publication up to 60 months after the PAS conference.20 Factors associated with subsequent publication include statistically significant results, a large sample size, and a randomized controlled trial study design.15,16 The primary reason for nonpublication for up to 80% of abstracts is failure to submit a manuscript for publication.23 A lack of time and fear of rejection after peer review are commonly cited explanations.18,23,24 Individuals may view acceptance for an oral presentation as positive reinforcement and be more motivated to pursue subsequent manuscript publication than individuals whose abstracts are offered poster presentations or are rejected. Trainees frequently present abstracts at scientific meetings, representing 40.3% of primary authors submitting abstracts to PHM in 2014, but may not have sufficient time or mentorship to develop a complete manuscript.18 To our knowledge, there have been no publications that assess the impact of trainee status on subsequent publication after conference submission.
Our study demonstrated that selection for oral presentation was associated with subsequent publication, shorter time to publication, and publication in journals with higher impact factors. A 2005 Cochrane review also demonstrated that selection for oral presentation was associated with subsequent journal publication.16 Abstracts accepted for oral publication may represent work further along in the research process, with more developed methodology and results. The shorter time to publication for abstracts accepted for oral presentation could also reflect feedback provided by conference attendees after the presentation, whereas poster sessions frequently lack a formalized process for critique.
Carroll et al. found no difference in time to publication between abstracts accepted for presentation at the PAS and rejected abstracts.20 Previous studies demonstrate that most abstracts presented at scientific meetings that are subsequently accepted for publication are published within 2 to 3 years of the meeting,12 with publication rates as high as 98% within 3 years of presentation.17 In contrast to Carroll et al., we found that abstracts accepted for oral presentation had a 4-fold greater likelihood of publication at each month than rejected abstracts. However, abstracts accepted for poster presentation did not have a significant difference in the proportional hazard ratio models for publication compared with rejected abstracts. Because space considerations limit the number of abstracts that can be accepted for presentation at a conference, some abstracts that are suitable for future publication may have been rejected due to a lack of space. Because researchers often use scientific meetings as a forum to receive peer feedback,12 authors who present at conferences may take more time to write a manuscript in order to incorporate this feedback.
The most common journal in which submitted abstracts were subsequently published was Hospital Pediatrics, representing twice as many published manuscripts as the second most frequent journal, Pediatrics. Hospital Pediatrics, which was first published in 2011, did not have an impact factor assigned during the study period. Yet, as a peer-reviewed journal dedicated to the field of PHM, it is well aligned with the research presented at the PHM meeting. It is unclear if Hospital Pediatrics is a journal to which pediatric hospitalists tend to submit manuscripts initially or if manuscripts are frequently submitted elsewhere prior to their publication in Hospital Pediatrics. Submission to other journals first likely extends the time to publication, especially for abstracts accepted for poster presentation, which may describe studies with less developed methods or results.
This study has several limitations. Previous studies have demonstrated mean time to publication of 12 to 32 months following abstract presentation with a median time of 19.6 months.16 Because we only have a 30-month follow-up, there may be abstracts still in the review process that are yet to be published, especially because the length of the review process varies by journal. We based our literature search on the first author of each PHM conference abstract submission, assuming that this presenting author would be one of the publishing authors even if not remaining first author; if this was not the case, we may have missed some abstracts that were subsequently published in full. Likewise, if a presenting author’s last name changed prior to the publication of a manuscript, a publication may have been missed. This limitation would cause us to underestimate the overall publication rate. It is not clear whether this would differentially affect the method of presentation. However, in this study, there was concordance between the presenting author and the publication’s first author in 87.8% of the abstracts subsequently published in full. Presenting authors who did not remain the first author on the published manuscript maintained authorship as either the senior author or second or third author, which may represent changes in the degree of involvement or a division of responsibilities for individuals working on a project together. While our search methods were comprehensive, there is a possibility that abstracts may have been published in a venue that was not searched. Additionally, we only reviewed abstracts submitted to PHM for 1 year. As the field matures and the number of fellowship programs increases, the quality of submitted abstracts may increase, leading to higher publication rates or shorter times to publication. It is also possible that the publication rate may not be reflective of PHM as a field because hospitalists may submit their work to conferences other than the PHM. Lastly, it may be more challenging to interpret any differences in impact factor because some journals, including Hospital Pediatrics (which represented a plurality of poster presentation abstracts that were subsequently published and is a relatively new journal), did not have an impact factor assigned during the study period. Assigning a 0 to journals without an impact factor may artificially lower the average impact factor reported. Furthermore, an impact factor, which is based on the frequency with which an individual journal’s articles are cited in scientific or medical publications, may not necessarily reflect a journal’s quality.
CONCLUSIONS
Of the 226 abstracts submitted to the 2014 PHM conference, approximately one-third were published in peer-reviewed journals within 30 months of the conference. Selection for oral presentation was found to be associated with subsequent publication as well as publication in journals with higher impact factors. The overall low publication rate may indicate a need for increased mentorship and resources for research development in this growing specialty. Improved mechanisms for author feedback at poster sessions may provide constructive suggestions for further development of these projects into full manuscripts or opportunities for trainees and early-career hospitalists to network with more experienced researchers in the field.
Disclosure
Drs. Herrmann, Hall, Kyler, Andrews, Williams, and Shah and Mr. Cochran have nothing to disclose. Dr. Wilson reports personal fees from the American Academy of Pediatrics during the conduct of the study. The authors have no financial relationships relevant to this article to disclose.
1. Stucky ER, Ottolini MC, Maniscalco J. Pediatric hospital medicine core competencies: development and methodology. J Hosp Med. 2010;5(6):339-343. PubMed
2. Freed GL, McGuinness GA, Althouse LA, Moran LM, Spera L. Long-term plans for those selecting hospital medicine as an initial career choice. Hosp Pediatr. 2015;5(4):169-174. PubMed
3. Rauch D. Pediatric Hospital Medicine Subspecialty. 2016; https://www.aap.org/en-us/about-the-aap/Committees-Councils-Sections/Section-on-Hospital-Medicine/Pages/Pediatric-Hospital-Medicine-Subspecialty.aspx. Accessed November 28, 2016.
4. Bekmezian A, Teufel RJ, Wilson KM. Research needs of pediatric hospitalists. Hosp Pediatr. 2011;1(1):38-44. PubMed
5. Teufel RJ, Bekmezian A, Wilson K. Pediatric hospitalist research productivity: predictors of success at presenting abstracts and publishing peer-reviewed manuscripts among pediatric hospitalists. Hosp Pediatr. 2012;2(3):149-160. PubMed
6. Wilson KM, Shah SS, Simon TD, Srivastava R, Tieder JS. The challenge of pediatric hospital medicine research. Hosp Pediatr. 2012;2(1):8-9. PubMed
7. Froom P, Froom J. Presentation Deficiencies in structured medical abstracts. J Clin Epidemiol. 1993;46(7):591-594. PubMed
8. Relman AS. News reports of medical meetings: how reliable are abstracts? N Engl J Med. 1980;303(5):277-278. PubMed
9. Soffer A. Beware the 200-word abstract! Arch Intern Med. 1976;136(11):1232-1233. PubMed
10. Bhandari M, Devereaux P, Guyatt GH, et al. An observational study of orthopaedic abstracts and subsequent full-text publications. J Bone Joint Surg Am. 2002;84(4):615-621. PubMed
11. Castagnetti M, Subramaniam R, El-Ghoneimi A. Abstracts presented at the European Society for Pediatric Urology (ESPU) meetings (2003–2010): Characteristics and outcome. J Pediatr Urol. 2014;10(2):355-360. PubMed
12. Halikman R, Scolnik D, Rimon A, Glatstein MM. Peer-Reviewed Journal Publication of Abstracts Presented at an International Emergency Medicine Scientific Meeting: Outcomes and Comparison With the Previous Meeting. Pediatr Emerg Care. 2016. PubMed
13. Relman AS. Peer review in scientific journals--what good is it? West J Med. 1990;153(5):520. PubMed
14. Riordan F. Do presenters to paediatric meetings get their work published? Arch Dis Child. 2000;83(6):524-526. PubMed
15. Scherer RW, Dickersin K, Langenberg P. Full publication of results initially presented in abstracts: a meta-analysis. JAMA. 1994;272(2):158-162. PubMed
16. Scherer RW, Langenberg P, Elm E. Full publication of results initially presented in abstracts. Cochrane Database Syst Rev. 2005. PubMed
17. Marx WF, Cloft HJ, Do HM, Kallmes DF. The fate of neuroradiologic abstracts presented at national meetings in 1993: rate of subsequent publication in peer-reviewed, indexed journals. Am J Neuroradiol. 1999;20(6):1173-1177. PubMed
18. Roy D, Sankar V, Hughes J, Jones A, Fenton J. Publication rates of scientific papers presented at the Otorhinolarygological Research Society meetings. Clin Otolaryngol Allied Sci. 2001;26(3):253-256. PubMed
19. McCormick MC, Holmes JH. Publication of research presented at the pediatric meetings: change in selection. Am J Dis Child. 1985;139(2):122-126. PubMed
20. Carroll AE, Sox CM, Tarini BA, Ringold S, Christakis DA. Does presentation format at the Pediatric Academic Societies’ annual meeting predict subsequent publication? Pediatrics. 2003;112(6):1238-1241. PubMed
21. Saha S, Saint S, Christakis DA. Impact factor: a valid measure of journal quality? J Med Libr Assoc. 2003;91(1):42. PubMed
22. Office for Human Research Protections. Code of Federal Regulations, Title 45 Public Welfare: Part 46, Protection of Human Subjects, §46.102(f ). http://www.hhs.gov/ohrp/regulations-and-policy/regulations/45-cfr-46/index.html#46.102. Accessed October 21, 2016.
23. Weber EJ, Callaham ML, Wears RL, Barton C, Young G. Unpublished research from a medical specialty meeting: why investigators fail to publish. JAMA. 1998;280(3):257-259. PubMed
24. Timmer A, Hilsden RJ, Cole J, Hailey D, Sutherland LR. Publication bias in gastroenterological research–a retrospective cohort study based on abstracts submitted to a scientific meeting. BMC Med Res Methodol. 2002;2(1):1. PubMed
Pediatric hospital medicine (PHM) is one of the most rapidly growing disciplines in pediatrics,1 with 8% of pediatric residency graduates each year entering the field.2 Research plays an important role in advancing care in the field and is a critical component for board certification and fellowship accreditation.3-6 The annual PHM conference, which has been jointly sponsored by the Academic Pediatric Association, the American Academy of Pediatrics, and the Society of Hospital Medicine, is an important venue for the dissemination of research findings. Abstract selection is determined by peer review; however, reviewers are provided with only a brief snapshot of the research, which may not contain sufficient information to fully evaluate the methodological quality of the work.7-10 Additionally, while instructions are provided, reviewers often lack formal training in abstract review. Consequently, scores may vary.9
Publication in a peer-reviewed journal is considered a measure of research success because it requires more rigorous peer review than the abstract selection process at scientific meetings.11-16 Rates of subsequent journal publication differ based on specialty and meeting, and they have been reported at 23% to 78%.10,12,14-18 In pediatrics, publication rates after presentation at scientific meetings range from 36% to 63%, with mean time to publication ranging from 20 to 26 months following the meeting.11,19,20 No studies have reviewed abstract submissions to the annual PHM meeting to determine if selection or presentation format is associated with subsequent publication in a peer-reviewed journal.
We sought to identify the publication rate of abstracts submitted to the 2014 PHM conference and determine whether presentation format was associated with the likelihood of subsequent journal publication or time to publication.
METHODS
Study Design
Data for this retrospective cohort study were obtained from a database of all abstracts submitted for presentation at the 2014 PHM conference in Lake Buena Vista, Florida.
Main Exposures
The main exposure was presentation format, which was categorized as not presented (ie, rejected), poster presentation, or oral presentation. PHM has a blinded abstract peer-review process; in 2014, an average of 10 reviewers scored each abstract. Reviewers graded abstracts on a scale of 1 (best in category) to 7 (unacceptable for presentation) according to the following criteria: originality, scientific importance, methodological rigor, and quality of presentation. Abstracts with the lowest average scores in each content area, usually less than or equal to 3, were accepted as oral presentations while most abstracts with scores greater than 5 were rejected. For this study, information collected from each abstract included authors, if the primary author was a trainee, title, content area, and presentation format. Content areas included clinical research, educational research, health services research (HSR) and/or epidemiology, practice management research, and quality improvement. Abstracts were then grouped by presentation format and content area for analysis. The Pediatric Academic Societies (PAS) annual meeting, another common venue for the presentation of pediatric research, precedes the PHM conference. Because acceptance for PAS presentation may represent more strongly developed abstract submissions for PHM, we identified which abstracts had also been presented at the PAS conference that same year by cross-referencing authors and abstract titles with the PAS 2014 program.
Main Outcome Measures
All submissions were assessed for subsequent publication in peer-reviewed journals through January 2017 (30 months following the July 2014 PHM conference). To identify abstracts that went on to full publication, 2 authors (JC and LEH) independently searched for the lead author’s name and the presentation title in PubMed, Google Scholar, and MedEdPORTAL in January 2017. PubMed was searched using both the general search box and an advanced search for author and title. Google Scholar was added to capture manuscripts that may not have been indexed in PubMed at the time of our search. MedEdPORTAL, a common venue for the publication of educational initiatives that are not currently indexed in PubMed, was searched by lead author name via the general search box. If a full manuscript was published discussing similar outcomes or results and was written by the same authors who had submitted a PHM conference abstract, it was considered to have been published. The journal, month, and year of publication were recorded. For journals published every 2 months, the date of publication was recorded as falling between the 2 months. For those journals with biannual publication in the spring and fall, the months of March and October were used, respectively. The impact factor of the publication journal was also recorded for the year preceding publication. A journal’s impact factor is frequently used as a quantitative measure of journal quality and reflects the frequency with which a journal’s articles are cited in the scientific literature.21 Journals without an impact factor (eg, newer journals) were assigned a 0.
Data Analysis
All abstracts submitted to the PHM conference were analyzed based on content area and presentation format. The proportion of all abstracts subsequently published was determined for each format type and content area, and the odds ratio (OR) for publication after abstract submission was calculated using logistic regression. We calculated an adjusted OR for subsequent publication controlling for PAS presentation and the trainee status of the primary author. The journals most frequently publishing abstracts submitted to the PHM conference were identified. Median time to publication was calculated using the number of months elapsed between the PHM conference and publication date and compared across all abstract formats using Cox proportional hazards models adjusted for PAS presentation and trainee status. Kaplan-Meier survival curves were also generated for each of the 3 formats and compared using log-rank tests. The median impact factor was determined for each abstract format and compared using Wilcoxon rank-sum tests. Median impact factor by content area was compared using a Kruskal-Wallis test. All statistical analyses were performed using SAS version 9.2 (SAS Institute, Cary, NC). P values < 0.05 were considered statistically significant. In accordance with the Common Rule22 and the policies of the Cincinnati Children’s Hospital Medical Center Institutional Review Board, this research was not considered human subjects research.
RESULTS
For the 2014 PHM meeting, 226 abstracts were submitted, of which 183 (81.0%) were selected for presentation, including 154 (68.0%) as poster presentations and 29 (12.8%) as oral presentations. Of all submitted abstracts, 82 (36.3%) were published within 30 months following the meeting. Eighty-one of these (98.8%) were identified via PubMed, and 1 was found only in MedEdPORTAL. No additional publications were found via Google Scholar. The presenting author for the PHM abstract was the first author for 87.8% (n = 72) of the publications. A trainee was the presenting author for only 2 of these abstracts. For the publications in which the first author was not the presenting author, the presenting author was the senior author in 2 of the publications and the second or third author on the remaining 8. Of the abstracts accepted for presentation, 70 (38.3%) were subsequently published. Abstracts accepted for oral presentation had almost 7-fold greater odds of subsequent publication than those that were rejected (Table 1; OR 6.8; 95% confidence interval [CI], 2.4-19.4). Differences in the odds of publication for rejected abstracts compared with those accepted for poster presentation were not statistically significant (OR 1.2; 95% CI, 0.5-2.5).
DISCUSSION
About one-third of abstracts submitted to the 2014 PHM conference were subsequently published in peer-reviewed journals within 30 months of the conference. Compared with rejected abstracts, the rate of publication was significantly higher for abstracts selected for oral presentation but not for those selected for poster presentation. For abstracts ultimately published in journals, selection for oral presentation was significantly associated with both a shorter time to publication and a higher median journal impact factor compared with rejected abstracts. Time to publication and median journal impact factor were similar between rejected abstracts and those accepted for poster presentation. Our findings suggest that abstract reviewers may be able to identify which abstracts will ultimately withstand more stringent peer review in the publication process when accepting abstracts for oral presentation. However, the selection for poster presentation versus rejection may not be indicative of future publication or the impact factor of the subsequent publication journal.
Previous studies have reviewed publication rates after meetings of the European Society for Pediatric Urology (publication rate of 47%),11 the Ambulatory Pediatric Association (now the Academic Pediatric Association; publication rate of 47%), the American Pediatric Society/Society for Pediatric Research (publication rate of 54%), and the PAS (publication rate of 45%).19,20 Our lower publication rate of 36.3% may be attributed to the shorter follow-up time in our study (30 months from the PHM conference), whereas prior studies monitored for publication up to 60 months after the PAS conference.20 Factors associated with subsequent publication include statistically significant results, a large sample size, and a randomized controlled trial study design.15,16 The primary reason for nonpublication for up to 80% of abstracts is failure to submit a manuscript for publication.23 A lack of time and fear of rejection after peer review are commonly cited explanations.18,23,24 Individuals may view acceptance for an oral presentation as positive reinforcement and be more motivated to pursue subsequent manuscript publication than individuals whose abstracts are offered poster presentations or are rejected. Trainees frequently present abstracts at scientific meetings, representing 40.3% of primary authors submitting abstracts to PHM in 2014, but may not have sufficient time or mentorship to develop a complete manuscript.18 To our knowledge, there have been no publications that assess the impact of trainee status on subsequent publication after conference submission.
Our study demonstrated that selection for oral presentation was associated with subsequent publication, shorter time to publication, and publication in journals with higher impact factors. A 2005 Cochrane review also demonstrated that selection for oral presentation was associated with subsequent journal publication.16 Abstracts accepted for oral publication may represent work further along in the research process, with more developed methodology and results. The shorter time to publication for abstracts accepted for oral presentation could also reflect feedback provided by conference attendees after the presentation, whereas poster sessions frequently lack a formalized process for critique.
Carroll et al. found no difference in time to publication between abstracts accepted for presentation at the PAS and rejected abstracts.20 Previous studies demonstrate that most abstracts presented at scientific meetings that are subsequently accepted for publication are published within 2 to 3 years of the meeting,12 with publication rates as high as 98% within 3 years of presentation.17 In contrast to Carroll et al., we found that abstracts accepted for oral presentation had a 4-fold greater likelihood of publication at each month than rejected abstracts. However, abstracts accepted for poster presentation did not have a significant difference in the proportional hazard ratio models for publication compared with rejected abstracts. Because space considerations limit the number of abstracts that can be accepted for presentation at a conference, some abstracts that are suitable for future publication may have been rejected due to a lack of space. Because researchers often use scientific meetings as a forum to receive peer feedback,12 authors who present at conferences may take more time to write a manuscript in order to incorporate this feedback.
The most common journal in which submitted abstracts were subsequently published was Hospital Pediatrics, representing twice as many published manuscripts as the second most frequent journal, Pediatrics. Hospital Pediatrics, which was first published in 2011, did not have an impact factor assigned during the study period. Yet, as a peer-reviewed journal dedicated to the field of PHM, it is well aligned with the research presented at the PHM meeting. It is unclear if Hospital Pediatrics is a journal to which pediatric hospitalists tend to submit manuscripts initially or if manuscripts are frequently submitted elsewhere prior to their publication in Hospital Pediatrics. Submission to other journals first likely extends the time to publication, especially for abstracts accepted for poster presentation, which may describe studies with less developed methods or results.
This study has several limitations. Previous studies have demonstrated mean time to publication of 12 to 32 months following abstract presentation with a median time of 19.6 months.16 Because we only have a 30-month follow-up, there may be abstracts still in the review process that are yet to be published, especially because the length of the review process varies by journal. We based our literature search on the first author of each PHM conference abstract submission, assuming that this presenting author would be one of the publishing authors even if not remaining first author; if this was not the case, we may have missed some abstracts that were subsequently published in full. Likewise, if a presenting author’s last name changed prior to the publication of a manuscript, a publication may have been missed. This limitation would cause us to underestimate the overall publication rate. It is not clear whether this would differentially affect the method of presentation. However, in this study, there was concordance between the presenting author and the publication’s first author in 87.8% of the abstracts subsequently published in full. Presenting authors who did not remain the first author on the published manuscript maintained authorship as either the senior author or second or third author, which may represent changes in the degree of involvement or a division of responsibilities for individuals working on a project together. While our search methods were comprehensive, there is a possibility that abstracts may have been published in a venue that was not searched. Additionally, we only reviewed abstracts submitted to PHM for 1 year. As the field matures and the number of fellowship programs increases, the quality of submitted abstracts may increase, leading to higher publication rates or shorter times to publication. It is also possible that the publication rate may not be reflective of PHM as a field because hospitalists may submit their work to conferences other than the PHM. Lastly, it may be more challenging to interpret any differences in impact factor because some journals, including Hospital Pediatrics (which represented a plurality of poster presentation abstracts that were subsequently published and is a relatively new journal), did not have an impact factor assigned during the study period. Assigning a 0 to journals without an impact factor may artificially lower the average impact factor reported. Furthermore, an impact factor, which is based on the frequency with which an individual journal’s articles are cited in scientific or medical publications, may not necessarily reflect a journal’s quality.
CONCLUSIONS
Of the 226 abstracts submitted to the 2014 PHM conference, approximately one-third were published in peer-reviewed journals within 30 months of the conference. Selection for oral presentation was found to be associated with subsequent publication as well as publication in journals with higher impact factors. The overall low publication rate may indicate a need for increased mentorship and resources for research development in this growing specialty. Improved mechanisms for author feedback at poster sessions may provide constructive suggestions for further development of these projects into full manuscripts or opportunities for trainees and early-career hospitalists to network with more experienced researchers in the field.
Disclosure
Drs. Herrmann, Hall, Kyler, Andrews, Williams, and Shah and Mr. Cochran have nothing to disclose. Dr. Wilson reports personal fees from the American Academy of Pediatrics during the conduct of the study. The authors have no financial relationships relevant to this article to disclose.
1. Stucky ER, Ottolini MC, Maniscalco J. Pediatric hospital medicine core competencies: development and methodology. J Hosp Med. 2010;5(6):339-343. PubMed
2. Freed GL, McGuinness GA, Althouse LA, Moran LM, Spera L. Long-term plans for those selecting hospital medicine as an initial career choice. Hosp Pediatr. 2015;5(4):169-174. PubMed
3. Rauch D. Pediatric Hospital Medicine Subspecialty. 2016; https://www.aap.org/en-us/about-the-aap/Committees-Councils-Sections/Section-on-Hospital-Medicine/Pages/Pediatric-Hospital-Medicine-Subspecialty.aspx. Accessed November 28, 2016.
4. Bekmezian A, Teufel RJ, Wilson KM. Research needs of pediatric hospitalists. Hosp Pediatr. 2011;1(1):38-44. PubMed
5. Teufel RJ, Bekmezian A, Wilson K. Pediatric hospitalist research productivity: predictors of success at presenting abstracts and publishing peer-reviewed manuscripts among pediatric hospitalists. Hosp Pediatr. 2012;2(3):149-160. PubMed
6. Wilson KM, Shah SS, Simon TD, Srivastava R, Tieder JS. The challenge of pediatric hospital medicine research. Hosp Pediatr. 2012;2(1):8-9. PubMed
7. Froom P, Froom J. Presentation Deficiencies in structured medical abstracts. J Clin Epidemiol. 1993;46(7):591-594. PubMed
8. Relman AS. News reports of medical meetings: how reliable are abstracts? N Engl J Med. 1980;303(5):277-278. PubMed
9. Soffer A. Beware the 200-word abstract! Arch Intern Med. 1976;136(11):1232-1233. PubMed
10. Bhandari M, Devereaux P, Guyatt GH, et al. An observational study of orthopaedic abstracts and subsequent full-text publications. J Bone Joint Surg Am. 2002;84(4):615-621. PubMed
11. Castagnetti M, Subramaniam R, El-Ghoneimi A. Abstracts presented at the European Society for Pediatric Urology (ESPU) meetings (2003–2010): Characteristics and outcome. J Pediatr Urol. 2014;10(2):355-360. PubMed
12. Halikman R, Scolnik D, Rimon A, Glatstein MM. Peer-Reviewed Journal Publication of Abstracts Presented at an International Emergency Medicine Scientific Meeting: Outcomes and Comparison With the Previous Meeting. Pediatr Emerg Care. 2016. PubMed
13. Relman AS. Peer review in scientific journals--what good is it? West J Med. 1990;153(5):520. PubMed
14. Riordan F. Do presenters to paediatric meetings get their work published? Arch Dis Child. 2000;83(6):524-526. PubMed
15. Scherer RW, Dickersin K, Langenberg P. Full publication of results initially presented in abstracts: a meta-analysis. JAMA. 1994;272(2):158-162. PubMed
16. Scherer RW, Langenberg P, Elm E. Full publication of results initially presented in abstracts. Cochrane Database Syst Rev. 2005. PubMed
17. Marx WF, Cloft HJ, Do HM, Kallmes DF. The fate of neuroradiologic abstracts presented at national meetings in 1993: rate of subsequent publication in peer-reviewed, indexed journals. Am J Neuroradiol. 1999;20(6):1173-1177. PubMed
18. Roy D, Sankar V, Hughes J, Jones A, Fenton J. Publication rates of scientific papers presented at the Otorhinolarygological Research Society meetings. Clin Otolaryngol Allied Sci. 2001;26(3):253-256. PubMed
19. McCormick MC, Holmes JH. Publication of research presented at the pediatric meetings: change in selection. Am J Dis Child. 1985;139(2):122-126. PubMed
20. Carroll AE, Sox CM, Tarini BA, Ringold S, Christakis DA. Does presentation format at the Pediatric Academic Societies’ annual meeting predict subsequent publication? Pediatrics. 2003;112(6):1238-1241. PubMed
21. Saha S, Saint S, Christakis DA. Impact factor: a valid measure of journal quality? J Med Libr Assoc. 2003;91(1):42. PubMed
22. Office for Human Research Protections. Code of Federal Regulations, Title 45 Public Welfare: Part 46, Protection of Human Subjects, §46.102(f ). http://www.hhs.gov/ohrp/regulations-and-policy/regulations/45-cfr-46/index.html#46.102. Accessed October 21, 2016.
23. Weber EJ, Callaham ML, Wears RL, Barton C, Young G. Unpublished research from a medical specialty meeting: why investigators fail to publish. JAMA. 1998;280(3):257-259. PubMed
24. Timmer A, Hilsden RJ, Cole J, Hailey D, Sutherland LR. Publication bias in gastroenterological research–a retrospective cohort study based on abstracts submitted to a scientific meeting. BMC Med Res Methodol. 2002;2(1):1. PubMed
© 2018 Society of Hospital Medicine
Regional Variation in Standardized Costs of Care at Children’s Hospitals
With some areas of the country spending close to 3 times more on healthcare than others, regional variation in healthcare spending has been the focus of national attention.1-7 Since 1973, the Dartmouth Institute has studied regional variation in healthcare utilization and spending and concluded that variation is “unwarranted” because it is driven by providers’ practice patterns rather than differences in medical need, patient preferences, or evidence-based medicine.8-11 However, critics of the Dartmouth Institute’s findings argue that their approach does not adequately adjust for community-level income, and that higher costs in some areas reflect greater patient needs that are not reflected in illness acuity alone.12-14
While Medicare data have made it possible to study variations in spending for the senior population, fragmentation of insurance coverage and nonstandardized data structures make studying the pediatric population more difficult. However, the Children’s Hospital Association’s (CHA) Pediatric Health Information System (PHIS) has made large-scale comparisons more feasible. To overcome challenges associated with using charges and nonuniform cost data, PHIS-derived standardized costs provide new opportunities for comparisons.15,16 Initial analyses using PHIS data showed significant interhospital variations in costs of care,15 but they did not adjust for differences in populations and assess the drivers of variation. A more recent study that controlled for payer status, comorbidities, and illness severity found that intensive care unit (ICU) utilization varied significantly for children hospitalized for asthma, suggesting that hospital practice patterns drive differences in cost.17
This study uses PHIS data to analyze regional variations in standardized costs of care for 3 conditions for which children are hospitalized. To assess potential drivers of variation, the study investigates the effects of patient-level demographic and illness-severity variables as well as encounter-level variables on costs of care. It also estimates cost savings from reducing variation.
METHODS
Data Source
This retrospective cohort study uses the PHIS database (CHA, Overland Park, KS), which includes 48 freestanding children’s hospitals located in noncompeting markets across the United States and accounts for approximately 20% of pediatric hospitalizations. PHIS includes patient demographics, International Classification of Diseases, 9th Revision (ICD-9) diagnosis and procedure codes, as well as hospital charges. In addition to total charges, PHIS reports imaging, laboratory, pharmacy, and “other” charges. The “other” category aggregates clinical, supply, room, and nursing charges (including facility fees and ancillary staff services).
Inclusion Criteria
Inpatient- and observation-status hospitalizations for asthma, diabetic ketoacidosis (DKA), and acute gastroenteritis (AGE) at 46 PHIS hospitals from October 2014 to September 2015 were included. Two hospitals were excluded because of missing data. Hospitalizations for patients >18 years were excluded.
Hospitalizations were categorized by using All Patient Refined-Diagnosis Related Groups (APR-DRGs) version 24 (3M Health Information Systems, St. Paul, MN)18 based on the ICD-9 diagnosis and procedure codes assigned during the episode of care. Analyses included APR-DRG 141 (asthma), primary diagnosis ICD-9 codes 250.11 and 250.13 (DKA), and APR-DRG 249 (AGE). ICD-9 codes were used for DKA for increased specificity.19 These conditions were chosen to represent 3 clinical scenarios: (1) a diagnosis for which hospitals differ on whether certain aspects of care are provided in the ICU (asthma), (2) a diagnosis that frequently includes care in an ICU (DKA), and (3) a diagnosis that typically does not include ICU care (AGE).19
Study Design
To focus the analysis on variation in resource utilization across hospitals rather than variations in hospital item charges, each billed resource was assigned a standardized cost.15,16 For each clinical transaction code (CTC), the median unit cost was calculated for each hospital. The median of the hospital medians was defined as the standardized unit cost for that CTC.
The primary outcome variable was the total standardized cost for the hospitalization adjusted for patient-level demographic and illness-severity variables. Patient demographic and illness-severity covariates included age, race, gender, ZIP code-based median annual household income (HHI), rural-urban location, distance from home ZIP code to the hospital, chronic condition indicator (CCI), and severity-of-illness (SOI). When assessing drivers of variation, encounter-level covariates were added, including length of stay (LOS) in hours, ICU utilization, and 7-day readmission (an imprecise measure to account for quality of care during the index visit). The contribution of imaging, laboratory, pharmacy, and “other” costs was also considered.
Median annual HHI for patients’ home ZIP code was obtained from 2010 US Census data. Community-level HHI, a proxy for socioeconomic status (SES),20,21 was classified into categories based on the 2015 US federal poverty level (FPL) for a family of 422: HHI-1 = ≤ 1.5 × FPL; HHI-2 = 1.5 to 2 × FPL; HHI-3 = 2 to 3 × FPL; HHI-4 = ≥ 3 × FPL. Rural-urban commuting area (RUCA) codes were used to determine the rural-urban classification of the patient’s home.23 The distance from home ZIP code to the hospital was included as an additional control for illness severity because patients traveling longer distances are often more sick and require more resources.24
The Agency for Healthcare Research and Quality CCI classification system was used to identify the presence of a chronic condition.25 For asthma, CCI was flagged if the patient had a chronic condition other than asthma; for DKA, CCI was flagged if the patient had a chronic condition other than DKA; and for AGE, CCI was flagged if the patient had any chronic condition.
The APR-DRG system provides a 4-level SOI score with each APR-DRG category. Patient factors, such as comorbid diagnoses, are considered in severity scores generated through 3M’s proprietary algorithms.18
For the first analysis, the 46 hospitals were categorized into 7 geographic regions based on 2010 US Census Divisions.26 To overcome small hospital sample sizes, Mountain and Pacific were combined into West, and Middle Atlantic and New England were combined into North East. Because PHIS hospitals are located in noncompeting geographic regions, for the second analysis, we examined hospital-level variation (considering each hospital as its own region).
Data Analysis
To focus the analysis on “typical” patients and produce more robust estimates of central tendencies, the top and bottom 5% of hospitalizations with the most extreme standardized costs by condition were trimmed.27 Standardized costs were log-transformed because of their nonnormal distribution and analyzed by using linear mixed models. Covariates were added stepwise to assess the proportion of the variance explained by each predictor. Post-hoc tests with conservative single-step stepwise mutation model corrections for multiple testing were used to compare adjusted costs. Statistical analyses were performed using SAS version 9.3 (SAS Institute, Cary, NC). P values < 0.05 were considered significant. The Children’s Hospital of Philadelphia Institutional Review Board did not classify this study as human subjects research.
RESULTS

During the study period, there were 26,430 hospitalizations for asthma, 5056 for DKA, and 16,274 for AGE (Table 1).
Variation Across Census Regions
After adjusting for patient-level demographic and illness-severity variables, differences in adjusted total standardized costs remained between regions (P < 0.001). Although no region was an outlier compared to the overall mean for any of the conditions, regions were statistically different in pairwise comparison. The East North Central, South Atlantic, and West South Central regions had the highest adjusted total standardized costs for each of the conditions. The East South Central and West North Central regions had the lowest costs for each of the conditions. Adjusted total standardized costs were 120% higher for asthma ($1920 vs $4227), 46% higher for DKA ($7429 vs $10,881), and 150% higher for AGE ($3316 vs $8292) in the highest-cost region compared with the lowest-cost region (Table 2A).
Variation Within Census Regions

After controlling for patient-level demographic and illness-severity variables, standardized costs were different across hospitals in the same region (P < 0.001; panel A in Figure). This was true for all conditions in each region. Differences between the lowest- and highest-cost hospitals within the same region ranged from 111% to 420% for asthma, 101% to 398% for DKA, and 166% to 787% for AGE (Table 3).
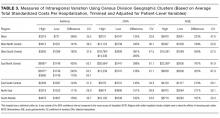
Variation Across Hospitals (Each Hospital as Its Own Region)
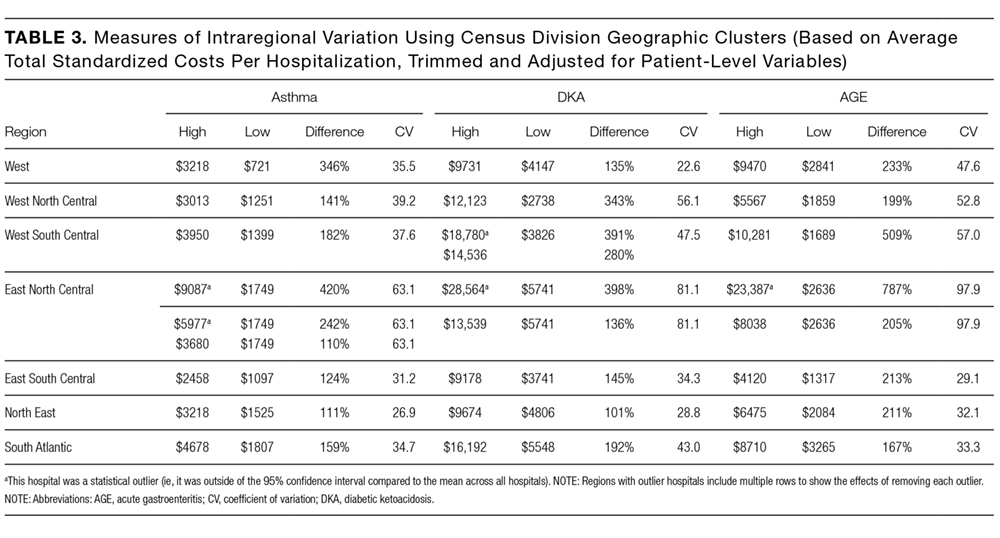
One hospital had the highest adjusted standardized costs for all 3 conditions ($9087 for asthma, $28,564 for DKA, and $23,387 for AGE) and was outside of the 95% confidence interval compared with the overall means. The second highest-cost hospitals for asthma ($5977) and AGE ($18,780) were also outside of the 95% confidence interval. After removing these outliers, the difference between the highest- and lowest-cost hospitals was 549% for asthma ($721 vs $4678), 491% for DKA ($2738 vs $16,192), and 681% for AGE ($1317 vs $10,281; Table 2B).
Drivers of Variation Across Census Regions
Patient-level demographic and illness-severity variables explained very little of the variation in standardized costs across regions. For each of the conditions, age, race, gender, community-level HHI, RUCA, and distance from home to the hospital each accounted for <1.5% of variation, while SOI and CCI each accounted for <5%. Overall, patient-level variables explained 5.5%, 3.7%, and 6.7% of variation for asthma, DKA, and AGE.
Encounter-level variables explained a much larger percentage of the variation in costs. LOS accounted for 17.8% of the variation for asthma, 9.8% for DKA, and 8.7% for AGE. ICU utilization explained 6.9% of the variation for asthma and 12.5% for DKA; ICU use was not a major driver for AGE. Seven-day readmissions accounted for <0.5% for each of the conditions. The combination of patient-level and encounter-level variables explained 27%, 24%, and 15% of the variation for asthma, DKA, and AGE.
Drivers of Variation Across Hospitals
For each of the conditions, patient-level demographic variables each accounted for <2% of variation in costs between hospitals. SOI accounted for 4.5% of the variation for asthma and CCI accounted for 5.2% for AGE. Overall, patient-level variables explained 6.9%, 5.3%, and 7.3% of variation for asthma, DKA, and AGE.
Encounter-level variables accounted for a much larger percentage of the variation in cost. LOS explained 25.4% for asthma, 13.3% for DKA, and 14.2% for AGE. ICU utilization accounted for 13.4% for asthma and 21.9% for DKA; ICU use was not a major driver for AGE. Seven-day readmissions accounted for <0.5% for each of the conditions. Together, patient-level and encounter-level variables explained 40%, 36%, and 22% of variation for asthma, DKA, and AGE.
Imaging, Laboratory, Pharmacy, and “Other” Costs
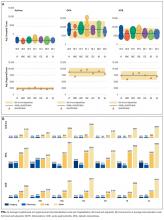
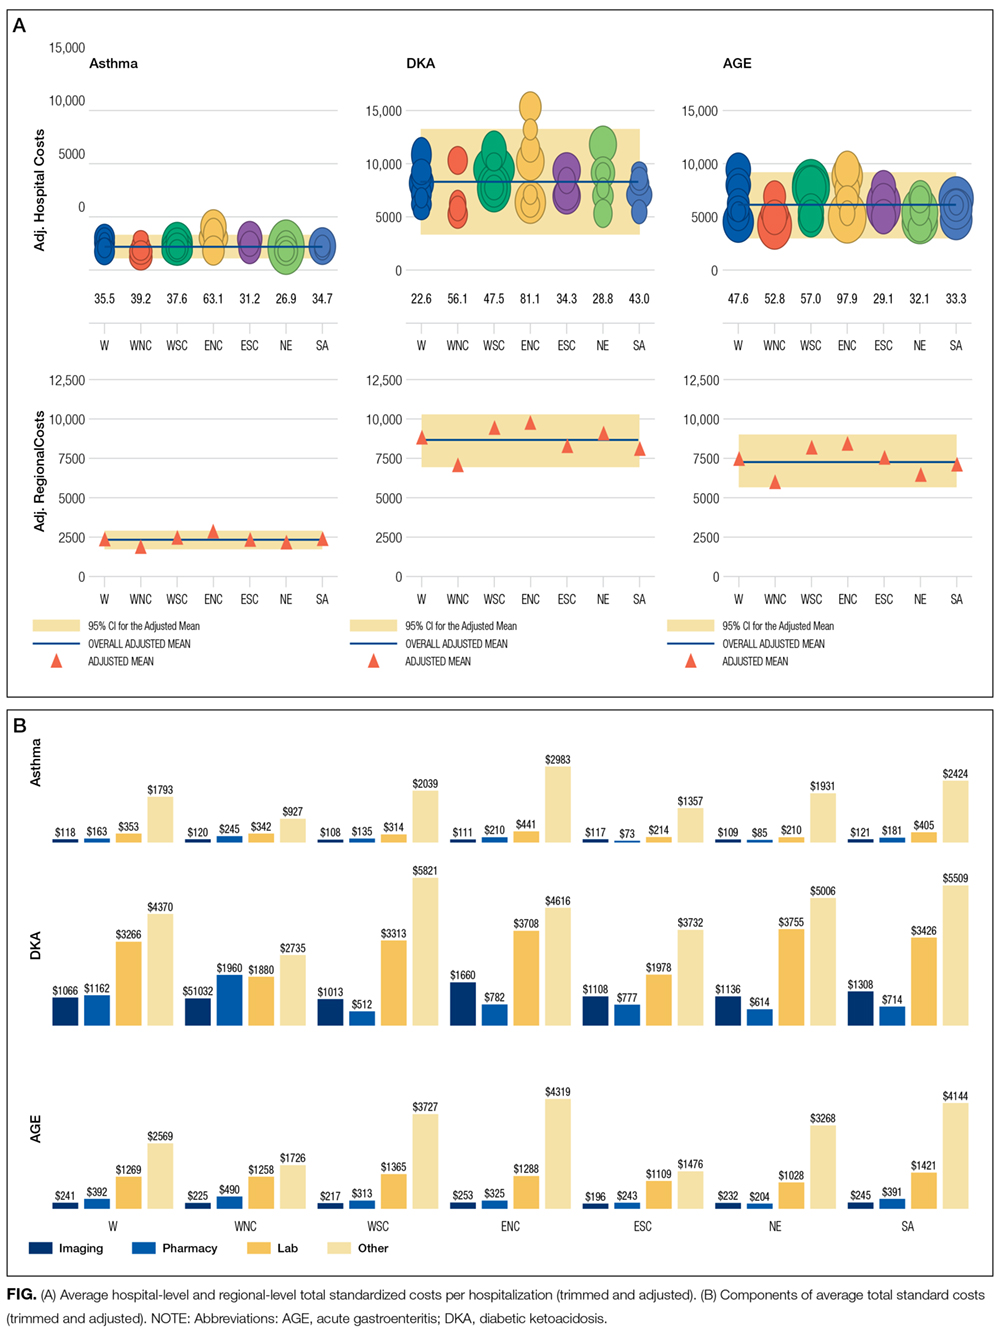
The largest contributor to total costs adjusted for patient-level factors for all conditions was “other,” which aggregates room, nursing, clinical, and supply charges (panel B in Figure). When considering drivers of variation, this category explained >50% for each of the conditions. The next largest contributor to total costs was laboratory charges, which accounted for 15% of the variation across regions for asthma and 11% for DKA. Differences in imaging accounted for 18% of the variation for DKA and 15% for AGE. Differences in pharmacy charges accounted for <4% of the variation for each of the conditions. Adding the 4 cost components to the other patient- and encounter-level covariates, the model explained 81%, 78%, and 72% of the variation across census regions for asthma, DKA, and AGE.
For the hospital-level analysis, differences in “other” remained the largest driver of cost variation. For asthma, “other” explained 61% of variation, while pharmacy, laboratory, and imaging each accounted for <8%. For DKA, differences in imaging accounted for 18% of the variation and laboratory charges accounted for 12%. For AGE, imaging accounted for 15% of the variation. Adding the 4 cost components to the other patient- and encounter-level covariates, the model explained 81%, 72%, and 67% of the variation for asthma, DKA, and AGE.
Cost Savings
If all hospitals in this cohort with adjusted standardized costs above the national PHIS average achieved costs equal to the national PHIS average, estimated annual savings in adjusted standardized costs for these 3 conditions would be $69.1 million. If each hospital with adjusted costs above the average within its census region achieved costs equal to its regional average, estimated annual savings in adjusted standardized costs for these conditions would be $25.2 million.
DISCUSSION
This study reported on the regional variation in costs of care for 3 conditions treated at 46 children’s hospitals across 7 geographic regions, and it demonstrated that variations in costs of care exist in pediatrics. This study used standardized costs to compare utilization patterns across hospitals and adjusted for several patient-level demographic and illness-severity factors, and it found that differences in costs of care for children hospitalized with asthma, DKA, and AGE remained both between and within regions.
These variations are noteworthy, as hospitals strive to improve the value of healthcare. If the higher-cost hospitals in this cohort could achieve costs equal to the national PHIS averages, estimated annual savings in adjusted standardized costs for these conditions alone would equal $69.1 million. If higher-cost hospitals relative to the average in their own region reduced costs to their regional averages, annual standardized cost savings could equal $25.2 million for these conditions.
The differences observed are also significant in that they provide a foundation for exploring whether lower-cost regions or lower-cost hospitals achieve comparable quality outcomes.28 If so, studying what those hospitals do to achieve outcomes more efficiently can serve as the basis for the establishment of best practices.29 Standardizing best practices through protocols, pathways, and care-model redesign can reduce potentially unnecessary spending.30
Our findings showed that patient-level demographic and illness-severity covariates, including community-level HHI and SOI, did not consistently explain cost differences. Instead, LOS and ICU utilization were associated with higher costs.17,19 When considering the effect of the 4 cost components on the variation in total standardized costs between regions and between hospitals, the fact that the “other” category accounted for the largest percent of the variation is not surprising, because the cost of room occupancy and nursing services increases with longer LOS and more time in the ICU. Other individual cost components that were major drivers of variation were laboratory utilization for asthma and imaging for DKA and AGE31 (though they accounted for a much smaller proportion of total adjusted costs).19
To determine if these factors are modifiable, more information is needed to explain why practices differ. Many factors may contribute to varying utilization patterns, including differences in capabilities and resources (in the hospital and in the community) and patient volumes. For example, some hospitals provide continuous albuterol for status asthmaticus only in ICUs, while others provide it on regular units.32 But if certain hospitals do not have adequate resources or volumes to effectively care for certain populations outside of the ICU, their higher-value approach (considering quality and cost) may be to utilize ICU beds, even if some other hospitals care for those patients on non-ICU floors. Another possibility is that family preferences about care delivery (such as how long children stay in the hospital) may vary across regions.33
Other evidence suggests that physician practice and spending patterns are strongly influenced by the practices of the region where they trained.34 Because physicians often practice close to where they trained,35,36 this may partially explain how regional patterns are reinforced.
Even considering all mentioned covariates, our model did not fully explain variation in standardized costs. After adding the cost components as covariates, between one-third and one-fifth of the variation remained unexplained. It is possible that this unexplained variation stemmed from unmeasured patient-level factors.
In addition, while proxies for SES, including community-level HHI, did not significantly predict differences in costs across regions, it is possible that SES affected LOS differently in different regions. Previous studies have suggested that lower SES is associated with longer LOS.37 If this effect is more pronounced in certain regions (potentially because of differences in social service infrastructures), SES may be contributing to variations in cost through LOS.
Our findings were subject to limitations. First, this study only examined 3 diagnoses and did not include surgical or less common conditions. Second, while PHIS includes tertiary care, academic, and freestanding children’s hospitals, it does not include general hospitals, which is where most pediatric patients receive care.38 Third, we used ZIP code-based median annual HHI to account for SES, and we used ZIP codes to determine the distance to the hospital and rural-urban location of patients’ homes. These approximations lack precision because SES and distances vary within ZIP codes.39 Fourth, while adjusted standardized costs allow for comparisons between hospitals, they do not represent actual costs to patients or individual hospitals. Additionally, when determining whether variation remained after controlling for patient-level variables, we included SOI as a reflection of illness-severity at presentation. However, in practice, SOI scores may be assigned partially based on factors determined during the hospitalization.18 Finally, the use of other regional boundaries or the selection of different hospitals may yield different results.
CONCLUSION
This study reveals regional variations in costs of care for 3 inpatient pediatric conditions. Future studies should explore whether lower-cost regions or lower-cost hospitals achieve comparable quality outcomes. To the extent that variation is driven by modifiable factors and lower spending does not compromise outcomes, these data may prompt reviews of care models to reduce unwarranted variation and improve the value of care delivery at local, regional, and national levels.
Disclosure
Internal funds from the CHA and The Children’s Hospital of Philadelphia supported the conduct of this work. The authors have no financial interests, relationships, or affiliations relevant to the subject matter or materials discussed in the manuscript to disclose. The authors have no potential conflicts of interest relevant to the subject matter or materials discussed in the manuscript to disclose
1. Fisher E, Skinner J. Making Sense of Geographic Variations in Health Care: The New IOM Report. 2013; http://healthaffairs.org/blog/2013/07/24/making-sense-of-geographic-variations-in-health-care-the-new-iom-report/. Accessed on April 11, 2014.
With some areas of the country spending close to 3 times more on healthcare than others, regional variation in healthcare spending has been the focus of national attention.1-7 Since 1973, the Dartmouth Institute has studied regional variation in healthcare utilization and spending and concluded that variation is “unwarranted” because it is driven by providers’ practice patterns rather than differences in medical need, patient preferences, or evidence-based medicine.8-11 However, critics of the Dartmouth Institute’s findings argue that their approach does not adequately adjust for community-level income, and that higher costs in some areas reflect greater patient needs that are not reflected in illness acuity alone.12-14
While Medicare data have made it possible to study variations in spending for the senior population, fragmentation of insurance coverage and nonstandardized data structures make studying the pediatric population more difficult. However, the Children’s Hospital Association’s (CHA) Pediatric Health Information System (PHIS) has made large-scale comparisons more feasible. To overcome challenges associated with using charges and nonuniform cost data, PHIS-derived standardized costs provide new opportunities for comparisons.15,16 Initial analyses using PHIS data showed significant interhospital variations in costs of care,15 but they did not adjust for differences in populations and assess the drivers of variation. A more recent study that controlled for payer status, comorbidities, and illness severity found that intensive care unit (ICU) utilization varied significantly for children hospitalized for asthma, suggesting that hospital practice patterns drive differences in cost.17
This study uses PHIS data to analyze regional variations in standardized costs of care for 3 conditions for which children are hospitalized. To assess potential drivers of variation, the study investigates the effects of patient-level demographic and illness-severity variables as well as encounter-level variables on costs of care. It also estimates cost savings from reducing variation.
METHODS
Data Source
This retrospective cohort study uses the PHIS database (CHA, Overland Park, KS), which includes 48 freestanding children’s hospitals located in noncompeting markets across the United States and accounts for approximately 20% of pediatric hospitalizations. PHIS includes patient demographics, International Classification of Diseases, 9th Revision (ICD-9) diagnosis and procedure codes, as well as hospital charges. In addition to total charges, PHIS reports imaging, laboratory, pharmacy, and “other” charges. The “other” category aggregates clinical, supply, room, and nursing charges (including facility fees and ancillary staff services).
Inclusion Criteria
Inpatient- and observation-status hospitalizations for asthma, diabetic ketoacidosis (DKA), and acute gastroenteritis (AGE) at 46 PHIS hospitals from October 2014 to September 2015 were included. Two hospitals were excluded because of missing data. Hospitalizations for patients >18 years were excluded.
Hospitalizations were categorized by using All Patient Refined-Diagnosis Related Groups (APR-DRGs) version 24 (3M Health Information Systems, St. Paul, MN)18 based on the ICD-9 diagnosis and procedure codes assigned during the episode of care. Analyses included APR-DRG 141 (asthma), primary diagnosis ICD-9 codes 250.11 and 250.13 (DKA), and APR-DRG 249 (AGE). ICD-9 codes were used for DKA for increased specificity.19 These conditions were chosen to represent 3 clinical scenarios: (1) a diagnosis for which hospitals differ on whether certain aspects of care are provided in the ICU (asthma), (2) a diagnosis that frequently includes care in an ICU (DKA), and (3) a diagnosis that typically does not include ICU care (AGE).19
Study Design
To focus the analysis on variation in resource utilization across hospitals rather than variations in hospital item charges, each billed resource was assigned a standardized cost.15,16 For each clinical transaction code (CTC), the median unit cost was calculated for each hospital. The median of the hospital medians was defined as the standardized unit cost for that CTC.
The primary outcome variable was the total standardized cost for the hospitalization adjusted for patient-level demographic and illness-severity variables. Patient demographic and illness-severity covariates included age, race, gender, ZIP code-based median annual household income (HHI), rural-urban location, distance from home ZIP code to the hospital, chronic condition indicator (CCI), and severity-of-illness (SOI). When assessing drivers of variation, encounter-level covariates were added, including length of stay (LOS) in hours, ICU utilization, and 7-day readmission (an imprecise measure to account for quality of care during the index visit). The contribution of imaging, laboratory, pharmacy, and “other” costs was also considered.
Median annual HHI for patients’ home ZIP code was obtained from 2010 US Census data. Community-level HHI, a proxy for socioeconomic status (SES),20,21 was classified into categories based on the 2015 US federal poverty level (FPL) for a family of 422: HHI-1 = ≤ 1.5 × FPL; HHI-2 = 1.5 to 2 × FPL; HHI-3 = 2 to 3 × FPL; HHI-4 = ≥ 3 × FPL. Rural-urban commuting area (RUCA) codes were used to determine the rural-urban classification of the patient’s home.23 The distance from home ZIP code to the hospital was included as an additional control for illness severity because patients traveling longer distances are often more sick and require more resources.24
The Agency for Healthcare Research and Quality CCI classification system was used to identify the presence of a chronic condition.25 For asthma, CCI was flagged if the patient had a chronic condition other than asthma; for DKA, CCI was flagged if the patient had a chronic condition other than DKA; and for AGE, CCI was flagged if the patient had any chronic condition.
The APR-DRG system provides a 4-level SOI score with each APR-DRG category. Patient factors, such as comorbid diagnoses, are considered in severity scores generated through 3M’s proprietary algorithms.18
For the first analysis, the 46 hospitals were categorized into 7 geographic regions based on 2010 US Census Divisions.26 To overcome small hospital sample sizes, Mountain and Pacific were combined into West, and Middle Atlantic and New England were combined into North East. Because PHIS hospitals are located in noncompeting geographic regions, for the second analysis, we examined hospital-level variation (considering each hospital as its own region).
Data Analysis
To focus the analysis on “typical” patients and produce more robust estimates of central tendencies, the top and bottom 5% of hospitalizations with the most extreme standardized costs by condition were trimmed.27 Standardized costs were log-transformed because of their nonnormal distribution and analyzed by using linear mixed models. Covariates were added stepwise to assess the proportion of the variance explained by each predictor. Post-hoc tests with conservative single-step stepwise mutation model corrections for multiple testing were used to compare adjusted costs. Statistical analyses were performed using SAS version 9.3 (SAS Institute, Cary, NC). P values < 0.05 were considered significant. The Children’s Hospital of Philadelphia Institutional Review Board did not classify this study as human subjects research.
RESULTS
During the study period, there were 26,430 hospitalizations for asthma, 5056 for DKA, and 16,274 for AGE (Table 1).
Variation Across Census Regions
After adjusting for patient-level demographic and illness-severity variables, differences in adjusted total standardized costs remained between regions (P < 0.001). Although no region was an outlier compared to the overall mean for any of the conditions, regions were statistically different in pairwise comparison. The East North Central, South Atlantic, and West South Central regions had the highest adjusted total standardized costs for each of the conditions. The East South Central and West North Central regions had the lowest costs for each of the conditions. Adjusted total standardized costs were 120% higher for asthma ($1920 vs $4227), 46% higher for DKA ($7429 vs $10,881), and 150% higher for AGE ($3316 vs $8292) in the highest-cost region compared with the lowest-cost region (Table 2A).
Variation Within Census Regions
After controlling for patient-level demographic and illness-severity variables, standardized costs were different across hospitals in the same region (P < 0.001; panel A in Figure). This was true for all conditions in each region. Differences between the lowest- and highest-cost hospitals within the same region ranged from 111% to 420% for asthma, 101% to 398% for DKA, and 166% to 787% for AGE (Table 3).
Variation Across Hospitals (Each Hospital as Its Own Region)
One hospital had the highest adjusted standardized costs for all 3 conditions ($9087 for asthma, $28,564 for DKA, and $23,387 for AGE) and was outside of the 95% confidence interval compared with the overall means. The second highest-cost hospitals for asthma ($5977) and AGE ($18,780) were also outside of the 95% confidence interval. After removing these outliers, the difference between the highest- and lowest-cost hospitals was 549% for asthma ($721 vs $4678), 491% for DKA ($2738 vs $16,192), and 681% for AGE ($1317 vs $10,281; Table 2B).
Drivers of Variation Across Census Regions
Patient-level demographic and illness-severity variables explained very little of the variation in standardized costs across regions. For each of the conditions, age, race, gender, community-level HHI, RUCA, and distance from home to the hospital each accounted for <1.5% of variation, while SOI and CCI each accounted for <5%. Overall, patient-level variables explained 5.5%, 3.7%, and 6.7% of variation for asthma, DKA, and AGE.
Encounter-level variables explained a much larger percentage of the variation in costs. LOS accounted for 17.8% of the variation for asthma, 9.8% for DKA, and 8.7% for AGE. ICU utilization explained 6.9% of the variation for asthma and 12.5% for DKA; ICU use was not a major driver for AGE. Seven-day readmissions accounted for <0.5% for each of the conditions. The combination of patient-level and encounter-level variables explained 27%, 24%, and 15% of the variation for asthma, DKA, and AGE.
Drivers of Variation Across Hospitals
For each of the conditions, patient-level demographic variables each accounted for <2% of variation in costs between hospitals. SOI accounted for 4.5% of the variation for asthma and CCI accounted for 5.2% for AGE. Overall, patient-level variables explained 6.9%, 5.3%, and 7.3% of variation for asthma, DKA, and AGE.
Encounter-level variables accounted for a much larger percentage of the variation in cost. LOS explained 25.4% for asthma, 13.3% for DKA, and 14.2% for AGE. ICU utilization accounted for 13.4% for asthma and 21.9% for DKA; ICU use was not a major driver for AGE. Seven-day readmissions accounted for <0.5% for each of the conditions. Together, patient-level and encounter-level variables explained 40%, 36%, and 22% of variation for asthma, DKA, and AGE.
Imaging, Laboratory, Pharmacy, and “Other” Costs
The largest contributor to total costs adjusted for patient-level factors for all conditions was “other,” which aggregates room, nursing, clinical, and supply charges (panel B in Figure). When considering drivers of variation, this category explained >50% for each of the conditions. The next largest contributor to total costs was laboratory charges, which accounted for 15% of the variation across regions for asthma and 11% for DKA. Differences in imaging accounted for 18% of the variation for DKA and 15% for AGE. Differences in pharmacy charges accounted for <4% of the variation for each of the conditions. Adding the 4 cost components to the other patient- and encounter-level covariates, the model explained 81%, 78%, and 72% of the variation across census regions for asthma, DKA, and AGE.
For the hospital-level analysis, differences in “other” remained the largest driver of cost variation. For asthma, “other” explained 61% of variation, while pharmacy, laboratory, and imaging each accounted for <8%. For DKA, differences in imaging accounted for 18% of the variation and laboratory charges accounted for 12%. For AGE, imaging accounted for 15% of the variation. Adding the 4 cost components to the other patient- and encounter-level covariates, the model explained 81%, 72%, and 67% of the variation for asthma, DKA, and AGE.
Cost Savings
If all hospitals in this cohort with adjusted standardized costs above the national PHIS average achieved costs equal to the national PHIS average, estimated annual savings in adjusted standardized costs for these 3 conditions would be $69.1 million. If each hospital with adjusted costs above the average within its census region achieved costs equal to its regional average, estimated annual savings in adjusted standardized costs for these conditions would be $25.2 million.
DISCUSSION
This study reported on the regional variation in costs of care for 3 conditions treated at 46 children’s hospitals across 7 geographic regions, and it demonstrated that variations in costs of care exist in pediatrics. This study used standardized costs to compare utilization patterns across hospitals and adjusted for several patient-level demographic and illness-severity factors, and it found that differences in costs of care for children hospitalized with asthma, DKA, and AGE remained both between and within regions.
These variations are noteworthy, as hospitals strive to improve the value of healthcare. If the higher-cost hospitals in this cohort could achieve costs equal to the national PHIS averages, estimated annual savings in adjusted standardized costs for these conditions alone would equal $69.1 million. If higher-cost hospitals relative to the average in their own region reduced costs to their regional averages, annual standardized cost savings could equal $25.2 million for these conditions.
The differences observed are also significant in that they provide a foundation for exploring whether lower-cost regions or lower-cost hospitals achieve comparable quality outcomes.28 If so, studying what those hospitals do to achieve outcomes more efficiently can serve as the basis for the establishment of best practices.29 Standardizing best practices through protocols, pathways, and care-model redesign can reduce potentially unnecessary spending.30
Our findings showed that patient-level demographic and illness-severity covariates, including community-level HHI and SOI, did not consistently explain cost differences. Instead, LOS and ICU utilization were associated with higher costs.17,19 When considering the effect of the 4 cost components on the variation in total standardized costs between regions and between hospitals, the fact that the “other” category accounted for the largest percent of the variation is not surprising, because the cost of room occupancy and nursing services increases with longer LOS and more time in the ICU. Other individual cost components that were major drivers of variation were laboratory utilization for asthma and imaging for DKA and AGE31 (though they accounted for a much smaller proportion of total adjusted costs).19
To determine if these factors are modifiable, more information is needed to explain why practices differ. Many factors may contribute to varying utilization patterns, including differences in capabilities and resources (in the hospital and in the community) and patient volumes. For example, some hospitals provide continuous albuterol for status asthmaticus only in ICUs, while others provide it on regular units.32 But if certain hospitals do not have adequate resources or volumes to effectively care for certain populations outside of the ICU, their higher-value approach (considering quality and cost) may be to utilize ICU beds, even if some other hospitals care for those patients on non-ICU floors. Another possibility is that family preferences about care delivery (such as how long children stay in the hospital) may vary across regions.33
Other evidence suggests that physician practice and spending patterns are strongly influenced by the practices of the region where they trained.34 Because physicians often practice close to where they trained,35,36 this may partially explain how regional patterns are reinforced.
Even considering all mentioned covariates, our model did not fully explain variation in standardized costs. After adding the cost components as covariates, between one-third and one-fifth of the variation remained unexplained. It is possible that this unexplained variation stemmed from unmeasured patient-level factors.
In addition, while proxies for SES, including community-level HHI, did not significantly predict differences in costs across regions, it is possible that SES affected LOS differently in different regions. Previous studies have suggested that lower SES is associated with longer LOS.37 If this effect is more pronounced in certain regions (potentially because of differences in social service infrastructures), SES may be contributing to variations in cost through LOS.
Our findings were subject to limitations. First, this study only examined 3 diagnoses and did not include surgical or less common conditions. Second, while PHIS includes tertiary care, academic, and freestanding children’s hospitals, it does not include general hospitals, which is where most pediatric patients receive care.38 Third, we used ZIP code-based median annual HHI to account for SES, and we used ZIP codes to determine the distance to the hospital and rural-urban location of patients’ homes. These approximations lack precision because SES and distances vary within ZIP codes.39 Fourth, while adjusted standardized costs allow for comparisons between hospitals, they do not represent actual costs to patients or individual hospitals. Additionally, when determining whether variation remained after controlling for patient-level variables, we included SOI as a reflection of illness-severity at presentation. However, in practice, SOI scores may be assigned partially based on factors determined during the hospitalization.18 Finally, the use of other regional boundaries or the selection of different hospitals may yield different results.
CONCLUSION
This study reveals regional variations in costs of care for 3 inpatient pediatric conditions. Future studies should explore whether lower-cost regions or lower-cost hospitals achieve comparable quality outcomes. To the extent that variation is driven by modifiable factors and lower spending does not compromise outcomes, these data may prompt reviews of care models to reduce unwarranted variation and improve the value of care delivery at local, regional, and national levels.
Disclosure
Internal funds from the CHA and The Children’s Hospital of Philadelphia supported the conduct of this work. The authors have no financial interests, relationships, or affiliations relevant to the subject matter or materials discussed in the manuscript to disclose. The authors have no potential conflicts of interest relevant to the subject matter or materials discussed in the manuscript to disclose
1. Fisher E, Skinner J. Making Sense of Geographic Variations in Health Care: The New IOM Report. 2013; http://healthaffairs.org/blog/2013/07/24/making-sense-of-geographic-variations-in-health-care-the-new-iom-report/. Accessed on April 11, 2014.
1. Fisher E, Skinner J. Making Sense of Geographic Variations in Health Care: The New IOM Report. 2013; http://healthaffairs.org/blog/2013/07/24/making-sense-of-geographic-variations-in-health-care-the-new-iom-report/. Accessed on April 11, 2014.
© 2017 Society of Hospital Medicine
Resource Utilization and Satisfaction
The patient experience has become increasingly important to healthcare in the United States. It is now a metric used commonly to determine physician compensation and accounts for nearly 30% of the Centers for Medicare and Medicaid Services' (CMS) Value‐Based Purchasing (VBP) reimbursement for fiscal years 2015 and 2016.[1, 2]
In April 2015, CMS added a 5‐star patient experience score to its Hospital Compare website in an attempt to address the Affordable Care Act's call for transparent and easily understandable public reporting.[3] A hospital's principal score is the Summary Star Rating, which is based on responses to the Hospital Consumer Assessment of Healthcare Providers and Systems (HCAHPS) survey. The formulas used to calculate Summary Star Ratings have been reported by CMS.[4]
Studies published over the past decade suggest that gender, age, education level, length of hospital stay, travel distance, and other factors may influence patient satisfaction.[5, 6, 7, 8] One study utilizing a national dataset suggested that higher patient satisfaction was associated with greater inpatient healthcare utilization and higher healthcare expenditures.[9] It is therefore possible that emphasizing patient experience scores could adversely impact healthcare resource utilization. However, positive patient experience may also be an important independent dimension of quality for patients and correlate with improved clinical outcomes.[10]
We know of no literature describing patient factors associated with the Summary Star Rating. Given that this rating is now used as a standard metric by which patient experience can be compared across more than 3,500 hospitals,[11] data describing the association between patient‐level factors and the Summary Star Rating may provide hospitals with an opportunity to target improvement efforts. We aimed to determine the degree to which resource utilization is associated with a satisfaction score based on the Summary Star Rating methodology.
METHODS
The study was conducted at the University of Rochester Medical Center (URMC), an 830‐bed tertiary care center in upstate New York. This was a retrospective review of all HCAHPS surveys returned to URMC over a 27‐month period from January 1, 2012 to April 1, 2014. URMC follows the standard CMS process for determining which patients receive surveys as follows. During the study timeframe, HCAHPS surveys were mailed to patients 18 years of age and older who had an inpatient stay spanning at least 1 midnight. Surveys were mailed within 5 days of discharge, and were generally returned within 6 weeks. URMC did not utilize telephone or email surveys during the study period. Surveys were not sent to patients who (1) were transferred to another facility, (2) were discharged to hospice, (3) died during the hospitalization, (4) received psychiatric or rehabilitative services during the hospitalization, (5) had an international address, and/or (6) were prisoners.
The survey vendor (Press Ganey, South Bend, IN) for URMC provided raw data for returned surveys with patient answers to questions. Administrative and billing databases were used to add demographic and clinical data for the corresponding hospitalization to the dataset. These data included age, gender, payer status (public, private, self, charity), length of stay, number of attendings who saw the patient (based on encounters documented in the electronic medical record (EMR)), all discharge International Classification of Diseases, 9th Revision (ICD‐9) diagnoses for the hospitalization, total charges for the hospitalization, and intensive care unit (ICU) utilization as evidenced by a documented encounter with a member of the Division of Critical Care/Pulmonary Medicine.
CMS analyzes surveys within 1 of 3 clinical service categories (medical, surgical, or obstetrics/gynecology) based on the discharging service. To parallel this approach, each returned survey was placed into 1 of these categories based on the clinical service of the discharging physician. Patients placed in the obstetrics/gynecology category (n = 1317, 13%) will be analyzed in a future analysis given inherent differences in patient characteristics that require evaluation of other variables.
Approximations of CMS Summary Star Rating
The HCAHPS survey is a multiple‐choice questionnaire that includes several domains of patient satisfaction. Respondents are asked to rate areas of satisfaction with their hospital experience on a Likert scale. CMS uses a weighted average of Likert responses to a subset of HCAHPS questions to calculate a hospital's raw score in 11 domains, as well as an overall raw summary score. CMS then adjusts each raw score for differences between hospitals (eg, clustering, improvement over time, method of survey) to determine a hospital's star rating in each domain and an overall Summary Star Rating (the Summary Star Rating is the primary factor by which consumers can compare hospitals).[4] Because our data were from a single hospital system, the between‐hospital scoring adjustments utilized by CMS were not applicable. Instead, we calculated the raw scores exactly as CMS does prior to the adjustments. Thus, our scores reflect the scores that CMS would have given URMC during the study period prior to standardized adjustments; we refer to this as the raw satisfaction rating (RSR). We calculated an RSR for every eligible survey. The RSR was calculated as a continuous variable from 0 (lowest) to 1 (highest). Detailed explanation of our RSR calculation is available in the Supporting Information in the online version of this article.
Statistical Analysis
All analyses were performed in aggregate and by service (medical vs surgical). Categorical variables were summarized using frequencies with percentages. Comparisons across levels of categorical variables were performed with the 2 test. We report bivariate associations between the independent variables and RSRs in the top decile using unadjusted odds ratios (ORs) with 95% confidence intervals (CIs). Similarly, multivariable logistic regression was used for adjusted analyses. For the variables of severity of illness and resource intensity, the group with the lowest illness severity and lowest resource use served as the reference groups. We modeled patients without an ICU encounter and with an ICU encounter separately.
Charges, number of unique attendings encountered, and lengths of stay were highly correlated, and likely various measures of the same underlying construct of resource intensity, and therefore could not be entered into our models simultaneously. We combined these into a resource intensity score using factor analysis with a varimax rotation, and extracted factor scores for a single factor (supported by a scree plot). We then placed patients into 4 groups based on the distribution of the factor scores: low (<25th percentile), moderate (25th50th percentile), major (50th75th percentile), and extreme (>75th percentile).
We used the Charlson‐Deyo comorbidity score as our disease severity index.[12] The index uses ICD‐9 diagnoses with points assigned for the impact of each diagnosis on morbidity and the points summed to an overall score. This provides a measure of disease severity for a patient based on the number of diagnoses and relative mortality of the individual diagnoses. Scores were categorized as 0 (representing no major illness burden), 1 to 3, 4 to 6, and >6.
All statistical analyses were performed using SAS version 9.4 (SAS Institute, Cary, NC), and P values <0.05 were considered statistically significant. This study was approved by the institutional review board at the University of Rochester Medical Center.
RESULTS
Our initial search identified 10,007 returned surveys (29% of eligible patients returned surveys during the study period). Of these, 5059 (51%) were categorized as medical, 3630 (36%) as surgical, and 1317 (13%) as obstetrics/gynecology. One survey did not have the service of the discharging physician recorded and was excluded. Cohort demographics and relationship to RSRs in the top decile for the 8689 medical and surgical patients can be found in Table 1. The most common discharge diagnosis‐related groups (DRGs) for medical patients were 247, percutaneous cardiovascular procedure with drug‐eluding stent without major complications or comorbidities (MCC) (3.8%); 871, septicemia or severe sepsis without mechanical ventilation >96 hours with MCC (2.7%); and 392, esophagitis, gastroenteritis, and miscellaneous digestive disorders with MCC (2.3%). The most common DRGs for surgical patients were 460, spinal fusion except cervical without MCC (3.5%); 328, stomach, esophageal and duodenal procedure without complication or comorbidities or MCC (3.3%); and 491, back and neck procedure excluding spinal fusion without complication or comorbidities or MCC (3.1%).
| Overall | Medical | Surgical | ||||||||||
|---|---|---|---|---|---|---|---|---|---|---|---|---|
| Total | <90th | Top Decile | P | Total | <90th | Top Decile | P | Total | <90th | Top Decile | P | |
| ||||||||||||
| Overall | 8,689 | 7,789 (90) | 900 (10) | 5,059 | 4,646 (92) | 413 (8) | 3,630 | 3,143 (87) | 487 (13) | |||
| Age, y | ||||||||||||
| <30 | 419 (5) | 371 (89) | 48 (12) | <0.001 | 218 (4) | 208 (95) | 10 (5) | <0.001 | 201 (6) | 163 (81) | 38 (19) | <0.001 |
| 3049 | 1,029 (12) | 902 (88) | 127 (12) | 533 (11) | 482 (90) | 51 (10) | 496 (14) | 420 (85) | 76 (15) | |||
| 5069 | 3,911 (45) | 3,450 (88) | 461 (12) | 2,136 (42) | 1,930 (90) | 206 (10) | 1,775 (49) | 1,520 (86) | 255 (14) | |||
| >69 | 3,330 (38) | 3,066 (92) | 264 (8) | 2,172 (43) | 2,026 (93) | 146 (7) | 1,158 (32) | 1,040 (90) | 118 (10) | |||
| Gender | ||||||||||||
| Male | 4,640 (53) | 4,142 (89) | 498 (11) | 0.220 | 2,596 (51) | 2,379 (92) | 217 (8) | 0.602 | 2,044 (56) | 1,763 (86) | 281 (14) | 0.506 |
| Female | 4,049 (47) | 3,647 (90) | 402 (10) | 2,463 (49) | 2,267 (92) | 196 (8) | 1,586 (44) | 1,380 (87) | 206 (13) | |||
| ICU encounter | ||||||||||||
| No | 7,122 (82) | 6,441 (90) | 681 (10) | <0.001 | 4,547 (90) | 4,193 (92) | 354 (8) | <0.001 | 2,575 (71) | 2,248 (87) | 327 (13) | 0.048 |
| Yes | 1,567 (18) | 1,348 (86) | 219 (14) | 512 (10) | 453 (89) | 59 (12) | 1,055 (29) | 895 (85) | 160 (15) | |||
| Payer | ||||||||||||
| Public | 5,564 (64) | 5,036 (91) | 528 (10) | <0.001 | 3,424 (68) | 3,161 (92) | 263 (8) | 0.163 | 2,140 (59) | 1,875 (88) | 265 (12) | 0.148 |
| Private | 3,064 (35) | 2,702 (88) | 362 (12) | 1,603 (32) | 1,458 (91) | 145 (9) | 1,461 (40) | 1,244 (85) | 217 (15) | |||
| Charity | 45 (1) | 37 (82) | 8 (18) | 25 (1) | 21 (84) | 4 (16) | 20 (1) | 16 (80) | 4 (20) | |||
| Self | 16 (0) | 14 (88) | 2 (13) | 7 (0) | 6 (86) | 1 (14) | 9 (0) | 8 (89) | 1 (11) | |||
| Length of stay, d | ||||||||||||
| <3 | 3,156 (36) | 2,930 (93) | 226 (7) | <0.001 | 1,961 (39) | 1,865 (95) | 96 (5) | <0.001 | 1,195 (33) | 1,065 (89) | 130 (11) | <0.001 |
| 36 | 3,330 (38) | 2,959 (89) | 371 (11) | 1,867 (37) | 1,702 (91) | 165 (9) | 1,463 (40) | 1,257 (86) | 206 (14) | |||
| >6 | 2,203 (25) | 1,900 (86) | 303 (14) | 1,231 (24) | 1,079 (88) | 152 (12) | 972 (27) | 821 (85) | 151 (16) | |||
| No. of attendings | ||||||||||||
| <4 | 3,959 (46) | 3,615 (91) | 344 (9) | <0.001 | 2,307 (46) | 2,160 (94) | 147 (6) | <0.001 | 1,652 (46) | 1,455 (88) | 197 (12) | 0.052 |
| 46 | 3,067 (35) | 2,711 (88) | 356 (12) | 1,836 (36) | 1,663 (91) | 173 (9) | 1,231 (34) | 1,048 (85) | 183 (15) | |||
| >6 | 1,663 (19) | 1,463 (88) | 200 (12) | 916 (18) | 823 (90) | 93 (10) | 747 (21) | 640 (86) | 107 (14) | |||
| Severity index* | ||||||||||||
| 0 (lowest) | 2,812 (32) | 2,505 (89) | 307 (11) | 0.272 | 1,273 (25) | 1,185 (93) | 88 (7) | 0.045 | 1,539 (42) | 1,320 (86) | 219 (14) | 0.261 |
| 13 | 4,253 (49) | 3,827 (90) | 426 (10) | 2,604 (52) | 2,395 (92) | 209 (8) | 1,649 (45) | 1,432 (87) | 217 (13) | |||
| 46 | 1163 (13) | 1,052 (91) | 111 (10) | 849 (17) | 770 (91) | 79 (9) | 314 (9) | 282 (90) | 32 (10) | |||
| >6 (highest) | 461 (5) | 405 (88) | 56 (12) | 333 (7) | 296 (89) | 37 (11) | 128 (4) | 109 (85) | 19 (15) | |||
| Charges, | ||||||||||||
| Low | 1,820 (21) | 1,707 (94) | 113 (6) | <0.001 | 1,426 (28) | 1,357 (95) | 69 (5) | <0.001 | 394 (11) | 350 (89) | 44 (11) | 0.007 |
| Medium | 5,094 (59) | 4,581 (90) | 513 (10) | 2,807 (56) | 2,582 (92) | 225 (8) | 2,287 (63) | 1,999 (87) | 288 (13) | |||
| High | 1,775 (20) | 1,501 (85) | 274 (15) | 826 (16) | 707 (86) | 119 (14) | 949 (26) | 794 (84) | 155 (16) | |||
Unadjusted analysis of medical and surgical patients identified significant associations of several variables with a top decile RSR (Table 2). Patients with longer lengths of stay (OR: 2.07, 95% CI: 1.72‐2.48), more attendings (OR: 1.44, 95% CI: 1.19‐1.73), and higher hospital charges (OR: 2.76, 95% CI: 2.19‐3.47) were more likely to report an RSR in the top decile. Patients without an ICU encounter (OR: 0.65, 95% CI: 0.55‐0.77) and on a medical service (OR: 0.57, 95% CI: 0.5‐ 0.66) were less likely to report an RSR in the top decile. Several associations were identified in only the medical or surgical cohorts. In the medical cohort, patients with the highest illness severity index (OR: 1.68, 95% CI: 1.12‐ 2.52) and with 7 different attending physicians (OR: 1.66, 95% CI: 1.27‐2.18) were more likely to report RSRs in the top decile. In the surgical cohort, patients <30 years of age (OR: 2.05, 95% CI 1.38‐3.07) were more likely to report an RSR in the top decile than patients >69 years of age. Insurance payer category and gender were not significantly associated with top decile RSRs.
| Overall | Medical | Surgical | ||||
|---|---|---|---|---|---|---|
| Odds Ratio (95% CI) | P | Odds Ratio (95% CI) | P | Odds Ratio (95% CI) | P | |
| ||||||
| Age, y | ||||||
| <30 | 1.5 (1.082.08) | 0.014 | 0.67 (0.351.29) | 0.227 | 2.05 (1.383.07) | <0.001 |
| 3049 | 1.64 (1.312.05) | <.001 | 1.47 (1.052.05) | 0.024 | 1.59 (1.172.17) | 0.003 |
| 5069 | 1.55 (1.321.82) | <.001 | 1.48 (1.191.85) | 0.001 | 1.48 (1.171.86) | 0.001 |
| >69 | Ref | Ref | Ref | |||
| Gender | ||||||
| Male | 1.09 (0.951.25) | 0.220 | 1.06 (0.861.29) | 0.602 | 1.07 (0.881.3) | 0.506 |
| Female | Ref | Ref | Ref | |||
| ICU encounter | ||||||
| No | 0.65 (0.550.77) | <0.001 | 0.65 (0.480.87) | 0.004 | 0.81 (0.661) | 0.048 |
| Yes | Ref | Ref | Ref | |||
| Payer | ||||||
| Public | 0.73 (0.173.24) | 0.683 | 0.5 (0.064.16) | 0.521 | 1.13 (0.149.08) | 0.908 |
| Private | 0.94 (0.214.14) | 0.933 | 0.6 (0.074.99) | 0.634 | 1.4 (0.1711.21) | 0.754 |
| Charity | 1.51 (0.298.02) | 0.626 | 1.14 (0.1112.25) | 0.912 | 2 (0.1920.97) | 0.563 |
| Self | Ref | Ref | Ref | |||
| Length of stay, d | ||||||
| <3 | Ref | Ref | Ref | |||
| 36 | 1.63 (1.371.93) | <0.001 | 1.88 (1.452.44) | <0.001 | 1.34 (1.061.7) | 0.014 |
| >6 | 2.07 (1.722.48) | <0.001 | 2.74 (2.13.57) | <0.001 | 1.51 (1.171.94) | 0.001 |
| No. of attendings | ||||||
| <4 | Ref | Ref | Ref | |||
| 46 | 1.38 (1.181.61) | <0.001 | 1.53 (1.221.92) | <0.001 | 1.29 (1.041.6) | 0.021 |
| >6 | 1.44 (1.191.73) | <0.001 | 1.66 (1.272.18) | <0.001 | 1.23 (0.961.59) | 0.102 |
| Severity index* | ||||||
| 0 (lowest) | Ref | Ref | Ref | |||
| 13 | 0.91 (0.781.06) | 0.224 | 1.18 (0.911.52) | 0.221 | 0.91 (0.751.12) | 0.380 |
| 46 | 0.86 (0.681.08) | 0.200 | 1.38 (1.011.9) | 0.046 | 0.68 (0.461.01) | 0.058 |
| >6 (highest) | 1.13 (0.831.53) | 0.436 | 1.68 (1.122.52) | 0.012 | 1.05 (0.631.75) | 0.849 |
| Charges | ||||||
| Low | Ref | Ref | Ref | |||
| Medium | 1.69 (1.372.09) | <0.001 | 1.71 (1.32.26) | <0.001 | 1.15 (0.821.61) | 0.428 |
| High | 2.76 (2.193.47) | <0.001 | 3.31 (2.434.51) | <0.001 | 1.55 (1.092.22) | 0.016 |
| Service | ||||||
| Medical | 0.57 (0.50.66) | <0.001 | ||||
| Surgical | Ref | |||||
Multivariable modeling (Table 3) for all patients without an ICU encounter suggested that (1) patients aged <30 years, 30 to 49 years, and 50 to 69 years were more likely to report top decile RSRs when compared to patients 70 years and older (OR: 1.61, 95% CI: 1.09‐2.36; OR: 1.44, 95% CI: 1.08‐1.93; and OR: 1.39, 95% CI: 1.13‐1.71, respectively) and (2), when compared to patients with extreme resource intensity scores, patients with higher resource intensity scores were more likely to report top decile RSRs (moderate [OR: 1.42, 95% CI: 1.11‐1.83], major [OR: 1.56, 95% CI: 1.22‐2.01], and extreme [OR: 2.29, 95% CI: 1.8‐2.92]. These results were relatively consistent within medical and surgical subgroups (Table 3).
| Overall | Medical | Surgical | ||||
|---|---|---|---|---|---|---|
| Odds Ratio (95% CI) | P | Odds Ratio (95% CI) | P | Odds Ratio (95% CI) | P | |
| ||||||
| Age, y | ||||||
| <30 | 1.61 (1.092.36) | 0.016 | 0.82 (0.41.7) | 0.596 | 2.31 (1.393.82) | 0.001 |
| 3049 | 1.44 (1.081.93) | 0.014 | 1.55 (1.032.32) | 0.034 | 1.41 (0.912.17) | 0.120 |
| 5069 | 1.39 (1.131.71) | 0.002 | 1.44 (1.11.88) | 0.008 | 1.39 (11.93) | 0.049 |
| >69 | Ref | Ref | Ref | |||
| Sex | ||||||
| Male | 1 (0.851.17) | 0.964 | 1 (0.81.25) | 0.975 | 0.99 (0.791.26) | 0.965 |
| Female | Ref | Ref | Ref | |||
| Payer | ||||||
| Public | 0.62 (0.142.8) | 0.531 | 0.42 (0.053.67) | 0.432 | 1.03 (0.128.59) | 0.978 |
| Private | 0.67 (0.153.02) | 0.599 | 0.42 (0.053.67) | 0.434 | 1.17 (0.149.69) | 0.884 |
| Charity | 1.54 (0.288.41) | 0.620 | 1 (0.0911.13) | 0.999 | 2.56 (0.2328.25) | 0.444 |
| Self | Ref | Ref | Ref | |||
| Severity index | ||||||
| 0 (lowest) | Ref | Ref | Ref | |||
| 13 | 1.07 (0.891.29) | 0.485 | 1.18 (0.881.58) | 0.267 | 1 (0.781.29) | 0.986 |
| 46 | 1.14 (0.861.51) | 0.377 | 1.42 (0.992.04) | 0.056 | 0.6 (0.331.1) | 0.100 |
| >6 (highest) | 1.31 (0.911.9) | 0.150 | 1.47 (0.932.33) | 0.097 | 1.1 (0.542.21) | 0.795 |
| Resource intensity score | ||||||
| Low | Ref | Ref | Ref | |||
| Moderate | 1.42 (1.111.83) | 0.006 | 1.6 (1.112.3) | 0.011 | 0.94 (0.661.34) | 0.722 |
| Major | 1.56 (1.222.01) | 0.001 | 1.69 (1.182.43) | 0.004 | 1.28 (0.911.8) | 0.151 |
| Extreme | 2.29 (1.82.92) | <0.001 | 2.72 (1.943.82) | <0.001 | 1.63 (1.172.26) | 0.004 |
| Service | ||||||
| Medical | 0.59 (0.50.69) | <0.001 | ||||
| Surgical | Ref | |||||
In those with at least 1 ICU attending encounter (see Supporting Table 1 in the online version of this article), no variables demonstrated significant association with top decile RSRs in the overall group or in the medical subgroup. For surgical patients with at least 1 ICU attending encounter (see Supporting Table 1 in the online version of this article), patients aged 30 to 49 and 50 to 69 years were more likely to provide top decile RSRs (OR: 1.93, 95% CI: 1.08‐3.46 and OR: 1.65, 95% CI 1.07‐2.53, respectively). Resource intensity was not significantly associated with top decile RSRs.
DISCUSSION
Our analysis suggests that, for patients on the general care floors, resource utilization is associated with the RSR and, therefore, potentially the CMS Summary Star Rating. Adjusting for severity of illness, patients with higher resource utilization were more likely to report top decile RSRs.
Prior data regarding utilization and satisfaction are mixed. In a 2‐year, prospective, national examination, patients in the highest quartile of patient satisfaction had increased healthcare and prescription drug expenditures as well as increased rates of hospitalization when compared with patients in the lowest quartile of patient satisfaction.[9] However, a recent national study of surgical administrative databases suggested hospitals with high patient satisfaction provided more efficient care.[13]
One reason for the conflicting data may be that large, national evaluations are unable to control for between‐hospital confounders (ie, hospital quality of care). By capturing all eligible returned surveys at 1 institution, our design allowed us to collect granular data. We found that in 1 hospital setting, patient population, facilities, and food services, patients receiving more clinical resources generally assigned higher ratings than patients receiving less.
It is possible that utilization is a proxy for serious illness, and that patients with serious illness receive more attention during hospitalization and are more satisfied when discharged in a good state of health. However, we did adjust for severity of illness in our model using the Charlson‐Deyo index and we suggest that, other factors being equal, hospitals with higher per‐patient expenditures may be assigned higher Summary Star Ratings.
CMS has recently implemented a number of metrics designed to decrease healthcare costs by improving quality, safety, and efficiency. Concurrently, CMS has also prioritized patient experience. The Summary Star Rating was created to provide healthcare consumers with an easy way to compare the patient experience between hospitals[4]; however, our data suggest that this metric may be at odds with inpatient cost savings and efficiency metrics.
Per‐patient spending becomes particularly salient when considering that in fiscal year 2016, CMS' hospital VBP reimbursement will include 2 metrics: an efficiency outcome measure labeled Medicare spending per beneficiary, and a patient experience outcome measure based on HCAHPS survey dimensions.[2] Together, these 2 metrics will comprise nearly half of the total VBP performance score used to determine reimbursement. Although our data suggest that these 2 VBP metrics may be correlated, it should be noted that we measured inpatient hospital charges, whereas the CMS efficiency outcome measure includes costs for episode of care spanning 3 days prior to hospitalization to 30 days after hospitalization.
Patient expectations likely play a role in satisfaction.[14, 15, 16] In an outpatient setting, physician fulfillment of patient requests has been associated with positive patient evaluations of care.[17] However, patients appear to value education, shared decision making, and provider empathy more than testing and intervention.[14, 18, 19, 20, 21, 22, 23] Perhaps, in the absence of the former attributes, patients use additional resource expenditure as a proxy.
It is not clear that higher resource expenditure improves outcomes. A landmark study of nearly 1 million Medicare enrollees by Fisher et al. suggests that, although Medicare patients in higher‐spending regions receive more care than those in lower‐spending regions, this does not result in better health outcomes, specifically with regard to mortality.[24, 25] Patients who live in areas of high hospital capacity use the hospital more frequently than do patients in areas of low hospital capacity, but this does not appear to result in improved mortality rates.[26] In fact, physicians in areas of high healthcare capacity report more difficulty maintaining high‐quality patient relationships and feel less able to provide high‐quality care than physicians in lower‐capacity areas.[27]
We hypothesize the cause of the association between resource utilization and patient satisfaction could be that patients (1) perceive that a doctor who allows them to stay longer in the hospital or who performs additional testing cares more about their well‐being and (2) that these patients feel more strongly that their concerns are being heard and addressed by their physicians. A systematic review of primary care patients identified many studies that found a positive association between meeting patient expectations and satisfaction with care, but also suggested that although patients frequently expect information, physicians misperceive this as an expectation of specific action.[28] A separate systematic review found that patient education in the form of decision aides can help patients develop more reasonable expectations and reduce utilization of certain discretionary procedures such as elective surgeries and prostate‐specific antigen testing.[29]
We did not specifically address clinical outcomes in our analysis because the clinical outcomes on which CMS currently adjusts VBP reimbursement focus on 30‐day mortality for specific diagnoses, nosocomial infections, and iatrogenic events.[30] Our data include only returned surveys from living patients, and it is likely that 30‐day mortality was similar throughout all subsets of patients. Additionally, the nosocomial and iatrogenic outcome measures used by CMS are sufficiently rare on the general floors and are unlikely to have significantly influenced our results.[31]
Our study has several strengths. Nearly all medical and surgical patient surveys returned during the study period were included, and therefore our calculations are likely to accurately reflect the Summary Star Rating that would have been assigned for the period. Second, the large sample size helps attenuate potential differences in commonly used outcome metrics. Third, by adjusting for a variety of demographic and clinical variables, we were able to decrease the likelihood of unidentified confounders.
Notably, we identified 38 (0.4%) surveys returned for patients under 18 years of age at admission. These surveys were included in our analysis because, to the best of our knowledge, they would have existed in the pool of surveys CMS could have used to assign a Summary Star Rating.
Our study also has limitations. First, geographically diverse data are needed to ensure generalizability. Second, we used the Charlson‐Deyo Comorbidity Index to describe the degree of illness for each patient. This index represents a patient's total illness burden but may not describe the relative severity of the patient's current illness relative to another patient. Third, we selected variables we felt were most likely to be associated with patient experience, but unidentified confounding remains possible. Fourth, attendings caring for ICU patients fall within the Division of Critical Care/Pulmonary Medicine. Therefore, we may have inadvertently placed patients into the ICU cohort who received a pulmonary/critical care consult on the general floors. Fifth, our data describe associations only for patients who returned surveys. Although there may be inherent biases in patients who return surveys, HCAHPS survey responses are used by CMS to determine a hospital's overall satisfaction score.
CONCLUSION
For patients who return HCAHPS surveys, resource utilization may be positively associated with a hospital's Summary Star Rating. These data suggest that hospitals with higher per‐patient expenditures may receive higher Summary Star Ratings, which could result in hospitals with higher per‐patient resource utilization appearing more attractive to healthcare consumers. Future studies should attempt to confirm our findings at other institutions and to determine causative factors.
Acknowledgements
The authors thank Jason Machan, PhD (Department of Orthopedics and Surgery, Warren Alpert Medical School, Brown University, Providence, Rhode Island) for his help with study design, and Ms. Brenda Foster (data analyst, University of Rochester Medical Center, Rochester, NY) for her help with data collection.
Disclosures: Nothing to report.
- , , . Redesigning physician compensation and improving ED performance. Healthc Financ Manage. 2011;65(6):114–117.
- QualityNet. Available at: https://www.qualitynet.org/dcs/ContentServer?c=Page97(13):1041–1048.
- , , , . Factors determining inpatient satisfaction with care. Soc Sci Med. 2002;54(4):493–504.
- , , , , . Patient satisfaction revisited: a multilevel approach. Soc Sci Med. 2009;69(1):68–75.
- , , , et al. Predictors of patient satisfaction with hospital health care. BMC Health Serv Res. 2006;6:102.
- , , , . The cost of satisfaction: a national study of patient satisfaction, health care utilization, expenditures, and mortality. Arch Intern Med. 2012;172(5):405–411.
- , , , , . Relationship between patient satisfaction with inpatient care and hospital readmission within 30 days. Am J Manag Care. 2011;17(1):41–48.
- Becker's Infection Control and Clinical Quality. Star Ratings go live on Hospital Compare: how many hospitals got 5 stars? Available at: http://www.beckershospitalreview.com/quality/star‐ratings‐go‐live‐on‐hospital‐compare‐how‐many‐hospitals‐got‐5‐stars.html. Published April 16, 2015. Accessed October 5, 2015.
- , , . Adapting a clinical comorbidity index for use with ICD‐9‐CM administrative databases. J Clin Epidemiol. 1992;45(6):613–619.
- , , . Patient satisfaction and quality of surgical care in US hospitals. Ann Surg. 2015;261(1):2–8.
- , , , , . Should health care providers be accountable for patients' care experiences? J Gen Intern Med. 2015;30(2):253–256.
- , , , , . Unmet expectations for care and the patient‐physician relationship. J Gen Intern Med. 2002;17(11):817–824.
- , , , et al. Do unmet expectations for specific tests, referrals, and new medications reduce patients' satisfaction? J Gen Intern Med. 2004;19(11):1080–1087.
- , , , , , . Request fulfillment in office practice: antecedents and relationship to outcomes. Med Care. 2002;40(1):38–51.
- , , , et al. Factors associated with patient satisfaction with care among dermatological outpatients. Br J Dermatol. 2001;145(4):617–623.
- , , , . Patient expectations of emergency department care: phase II—a cross‐sectional survey. CJEM. 2006;8(3):148–157.
- , , , , . Patients' perspectives on ideal physician behaviors. Mayo Clin Proc. 2006;81(3):338–344.
- , . What do people want from their health care? A qualitative study. J Participat Med. 2015;18:e10.
- , , . Evaluations of care by adults following a denial of an advertisement‐related prescription drug request: the role of expectations, symptom severity, and physician communication style. Soc Sci Med. 2006;62(4):888–899.
- , , , , , . Getting to “no”: strategies primary care physicians use to deny patient requests. Arch Intern Med. 2010;170(4):381–388.
- , , , , , . The implications of regional variations in Medicare spending. Part 1: the content, quality, and accessibility of care. Ann Intern Med. 2003;138(4):273–287.
- , , , , , . The implications of regional variations in Medicare spending. Part 2: health outcomes and satisfaction with care. Ann Intern Med. 2003;138(4):288–298.
- , , , et al. Associations among hospital capacity, utilization, and mortality of US Medicare beneficiaries, controlling for sociodemographic factors. Health Serv Res. 2000;34(6):1351–1362.
- , , , . Regional variations in health care intensity and physician perceptions of quality of care. Ann Intern Med. 2006;144(9):641–649.
- , , . Visit‐specific expectations and patient‐centered outcomes: a literature review. Arch Fam Med. 2000;9(10):1148–1155.
- , , , et al. Decision aids for people facing health treatment or screening decisions. Cochrane Database Syst Rev. 2014;1:CD001431.
- Centers for Medicare and Medicaid Services. Hospital Compare. Outcome domain. Available at: https://www.medicare.gov/hospitalcompare/data/outcome‐domain.html. Accessed October 5, 2015.
- Centers for Disease Control and Prevention. 2013 national and state healthcare‐associated infections progress report. Available at: www.cdc.gov/hai/progress‐report/index.html. Accessed October 5, 2015.
The patient experience has become increasingly important to healthcare in the United States. It is now a metric used commonly to determine physician compensation and accounts for nearly 30% of the Centers for Medicare and Medicaid Services' (CMS) Value‐Based Purchasing (VBP) reimbursement for fiscal years 2015 and 2016.[1, 2]
In April 2015, CMS added a 5‐star patient experience score to its Hospital Compare website in an attempt to address the Affordable Care Act's call for transparent and easily understandable public reporting.[3] A hospital's principal score is the Summary Star Rating, which is based on responses to the Hospital Consumer Assessment of Healthcare Providers and Systems (HCAHPS) survey. The formulas used to calculate Summary Star Ratings have been reported by CMS.[4]
Studies published over the past decade suggest that gender, age, education level, length of hospital stay, travel distance, and other factors may influence patient satisfaction.[5, 6, 7, 8] One study utilizing a national dataset suggested that higher patient satisfaction was associated with greater inpatient healthcare utilization and higher healthcare expenditures.[9] It is therefore possible that emphasizing patient experience scores could adversely impact healthcare resource utilization. However, positive patient experience may also be an important independent dimension of quality for patients and correlate with improved clinical outcomes.[10]
We know of no literature describing patient factors associated with the Summary Star Rating. Given that this rating is now used as a standard metric by which patient experience can be compared across more than 3,500 hospitals,[11] data describing the association between patient‐level factors and the Summary Star Rating may provide hospitals with an opportunity to target improvement efforts. We aimed to determine the degree to which resource utilization is associated with a satisfaction score based on the Summary Star Rating methodology.
METHODS
The study was conducted at the University of Rochester Medical Center (URMC), an 830‐bed tertiary care center in upstate New York. This was a retrospective review of all HCAHPS surveys returned to URMC over a 27‐month period from January 1, 2012 to April 1, 2014. URMC follows the standard CMS process for determining which patients receive surveys as follows. During the study timeframe, HCAHPS surveys were mailed to patients 18 years of age and older who had an inpatient stay spanning at least 1 midnight. Surveys were mailed within 5 days of discharge, and were generally returned within 6 weeks. URMC did not utilize telephone or email surveys during the study period. Surveys were not sent to patients who (1) were transferred to another facility, (2) were discharged to hospice, (3) died during the hospitalization, (4) received psychiatric or rehabilitative services during the hospitalization, (5) had an international address, and/or (6) were prisoners.
The survey vendor (Press Ganey, South Bend, IN) for URMC provided raw data for returned surveys with patient answers to questions. Administrative and billing databases were used to add demographic and clinical data for the corresponding hospitalization to the dataset. These data included age, gender, payer status (public, private, self, charity), length of stay, number of attendings who saw the patient (based on encounters documented in the electronic medical record (EMR)), all discharge International Classification of Diseases, 9th Revision (ICD‐9) diagnoses for the hospitalization, total charges for the hospitalization, and intensive care unit (ICU) utilization as evidenced by a documented encounter with a member of the Division of Critical Care/Pulmonary Medicine.
CMS analyzes surveys within 1 of 3 clinical service categories (medical, surgical, or obstetrics/gynecology) based on the discharging service. To parallel this approach, each returned survey was placed into 1 of these categories based on the clinical service of the discharging physician. Patients placed in the obstetrics/gynecology category (n = 1317, 13%) will be analyzed in a future analysis given inherent differences in patient characteristics that require evaluation of other variables.
Approximations of CMS Summary Star Rating
The HCAHPS survey is a multiple‐choice questionnaire that includes several domains of patient satisfaction. Respondents are asked to rate areas of satisfaction with their hospital experience on a Likert scale. CMS uses a weighted average of Likert responses to a subset of HCAHPS questions to calculate a hospital's raw score in 11 domains, as well as an overall raw summary score. CMS then adjusts each raw score for differences between hospitals (eg, clustering, improvement over time, method of survey) to determine a hospital's star rating in each domain and an overall Summary Star Rating (the Summary Star Rating is the primary factor by which consumers can compare hospitals).[4] Because our data were from a single hospital system, the between‐hospital scoring adjustments utilized by CMS were not applicable. Instead, we calculated the raw scores exactly as CMS does prior to the adjustments. Thus, our scores reflect the scores that CMS would have given URMC during the study period prior to standardized adjustments; we refer to this as the raw satisfaction rating (RSR). We calculated an RSR for every eligible survey. The RSR was calculated as a continuous variable from 0 (lowest) to 1 (highest). Detailed explanation of our RSR calculation is available in the Supporting Information in the online version of this article.
Statistical Analysis
All analyses were performed in aggregate and by service (medical vs surgical). Categorical variables were summarized using frequencies with percentages. Comparisons across levels of categorical variables were performed with the 2 test. We report bivariate associations between the independent variables and RSRs in the top decile using unadjusted odds ratios (ORs) with 95% confidence intervals (CIs). Similarly, multivariable logistic regression was used for adjusted analyses. For the variables of severity of illness and resource intensity, the group with the lowest illness severity and lowest resource use served as the reference groups. We modeled patients without an ICU encounter and with an ICU encounter separately.
Charges, number of unique attendings encountered, and lengths of stay were highly correlated, and likely various measures of the same underlying construct of resource intensity, and therefore could not be entered into our models simultaneously. We combined these into a resource intensity score using factor analysis with a varimax rotation, and extracted factor scores for a single factor (supported by a scree plot). We then placed patients into 4 groups based on the distribution of the factor scores: low (<25th percentile), moderate (25th50th percentile), major (50th75th percentile), and extreme (>75th percentile).
We used the Charlson‐Deyo comorbidity score as our disease severity index.[12] The index uses ICD‐9 diagnoses with points assigned for the impact of each diagnosis on morbidity and the points summed to an overall score. This provides a measure of disease severity for a patient based on the number of diagnoses and relative mortality of the individual diagnoses. Scores were categorized as 0 (representing no major illness burden), 1 to 3, 4 to 6, and >6.
All statistical analyses were performed using SAS version 9.4 (SAS Institute, Cary, NC), and P values <0.05 were considered statistically significant. This study was approved by the institutional review board at the University of Rochester Medical Center.
RESULTS
Our initial search identified 10,007 returned surveys (29% of eligible patients returned surveys during the study period). Of these, 5059 (51%) were categorized as medical, 3630 (36%) as surgical, and 1317 (13%) as obstetrics/gynecology. One survey did not have the service of the discharging physician recorded and was excluded. Cohort demographics and relationship to RSRs in the top decile for the 8689 medical and surgical patients can be found in Table 1. The most common discharge diagnosis‐related groups (DRGs) for medical patients were 247, percutaneous cardiovascular procedure with drug‐eluding stent without major complications or comorbidities (MCC) (3.8%); 871, septicemia or severe sepsis without mechanical ventilation >96 hours with MCC (2.7%); and 392, esophagitis, gastroenteritis, and miscellaneous digestive disorders with MCC (2.3%). The most common DRGs for surgical patients were 460, spinal fusion except cervical without MCC (3.5%); 328, stomach, esophageal and duodenal procedure without complication or comorbidities or MCC (3.3%); and 491, back and neck procedure excluding spinal fusion without complication or comorbidities or MCC (3.1%).
| Overall | Medical | Surgical | ||||||||||
|---|---|---|---|---|---|---|---|---|---|---|---|---|
| Total | <90th | Top Decile | P | Total | <90th | Top Decile | P | Total | <90th | Top Decile | P | |
| ||||||||||||
| Overall | 8,689 | 7,789 (90) | 900 (10) | 5,059 | 4,646 (92) | 413 (8) | 3,630 | 3,143 (87) | 487 (13) | |||
| Age, y | ||||||||||||
| <30 | 419 (5) | 371 (89) | 48 (12) | <0.001 | 218 (4) | 208 (95) | 10 (5) | <0.001 | 201 (6) | 163 (81) | 38 (19) | <0.001 |
| 3049 | 1,029 (12) | 902 (88) | 127 (12) | 533 (11) | 482 (90) | 51 (10) | 496 (14) | 420 (85) | 76 (15) | |||
| 5069 | 3,911 (45) | 3,450 (88) | 461 (12) | 2,136 (42) | 1,930 (90) | 206 (10) | 1,775 (49) | 1,520 (86) | 255 (14) | |||
| >69 | 3,330 (38) | 3,066 (92) | 264 (8) | 2,172 (43) | 2,026 (93) | 146 (7) | 1,158 (32) | 1,040 (90) | 118 (10) | |||
| Gender | ||||||||||||
| Male | 4,640 (53) | 4,142 (89) | 498 (11) | 0.220 | 2,596 (51) | 2,379 (92) | 217 (8) | 0.602 | 2,044 (56) | 1,763 (86) | 281 (14) | 0.506 |
| Female | 4,049 (47) | 3,647 (90) | 402 (10) | 2,463 (49) | 2,267 (92) | 196 (8) | 1,586 (44) | 1,380 (87) | 206 (13) | |||
| ICU encounter | ||||||||||||
| No | 7,122 (82) | 6,441 (90) | 681 (10) | <0.001 | 4,547 (90) | 4,193 (92) | 354 (8) | <0.001 | 2,575 (71) | 2,248 (87) | 327 (13) | 0.048 |
| Yes | 1,567 (18) | 1,348 (86) | 219 (14) | 512 (10) | 453 (89) | 59 (12) | 1,055 (29) | 895 (85) | 160 (15) | |||
| Payer | ||||||||||||
| Public | 5,564 (64) | 5,036 (91) | 528 (10) | <0.001 | 3,424 (68) | 3,161 (92) | 263 (8) | 0.163 | 2,140 (59) | 1,875 (88) | 265 (12) | 0.148 |
| Private | 3,064 (35) | 2,702 (88) | 362 (12) | 1,603 (32) | 1,458 (91) | 145 (9) | 1,461 (40) | 1,244 (85) | 217 (15) | |||
| Charity | 45 (1) | 37 (82) | 8 (18) | 25 (1) | 21 (84) | 4 (16) | 20 (1) | 16 (80) | 4 (20) | |||
| Self | 16 (0) | 14 (88) | 2 (13) | 7 (0) | 6 (86) | 1 (14) | 9 (0) | 8 (89) | 1 (11) | |||
| Length of stay, d | ||||||||||||
| <3 | 3,156 (36) | 2,930 (93) | 226 (7) | <0.001 | 1,961 (39) | 1,865 (95) | 96 (5) | <0.001 | 1,195 (33) | 1,065 (89) | 130 (11) | <0.001 |
| 36 | 3,330 (38) | 2,959 (89) | 371 (11) | 1,867 (37) | 1,702 (91) | 165 (9) | 1,463 (40) | 1,257 (86) | 206 (14) | |||
| >6 | 2,203 (25) | 1,900 (86) | 303 (14) | 1,231 (24) | 1,079 (88) | 152 (12) | 972 (27) | 821 (85) | 151 (16) | |||
| No. of attendings | ||||||||||||
| <4 | 3,959 (46) | 3,615 (91) | 344 (9) | <0.001 | 2,307 (46) | 2,160 (94) | 147 (6) | <0.001 | 1,652 (46) | 1,455 (88) | 197 (12) | 0.052 |
| 46 | 3,067 (35) | 2,711 (88) | 356 (12) | 1,836 (36) | 1,663 (91) | 173 (9) | 1,231 (34) | 1,048 (85) | 183 (15) | |||
| >6 | 1,663 (19) | 1,463 (88) | 200 (12) | 916 (18) | 823 (90) | 93 (10) | 747 (21) | 640 (86) | 107 (14) | |||
| Severity index* | ||||||||||||
| 0 (lowest) | 2,812 (32) | 2,505 (89) | 307 (11) | 0.272 | 1,273 (25) | 1,185 (93) | 88 (7) | 0.045 | 1,539 (42) | 1,320 (86) | 219 (14) | 0.261 |
| 13 | 4,253 (49) | 3,827 (90) | 426 (10) | 2,604 (52) | 2,395 (92) | 209 (8) | 1,649 (45) | 1,432 (87) | 217 (13) | |||
| 46 | 1163 (13) | 1,052 (91) | 111 (10) | 849 (17) | 770 (91) | 79 (9) | 314 (9) | 282 (90) | 32 (10) | |||
| >6 (highest) | 461 (5) | 405 (88) | 56 (12) | 333 (7) | 296 (89) | 37 (11) | 128 (4) | 109 (85) | 19 (15) | |||
| Charges, | ||||||||||||
| Low | 1,820 (21) | 1,707 (94) | 113 (6) | <0.001 | 1,426 (28) | 1,357 (95) | 69 (5) | <0.001 | 394 (11) | 350 (89) | 44 (11) | 0.007 |
| Medium | 5,094 (59) | 4,581 (90) | 513 (10) | 2,807 (56) | 2,582 (92) | 225 (8) | 2,287 (63) | 1,999 (87) | 288 (13) | |||
| High | 1,775 (20) | 1,501 (85) | 274 (15) | 826 (16) | 707 (86) | 119 (14) | 949 (26) | 794 (84) | 155 (16) | |||
Unadjusted analysis of medical and surgical patients identified significant associations of several variables with a top decile RSR (Table 2). Patients with longer lengths of stay (OR: 2.07, 95% CI: 1.72‐2.48), more attendings (OR: 1.44, 95% CI: 1.19‐1.73), and higher hospital charges (OR: 2.76, 95% CI: 2.19‐3.47) were more likely to report an RSR in the top decile. Patients without an ICU encounter (OR: 0.65, 95% CI: 0.55‐0.77) and on a medical service (OR: 0.57, 95% CI: 0.5‐ 0.66) were less likely to report an RSR in the top decile. Several associations were identified in only the medical or surgical cohorts. In the medical cohort, patients with the highest illness severity index (OR: 1.68, 95% CI: 1.12‐ 2.52) and with 7 different attending physicians (OR: 1.66, 95% CI: 1.27‐2.18) were more likely to report RSRs in the top decile. In the surgical cohort, patients <30 years of age (OR: 2.05, 95% CI 1.38‐3.07) were more likely to report an RSR in the top decile than patients >69 years of age. Insurance payer category and gender were not significantly associated with top decile RSRs.
| Overall | Medical | Surgical | ||||
|---|---|---|---|---|---|---|
| Odds Ratio (95% CI) | P | Odds Ratio (95% CI) | P | Odds Ratio (95% CI) | P | |
| ||||||
| Age, y | ||||||
| <30 | 1.5 (1.082.08) | 0.014 | 0.67 (0.351.29) | 0.227 | 2.05 (1.383.07) | <0.001 |
| 3049 | 1.64 (1.312.05) | <.001 | 1.47 (1.052.05) | 0.024 | 1.59 (1.172.17) | 0.003 |
| 5069 | 1.55 (1.321.82) | <.001 | 1.48 (1.191.85) | 0.001 | 1.48 (1.171.86) | 0.001 |
| >69 | Ref | Ref | Ref | |||
| Gender | ||||||
| Male | 1.09 (0.951.25) | 0.220 | 1.06 (0.861.29) | 0.602 | 1.07 (0.881.3) | 0.506 |
| Female | Ref | Ref | Ref | |||
| ICU encounter | ||||||
| No | 0.65 (0.550.77) | <0.001 | 0.65 (0.480.87) | 0.004 | 0.81 (0.661) | 0.048 |
| Yes | Ref | Ref | Ref | |||
| Payer | ||||||
| Public | 0.73 (0.173.24) | 0.683 | 0.5 (0.064.16) | 0.521 | 1.13 (0.149.08) | 0.908 |
| Private | 0.94 (0.214.14) | 0.933 | 0.6 (0.074.99) | 0.634 | 1.4 (0.1711.21) | 0.754 |
| Charity | 1.51 (0.298.02) | 0.626 | 1.14 (0.1112.25) | 0.912 | 2 (0.1920.97) | 0.563 |
| Self | Ref | Ref | Ref | |||
| Length of stay, d | ||||||
| <3 | Ref | Ref | Ref | |||
| 36 | 1.63 (1.371.93) | <0.001 | 1.88 (1.452.44) | <0.001 | 1.34 (1.061.7) | 0.014 |
| >6 | 2.07 (1.722.48) | <0.001 | 2.74 (2.13.57) | <0.001 | 1.51 (1.171.94) | 0.001 |
| No. of attendings | ||||||
| <4 | Ref | Ref | Ref | |||
| 46 | 1.38 (1.181.61) | <0.001 | 1.53 (1.221.92) | <0.001 | 1.29 (1.041.6) | 0.021 |
| >6 | 1.44 (1.191.73) | <0.001 | 1.66 (1.272.18) | <0.001 | 1.23 (0.961.59) | 0.102 |
| Severity index* | ||||||
| 0 (lowest) | Ref | Ref | Ref | |||
| 13 | 0.91 (0.781.06) | 0.224 | 1.18 (0.911.52) | 0.221 | 0.91 (0.751.12) | 0.380 |
| 46 | 0.86 (0.681.08) | 0.200 | 1.38 (1.011.9) | 0.046 | 0.68 (0.461.01) | 0.058 |
| >6 (highest) | 1.13 (0.831.53) | 0.436 | 1.68 (1.122.52) | 0.012 | 1.05 (0.631.75) | 0.849 |
| Charges | ||||||
| Low | Ref | Ref | Ref | |||
| Medium | 1.69 (1.372.09) | <0.001 | 1.71 (1.32.26) | <0.001 | 1.15 (0.821.61) | 0.428 |
| High | 2.76 (2.193.47) | <0.001 | 3.31 (2.434.51) | <0.001 | 1.55 (1.092.22) | 0.016 |
| Service | ||||||
| Medical | 0.57 (0.50.66) | <0.001 | ||||
| Surgical | Ref | |||||
Multivariable modeling (Table 3) for all patients without an ICU encounter suggested that (1) patients aged <30 years, 30 to 49 years, and 50 to 69 years were more likely to report top decile RSRs when compared to patients 70 years and older (OR: 1.61, 95% CI: 1.09‐2.36; OR: 1.44, 95% CI: 1.08‐1.93; and OR: 1.39, 95% CI: 1.13‐1.71, respectively) and (2), when compared to patients with extreme resource intensity scores, patients with higher resource intensity scores were more likely to report top decile RSRs (moderate [OR: 1.42, 95% CI: 1.11‐1.83], major [OR: 1.56, 95% CI: 1.22‐2.01], and extreme [OR: 2.29, 95% CI: 1.8‐2.92]. These results were relatively consistent within medical and surgical subgroups (Table 3).
| Overall | Medical | Surgical | ||||
|---|---|---|---|---|---|---|
| Odds Ratio (95% CI) | P | Odds Ratio (95% CI) | P | Odds Ratio (95% CI) | P | |
| ||||||
| Age, y | ||||||
| <30 | 1.61 (1.092.36) | 0.016 | 0.82 (0.41.7) | 0.596 | 2.31 (1.393.82) | 0.001 |
| 3049 | 1.44 (1.081.93) | 0.014 | 1.55 (1.032.32) | 0.034 | 1.41 (0.912.17) | 0.120 |
| 5069 | 1.39 (1.131.71) | 0.002 | 1.44 (1.11.88) | 0.008 | 1.39 (11.93) | 0.049 |
| >69 | Ref | Ref | Ref | |||
| Sex | ||||||
| Male | 1 (0.851.17) | 0.964 | 1 (0.81.25) | 0.975 | 0.99 (0.791.26) | 0.965 |
| Female | Ref | Ref | Ref | |||
| Payer | ||||||
| Public | 0.62 (0.142.8) | 0.531 | 0.42 (0.053.67) | 0.432 | 1.03 (0.128.59) | 0.978 |
| Private | 0.67 (0.153.02) | 0.599 | 0.42 (0.053.67) | 0.434 | 1.17 (0.149.69) | 0.884 |
| Charity | 1.54 (0.288.41) | 0.620 | 1 (0.0911.13) | 0.999 | 2.56 (0.2328.25) | 0.444 |
| Self | Ref | Ref | Ref | |||
| Severity index | ||||||
| 0 (lowest) | Ref | Ref | Ref | |||
| 13 | 1.07 (0.891.29) | 0.485 | 1.18 (0.881.58) | 0.267 | 1 (0.781.29) | 0.986 |
| 46 | 1.14 (0.861.51) | 0.377 | 1.42 (0.992.04) | 0.056 | 0.6 (0.331.1) | 0.100 |
| >6 (highest) | 1.31 (0.911.9) | 0.150 | 1.47 (0.932.33) | 0.097 | 1.1 (0.542.21) | 0.795 |
| Resource intensity score | ||||||
| Low | Ref | Ref | Ref | |||
| Moderate | 1.42 (1.111.83) | 0.006 | 1.6 (1.112.3) | 0.011 | 0.94 (0.661.34) | 0.722 |
| Major | 1.56 (1.222.01) | 0.001 | 1.69 (1.182.43) | 0.004 | 1.28 (0.911.8) | 0.151 |
| Extreme | 2.29 (1.82.92) | <0.001 | 2.72 (1.943.82) | <0.001 | 1.63 (1.172.26) | 0.004 |
| Service | ||||||
| Medical | 0.59 (0.50.69) | <0.001 | ||||
| Surgical | Ref | |||||
In those with at least 1 ICU attending encounter (see Supporting Table 1 in the online version of this article), no variables demonstrated significant association with top decile RSRs in the overall group or in the medical subgroup. For surgical patients with at least 1 ICU attending encounter (see Supporting Table 1 in the online version of this article), patients aged 30 to 49 and 50 to 69 years were more likely to provide top decile RSRs (OR: 1.93, 95% CI: 1.08‐3.46 and OR: 1.65, 95% CI 1.07‐2.53, respectively). Resource intensity was not significantly associated with top decile RSRs.
DISCUSSION
Our analysis suggests that, for patients on the general care floors, resource utilization is associated with the RSR and, therefore, potentially the CMS Summary Star Rating. Adjusting for severity of illness, patients with higher resource utilization were more likely to report top decile RSRs.
Prior data regarding utilization and satisfaction are mixed. In a 2‐year, prospective, national examination, patients in the highest quartile of patient satisfaction had increased healthcare and prescription drug expenditures as well as increased rates of hospitalization when compared with patients in the lowest quartile of patient satisfaction.[9] However, a recent national study of surgical administrative databases suggested hospitals with high patient satisfaction provided more efficient care.[13]
One reason for the conflicting data may be that large, national evaluations are unable to control for between‐hospital confounders (ie, hospital quality of care). By capturing all eligible returned surveys at 1 institution, our design allowed us to collect granular data. We found that in 1 hospital setting, patient population, facilities, and food services, patients receiving more clinical resources generally assigned higher ratings than patients receiving less.
It is possible that utilization is a proxy for serious illness, and that patients with serious illness receive more attention during hospitalization and are more satisfied when discharged in a good state of health. However, we did adjust for severity of illness in our model using the Charlson‐Deyo index and we suggest that, other factors being equal, hospitals with higher per‐patient expenditures may be assigned higher Summary Star Ratings.
CMS has recently implemented a number of metrics designed to decrease healthcare costs by improving quality, safety, and efficiency. Concurrently, CMS has also prioritized patient experience. The Summary Star Rating was created to provide healthcare consumers with an easy way to compare the patient experience between hospitals[4]; however, our data suggest that this metric may be at odds with inpatient cost savings and efficiency metrics.
Per‐patient spending becomes particularly salient when considering that in fiscal year 2016, CMS' hospital VBP reimbursement will include 2 metrics: an efficiency outcome measure labeled Medicare spending per beneficiary, and a patient experience outcome measure based on HCAHPS survey dimensions.[2] Together, these 2 metrics will comprise nearly half of the total VBP performance score used to determine reimbursement. Although our data suggest that these 2 VBP metrics may be correlated, it should be noted that we measured inpatient hospital charges, whereas the CMS efficiency outcome measure includes costs for episode of care spanning 3 days prior to hospitalization to 30 days after hospitalization.
Patient expectations likely play a role in satisfaction.[14, 15, 16] In an outpatient setting, physician fulfillment of patient requests has been associated with positive patient evaluations of care.[17] However, patients appear to value education, shared decision making, and provider empathy more than testing and intervention.[14, 18, 19, 20, 21, 22, 23] Perhaps, in the absence of the former attributes, patients use additional resource expenditure as a proxy.
It is not clear that higher resource expenditure improves outcomes. A landmark study of nearly 1 million Medicare enrollees by Fisher et al. suggests that, although Medicare patients in higher‐spending regions receive more care than those in lower‐spending regions, this does not result in better health outcomes, specifically with regard to mortality.[24, 25] Patients who live in areas of high hospital capacity use the hospital more frequently than do patients in areas of low hospital capacity, but this does not appear to result in improved mortality rates.[26] In fact, physicians in areas of high healthcare capacity report more difficulty maintaining high‐quality patient relationships and feel less able to provide high‐quality care than physicians in lower‐capacity areas.[27]
We hypothesize the cause of the association between resource utilization and patient satisfaction could be that patients (1) perceive that a doctor who allows them to stay longer in the hospital or who performs additional testing cares more about their well‐being and (2) that these patients feel more strongly that their concerns are being heard and addressed by their physicians. A systematic review of primary care patients identified many studies that found a positive association between meeting patient expectations and satisfaction with care, but also suggested that although patients frequently expect information, physicians misperceive this as an expectation of specific action.[28] A separate systematic review found that patient education in the form of decision aides can help patients develop more reasonable expectations and reduce utilization of certain discretionary procedures such as elective surgeries and prostate‐specific antigen testing.[29]
We did not specifically address clinical outcomes in our analysis because the clinical outcomes on which CMS currently adjusts VBP reimbursement focus on 30‐day mortality for specific diagnoses, nosocomial infections, and iatrogenic events.[30] Our data include only returned surveys from living patients, and it is likely that 30‐day mortality was similar throughout all subsets of patients. Additionally, the nosocomial and iatrogenic outcome measures used by CMS are sufficiently rare on the general floors and are unlikely to have significantly influenced our results.[31]
Our study has several strengths. Nearly all medical and surgical patient surveys returned during the study period were included, and therefore our calculations are likely to accurately reflect the Summary Star Rating that would have been assigned for the period. Second, the large sample size helps attenuate potential differences in commonly used outcome metrics. Third, by adjusting for a variety of demographic and clinical variables, we were able to decrease the likelihood of unidentified confounders.
Notably, we identified 38 (0.4%) surveys returned for patients under 18 years of age at admission. These surveys were included in our analysis because, to the best of our knowledge, they would have existed in the pool of surveys CMS could have used to assign a Summary Star Rating.
Our study also has limitations. First, geographically diverse data are needed to ensure generalizability. Second, we used the Charlson‐Deyo Comorbidity Index to describe the degree of illness for each patient. This index represents a patient's total illness burden but may not describe the relative severity of the patient's current illness relative to another patient. Third, we selected variables we felt were most likely to be associated with patient experience, but unidentified confounding remains possible. Fourth, attendings caring for ICU patients fall within the Division of Critical Care/Pulmonary Medicine. Therefore, we may have inadvertently placed patients into the ICU cohort who received a pulmonary/critical care consult on the general floors. Fifth, our data describe associations only for patients who returned surveys. Although there may be inherent biases in patients who return surveys, HCAHPS survey responses are used by CMS to determine a hospital's overall satisfaction score.
CONCLUSION
For patients who return HCAHPS surveys, resource utilization may be positively associated with a hospital's Summary Star Rating. These data suggest that hospitals with higher per‐patient expenditures may receive higher Summary Star Ratings, which could result in hospitals with higher per‐patient resource utilization appearing more attractive to healthcare consumers. Future studies should attempt to confirm our findings at other institutions and to determine causative factors.
Acknowledgements
The authors thank Jason Machan, PhD (Department of Orthopedics and Surgery, Warren Alpert Medical School, Brown University, Providence, Rhode Island) for his help with study design, and Ms. Brenda Foster (data analyst, University of Rochester Medical Center, Rochester, NY) for her help with data collection.
Disclosures: Nothing to report.
- , , . Redesigning physician compensation and improving ED performance. Healthc Financ Manage. 2011;65(6):114–117.
- QualityNet. Available at: https://www.qualitynet.org/dcs/ContentServer?c=Page97(13):1041–1048.
- , , , . Factors determining inpatient satisfaction with care. Soc Sci Med. 2002;54(4):493–504.
- , , , , . Patient satisfaction revisited: a multilevel approach. Soc Sci Med. 2009;69(1):68–75.
- , , , et al. Predictors of patient satisfaction with hospital health care. BMC Health Serv Res. 2006;6:102.
- , , , . The cost of satisfaction: a national study of patient satisfaction, health care utilization, expenditures, and mortality. Arch Intern Med. 2012;172(5):405–411.
- , , , , . Relationship between patient satisfaction with inpatient care and hospital readmission within 30 days. Am J Manag Care. 2011;17(1):41–48.
- Becker's Infection Control and Clinical Quality. Star Ratings go live on Hospital Compare: how many hospitals got 5 stars? Available at: http://www.beckershospitalreview.com/quality/star‐ratings‐go‐live‐on‐hospital‐compare‐how‐many‐hospitals‐got‐5‐stars.html. Published April 16, 2015. Accessed October 5, 2015.
- , , . Adapting a clinical comorbidity index for use with ICD‐9‐CM administrative databases. J Clin Epidemiol. 1992;45(6):613–619.
- , , . Patient satisfaction and quality of surgical care in US hospitals. Ann Surg. 2015;261(1):2–8.
- , , , , . Should health care providers be accountable for patients' care experiences? J Gen Intern Med. 2015;30(2):253–256.
- , , , , . Unmet expectations for care and the patient‐physician relationship. J Gen Intern Med. 2002;17(11):817–824.
- , , , et al. Do unmet expectations for specific tests, referrals, and new medications reduce patients' satisfaction? J Gen Intern Med. 2004;19(11):1080–1087.
- , , , , , . Request fulfillment in office practice: antecedents and relationship to outcomes. Med Care. 2002;40(1):38–51.
- , , , et al. Factors associated with patient satisfaction with care among dermatological outpatients. Br J Dermatol. 2001;145(4):617–623.
- , , , . Patient expectations of emergency department care: phase II—a cross‐sectional survey. CJEM. 2006;8(3):148–157.
- , , , , . Patients' perspectives on ideal physician behaviors. Mayo Clin Proc. 2006;81(3):338–344.
- , . What do people want from their health care? A qualitative study. J Participat Med. 2015;18:e10.
- , , . Evaluations of care by adults following a denial of an advertisement‐related prescription drug request: the role of expectations, symptom severity, and physician communication style. Soc Sci Med. 2006;62(4):888–899.
- , , , , , . Getting to “no”: strategies primary care physicians use to deny patient requests. Arch Intern Med. 2010;170(4):381–388.
- , , , , , . The implications of regional variations in Medicare spending. Part 1: the content, quality, and accessibility of care. Ann Intern Med. 2003;138(4):273–287.
- , , , , , . The implications of regional variations in Medicare spending. Part 2: health outcomes and satisfaction with care. Ann Intern Med. 2003;138(4):288–298.
- , , , et al. Associations among hospital capacity, utilization, and mortality of US Medicare beneficiaries, controlling for sociodemographic factors. Health Serv Res. 2000;34(6):1351–1362.
- , , , . Regional variations in health care intensity and physician perceptions of quality of care. Ann Intern Med. 2006;144(9):641–649.
- , , . Visit‐specific expectations and patient‐centered outcomes: a literature review. Arch Fam Med. 2000;9(10):1148–1155.
- , , , et al. Decision aids for people facing health treatment or screening decisions. Cochrane Database Syst Rev. 2014;1:CD001431.
- Centers for Medicare and Medicaid Services. Hospital Compare. Outcome domain. Available at: https://www.medicare.gov/hospitalcompare/data/outcome‐domain.html. Accessed October 5, 2015.
- Centers for Disease Control and Prevention. 2013 national and state healthcare‐associated infections progress report. Available at: www.cdc.gov/hai/progress‐report/index.html. Accessed October 5, 2015.
OUs and Patient Outcomes
Many pediatric hospitalizations are of short duration, and more than half of short‐stay hospitalizations are designated as observation status.[1, 2] Observation status is an administrative label assigned to patients who do not meet hospital or payer criteria for inpatient‐status care. Short‐stay observation‐status patients do not fit in traditional models of emergency department (ED) or inpatient care. EDs often focus on discharging or admitting patients within a matter of hours, whereas inpatient units tend to measure length of stay (LOS) in terms of days[3] and may not have systems in place to facilitate rapid discharge of short‐stay patients.[4] Observation units (OUs) have been established in some hospitals to address the unique care needs of short‐stay patients.[5, 6, 7]
Single‐site reports from children's hospitals with successful OUs have demonstrated shorter LOS and lower costs compared with inpatient settings.[6, 8, 9, 10, 11, 12, 13, 14] No prior study has examined hospital‐level effects of an OU on observation‐status patient outcomes. The Pediatric Health Information System (PHIS) database provides a unique opportunity to explore this question, because unlike other national hospital administrative databases,[15, 16] the PHIS dataset contains information about children under observation status. In addition, we know which PHIS hospitals had a dedicated OU in 2011.7
We hypothesized that overall observation‐status stays in hospitals with a dedicated OU would be of shorter duration with earlier discharges at lower cost than observation‐status stays in hospitals without a dedicated OU. We compared hospitals with and without a dedicated OU on secondary outcomes including rates of conversion to inpatient status and return care for any reason.
METHODS
We conducted a cross‐sectional analysis of hospital administrative data using the 2011 PHIS databasea national administrative database that contains resource utilization data from 43 participating hospitals located in 26 states plus the District of Columbia. These hospitals account for approximately 20% of pediatric hospitalizations in the United States.
For each hospital encounter, PHIS includes patient demographics, up to 41 International Classification of Diseases, Ninth Revision, Clinical Modification (ICD‐9‐CM) diagnoses, up to 41 ICD‐9‐CM procedures, and hospital charges for services. Data are deidentified prior to inclusion, but unique identifiers allow for determination of return visits and readmissions following an index visit for an individual patient. Data quality and reliability are assured jointly by the Children's Hospital Association (formerly Child Health Corporation of America, Overland Park, KS), participating hospitals, and Truven Health Analytics (New York, NY). This study, using administrative data, was not considered human subjects research by the policies of the Cincinnati Children's Hospital Medical Center Institutional Review Board.
Hospital Selection and Hospital Characteristics
The study sample was drawn from the 31 hospitals that reported observation‐status patient data to PHIS in 2011. Analyses were conducted in 2013, at which time 2011 was the most recent year of data. We categorized 14 hospitals as having a dedicated OU during 2011 based on information collected in 2013.7 To summarize briefly, we interviewed by telephone representatives of hospitals responding to an email query as to the presence of a geographically distinct OU for the care of unscheduled patients from the ED. Three of the 14 representatives reported their hospital had 2 OUs, 1 of which was a separate surgical OU. Ten OUs cared for both ED patients and patients with scheduled procedures; 8 units received patients from non‐ED sources. Hospitalists provided staffing in more than half of the OUs.
We attempted to identify administrative data that would signal care delivered in a dedicated OU using hospital charge codes reported to PHIS, but learned this was not possible due to between‐hospital variation in the specificity of the charge codes. Therefore, we were unable to determine if patient care was delivered in a dedicated OU or another setting, such as a general inpatient unit or the ED. Other hospital characteristics available from the PHIS dataset included the number of inpatient beds, ED visits, inpatient admissions, observation‐status stays, and payer mix. We calculated the percentage of ED visits resulting in admission by dividing the number of ED visits with associated inpatient or observation status by the total number of ED visits and the percentage of admissions under observation status by dividing the number of observation‐status stays by the total number of admissions under observation or inpatient status.
Visit Selection and Patient Characteristics
All observation‐status stays regardless of the point of entry into the hospital were eligible for this study. We excluded stays that were birth‐related, included intensive care, or resulted in transfer or death. Patient demographic characteristics used to describe the cohort included age, gender, race/ethnicity, and primary payer. Stays that began in the ED were identified by an emergency room charge within PHIS. Eligible stays were categorized using All Patient Refined Diagnosis Related Groups (APR‐DRGs) version 24 using the ICD‐9‐CM code‐based proprietary 3M software (3M Health Information Systems, St. Paul, MN). We determined the 15 top‐ranking APR‐DRGs among observation‐status stays in hospitals with a dedicated OU and hospitals without. Procedural stays were identified based on procedural APR‐DRGs (eg, tonsil and adenoid procedures) or the presence of an ICD‐9‐CM procedure code (eg, 331 spinal tap).
Measured Outcomes
Outcomes of observation‐status stays were determined within 4 categories: (1) LOS, (2) standardized costs, (3) conversion to inpatient status, and (4) return visits and readmissions. LOS was calculated in terms of nights spent in hospital for all stays by subtracting the discharge date from the admission date and in terms of hours for stays in the 28 hospitals that report admission and discharge hour to the PHIS database. Discharge timing was examined in 4, 6‐hour blocks starting at midnight. Standardized costs were derived from a charge master index that was created by taking the median costs from all PHIS hospitals for each charged service.[17] Standardized costs represent the estimated cost of providing any particular clinical activity but are not the cost to patients, nor do they represent the actual cost to any given hospital. This approach allows for cost comparisons across hospitals, without biases arising from using charges or from deriving costs using hospitals' ratios of costs to charges.[18] Conversion from observation to inpatient status was calculated by dividing the number of inpatient‐status stays with observation codes by the number of observation‐statusonly stays plus the number of inpatient‐status stays with observation codes. All‐cause 3‐day ED return visits and 30‐day readmissions to the same hospital were assessed using patient‐specific identifiers that allowed for tracking of ED return visits and readmissions following the index observation stay.
Data Analysis
Descriptive statistics were calculated for hospital and patient characteristics using medians and interquartile ranges (IQRs) for continuous factors and frequencies with percentages for categorical factors. Comparisons of these factors between hospitals with dedicated OUs and without were made using [2] and Wilcoxon rank sum tests as appropriate. Multivariable regression was performed using generalized linear mixed models treating hospital as a random effect and used patient age, the case‐mix index based on the APR‐DRG severity of illness, ED visit, and procedures associated with the index observation‐status stay. For continuous outcomes, we performed a log transformation on the outcome, confirmed the normality assumption, and back transformed the results. Sensitivity analyses were conducted to compare LOS, standardized costs, and conversation rates by hospital type for 10 of the 15 top‐ranking APR‐DRGs commonly cared for by pediatric hospitalists and to compare hospitals that reported the presence of an OU that was consistently open (24 hours per day, 7 days per week) and operating during the entire 2011 calendar year, and those without. Based on information gathered from the telephone interviews, hospitals with partially open OUs were similar to hospitals with continuously open OUs, such that they were included in our main analyses. All statistical analyses were performed using SAS version 9.3 (SAS Institute, Cary, NC). P values <0.05 were considered statistically significant.
RESULTS
Hospital Characteristics
Dedicated OUs were present in 14 of the 31 hospitals that reported observation‐status patient data to PHIS (Figure 1). Three of these hospitals had OUs that were open for 5 months or less in 2011; 1 unit opened, 1 unit closed, and 1 hospital operated a seasonal unit. The remaining 17 hospitals reported no OU that admitted unscheduled patients from the ED during 2011. Hospitals with a dedicated OU had more inpatient beds and higher median number of inpatient admissions than those without (Table 1). Hospitals were statistically similar in terms of total volume of ED visits, percentage of ED visits resulting in admission, total number of observation‐status stays, percentage of admissions under observation status, and payer mix.

| Overall, Median (IQR) | Hospitals With a Dedicated Observation Unit, Median (IQR) | Hospitals Without a Dedicated Observation Unit, Median (IQR) | P Value | |
|---|---|---|---|---|
| ||||
| No. of hospitals | 31 | 14 | 17 | |
| Total no. of inpatient beds | 273 (213311) | 304 (269425) | 246 (175293) | 0.006 |
| Total no. ED visits | 62971 (47,50497,723) | 87,892 (55,102117,119) | 53,151 (4750470,882) | 0.21 |
| ED visits resulting in admission, % | 13.1 (9.715.0) | 13.8 (10.5, 19.1) | 12.5 (9.714.5) | 0.31 |
| Total no. of inpatient admissions | 11,537 (9,26814,568) | 13,206 (11,32517,869) | 10,207 (8,64013,363) | 0.04 |
| Admissions under observation status, % | 25.7 (19.733.8) | 25.5 (21.431.4) | 26.0 (16.935.1) | 0.98 |
| Total no. of observation stays | 3,820 (27935672) | 4,850 (3,309 6,196) | 3,141 (2,3654,616) | 0.07 |
| Government payer, % | 60.2 (53.371.2) | 62.1 (54.9, 65.9) | 59.2 (53.373.7) | 0.89 |
Observation‐Status Patients by Hospital Type
In 2011, there were a total of 136,239 observation‐status stays69,983 (51.4%) within the 14 hospitals with a dedicated OU and 66,256 (48.6%) within the 17 hospitals without. Patient care originated in the ED for 57.8% observation‐status stays in hospitals with an OU compared with 53.0% of observation‐status stays in hospitals without (P<0.001). Compared with hospitals with a dedicated OU, those without a dedicated OU had higher percentages of observation‐status patients older than 12 years and non‐Hispanic and a higher percentage of observation‐status patients with private payer type (Table 2). The 15 top‐ranking APR‐DRGs accounted for roughly half of all observation‐status stays and were relatively consistent between hospitals with and without a dedicated OU (Table 3). Procedural care was frequently associated with observation‐status stays.
| Overall, No. (%) | Hospitals With a Dedicated Observation Unit, No. (%)* | Hospitals Without a Dedicated Observation Unit, No. (%) | P Value | |
|---|---|---|---|---|
| ||||
| Age | ||||
| <1 year | 23,845 (17.5) | 12,101 (17.3) | 11,744 (17.7) | <0.001 |
| 15 years | 53,405 (38.5) | 28,052 (40.1) | 24,353 (36.8) | |
| 612 years | 33,674 (24.7) | 17,215 (24.6) | 16,459 (24.8) | |
| 1318 years | 23,607 (17.3) | 11,472 (16.4) | 12,135 (18.3) | |
| >18 years | 2,708 (2) | 1,143 (1.6) | 1,565 (2.4) | |
| Gender | ||||
| Male | 76,142 (55.9) | 39,178 (56) | 36,964 (55.8) | 0.43 |
| Female | 60,025 (44.1) | 30,756 (44) | 29,269 (44.2) | |
| Race/ethnicity | ||||
| Non‐Hispanic white | 72,183 (53.0) | 30,653 (43.8) | 41,530 (62.7) | <0.001 |
| Non‐Hispanic black | 30,995 (22.8) | 16,314 (23.3) | 14,681 (22.2) | |
| Hispanic | 21,255 (15.6) | 16,583 (23.7) | 4,672 (7.1) | |
| Asian | 2,075 (1.5) | 1,313 (1.9) | 762 (1.2) | |
| Non‐Hispanic other | 9,731 (7.1) | 5,120 (7.3) | 4,611 (7.0) | |
| Payer | ||||
| Government | 68,725 (50.4) | 36,967 (52.8) | 31,758 (47.9) | <0.001 |
| Private | 48,416 (35.5) | 21,112 (30.2) | 27,304 (41.2) | |
| Other | 19,098 (14.0) | 11,904 (17) | 7,194 (10.9) | |
| Observation‐Status Patients in Hospitals With a Dedicated Observation Unit* | Observation‐Status Patients in Hospitals Without a Dedicated Observation Unit | ||||||||
|---|---|---|---|---|---|---|---|---|---|
| Rank | APR‐DRG | No. | % of All Observation Status Stays | % Began in ED | Rank | APR‐DRG | No. | % of All Observation Status Stays | % Began in ED |
| |||||||||
| 1 | Tonsil and adenoid procedures | 4,621 | 6.6 | 1.3 | 1 | Tonsil and adenoid procedures | 3,806 | 5.7 | 1.6 |
| 2 | Asthma | 4,246 | 6.1 | 85.3 | 2 | Asthma | 3,756 | 5.7 | 79.0 |
| 3 | Seizure | 3,516 | 5.0 | 52.0 | 3 | Seizure | 2,846 | 4.3 | 54.9 |
| 4 | Nonbacterial gastroenteritis | 3,286 | 4.7 | 85.8 | 4 | Upper respiratory infections | 2,733 | 4.1 | 69.6 |
| 5 | Bronchiolitis, RSV pneumonia | 3,093 | 4.4 | 78.5 | 5 | Nonbacterial gastroenteritis | 2,682 | 4.0 | 74.5 |
| 6 | Upper respiratory infections | 2,923 | 4.2 | 80.0 | 6 | Other digestive system diagnoses | 2,545 | 3.8 | 66.3 |
| 7 | Other digestive system diagnoses | 2,064 | 2.9 | 74.0 | 7 | Bronchiolitis, RSV pneumonia | 2,544 | 3.8 | 69.2 |
| 8 | Respiratory signs, symptoms, diagnoses | 2,052 | 2.9 | 81.6 | 8 | Shoulder and arm procedures | 1,862 | 2.8 | 72.6 |
| 9 | Other ENT/cranial/facial diagnoses | 1,684 | 2.4 | 43.6 | 9 | Appendectomy | 1,785 | 2.7 | 79.2 |
| 10 | Shoulder and arm procedures | 1,624 | 2.3 | 79.1 | 10 | Other ENT/cranial/facial diagnoses | 1,624 | 2.5 | 29.9 |
| 11 | Abdominal pain | 1,612 | 2.3 | 86.2 | 11 | Abdominal pain | 1,461 | 2.2 | 82.3 |
| 12 | Fever | 1,494 | 2.1 | 85.1 | 12 | Other factors influencing health status | 1,461 | 2.2 | 66.3 |
| 13 | Appendectomy | 1,465 | 2.1 | 66.4 | 13 | Cellulitis/other bacterial skin infections | 1,383 | 2.1 | 84.2 |
| 14 | Cellulitis/other bacterial skin infections | 1,393 | 2.0 | 86.4 | 14 | Respiratory signs, symptoms, diagnoses | 1,308 | 2.0 | 39.1 |
| 15 | Pneumonia NEC | 1,356 | 1.9 | 79.1 | 15 | Pneumonia NEC | 1,245 | 1.9 | 73.1 |
| Total | 36,429 | 52.0 | 57.8 | Total | 33,041 | 49.87 | 53.0 | ||
Outcomes of Observation‐Status Stays
A greater percentage of observation‐status stays in hospitals with a dedicated OU experienced a same‐day discharge (Table 4). In addition, a higher percentage of discharges occurred between midnight and 11 am in hospitals with a dedicated OU. However, overall risk‐adjusted LOS in hours (12.8 vs 12.2 hours, P=0.90) and risk‐adjusted total standardized costs ($2551 vs $2433, P=0.75) were similar between hospital types. These findings were consistent within the 1 APR‐DRGs commonly cared for by pediatric hospitalists (see Supporting Information, Appendix 1, in the online version of this article). Overall, conversion from observation to inpatient status was significantly higher in hospitals with a dedicated OU compared with hospitals without; however, this pattern was not consistent across the 10 APR‐DRGs commonly cared for by pediatric hospitalists (see Supporting Information, Appendix 1, in the online version of this article). Adjusted odds of 3‐day ED return visits and 30‐day readmissions were comparable between hospital groups.
| Observation‐Status Patients in Hospitals With a Dedicated Observation Unit | Observation‐Status Patients in Hospitals Without a Dedicated Observation Unit | P Value | |
|---|---|---|---|
| |||
| No. of hospitals | 14 | 17 | |
| Length of stay, h, median (IQR) | 12.8 (6.923.7) | 12.2 (721.3) | 0.90 |
| 0 midnights, no. (%) | 16,678 (23.8) | 14,648 (22.1) | <.001 |
| 1 midnight, no. (%) | 46,144 (65.9) | 44,559 (67.3) | |
| 2 midnights or more, no. (%) | 7,161 (10.2) | 7,049 (10.6) | |
| Discharge timing, no. (%) | |||
| Midnight5 am | 1,223 (1.9) | 408 (0.7) | <0.001 |
| 6 am11 am | 18,916 (29.3) | 15,914 (27.1) | |
| Noon5 pm | 32,699 (50.7) | 31,619 (53.9) | |
| 6 pm11 pm | 11,718 (18.2) | 10,718 (18.3) | |
| Total standardized costs, $, median (IQR) | 2,551.3 (2,053.93,169.1) | 2,433.4 (1,998.42,963) | 0.75 |
| Conversion to inpatient status | 11.06% | 9.63% | <0.01 |
| Return care, AOR (95% CI) | |||
| 3‐day ED return visit | 0.93 (0.77‐1.12) | Referent | 0.46 |
| 30‐day readmission | 0.88 (0.67‐1.15) | Referent | 0.36 |
We found similar results in sensitivity analyses comparing observation‐status stays in hospitals with a continuously open OU (open 24 hours per day, 7 days per week, for all of 2011 [n=10 hospitals]) to those without(see Supporting Information, Appendix 2, in the online version of this article). However, there were, on average, more observation‐status stays in hospitals with a continuously open OU (median 5605, IQR 42077089) than hospitals without (median 3309, IQR 26784616) (P=0.04). In contrast to our main results, conversion to inpatient status was lower in hospitals with a continuously open OU compared with hospitals without (8.52% vs 11.57%, P<0.01).
DISCUSSION
Counter to our hypothesis, we did not find hospital‐level differences in length of stay or costs for observation‐status patients cared for in hospitals with and without a dedicated OU, though hospitals with dedicated OUs did have more same‐day discharges and more morning discharges. The lack of observed differences in LOS and costs may reflect the fact that many children under observation status are treated throughout the hospital, even in facilities with a dedicated OU. Access to a dedicated OU is limited by factors including small numbers of OU beds and specific low acuity/low complexity OU admission criteria.[7] The inclusion of all children admitted under observation status in our analyses may have diluted any effect of dedicated OUs at the hospital level, but was necessary due to the inability to identify location of care for children admitted under observation status. Location of care is an important variable that should be incorporated into administrative databases to allow for comparative effectiveness research designs. Until such data are available, chart review at individual hospitals would be necessary to determine which patients received care in an OU.
We did find that discharges for observation‐status patients occurred earlier in the day in hospitals with a dedicated OU when compared with observation‐status patients in hospitals without a dedicated OU. In addition, the percentage of same‐day discharges was higher among observation‐status patients treated in hospitals with a dedicated OU. These differences may stem from policies and procedures that encourage rapid discharge in dedicated OUs, and those practices may affect other care areas. For example, OUs may enforce policies requiring family presence at the bedside or utilize staffing models where doctors and nurses are in frequent communication, both of which would facilitate discharge as soon as a patient no longer required hospital‐based care.[7] A retrospective chart review study design could be used to identify discharge processes and other key characteristics of highly performing OUs.
We found conflicting results in our main and sensitivity analyses related to conversion to inpatient status. Lower percentages of observation‐status patients converting to inpatient status indicates greater success in the delivery of observation care based on established performance metrics.[19] Lower rates of conversion to inpatient status may be the result of stricter admission criteria for some diagnosis and in hospitals with a continuously open dedicate OU, more refined processes for utilization review that allow for patients to be placed into the correct status (observation vs inpatient) at the time of admission, or efforts to educate providers about the designation of observation status.[7] It is also possible that fewer observation‐status patients convert to inpatient status in hospitals with a continuously open dedicated OU because such a change would require movement of the patient to an inpatient bed.
These analyses were more comprehensive than our prior studies[2, 20] in that we included both patients who were treated first in the ED and those who were not. In addition to the APR‐DRGs representative of conditions that have been successfully treated in ED‐based pediatric OUs (eg, asthma, seizures, gastroenteritis, cellulitis),[8, 9, 21, 22] we found observation‐status was commonly associated with procedural care. This population of patients may be relevant to hospitalists who staff OUs that provide both unscheduled and postprocedural care. The colocation of medical and postprocedural patients has been described by others[8, 23] and was reported to occur in over half of the OUs included in this study.[7] The extent to which postprocedure observation care is provided in general OUs staffed by hospitalists represents another opportunity for further study.
Hospitals face many considerations when determining if and how they will provide observation services to patients expected to experience short stays.[7] Some hospitals may be unable to justify an OU for all or part of the year based on the volume of admissions or the costs to staff an OU.[24, 25] Other hospitals may open an OU to promote patient flow and reduce ED crowding.[26] Hospitals may also be influenced by reimbursement policies related to observation‐status stays. Although we did not observe differences in overall payer mix, we did find higher percentages of observation‐status patients in hospitals with dedicated OUs to have public insurance. Although hospital contracts with payers around observation status patients are complex and beyond the scope of this analysis, it is possible that hospitals have established OUs because of increasingly stringent rules or criteria to meet inpatient status or experiences with high volumes of observation‐status patients covered by a particular payer. Nevertheless, the brief nature of many pediatric hospitalizations and the scarcity of pediatric OU beds must be considered in policy changes that result from national discussions about the appropriateness of inpatient stays shorter than 2 nights in duration.[27]
Limitations
The primary limitation to our analyses is the lack of ability to identify patients who were treated in a dedicated OU because few hospitals provided data to PHIS that allowed for the identification of the unit or location of care. Second, it is possible that some hospitals were misclassified as not having a dedicated OU based on our survey, which initially inquired about OUs that provided care to patients first treated in the ED. Therefore, OUs that exclusively care for postoperative patients or patients with scheduled treatments may be present in hospitals that we have labeled as not having a dedicated OU. This potential misclassification would bias our results toward finding no differences. Third, in any study of administrative data there is potential that diagnosis codes are incomplete or inaccurately capture the underlying reason for the episode of care. Fourth, the experiences of the free‐standing children's hospitals that contribute data to PHIS may not be generalizable to other hospitals that provide observation care to children. Finally, return care may be underestimated, as children could receive treatment at another hospital following discharge from a PHIS hospital. Care outside of PHIS hospitals would not be captured, but we do not expect this to differ for hospitals with and without dedicated OUs. It is possible that health information exchanges will permit more comprehensive analyses of care across different hospitals in the future.
CONCLUSION
Observation status patients are similar in hospitals with and without dedicated observation units that admit children from the ED. The presence of a dedicated OU appears to have an influence on same‐day and morning discharges across all observation‐status stays without impacting other hospital‐level outcomes. Inclusion of location of care (eg, geographically distinct dedicated OU vs general inpatient unit vs ED) in hospital administrative datasets would allow for meaningful comparisons of different models of care for short‐stay observation‐status patients.
Acknowledgements
The authors thank John P. Harding, MBA, FACHE, Children's Hospital of the King's Daughters, Norfolk, Virginia for his input on the study design.
Disclosures: Dr. Hall had full access to the data and takes responsibility for the integrity of the data and the accuracy of the data analysis. Internal funds from the Children's Hospital Association supported the conduct of this work. The authors have no financial relationships or conflicts of interest to disclose.
Many pediatric hospitalizations are of short duration, and more than half of short‐stay hospitalizations are designated as observation status.[1, 2] Observation status is an administrative label assigned to patients who do not meet hospital or payer criteria for inpatient‐status care. Short‐stay observation‐status patients do not fit in traditional models of emergency department (ED) or inpatient care. EDs often focus on discharging or admitting patients within a matter of hours, whereas inpatient units tend to measure length of stay (LOS) in terms of days[3] and may not have systems in place to facilitate rapid discharge of short‐stay patients.[4] Observation units (OUs) have been established in some hospitals to address the unique care needs of short‐stay patients.[5, 6, 7]
Single‐site reports from children's hospitals with successful OUs have demonstrated shorter LOS and lower costs compared with inpatient settings.[6, 8, 9, 10, 11, 12, 13, 14] No prior study has examined hospital‐level effects of an OU on observation‐status patient outcomes. The Pediatric Health Information System (PHIS) database provides a unique opportunity to explore this question, because unlike other national hospital administrative databases,[15, 16] the PHIS dataset contains information about children under observation status. In addition, we know which PHIS hospitals had a dedicated OU in 2011.7
We hypothesized that overall observation‐status stays in hospitals with a dedicated OU would be of shorter duration with earlier discharges at lower cost than observation‐status stays in hospitals without a dedicated OU. We compared hospitals with and without a dedicated OU on secondary outcomes including rates of conversion to inpatient status and return care for any reason.
METHODS
We conducted a cross‐sectional analysis of hospital administrative data using the 2011 PHIS databasea national administrative database that contains resource utilization data from 43 participating hospitals located in 26 states plus the District of Columbia. These hospitals account for approximately 20% of pediatric hospitalizations in the United States.
For each hospital encounter, PHIS includes patient demographics, up to 41 International Classification of Diseases, Ninth Revision, Clinical Modification (ICD‐9‐CM) diagnoses, up to 41 ICD‐9‐CM procedures, and hospital charges for services. Data are deidentified prior to inclusion, but unique identifiers allow for determination of return visits and readmissions following an index visit for an individual patient. Data quality and reliability are assured jointly by the Children's Hospital Association (formerly Child Health Corporation of America, Overland Park, KS), participating hospitals, and Truven Health Analytics (New York, NY). This study, using administrative data, was not considered human subjects research by the policies of the Cincinnati Children's Hospital Medical Center Institutional Review Board.
Hospital Selection and Hospital Characteristics
The study sample was drawn from the 31 hospitals that reported observation‐status patient data to PHIS in 2011. Analyses were conducted in 2013, at which time 2011 was the most recent year of data. We categorized 14 hospitals as having a dedicated OU during 2011 based on information collected in 2013.7 To summarize briefly, we interviewed by telephone representatives of hospitals responding to an email query as to the presence of a geographically distinct OU for the care of unscheduled patients from the ED. Three of the 14 representatives reported their hospital had 2 OUs, 1 of which was a separate surgical OU. Ten OUs cared for both ED patients and patients with scheduled procedures; 8 units received patients from non‐ED sources. Hospitalists provided staffing in more than half of the OUs.
We attempted to identify administrative data that would signal care delivered in a dedicated OU using hospital charge codes reported to PHIS, but learned this was not possible due to between‐hospital variation in the specificity of the charge codes. Therefore, we were unable to determine if patient care was delivered in a dedicated OU or another setting, such as a general inpatient unit or the ED. Other hospital characteristics available from the PHIS dataset included the number of inpatient beds, ED visits, inpatient admissions, observation‐status stays, and payer mix. We calculated the percentage of ED visits resulting in admission by dividing the number of ED visits with associated inpatient or observation status by the total number of ED visits and the percentage of admissions under observation status by dividing the number of observation‐status stays by the total number of admissions under observation or inpatient status.
Visit Selection and Patient Characteristics
All observation‐status stays regardless of the point of entry into the hospital were eligible for this study. We excluded stays that were birth‐related, included intensive care, or resulted in transfer or death. Patient demographic characteristics used to describe the cohort included age, gender, race/ethnicity, and primary payer. Stays that began in the ED were identified by an emergency room charge within PHIS. Eligible stays were categorized using All Patient Refined Diagnosis Related Groups (APR‐DRGs) version 24 using the ICD‐9‐CM code‐based proprietary 3M software (3M Health Information Systems, St. Paul, MN). We determined the 15 top‐ranking APR‐DRGs among observation‐status stays in hospitals with a dedicated OU and hospitals without. Procedural stays were identified based on procedural APR‐DRGs (eg, tonsil and adenoid procedures) or the presence of an ICD‐9‐CM procedure code (eg, 331 spinal tap).
Measured Outcomes
Outcomes of observation‐status stays were determined within 4 categories: (1) LOS, (2) standardized costs, (3) conversion to inpatient status, and (4) return visits and readmissions. LOS was calculated in terms of nights spent in hospital for all stays by subtracting the discharge date from the admission date and in terms of hours for stays in the 28 hospitals that report admission and discharge hour to the PHIS database. Discharge timing was examined in 4, 6‐hour blocks starting at midnight. Standardized costs were derived from a charge master index that was created by taking the median costs from all PHIS hospitals for each charged service.[17] Standardized costs represent the estimated cost of providing any particular clinical activity but are not the cost to patients, nor do they represent the actual cost to any given hospital. This approach allows for cost comparisons across hospitals, without biases arising from using charges or from deriving costs using hospitals' ratios of costs to charges.[18] Conversion from observation to inpatient status was calculated by dividing the number of inpatient‐status stays with observation codes by the number of observation‐statusonly stays plus the number of inpatient‐status stays with observation codes. All‐cause 3‐day ED return visits and 30‐day readmissions to the same hospital were assessed using patient‐specific identifiers that allowed for tracking of ED return visits and readmissions following the index observation stay.
Data Analysis
Descriptive statistics were calculated for hospital and patient characteristics using medians and interquartile ranges (IQRs) for continuous factors and frequencies with percentages for categorical factors. Comparisons of these factors between hospitals with dedicated OUs and without were made using [2] and Wilcoxon rank sum tests as appropriate. Multivariable regression was performed using generalized linear mixed models treating hospital as a random effect and used patient age, the case‐mix index based on the APR‐DRG severity of illness, ED visit, and procedures associated with the index observation‐status stay. For continuous outcomes, we performed a log transformation on the outcome, confirmed the normality assumption, and back transformed the results. Sensitivity analyses were conducted to compare LOS, standardized costs, and conversation rates by hospital type for 10 of the 15 top‐ranking APR‐DRGs commonly cared for by pediatric hospitalists and to compare hospitals that reported the presence of an OU that was consistently open (24 hours per day, 7 days per week) and operating during the entire 2011 calendar year, and those without. Based on information gathered from the telephone interviews, hospitals with partially open OUs were similar to hospitals with continuously open OUs, such that they were included in our main analyses. All statistical analyses were performed using SAS version 9.3 (SAS Institute, Cary, NC). P values <0.05 were considered statistically significant.
RESULTS
Hospital Characteristics
Dedicated OUs were present in 14 of the 31 hospitals that reported observation‐status patient data to PHIS (Figure 1). Three of these hospitals had OUs that were open for 5 months or less in 2011; 1 unit opened, 1 unit closed, and 1 hospital operated a seasonal unit. The remaining 17 hospitals reported no OU that admitted unscheduled patients from the ED during 2011. Hospitals with a dedicated OU had more inpatient beds and higher median number of inpatient admissions than those without (Table 1). Hospitals were statistically similar in terms of total volume of ED visits, percentage of ED visits resulting in admission, total number of observation‐status stays, percentage of admissions under observation status, and payer mix.
| Overall, Median (IQR) | Hospitals With a Dedicated Observation Unit, Median (IQR) | Hospitals Without a Dedicated Observation Unit, Median (IQR) | P Value | |
|---|---|---|---|---|
| ||||
| No. of hospitals | 31 | 14 | 17 | |
| Total no. of inpatient beds | 273 (213311) | 304 (269425) | 246 (175293) | 0.006 |
| Total no. ED visits | 62971 (47,50497,723) | 87,892 (55,102117,119) | 53,151 (4750470,882) | 0.21 |
| ED visits resulting in admission, % | 13.1 (9.715.0) | 13.8 (10.5, 19.1) | 12.5 (9.714.5) | 0.31 |
| Total no. of inpatient admissions | 11,537 (9,26814,568) | 13,206 (11,32517,869) | 10,207 (8,64013,363) | 0.04 |
| Admissions under observation status, % | 25.7 (19.733.8) | 25.5 (21.431.4) | 26.0 (16.935.1) | 0.98 |
| Total no. of observation stays | 3,820 (27935672) | 4,850 (3,309 6,196) | 3,141 (2,3654,616) | 0.07 |
| Government payer, % | 60.2 (53.371.2) | 62.1 (54.9, 65.9) | 59.2 (53.373.7) | 0.89 |
Observation‐Status Patients by Hospital Type
In 2011, there were a total of 136,239 observation‐status stays69,983 (51.4%) within the 14 hospitals with a dedicated OU and 66,256 (48.6%) within the 17 hospitals without. Patient care originated in the ED for 57.8% observation‐status stays in hospitals with an OU compared with 53.0% of observation‐status stays in hospitals without (P<0.001). Compared with hospitals with a dedicated OU, those without a dedicated OU had higher percentages of observation‐status patients older than 12 years and non‐Hispanic and a higher percentage of observation‐status patients with private payer type (Table 2). The 15 top‐ranking APR‐DRGs accounted for roughly half of all observation‐status stays and were relatively consistent between hospitals with and without a dedicated OU (Table 3). Procedural care was frequently associated with observation‐status stays.
| Overall, No. (%) | Hospitals With a Dedicated Observation Unit, No. (%)* | Hospitals Without a Dedicated Observation Unit, No. (%) | P Value | |
|---|---|---|---|---|
| ||||
| Age | ||||
| <1 year | 23,845 (17.5) | 12,101 (17.3) | 11,744 (17.7) | <0.001 |
| 15 years | 53,405 (38.5) | 28,052 (40.1) | 24,353 (36.8) | |
| 612 years | 33,674 (24.7) | 17,215 (24.6) | 16,459 (24.8) | |
| 1318 years | 23,607 (17.3) | 11,472 (16.4) | 12,135 (18.3) | |
| >18 years | 2,708 (2) | 1,143 (1.6) | 1,565 (2.4) | |
| Gender | ||||
| Male | 76,142 (55.9) | 39,178 (56) | 36,964 (55.8) | 0.43 |
| Female | 60,025 (44.1) | 30,756 (44) | 29,269 (44.2) | |
| Race/ethnicity | ||||
| Non‐Hispanic white | 72,183 (53.0) | 30,653 (43.8) | 41,530 (62.7) | <0.001 |
| Non‐Hispanic black | 30,995 (22.8) | 16,314 (23.3) | 14,681 (22.2) | |
| Hispanic | 21,255 (15.6) | 16,583 (23.7) | 4,672 (7.1) | |
| Asian | 2,075 (1.5) | 1,313 (1.9) | 762 (1.2) | |
| Non‐Hispanic other | 9,731 (7.1) | 5,120 (7.3) | 4,611 (7.0) | |
| Payer | ||||
| Government | 68,725 (50.4) | 36,967 (52.8) | 31,758 (47.9) | <0.001 |
| Private | 48,416 (35.5) | 21,112 (30.2) | 27,304 (41.2) | |
| Other | 19,098 (14.0) | 11,904 (17) | 7,194 (10.9) | |
| Observation‐Status Patients in Hospitals With a Dedicated Observation Unit* | Observation‐Status Patients in Hospitals Without a Dedicated Observation Unit | ||||||||
|---|---|---|---|---|---|---|---|---|---|
| Rank | APR‐DRG | No. | % of All Observation Status Stays | % Began in ED | Rank | APR‐DRG | No. | % of All Observation Status Stays | % Began in ED |
| |||||||||
| 1 | Tonsil and adenoid procedures | 4,621 | 6.6 | 1.3 | 1 | Tonsil and adenoid procedures | 3,806 | 5.7 | 1.6 |
| 2 | Asthma | 4,246 | 6.1 | 85.3 | 2 | Asthma | 3,756 | 5.7 | 79.0 |
| 3 | Seizure | 3,516 | 5.0 | 52.0 | 3 | Seizure | 2,846 | 4.3 | 54.9 |
| 4 | Nonbacterial gastroenteritis | 3,286 | 4.7 | 85.8 | 4 | Upper respiratory infections | 2,733 | 4.1 | 69.6 |
| 5 | Bronchiolitis, RSV pneumonia | 3,093 | 4.4 | 78.5 | 5 | Nonbacterial gastroenteritis | 2,682 | 4.0 | 74.5 |
| 6 | Upper respiratory infections | 2,923 | 4.2 | 80.0 | 6 | Other digestive system diagnoses | 2,545 | 3.8 | 66.3 |
| 7 | Other digestive system diagnoses | 2,064 | 2.9 | 74.0 | 7 | Bronchiolitis, RSV pneumonia | 2,544 | 3.8 | 69.2 |
| 8 | Respiratory signs, symptoms, diagnoses | 2,052 | 2.9 | 81.6 | 8 | Shoulder and arm procedures | 1,862 | 2.8 | 72.6 |
| 9 | Other ENT/cranial/facial diagnoses | 1,684 | 2.4 | 43.6 | 9 | Appendectomy | 1,785 | 2.7 | 79.2 |
| 10 | Shoulder and arm procedures | 1,624 | 2.3 | 79.1 | 10 | Other ENT/cranial/facial diagnoses | 1,624 | 2.5 | 29.9 |
| 11 | Abdominal pain | 1,612 | 2.3 | 86.2 | 11 | Abdominal pain | 1,461 | 2.2 | 82.3 |
| 12 | Fever | 1,494 | 2.1 | 85.1 | 12 | Other factors influencing health status | 1,461 | 2.2 | 66.3 |
| 13 | Appendectomy | 1,465 | 2.1 | 66.4 | 13 | Cellulitis/other bacterial skin infections | 1,383 | 2.1 | 84.2 |
| 14 | Cellulitis/other bacterial skin infections | 1,393 | 2.0 | 86.4 | 14 | Respiratory signs, symptoms, diagnoses | 1,308 | 2.0 | 39.1 |
| 15 | Pneumonia NEC | 1,356 | 1.9 | 79.1 | 15 | Pneumonia NEC | 1,245 | 1.9 | 73.1 |
| Total | 36,429 | 52.0 | 57.8 | Total | 33,041 | 49.87 | 53.0 | ||
Outcomes of Observation‐Status Stays
A greater percentage of observation‐status stays in hospitals with a dedicated OU experienced a same‐day discharge (Table 4). In addition, a higher percentage of discharges occurred between midnight and 11 am in hospitals with a dedicated OU. However, overall risk‐adjusted LOS in hours (12.8 vs 12.2 hours, P=0.90) and risk‐adjusted total standardized costs ($2551 vs $2433, P=0.75) were similar between hospital types. These findings were consistent within the 1 APR‐DRGs commonly cared for by pediatric hospitalists (see Supporting Information, Appendix 1, in the online version of this article). Overall, conversion from observation to inpatient status was significantly higher in hospitals with a dedicated OU compared with hospitals without; however, this pattern was not consistent across the 10 APR‐DRGs commonly cared for by pediatric hospitalists (see Supporting Information, Appendix 1, in the online version of this article). Adjusted odds of 3‐day ED return visits and 30‐day readmissions were comparable between hospital groups.
| Observation‐Status Patients in Hospitals With a Dedicated Observation Unit | Observation‐Status Patients in Hospitals Without a Dedicated Observation Unit | P Value | |
|---|---|---|---|
| |||
| No. of hospitals | 14 | 17 | |
| Length of stay, h, median (IQR) | 12.8 (6.923.7) | 12.2 (721.3) | 0.90 |
| 0 midnights, no. (%) | 16,678 (23.8) | 14,648 (22.1) | <.001 |
| 1 midnight, no. (%) | 46,144 (65.9) | 44,559 (67.3) | |
| 2 midnights or more, no. (%) | 7,161 (10.2) | 7,049 (10.6) | |
| Discharge timing, no. (%) | |||
| Midnight5 am | 1,223 (1.9) | 408 (0.7) | <0.001 |
| 6 am11 am | 18,916 (29.3) | 15,914 (27.1) | |
| Noon5 pm | 32,699 (50.7) | 31,619 (53.9) | |
| 6 pm11 pm | 11,718 (18.2) | 10,718 (18.3) | |
| Total standardized costs, $, median (IQR) | 2,551.3 (2,053.93,169.1) | 2,433.4 (1,998.42,963) | 0.75 |
| Conversion to inpatient status | 11.06% | 9.63% | <0.01 |
| Return care, AOR (95% CI) | |||
| 3‐day ED return visit | 0.93 (0.77‐1.12) | Referent | 0.46 |
| 30‐day readmission | 0.88 (0.67‐1.15) | Referent | 0.36 |
We found similar results in sensitivity analyses comparing observation‐status stays in hospitals with a continuously open OU (open 24 hours per day, 7 days per week, for all of 2011 [n=10 hospitals]) to those without(see Supporting Information, Appendix 2, in the online version of this article). However, there were, on average, more observation‐status stays in hospitals with a continuously open OU (median 5605, IQR 42077089) than hospitals without (median 3309, IQR 26784616) (P=0.04). In contrast to our main results, conversion to inpatient status was lower in hospitals with a continuously open OU compared with hospitals without (8.52% vs 11.57%, P<0.01).
DISCUSSION
Counter to our hypothesis, we did not find hospital‐level differences in length of stay or costs for observation‐status patients cared for in hospitals with and without a dedicated OU, though hospitals with dedicated OUs did have more same‐day discharges and more morning discharges. The lack of observed differences in LOS and costs may reflect the fact that many children under observation status are treated throughout the hospital, even in facilities with a dedicated OU. Access to a dedicated OU is limited by factors including small numbers of OU beds and specific low acuity/low complexity OU admission criteria.[7] The inclusion of all children admitted under observation status in our analyses may have diluted any effect of dedicated OUs at the hospital level, but was necessary due to the inability to identify location of care for children admitted under observation status. Location of care is an important variable that should be incorporated into administrative databases to allow for comparative effectiveness research designs. Until such data are available, chart review at individual hospitals would be necessary to determine which patients received care in an OU.
We did find that discharges for observation‐status patients occurred earlier in the day in hospitals with a dedicated OU when compared with observation‐status patients in hospitals without a dedicated OU. In addition, the percentage of same‐day discharges was higher among observation‐status patients treated in hospitals with a dedicated OU. These differences may stem from policies and procedures that encourage rapid discharge in dedicated OUs, and those practices may affect other care areas. For example, OUs may enforce policies requiring family presence at the bedside or utilize staffing models where doctors and nurses are in frequent communication, both of which would facilitate discharge as soon as a patient no longer required hospital‐based care.[7] A retrospective chart review study design could be used to identify discharge processes and other key characteristics of highly performing OUs.
We found conflicting results in our main and sensitivity analyses related to conversion to inpatient status. Lower percentages of observation‐status patients converting to inpatient status indicates greater success in the delivery of observation care based on established performance metrics.[19] Lower rates of conversion to inpatient status may be the result of stricter admission criteria for some diagnosis and in hospitals with a continuously open dedicate OU, more refined processes for utilization review that allow for patients to be placed into the correct status (observation vs inpatient) at the time of admission, or efforts to educate providers about the designation of observation status.[7] It is also possible that fewer observation‐status patients convert to inpatient status in hospitals with a continuously open dedicated OU because such a change would require movement of the patient to an inpatient bed.
These analyses were more comprehensive than our prior studies[2, 20] in that we included both patients who were treated first in the ED and those who were not. In addition to the APR‐DRGs representative of conditions that have been successfully treated in ED‐based pediatric OUs (eg, asthma, seizures, gastroenteritis, cellulitis),[8, 9, 21, 22] we found observation‐status was commonly associated with procedural care. This population of patients may be relevant to hospitalists who staff OUs that provide both unscheduled and postprocedural care. The colocation of medical and postprocedural patients has been described by others[8, 23] and was reported to occur in over half of the OUs included in this study.[7] The extent to which postprocedure observation care is provided in general OUs staffed by hospitalists represents another opportunity for further study.
Hospitals face many considerations when determining if and how they will provide observation services to patients expected to experience short stays.[7] Some hospitals may be unable to justify an OU for all or part of the year based on the volume of admissions or the costs to staff an OU.[24, 25] Other hospitals may open an OU to promote patient flow and reduce ED crowding.[26] Hospitals may also be influenced by reimbursement policies related to observation‐status stays. Although we did not observe differences in overall payer mix, we did find higher percentages of observation‐status patients in hospitals with dedicated OUs to have public insurance. Although hospital contracts with payers around observation status patients are complex and beyond the scope of this analysis, it is possible that hospitals have established OUs because of increasingly stringent rules or criteria to meet inpatient status or experiences with high volumes of observation‐status patients covered by a particular payer. Nevertheless, the brief nature of many pediatric hospitalizations and the scarcity of pediatric OU beds must be considered in policy changes that result from national discussions about the appropriateness of inpatient stays shorter than 2 nights in duration.[27]
Limitations
The primary limitation to our analyses is the lack of ability to identify patients who were treated in a dedicated OU because few hospitals provided data to PHIS that allowed for the identification of the unit or location of care. Second, it is possible that some hospitals were misclassified as not having a dedicated OU based on our survey, which initially inquired about OUs that provided care to patients first treated in the ED. Therefore, OUs that exclusively care for postoperative patients or patients with scheduled treatments may be present in hospitals that we have labeled as not having a dedicated OU. This potential misclassification would bias our results toward finding no differences. Third, in any study of administrative data there is potential that diagnosis codes are incomplete or inaccurately capture the underlying reason for the episode of care. Fourth, the experiences of the free‐standing children's hospitals that contribute data to PHIS may not be generalizable to other hospitals that provide observation care to children. Finally, return care may be underestimated, as children could receive treatment at another hospital following discharge from a PHIS hospital. Care outside of PHIS hospitals would not be captured, but we do not expect this to differ for hospitals with and without dedicated OUs. It is possible that health information exchanges will permit more comprehensive analyses of care across different hospitals in the future.
CONCLUSION
Observation status patients are similar in hospitals with and without dedicated observation units that admit children from the ED. The presence of a dedicated OU appears to have an influence on same‐day and morning discharges across all observation‐status stays without impacting other hospital‐level outcomes. Inclusion of location of care (eg, geographically distinct dedicated OU vs general inpatient unit vs ED) in hospital administrative datasets would allow for meaningful comparisons of different models of care for short‐stay observation‐status patients.
Acknowledgements
The authors thank John P. Harding, MBA, FACHE, Children's Hospital of the King's Daughters, Norfolk, Virginia for his input on the study design.
Disclosures: Dr. Hall had full access to the data and takes responsibility for the integrity of the data and the accuracy of the data analysis. Internal funds from the Children's Hospital Association supported the conduct of this work. The authors have no financial relationships or conflicts of interest to disclose.
© 2015 Society of Hospital Medicine
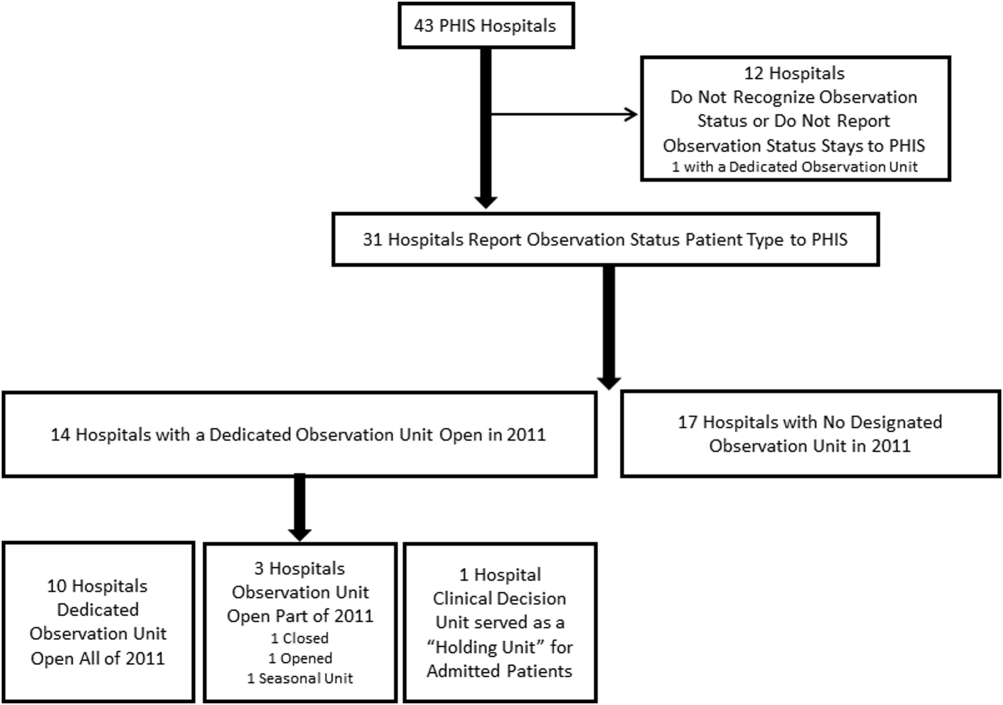
Radiographs Predict Pneumonia Severity
The 2011 Pediatric Infectious Diseases Society and Infectious Diseases Society of America (PIDS/IDSA) guidelines for management of pediatric community‐acquired pneumonia (CAP) recommend that admission chest radiographs be obtained in all children hospitalized with CAP to document the presence and extent of infiltrates and to identify complications.[1] Findings from chest radiographs may also provide clues to etiology and assist with predicting disease outcomes. In adults with CAP, clinical prediction tools use radiographic findings to inform triage decisions, guide management strategies, and predict outcomes.[2, 3, 4, 5, 6, 7] Whether or not radiographic findings could have similar utility among children with CAP is unknown.
Several retrospective studies have examined the ability of chest radiographs to predict pediatric pneumonia disease severity.[8, 9, 10, 11, 12] However, these studies used several different measures of severe pneumonia and/or were limited to young children <5 years of age, leading to inconsistent findings. These studies also rarely considered very severe disease (eg, need for invasive mechanical ventilation) or longitudinal outcome measures such as hospital length of stay. Finally, all of these prior studies were conducted outside of the United States, and most were single‐center investigations, potentially limiting generalizability. We sought to examine associations between admission chest radiographic findings and subsequent hospital care processes and clinical outcomes, including length of stay and resource utilization measures, among children hospitalized with CAP at 4 children's hospitals in the United States.
METHODS
Design and Setting
This study was nested within a multicenter retrospective cohort designed to validate International Classification of Diseases, 9th Revision, Clinical Modification (ICD9‐CM) diagnostic codes for pediatric CAP hospitalizations.[13] The Pediatric Health Information System database (Children's Hospital Association, Overland Park, KS) was used to identify children from 4 freestanding pediatric hospitals (Monroe Carell, Jr. Children's Hospital at Vanderbilt, Nashville, Tennessee; Children's Mercy Hospitals & Clinics, Kansas City, Missouri; Seattle Children's Hospital, Seattle, Washington; and Cincinnati Children's Hospital Medical Center, Cincinnati, Ohio). The institutional review boards at each participating institution approved the study. The validation study included a 25% random sampling of children 60 days to 18 years of age (n=998) who were hospitalized between January 1, 2010 and December 31, 2010 with at least 1 ICD9‐CM discharge code indicating pneumonia. The diagnosis of CAP was confirmed by medical record review.
Study Population
This study was limited to children from the validation study who met criteria for clinical and radiographic CAP, defined as: (1) abnormal temperature or white blood cell count, (2) signs and symptoms of acute respiratory illness (eg, cough, tachypnea), and (3) chest radiograph indicating pneumonia within 48 hours of admission. Children with atelectasis as the only abnormal radiographic finding and those with complex chronic conditions (eg, cystic fibrosis, malignancy) were excluded using a previously described algorithm.[14]
Outcomes
Several measures of disease severity were assessed. Dichotomous outcomes included supplemental oxygen use, need for intensive care unit (ICU) admission, and need for invasive mechanical ventilation. Continuous outcomes included hospital length of stay, and for those requiring supplemental oxygen, duration of oxygen supplementation, measured in hours.
Exposure
To categorize infiltrate patterns and the presence and size of pleural effusions, we reviewed the final report from admission chest radiographs to obtain the final clinical interpretation performed by the attending pediatric radiologist. Infiltrate patterns were classified as single lobar (reference), unilateral multilobar, bilateral multilobar, or interstitial. Children with both lobar and interstitial infiltrates, and those with mention of atelectasis, were classified according to the type of lobar infiltrate. Those with atelectasis only were excluded. Pleural effusions were classified as absent, small, or moderate/large.
Analysis
Descriptive statistics were summarized using frequencies and percentages for categorical variables and median and interquartile range (IQR) values for continuous variables. Our primary exposures were infiltrate pattern and presence and size of pleural effusion on admission chest radiograph. Associations between radiographic findings and disease outcomes were analyzed using logistic and linear regression for dichotomous and continuous variables, respectively. Continuous outcomes were log‐transformed and normality assumptions verified prior to model development.
Due to the large number of covariates relative to outcome events, we used propensity score methods to adjust for potential confounding. The propensity score estimates the likelihood of a given exposure (ie, infiltrate pattern) conditional on a set of covariates. In this way, the propensity score summarizes potential confounding effects from a large number of covariates into a single variable. Including the propensity score as a covariate in multivariable regression improves model efficiency and helps protect against overfitting.[15] Covariates included in the estimation of the propensity score included age, sex, race/ethnicity, payer, hospital, asthma history, hospital transfer, recent hospitalization (within 30 days), recent emergency department or clinic visit (within 2 weeks), recent antibiotics for acute illness (within 5 days), illness duration prior to admission, tachypnea and/or increased work of breathing (retractions, nasal flaring, or grunting) at presentation, receipt of albuterol and/or corticosteroids during the first 2 calendar days of hospitalization, and concurrent diagnosis of bronchiolitis. All analyses included the estimated propensity score, infiltrate pattern, and pleural effusion (absent, small, or moderate/large).
RESULTS
Study Population
The median age of the 406 children with clinical and radiographic CAP was 3 years (IQR, 16 years) (Table 1). Single lobar infiltrate was the most common radiographic pattern (61%). Children with interstitial infiltrates (10%) were younger than those with lobar infiltrates of any type (median age 1 vs 3 years, P=0.02). A concomitant diagnosis of bronchiolitis was assigned to 34% of children with interstitial infiltrates but only 17% of those with lobar infiltrate patterns (range, 11%20%, P=0.03). Pleural effusion was present in 21% of children and was more common among those with lobar infiltrates, particularly multilobar disease. Only 1 child with interstitial infiltrate had a pleural effusion. Overall, 63% of children required supplemental oxygen, 8% required ICU admission, and 3% required invasive mechanical ventilation. Median length of stay was 51.5 hours (IQR, 3991) and median oxygen duration was 31.5 hours [IQR, 1365]. There were no deaths.
| Characteristic | Infiltrate Patterna | P Valueb | |||
|---|---|---|---|---|---|
| Single Lobar | Multilobar, Unilateral | Multilobar, Bilateral | Interstitial | ||
| |||||
| No. | 247 (60.8) | 54 (13.3) | 64 (15.8) | 41 (10.1) | |
| Median age, y | 3 [16] | 3 [17] | 3 [15] | 1 [03] | 0.02 |
| Male sex | 124 (50.2) | 32 (59.3) | 41 (64.1) | 30 (73.2) | 0.02 |
| Race | |||||
| Non‐Hispanic white | 133 (53.8) | 36 (66.7) | 37 (57.8) | 17 (41.5) | 0.69 |
| Non‐Hispanic black | 40 (16.2) | 6 (11.1) | 9 (14.1) | 8 (19.5) | |
| Hispanic | 25 (10.1) | 4 (7.4) | 5 (7.8) | 7 (17.1) | |
| Other | 49 (19.9) | 8 (14.8) | 13 (20.4) | 9 (22) | |
| Insurance | |||||
| Public | 130 (52.6) | 26 (48.1) | 33 (51.6) | 25 (61) | 0.90 |
| Private | 116 (47) | 28 (51.9) | 31 (48.4) | 16 (39) | |
| Concurrent diagnosis | |||||
| Asthma | 80 (32.4) | 16 (29.6) | 17 (26.6) | 12 (29.3) | 0.82 |
| Bronchiolitis | 43 (17.4) | 6 (11.1) | 13 (20.3) | 14 (34.1) | 0.03 |
| Effusion | |||||
| None | 201 (81.4) | 31 (57.4) | 48 (75) | 40 (97.6) | <.01 |
| Small | 34 (13.8) | 20 (37) | 11 (17.2) | 0 | |
| Moderate/large | 12 (4.9) | 3 (5.6) | 5 (7.8) | 1 (2.4) | |
Outcomes According to Radiographic Infiltrate Pattern
Compared to children with single lobar infiltrates, the odds of ICU admission was significantly increased for those with either unilateral or bilateral multilobar infiltrates (unilateral, adjusted odds ratio [aOR]: 8.0, 95% confidence interval [CI]: 2.922.2; bilateral, aOR: 6.6, 95% CI: 2.14.5) (Figure 1, Table 2). Patients with bilateral multilobar infiltrates also had higher odds for supplemental oxygen use (aOR: 2.7, 95% CI: 1.25.8) and need for invasive mechanical ventilation (aOR: 3.0, 95% CI: 1.27.9). There were no differences in duration of oxygen supplementation or hospital length of stay for children with single versus multilobar infiltrates.

| Outcome | Infiltrate Patterna | P Valueb | |||
|---|---|---|---|---|---|
| Single Lobar, n=247 | Multilobar, Unilateral, n=54 | Multilobar, Bilateral, n=64 | Interstitial, n=41 | ||
| |||||
| Supplemental O2 requirement | 143 (57.9) | 34 (63) | 46 (71.9) | 31 (75.6) | 0.05 |
| ICU admission | 10 (4) | 9 (16.7) | 9 (14.1) | 4 (9.8) | <0.01 |
| Mechanical ventilation | 5 (2) | 4 (7.4) | 4 (6.3) | 1 (2.4) | 0.13 |
| Hospital length of stay, h | 47 [3779] | 63 [45114] | 56.5 [39.5101] | 62 [3993] | <0.01 |
| O2 duration, h | 27 [1059] | 38 [1777] | 38 [2381] | 34.5 [1765] | 0.18 |
Compared to those with single lobar infiltrates, children with interstitial infiltrates had higher odds of need for supplemental oxygen (aOR: 3.1, 95% CI: 1.37.6) and ICU admission (aOR: 4.4, 95% CI: 1.314.3) but not invasive mechanical ventilation. There were also no differences in duration of oxygen supplementation or hospital length of stay.
Outcomes According to Presence and Size of Pleural Effusion
Compared to those without pleural effusion, children with moderate to large effusion had a higher odds of ICU admission (aOR: 3.2, 95% CI: 1.18.9) and invasive mechanical ventilation (aOR: 14.8, 95% CI: 9.822.4), and also had a longer duration of oxygen supplementation (aOR: 3.0, 95% CI: 1.46.5) and hospital length of stay (aOR: 2.6, 95% CI: 1.9‐3.6) (Table 3, Figure 2). The presence of a small pleural effusion was not associated with increased need for supplemental oxygen, ICU admission, or mechanical ventilation compared to those without effusion. However, small effusion was associated with a longer duration of oxygen supplementation (aOR: 1.7, 95% CI: 12.7) and hospital length of stay (aOR: 1.6, 95% CI: 1.3‐1.9).
| Outcome | Pleural Effusion | P Valuea | ||
|---|---|---|---|---|
| None, n=320 | Small, n=65 | Moderate/Large, n=21 | ||
| ||||
| Supplemental O2 requirement | 200 (62.5) | 40 (61.5) | 14 (66.7) | 0.91 |
| ICU admission | 22 (6.9) | 6 (9.2) | 4 (19) | 0.12 |
| Mechanical ventilation | 5 (1.6) | 5 (7.7) | 4 (19) | <0.01 |
| Hospital length of stay, h | 48 [37.576] | 72 [45142] | 160 [82191] | <0.01 |
| Oxygen duration, h | 31 [1157] | 38.5 [1887] | 111 [27154] | <0.01 |
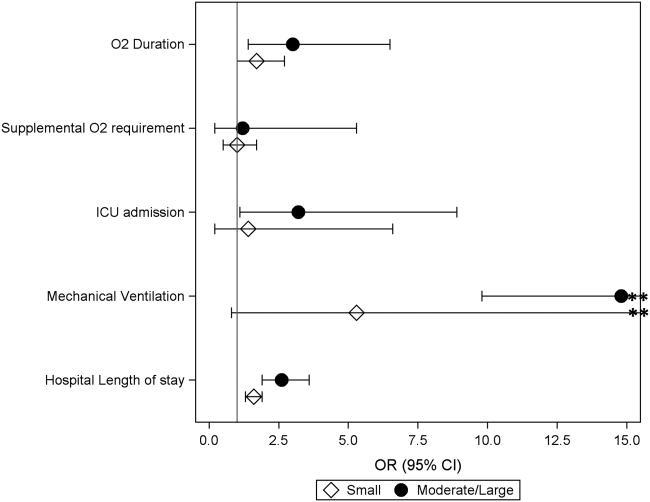
DISCUSSION
We evaluated the association between admission chest radiographic findings and subsequent clinical outcomes and hospital care processes for children hospitalized with CAP at 4 children's hospitals in the United States. We conclude that radiographic findings are associated with important inpatient outcomes. Similar to data from adults, findings of moderate to large pleural effusions and bilateral multilobar infiltrates had the strongest associations with severe disease. Such information, in combination with other prognostic factors, may help clinicians identify high‐risk patients and support management decisions, while also helping to inform families about the expected hospital course.
Previous pediatric studies examining the association between radiographic findings and outcomes have produced inconsistent results.[8, 9, 10, 11, 12] All but 1 of these studies documented 1 radiographic characteristics associated with pneumonia disease severity.[11] Further, although most contrasted lobar/alveolar and interstitial infiltrates, only Patria et al. distinguished among lobar infiltrate patterns (eg, single lobar vs multilobar).[12] Similar to our findings, that study demonstrated increased disease severity among children with bilateral multifocal lobar infiltrates. Of the studies that considered the presence of pleural effusion, only 1 demonstrated this finding to be associated with more severe disease.[9] However, none of these prior studies examined size of the pleural effusion.
In our study, the strongest association with severe pneumonia outcomes was among children with moderate to large pleural effusion. Significant pleural effusions are much more commonly due to infection with bacterial pathogens, particularly Streptococcus pneumoniae, Staphylococcus aureus, and Streptococcus pyogenes, and may also indicate infection with more virulent and/or difficult to treat strains.[16, 17, 18, 19] Surgical intervention is also often required. As such, children with significant pleural effusions are often more ill on presentation and may have a prolonged period of recovery.[20, 21, 22]
Similarly, multilobar infiltrates, particularly bilateral, were associated with increased disease severity in terms of need for supplemental oxygen, ICU admission, and need for invasive mechanical ventilation. Although this finding may be expected, it is interesting to note that the duration of supplemental oxygen and hospital length of stay were similar to those with single lobar disease. One potential explanation is that, although children with multilobar disease are more severe at presentation, rates of recovery are similar to those with less extensive radiographic findings, owing to rapidly effective antimicrobials for uncomplicated bacterial pneumonia. This hypothesis also agrees with the 2011 PIDS/IDSA guidelines, which state that children receiving adequate therapy typically show signs of improvement within 48 to 72 hours regardless of initial severity.[1]
Interstitial infiltrate was also associated with increased severity at presentation but similar length of stay and duration of oxygen requirement compared with single lobar disease. We note that these children were substantially younger than those presenting with any pattern of lobar disease (median age, 1 vs 3 years), were more likely to have a concurrent diagnosis of bronchiolitis (34% vs 17%), and only 1 child with interstitial infiltrates had a documented pleural effusion (vs 23% of children with lobar infiltrates). Primary viral pneumonia is considered more likely to produce interstitial infiltrates on chest radiograph compared to bacterial disease, and although detailed etiologic data are unavailable for this study, our findings above strongly support this assertion.[23, 24]
The 2011 PIDS/IDSA guidelines recommend admission chest radiographs for all children hospitalized with pneumonia to assess extent of disease and identify complications that may requiring additional evaluation or surgical intervention.[1] Our findings highlight additional potential benefits of admission radiographs in terms of disease prognosis and management decisions. In the initial evaluation of a sick child with pneumonia, clinicians are often presented with a number of potential prognostic factors that may influence disease outcomes. However, it is sometimes difficult for providers to consider all available information and/or the relative importance of a single factor, resulting in inaccurate risk perceptions and management decisions that may contribute to poor outcomes.[25] Similar to adults, the development of clinical prediction rules, which incorporate a variety of important predictors including admission radiographic findings, likely would improve risk assessments and potentially outcomes for children with pneumonia. Such prognostic information is also helpful for clinicians who may use these data to inform and prepare families regarding the expected course of hospitalization.
Our study has several limitations. This study was retrospective and only included a sample of pneumonia hospitalizations during the study period, which may raise confounding concerns and potential for selection bias. However, detailed medical record reviews using standardized case definitions for radiographic CAP were used, and a large sample of children was randomly selected from each institution. In addition, a large number of potential confounders were selected a priori and included in multivariable analyses; propensity score adjustment was used to reduce model complexity and avoid overfitting. Radiographic findings were based on clinical interpretation by pediatric radiologists independent of a study protocol. Prior studies have demonstrated good agreement for identification of alveolar/lobar infiltrates and pleural effusion by trained radiologists, although agreement for interstitial infiltrate is poor.[26, 27] This limitation could result in either over‐ or underestimation of the prevalence of interstitial infiltrates likely resulting in a nondifferential bias toward the null. Microbiologic information, which may inform radiographic findings and disease severity, was also not available. However, because pneumonia etiology is frequently unknown in the clinical setting, our study reflects typical practice. We also did not include children from community or nonteaching hospitals. Thus, although findings may have relevance to community or nonteaching hospitals, our results cannot be generalized.
CONCLUSION
Our study demonstrates that among children hospitalized with CAP, admission chest radiographic findings are associated with important clinical outcomes and hospital care processes, highlighting additional benefits of the 2011 PIDS/IDSA guidelines' recommendation for admission chest radiographs for all children hospitalized with pneumonia. These data, in conjunction with other important prognostic information, may help clinicians more rapidly identify children at increased risk for severe illness, and could also offer guidance regarding disease management strategies and facilitate shared decision making with families. Thus, routine admission chest radiography in this population represents a valuable tool that contributes to improved quality of care.
Disclosures
Dr. Williams is supported by funds from the National Institutes of HealthNational Institute of Allergy and Infectious Diseases (K23AI104779). The authors report no conflicts of interest.
- , , , et al. The management of community‐acquired pneumonia in infants and children older than 3 months of age: clinical practice guidelines by the Pediatric Infectious Diseases Society and the Infectious Diseases Society of America. Clin Infect Dis. 2011;53(7):e25–e76.
- , , , et al. A prediction rule to identify low‐risk patients with community‐acquired pneumonia. N Engl J Med. 1997;336(4):243–250.
- , , , et al. SMART‐COP: a tool for predicting the need for intensive respiratory or vasopressor support in community‐acquired pneumonia. Clin Infect Dis. 2008;47(3):375–384.
- , , , et al. Development and validation of a clinical prediction rule for severe community‐acquired pneumonia. Am J Respir Crit Care Med. 2006;174(11):1249–1256.
- , , , et al. Risk stratification of early admission to the intensive care unit of patients with no major criteria of severe community‐acquired pneumonia: development of an international prediction rule. Crit Care. 2009;13(2):R54.
- , , , et al. Do pulmonary radiographic findings at presentation predict mortality in patients with community‐acquired pneumonia? Arch Intern Med. 1996;156(19):2206–2212.
- , , , , , . Safety and efficacy of CURB65‐guided antibiotic therapy in community‐acquired pneumonia. J Antimicrob Chemother. 2011;66(2):416–423.
- , , . Severity of childhood community‐acquired pneumonia and chest radiographic findings. Pediatr Pulmonol. 2009;44(3):249–252.
- , , , et al. Can chest x‐ray predict pneumonia severity? Pediatr Pulmonol. 2004;38(6):465–469.
- , , , . Children with pneumonia: how do they present and how are they managed? Arch Dis Child. 2007;92(5):394–398.
- , , . Role of chest X‐ray in predicting outcome of acute severe pneumonia. Indian Pediatr. 2008;45(11):893–898.
- , , , , , . Association between radiological findings and severity of community‐acquired pneumonia in children. Ital J Pediatr. 2013;39:56.
- , , , et al. Identifying pediatric community‐acquired pneumonia hospitalizations: accuracy of administrative billing codes. JAMA Pediatrics. 2013;167(9):851–858.
- , , , , , . Deaths attributed to pediatric complex chronic conditions: national trends and implications for supportive care services. Pediatrics. 2001;107(6):E99.
- , . Invited commentary: propensity scores. Am J Epidemiol. 1999;150(4):327–333.
- , , , . Increasing incidence of empyema complicating childhood community‐acquired pneumonia in the United States. Clin Infect Dis. 2010;50(6):805–813.
- , , , et al. Epidemiology and clinical characteristics of community‐acquired pneumonia in hospitalized children. Pediatrics. 2004;113(4):701–707.
- , , , et al. Molecular analysis improves pathogen identification and epidemiologic study of pediatric parapneumonic empyema. Pediatr Infect Dis J. 2011;30(4):289–294.
- , . Parapneumonic pleural effusion and empyema in children. Review of a 19‐year experience, 1962–1980. Clin Pediatr (Phila). 1983;22(6):414–419.
- , , , et al. Risk factors of progressive community‐acquired pneumonia in hospitalized children: a prospective study [published online ahead of print August 28, 2013]. J Microbiol Immunol Infect. doi: 10.1016/j.jmii.2013.06.009.
- , , , , . Community‐acquired lobar pneumonia in children in the era of universal 7‐valent pneumococcal vaccination: a review of clinical presentations and antimicrobial treatment from a Canadian pediatric hospital. BMC Pediatr. 2012;12:133.
- , , , et al. Clinical characteristics and outcome of complicated pneumococcal pneumonia in a pediatric population. Pediatr Pulmonol. 2006;41(8):726–734.
- , , , , , . Differentiation of bacterial and viral pneumonia in children. Thorax. 2002;57(5):438–441.
- , , , et al. British Thoracic Society guidelines for the management of community acquired pneumonia in children: update 2011. Thorax. 2011;66(suppl 2):ii1–ii23.
- , , , et al. Community acquired pneumonia: aetiology and usefulness of severity criteria on admission. Thorax. 1996;51(10):1010–1016.
- , , , et al. Variability in the interpretation of chest radiographs for the diagnosis of pneumonia in children. J Hosp Med. 2012;7(4):294–298.
- , , , et al. Interobserver reliability of the chest radiograph in community‐acquired pneumonia. PORT Investigators. Chest. 1996;110(2):343–350.
The 2011 Pediatric Infectious Diseases Society and Infectious Diseases Society of America (PIDS/IDSA) guidelines for management of pediatric community‐acquired pneumonia (CAP) recommend that admission chest radiographs be obtained in all children hospitalized with CAP to document the presence and extent of infiltrates and to identify complications.[1] Findings from chest radiographs may also provide clues to etiology and assist with predicting disease outcomes. In adults with CAP, clinical prediction tools use radiographic findings to inform triage decisions, guide management strategies, and predict outcomes.[2, 3, 4, 5, 6, 7] Whether or not radiographic findings could have similar utility among children with CAP is unknown.
Several retrospective studies have examined the ability of chest radiographs to predict pediatric pneumonia disease severity.[8, 9, 10, 11, 12] However, these studies used several different measures of severe pneumonia and/or were limited to young children <5 years of age, leading to inconsistent findings. These studies also rarely considered very severe disease (eg, need for invasive mechanical ventilation) or longitudinal outcome measures such as hospital length of stay. Finally, all of these prior studies were conducted outside of the United States, and most were single‐center investigations, potentially limiting generalizability. We sought to examine associations between admission chest radiographic findings and subsequent hospital care processes and clinical outcomes, including length of stay and resource utilization measures, among children hospitalized with CAP at 4 children's hospitals in the United States.
METHODS
Design and Setting
This study was nested within a multicenter retrospective cohort designed to validate International Classification of Diseases, 9th Revision, Clinical Modification (ICD9‐CM) diagnostic codes for pediatric CAP hospitalizations.[13] The Pediatric Health Information System database (Children's Hospital Association, Overland Park, KS) was used to identify children from 4 freestanding pediatric hospitals (Monroe Carell, Jr. Children's Hospital at Vanderbilt, Nashville, Tennessee; Children's Mercy Hospitals & Clinics, Kansas City, Missouri; Seattle Children's Hospital, Seattle, Washington; and Cincinnati Children's Hospital Medical Center, Cincinnati, Ohio). The institutional review boards at each participating institution approved the study. The validation study included a 25% random sampling of children 60 days to 18 years of age (n=998) who were hospitalized between January 1, 2010 and December 31, 2010 with at least 1 ICD9‐CM discharge code indicating pneumonia. The diagnosis of CAP was confirmed by medical record review.
Study Population
This study was limited to children from the validation study who met criteria for clinical and radiographic CAP, defined as: (1) abnormal temperature or white blood cell count, (2) signs and symptoms of acute respiratory illness (eg, cough, tachypnea), and (3) chest radiograph indicating pneumonia within 48 hours of admission. Children with atelectasis as the only abnormal radiographic finding and those with complex chronic conditions (eg, cystic fibrosis, malignancy) were excluded using a previously described algorithm.[14]
Outcomes
Several measures of disease severity were assessed. Dichotomous outcomes included supplemental oxygen use, need for intensive care unit (ICU) admission, and need for invasive mechanical ventilation. Continuous outcomes included hospital length of stay, and for those requiring supplemental oxygen, duration of oxygen supplementation, measured in hours.
Exposure
To categorize infiltrate patterns and the presence and size of pleural effusions, we reviewed the final report from admission chest radiographs to obtain the final clinical interpretation performed by the attending pediatric radiologist. Infiltrate patterns were classified as single lobar (reference), unilateral multilobar, bilateral multilobar, or interstitial. Children with both lobar and interstitial infiltrates, and those with mention of atelectasis, were classified according to the type of lobar infiltrate. Those with atelectasis only were excluded. Pleural effusions were classified as absent, small, or moderate/large.
Analysis
Descriptive statistics were summarized using frequencies and percentages for categorical variables and median and interquartile range (IQR) values for continuous variables. Our primary exposures were infiltrate pattern and presence and size of pleural effusion on admission chest radiograph. Associations between radiographic findings and disease outcomes were analyzed using logistic and linear regression for dichotomous and continuous variables, respectively. Continuous outcomes were log‐transformed and normality assumptions verified prior to model development.
Due to the large number of covariates relative to outcome events, we used propensity score methods to adjust for potential confounding. The propensity score estimates the likelihood of a given exposure (ie, infiltrate pattern) conditional on a set of covariates. In this way, the propensity score summarizes potential confounding effects from a large number of covariates into a single variable. Including the propensity score as a covariate in multivariable regression improves model efficiency and helps protect against overfitting.[15] Covariates included in the estimation of the propensity score included age, sex, race/ethnicity, payer, hospital, asthma history, hospital transfer, recent hospitalization (within 30 days), recent emergency department or clinic visit (within 2 weeks), recent antibiotics for acute illness (within 5 days), illness duration prior to admission, tachypnea and/or increased work of breathing (retractions, nasal flaring, or grunting) at presentation, receipt of albuterol and/or corticosteroids during the first 2 calendar days of hospitalization, and concurrent diagnosis of bronchiolitis. All analyses included the estimated propensity score, infiltrate pattern, and pleural effusion (absent, small, or moderate/large).
RESULTS
Study Population
The median age of the 406 children with clinical and radiographic CAP was 3 years (IQR, 16 years) (Table 1). Single lobar infiltrate was the most common radiographic pattern (61%). Children with interstitial infiltrates (10%) were younger than those with lobar infiltrates of any type (median age 1 vs 3 years, P=0.02). A concomitant diagnosis of bronchiolitis was assigned to 34% of children with interstitial infiltrates but only 17% of those with lobar infiltrate patterns (range, 11%20%, P=0.03). Pleural effusion was present in 21% of children and was more common among those with lobar infiltrates, particularly multilobar disease. Only 1 child with interstitial infiltrate had a pleural effusion. Overall, 63% of children required supplemental oxygen, 8% required ICU admission, and 3% required invasive mechanical ventilation. Median length of stay was 51.5 hours (IQR, 3991) and median oxygen duration was 31.5 hours [IQR, 1365]. There were no deaths.
| Characteristic | Infiltrate Patterna | P Valueb | |||
|---|---|---|---|---|---|
| Single Lobar | Multilobar, Unilateral | Multilobar, Bilateral | Interstitial | ||
| |||||
| No. | 247 (60.8) | 54 (13.3) | 64 (15.8) | 41 (10.1) | |
| Median age, y | 3 [16] | 3 [17] | 3 [15] | 1 [03] | 0.02 |
| Male sex | 124 (50.2) | 32 (59.3) | 41 (64.1) | 30 (73.2) | 0.02 |
| Race | |||||
| Non‐Hispanic white | 133 (53.8) | 36 (66.7) | 37 (57.8) | 17 (41.5) | 0.69 |
| Non‐Hispanic black | 40 (16.2) | 6 (11.1) | 9 (14.1) | 8 (19.5) | |
| Hispanic | 25 (10.1) | 4 (7.4) | 5 (7.8) | 7 (17.1) | |
| Other | 49 (19.9) | 8 (14.8) | 13 (20.4) | 9 (22) | |
| Insurance | |||||
| Public | 130 (52.6) | 26 (48.1) | 33 (51.6) | 25 (61) | 0.90 |
| Private | 116 (47) | 28 (51.9) | 31 (48.4) | 16 (39) | |
| Concurrent diagnosis | |||||
| Asthma | 80 (32.4) | 16 (29.6) | 17 (26.6) | 12 (29.3) | 0.82 |
| Bronchiolitis | 43 (17.4) | 6 (11.1) | 13 (20.3) | 14 (34.1) | 0.03 |
| Effusion | |||||
| None | 201 (81.4) | 31 (57.4) | 48 (75) | 40 (97.6) | <.01 |
| Small | 34 (13.8) | 20 (37) | 11 (17.2) | 0 | |
| Moderate/large | 12 (4.9) | 3 (5.6) | 5 (7.8) | 1 (2.4) | |
Outcomes According to Radiographic Infiltrate Pattern
Compared to children with single lobar infiltrates, the odds of ICU admission was significantly increased for those with either unilateral or bilateral multilobar infiltrates (unilateral, adjusted odds ratio [aOR]: 8.0, 95% confidence interval [CI]: 2.922.2; bilateral, aOR: 6.6, 95% CI: 2.14.5) (Figure 1, Table 2). Patients with bilateral multilobar infiltrates also had higher odds for supplemental oxygen use (aOR: 2.7, 95% CI: 1.25.8) and need for invasive mechanical ventilation (aOR: 3.0, 95% CI: 1.27.9). There were no differences in duration of oxygen supplementation or hospital length of stay for children with single versus multilobar infiltrates.
| Outcome | Infiltrate Patterna | P Valueb | |||
|---|---|---|---|---|---|
| Single Lobar, n=247 | Multilobar, Unilateral, n=54 | Multilobar, Bilateral, n=64 | Interstitial, n=41 | ||
| |||||
| Supplemental O2 requirement | 143 (57.9) | 34 (63) | 46 (71.9) | 31 (75.6) | 0.05 |
| ICU admission | 10 (4) | 9 (16.7) | 9 (14.1) | 4 (9.8) | <0.01 |
| Mechanical ventilation | 5 (2) | 4 (7.4) | 4 (6.3) | 1 (2.4) | 0.13 |
| Hospital length of stay, h | 47 [3779] | 63 [45114] | 56.5 [39.5101] | 62 [3993] | <0.01 |
| O2 duration, h | 27 [1059] | 38 [1777] | 38 [2381] | 34.5 [1765] | 0.18 |
Compared to those with single lobar infiltrates, children with interstitial infiltrates had higher odds of need for supplemental oxygen (aOR: 3.1, 95% CI: 1.37.6) and ICU admission (aOR: 4.4, 95% CI: 1.314.3) but not invasive mechanical ventilation. There were also no differences in duration of oxygen supplementation or hospital length of stay.
Outcomes According to Presence and Size of Pleural Effusion
Compared to those without pleural effusion, children with moderate to large effusion had a higher odds of ICU admission (aOR: 3.2, 95% CI: 1.18.9) and invasive mechanical ventilation (aOR: 14.8, 95% CI: 9.822.4), and also had a longer duration of oxygen supplementation (aOR: 3.0, 95% CI: 1.46.5) and hospital length of stay (aOR: 2.6, 95% CI: 1.9‐3.6) (Table 3, Figure 2). The presence of a small pleural effusion was not associated with increased need for supplemental oxygen, ICU admission, or mechanical ventilation compared to those without effusion. However, small effusion was associated with a longer duration of oxygen supplementation (aOR: 1.7, 95% CI: 12.7) and hospital length of stay (aOR: 1.6, 95% CI: 1.3‐1.9).
| Outcome | Pleural Effusion | P Valuea | ||
|---|---|---|---|---|
| None, n=320 | Small, n=65 | Moderate/Large, n=21 | ||
| ||||
| Supplemental O2 requirement | 200 (62.5) | 40 (61.5) | 14 (66.7) | 0.91 |
| ICU admission | 22 (6.9) | 6 (9.2) | 4 (19) | 0.12 |
| Mechanical ventilation | 5 (1.6) | 5 (7.7) | 4 (19) | <0.01 |
| Hospital length of stay, h | 48 [37.576] | 72 [45142] | 160 [82191] | <0.01 |
| Oxygen duration, h | 31 [1157] | 38.5 [1887] | 111 [27154] | <0.01 |
DISCUSSION
We evaluated the association between admission chest radiographic findings and subsequent clinical outcomes and hospital care processes for children hospitalized with CAP at 4 children's hospitals in the United States. We conclude that radiographic findings are associated with important inpatient outcomes. Similar to data from adults, findings of moderate to large pleural effusions and bilateral multilobar infiltrates had the strongest associations with severe disease. Such information, in combination with other prognostic factors, may help clinicians identify high‐risk patients and support management decisions, while also helping to inform families about the expected hospital course.
Previous pediatric studies examining the association between radiographic findings and outcomes have produced inconsistent results.[8, 9, 10, 11, 12] All but 1 of these studies documented 1 radiographic characteristics associated with pneumonia disease severity.[11] Further, although most contrasted lobar/alveolar and interstitial infiltrates, only Patria et al. distinguished among lobar infiltrate patterns (eg, single lobar vs multilobar).[12] Similar to our findings, that study demonstrated increased disease severity among children with bilateral multifocal lobar infiltrates. Of the studies that considered the presence of pleural effusion, only 1 demonstrated this finding to be associated with more severe disease.[9] However, none of these prior studies examined size of the pleural effusion.
In our study, the strongest association with severe pneumonia outcomes was among children with moderate to large pleural effusion. Significant pleural effusions are much more commonly due to infection with bacterial pathogens, particularly Streptococcus pneumoniae, Staphylococcus aureus, and Streptococcus pyogenes, and may also indicate infection with more virulent and/or difficult to treat strains.[16, 17, 18, 19] Surgical intervention is also often required. As such, children with significant pleural effusions are often more ill on presentation and may have a prolonged period of recovery.[20, 21, 22]
Similarly, multilobar infiltrates, particularly bilateral, were associated with increased disease severity in terms of need for supplemental oxygen, ICU admission, and need for invasive mechanical ventilation. Although this finding may be expected, it is interesting to note that the duration of supplemental oxygen and hospital length of stay were similar to those with single lobar disease. One potential explanation is that, although children with multilobar disease are more severe at presentation, rates of recovery are similar to those with less extensive radiographic findings, owing to rapidly effective antimicrobials for uncomplicated bacterial pneumonia. This hypothesis also agrees with the 2011 PIDS/IDSA guidelines, which state that children receiving adequate therapy typically show signs of improvement within 48 to 72 hours regardless of initial severity.[1]
Interstitial infiltrate was also associated with increased severity at presentation but similar length of stay and duration of oxygen requirement compared with single lobar disease. We note that these children were substantially younger than those presenting with any pattern of lobar disease (median age, 1 vs 3 years), were more likely to have a concurrent diagnosis of bronchiolitis (34% vs 17%), and only 1 child with interstitial infiltrates had a documented pleural effusion (vs 23% of children with lobar infiltrates). Primary viral pneumonia is considered more likely to produce interstitial infiltrates on chest radiograph compared to bacterial disease, and although detailed etiologic data are unavailable for this study, our findings above strongly support this assertion.[23, 24]
The 2011 PIDS/IDSA guidelines recommend admission chest radiographs for all children hospitalized with pneumonia to assess extent of disease and identify complications that may requiring additional evaluation or surgical intervention.[1] Our findings highlight additional potential benefits of admission radiographs in terms of disease prognosis and management decisions. In the initial evaluation of a sick child with pneumonia, clinicians are often presented with a number of potential prognostic factors that may influence disease outcomes. However, it is sometimes difficult for providers to consider all available information and/or the relative importance of a single factor, resulting in inaccurate risk perceptions and management decisions that may contribute to poor outcomes.[25] Similar to adults, the development of clinical prediction rules, which incorporate a variety of important predictors including admission radiographic findings, likely would improve risk assessments and potentially outcomes for children with pneumonia. Such prognostic information is also helpful for clinicians who may use these data to inform and prepare families regarding the expected course of hospitalization.
Our study has several limitations. This study was retrospective and only included a sample of pneumonia hospitalizations during the study period, which may raise confounding concerns and potential for selection bias. However, detailed medical record reviews using standardized case definitions for radiographic CAP were used, and a large sample of children was randomly selected from each institution. In addition, a large number of potential confounders were selected a priori and included in multivariable analyses; propensity score adjustment was used to reduce model complexity and avoid overfitting. Radiographic findings were based on clinical interpretation by pediatric radiologists independent of a study protocol. Prior studies have demonstrated good agreement for identification of alveolar/lobar infiltrates and pleural effusion by trained radiologists, although agreement for interstitial infiltrate is poor.[26, 27] This limitation could result in either over‐ or underestimation of the prevalence of interstitial infiltrates likely resulting in a nondifferential bias toward the null. Microbiologic information, which may inform radiographic findings and disease severity, was also not available. However, because pneumonia etiology is frequently unknown in the clinical setting, our study reflects typical practice. We also did not include children from community or nonteaching hospitals. Thus, although findings may have relevance to community or nonteaching hospitals, our results cannot be generalized.
CONCLUSION
Our study demonstrates that among children hospitalized with CAP, admission chest radiographic findings are associated with important clinical outcomes and hospital care processes, highlighting additional benefits of the 2011 PIDS/IDSA guidelines' recommendation for admission chest radiographs for all children hospitalized with pneumonia. These data, in conjunction with other important prognostic information, may help clinicians more rapidly identify children at increased risk for severe illness, and could also offer guidance regarding disease management strategies and facilitate shared decision making with families. Thus, routine admission chest radiography in this population represents a valuable tool that contributes to improved quality of care.
Disclosures
Dr. Williams is supported by funds from the National Institutes of HealthNational Institute of Allergy and Infectious Diseases (K23AI104779). The authors report no conflicts of interest.
- , , , et al. The management of community‐acquired pneumonia in infants and children older than 3 months of age: clinical practice guidelines by the Pediatric Infectious Diseases Society and the Infectious Diseases Society of America. Clin Infect Dis. 2011;53(7):e25–e76.
- , , , et al. A prediction rule to identify low‐risk patients with community‐acquired pneumonia. N Engl J Med. 1997;336(4):243–250.
- , , , et al. SMART‐COP: a tool for predicting the need for intensive respiratory or vasopressor support in community‐acquired pneumonia. Clin Infect Dis. 2008;47(3):375–384.
- , , , et al. Development and validation of a clinical prediction rule for severe community‐acquired pneumonia. Am J Respir Crit Care Med. 2006;174(11):1249–1256.
- , , , et al. Risk stratification of early admission to the intensive care unit of patients with no major criteria of severe community‐acquired pneumonia: development of an international prediction rule. Crit Care. 2009;13(2):R54.
- , , , et al. Do pulmonary radiographic findings at presentation predict mortality in patients with community‐acquired pneumonia? Arch Intern Med. 1996;156(19):2206–2212.
- , , , , , . Safety and efficacy of CURB65‐guided antibiotic therapy in community‐acquired pneumonia. J Antimicrob Chemother. 2011;66(2):416–423.
- , , . Severity of childhood community‐acquired pneumonia and chest radiographic findings. Pediatr Pulmonol. 2009;44(3):249–252.
- , , , et al. Can chest x‐ray predict pneumonia severity? Pediatr Pulmonol. 2004;38(6):465–469.
- , , , . Children with pneumonia: how do they present and how are they managed? Arch Dis Child. 2007;92(5):394–398.
- , , . Role of chest X‐ray in predicting outcome of acute severe pneumonia. Indian Pediatr. 2008;45(11):893–898.
- , , , , , . Association between radiological findings and severity of community‐acquired pneumonia in children. Ital J Pediatr. 2013;39:56.
- , , , et al. Identifying pediatric community‐acquired pneumonia hospitalizations: accuracy of administrative billing codes. JAMA Pediatrics. 2013;167(9):851–858.
- , , , , , . Deaths attributed to pediatric complex chronic conditions: national trends and implications for supportive care services. Pediatrics. 2001;107(6):E99.
- , . Invited commentary: propensity scores. Am J Epidemiol. 1999;150(4):327–333.
- , , , . Increasing incidence of empyema complicating childhood community‐acquired pneumonia in the United States. Clin Infect Dis. 2010;50(6):805–813.
- , , , et al. Epidemiology and clinical characteristics of community‐acquired pneumonia in hospitalized children. Pediatrics. 2004;113(4):701–707.
- , , , et al. Molecular analysis improves pathogen identification and epidemiologic study of pediatric parapneumonic empyema. Pediatr Infect Dis J. 2011;30(4):289–294.
- , . Parapneumonic pleural effusion and empyema in children. Review of a 19‐year experience, 1962–1980. Clin Pediatr (Phila). 1983;22(6):414–419.
- , , , et al. Risk factors of progressive community‐acquired pneumonia in hospitalized children: a prospective study [published online ahead of print August 28, 2013]. J Microbiol Immunol Infect. doi: 10.1016/j.jmii.2013.06.009.
- , , , , . Community‐acquired lobar pneumonia in children in the era of universal 7‐valent pneumococcal vaccination: a review of clinical presentations and antimicrobial treatment from a Canadian pediatric hospital. BMC Pediatr. 2012;12:133.
- , , , et al. Clinical characteristics and outcome of complicated pneumococcal pneumonia in a pediatric population. Pediatr Pulmonol. 2006;41(8):726–734.
- , , , , , . Differentiation of bacterial and viral pneumonia in children. Thorax. 2002;57(5):438–441.
- , , , et al. British Thoracic Society guidelines for the management of community acquired pneumonia in children: update 2011. Thorax. 2011;66(suppl 2):ii1–ii23.
- , , , et al. Community acquired pneumonia: aetiology and usefulness of severity criteria on admission. Thorax. 1996;51(10):1010–1016.
- , , , et al. Variability in the interpretation of chest radiographs for the diagnosis of pneumonia in children. J Hosp Med. 2012;7(4):294–298.
- , , , et al. Interobserver reliability of the chest radiograph in community‐acquired pneumonia. PORT Investigators. Chest. 1996;110(2):343–350.
© 2014 Society of Hospital Medicine
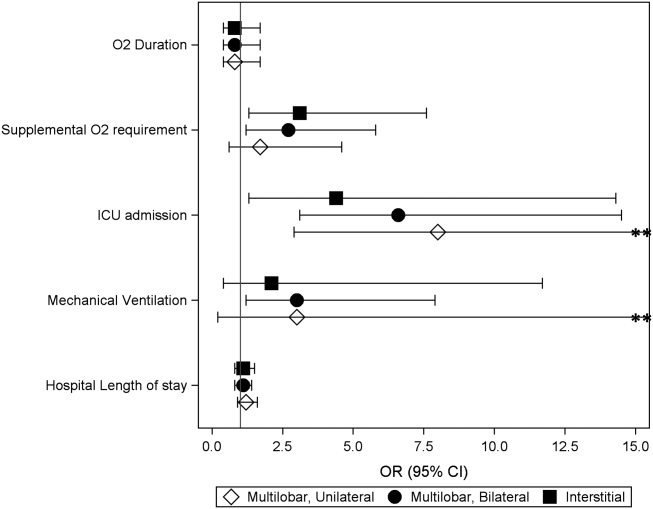
Discordant Antibiotics in Pediatric UTI
Urinary tract infections (UTIs) are one of the most common reasons for pediatric hospitalizations.1 Bacterial infections require prompt treatment with appropriate antimicrobial agents. Results from culture and susceptibility testing, however, are often unavailable until 48 hours after initial presentation. Therefore, the clinician must select antimicrobials empirically, basing decisions on likely pathogens and local resistance patterns.2 This decision is challenging because the effect of treatment delay on clinical outcomes is difficult to determine and resistance among uropathogens is increasing. Resistance rates have doubled over the past several years.3, 4 For common first‐line antibiotics, such as ampicillin and trimethoprim‐sulfamethoxazole, resistance rates for Escherichia coli, the most common uropathogen, exceed 25%.4, 5 While resistance to third‐generation cephalosporins remains low, rates in the United States have increased from <1% in 1999 to 4% in 2010. International data shows much higher resistance rates for cephalosporins in general.6, 7 This high prevalence of resistance may prompt the use of broad‐spectrum antibiotics for patients with UTI. For example, the use of third‐generation cephalosporins for UTI has doubled in recent years.3 Untreated, UTIs can lead to serious illness, but the consequences of inadequate initial antibiotic coverage are unknown.8, 9
Discordant antibiotic therapy, initial antibiotic therapy to which the causative bacterium is not susceptible, occurs in up to 9% of children hospitalized for UTI.10 However, there is reason to believe that discordant therapy may matter less for UTIs than for infections at other sites. First, in adults hospitalized with UTIs, discordant initial therapy did not affect the time to resolution of symptoms.11, 12 Second, most antibiotics used to treat UTIs are renally excreted and, thus, antibiotic concentrations at the site of infection are higher than can be achieved in the serum or cerebrospinal fluid.13 The Clinical and Laboratory Standard Institute has acknowledged that traditional susceptibility breakpoints may be too conservative for some non‐central nervous system infections; such as non‐central nervous system infections caused by Streptococcus pneumoniae.14
As resistance rates increase, more patients are likely to be treated with discordant therapy. Therefore, we sought to identify the clinical consequences of discordant antimicrobial therapy for patients hospitalized with a UTI.
METHODS
Design and Setting
We conducted a multicenter, retrospective cohort study. Data for this study were originally collected for a study that determined the accuracy of individual and combined International Classification of Diseases, Ninth Revision (ICD‐9) discharge diagnosis codes for children with laboratory tests for a UTI, in order to develop national quality measures for children hospitalized with UTIs.15 The institutional review board for each hospital (Seattle Children's Hospital, Seattle, WA; Monroe Carell Jr Children's Hospital at Vanderbilt, Nashville, TN; Cincinnati Children's Hospital Medical Center, Cincinnati, OH; Children's Mercy Hospital, Kansas City, MO; Children's Hospital of Philadelphia, Philadelphia, PA) approved the study.
Data Sources
Data were obtained from the Pediatric Health Information System (PHIS) and medical records for patients at the 5 participating hospitals. PHIS contains clinical and billing data from hospitalized children at 43 freestanding children's hospitals. Data quality and coding reliability are assured through a joint effort between the Children's Hospital Association (Shawnee Mission, KS) and participating hospitals.16 PHIS was used to identify participants based on presence of discharge diagnosis code and laboratory tests indicating possible UTI, patient demographics, antibiotic administration date, and utilization of hospital resources (length of stay [LOS], laboratory testing).
Medical records for each participant were reviewed to obtain laboratory and clinical information such as past medical history (including vesicoureteral reflux [VUR], abnormal genitourinary [GU] anatomy, use of prophylactic antibiotic), culture data, and fever data. Data were entered into a secured centrally housed web‐based data collection system. To assure consistency of chart review, all investigators responsible for data collection underwent training. In addition, 2 pilot medical record reviews were performed, followed by group discussion, to reach consensus on questions, preselected answers, interpretation of medical record data, and parameters for free text data entry.
Subjects
The initial cohort included 460 hospitalized patients, aged 3 days to 18 years of age, discharged from participating hospitals between July 1, 2008 and June 30, 2009 with a positive urine culture at any time during hospitalization.15 We excluded patients under 3 days of age because patients this young are more likely to have been transferred from the birthing hospital for a complication related to birth or a congenital anomaly. For this secondary analysis of patients from a prior study, our target population included patients admitted for management of UTI.15 We excluded patients with a negative initial urine culture (n = 59) or if their initial urine culture did not meet definition of laboratory‐confirmed UTI, defined as urine culture with >50,000 colony‐forming units (CFU) with an abnormal urinalysis (UA) (n = 77).1, 1719 An abnormal UA was defined by presence of white blood cells, leukocyte esterase, bacteria, and/or nitrites. For our cohort, all cultures with >50,000 CFU also had an abnormal urinalysis. We excluded 19 patients with cultures classified as 10,000100,000 CFU because we could not confirm that the CFU was >50,000. We excluded 30 patients with urine cultures classified as normal or mixed flora, positive for a mixture of organisms not further identified, or if results were unavailable. Additionally, coagulase‐negative Staphylococcus species (n = 8) were excluded, as these are typically considered contaminants in the setting of urine cultures.2 Patients likely to have received antibiotics prior to admission, or develop a UTI after admission, were identified and removed from the cohort if they had a urine culture performed more than 1 day before, or 2 days after, admission (n = 35). Cultures without resistance testing to the initial antibiotic selection were also excluded (n = 16).
Main Outcome Measures
The primary outcome measure was hospital LOS. Time to fever resolution was a secondary outcome measure. Fever was defined as temperature 38C. Fever duration was defined as number of hours until resolution of fever; only patients with fever at admission were included in this subanalysis.
Main Exposure
The main exposure was initial antibiotic therapy. Patients were classified into 3 groups according to initial antibiotic selection: those receiving 1) concordant; 2) discordant; or 3) delayed initial therapy. Concordance was defined as in vitro susceptibility to the initial antibiotic or class of antibiotic. If the uropathogen was sensitive to a narrow‐spectrum antibiotic (eg, first‐generation cephalosporin), but was not tested against a more broad‐spectrum antibiotic of the same class (eg, third‐generation cephalosporin), concordance was based on the sensitivity to the narrow‐spectrum antibiotic. If the uropathogen was sensitive to a broad‐spectrum antibiotic (eg, third‐generation cephalosporin), concordance to a more narrow‐spectrum antibiotic was not assumed. Discordance was defined as laboratory confirmation of in vitro resistance, or intermediate sensitivity of the pathogen to the initial antibiotic or class of antibiotics. Patients were considered to have a delay in antibiotic therapy if they did not receive antibiotics on the day of, or day after, collection of UA and culture. Patients with more than 1 uropathogen identified in a single culture were classified as discordant if any of the organisms was discordant to the initial antibiotic; they were classified as concordant if all organisms were concordant to the initial antibiotic. Antibiotic susceptibility was not tested in some cases (n = 16).
Initial antibiotic was defined as the antibiotic(s) billed on the same day or day after the UA was billed. If the patient had the UA completed on the day prior to admission, we used the antibiotic administered on the day of admission as the initial antibiotic.
Covariates
Covariates were selected a priori to include patient characteristics likely to affect patient outcomes; all were included in the final analysis. These were age, race, sex, insurance, disposition, prophylactic antibiotic use for any reason (VUR, oncologic process, etc), presence of a chronic care condition, and presence of VUR or GU anatomic abnormality. Age, race, sex, and insurance were obtained from PHIS. Medical record review was used to determine prophylactic antibiotic use, and presence of VUR or GU abnormalities (eg, posterior urethral valves). Chronic care conditions were defined using a previously reported method.20
Data Analysis
Continuous variables were described using median and interquartile range (IQR). Categorical variables were described using frequencies. Multivariable analyses were used to determine the independent association of discordant antibiotic therapy and the outcomes of interest. Poisson regression was used to fit the skewed LOS distribution. The effect of antibiotic concordance or discordance on LOS was determined for all patients in our sample, as well as for those with a urine culture positive for a single identified organism. We used the KruskalWallis test statistic to determine the association between duration of fever and discordant antibiotic therapy, given that duration of fever is a continuous variable. Generalized estimating equations accounted for clustering by hospital and the variability that exists between hospitals.
RESULTS
Of the initial 460 cases with positive urine culture growth at any time during admission, 216 met inclusion criteria for a laboratory‐confirmed UTI from urine culture completed at admission. The median age was 2.46 years (IQR: 0.27,8.89). In the study population, 25.0% were male, 31.0% were receiving prophylactic antibiotics, 13.0% had any grade of VUR, and 16.7% had abnormal GU anatomy (Table 1). A total of 82.4% of patients were treated with concordant initial therapy, 10.2% with discordant initial therapy, and 7.4% received delayed initial antibiotic therapy. There were no significant differences between the groups for any of the covariates. Discordant antibiotic cases ranged from 4.9% to 21.7% across hospitals.
| Overall | Concordant* | Discordant | Delayed Antibiotics | P Value | |
|---|---|---|---|---|---|
| |||||
| N | 216 | 178 (82.4) | 22 (10.2) | 16 (7.4) | |
| Gender | |||||
| Male | 54 (25.0) | 40 (22.5) | 8 (36.4) | 6 (37.5) | 0.18 |
| Female | 162 (75.0) | 138 (77.5) | 14 (63.64) | 10 (62.5) | |
| Race | |||||
| Non‐Hispanic white | 136 (63.9) | 110 (62.5) | 15 (71.4) | 11 (68.8) | 0.83 |
| Non‐Hispanic black | 28 (13.2) | 24 (13.6) | 2 (9.5) | 2 (12.5) | |
| Hispanic | 20 (9.4) | 16 (9.1) | 3 (14.3) | 1 (6.3) | |
| Asian | 10 (4.7) | 9 (5.1) | 1 (4.7) | ||
| Other | 19 (8.9) | 17 (9.7) | 2 (12.5) | ||
| Payor | |||||
| Government | 97 (44.9) | 80 (44.9) | 11 (50.0) | 6 (37.5) | 0.58 |
| Private | 70 (32.4) | 56 (31.5) | 6 (27.3) | 8 (50.0) | |
| Other | 49 (22.7) | 42 (23.6) | 5 (22.7) | 2 (12.5) | |
| Disposition | |||||
| Home | 204 (94.4) | 168 (94.4) | 21 (95.5) | 15 (93.8) | 0.99 |
| Died | 1 (0.5) | 1 (0.6) | |||
| Other | 11 (5.1) | 9 (5.1) | 1 (4.6) | 1 (6.3) | |
| Age | |||||
| 3 d60 d | 40 (18.5) | 35 (19.7) | 3 (13.6) | 2 (12.5) | 0.53 |
| 61 d2 y | 62 (28.7) | 54 (30.3) | 4 (18.2) | 4 (25.0) | |
| 3 y12 y | 75 (34.7) | 61 (34.3) | 8 (36.4) | 6 (37.5) | |
| 13 y18 y | 39 (18.1) | 28 (15.7) | 7 (31.8) | 4 (25.0) | |
| Length of stay | |||||
| 1 d5 d | 171 (79.2) | 147 (82.6) | 12 (54.6) | 12 (75.0) | 0.03 |
| 6 d10 d | 24 (11.1) | 17 (9.6) | 5 (22.7) | 2 (12.5) | |
| 11 d15 d | 10 (4.6) | 5 (2.8) | 3 (13.6) | 2 (12.5) | |
| 16 d+ | 11 (5.1) | 9 (5.1) | 2 (9.1) | 0 | |
| Complex chronic conditions | |||||
| Any CCC | 94 (43.5) | 77 (43.3) | 12 (54.6) | 5 (31.3) | 0.35 |
| Cardiovascular | 20 (9.3) | 19 (10.7) | 1 (6.3) | 0.24 | |
| Neuromuscular | 34 (15.7) | 26 (14.6) | 7 (31.8) | 1 (6.3) | 0.06 |
| Respiratory | 6 (2.8) | 6 (3.4) | 0.52 | ||
| Renal | 26 (12.0) | 21 (11.8) | 4 (18.2) | 1 (6.3) | 0.52 |
| Gastrointestinal | 3 (1.4) | 3 (1.7) | 0.72 | ||
| Hematologic/ immunologic | 1 (0.5) | 1 (4.6) | 0.01 | ||
| Metabolic | 8 (3.7) | 6 (3.4) | 1 (4.6) | 1 (6.3) | 0.82 |
| Congenital or genetic | 15 (6.9) | 11 (6.2) | 3 (13.6) | 1 (6.3) | 0.43 |
| Malignancy | 5 (2.3) | 3 (1.7) | 2 (9.1) | 0.08 | |
| VUR | 28 (13.0) | 23 (12.9) | 3 (13.6) | 2 (12.5) | 0.99 |
| Abnormal GU | 36 (16.7) | 31 (17.4) | 4 (18.2) | 1 (6.3) | 0.51 |
| Prophylactic antibiotics | 67 (31.0) | 53 (29.8) | 10 (45.5) | 4 (25.0) | 0.28 |
The most common causative organisms were E. coli (65.7%) and Klebsiella spp (9.7%) (Table 2). The most common initial antibiotics were a third‐generation cephalosporin (39.1%), combination of ampicillin and a third‐ or fourth‐generation cephalosporin (16.7%), and combination of ampicillin with gentamicin (11.1%). A third‐generation cephalosporin was the initial antibiotic for 46.1% of the E. coli and 56.9% of Klebsiella spp UTIs. Resistance to third‐generation cephalosporins but carbapenem susceptibility was noted for 4.5% of E. coli and 7.7% of Klebsiella spp isolates. Patients with UTIs caused by Klebsiella spp, mixed organisms, and Enterobacter spp were more likely to receive discordant antibiotic therapy. Patients with Enterobacter spp and mixed‐organism UTIs were more likely to have delayed antibiotic therapy. Nineteen patients (8.8%) had positive blood cultures. Fifteen (6.9%) required intensive care unit (ICU) admission during hospitalization.
| Organism | Cases | Concordant* No. (%) | Discordant No. (%) | Delayed Antibiotics No. (%) |
|---|---|---|---|---|
| ||||
| E. coli | 142 | 129 (90.8) | 3 (2.1) | 10 (7.0) |
| Klebsiella spp | 21 | 14 (66.7) | 7 (33.3) | 0 (0) |
| Enterococcus spp | 12 | 9 (75.0) | 3 (25.0) | 0 (0) |
| Enterobacter spp | 10 | 5 (50.0) | 3 (30.0) | 2 (20.0) |
| Pseudomonas spp | 10 | 9 (90.0) | 1 (10.0) | 0 (0) |
| Other single organisms | 6 | 5 (83.3) | 0 (0) | 1 (16.7) |
| Other identified multiple organisms | 15 | 7 (46.7) | 5 (33.3) | 3 (20.0) |
Unadjusted results are shown in Supporting Appendix 1, in the online version of this article. In the adjusted analysis, discordant antibiotic therapy was associated with a significantly longer LOS, compared with concordant therapy for all UTIs and for all UTIs caused by a single organism (Table 3). In adjusted analysis, discordant therapy was also associated with a 3.1 day (IQR: 2.0, 4.7) longer length of stay compared with concordant therapy for all E. coli UTIs.
| Bacteria | Difference in LOS (95% CI)* | P Value |
|---|---|---|
| ||
| All organisms | ||
| Concordant vs discordant | 1.8 (2.1, 1.5) | <0.0001 |
| Concordant vs delayed antibiotics | 1.4 (1.7, 1.1) | 0.01 |
| Single organisms | ||
| Concordant vs discordant | 1.9 (2.4, 1.5) | <0.0001 |
| Concordant vs delayed antibiotics | 1.2 (1.6, 1.2) | 0.37 |
Time to fever resolution was analyzed for patients with a documented fever at presentation for each treatment subgroup. One hundred thirty‐six patients were febrile at admission and 122 were febrile beyond the first recorded vital signs. Fever was present at admission in 60% of the concordant group and 55% of the discordant group (P = 0.6). The median duration of fever was 48 hours for the concordant group (n = 107; IQR: 24, 240) and 78 hours for the discordant group (n = 12; IQR: 48, 132). All patients were afebrile at discharge. Differences in fever duration between treatment groups were not statistically significant (P = 0.7).
DISCUSSION
Across 5 children's hospitals, 1 out of every 10 children hospitalized for UTI received discordant initial antibiotic therapy. Children receiving discordant antibiotic therapy had a 1.8 day longer LOS when compared with those on concordant therapy. However, there was no significant difference in time to fever resolution between the groups, suggesting that the increase in LOS was not explained by increased fever duration.
The overall rate of discordant therapy in this study is consistent with prior studies, as was the more common association of discordant therapy with non‐E. coli UTIs.10 According to the Kids' Inpatient Database 2009, there are 48,100 annual admissions for patients less than 20 years of age with a discharge diagnosis code of UTI in the United States.1 This suggests that nearly 4800 children with UTI could be affected by discordant therapy annually.
Children treated with discordant antibiotic therapy had a significantly longer LOS compared to those treated with concordant therapy. However, differences in time to fever resolution between the groups were not statistically significant. While resolution of fever may suggest clinical improvement and adequate empiric therapy, the lack of association with antibiotic concordance was not unexpected, since the relationship between fever resolution, clinical improvement, and LOS is complex and thus challenging to measure.21 These results support the notion that fever resolution alone may not be an adequate measure of clinical response.
It is possible that variability in discharge decision‐making may contribute to increased length of stay. Some clinicians may delay a patient's discharge until complete resolution of symptoms or knowledge of susceptibilities, while others may discharge patients that are still febrile and/or still receiving empiric antibiotics. Evidence‐based guidelines that address the appropriate time to discharge a patient with UTI are lacking. The American Academy of Pediatrics provides recommendations for use of parenteral antibiotics and hospital admission for patients with UTI, but does not address discharge decision‐making or patient management in the setting of discordant antibiotic therapy.2, 21
This study must be interpreted in the context of several limitations. First, our primary and secondary outcomes, LOS and fever duration, were surrogate measures for clinical response. We were not able to measure all clinical factors that may contribute to LOS, such as the patient's ability to tolerate oral fluids and antibiotics. Also, there may have been too few patients to detect a clinically important difference in fever duration between the concordant and discordant groups, especially for individual organisms. Although we did find a significant difference in LOS between patients treated with concordant compared with discordant therapy, there may be residual confounding from unobserved differences. This confounding, in conjunction with the small sample size, may cause us to underestimate the magnitude of the difference in LOS resulting from discordant therapy. Second, short‐term outcomes such as ICU admission were not investigated in this study; however, the proportion of patients admitted to the ICU in our population was quite small, precluding its use as a meaningful outcome measure. Third, the potential benefits to patients who were not exposed to unnecessary antibiotics, or harm to those that were exposed, could not be measured. Finally, our study was obtained using data from 5 free‐standing tertiary care pediatric facilities, thereby limiting its generalizability to other settings. Still, our rates of prophylactic antibiotic use, VUR, and GU abnormalities are similar to others reported in tertiary care children's hospitals, and we accounted for these covariates in our model.2225
As the frequency of infections caused by resistant bacteria increase, so will the number of patients receiving discordant antibiotics for UTI, compounding the challenge of empiric antimicrobial selection. Further research is needed to better understand how discordant initial antibiotic therapy contributes to LOS and whether it is associated with adverse short‐ and long‐term clinical outcomes. Such research could also aid in weighing the risk of broader‐spectrum prescribing on antimicrobial resistance patterns. While we identified an association between discordant initial antibiotic therapy and LOS, we were unable to determine the ideal empiric antibiotic therapy for patients hospitalized with UTI. Further investigation is needed to inform local and national practice guidelines for empiric antibiotic selection in patients with UTIs. This may also be an opportunity to decrease discordant empiric antibiotic selection, perhaps through use of antibiograms that stratify patients based on known factors, to lead to more specific initial therapy.
CONCLUSIONS
This study demonstrates that discordant antibiotic selection for UTI at admission is associated with longer hospital stay, but not fever duration. The full clinical consequences of discordant therapy, and the effects on length of stay, need to be better understood. Our findings, taken in combination with careful consideration of patient characteristics and prior history, may provide an opportunity to improve the hospital care for patients with UTIs.
Acknowledgements
Disclosure: Nothing to report.
- HCUP Kids' Inpatient Database (KID). Healthcare Cost and Utilization Project (HCUP). Rockville, MD: Agency for Healthcare Research and Quality; 2006 and 2009. Available at: http://www.hcup‐us.ahrq.gov/kidoverview.jsp.
- Subcommitee on Urinary Tract Infection, Steering Committee on Quality Improvement and Management. Urinary tract infection: clinical practice guideline for the diagnosis and management of the initial UTI in febrile infants and children 2 to 24 months. Pediatrics. 2011;128(3)595–610. doi: 10.1542/peds.2011–1330. Available at: http://pediatrics.aappublications.org/content/128/3/595.full.html.
- , , . National ambulatory antibiotic prescribing patterns for pediatric urinary tract infection, 1998–2007. Pediatrics. 2011;127(6):1027–1033.
- , , , , . Previous antimicrobial exposure is associated with drug‐resistant urinary tract infections in children. Pediatrics. 2010;125(4):664–672.
- CDC. National Antimicrobial Resistance Monitoring System for Enteric Bacteria (NARMS): Human Isolates Final Report. Atlanta, GA: US Department of Health and Human Services, CDC; 2009.
- , , , , . Increasing antibiotic resistance among uropathogens isolated during years 2006–2009: impact on the empirical management. Int Braz J Urol. 2012;38(1):25–32.
- . 3rd Generation Cephalosporin‐Resistant Escherichia coli. 2010. Available at: http://www.cddep.org/ResistanceMap/bug‐drug/EC‐CS. Accessed May 14, 2012.
- , , , . Risk of renal scarring in children with a first urinary tract infection: a systematic review. Pediatrics. 2010;126(6):1084–1091.
- , . Treatment of urinary tract infections. Pediatr Infect Dis J. 1999;18(11):1020–1021.
- , , , , . Non‐Escherichia coli versus Escherichia coli community‐acquired urinary tract infections in children hospitalized in a tertiary center: relative frequency, risk factors, antimicrobial resistance and outcome. Pediatr Infect Dis J. 2005;24(7):581–585.
- , , , , , . Prognosis of urinary tract infections with discordant antibiotic treatment [in Spanish]. Rev Clin Esp. 2010;210(11):545–549.
- , , , et al. Appropriateness of empiric antibiotic therapy in urinary tract infection in emergency room [in Spanish]. Rev Clin Esp. 2010;210(1):11–16.
- , , . Principles and Practice of Pediatric Infectious Diseases. 3rd ed. New York, NY: Churchill Livingstone/Elsevier; 2009.
- National Committee for Clinical Laboratory Standards. Performance Standards for Antimicrobial Susceptibility Testing; Twelfth Informational Supplement.Vol M100‐S12. Wayne, PA: NCCLS; 2002.
- , , , et al. Accuracy of administrative billing codes to detect urinary tract infection hospitalizations. Pediatrics. 2011;128(2):323–330.
- , , , . Corticosteroids and mortality in children with bacterial meningitis. JAMA. 2008;299(17):2048–2055.
- , , , , . Enhanced urinalysis as a screening test for urinary tract infection. Pediatrics. 1993;91(6):1196–1199.
- , , , , . Pyuria and bacteriuria in urine specimens obtained by catheter from young children with fever. J Pediatr. 1994;124(4):513–519.
- , , , et al. Clinical and demographic factors associated with urinary tract infection in young febrile infants. Pediatrics. 2005;116(3):644–648.
- , , , , , . Deaths attributed to pediatric complex chronic conditions: national trends and implications for supportive care services. Pediatrics. 2001;107(6):E99.
- Committee on Quality Improvement. Subcommittee on Urinary Tract Infection. Practice parameter: the diagnosis, treatment, and evaluation of the initial urinary tract infection in febrile infants and young children. Pediatrics. 1999;103:843–852.
- , . Antibiotics or surgery for vesicoureteric reflux in children. Lancet. 2004;364(9446):1720–1722.
- , , , et al. Randomized intervention for children with vesicoureteral reflux (RIVUR): background commentary of RIVUR investigators. Pediatrics. 2008;122(suppl 5):S233–S239.
- , , . Length of intravenous antibiotic therapy and treatment failure in infants with urinary tract infections. Pediatrics. 2010;126(2):196–203.
- , , , , , . Vesicoureteral reflux in children with suspected and proven urinary tract infection. Pediatr Nephrol. 2010;25(8):1463–1469.
Urinary tract infections (UTIs) are one of the most common reasons for pediatric hospitalizations.1 Bacterial infections require prompt treatment with appropriate antimicrobial agents. Results from culture and susceptibility testing, however, are often unavailable until 48 hours after initial presentation. Therefore, the clinician must select antimicrobials empirically, basing decisions on likely pathogens and local resistance patterns.2 This decision is challenging because the effect of treatment delay on clinical outcomes is difficult to determine and resistance among uropathogens is increasing. Resistance rates have doubled over the past several years.3, 4 For common first‐line antibiotics, such as ampicillin and trimethoprim‐sulfamethoxazole, resistance rates for Escherichia coli, the most common uropathogen, exceed 25%.4, 5 While resistance to third‐generation cephalosporins remains low, rates in the United States have increased from <1% in 1999 to 4% in 2010. International data shows much higher resistance rates for cephalosporins in general.6, 7 This high prevalence of resistance may prompt the use of broad‐spectrum antibiotics for patients with UTI. For example, the use of third‐generation cephalosporins for UTI has doubled in recent years.3 Untreated, UTIs can lead to serious illness, but the consequences of inadequate initial antibiotic coverage are unknown.8, 9
Discordant antibiotic therapy, initial antibiotic therapy to which the causative bacterium is not susceptible, occurs in up to 9% of children hospitalized for UTI.10 However, there is reason to believe that discordant therapy may matter less for UTIs than for infections at other sites. First, in adults hospitalized with UTIs, discordant initial therapy did not affect the time to resolution of symptoms.11, 12 Second, most antibiotics used to treat UTIs are renally excreted and, thus, antibiotic concentrations at the site of infection are higher than can be achieved in the serum or cerebrospinal fluid.13 The Clinical and Laboratory Standard Institute has acknowledged that traditional susceptibility breakpoints may be too conservative for some non‐central nervous system infections; such as non‐central nervous system infections caused by Streptococcus pneumoniae.14
As resistance rates increase, more patients are likely to be treated with discordant therapy. Therefore, we sought to identify the clinical consequences of discordant antimicrobial therapy for patients hospitalized with a UTI.
METHODS
Design and Setting
We conducted a multicenter, retrospective cohort study. Data for this study were originally collected for a study that determined the accuracy of individual and combined International Classification of Diseases, Ninth Revision (ICD‐9) discharge diagnosis codes for children with laboratory tests for a UTI, in order to develop national quality measures for children hospitalized with UTIs.15 The institutional review board for each hospital (Seattle Children's Hospital, Seattle, WA; Monroe Carell Jr Children's Hospital at Vanderbilt, Nashville, TN; Cincinnati Children's Hospital Medical Center, Cincinnati, OH; Children's Mercy Hospital, Kansas City, MO; Children's Hospital of Philadelphia, Philadelphia, PA) approved the study.
Data Sources
Data were obtained from the Pediatric Health Information System (PHIS) and medical records for patients at the 5 participating hospitals. PHIS contains clinical and billing data from hospitalized children at 43 freestanding children's hospitals. Data quality and coding reliability are assured through a joint effort between the Children's Hospital Association (Shawnee Mission, KS) and participating hospitals.16 PHIS was used to identify participants based on presence of discharge diagnosis code and laboratory tests indicating possible UTI, patient demographics, antibiotic administration date, and utilization of hospital resources (length of stay [LOS], laboratory testing).
Medical records for each participant were reviewed to obtain laboratory and clinical information such as past medical history (including vesicoureteral reflux [VUR], abnormal genitourinary [GU] anatomy, use of prophylactic antibiotic), culture data, and fever data. Data were entered into a secured centrally housed web‐based data collection system. To assure consistency of chart review, all investigators responsible for data collection underwent training. In addition, 2 pilot medical record reviews were performed, followed by group discussion, to reach consensus on questions, preselected answers, interpretation of medical record data, and parameters for free text data entry.
Subjects
The initial cohort included 460 hospitalized patients, aged 3 days to 18 years of age, discharged from participating hospitals between July 1, 2008 and June 30, 2009 with a positive urine culture at any time during hospitalization.15 We excluded patients under 3 days of age because patients this young are more likely to have been transferred from the birthing hospital for a complication related to birth or a congenital anomaly. For this secondary analysis of patients from a prior study, our target population included patients admitted for management of UTI.15 We excluded patients with a negative initial urine culture (n = 59) or if their initial urine culture did not meet definition of laboratory‐confirmed UTI, defined as urine culture with >50,000 colony‐forming units (CFU) with an abnormal urinalysis (UA) (n = 77).1, 1719 An abnormal UA was defined by presence of white blood cells, leukocyte esterase, bacteria, and/or nitrites. For our cohort, all cultures with >50,000 CFU also had an abnormal urinalysis. We excluded 19 patients with cultures classified as 10,000100,000 CFU because we could not confirm that the CFU was >50,000. We excluded 30 patients with urine cultures classified as normal or mixed flora, positive for a mixture of organisms not further identified, or if results were unavailable. Additionally, coagulase‐negative Staphylococcus species (n = 8) were excluded, as these are typically considered contaminants in the setting of urine cultures.2 Patients likely to have received antibiotics prior to admission, or develop a UTI after admission, were identified and removed from the cohort if they had a urine culture performed more than 1 day before, or 2 days after, admission (n = 35). Cultures without resistance testing to the initial antibiotic selection were also excluded (n = 16).
Main Outcome Measures
The primary outcome measure was hospital LOS. Time to fever resolution was a secondary outcome measure. Fever was defined as temperature 38C. Fever duration was defined as number of hours until resolution of fever; only patients with fever at admission were included in this subanalysis.
Main Exposure
The main exposure was initial antibiotic therapy. Patients were classified into 3 groups according to initial antibiotic selection: those receiving 1) concordant; 2) discordant; or 3) delayed initial therapy. Concordance was defined as in vitro susceptibility to the initial antibiotic or class of antibiotic. If the uropathogen was sensitive to a narrow‐spectrum antibiotic (eg, first‐generation cephalosporin), but was not tested against a more broad‐spectrum antibiotic of the same class (eg, third‐generation cephalosporin), concordance was based on the sensitivity to the narrow‐spectrum antibiotic. If the uropathogen was sensitive to a broad‐spectrum antibiotic (eg, third‐generation cephalosporin), concordance to a more narrow‐spectrum antibiotic was not assumed. Discordance was defined as laboratory confirmation of in vitro resistance, or intermediate sensitivity of the pathogen to the initial antibiotic or class of antibiotics. Patients were considered to have a delay in antibiotic therapy if they did not receive antibiotics on the day of, or day after, collection of UA and culture. Patients with more than 1 uropathogen identified in a single culture were classified as discordant if any of the organisms was discordant to the initial antibiotic; they were classified as concordant if all organisms were concordant to the initial antibiotic. Antibiotic susceptibility was not tested in some cases (n = 16).
Initial antibiotic was defined as the antibiotic(s) billed on the same day or day after the UA was billed. If the patient had the UA completed on the day prior to admission, we used the antibiotic administered on the day of admission as the initial antibiotic.
Covariates
Covariates were selected a priori to include patient characteristics likely to affect patient outcomes; all were included in the final analysis. These were age, race, sex, insurance, disposition, prophylactic antibiotic use for any reason (VUR, oncologic process, etc), presence of a chronic care condition, and presence of VUR or GU anatomic abnormality. Age, race, sex, and insurance were obtained from PHIS. Medical record review was used to determine prophylactic antibiotic use, and presence of VUR or GU abnormalities (eg, posterior urethral valves). Chronic care conditions were defined using a previously reported method.20
Data Analysis
Continuous variables were described using median and interquartile range (IQR). Categorical variables were described using frequencies. Multivariable analyses were used to determine the independent association of discordant antibiotic therapy and the outcomes of interest. Poisson regression was used to fit the skewed LOS distribution. The effect of antibiotic concordance or discordance on LOS was determined for all patients in our sample, as well as for those with a urine culture positive for a single identified organism. We used the KruskalWallis test statistic to determine the association between duration of fever and discordant antibiotic therapy, given that duration of fever is a continuous variable. Generalized estimating equations accounted for clustering by hospital and the variability that exists between hospitals.
RESULTS
Of the initial 460 cases with positive urine culture growth at any time during admission, 216 met inclusion criteria for a laboratory‐confirmed UTI from urine culture completed at admission. The median age was 2.46 years (IQR: 0.27,8.89). In the study population, 25.0% were male, 31.0% were receiving prophylactic antibiotics, 13.0% had any grade of VUR, and 16.7% had abnormal GU anatomy (Table 1). A total of 82.4% of patients were treated with concordant initial therapy, 10.2% with discordant initial therapy, and 7.4% received delayed initial antibiotic therapy. There were no significant differences between the groups for any of the covariates. Discordant antibiotic cases ranged from 4.9% to 21.7% across hospitals.
| Overall | Concordant* | Discordant | Delayed Antibiotics | P Value | |
|---|---|---|---|---|---|
| |||||
| N | 216 | 178 (82.4) | 22 (10.2) | 16 (7.4) | |
| Gender | |||||
| Male | 54 (25.0) | 40 (22.5) | 8 (36.4) | 6 (37.5) | 0.18 |
| Female | 162 (75.0) | 138 (77.5) | 14 (63.64) | 10 (62.5) | |
| Race | |||||
| Non‐Hispanic white | 136 (63.9) | 110 (62.5) | 15 (71.4) | 11 (68.8) | 0.83 |
| Non‐Hispanic black | 28 (13.2) | 24 (13.6) | 2 (9.5) | 2 (12.5) | |
| Hispanic | 20 (9.4) | 16 (9.1) | 3 (14.3) | 1 (6.3) | |
| Asian | 10 (4.7) | 9 (5.1) | 1 (4.7) | ||
| Other | 19 (8.9) | 17 (9.7) | 2 (12.5) | ||
| Payor | |||||
| Government | 97 (44.9) | 80 (44.9) | 11 (50.0) | 6 (37.5) | 0.58 |
| Private | 70 (32.4) | 56 (31.5) | 6 (27.3) | 8 (50.0) | |
| Other | 49 (22.7) | 42 (23.6) | 5 (22.7) | 2 (12.5) | |
| Disposition | |||||
| Home | 204 (94.4) | 168 (94.4) | 21 (95.5) | 15 (93.8) | 0.99 |
| Died | 1 (0.5) | 1 (0.6) | |||
| Other | 11 (5.1) | 9 (5.1) | 1 (4.6) | 1 (6.3) | |
| Age | |||||
| 3 d60 d | 40 (18.5) | 35 (19.7) | 3 (13.6) | 2 (12.5) | 0.53 |
| 61 d2 y | 62 (28.7) | 54 (30.3) | 4 (18.2) | 4 (25.0) | |
| 3 y12 y | 75 (34.7) | 61 (34.3) | 8 (36.4) | 6 (37.5) | |
| 13 y18 y | 39 (18.1) | 28 (15.7) | 7 (31.8) | 4 (25.0) | |
| Length of stay | |||||
| 1 d5 d | 171 (79.2) | 147 (82.6) | 12 (54.6) | 12 (75.0) | 0.03 |
| 6 d10 d | 24 (11.1) | 17 (9.6) | 5 (22.7) | 2 (12.5) | |
| 11 d15 d | 10 (4.6) | 5 (2.8) | 3 (13.6) | 2 (12.5) | |
| 16 d+ | 11 (5.1) | 9 (5.1) | 2 (9.1) | 0 | |
| Complex chronic conditions | |||||
| Any CCC | 94 (43.5) | 77 (43.3) | 12 (54.6) | 5 (31.3) | 0.35 |
| Cardiovascular | 20 (9.3) | 19 (10.7) | 1 (6.3) | 0.24 | |
| Neuromuscular | 34 (15.7) | 26 (14.6) | 7 (31.8) | 1 (6.3) | 0.06 |
| Respiratory | 6 (2.8) | 6 (3.4) | 0.52 | ||
| Renal | 26 (12.0) | 21 (11.8) | 4 (18.2) | 1 (6.3) | 0.52 |
| Gastrointestinal | 3 (1.4) | 3 (1.7) | 0.72 | ||
| Hematologic/ immunologic | 1 (0.5) | 1 (4.6) | 0.01 | ||
| Metabolic | 8 (3.7) | 6 (3.4) | 1 (4.6) | 1 (6.3) | 0.82 |
| Congenital or genetic | 15 (6.9) | 11 (6.2) | 3 (13.6) | 1 (6.3) | 0.43 |
| Malignancy | 5 (2.3) | 3 (1.7) | 2 (9.1) | 0.08 | |
| VUR | 28 (13.0) | 23 (12.9) | 3 (13.6) | 2 (12.5) | 0.99 |
| Abnormal GU | 36 (16.7) | 31 (17.4) | 4 (18.2) | 1 (6.3) | 0.51 |
| Prophylactic antibiotics | 67 (31.0) | 53 (29.8) | 10 (45.5) | 4 (25.0) | 0.28 |
The most common causative organisms were E. coli (65.7%) and Klebsiella spp (9.7%) (Table 2). The most common initial antibiotics were a third‐generation cephalosporin (39.1%), combination of ampicillin and a third‐ or fourth‐generation cephalosporin (16.7%), and combination of ampicillin with gentamicin (11.1%). A third‐generation cephalosporin was the initial antibiotic for 46.1% of the E. coli and 56.9% of Klebsiella spp UTIs. Resistance to third‐generation cephalosporins but carbapenem susceptibility was noted for 4.5% of E. coli and 7.7% of Klebsiella spp isolates. Patients with UTIs caused by Klebsiella spp, mixed organisms, and Enterobacter spp were more likely to receive discordant antibiotic therapy. Patients with Enterobacter spp and mixed‐organism UTIs were more likely to have delayed antibiotic therapy. Nineteen patients (8.8%) had positive blood cultures. Fifteen (6.9%) required intensive care unit (ICU) admission during hospitalization.
| Organism | Cases | Concordant* No. (%) | Discordant No. (%) | Delayed Antibiotics No. (%) |
|---|---|---|---|---|
| ||||
| E. coli | 142 | 129 (90.8) | 3 (2.1) | 10 (7.0) |
| Klebsiella spp | 21 | 14 (66.7) | 7 (33.3) | 0 (0) |
| Enterococcus spp | 12 | 9 (75.0) | 3 (25.0) | 0 (0) |
| Enterobacter spp | 10 | 5 (50.0) | 3 (30.0) | 2 (20.0) |
| Pseudomonas spp | 10 | 9 (90.0) | 1 (10.0) | 0 (0) |
| Other single organisms | 6 | 5 (83.3) | 0 (0) | 1 (16.7) |
| Other identified multiple organisms | 15 | 7 (46.7) | 5 (33.3) | 3 (20.0) |
Unadjusted results are shown in Supporting Appendix 1, in the online version of this article. In the adjusted analysis, discordant antibiotic therapy was associated with a significantly longer LOS, compared with concordant therapy for all UTIs and for all UTIs caused by a single organism (Table 3). In adjusted analysis, discordant therapy was also associated with a 3.1 day (IQR: 2.0, 4.7) longer length of stay compared with concordant therapy for all E. coli UTIs.
| Bacteria | Difference in LOS (95% CI)* | P Value |
|---|---|---|
| ||
| All organisms | ||
| Concordant vs discordant | 1.8 (2.1, 1.5) | <0.0001 |
| Concordant vs delayed antibiotics | 1.4 (1.7, 1.1) | 0.01 |
| Single organisms | ||
| Concordant vs discordant | 1.9 (2.4, 1.5) | <0.0001 |
| Concordant vs delayed antibiotics | 1.2 (1.6, 1.2) | 0.37 |
Time to fever resolution was analyzed for patients with a documented fever at presentation for each treatment subgroup. One hundred thirty‐six patients were febrile at admission and 122 were febrile beyond the first recorded vital signs. Fever was present at admission in 60% of the concordant group and 55% of the discordant group (P = 0.6). The median duration of fever was 48 hours for the concordant group (n = 107; IQR: 24, 240) and 78 hours for the discordant group (n = 12; IQR: 48, 132). All patients were afebrile at discharge. Differences in fever duration between treatment groups were not statistically significant (P = 0.7).
DISCUSSION
Across 5 children's hospitals, 1 out of every 10 children hospitalized for UTI received discordant initial antibiotic therapy. Children receiving discordant antibiotic therapy had a 1.8 day longer LOS when compared with those on concordant therapy. However, there was no significant difference in time to fever resolution between the groups, suggesting that the increase in LOS was not explained by increased fever duration.
The overall rate of discordant therapy in this study is consistent with prior studies, as was the more common association of discordant therapy with non‐E. coli UTIs.10 According to the Kids' Inpatient Database 2009, there are 48,100 annual admissions for patients less than 20 years of age with a discharge diagnosis code of UTI in the United States.1 This suggests that nearly 4800 children with UTI could be affected by discordant therapy annually.
Children treated with discordant antibiotic therapy had a significantly longer LOS compared to those treated with concordant therapy. However, differences in time to fever resolution between the groups were not statistically significant. While resolution of fever may suggest clinical improvement and adequate empiric therapy, the lack of association with antibiotic concordance was not unexpected, since the relationship between fever resolution, clinical improvement, and LOS is complex and thus challenging to measure.21 These results support the notion that fever resolution alone may not be an adequate measure of clinical response.
It is possible that variability in discharge decision‐making may contribute to increased length of stay. Some clinicians may delay a patient's discharge until complete resolution of symptoms or knowledge of susceptibilities, while others may discharge patients that are still febrile and/or still receiving empiric antibiotics. Evidence‐based guidelines that address the appropriate time to discharge a patient with UTI are lacking. The American Academy of Pediatrics provides recommendations for use of parenteral antibiotics and hospital admission for patients with UTI, but does not address discharge decision‐making or patient management in the setting of discordant antibiotic therapy.2, 21
This study must be interpreted in the context of several limitations. First, our primary and secondary outcomes, LOS and fever duration, were surrogate measures for clinical response. We were not able to measure all clinical factors that may contribute to LOS, such as the patient's ability to tolerate oral fluids and antibiotics. Also, there may have been too few patients to detect a clinically important difference in fever duration between the concordant and discordant groups, especially for individual organisms. Although we did find a significant difference in LOS between patients treated with concordant compared with discordant therapy, there may be residual confounding from unobserved differences. This confounding, in conjunction with the small sample size, may cause us to underestimate the magnitude of the difference in LOS resulting from discordant therapy. Second, short‐term outcomes such as ICU admission were not investigated in this study; however, the proportion of patients admitted to the ICU in our population was quite small, precluding its use as a meaningful outcome measure. Third, the potential benefits to patients who were not exposed to unnecessary antibiotics, or harm to those that were exposed, could not be measured. Finally, our study was obtained using data from 5 free‐standing tertiary care pediatric facilities, thereby limiting its generalizability to other settings. Still, our rates of prophylactic antibiotic use, VUR, and GU abnormalities are similar to others reported in tertiary care children's hospitals, and we accounted for these covariates in our model.2225
As the frequency of infections caused by resistant bacteria increase, so will the number of patients receiving discordant antibiotics for UTI, compounding the challenge of empiric antimicrobial selection. Further research is needed to better understand how discordant initial antibiotic therapy contributes to LOS and whether it is associated with adverse short‐ and long‐term clinical outcomes. Such research could also aid in weighing the risk of broader‐spectrum prescribing on antimicrobial resistance patterns. While we identified an association between discordant initial antibiotic therapy and LOS, we were unable to determine the ideal empiric antibiotic therapy for patients hospitalized with UTI. Further investigation is needed to inform local and national practice guidelines for empiric antibiotic selection in patients with UTIs. This may also be an opportunity to decrease discordant empiric antibiotic selection, perhaps through use of antibiograms that stratify patients based on known factors, to lead to more specific initial therapy.
CONCLUSIONS
This study demonstrates that discordant antibiotic selection for UTI at admission is associated with longer hospital stay, but not fever duration. The full clinical consequences of discordant therapy, and the effects on length of stay, need to be better understood. Our findings, taken in combination with careful consideration of patient characteristics and prior history, may provide an opportunity to improve the hospital care for patients with UTIs.
Acknowledgements
Disclosure: Nothing to report.
- HCUP Kids' Inpatient Database (KID). Healthcare Cost and Utilization Project (HCUP). Rockville, MD: Agency for Healthcare Research and Quality; 2006 and 2009. Available at: http://www.hcup‐us.ahrq.gov/kidoverview.jsp.
- Subcommitee on Urinary Tract Infection, Steering Committee on Quality Improvement and Management. Urinary tract infection: clinical practice guideline for the diagnosis and management of the initial UTI in febrile infants and children 2 to 24 months. Pediatrics. 2011;128(3)595–610. doi: 10.1542/peds.2011–1330. Available at: http://pediatrics.aappublications.org/content/128/3/595.full.html.
- , , . National ambulatory antibiotic prescribing patterns for pediatric urinary tract infection, 1998–2007. Pediatrics. 2011;127(6):1027–1033.
- , , , , . Previous antimicrobial exposure is associated with drug‐resistant urinary tract infections in children. Pediatrics. 2010;125(4):664–672.
- CDC. National Antimicrobial Resistance Monitoring System for Enteric Bacteria (NARMS): Human Isolates Final Report. Atlanta, GA: US Department of Health and Human Services, CDC; 2009.
- , , , , . Increasing antibiotic resistance among uropathogens isolated during years 2006–2009: impact on the empirical management. Int Braz J Urol. 2012;38(1):25–32.
- . 3rd Generation Cephalosporin‐Resistant Escherichia coli. 2010. Available at: http://www.cddep.org/ResistanceMap/bug‐drug/EC‐CS. Accessed May 14, 2012.
- , , , . Risk of renal scarring in children with a first urinary tract infection: a systematic review. Pediatrics. 2010;126(6):1084–1091.
- , . Treatment of urinary tract infections. Pediatr Infect Dis J. 1999;18(11):1020–1021.
- , , , , . Non‐Escherichia coli versus Escherichia coli community‐acquired urinary tract infections in children hospitalized in a tertiary center: relative frequency, risk factors, antimicrobial resistance and outcome. Pediatr Infect Dis J. 2005;24(7):581–585.
- , , , , , . Prognosis of urinary tract infections with discordant antibiotic treatment [in Spanish]. Rev Clin Esp. 2010;210(11):545–549.
- , , , et al. Appropriateness of empiric antibiotic therapy in urinary tract infection in emergency room [in Spanish]. Rev Clin Esp. 2010;210(1):11–16.
- , , . Principles and Practice of Pediatric Infectious Diseases. 3rd ed. New York, NY: Churchill Livingstone/Elsevier; 2009.
- National Committee for Clinical Laboratory Standards. Performance Standards for Antimicrobial Susceptibility Testing; Twelfth Informational Supplement.Vol M100‐S12. Wayne, PA: NCCLS; 2002.
- , , , et al. Accuracy of administrative billing codes to detect urinary tract infection hospitalizations. Pediatrics. 2011;128(2):323–330.
- , , , . Corticosteroids and mortality in children with bacterial meningitis. JAMA. 2008;299(17):2048–2055.
- , , , , . Enhanced urinalysis as a screening test for urinary tract infection. Pediatrics. 1993;91(6):1196–1199.
- , , , , . Pyuria and bacteriuria in urine specimens obtained by catheter from young children with fever. J Pediatr. 1994;124(4):513–519.
- , , , et al. Clinical and demographic factors associated with urinary tract infection in young febrile infants. Pediatrics. 2005;116(3):644–648.
- , , , , , . Deaths attributed to pediatric complex chronic conditions: national trends and implications for supportive care services. Pediatrics. 2001;107(6):E99.
- Committee on Quality Improvement. Subcommittee on Urinary Tract Infection. Practice parameter: the diagnosis, treatment, and evaluation of the initial urinary tract infection in febrile infants and young children. Pediatrics. 1999;103:843–852.
- , . Antibiotics or surgery for vesicoureteric reflux in children. Lancet. 2004;364(9446):1720–1722.
- , , , et al. Randomized intervention for children with vesicoureteral reflux (RIVUR): background commentary of RIVUR investigators. Pediatrics. 2008;122(suppl 5):S233–S239.
- , , . Length of intravenous antibiotic therapy and treatment failure in infants with urinary tract infections. Pediatrics. 2010;126(2):196–203.
- , , , , , . Vesicoureteral reflux in children with suspected and proven urinary tract infection. Pediatr Nephrol. 2010;25(8):1463–1469.
Copyright © 2012 Society of Hospital Medicine
Pediatric Observation Status Stays
In recent decades, hospital lengths of stay have decreased and there has been a shift toward outpatient management for many pediatric conditions. In 2003, one‐third of all children admitted to US hospitals experienced 1‐day inpatient stays, an increase from 19% in 1993.1 Some hospitals have developed dedicated observation units for the care of children, with select diagnoses, who are expected to respond to less than 24 hours of treatment.26 Expansion of observation services has been suggested as an approach to lessen emergency department (ED) crowding7 and alleviate high‐capacity conditions within hospital inpatient units.8
In contrast to care delivered in a dedicated observation unit, observation status is an administrative label applied to patients who do not meet inpatient criteria as defined by third parties such as InterQual. While the decision to admit a patient is ultimately at the discretion of the ordering physician, many hospitals use predetermined criteria to assign observation status to patients admitted to observation and inpatient units.9 Treatment provided under observation status is designated by hospitals and payers as outpatient care, even when delivered in an inpatient bed.10 As outpatient‐designated care, observation cases do not enter publicly available administrative datasets of hospital discharges that have traditionally been used to understand hospital resource utilization, including the National Hospital Discharge Survey and the Kid's Inpatient Database.11, 12
We hypothesize that there has been an increase in observation status care delivered to children in recent years, and that the majority of children under observation were discharged home without converting to inpatient status. To determine trends in pediatric observation status care, we conducted the first longitudinal, multicenter evaluation of observation status code utilization following ED treatment in a sample of US freestanding children's hospitals. In addition, we focused on the most recent year of data among top ranking diagnoses to assess the current state of observation status stay outcomes (including conversion to inpatient status and return visits).
METHODS
Data Source
Data for this multicenter retrospective cohort study were obtained from the Pediatric Health Information System (PHIS). Freestanding children's hospital's participating in PHIS account for approximately 20% of all US tertiary care children's hospitals. The PHIS hospitals provide resource utilization data including patient demographics, International Classification of Diseases, Ninth Revision (ICD‐9) diagnosis and procedure codes, and charges applied to each stay, including room and nursing charges. Data were de‐identified prior to inclusion in the database, however encrypted identification numbers allowed for tracking individual patients across admissions. Data quality and reliability were assured through a joint effort between the Child Health Corporation of America (CHCA; Shawnee Mission, KS) and participating hospitals as described previously.13, 14 In accordance with the Common Rule (45 CFR 46.102(f)) and the policies of The Children's Hospital of Philadelphia Institutional Review Board, this research, using a de‐identified dataset, was considered exempt from review.
Hospital Selection
Each year from 2004 to 2009, there were 18 hospitals participating in PHIS that reported data from both inpatient discharges and outpatient visits (including observation status discharges). To assess data quality for observation status stays, we evaluated observation status discharges for the presence of associated observation billing codes applied to charge records reported to PHIS including: 1) observation per hour, 2) ED observation time, or 3) other codes mentioning observation in the hospital charge master description document. The 16 hospitals with observation charges assigned to at least 90% of observation status discharges in each study year were selected for analysis.
Visit Identification
Within the 16 study hospitals, we identified all visits between January 1, 2004 and December 31, 2009 with ED facility charges. From these ED visits, we included any stays designated by the hospital as observation or inpatient status, excluding transfers and ED discharges.
Variable Definitions
Hospitals submitting records to PHIS assigned a single patient type to the episode of care. The Observation patient type was assigned to patients discharged from observation status. Although the duration of observation is often less than 24 hours, hospitals may allow a patient to remain under observation for longer durations.15, 16 Duration of stay is not defined precisely enough within PHIS to determine hours of inpatient care. Therefore, length of stay (LOS) was not used to determine observation status stays.
The Inpatient patient type was assigned to patients who were discharged from inpatient status, including those patients admitted to inpatient care from the ED and also those who converted to inpatient status from observation. Patients who converted from observation status to inpatient status during the episode of care could be identified through the presence of observation charge codes as described above.
Given the potential for differences in the application of observation status, we also identified 1‐Day Stays where discharge occurred on the day of, or the day following, an inpatient status admission. These 1‐Day Stays represent hospitalizations that may, by their duration, be suitable for care in an observation unit. We considered discharges in the Observation and 1‐Day Stay categories to be Short‐Stays.
DATA ANALYSIS
For each of the 6 years of study, we calculated the following proportions to determine trends over time: 1) the number of Observation Status admissions from the ED as a proportion of the total number of ED visits resulting in Observation or Inpatient admission, and 2) the number of 1‐Day Stays admitted from the ED as a proportion of the total number of ED visits resulting in Observation or Inpatient admissions. Trends were analyzed using linear regression. Trends were also calculated for the total volume of admissions from the ED and the case‐mix index (CMI). CMI was assessed to evaluate for changes in the severity of illness for children admitted from the ED over the study period. Each hospital's CMI was calculated as an average of their Observation and Inpatient Status discharges' charge weights during the study period. Charge weights were calculated at the All Patient Refined Diagnosis Related Groups (APR‐DRG)/severity of illness level (3M Health Information Systems, St Paul, MN) and were normalized national average charges derived by Thomson‐Reuters from their Pediatric Projected National Database. Weights were then assigned to each discharge based on the discharge's APR‐DRG and severity level assignment.
To assess the current outcomes for observation, we analyzed stays with associated observation billing codes from the most recent year of available data (2009). Stays with Observation patient type were considered to have been discharged from observation, while those with an Inpatient Status patient type were considered to have converted to an inpatient admission during the observation period.
Using the 2009 data, we calculated descriptive statistics for patient characteristics (eg, age, gender, payer) comparing Observation Stays, 1‐Day Stays, and longer‐duration Inpatient admissions using chi‐square statistics. Age was categorized using the American Academy of Pediatrics groupings: <30 days, 30 days1 year, 12 years, 34 years, 512 years, 1317 years, >18 years. Designated payer was categorized into government, private, and other, including self‐pay and uninsured groups.
We used the Severity Classification Systems (SCS) developed for pediatric emergency care to estimate severity of illness for the visit.17 In this 5‐level system, each ICD‐9 diagnosis code is associated with a score related to the intensity of ED resources needed to care for a child with that diagnosis. In our analyses, each case was assigned the maximal SCS category based on the highest severity ICD‐9 code associated with the stay. Within the SCS, a score of 1 indicates minor illness (eg, diaper dermatitis) and 5 indicates major illness (eg, septic shock). The proportions of visits within categorical SCS scores were compared for Observation Stays, 1‐Day Stays, and longer‐duration Inpatient admissions using chi‐square statistics.
We determined the top 10 ranking diagnoses for which children were admitted from the ED in 2009 using the Diagnosis Grouping System (DGS).18 The DGS was designed specifically to categorize pediatric ED visits into clinically meaningful groups. The ICD‐9 code for the principal discharge diagnosis was used to assign records to 1 of the 77 DGS subgroups. Within each of the top ranking DGS subgroups, we determined the proportion of Observation Stays, 1‐Day Stays, and longer‐duration Inpatient admissions.
To provide clinically relevant outcomes of Observation Stays for common conditions, we selected stays with observation charges from within the top 10 ranking observation stay DGS subgroups in 2009. Outcomes for observation included: 1) immediate outcome of the observation stay (ie, discharge or conversion to inpatient status), 2) return visits to the ED in the 3 days following observation, and 3) readmissions to the hospital in the 3 and 30 days following observation. Bivariate comparisons of return visits and readmissions for Observation versus 1‐Day Stays within DGS subgroups were analyzed using chi‐square tests. Multivariate analyses of return visits and readmissions were conducted using Generalized Estimating Equations adjusting for severity of illness by SCS score and clustering by hospital. To account for local practice patterns, we also adjusted for a grouped treatment variable that included the site level proportion of children admitted to Observation Status, 1‐Day‐Stays, and longer Inpatient admissions. All statistical analyses were performed using SAS (version 9.2, SAS Institute, Inc, Cary, NC); P values <0.05 were considered statistically significant.
RESULTS
Trends in Short‐Stays
An increase in proportion of Observation Stays was mirrored by a decrease in proportion of 1‐Day Stays over the study period (Figure 1). In 2009, there were 1.4 times more Observation Stays than 1‐Day Stays (25,653 vs 18,425) compared with 14,242 and 20,747, respectively, in 2004. This shift toward more Observation Stays occurred as hospitals faced a 16% increase in the total number of admissions from the ED (91,318 to 108,217) and change in CMI from 1.48 to 1.51. Over the study period, roughly 40% of all admissions from the ED were Short‐Stays (Observation and 1‐Day Stays). Median LOS for Observation Status stays was 1 day (interquartile range [IQR]: 11).

Patient Characteristics in 2009
Table 1 presents comparisons between Observation, 1‐Day Stays, and longer‐duration Inpatient admissions. Of potential clinical significance, children under Observation Status were slightly younger (median, 4.0 years; IQR: 1.310.0) when compared with children admitted for 1‐Day Stays (median, 5.0 years; IQR: 1.411.4; P < 0.001) and longer‐duration Inpatient stays (median, 4.7 years; IQR: 0.912.2; P < 0.001). Nearly two‐thirds of Observation Status stays had SCS scores of 3 or lower compared with less than half of 1‐Day Stays and longer‐duration Inpatient admissions.
| Short‐Stays | LOS >1 Day | |||||
|---|---|---|---|---|---|---|
| Observation | 1‐Day Stay | Longer Admission | ||||
| N = 25,653* (24%) | N = 18,425* (17%) | P Value Comparing Observation to 1‐Day Stay | N = 64,139* (59%) | P Value Comparing Short‐Stays to LOS >1 Day | ||
| ||||||
| Sex | Male | 14,586 (57) | 10,474 (57) | P = 0.663 | 34,696 (54) | P < 0.001 |
| Female | 11,000 (43) | 7,940 (43) | 29,403 (46) | |||
| Payer | Government | 13,247 (58) | 8,944 (55) | P < 0.001 | 35,475 (61) | P < 0.001 |
| Private | 7,123 (31) | 5,105 (32) | 16,507 (28) | |||
| Other | 2,443 (11) | 2,087 (13) | 6,157 (11) | |||
| Age | <30 days | 793 (3) | 687 (4) | P < 0.001 | 3,932 (6) | P < 0.001 |
| 30 days1 yr | 4,499 (17) | 2,930 (16) | 13,139 (21) | |||
| 12 yr | 5,793 (23) | 3,566 (19) | 10,229 (16) | |||
| 34 yr | 3,040 (12) | 2,056 (11) | 5,551 (9) | |||
| 512 yr | 7,427 (29) | 5,570 (30) | 17,057 (27) | |||
| 1317 yr | 3,560 (14) | 3,136 (17) | 11,860 (18) | |||
| >17 yr | 541 (2) | 480 (3) | 2,371 (4) | |||
| Race | White | 17,249 (70) | 12,123 (70) | P < 0.001 | 40,779 (67) | P <0.001 |
| Black | 6,298 (25) | 4,216 (25) | 16,855 (28) | |||
| Asian | 277 (1) | 295 (2) | 995 (2) | |||
| Other | 885 (4) | 589 (3) | 2,011 (3) | |||
| SCS | 1 Minor illness | 64 (<1) | 37 (<1) | P < 0.001 | 84 (<1) | P < 0.001 |
| 2 | 1,190 (5) | 658 (4) | 1,461 (2) | |||
| 3 | 14,553 (57) | 7,617 (42) | 20,760 (33) | |||
| 4 | 8,994 (36) | 9,317 (51) | 35,632 (56) | |||
| 5 Major illness | 490 (2) | 579 (3) | 5,689 (9) | |||
In 2009, the top 10 DGS subgroups accounted for half of all admissions from the ED. The majority of admissions for extremity fractures, head trauma, dehydration, and asthma were Short‐Stays, as were roughly 50% of admissions for seizures, appendicitis, and gastroenteritis (Table 2). Respiratory infections and asthma were the top 1 and 2 ranking DGS subgroups for Observation Stays, 1‐Day Stays, and longer‐duration Inpatient admissions. While rank order differed, 9 of the 10 top ranking Observation Stay DGS subgroups were also top ranking DGS subgroups for 1‐Day Stays. Gastroenteritis ranked 10th among Observation Stays and 11th among 1‐Day Stays. Diabetes mellitus ranked 26th among Observation Stays compared with 8th among 1‐Day Stays.
| Short‐Stays | LOS >1 Day | ||
|---|---|---|---|
| % Observation | % 1‐Day Stay | % Longer Admission | |
| |||
| All admissions from the ED | 23.7 | 17.0 | 59.3 |
| n = 108,217 | |||
| Respiratory infections | 22.3 | 15.3 | 62.4 |
| n = 14,455 (13%) | |||
| Asthma | 32.0 | 23.8 | 44.2 |
| n = 8,853 (8%) | |||
| Other GI diseases | 24.1 | 16.2 | 59.7 |
| n = 6,519 (6%) | |||
| Appendicitis | 21.0 | 29.5 | 49.5 |
| n = 4,480 (4%) | |||
| Skin infections | 20.7 | 14.3 | 65.0 |
| n = 4,743 (4%) | |||
| Seizures | 29.5 | 22 | 48.5 |
| n = 4,088 (4%) | |||
| Extremity fractures | 49.4 | 20.5 | 30.1 |
| n = 3,681 (3%) | |||
| Dehydration | 37.8 | 19.0 | 43.2 |
| n = 2,773 (3%) | |||
| Gastroenteritis | 30.3 | 18.7 | 50.9 |
| n = 2,603 (2%) | |||
| Head trauma | 44.1 | 43.9 | 32.0 |
| n = 2,153 (2%) | |||
Average maximum SCS scores were clinically comparable for Observation and 1‐Day Stays and generally lower than for longer‐duration Inpatient admissions within the top 10 most common DGS subgroups. Average maximum SCS scores were statistically lower for Observation Stays compared with 1‐Day Stays for respiratory infections (3.2 vs 3.4), asthma (3.4 vs 3.6), diabetes (3.5 vs 3.8), gastroenteritis (3.0 vs 3.1), other gastrointestinal diseases (3.2 vs 3.4), head trauma (3.3 vs 3.5), and extremity fractures (3.2 vs 3.4) (P < 0.01). There were no differences in SCS scores for skin infections (SCS = 3.0) and appendicitis (SCS = 4.0) when comparing Observation and 1‐Day Stays.
Outcomes for Observation Stays in 2009
Within 6 of the top 10 DGS subgroups for Observation Stays, >75% of patients were discharged home from Observation Status (Table 3). Mean LOS for stays that converted from Observation to Inpatient Status ranged from 2.85 days for extremity fractures to 4.66 days for appendicitis.
| Return to ED in 3 Days n = 421 (1.6%) | Hospital Readmissions in 3 Days n = 247 (1.0%) | Hospital Readmissions in 30 Days n = 819 (3.2%) | ||
|---|---|---|---|---|
| DGS subgroup | % Discharged From Observation | Adjusted* Odds Ratio (95% CI) | Adjusted* Odds Ratio (95% CI) | Adjusted* Odds Ratio (95% CI) |
| ||||
| Respiratory infections | 72 | 1.1 (0.71.8) | 0.8 (0.51.3) | 0.9 (0.71.3) |
| Asthma | 80 | 1.3 (0.63.0) | 1.0 (0.61.8) | 0.5 (0.31.0) |
| Other GI diseases | 74 | 0.8 (0.51.3) | 2.2 (1.33.8) | 1.0 (0.71.5) |
| Appendicitis | 82 | NE | NE | NE |
| Skin infections | 68 | 1.8 (0.84.4) | 1.4 (0.45.3) | 0.9 (0.61.6) |
| Seizures | 79 | 0.8 (0.41.6) | 0.8 (0.31.8) | 0.7 (0.51.0) |
| Extremity fractures | 92 | 0.9 (0.42.1) | 0.2 (01.3) | 1.2 (0.53.2) |
| Dehydration | 81 | 0.9 (0.61.4) | 0.8 (0.31.9) | 0.7 (0.41.1) |
| Gastroenteritis | 74 | 0.9 (0.42.0) | 0.6 (0.41.2) | 0.6 (0.41) |
| Head trauma | 92 | 0.6 (0.21.7) | 0.3 (02.1) | 1.0 (0.42.8) |
Among children with Observation Stays for 1 of the top 10 DGS subgroups, adjusted return ED visit rates were <3% and readmission rates were <1.6% within 3 days following the index stay. Thirty‐day readmission rates were highest following observation for other GI illnesses and seizures. In unadjusted analysis, Observation Stays for asthma, respiratory infections, and skin infections were associated with greater proportions of return ED visits when compared with 1‐Day Stays. Differences were no longer statistically significant after adjusting for SCS score, clustering by hospital, and the grouped treatment variable. Adjusted odds of readmission were significantly higher at 3 days following observation for other GI illnesses and lower at 30 days following observation for seizures when compared with 1‐Day Stays (Table 3).
DISCUSSION
In this first, multicenter longitudinal study of pediatric observation following an ED visit, we found that Observation Status code utilization has increased steadily over the past 6 years and, in 2007, the proportion of children admitted to observation status surpassed the proportion of children experiencing a 1‐day inpatient admission. Taken together, Short‐Stays made up more than 40% of the hospital‐based care delivered to children admitted from an ED. Stable trends in CMI over time suggest that observation status may be replacing inpatient status designated care for pediatric Short‐Stays in these hospitals. Our findings suggest the lines between outpatient observation and short‐stay inpatient care are becoming increasingly blurred. These trends have occurred in the setting of changing policies for hospital reimbursement, requirements for patients to meet criteria to qualify for inpatient admissions, and efforts to avoid stays deemed unnecessary or inappropriate by their brief duration.19 Therefore there is a growing need to understand the impact of children under observation on the structure, delivery, and financing of acute hospital care for children.
Our results also have implications for pediatric health services research that relies on hospital administrative databases that do not contain observation stays. Currently, observation stays are systematically excluded from many inpatient administrative datasets.11, 12 Analyses of datasets that do not account for observation stays likely result in underestimation of hospitalization rates and hospital resource utilization for children. This may be particularly important for high‐volume conditions, such as asthma and acute infections, for which children commonly require brief periods of hospital‐based care beyond an ED encounter. Data from pediatric observation status admissions should be consistently included in hospital administrative datasets to allow for more comprehensive analyses of hospital resource utilization among children.
Prior research has shown that the diagnoses commonly treated in pediatric observation units overlap with the diagnoses for which children experience 1‐Day Stays.1, 20 We found a similar pattern of conditions for which children were under Observation Status and 1‐Day Stays with comparable severity of illness between the groups in terms of SCS scores. Our findings imply a need to determine how and why hospitals differentiate Observation Status from 1‐Day‐Stay groups in order to improve the assignment of observation status. Assuming continued pressures from payers to provide more care in outpatient or observation settings, there is potential for expansion of dedicated observation services for children in the US. Without designated observation units or processes to group patients with lower severity conditions, there may be limited opportunities to realize more efficient hospital care simply through the application of the label of observation status.
For more than 30 years, observation services have been provided to children who require a period of monitoring to determine their response to therapy and the need for acute inpatient admission from the ED.21While we were not able to determine the location of care for observation status patients in this study, we know that few children's hospitals have dedicated observation units and, even when an observation unit is present, not all observation status patients are cared for in dedicated observation units.9 This, in essence, means that most children under observation status are cared for in virtual observation by inpatient teams using inpatient beds. If observation patients are treated in inpatient beds and consume the same resources as inpatients, then cost‐savings based on reimbursement contracts with payers may not reflect an actual reduction in services. Pediatric institutions will need to closely monitor the financial implications of observation status given the historical differences in payment for observation and inpatient care.
With more than 70% of children being discharged home following observation, our results are comparable to the published literature2, 5, 6, 22, 23 and guidelines for observation unit operations.24 Similar to prior studies,4, 15, 2530 our results also indicate that return visits and readmissions following observation are uncommon events. Our findings can serve as initial benchmarks for condition‐specific outcomes for pediatric observation care. Studies are needed both to identify the clinical characteristics predictive of successful discharge home from observation and to explore the hospital‐to‐hospital variability in outcomes for observation. Such studies are necessary to identify the most successful healthcare delivery models for pediatric observation stays.
LIMITATIONS
The primary limitation to our results is that data from a subset of freestanding children's hospitals may not reflect observation stays at other children's hospitals or the community hospitals that care for children across the US. Only 18 of 42 current PHIS member hospitals have provided both outpatient visit and inpatient stay data for each year of the study period and were considered eligible. In an effort to ensure the quality of observation stay data, we included the 16 hospitals that assigned observation charges to at least 90% of their observation status stays in the PHIS database. The exclusion of the 2 hospitals where <90% of observation status patients were assigned observation charges likely resulted in an underestimation of the utilization of observation status.
Second, there is potential for misclassification of patient type given institutional variations in the assignment of patient status. The PHIS database does not contain information about the factors that were considered in the assignment of observation status. At the time of admission from the ED, observation or inpatient status is assigned. While this decision is clearly reserved for the admitting physician, the process is not standardized across hospitals.9 Some institutions have Utilization Managers on site to help guide decision‐making, while others allow the assignment to be made by physicians without specific guidance. As a result, some patients may be assigned to observation status at admission and reassigned to inpatient status following Utilization Review, which may bias our results toward overestimation of the number of observation stays that converted to inpatient status.
The third limitation to our results relates to return visits. An accurate assessment of return visits is subject to the patient returning to the same hospital. If children do not return to the same hospital, our results would underestimate return visits and readmissions. In addition, we did not assess the reason for return visit as there was no way to verify if the return visit was truly related to the index visit without detailed chart review. Assuming children return to the same hospital for different reasons, our results would overestimate return visits associated with observation stays. We suspect that many 3‐day return visits result from the progression of acute illness or failure to respond to initial treatment, and 30‐day readmissions reflect recurrent hospital care needs related to chronic illnesses.
Lastly, severity classification is difficult when analyzing administrative datasets without physiologic patient data, and the SCS may not provide enough detail to reveal clinically important differences between patient groups.
CONCLUSIONS
Short‐stay hospitalizations following ED visits are common among children, and the majority of pediatric short‐stays are under observation status. Analyses of inpatient administrative databases that exclude observation stays likely result in an underestimation of hospital resource utilization for children. Efforts are needed to ensure that patients under observation status are accounted for in hospital administrative datasets used for pediatric health services research, and healthcare resource allocation, as it relates to hospital‐based care. While the clinical outcomes for observation patients appear favorable in terms of conversion to inpatient admissions and return visits, the financial implications of observation status care within children's hospitals are currently unknown.
- ,,,,,.Trends in high‐turnover stays among children hospitalized in the United States, 1993–2003.Pediatrics.2009;123(3):996–1002.
- ,,,,.Utilization and unexpected hospitalization rates of a pediatric emergency department 23‐hour observation unit.Pediatr Emerg Care.2008;24(9):589–594.
- ,,.When the patient requires observation not hospitalization.J Nurs Admin.1988;18(10):20–23.
- ,,,.Pediatric observation status beds on an inpatient unit: an integrated care model.Pediatr Emerg Care.2004;20(1):17–21.
- ,,.Use of an observation unit by a pediatric emergency department for common pediatric illnesses.Pediatr Emerg Care.2001;17(5):321–323.
- ,,.The pediatric hybrid observation unit: an analysis of 6477 consecutive patient encounters.Pediatrics.2005;115(5):e535–e542.
- ACEP. Emergency Department Crowding: High‐Impact Solutions. Task Force Report on Boarding.2008. Available at: http://www.acep.org/WorkArea/downloadasset.aspx?id=37960. Accessed July 21, 2010.
- ,,, et al.Children's hospitals do not acutely respond to high occupancy.Pediatrics.2010;125(5):974–981.
- ,,, et al.Differences in observation care practices in US freestanding children's hospitals: are they virtual or real?J Hosp Med.2011. Available at: http://www.cms.gov/transmittals/downloads/R770HO.pdf. Accessed January 10, 2011.
- CMS.Medicare Hospital Manual, Section 455.Department of Health and Human Services, Centers for Medicare and Medicaid Services;2001. Available at: http://www.hcup‐us.ahrq.gov/reports/methods/FinalReportonObservationStatus_v2Final.pdf. Accessed on May 3, 2007.
- HCUP.Methods Series Report #2002–3. Observation Status Related to U.S. Hospital Records. Healthcare Cost and Utilization Project.Rockville, MD:Agency for Healthcare Research and Quality;2002.
- ,.Design and operation of the National Hospital Discharge Survey: 1988 redesign.Vital Health Stat.2000;1(39):1–43.
- ,,,.Corticosteroids and mortality in children with bacterial meningitis.JAMA.2008;299(17):2048–2055.
- ,,,,.Intravenous immunoglobulin in children with streptococcal toxic shock syndrome.Clin Infect Dis.2009;49(9):1369–1376.
- ,,,.Impact of a short stay unit on asthma patients admitted to a tertiary pediatric hospital.Qual Manag Health Care.1997;6(1):14–22.
- ,,.An observation unit in a pediatric emergency department: one children's hospital's experience.J Emerg Nurs.2002;28(5):407–413.
- ,,,.Developing a diagnosis‐based severity classification system for use in emergency medical systems for children. Pediatric Academic Societies' Annual Meeting, Platform Presentation; Toronto, Canada;2007.
- ,,,,.A new diagnosis grouping system for child emergency department visits.Acad Emerg Med.2010;17(2):204–213.
- .Observation medicine: the healthcare system's tincture of time. In: Graff LG, ed.Principles of Observation Medicine.American College of Emergency Physicians;2010. Available at: http://www. acep.org/content.aspx?id=46142. Accessed February 18, 2011.
- ,,,,.High turnover stays for pediatric asthma in the United States: analysis of the 2006 Kids' Inpatient Database.Med Care.2010;48(9):827–833.
- ,,,,.Pediatric observation units in the United States: a systematic review.J Hosp Med.2010;5(3):172–182.
- ,.Observation unit in childrens hospital—adjunct to delivery and teaching of ambulatory pediatric care.N Y State J Med.1980;80(11):1684–1686.
- ,,.Short stay in an outpatient department. An alternative to hospitalization.Am J Dis Child.1972;123(2):128–132.
- ACEP.Practice Management Committee, American College of Emergency Physicians. Management of Observation Units.Irving, TX:American College of Emergency Physicians;1994.
- ,,,,.Return visits to a pediatric emergency department.Pediatr Emerg Care.2004;20(3):166–171.
- ,.Postreduction management of intussusception in a children's hospital emergency department.Pediatrics.2003;112(6 pt 1):1302–1307.
- ,,,,.Pediatric closed head injuries treated in an observation unit.Pediatr Emerg Care.2005;21(10):639–644.
- ,,,.Use of pediatric observation unit for treatment of children with dehydration caused by gastroenteritis.Pediatr Emerg Care.2006;22(1):1–6.
- ,,,.Children with asthma admitted to a pediatric observation unit.Pediatr Emerg Care.2005;21(10):645–649.
- ,,, et al.How well can hospital readmission be predicted in a cohort of hospitalized children? A retrospective, multicenter study.Pediatrics.2009;123(1):286–293.
In recent decades, hospital lengths of stay have decreased and there has been a shift toward outpatient management for many pediatric conditions. In 2003, one‐third of all children admitted to US hospitals experienced 1‐day inpatient stays, an increase from 19% in 1993.1 Some hospitals have developed dedicated observation units for the care of children, with select diagnoses, who are expected to respond to less than 24 hours of treatment.26 Expansion of observation services has been suggested as an approach to lessen emergency department (ED) crowding7 and alleviate high‐capacity conditions within hospital inpatient units.8
In contrast to care delivered in a dedicated observation unit, observation status is an administrative label applied to patients who do not meet inpatient criteria as defined by third parties such as InterQual. While the decision to admit a patient is ultimately at the discretion of the ordering physician, many hospitals use predetermined criteria to assign observation status to patients admitted to observation and inpatient units.9 Treatment provided under observation status is designated by hospitals and payers as outpatient care, even when delivered in an inpatient bed.10 As outpatient‐designated care, observation cases do not enter publicly available administrative datasets of hospital discharges that have traditionally been used to understand hospital resource utilization, including the National Hospital Discharge Survey and the Kid's Inpatient Database.11, 12
We hypothesize that there has been an increase in observation status care delivered to children in recent years, and that the majority of children under observation were discharged home without converting to inpatient status. To determine trends in pediatric observation status care, we conducted the first longitudinal, multicenter evaluation of observation status code utilization following ED treatment in a sample of US freestanding children's hospitals. In addition, we focused on the most recent year of data among top ranking diagnoses to assess the current state of observation status stay outcomes (including conversion to inpatient status and return visits).
METHODS
Data Source
Data for this multicenter retrospective cohort study were obtained from the Pediatric Health Information System (PHIS). Freestanding children's hospital's participating in PHIS account for approximately 20% of all US tertiary care children's hospitals. The PHIS hospitals provide resource utilization data including patient demographics, International Classification of Diseases, Ninth Revision (ICD‐9) diagnosis and procedure codes, and charges applied to each stay, including room and nursing charges. Data were de‐identified prior to inclusion in the database, however encrypted identification numbers allowed for tracking individual patients across admissions. Data quality and reliability were assured through a joint effort between the Child Health Corporation of America (CHCA; Shawnee Mission, KS) and participating hospitals as described previously.13, 14 In accordance with the Common Rule (45 CFR 46.102(f)) and the policies of The Children's Hospital of Philadelphia Institutional Review Board, this research, using a de‐identified dataset, was considered exempt from review.
Hospital Selection
Each year from 2004 to 2009, there were 18 hospitals participating in PHIS that reported data from both inpatient discharges and outpatient visits (including observation status discharges). To assess data quality for observation status stays, we evaluated observation status discharges for the presence of associated observation billing codes applied to charge records reported to PHIS including: 1) observation per hour, 2) ED observation time, or 3) other codes mentioning observation in the hospital charge master description document. The 16 hospitals with observation charges assigned to at least 90% of observation status discharges in each study year were selected for analysis.
Visit Identification
Within the 16 study hospitals, we identified all visits between January 1, 2004 and December 31, 2009 with ED facility charges. From these ED visits, we included any stays designated by the hospital as observation or inpatient status, excluding transfers and ED discharges.
Variable Definitions
Hospitals submitting records to PHIS assigned a single patient type to the episode of care. The Observation patient type was assigned to patients discharged from observation status. Although the duration of observation is often less than 24 hours, hospitals may allow a patient to remain under observation for longer durations.15, 16 Duration of stay is not defined precisely enough within PHIS to determine hours of inpatient care. Therefore, length of stay (LOS) was not used to determine observation status stays.
The Inpatient patient type was assigned to patients who were discharged from inpatient status, including those patients admitted to inpatient care from the ED and also those who converted to inpatient status from observation. Patients who converted from observation status to inpatient status during the episode of care could be identified through the presence of observation charge codes as described above.
Given the potential for differences in the application of observation status, we also identified 1‐Day Stays where discharge occurred on the day of, or the day following, an inpatient status admission. These 1‐Day Stays represent hospitalizations that may, by their duration, be suitable for care in an observation unit. We considered discharges in the Observation and 1‐Day Stay categories to be Short‐Stays.
DATA ANALYSIS
For each of the 6 years of study, we calculated the following proportions to determine trends over time: 1) the number of Observation Status admissions from the ED as a proportion of the total number of ED visits resulting in Observation or Inpatient admission, and 2) the number of 1‐Day Stays admitted from the ED as a proportion of the total number of ED visits resulting in Observation or Inpatient admissions. Trends were analyzed using linear regression. Trends were also calculated for the total volume of admissions from the ED and the case‐mix index (CMI). CMI was assessed to evaluate for changes in the severity of illness for children admitted from the ED over the study period. Each hospital's CMI was calculated as an average of their Observation and Inpatient Status discharges' charge weights during the study period. Charge weights were calculated at the All Patient Refined Diagnosis Related Groups (APR‐DRG)/severity of illness level (3M Health Information Systems, St Paul, MN) and were normalized national average charges derived by Thomson‐Reuters from their Pediatric Projected National Database. Weights were then assigned to each discharge based on the discharge's APR‐DRG and severity level assignment.
To assess the current outcomes for observation, we analyzed stays with associated observation billing codes from the most recent year of available data (2009). Stays with Observation patient type were considered to have been discharged from observation, while those with an Inpatient Status patient type were considered to have converted to an inpatient admission during the observation period.
Using the 2009 data, we calculated descriptive statistics for patient characteristics (eg, age, gender, payer) comparing Observation Stays, 1‐Day Stays, and longer‐duration Inpatient admissions using chi‐square statistics. Age was categorized using the American Academy of Pediatrics groupings: <30 days, 30 days1 year, 12 years, 34 years, 512 years, 1317 years, >18 years. Designated payer was categorized into government, private, and other, including self‐pay and uninsured groups.
We used the Severity Classification Systems (SCS) developed for pediatric emergency care to estimate severity of illness for the visit.17 In this 5‐level system, each ICD‐9 diagnosis code is associated with a score related to the intensity of ED resources needed to care for a child with that diagnosis. In our analyses, each case was assigned the maximal SCS category based on the highest severity ICD‐9 code associated with the stay. Within the SCS, a score of 1 indicates minor illness (eg, diaper dermatitis) and 5 indicates major illness (eg, septic shock). The proportions of visits within categorical SCS scores were compared for Observation Stays, 1‐Day Stays, and longer‐duration Inpatient admissions using chi‐square statistics.
We determined the top 10 ranking diagnoses for which children were admitted from the ED in 2009 using the Diagnosis Grouping System (DGS).18 The DGS was designed specifically to categorize pediatric ED visits into clinically meaningful groups. The ICD‐9 code for the principal discharge diagnosis was used to assign records to 1 of the 77 DGS subgroups. Within each of the top ranking DGS subgroups, we determined the proportion of Observation Stays, 1‐Day Stays, and longer‐duration Inpatient admissions.
To provide clinically relevant outcomes of Observation Stays for common conditions, we selected stays with observation charges from within the top 10 ranking observation stay DGS subgroups in 2009. Outcomes for observation included: 1) immediate outcome of the observation stay (ie, discharge or conversion to inpatient status), 2) return visits to the ED in the 3 days following observation, and 3) readmissions to the hospital in the 3 and 30 days following observation. Bivariate comparisons of return visits and readmissions for Observation versus 1‐Day Stays within DGS subgroups were analyzed using chi‐square tests. Multivariate analyses of return visits and readmissions were conducted using Generalized Estimating Equations adjusting for severity of illness by SCS score and clustering by hospital. To account for local practice patterns, we also adjusted for a grouped treatment variable that included the site level proportion of children admitted to Observation Status, 1‐Day‐Stays, and longer Inpatient admissions. All statistical analyses were performed using SAS (version 9.2, SAS Institute, Inc, Cary, NC); P values <0.05 were considered statistically significant.
RESULTS
Trends in Short‐Stays
An increase in proportion of Observation Stays was mirrored by a decrease in proportion of 1‐Day Stays over the study period (Figure 1). In 2009, there were 1.4 times more Observation Stays than 1‐Day Stays (25,653 vs 18,425) compared with 14,242 and 20,747, respectively, in 2004. This shift toward more Observation Stays occurred as hospitals faced a 16% increase in the total number of admissions from the ED (91,318 to 108,217) and change in CMI from 1.48 to 1.51. Over the study period, roughly 40% of all admissions from the ED were Short‐Stays (Observation and 1‐Day Stays). Median LOS for Observation Status stays was 1 day (interquartile range [IQR]: 11).
Patient Characteristics in 2009
Table 1 presents comparisons between Observation, 1‐Day Stays, and longer‐duration Inpatient admissions. Of potential clinical significance, children under Observation Status were slightly younger (median, 4.0 years; IQR: 1.310.0) when compared with children admitted for 1‐Day Stays (median, 5.0 years; IQR: 1.411.4; P < 0.001) and longer‐duration Inpatient stays (median, 4.7 years; IQR: 0.912.2; P < 0.001). Nearly two‐thirds of Observation Status stays had SCS scores of 3 or lower compared with less than half of 1‐Day Stays and longer‐duration Inpatient admissions.
| Short‐Stays | LOS >1 Day | |||||
|---|---|---|---|---|---|---|
| Observation | 1‐Day Stay | Longer Admission | ||||
| N = 25,653* (24%) | N = 18,425* (17%) | P Value Comparing Observation to 1‐Day Stay | N = 64,139* (59%) | P Value Comparing Short‐Stays to LOS >1 Day | ||
| ||||||
| Sex | Male | 14,586 (57) | 10,474 (57) | P = 0.663 | 34,696 (54) | P < 0.001 |
| Female | 11,000 (43) | 7,940 (43) | 29,403 (46) | |||
| Payer | Government | 13,247 (58) | 8,944 (55) | P < 0.001 | 35,475 (61) | P < 0.001 |
| Private | 7,123 (31) | 5,105 (32) | 16,507 (28) | |||
| Other | 2,443 (11) | 2,087 (13) | 6,157 (11) | |||
| Age | <30 days | 793 (3) | 687 (4) | P < 0.001 | 3,932 (6) | P < 0.001 |
| 30 days1 yr | 4,499 (17) | 2,930 (16) | 13,139 (21) | |||
| 12 yr | 5,793 (23) | 3,566 (19) | 10,229 (16) | |||
| 34 yr | 3,040 (12) | 2,056 (11) | 5,551 (9) | |||
| 512 yr | 7,427 (29) | 5,570 (30) | 17,057 (27) | |||
| 1317 yr | 3,560 (14) | 3,136 (17) | 11,860 (18) | |||
| >17 yr | 541 (2) | 480 (3) | 2,371 (4) | |||
| Race | White | 17,249 (70) | 12,123 (70) | P < 0.001 | 40,779 (67) | P <0.001 |
| Black | 6,298 (25) | 4,216 (25) | 16,855 (28) | |||
| Asian | 277 (1) | 295 (2) | 995 (2) | |||
| Other | 885 (4) | 589 (3) | 2,011 (3) | |||
| SCS | 1 Minor illness | 64 (<1) | 37 (<1) | P < 0.001 | 84 (<1) | P < 0.001 |
| 2 | 1,190 (5) | 658 (4) | 1,461 (2) | |||
| 3 | 14,553 (57) | 7,617 (42) | 20,760 (33) | |||
| 4 | 8,994 (36) | 9,317 (51) | 35,632 (56) | |||
| 5 Major illness | 490 (2) | 579 (3) | 5,689 (9) | |||
In 2009, the top 10 DGS subgroups accounted for half of all admissions from the ED. The majority of admissions for extremity fractures, head trauma, dehydration, and asthma were Short‐Stays, as were roughly 50% of admissions for seizures, appendicitis, and gastroenteritis (Table 2). Respiratory infections and asthma were the top 1 and 2 ranking DGS subgroups for Observation Stays, 1‐Day Stays, and longer‐duration Inpatient admissions. While rank order differed, 9 of the 10 top ranking Observation Stay DGS subgroups were also top ranking DGS subgroups for 1‐Day Stays. Gastroenteritis ranked 10th among Observation Stays and 11th among 1‐Day Stays. Diabetes mellitus ranked 26th among Observation Stays compared with 8th among 1‐Day Stays.
| Short‐Stays | LOS >1 Day | ||
|---|---|---|---|
| % Observation | % 1‐Day Stay | % Longer Admission | |
| |||
| All admissions from the ED | 23.7 | 17.0 | 59.3 |
| n = 108,217 | |||
| Respiratory infections | 22.3 | 15.3 | 62.4 |
| n = 14,455 (13%) | |||
| Asthma | 32.0 | 23.8 | 44.2 |
| n = 8,853 (8%) | |||
| Other GI diseases | 24.1 | 16.2 | 59.7 |
| n = 6,519 (6%) | |||
| Appendicitis | 21.0 | 29.5 | 49.5 |
| n = 4,480 (4%) | |||
| Skin infections | 20.7 | 14.3 | 65.0 |
| n = 4,743 (4%) | |||
| Seizures | 29.5 | 22 | 48.5 |
| n = 4,088 (4%) | |||
| Extremity fractures | 49.4 | 20.5 | 30.1 |
| n = 3,681 (3%) | |||
| Dehydration | 37.8 | 19.0 | 43.2 |
| n = 2,773 (3%) | |||
| Gastroenteritis | 30.3 | 18.7 | 50.9 |
| n = 2,603 (2%) | |||
| Head trauma | 44.1 | 43.9 | 32.0 |
| n = 2,153 (2%) | |||
Average maximum SCS scores were clinically comparable for Observation and 1‐Day Stays and generally lower than for longer‐duration Inpatient admissions within the top 10 most common DGS subgroups. Average maximum SCS scores were statistically lower for Observation Stays compared with 1‐Day Stays for respiratory infections (3.2 vs 3.4), asthma (3.4 vs 3.6), diabetes (3.5 vs 3.8), gastroenteritis (3.0 vs 3.1), other gastrointestinal diseases (3.2 vs 3.4), head trauma (3.3 vs 3.5), and extremity fractures (3.2 vs 3.4) (P < 0.01). There were no differences in SCS scores for skin infections (SCS = 3.0) and appendicitis (SCS = 4.0) when comparing Observation and 1‐Day Stays.
Outcomes for Observation Stays in 2009
Within 6 of the top 10 DGS subgroups for Observation Stays, >75% of patients were discharged home from Observation Status (Table 3). Mean LOS for stays that converted from Observation to Inpatient Status ranged from 2.85 days for extremity fractures to 4.66 days for appendicitis.
| Return to ED in 3 Days n = 421 (1.6%) | Hospital Readmissions in 3 Days n = 247 (1.0%) | Hospital Readmissions in 30 Days n = 819 (3.2%) | ||
|---|---|---|---|---|
| DGS subgroup | % Discharged From Observation | Adjusted* Odds Ratio (95% CI) | Adjusted* Odds Ratio (95% CI) | Adjusted* Odds Ratio (95% CI) |
| ||||
| Respiratory infections | 72 | 1.1 (0.71.8) | 0.8 (0.51.3) | 0.9 (0.71.3) |
| Asthma | 80 | 1.3 (0.63.0) | 1.0 (0.61.8) | 0.5 (0.31.0) |
| Other GI diseases | 74 | 0.8 (0.51.3) | 2.2 (1.33.8) | 1.0 (0.71.5) |
| Appendicitis | 82 | NE | NE | NE |
| Skin infections | 68 | 1.8 (0.84.4) | 1.4 (0.45.3) | 0.9 (0.61.6) |
| Seizures | 79 | 0.8 (0.41.6) | 0.8 (0.31.8) | 0.7 (0.51.0) |
| Extremity fractures | 92 | 0.9 (0.42.1) | 0.2 (01.3) | 1.2 (0.53.2) |
| Dehydration | 81 | 0.9 (0.61.4) | 0.8 (0.31.9) | 0.7 (0.41.1) |
| Gastroenteritis | 74 | 0.9 (0.42.0) | 0.6 (0.41.2) | 0.6 (0.41) |
| Head trauma | 92 | 0.6 (0.21.7) | 0.3 (02.1) | 1.0 (0.42.8) |
Among children with Observation Stays for 1 of the top 10 DGS subgroups, adjusted return ED visit rates were <3% and readmission rates were <1.6% within 3 days following the index stay. Thirty‐day readmission rates were highest following observation for other GI illnesses and seizures. In unadjusted analysis, Observation Stays for asthma, respiratory infections, and skin infections were associated with greater proportions of return ED visits when compared with 1‐Day Stays. Differences were no longer statistically significant after adjusting for SCS score, clustering by hospital, and the grouped treatment variable. Adjusted odds of readmission were significantly higher at 3 days following observation for other GI illnesses and lower at 30 days following observation for seizures when compared with 1‐Day Stays (Table 3).
DISCUSSION
In this first, multicenter longitudinal study of pediatric observation following an ED visit, we found that Observation Status code utilization has increased steadily over the past 6 years and, in 2007, the proportion of children admitted to observation status surpassed the proportion of children experiencing a 1‐day inpatient admission. Taken together, Short‐Stays made up more than 40% of the hospital‐based care delivered to children admitted from an ED. Stable trends in CMI over time suggest that observation status may be replacing inpatient status designated care for pediatric Short‐Stays in these hospitals. Our findings suggest the lines between outpatient observation and short‐stay inpatient care are becoming increasingly blurred. These trends have occurred in the setting of changing policies for hospital reimbursement, requirements for patients to meet criteria to qualify for inpatient admissions, and efforts to avoid stays deemed unnecessary or inappropriate by their brief duration.19 Therefore there is a growing need to understand the impact of children under observation on the structure, delivery, and financing of acute hospital care for children.
Our results also have implications for pediatric health services research that relies on hospital administrative databases that do not contain observation stays. Currently, observation stays are systematically excluded from many inpatient administrative datasets.11, 12 Analyses of datasets that do not account for observation stays likely result in underestimation of hospitalization rates and hospital resource utilization for children. This may be particularly important for high‐volume conditions, such as asthma and acute infections, for which children commonly require brief periods of hospital‐based care beyond an ED encounter. Data from pediatric observation status admissions should be consistently included in hospital administrative datasets to allow for more comprehensive analyses of hospital resource utilization among children.
Prior research has shown that the diagnoses commonly treated in pediatric observation units overlap with the diagnoses for which children experience 1‐Day Stays.1, 20 We found a similar pattern of conditions for which children were under Observation Status and 1‐Day Stays with comparable severity of illness between the groups in terms of SCS scores. Our findings imply a need to determine how and why hospitals differentiate Observation Status from 1‐Day‐Stay groups in order to improve the assignment of observation status. Assuming continued pressures from payers to provide more care in outpatient or observation settings, there is potential for expansion of dedicated observation services for children in the US. Without designated observation units or processes to group patients with lower severity conditions, there may be limited opportunities to realize more efficient hospital care simply through the application of the label of observation status.
For more than 30 years, observation services have been provided to children who require a period of monitoring to determine their response to therapy and the need for acute inpatient admission from the ED.21While we were not able to determine the location of care for observation status patients in this study, we know that few children's hospitals have dedicated observation units and, even when an observation unit is present, not all observation status patients are cared for in dedicated observation units.9 This, in essence, means that most children under observation status are cared for in virtual observation by inpatient teams using inpatient beds. If observation patients are treated in inpatient beds and consume the same resources as inpatients, then cost‐savings based on reimbursement contracts with payers may not reflect an actual reduction in services. Pediatric institutions will need to closely monitor the financial implications of observation status given the historical differences in payment for observation and inpatient care.
With more than 70% of children being discharged home following observation, our results are comparable to the published literature2, 5, 6, 22, 23 and guidelines for observation unit operations.24 Similar to prior studies,4, 15, 2530 our results also indicate that return visits and readmissions following observation are uncommon events. Our findings can serve as initial benchmarks for condition‐specific outcomes for pediatric observation care. Studies are needed both to identify the clinical characteristics predictive of successful discharge home from observation and to explore the hospital‐to‐hospital variability in outcomes for observation. Such studies are necessary to identify the most successful healthcare delivery models for pediatric observation stays.
LIMITATIONS
The primary limitation to our results is that data from a subset of freestanding children's hospitals may not reflect observation stays at other children's hospitals or the community hospitals that care for children across the US. Only 18 of 42 current PHIS member hospitals have provided both outpatient visit and inpatient stay data for each year of the study period and were considered eligible. In an effort to ensure the quality of observation stay data, we included the 16 hospitals that assigned observation charges to at least 90% of their observation status stays in the PHIS database. The exclusion of the 2 hospitals where <90% of observation status patients were assigned observation charges likely resulted in an underestimation of the utilization of observation status.
Second, there is potential for misclassification of patient type given institutional variations in the assignment of patient status. The PHIS database does not contain information about the factors that were considered in the assignment of observation status. At the time of admission from the ED, observation or inpatient status is assigned. While this decision is clearly reserved for the admitting physician, the process is not standardized across hospitals.9 Some institutions have Utilization Managers on site to help guide decision‐making, while others allow the assignment to be made by physicians without specific guidance. As a result, some patients may be assigned to observation status at admission and reassigned to inpatient status following Utilization Review, which may bias our results toward overestimation of the number of observation stays that converted to inpatient status.
The third limitation to our results relates to return visits. An accurate assessment of return visits is subject to the patient returning to the same hospital. If children do not return to the same hospital, our results would underestimate return visits and readmissions. In addition, we did not assess the reason for return visit as there was no way to verify if the return visit was truly related to the index visit without detailed chart review. Assuming children return to the same hospital for different reasons, our results would overestimate return visits associated with observation stays. We suspect that many 3‐day return visits result from the progression of acute illness or failure to respond to initial treatment, and 30‐day readmissions reflect recurrent hospital care needs related to chronic illnesses.
Lastly, severity classification is difficult when analyzing administrative datasets without physiologic patient data, and the SCS may not provide enough detail to reveal clinically important differences between patient groups.
CONCLUSIONS
Short‐stay hospitalizations following ED visits are common among children, and the majority of pediatric short‐stays are under observation status. Analyses of inpatient administrative databases that exclude observation stays likely result in an underestimation of hospital resource utilization for children. Efforts are needed to ensure that patients under observation status are accounted for in hospital administrative datasets used for pediatric health services research, and healthcare resource allocation, as it relates to hospital‐based care. While the clinical outcomes for observation patients appear favorable in terms of conversion to inpatient admissions and return visits, the financial implications of observation status care within children's hospitals are currently unknown.
- ,,,,,.Trends in high‐turnover stays among children hospitalized in the United States, 1993–2003.Pediatrics.2009;123(3):996–1002.
- ,,,,.Utilization and unexpected hospitalization rates of a pediatric emergency department 23‐hour observation unit.Pediatr Emerg Care.2008;24(9):589–594.
- ,,.When the patient requires observation not hospitalization.J Nurs Admin.1988;18(10):20–23.
- ,,,.Pediatric observation status beds on an inpatient unit: an integrated care model.Pediatr Emerg Care.2004;20(1):17–21.
- ,,.Use of an observation unit by a pediatric emergency department for common pediatric illnesses.Pediatr Emerg Care.2001;17(5):321–323.
- ,,.The pediatric hybrid observation unit: an analysis of 6477 consecutive patient encounters.Pediatrics.2005;115(5):e535–e542.
- ACEP. Emergency Department Crowding: High‐Impact Solutions. Task Force Report on Boarding.2008. Available at: http://www.acep.org/WorkArea/downloadasset.aspx?id=37960. Accessed July 21, 2010.
- ,,, et al.Children's hospitals do not acutely respond to high occupancy.Pediatrics.2010;125(5):974–981.
- ,,, et al.Differences in observation care practices in US freestanding children's hospitals: are they virtual or real?J Hosp Med.2011. Available at: http://www.cms.gov/transmittals/downloads/R770HO.pdf. Accessed January 10, 2011.
- CMS.Medicare Hospital Manual, Section 455.Department of Health and Human Services, Centers for Medicare and Medicaid Services;2001. Available at: http://www.hcup‐us.ahrq.gov/reports/methods/FinalReportonObservationStatus_v2Final.pdf. Accessed on May 3, 2007.
- HCUP.Methods Series Report #2002–3. Observation Status Related to U.S. Hospital Records. Healthcare Cost and Utilization Project.Rockville, MD:Agency for Healthcare Research and Quality;2002.
- ,.Design and operation of the National Hospital Discharge Survey: 1988 redesign.Vital Health Stat.2000;1(39):1–43.
- ,,,.Corticosteroids and mortality in children with bacterial meningitis.JAMA.2008;299(17):2048–2055.
- ,,,,.Intravenous immunoglobulin in children with streptococcal toxic shock syndrome.Clin Infect Dis.2009;49(9):1369–1376.
- ,,,.Impact of a short stay unit on asthma patients admitted to a tertiary pediatric hospital.Qual Manag Health Care.1997;6(1):14–22.
- ,,.An observation unit in a pediatric emergency department: one children's hospital's experience.J Emerg Nurs.2002;28(5):407–413.
- ,,,.Developing a diagnosis‐based severity classification system for use in emergency medical systems for children. Pediatric Academic Societies' Annual Meeting, Platform Presentation; Toronto, Canada;2007.
- ,,,,.A new diagnosis grouping system for child emergency department visits.Acad Emerg Med.2010;17(2):204–213.
- .Observation medicine: the healthcare system's tincture of time. In: Graff LG, ed.Principles of Observation Medicine.American College of Emergency Physicians;2010. Available at: http://www. acep.org/content.aspx?id=46142. Accessed February 18, 2011.
- ,,,,.High turnover stays for pediatric asthma in the United States: analysis of the 2006 Kids' Inpatient Database.Med Care.2010;48(9):827–833.
- ,,,,.Pediatric observation units in the United States: a systematic review.J Hosp Med.2010;5(3):172–182.
- ,.Observation unit in childrens hospital—adjunct to delivery and teaching of ambulatory pediatric care.N Y State J Med.1980;80(11):1684–1686.
- ,,.Short stay in an outpatient department. An alternative to hospitalization.Am J Dis Child.1972;123(2):128–132.
- ACEP.Practice Management Committee, American College of Emergency Physicians. Management of Observation Units.Irving, TX:American College of Emergency Physicians;1994.
- ,,,,.Return visits to a pediatric emergency department.Pediatr Emerg Care.2004;20(3):166–171.
- ,.Postreduction management of intussusception in a children's hospital emergency department.Pediatrics.2003;112(6 pt 1):1302–1307.
- ,,,,.Pediatric closed head injuries treated in an observation unit.Pediatr Emerg Care.2005;21(10):639–644.
- ,,,.Use of pediatric observation unit for treatment of children with dehydration caused by gastroenteritis.Pediatr Emerg Care.2006;22(1):1–6.
- ,,,.Children with asthma admitted to a pediatric observation unit.Pediatr Emerg Care.2005;21(10):645–649.
- ,,, et al.How well can hospital readmission be predicted in a cohort of hospitalized children? A retrospective, multicenter study.Pediatrics.2009;123(1):286–293.
Copyright © 2012 Society of Hospital Medicine