User login
Regional Variation in Standardized Costs of Care at Children’s Hospitals
With some areas of the country spending close to 3 times more on healthcare than others, regional variation in healthcare spending has been the focus of national attention.1-7 Since 1973, the Dartmouth Institute has studied regional variation in healthcare utilization and spending and concluded that variation is “unwarranted” because it is driven by providers’ practice patterns rather than differences in medical need, patient preferences, or evidence-based medicine.8-11 However, critics of the Dartmouth Institute’s findings argue that their approach does not adequately adjust for community-level income, and that higher costs in some areas reflect greater patient needs that are not reflected in illness acuity alone.12-14
While Medicare data have made it possible to study variations in spending for the senior population, fragmentation of insurance coverage and nonstandardized data structures make studying the pediatric population more difficult. However, the Children’s Hospital Association’s (CHA) Pediatric Health Information System (PHIS) has made large-scale comparisons more feasible. To overcome challenges associated with using charges and nonuniform cost data, PHIS-derived standardized costs provide new opportunities for comparisons.15,16 Initial analyses using PHIS data showed significant interhospital variations in costs of care,15 but they did not adjust for differences in populations and assess the drivers of variation. A more recent study that controlled for payer status, comorbidities, and illness severity found that intensive care unit (ICU) utilization varied significantly for children hospitalized for asthma, suggesting that hospital practice patterns drive differences in cost.17
This study uses PHIS data to analyze regional variations in standardized costs of care for 3 conditions for which children are hospitalized. To assess potential drivers of variation, the study investigates the effects of patient-level demographic and illness-severity variables as well as encounter-level variables on costs of care. It also estimates cost savings from reducing variation.
METHODS
Data Source
This retrospective cohort study uses the PHIS database (CHA, Overland Park, KS), which includes 48 freestanding children’s hospitals located in noncompeting markets across the United States and accounts for approximately 20% of pediatric hospitalizations. PHIS includes patient demographics, International Classification of Diseases, 9th Revision (ICD-9) diagnosis and procedure codes, as well as hospital charges. In addition to total charges, PHIS reports imaging, laboratory, pharmacy, and “other” charges. The “other” category aggregates clinical, supply, room, and nursing charges (including facility fees and ancillary staff services).
Inclusion Criteria
Inpatient- and observation-status hospitalizations for asthma, diabetic ketoacidosis (DKA), and acute gastroenteritis (AGE) at 46 PHIS hospitals from October 2014 to September 2015 were included. Two hospitals were excluded because of missing data. Hospitalizations for patients >18 years were excluded.
Hospitalizations were categorized by using All Patient Refined-Diagnosis Related Groups (APR-DRGs) version 24 (3M Health Information Systems, St. Paul, MN)18 based on the ICD-9 diagnosis and procedure codes assigned during the episode of care. Analyses included APR-DRG 141 (asthma), primary diagnosis ICD-9 codes 250.11 and 250.13 (DKA), and APR-DRG 249 (AGE). ICD-9 codes were used for DKA for increased specificity.19 These conditions were chosen to represent 3 clinical scenarios: (1) a diagnosis for which hospitals differ on whether certain aspects of care are provided in the ICU (asthma), (2) a diagnosis that frequently includes care in an ICU (DKA), and (3) a diagnosis that typically does not include ICU care (AGE).19
Study Design
To focus the analysis on variation in resource utilization across hospitals rather than variations in hospital item charges, each billed resource was assigned a standardized cost.15,16 For each clinical transaction code (CTC), the median unit cost was calculated for each hospital. The median of the hospital medians was defined as the standardized unit cost for that CTC.
The primary outcome variable was the total standardized cost for the hospitalization adjusted for patient-level demographic and illness-severity variables. Patient demographic and illness-severity covariates included age, race, gender, ZIP code-based median annual household income (HHI), rural-urban location, distance from home ZIP code to the hospital, chronic condition indicator (CCI), and severity-of-illness (SOI). When assessing drivers of variation, encounter-level covariates were added, including length of stay (LOS) in hours, ICU utilization, and 7-day readmission (an imprecise measure to account for quality of care during the index visit). The contribution of imaging, laboratory, pharmacy, and “other” costs was also considered.
Median annual HHI for patients’ home ZIP code was obtained from 2010 US Census data. Community-level HHI, a proxy for socioeconomic status (SES),20,21 was classified into categories based on the 2015 US federal poverty level (FPL) for a family of 422: HHI-1 = ≤ 1.5 × FPL; HHI-2 = 1.5 to 2 × FPL; HHI-3 = 2 to 3 × FPL; HHI-4 = ≥ 3 × FPL. Rural-urban commuting area (RUCA) codes were used to determine the rural-urban classification of the patient’s home.23 The distance from home ZIP code to the hospital was included as an additional control for illness severity because patients traveling longer distances are often more sick and require more resources.24
The Agency for Healthcare Research and Quality CCI classification system was used to identify the presence of a chronic condition.25 For asthma, CCI was flagged if the patient had a chronic condition other than asthma; for DKA, CCI was flagged if the patient had a chronic condition other than DKA; and for AGE, CCI was flagged if the patient had any chronic condition.
The APR-DRG system provides a 4-level SOI score with each APR-DRG category. Patient factors, such as comorbid diagnoses, are considered in severity scores generated through 3M’s proprietary algorithms.18
For the first analysis, the 46 hospitals were categorized into 7 geographic regions based on 2010 US Census Divisions.26 To overcome small hospital sample sizes, Mountain and Pacific were combined into West, and Middle Atlantic and New England were combined into North East. Because PHIS hospitals are located in noncompeting geographic regions, for the second analysis, we examined hospital-level variation (considering each hospital as its own region).
Data Analysis
To focus the analysis on “typical” patients and produce more robust estimates of central tendencies, the top and bottom 5% of hospitalizations with the most extreme standardized costs by condition were trimmed.27 Standardized costs were log-transformed because of their nonnormal distribution and analyzed by using linear mixed models. Covariates were added stepwise to assess the proportion of the variance explained by each predictor. Post-hoc tests with conservative single-step stepwise mutation model corrections for multiple testing were used to compare adjusted costs. Statistical analyses were performed using SAS version 9.3 (SAS Institute, Cary, NC). P values < 0.05 were considered significant. The Children’s Hospital of Philadelphia Institutional Review Board did not classify this study as human subjects research.
RESULTS
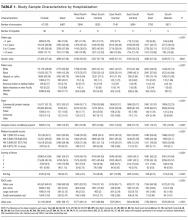

During the study period, there were 26,430 hospitalizations for asthma, 5056 for DKA, and 16,274 for AGE (Table 1).
Variation Across Census Regions
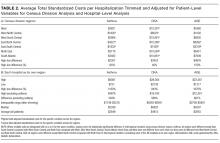
After adjusting for patient-level demographic and illness-severity variables, differences in adjusted total standardized costs remained between regions (P < 0.001). Although no region was an outlier compared to the overall mean for any of the conditions, regions were statistically different in pairwise comparison. The East North Central, South Atlantic, and West South Central regions had the highest adjusted total standardized costs for each of the conditions. The East South Central and West North Central regions had the lowest costs for each of the conditions. Adjusted total standardized costs were 120% higher for asthma ($1920 vs $4227), 46% higher for DKA ($7429 vs $10,881), and 150% higher for AGE ($3316 vs $8292) in the highest-cost region compared with the lowest-cost region (Table 2A).
Variation Within Census Regions

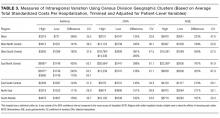
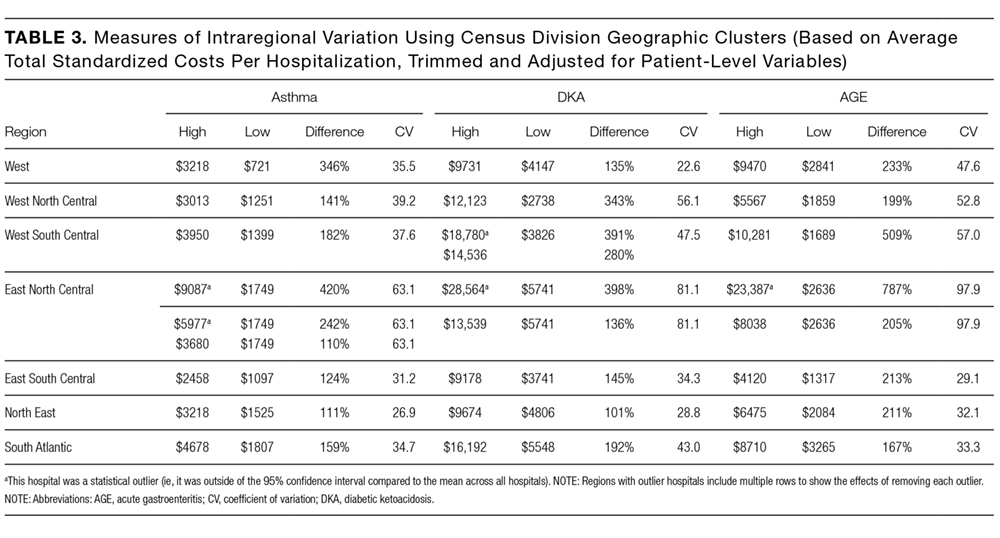
After controlling for patient-level demographic and illness-severity variables, standardized costs were different across hospitals in the same region (P < 0.001; panel A in Figure). This was true for all conditions in each region. Differences between the lowest- and highest-cost hospitals within the same region ranged from 111% to 420% for asthma, 101% to 398% for DKA, and 166% to 787% for AGE (Table 3).
Variation Across Hospitals (Each Hospital as Its Own Region)
One hospital had the highest adjusted standardized costs for all 3 conditions ($9087 for asthma, $28,564 for DKA, and $23,387 for AGE) and was outside of the 95% confidence interval compared with the overall means. The second highest-cost hospitals for asthma ($5977) and AGE ($18,780) were also outside of the 95% confidence interval. After removing these outliers, the difference between the highest- and lowest-cost hospitals was 549% for asthma ($721 vs $4678), 491% for DKA ($2738 vs $16,192), and 681% for AGE ($1317 vs $10,281; Table 2B).
Drivers of Variation Across Census Regions
Patient-level demographic and illness-severity variables explained very little of the variation in standardized costs across regions. For each of the conditions, age, race, gender, community-level HHI, RUCA, and distance from home to the hospital each accounted for <1.5% of variation, while SOI and CCI each accounted for <5%. Overall, patient-level variables explained 5.5%, 3.7%, and 6.7% of variation for asthma, DKA, and AGE.
Encounter-level variables explained a much larger percentage of the variation in costs. LOS accounted for 17.8% of the variation for asthma, 9.8% for DKA, and 8.7% for AGE. ICU utilization explained 6.9% of the variation for asthma and 12.5% for DKA; ICU use was not a major driver for AGE. Seven-day readmissions accounted for <0.5% for each of the conditions. The combination of patient-level and encounter-level variables explained 27%, 24%, and 15% of the variation for asthma, DKA, and AGE.
Drivers of Variation Across Hospitals
For each of the conditions, patient-level demographic variables each accounted for <2% of variation in costs between hospitals. SOI accounted for 4.5% of the variation for asthma and CCI accounted for 5.2% for AGE. Overall, patient-level variables explained 6.9%, 5.3%, and 7.3% of variation for asthma, DKA, and AGE.
Encounter-level variables accounted for a much larger percentage of the variation in cost. LOS explained 25.4% for asthma, 13.3% for DKA, and 14.2% for AGE. ICU utilization accounted for 13.4% for asthma and 21.9% for DKA; ICU use was not a major driver for AGE. Seven-day readmissions accounted for <0.5% for each of the conditions. Together, patient-level and encounter-level variables explained 40%, 36%, and 22% of variation for asthma, DKA, and AGE.
Imaging, Laboratory, Pharmacy, and “Other” Costs
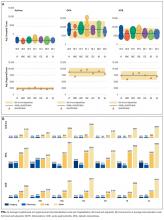
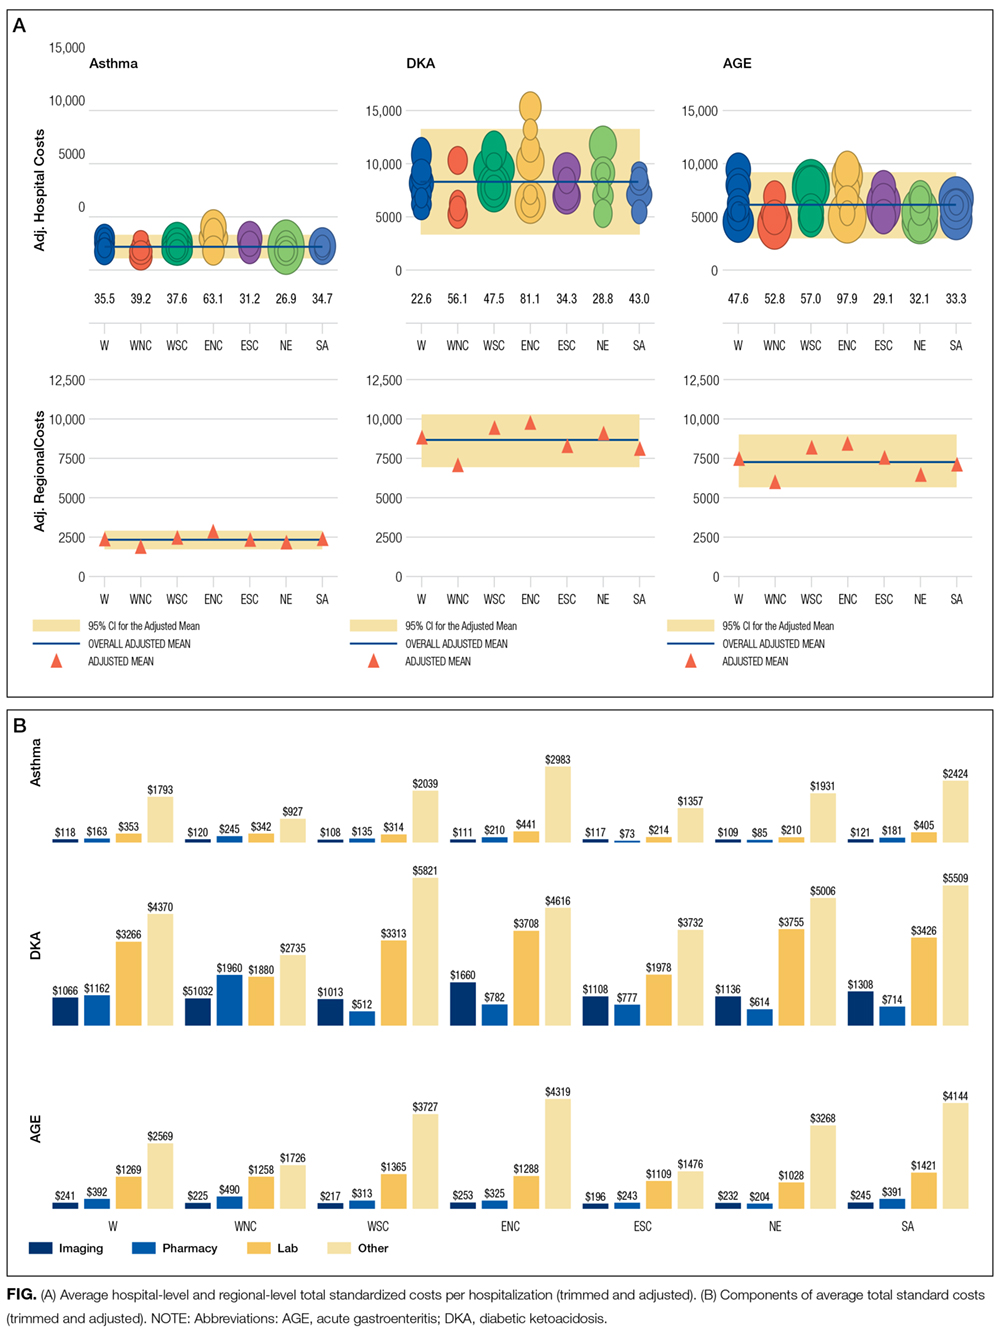
The largest contributor to total costs adjusted for patient-level factors for all conditions was “other,” which aggregates room, nursing, clinical, and supply charges (panel B in Figure). When considering drivers of variation, this category explained >50% for each of the conditions. The next largest contributor to total costs was laboratory charges, which accounted for 15% of the variation across regions for asthma and 11% for DKA. Differences in imaging accounted for 18% of the variation for DKA and 15% for AGE. Differences in pharmacy charges accounted for <4% of the variation for each of the conditions. Adding the 4 cost components to the other patient- and encounter-level covariates, the model explained 81%, 78%, and 72% of the variation across census regions for asthma, DKA, and AGE.
For the hospital-level analysis, differences in “other” remained the largest driver of cost variation. For asthma, “other” explained 61% of variation, while pharmacy, laboratory, and imaging each accounted for <8%. For DKA, differences in imaging accounted for 18% of the variation and laboratory charges accounted for 12%. For AGE, imaging accounted for 15% of the variation. Adding the 4 cost components to the other patient- and encounter-level covariates, the model explained 81%, 72%, and 67% of the variation for asthma, DKA, and AGE.
Cost Savings
If all hospitals in this cohort with adjusted standardized costs above the national PHIS average achieved costs equal to the national PHIS average, estimated annual savings in adjusted standardized costs for these 3 conditions would be $69.1 million. If each hospital with adjusted costs above the average within its census region achieved costs equal to its regional average, estimated annual savings in adjusted standardized costs for these conditions would be $25.2 million.
DISCUSSION
This study reported on the regional variation in costs of care for 3 conditions treated at 46 children’s hospitals across 7 geographic regions, and it demonstrated that variations in costs of care exist in pediatrics. This study used standardized costs to compare utilization patterns across hospitals and adjusted for several patient-level demographic and illness-severity factors, and it found that differences in costs of care for children hospitalized with asthma, DKA, and AGE remained both between and within regions.
These variations are noteworthy, as hospitals strive to improve the value of healthcare. If the higher-cost hospitals in this cohort could achieve costs equal to the national PHIS averages, estimated annual savings in adjusted standardized costs for these conditions alone would equal $69.1 million. If higher-cost hospitals relative to the average in their own region reduced costs to their regional averages, annual standardized cost savings could equal $25.2 million for these conditions.
The differences observed are also significant in that they provide a foundation for exploring whether lower-cost regions or lower-cost hospitals achieve comparable quality outcomes.28 If so, studying what those hospitals do to achieve outcomes more efficiently can serve as the basis for the establishment of best practices.29 Standardizing best practices through protocols, pathways, and care-model redesign can reduce potentially unnecessary spending.30
Our findings showed that patient-level demographic and illness-severity covariates, including community-level HHI and SOI, did not consistently explain cost differences. Instead, LOS and ICU utilization were associated with higher costs.17,19 When considering the effect of the 4 cost components on the variation in total standardized costs between regions and between hospitals, the fact that the “other” category accounted for the largest percent of the variation is not surprising, because the cost of room occupancy and nursing services increases with longer LOS and more time in the ICU. Other individual cost components that were major drivers of variation were laboratory utilization for asthma and imaging for DKA and AGE31 (though they accounted for a much smaller proportion of total adjusted costs).19
To determine if these factors are modifiable, more information is needed to explain why practices differ. Many factors may contribute to varying utilization patterns, including differences in capabilities and resources (in the hospital and in the community) and patient volumes. For example, some hospitals provide continuous albuterol for status asthmaticus only in ICUs, while others provide it on regular units.32 But if certain hospitals do not have adequate resources or volumes to effectively care for certain populations outside of the ICU, their higher-value approach (considering quality and cost) may be to utilize ICU beds, even if some other hospitals care for those patients on non-ICU floors. Another possibility is that family preferences about care delivery (such as how long children stay in the hospital) may vary across regions.33
Other evidence suggests that physician practice and spending patterns are strongly influenced by the practices of the region where they trained.34 Because physicians often practice close to where they trained,35,36 this may partially explain how regional patterns are reinforced.
Even considering all mentioned covariates, our model did not fully explain variation in standardized costs. After adding the cost components as covariates, between one-third and one-fifth of the variation remained unexplained. It is possible that this unexplained variation stemmed from unmeasured patient-level factors.
In addition, while proxies for SES, including community-level HHI, did not significantly predict differences in costs across regions, it is possible that SES affected LOS differently in different regions. Previous studies have suggested that lower SES is associated with longer LOS.37 If this effect is more pronounced in certain regions (potentially because of differences in social service infrastructures), SES may be contributing to variations in cost through LOS.
Our findings were subject to limitations. First, this study only examined 3 diagnoses and did not include surgical or less common conditions. Second, while PHIS includes tertiary care, academic, and freestanding children’s hospitals, it does not include general hospitals, which is where most pediatric patients receive care.38 Third, we used ZIP code-based median annual HHI to account for SES, and we used ZIP codes to determine the distance to the hospital and rural-urban location of patients’ homes. These approximations lack precision because SES and distances vary within ZIP codes.39 Fourth, while adjusted standardized costs allow for comparisons between hospitals, they do not represent actual costs to patients or individual hospitals. Additionally, when determining whether variation remained after controlling for patient-level variables, we included SOI as a reflection of illness-severity at presentation. However, in practice, SOI scores may be assigned partially based on factors determined during the hospitalization.18 Finally, the use of other regional boundaries or the selection of different hospitals may yield different results.
CONCLUSION
This study reveals regional variations in costs of care for 3 inpatient pediatric conditions. Future studies should explore whether lower-cost regions or lower-cost hospitals achieve comparable quality outcomes. To the extent that variation is driven by modifiable factors and lower spending does not compromise outcomes, these data may prompt reviews of care models to reduce unwarranted variation and improve the value of care delivery at local, regional, and national levels.
Disclosure
Internal funds from the CHA and The Children’s Hospital of Philadelphia supported the conduct of this work. The authors have no financial interests, relationships, or affiliations relevant to the subject matter or materials discussed in the manuscript to disclose. The authors have no potential conflicts of interest relevant to the subject matter or materials discussed in the manuscript to disclose
1. Fisher E, Skinner J. Making Sense of Geographic Variations in Health Care: The New IOM Report. 2013; http://healthaffairs.org/blog/2013/07/24/making-sense-of-geographic-variations-in-health-care-the-new-iom-report/. Accessed on April 11, 2014.
With some areas of the country spending close to 3 times more on healthcare than others, regional variation in healthcare spending has been the focus of national attention.1-7 Since 1973, the Dartmouth Institute has studied regional variation in healthcare utilization and spending and concluded that variation is “unwarranted” because it is driven by providers’ practice patterns rather than differences in medical need, patient preferences, or evidence-based medicine.8-11 However, critics of the Dartmouth Institute’s findings argue that their approach does not adequately adjust for community-level income, and that higher costs in some areas reflect greater patient needs that are not reflected in illness acuity alone.12-14
While Medicare data have made it possible to study variations in spending for the senior population, fragmentation of insurance coverage and nonstandardized data structures make studying the pediatric population more difficult. However, the Children’s Hospital Association’s (CHA) Pediatric Health Information System (PHIS) has made large-scale comparisons more feasible. To overcome challenges associated with using charges and nonuniform cost data, PHIS-derived standardized costs provide new opportunities for comparisons.15,16 Initial analyses using PHIS data showed significant interhospital variations in costs of care,15 but they did not adjust for differences in populations and assess the drivers of variation. A more recent study that controlled for payer status, comorbidities, and illness severity found that intensive care unit (ICU) utilization varied significantly for children hospitalized for asthma, suggesting that hospital practice patterns drive differences in cost.17
This study uses PHIS data to analyze regional variations in standardized costs of care for 3 conditions for which children are hospitalized. To assess potential drivers of variation, the study investigates the effects of patient-level demographic and illness-severity variables as well as encounter-level variables on costs of care. It also estimates cost savings from reducing variation.
METHODS
Data Source
This retrospective cohort study uses the PHIS database (CHA, Overland Park, KS), which includes 48 freestanding children’s hospitals located in noncompeting markets across the United States and accounts for approximately 20% of pediatric hospitalizations. PHIS includes patient demographics, International Classification of Diseases, 9th Revision (ICD-9) diagnosis and procedure codes, as well as hospital charges. In addition to total charges, PHIS reports imaging, laboratory, pharmacy, and “other” charges. The “other” category aggregates clinical, supply, room, and nursing charges (including facility fees and ancillary staff services).
Inclusion Criteria
Inpatient- and observation-status hospitalizations for asthma, diabetic ketoacidosis (DKA), and acute gastroenteritis (AGE) at 46 PHIS hospitals from October 2014 to September 2015 were included. Two hospitals were excluded because of missing data. Hospitalizations for patients >18 years were excluded.
Hospitalizations were categorized by using All Patient Refined-Diagnosis Related Groups (APR-DRGs) version 24 (3M Health Information Systems, St. Paul, MN)18 based on the ICD-9 diagnosis and procedure codes assigned during the episode of care. Analyses included APR-DRG 141 (asthma), primary diagnosis ICD-9 codes 250.11 and 250.13 (DKA), and APR-DRG 249 (AGE). ICD-9 codes were used for DKA for increased specificity.19 These conditions were chosen to represent 3 clinical scenarios: (1) a diagnosis for which hospitals differ on whether certain aspects of care are provided in the ICU (asthma), (2) a diagnosis that frequently includes care in an ICU (DKA), and (3) a diagnosis that typically does not include ICU care (AGE).19
Study Design
To focus the analysis on variation in resource utilization across hospitals rather than variations in hospital item charges, each billed resource was assigned a standardized cost.15,16 For each clinical transaction code (CTC), the median unit cost was calculated for each hospital. The median of the hospital medians was defined as the standardized unit cost for that CTC.
The primary outcome variable was the total standardized cost for the hospitalization adjusted for patient-level demographic and illness-severity variables. Patient demographic and illness-severity covariates included age, race, gender, ZIP code-based median annual household income (HHI), rural-urban location, distance from home ZIP code to the hospital, chronic condition indicator (CCI), and severity-of-illness (SOI). When assessing drivers of variation, encounter-level covariates were added, including length of stay (LOS) in hours, ICU utilization, and 7-day readmission (an imprecise measure to account for quality of care during the index visit). The contribution of imaging, laboratory, pharmacy, and “other” costs was also considered.
Median annual HHI for patients’ home ZIP code was obtained from 2010 US Census data. Community-level HHI, a proxy for socioeconomic status (SES),20,21 was classified into categories based on the 2015 US federal poverty level (FPL) for a family of 422: HHI-1 = ≤ 1.5 × FPL; HHI-2 = 1.5 to 2 × FPL; HHI-3 = 2 to 3 × FPL; HHI-4 = ≥ 3 × FPL. Rural-urban commuting area (RUCA) codes were used to determine the rural-urban classification of the patient’s home.23 The distance from home ZIP code to the hospital was included as an additional control for illness severity because patients traveling longer distances are often more sick and require more resources.24
The Agency for Healthcare Research and Quality CCI classification system was used to identify the presence of a chronic condition.25 For asthma, CCI was flagged if the patient had a chronic condition other than asthma; for DKA, CCI was flagged if the patient had a chronic condition other than DKA; and for AGE, CCI was flagged if the patient had any chronic condition.
The APR-DRG system provides a 4-level SOI score with each APR-DRG category. Patient factors, such as comorbid diagnoses, are considered in severity scores generated through 3M’s proprietary algorithms.18
For the first analysis, the 46 hospitals were categorized into 7 geographic regions based on 2010 US Census Divisions.26 To overcome small hospital sample sizes, Mountain and Pacific were combined into West, and Middle Atlantic and New England were combined into North East. Because PHIS hospitals are located in noncompeting geographic regions, for the second analysis, we examined hospital-level variation (considering each hospital as its own region).
Data Analysis
To focus the analysis on “typical” patients and produce more robust estimates of central tendencies, the top and bottom 5% of hospitalizations with the most extreme standardized costs by condition were trimmed.27 Standardized costs were log-transformed because of their nonnormal distribution and analyzed by using linear mixed models. Covariates were added stepwise to assess the proportion of the variance explained by each predictor. Post-hoc tests with conservative single-step stepwise mutation model corrections for multiple testing were used to compare adjusted costs. Statistical analyses were performed using SAS version 9.3 (SAS Institute, Cary, NC). P values < 0.05 were considered significant. The Children’s Hospital of Philadelphia Institutional Review Board did not classify this study as human subjects research.
RESULTS
During the study period, there were 26,430 hospitalizations for asthma, 5056 for DKA, and 16,274 for AGE (Table 1).
Variation Across Census Regions
After adjusting for patient-level demographic and illness-severity variables, differences in adjusted total standardized costs remained between regions (P < 0.001). Although no region was an outlier compared to the overall mean for any of the conditions, regions were statistically different in pairwise comparison. The East North Central, South Atlantic, and West South Central regions had the highest adjusted total standardized costs for each of the conditions. The East South Central and West North Central regions had the lowest costs for each of the conditions. Adjusted total standardized costs were 120% higher for asthma ($1920 vs $4227), 46% higher for DKA ($7429 vs $10,881), and 150% higher for AGE ($3316 vs $8292) in the highest-cost region compared with the lowest-cost region (Table 2A).
Variation Within Census Regions
After controlling for patient-level demographic and illness-severity variables, standardized costs were different across hospitals in the same region (P < 0.001; panel A in Figure). This was true for all conditions in each region. Differences between the lowest- and highest-cost hospitals within the same region ranged from 111% to 420% for asthma, 101% to 398% for DKA, and 166% to 787% for AGE (Table 3).
Variation Across Hospitals (Each Hospital as Its Own Region)
One hospital had the highest adjusted standardized costs for all 3 conditions ($9087 for asthma, $28,564 for DKA, and $23,387 for AGE) and was outside of the 95% confidence interval compared with the overall means. The second highest-cost hospitals for asthma ($5977) and AGE ($18,780) were also outside of the 95% confidence interval. After removing these outliers, the difference between the highest- and lowest-cost hospitals was 549% for asthma ($721 vs $4678), 491% for DKA ($2738 vs $16,192), and 681% for AGE ($1317 vs $10,281; Table 2B).
Drivers of Variation Across Census Regions
Patient-level demographic and illness-severity variables explained very little of the variation in standardized costs across regions. For each of the conditions, age, race, gender, community-level HHI, RUCA, and distance from home to the hospital each accounted for <1.5% of variation, while SOI and CCI each accounted for <5%. Overall, patient-level variables explained 5.5%, 3.7%, and 6.7% of variation for asthma, DKA, and AGE.
Encounter-level variables explained a much larger percentage of the variation in costs. LOS accounted for 17.8% of the variation for asthma, 9.8% for DKA, and 8.7% for AGE. ICU utilization explained 6.9% of the variation for asthma and 12.5% for DKA; ICU use was not a major driver for AGE. Seven-day readmissions accounted for <0.5% for each of the conditions. The combination of patient-level and encounter-level variables explained 27%, 24%, and 15% of the variation for asthma, DKA, and AGE.
Drivers of Variation Across Hospitals
For each of the conditions, patient-level demographic variables each accounted for <2% of variation in costs between hospitals. SOI accounted for 4.5% of the variation for asthma and CCI accounted for 5.2% for AGE. Overall, patient-level variables explained 6.9%, 5.3%, and 7.3% of variation for asthma, DKA, and AGE.
Encounter-level variables accounted for a much larger percentage of the variation in cost. LOS explained 25.4% for asthma, 13.3% for DKA, and 14.2% for AGE. ICU utilization accounted for 13.4% for asthma and 21.9% for DKA; ICU use was not a major driver for AGE. Seven-day readmissions accounted for <0.5% for each of the conditions. Together, patient-level and encounter-level variables explained 40%, 36%, and 22% of variation for asthma, DKA, and AGE.
Imaging, Laboratory, Pharmacy, and “Other” Costs
The largest contributor to total costs adjusted for patient-level factors for all conditions was “other,” which aggregates room, nursing, clinical, and supply charges (panel B in Figure). When considering drivers of variation, this category explained >50% for each of the conditions. The next largest contributor to total costs was laboratory charges, which accounted for 15% of the variation across regions for asthma and 11% for DKA. Differences in imaging accounted for 18% of the variation for DKA and 15% for AGE. Differences in pharmacy charges accounted for <4% of the variation for each of the conditions. Adding the 4 cost components to the other patient- and encounter-level covariates, the model explained 81%, 78%, and 72% of the variation across census regions for asthma, DKA, and AGE.
For the hospital-level analysis, differences in “other” remained the largest driver of cost variation. For asthma, “other” explained 61% of variation, while pharmacy, laboratory, and imaging each accounted for <8%. For DKA, differences in imaging accounted for 18% of the variation and laboratory charges accounted for 12%. For AGE, imaging accounted for 15% of the variation. Adding the 4 cost components to the other patient- and encounter-level covariates, the model explained 81%, 72%, and 67% of the variation for asthma, DKA, and AGE.
Cost Savings
If all hospitals in this cohort with adjusted standardized costs above the national PHIS average achieved costs equal to the national PHIS average, estimated annual savings in adjusted standardized costs for these 3 conditions would be $69.1 million. If each hospital with adjusted costs above the average within its census region achieved costs equal to its regional average, estimated annual savings in adjusted standardized costs for these conditions would be $25.2 million.
DISCUSSION
This study reported on the regional variation in costs of care for 3 conditions treated at 46 children’s hospitals across 7 geographic regions, and it demonstrated that variations in costs of care exist in pediatrics. This study used standardized costs to compare utilization patterns across hospitals and adjusted for several patient-level demographic and illness-severity factors, and it found that differences in costs of care for children hospitalized with asthma, DKA, and AGE remained both between and within regions.
These variations are noteworthy, as hospitals strive to improve the value of healthcare. If the higher-cost hospitals in this cohort could achieve costs equal to the national PHIS averages, estimated annual savings in adjusted standardized costs for these conditions alone would equal $69.1 million. If higher-cost hospitals relative to the average in their own region reduced costs to their regional averages, annual standardized cost savings could equal $25.2 million for these conditions.
The differences observed are also significant in that they provide a foundation for exploring whether lower-cost regions or lower-cost hospitals achieve comparable quality outcomes.28 If so, studying what those hospitals do to achieve outcomes more efficiently can serve as the basis for the establishment of best practices.29 Standardizing best practices through protocols, pathways, and care-model redesign can reduce potentially unnecessary spending.30
Our findings showed that patient-level demographic and illness-severity covariates, including community-level HHI and SOI, did not consistently explain cost differences. Instead, LOS and ICU utilization were associated with higher costs.17,19 When considering the effect of the 4 cost components on the variation in total standardized costs between regions and between hospitals, the fact that the “other” category accounted for the largest percent of the variation is not surprising, because the cost of room occupancy and nursing services increases with longer LOS and more time in the ICU. Other individual cost components that were major drivers of variation were laboratory utilization for asthma and imaging for DKA and AGE31 (though they accounted for a much smaller proportion of total adjusted costs).19
To determine if these factors are modifiable, more information is needed to explain why practices differ. Many factors may contribute to varying utilization patterns, including differences in capabilities and resources (in the hospital and in the community) and patient volumes. For example, some hospitals provide continuous albuterol for status asthmaticus only in ICUs, while others provide it on regular units.32 But if certain hospitals do not have adequate resources or volumes to effectively care for certain populations outside of the ICU, their higher-value approach (considering quality and cost) may be to utilize ICU beds, even if some other hospitals care for those patients on non-ICU floors. Another possibility is that family preferences about care delivery (such as how long children stay in the hospital) may vary across regions.33
Other evidence suggests that physician practice and spending patterns are strongly influenced by the practices of the region where they trained.34 Because physicians often practice close to where they trained,35,36 this may partially explain how regional patterns are reinforced.
Even considering all mentioned covariates, our model did not fully explain variation in standardized costs. After adding the cost components as covariates, between one-third and one-fifth of the variation remained unexplained. It is possible that this unexplained variation stemmed from unmeasured patient-level factors.
In addition, while proxies for SES, including community-level HHI, did not significantly predict differences in costs across regions, it is possible that SES affected LOS differently in different regions. Previous studies have suggested that lower SES is associated with longer LOS.37 If this effect is more pronounced in certain regions (potentially because of differences in social service infrastructures), SES may be contributing to variations in cost through LOS.
Our findings were subject to limitations. First, this study only examined 3 diagnoses and did not include surgical or less common conditions. Second, while PHIS includes tertiary care, academic, and freestanding children’s hospitals, it does not include general hospitals, which is where most pediatric patients receive care.38 Third, we used ZIP code-based median annual HHI to account for SES, and we used ZIP codes to determine the distance to the hospital and rural-urban location of patients’ homes. These approximations lack precision because SES and distances vary within ZIP codes.39 Fourth, while adjusted standardized costs allow for comparisons between hospitals, they do not represent actual costs to patients or individual hospitals. Additionally, when determining whether variation remained after controlling for patient-level variables, we included SOI as a reflection of illness-severity at presentation. However, in practice, SOI scores may be assigned partially based on factors determined during the hospitalization.18 Finally, the use of other regional boundaries or the selection of different hospitals may yield different results.
CONCLUSION
This study reveals regional variations in costs of care for 3 inpatient pediatric conditions. Future studies should explore whether lower-cost regions or lower-cost hospitals achieve comparable quality outcomes. To the extent that variation is driven by modifiable factors and lower spending does not compromise outcomes, these data may prompt reviews of care models to reduce unwarranted variation and improve the value of care delivery at local, regional, and national levels.
Disclosure
Internal funds from the CHA and The Children’s Hospital of Philadelphia supported the conduct of this work. The authors have no financial interests, relationships, or affiliations relevant to the subject matter or materials discussed in the manuscript to disclose. The authors have no potential conflicts of interest relevant to the subject matter or materials discussed in the manuscript to disclose
1. Fisher E, Skinner J. Making Sense of Geographic Variations in Health Care: The New IOM Report. 2013; http://healthaffairs.org/blog/2013/07/24/making-sense-of-geographic-variations-in-health-care-the-new-iom-report/. Accessed on April 11, 2014.
1. Fisher E, Skinner J. Making Sense of Geographic Variations in Health Care: The New IOM Report. 2013; http://healthaffairs.org/blog/2013/07/24/making-sense-of-geographic-variations-in-health-care-the-new-iom-report/. Accessed on April 11, 2014.
© 2017 Society of Hospital Medicine
OUs and Patient Outcomes
Many pediatric hospitalizations are of short duration, and more than half of short‐stay hospitalizations are designated as observation status.[1, 2] Observation status is an administrative label assigned to patients who do not meet hospital or payer criteria for inpatient‐status care. Short‐stay observation‐status patients do not fit in traditional models of emergency department (ED) or inpatient care. EDs often focus on discharging or admitting patients within a matter of hours, whereas inpatient units tend to measure length of stay (LOS) in terms of days[3] and may not have systems in place to facilitate rapid discharge of short‐stay patients.[4] Observation units (OUs) have been established in some hospitals to address the unique care needs of short‐stay patients.[5, 6, 7]
Single‐site reports from children's hospitals with successful OUs have demonstrated shorter LOS and lower costs compared with inpatient settings.[6, 8, 9, 10, 11, 12, 13, 14] No prior study has examined hospital‐level effects of an OU on observation‐status patient outcomes. The Pediatric Health Information System (PHIS) database provides a unique opportunity to explore this question, because unlike other national hospital administrative databases,[15, 16] the PHIS dataset contains information about children under observation status. In addition, we know which PHIS hospitals had a dedicated OU in 2011.7
We hypothesized that overall observation‐status stays in hospitals with a dedicated OU would be of shorter duration with earlier discharges at lower cost than observation‐status stays in hospitals without a dedicated OU. We compared hospitals with and without a dedicated OU on secondary outcomes including rates of conversion to inpatient status and return care for any reason.
METHODS
We conducted a cross‐sectional analysis of hospital administrative data using the 2011 PHIS databasea national administrative database that contains resource utilization data from 43 participating hospitals located in 26 states plus the District of Columbia. These hospitals account for approximately 20% of pediatric hospitalizations in the United States.
For each hospital encounter, PHIS includes patient demographics, up to 41 International Classification of Diseases, Ninth Revision, Clinical Modification (ICD‐9‐CM) diagnoses, up to 41 ICD‐9‐CM procedures, and hospital charges for services. Data are deidentified prior to inclusion, but unique identifiers allow for determination of return visits and readmissions following an index visit for an individual patient. Data quality and reliability are assured jointly by the Children's Hospital Association (formerly Child Health Corporation of America, Overland Park, KS), participating hospitals, and Truven Health Analytics (New York, NY). This study, using administrative data, was not considered human subjects research by the policies of the Cincinnati Children's Hospital Medical Center Institutional Review Board.
Hospital Selection and Hospital Characteristics
The study sample was drawn from the 31 hospitals that reported observation‐status patient data to PHIS in 2011. Analyses were conducted in 2013, at which time 2011 was the most recent year of data. We categorized 14 hospitals as having a dedicated OU during 2011 based on information collected in 2013.7 To summarize briefly, we interviewed by telephone representatives of hospitals responding to an email query as to the presence of a geographically distinct OU for the care of unscheduled patients from the ED. Three of the 14 representatives reported their hospital had 2 OUs, 1 of which was a separate surgical OU. Ten OUs cared for both ED patients and patients with scheduled procedures; 8 units received patients from non‐ED sources. Hospitalists provided staffing in more than half of the OUs.
We attempted to identify administrative data that would signal care delivered in a dedicated OU using hospital charge codes reported to PHIS, but learned this was not possible due to between‐hospital variation in the specificity of the charge codes. Therefore, we were unable to determine if patient care was delivered in a dedicated OU or another setting, such as a general inpatient unit or the ED. Other hospital characteristics available from the PHIS dataset included the number of inpatient beds, ED visits, inpatient admissions, observation‐status stays, and payer mix. We calculated the percentage of ED visits resulting in admission by dividing the number of ED visits with associated inpatient or observation status by the total number of ED visits and the percentage of admissions under observation status by dividing the number of observation‐status stays by the total number of admissions under observation or inpatient status.
Visit Selection and Patient Characteristics
All observation‐status stays regardless of the point of entry into the hospital were eligible for this study. We excluded stays that were birth‐related, included intensive care, or resulted in transfer or death. Patient demographic characteristics used to describe the cohort included age, gender, race/ethnicity, and primary payer. Stays that began in the ED were identified by an emergency room charge within PHIS. Eligible stays were categorized using All Patient Refined Diagnosis Related Groups (APR‐DRGs) version 24 using the ICD‐9‐CM code‐based proprietary 3M software (3M Health Information Systems, St. Paul, MN). We determined the 15 top‐ranking APR‐DRGs among observation‐status stays in hospitals with a dedicated OU and hospitals without. Procedural stays were identified based on procedural APR‐DRGs (eg, tonsil and adenoid procedures) or the presence of an ICD‐9‐CM procedure code (eg, 331 spinal tap).
Measured Outcomes
Outcomes of observation‐status stays were determined within 4 categories: (1) LOS, (2) standardized costs, (3) conversion to inpatient status, and (4) return visits and readmissions. LOS was calculated in terms of nights spent in hospital for all stays by subtracting the discharge date from the admission date and in terms of hours for stays in the 28 hospitals that report admission and discharge hour to the PHIS database. Discharge timing was examined in 4, 6‐hour blocks starting at midnight. Standardized costs were derived from a charge master index that was created by taking the median costs from all PHIS hospitals for each charged service.[17] Standardized costs represent the estimated cost of providing any particular clinical activity but are not the cost to patients, nor do they represent the actual cost to any given hospital. This approach allows for cost comparisons across hospitals, without biases arising from using charges or from deriving costs using hospitals' ratios of costs to charges.[18] Conversion from observation to inpatient status was calculated by dividing the number of inpatient‐status stays with observation codes by the number of observation‐statusonly stays plus the number of inpatient‐status stays with observation codes. All‐cause 3‐day ED return visits and 30‐day readmissions to the same hospital were assessed using patient‐specific identifiers that allowed for tracking of ED return visits and readmissions following the index observation stay.
Data Analysis
Descriptive statistics were calculated for hospital and patient characteristics using medians and interquartile ranges (IQRs) for continuous factors and frequencies with percentages for categorical factors. Comparisons of these factors between hospitals with dedicated OUs and without were made using [2] and Wilcoxon rank sum tests as appropriate. Multivariable regression was performed using generalized linear mixed models treating hospital as a random effect and used patient age, the case‐mix index based on the APR‐DRG severity of illness, ED visit, and procedures associated with the index observation‐status stay. For continuous outcomes, we performed a log transformation on the outcome, confirmed the normality assumption, and back transformed the results. Sensitivity analyses were conducted to compare LOS, standardized costs, and conversation rates by hospital type for 10 of the 15 top‐ranking APR‐DRGs commonly cared for by pediatric hospitalists and to compare hospitals that reported the presence of an OU that was consistently open (24 hours per day, 7 days per week) and operating during the entire 2011 calendar year, and those without. Based on information gathered from the telephone interviews, hospitals with partially open OUs were similar to hospitals with continuously open OUs, such that they were included in our main analyses. All statistical analyses were performed using SAS version 9.3 (SAS Institute, Cary, NC). P values <0.05 were considered statistically significant.
RESULTS
Hospital Characteristics
Dedicated OUs were present in 14 of the 31 hospitals that reported observation‐status patient data to PHIS (Figure 1). Three of these hospitals had OUs that were open for 5 months or less in 2011; 1 unit opened, 1 unit closed, and 1 hospital operated a seasonal unit. The remaining 17 hospitals reported no OU that admitted unscheduled patients from the ED during 2011. Hospitals with a dedicated OU had more inpatient beds and higher median number of inpatient admissions than those without (Table 1). Hospitals were statistically similar in terms of total volume of ED visits, percentage of ED visits resulting in admission, total number of observation‐status stays, percentage of admissions under observation status, and payer mix.

| Overall, Median (IQR) | Hospitals With a Dedicated Observation Unit, Median (IQR) | Hospitals Without a Dedicated Observation Unit, Median (IQR) | P Value | |
|---|---|---|---|---|
| ||||
| No. of hospitals | 31 | 14 | 17 | |
| Total no. of inpatient beds | 273 (213311) | 304 (269425) | 246 (175293) | 0.006 |
| Total no. ED visits | 62971 (47,50497,723) | 87,892 (55,102117,119) | 53,151 (4750470,882) | 0.21 |
| ED visits resulting in admission, % | 13.1 (9.715.0) | 13.8 (10.5, 19.1) | 12.5 (9.714.5) | 0.31 |
| Total no. of inpatient admissions | 11,537 (9,26814,568) | 13,206 (11,32517,869) | 10,207 (8,64013,363) | 0.04 |
| Admissions under observation status, % | 25.7 (19.733.8) | 25.5 (21.431.4) | 26.0 (16.935.1) | 0.98 |
| Total no. of observation stays | 3,820 (27935672) | 4,850 (3,309 6,196) | 3,141 (2,3654,616) | 0.07 |
| Government payer, % | 60.2 (53.371.2) | 62.1 (54.9, 65.9) | 59.2 (53.373.7) | 0.89 |
Observation‐Status Patients by Hospital Type
In 2011, there were a total of 136,239 observation‐status stays69,983 (51.4%) within the 14 hospitals with a dedicated OU and 66,256 (48.6%) within the 17 hospitals without. Patient care originated in the ED for 57.8% observation‐status stays in hospitals with an OU compared with 53.0% of observation‐status stays in hospitals without (P<0.001). Compared with hospitals with a dedicated OU, those without a dedicated OU had higher percentages of observation‐status patients older than 12 years and non‐Hispanic and a higher percentage of observation‐status patients with private payer type (Table 2). The 15 top‐ranking APR‐DRGs accounted for roughly half of all observation‐status stays and were relatively consistent between hospitals with and without a dedicated OU (Table 3). Procedural care was frequently associated with observation‐status stays.
| Overall, No. (%) | Hospitals With a Dedicated Observation Unit, No. (%)* | Hospitals Without a Dedicated Observation Unit, No. (%) | P Value | |
|---|---|---|---|---|
| ||||
| Age | ||||
| <1 year | 23,845 (17.5) | 12,101 (17.3) | 11,744 (17.7) | <0.001 |
| 15 years | 53,405 (38.5) | 28,052 (40.1) | 24,353 (36.8) | |
| 612 years | 33,674 (24.7) | 17,215 (24.6) | 16,459 (24.8) | |
| 1318 years | 23,607 (17.3) | 11,472 (16.4) | 12,135 (18.3) | |
| >18 years | 2,708 (2) | 1,143 (1.6) | 1,565 (2.4) | |
| Gender | ||||
| Male | 76,142 (55.9) | 39,178 (56) | 36,964 (55.8) | 0.43 |
| Female | 60,025 (44.1) | 30,756 (44) | 29,269 (44.2) | |
| Race/ethnicity | ||||
| Non‐Hispanic white | 72,183 (53.0) | 30,653 (43.8) | 41,530 (62.7) | <0.001 |
| Non‐Hispanic black | 30,995 (22.8) | 16,314 (23.3) | 14,681 (22.2) | |
| Hispanic | 21,255 (15.6) | 16,583 (23.7) | 4,672 (7.1) | |
| Asian | 2,075 (1.5) | 1,313 (1.9) | 762 (1.2) | |
| Non‐Hispanic other | 9,731 (7.1) | 5,120 (7.3) | 4,611 (7.0) | |
| Payer | ||||
| Government | 68,725 (50.4) | 36,967 (52.8) | 31,758 (47.9) | <0.001 |
| Private | 48,416 (35.5) | 21,112 (30.2) | 27,304 (41.2) | |
| Other | 19,098 (14.0) | 11,904 (17) | 7,194 (10.9) | |
| Observation‐Status Patients in Hospitals With a Dedicated Observation Unit* | Observation‐Status Patients in Hospitals Without a Dedicated Observation Unit | ||||||||
|---|---|---|---|---|---|---|---|---|---|
| Rank | APR‐DRG | No. | % of All Observation Status Stays | % Began in ED | Rank | APR‐DRG | No. | % of All Observation Status Stays | % Began in ED |
| |||||||||
| 1 | Tonsil and adenoid procedures | 4,621 | 6.6 | 1.3 | 1 | Tonsil and adenoid procedures | 3,806 | 5.7 | 1.6 |
| 2 | Asthma | 4,246 | 6.1 | 85.3 | 2 | Asthma | 3,756 | 5.7 | 79.0 |
| 3 | Seizure | 3,516 | 5.0 | 52.0 | 3 | Seizure | 2,846 | 4.3 | 54.9 |
| 4 | Nonbacterial gastroenteritis | 3,286 | 4.7 | 85.8 | 4 | Upper respiratory infections | 2,733 | 4.1 | 69.6 |
| 5 | Bronchiolitis, RSV pneumonia | 3,093 | 4.4 | 78.5 | 5 | Nonbacterial gastroenteritis | 2,682 | 4.0 | 74.5 |
| 6 | Upper respiratory infections | 2,923 | 4.2 | 80.0 | 6 | Other digestive system diagnoses | 2,545 | 3.8 | 66.3 |
| 7 | Other digestive system diagnoses | 2,064 | 2.9 | 74.0 | 7 | Bronchiolitis, RSV pneumonia | 2,544 | 3.8 | 69.2 |
| 8 | Respiratory signs, symptoms, diagnoses | 2,052 | 2.9 | 81.6 | 8 | Shoulder and arm procedures | 1,862 | 2.8 | 72.6 |
| 9 | Other ENT/cranial/facial diagnoses | 1,684 | 2.4 | 43.6 | 9 | Appendectomy | 1,785 | 2.7 | 79.2 |
| 10 | Shoulder and arm procedures | 1,624 | 2.3 | 79.1 | 10 | Other ENT/cranial/facial diagnoses | 1,624 | 2.5 | 29.9 |
| 11 | Abdominal pain | 1,612 | 2.3 | 86.2 | 11 | Abdominal pain | 1,461 | 2.2 | 82.3 |
| 12 | Fever | 1,494 | 2.1 | 85.1 | 12 | Other factors influencing health status | 1,461 | 2.2 | 66.3 |
| 13 | Appendectomy | 1,465 | 2.1 | 66.4 | 13 | Cellulitis/other bacterial skin infections | 1,383 | 2.1 | 84.2 |
| 14 | Cellulitis/other bacterial skin infections | 1,393 | 2.0 | 86.4 | 14 | Respiratory signs, symptoms, diagnoses | 1,308 | 2.0 | 39.1 |
| 15 | Pneumonia NEC | 1,356 | 1.9 | 79.1 | 15 | Pneumonia NEC | 1,245 | 1.9 | 73.1 |
| Total | 36,429 | 52.0 | 57.8 | Total | 33,041 | 49.87 | 53.0 | ||
Outcomes of Observation‐Status Stays
A greater percentage of observation‐status stays in hospitals with a dedicated OU experienced a same‐day discharge (Table 4). In addition, a higher percentage of discharges occurred between midnight and 11 am in hospitals with a dedicated OU. However, overall risk‐adjusted LOS in hours (12.8 vs 12.2 hours, P=0.90) and risk‐adjusted total standardized costs ($2551 vs $2433, P=0.75) were similar between hospital types. These findings were consistent within the 1 APR‐DRGs commonly cared for by pediatric hospitalists (see Supporting Information, Appendix 1, in the online version of this article). Overall, conversion from observation to inpatient status was significantly higher in hospitals with a dedicated OU compared with hospitals without; however, this pattern was not consistent across the 10 APR‐DRGs commonly cared for by pediatric hospitalists (see Supporting Information, Appendix 1, in the online version of this article). Adjusted odds of 3‐day ED return visits and 30‐day readmissions were comparable between hospital groups.
| Observation‐Status Patients in Hospitals With a Dedicated Observation Unit | Observation‐Status Patients in Hospitals Without a Dedicated Observation Unit | P Value | |
|---|---|---|---|
| |||
| No. of hospitals | 14 | 17 | |
| Length of stay, h, median (IQR) | 12.8 (6.923.7) | 12.2 (721.3) | 0.90 |
| 0 midnights, no. (%) | 16,678 (23.8) | 14,648 (22.1) | <.001 |
| 1 midnight, no. (%) | 46,144 (65.9) | 44,559 (67.3) | |
| 2 midnights or more, no. (%) | 7,161 (10.2) | 7,049 (10.6) | |
| Discharge timing, no. (%) | |||
| Midnight5 am | 1,223 (1.9) | 408 (0.7) | <0.001 |
| 6 am11 am | 18,916 (29.3) | 15,914 (27.1) | |
| Noon5 pm | 32,699 (50.7) | 31,619 (53.9) | |
| 6 pm11 pm | 11,718 (18.2) | 10,718 (18.3) | |
| Total standardized costs, $, median (IQR) | 2,551.3 (2,053.93,169.1) | 2,433.4 (1,998.42,963) | 0.75 |
| Conversion to inpatient status | 11.06% | 9.63% | <0.01 |
| Return care, AOR (95% CI) | |||
| 3‐day ED return visit | 0.93 (0.77‐1.12) | Referent | 0.46 |
| 30‐day readmission | 0.88 (0.67‐1.15) | Referent | 0.36 |
We found similar results in sensitivity analyses comparing observation‐status stays in hospitals with a continuously open OU (open 24 hours per day, 7 days per week, for all of 2011 [n=10 hospitals]) to those without(see Supporting Information, Appendix 2, in the online version of this article). However, there were, on average, more observation‐status stays in hospitals with a continuously open OU (median 5605, IQR 42077089) than hospitals without (median 3309, IQR 26784616) (P=0.04). In contrast to our main results, conversion to inpatient status was lower in hospitals with a continuously open OU compared with hospitals without (8.52% vs 11.57%, P<0.01).
DISCUSSION
Counter to our hypothesis, we did not find hospital‐level differences in length of stay or costs for observation‐status patients cared for in hospitals with and without a dedicated OU, though hospitals with dedicated OUs did have more same‐day discharges and more morning discharges. The lack of observed differences in LOS and costs may reflect the fact that many children under observation status are treated throughout the hospital, even in facilities with a dedicated OU. Access to a dedicated OU is limited by factors including small numbers of OU beds and specific low acuity/low complexity OU admission criteria.[7] The inclusion of all children admitted under observation status in our analyses may have diluted any effect of dedicated OUs at the hospital level, but was necessary due to the inability to identify location of care for children admitted under observation status. Location of care is an important variable that should be incorporated into administrative databases to allow for comparative effectiveness research designs. Until such data are available, chart review at individual hospitals would be necessary to determine which patients received care in an OU.
We did find that discharges for observation‐status patients occurred earlier in the day in hospitals with a dedicated OU when compared with observation‐status patients in hospitals without a dedicated OU. In addition, the percentage of same‐day discharges was higher among observation‐status patients treated in hospitals with a dedicated OU. These differences may stem from policies and procedures that encourage rapid discharge in dedicated OUs, and those practices may affect other care areas. For example, OUs may enforce policies requiring family presence at the bedside or utilize staffing models where doctors and nurses are in frequent communication, both of which would facilitate discharge as soon as a patient no longer required hospital‐based care.[7] A retrospective chart review study design could be used to identify discharge processes and other key characteristics of highly performing OUs.
We found conflicting results in our main and sensitivity analyses related to conversion to inpatient status. Lower percentages of observation‐status patients converting to inpatient status indicates greater success in the delivery of observation care based on established performance metrics.[19] Lower rates of conversion to inpatient status may be the result of stricter admission criteria for some diagnosis and in hospitals with a continuously open dedicate OU, more refined processes for utilization review that allow for patients to be placed into the correct status (observation vs inpatient) at the time of admission, or efforts to educate providers about the designation of observation status.[7] It is also possible that fewer observation‐status patients convert to inpatient status in hospitals with a continuously open dedicated OU because such a change would require movement of the patient to an inpatient bed.
These analyses were more comprehensive than our prior studies[2, 20] in that we included both patients who were treated first in the ED and those who were not. In addition to the APR‐DRGs representative of conditions that have been successfully treated in ED‐based pediatric OUs (eg, asthma, seizures, gastroenteritis, cellulitis),[8, 9, 21, 22] we found observation‐status was commonly associated with procedural care. This population of patients may be relevant to hospitalists who staff OUs that provide both unscheduled and postprocedural care. The colocation of medical and postprocedural patients has been described by others[8, 23] and was reported to occur in over half of the OUs included in this study.[7] The extent to which postprocedure observation care is provided in general OUs staffed by hospitalists represents another opportunity for further study.
Hospitals face many considerations when determining if and how they will provide observation services to patients expected to experience short stays.[7] Some hospitals may be unable to justify an OU for all or part of the year based on the volume of admissions or the costs to staff an OU.[24, 25] Other hospitals may open an OU to promote patient flow and reduce ED crowding.[26] Hospitals may also be influenced by reimbursement policies related to observation‐status stays. Although we did not observe differences in overall payer mix, we did find higher percentages of observation‐status patients in hospitals with dedicated OUs to have public insurance. Although hospital contracts with payers around observation status patients are complex and beyond the scope of this analysis, it is possible that hospitals have established OUs because of increasingly stringent rules or criteria to meet inpatient status or experiences with high volumes of observation‐status patients covered by a particular payer. Nevertheless, the brief nature of many pediatric hospitalizations and the scarcity of pediatric OU beds must be considered in policy changes that result from national discussions about the appropriateness of inpatient stays shorter than 2 nights in duration.[27]
Limitations
The primary limitation to our analyses is the lack of ability to identify patients who were treated in a dedicated OU because few hospitals provided data to PHIS that allowed for the identification of the unit or location of care. Second, it is possible that some hospitals were misclassified as not having a dedicated OU based on our survey, which initially inquired about OUs that provided care to patients first treated in the ED. Therefore, OUs that exclusively care for postoperative patients or patients with scheduled treatments may be present in hospitals that we have labeled as not having a dedicated OU. This potential misclassification would bias our results toward finding no differences. Third, in any study of administrative data there is potential that diagnosis codes are incomplete or inaccurately capture the underlying reason for the episode of care. Fourth, the experiences of the free‐standing children's hospitals that contribute data to PHIS may not be generalizable to other hospitals that provide observation care to children. Finally, return care may be underestimated, as children could receive treatment at another hospital following discharge from a PHIS hospital. Care outside of PHIS hospitals would not be captured, but we do not expect this to differ for hospitals with and without dedicated OUs. It is possible that health information exchanges will permit more comprehensive analyses of care across different hospitals in the future.
CONCLUSION
Observation status patients are similar in hospitals with and without dedicated observation units that admit children from the ED. The presence of a dedicated OU appears to have an influence on same‐day and morning discharges across all observation‐status stays without impacting other hospital‐level outcomes. Inclusion of location of care (eg, geographically distinct dedicated OU vs general inpatient unit vs ED) in hospital administrative datasets would allow for meaningful comparisons of different models of care for short‐stay observation‐status patients.
Acknowledgements
The authors thank John P. Harding, MBA, FACHE, Children's Hospital of the King's Daughters, Norfolk, Virginia for his input on the study design.
Disclosures: Dr. Hall had full access to the data and takes responsibility for the integrity of the data and the accuracy of the data analysis. Internal funds from the Children's Hospital Association supported the conduct of this work. The authors have no financial relationships or conflicts of interest to disclose.
Many pediatric hospitalizations are of short duration, and more than half of short‐stay hospitalizations are designated as observation status.[1, 2] Observation status is an administrative label assigned to patients who do not meet hospital or payer criteria for inpatient‐status care. Short‐stay observation‐status patients do not fit in traditional models of emergency department (ED) or inpatient care. EDs often focus on discharging or admitting patients within a matter of hours, whereas inpatient units tend to measure length of stay (LOS) in terms of days[3] and may not have systems in place to facilitate rapid discharge of short‐stay patients.[4] Observation units (OUs) have been established in some hospitals to address the unique care needs of short‐stay patients.[5, 6, 7]
Single‐site reports from children's hospitals with successful OUs have demonstrated shorter LOS and lower costs compared with inpatient settings.[6, 8, 9, 10, 11, 12, 13, 14] No prior study has examined hospital‐level effects of an OU on observation‐status patient outcomes. The Pediatric Health Information System (PHIS) database provides a unique opportunity to explore this question, because unlike other national hospital administrative databases,[15, 16] the PHIS dataset contains information about children under observation status. In addition, we know which PHIS hospitals had a dedicated OU in 2011.7
We hypothesized that overall observation‐status stays in hospitals with a dedicated OU would be of shorter duration with earlier discharges at lower cost than observation‐status stays in hospitals without a dedicated OU. We compared hospitals with and without a dedicated OU on secondary outcomes including rates of conversion to inpatient status and return care for any reason.
METHODS
We conducted a cross‐sectional analysis of hospital administrative data using the 2011 PHIS databasea national administrative database that contains resource utilization data from 43 participating hospitals located in 26 states plus the District of Columbia. These hospitals account for approximately 20% of pediatric hospitalizations in the United States.
For each hospital encounter, PHIS includes patient demographics, up to 41 International Classification of Diseases, Ninth Revision, Clinical Modification (ICD‐9‐CM) diagnoses, up to 41 ICD‐9‐CM procedures, and hospital charges for services. Data are deidentified prior to inclusion, but unique identifiers allow for determination of return visits and readmissions following an index visit for an individual patient. Data quality and reliability are assured jointly by the Children's Hospital Association (formerly Child Health Corporation of America, Overland Park, KS), participating hospitals, and Truven Health Analytics (New York, NY). This study, using administrative data, was not considered human subjects research by the policies of the Cincinnati Children's Hospital Medical Center Institutional Review Board.
Hospital Selection and Hospital Characteristics
The study sample was drawn from the 31 hospitals that reported observation‐status patient data to PHIS in 2011. Analyses were conducted in 2013, at which time 2011 was the most recent year of data. We categorized 14 hospitals as having a dedicated OU during 2011 based on information collected in 2013.7 To summarize briefly, we interviewed by telephone representatives of hospitals responding to an email query as to the presence of a geographically distinct OU for the care of unscheduled patients from the ED. Three of the 14 representatives reported their hospital had 2 OUs, 1 of which was a separate surgical OU. Ten OUs cared for both ED patients and patients with scheduled procedures; 8 units received patients from non‐ED sources. Hospitalists provided staffing in more than half of the OUs.
We attempted to identify administrative data that would signal care delivered in a dedicated OU using hospital charge codes reported to PHIS, but learned this was not possible due to between‐hospital variation in the specificity of the charge codes. Therefore, we were unable to determine if patient care was delivered in a dedicated OU or another setting, such as a general inpatient unit or the ED. Other hospital characteristics available from the PHIS dataset included the number of inpatient beds, ED visits, inpatient admissions, observation‐status stays, and payer mix. We calculated the percentage of ED visits resulting in admission by dividing the number of ED visits with associated inpatient or observation status by the total number of ED visits and the percentage of admissions under observation status by dividing the number of observation‐status stays by the total number of admissions under observation or inpatient status.
Visit Selection and Patient Characteristics
All observation‐status stays regardless of the point of entry into the hospital were eligible for this study. We excluded stays that were birth‐related, included intensive care, or resulted in transfer or death. Patient demographic characteristics used to describe the cohort included age, gender, race/ethnicity, and primary payer. Stays that began in the ED were identified by an emergency room charge within PHIS. Eligible stays were categorized using All Patient Refined Diagnosis Related Groups (APR‐DRGs) version 24 using the ICD‐9‐CM code‐based proprietary 3M software (3M Health Information Systems, St. Paul, MN). We determined the 15 top‐ranking APR‐DRGs among observation‐status stays in hospitals with a dedicated OU and hospitals without. Procedural stays were identified based on procedural APR‐DRGs (eg, tonsil and adenoid procedures) or the presence of an ICD‐9‐CM procedure code (eg, 331 spinal tap).
Measured Outcomes
Outcomes of observation‐status stays were determined within 4 categories: (1) LOS, (2) standardized costs, (3) conversion to inpatient status, and (4) return visits and readmissions. LOS was calculated in terms of nights spent in hospital for all stays by subtracting the discharge date from the admission date and in terms of hours for stays in the 28 hospitals that report admission and discharge hour to the PHIS database. Discharge timing was examined in 4, 6‐hour blocks starting at midnight. Standardized costs were derived from a charge master index that was created by taking the median costs from all PHIS hospitals for each charged service.[17] Standardized costs represent the estimated cost of providing any particular clinical activity but are not the cost to patients, nor do they represent the actual cost to any given hospital. This approach allows for cost comparisons across hospitals, without biases arising from using charges or from deriving costs using hospitals' ratios of costs to charges.[18] Conversion from observation to inpatient status was calculated by dividing the number of inpatient‐status stays with observation codes by the number of observation‐statusonly stays plus the number of inpatient‐status stays with observation codes. All‐cause 3‐day ED return visits and 30‐day readmissions to the same hospital were assessed using patient‐specific identifiers that allowed for tracking of ED return visits and readmissions following the index observation stay.
Data Analysis
Descriptive statistics were calculated for hospital and patient characteristics using medians and interquartile ranges (IQRs) for continuous factors and frequencies with percentages for categorical factors. Comparisons of these factors between hospitals with dedicated OUs and without were made using [2] and Wilcoxon rank sum tests as appropriate. Multivariable regression was performed using generalized linear mixed models treating hospital as a random effect and used patient age, the case‐mix index based on the APR‐DRG severity of illness, ED visit, and procedures associated with the index observation‐status stay. For continuous outcomes, we performed a log transformation on the outcome, confirmed the normality assumption, and back transformed the results. Sensitivity analyses were conducted to compare LOS, standardized costs, and conversation rates by hospital type for 10 of the 15 top‐ranking APR‐DRGs commonly cared for by pediatric hospitalists and to compare hospitals that reported the presence of an OU that was consistently open (24 hours per day, 7 days per week) and operating during the entire 2011 calendar year, and those without. Based on information gathered from the telephone interviews, hospitals with partially open OUs were similar to hospitals with continuously open OUs, such that they were included in our main analyses. All statistical analyses were performed using SAS version 9.3 (SAS Institute, Cary, NC). P values <0.05 were considered statistically significant.
RESULTS
Hospital Characteristics
Dedicated OUs were present in 14 of the 31 hospitals that reported observation‐status patient data to PHIS (Figure 1). Three of these hospitals had OUs that were open for 5 months or less in 2011; 1 unit opened, 1 unit closed, and 1 hospital operated a seasonal unit. The remaining 17 hospitals reported no OU that admitted unscheduled patients from the ED during 2011. Hospitals with a dedicated OU had more inpatient beds and higher median number of inpatient admissions than those without (Table 1). Hospitals were statistically similar in terms of total volume of ED visits, percentage of ED visits resulting in admission, total number of observation‐status stays, percentage of admissions under observation status, and payer mix.
| Overall, Median (IQR) | Hospitals With a Dedicated Observation Unit, Median (IQR) | Hospitals Without a Dedicated Observation Unit, Median (IQR) | P Value | |
|---|---|---|---|---|
| ||||
| No. of hospitals | 31 | 14 | 17 | |
| Total no. of inpatient beds | 273 (213311) | 304 (269425) | 246 (175293) | 0.006 |
| Total no. ED visits | 62971 (47,50497,723) | 87,892 (55,102117,119) | 53,151 (4750470,882) | 0.21 |
| ED visits resulting in admission, % | 13.1 (9.715.0) | 13.8 (10.5, 19.1) | 12.5 (9.714.5) | 0.31 |
| Total no. of inpatient admissions | 11,537 (9,26814,568) | 13,206 (11,32517,869) | 10,207 (8,64013,363) | 0.04 |
| Admissions under observation status, % | 25.7 (19.733.8) | 25.5 (21.431.4) | 26.0 (16.935.1) | 0.98 |
| Total no. of observation stays | 3,820 (27935672) | 4,850 (3,309 6,196) | 3,141 (2,3654,616) | 0.07 |
| Government payer, % | 60.2 (53.371.2) | 62.1 (54.9, 65.9) | 59.2 (53.373.7) | 0.89 |
Observation‐Status Patients by Hospital Type
In 2011, there were a total of 136,239 observation‐status stays69,983 (51.4%) within the 14 hospitals with a dedicated OU and 66,256 (48.6%) within the 17 hospitals without. Patient care originated in the ED for 57.8% observation‐status stays in hospitals with an OU compared with 53.0% of observation‐status stays in hospitals without (P<0.001). Compared with hospitals with a dedicated OU, those without a dedicated OU had higher percentages of observation‐status patients older than 12 years and non‐Hispanic and a higher percentage of observation‐status patients with private payer type (Table 2). The 15 top‐ranking APR‐DRGs accounted for roughly half of all observation‐status stays and were relatively consistent between hospitals with and without a dedicated OU (Table 3). Procedural care was frequently associated with observation‐status stays.
| Overall, No. (%) | Hospitals With a Dedicated Observation Unit, No. (%)* | Hospitals Without a Dedicated Observation Unit, No. (%) | P Value | |
|---|---|---|---|---|
| ||||
| Age | ||||
| <1 year | 23,845 (17.5) | 12,101 (17.3) | 11,744 (17.7) | <0.001 |
| 15 years | 53,405 (38.5) | 28,052 (40.1) | 24,353 (36.8) | |
| 612 years | 33,674 (24.7) | 17,215 (24.6) | 16,459 (24.8) | |
| 1318 years | 23,607 (17.3) | 11,472 (16.4) | 12,135 (18.3) | |
| >18 years | 2,708 (2) | 1,143 (1.6) | 1,565 (2.4) | |
| Gender | ||||
| Male | 76,142 (55.9) | 39,178 (56) | 36,964 (55.8) | 0.43 |
| Female | 60,025 (44.1) | 30,756 (44) | 29,269 (44.2) | |
| Race/ethnicity | ||||
| Non‐Hispanic white | 72,183 (53.0) | 30,653 (43.8) | 41,530 (62.7) | <0.001 |
| Non‐Hispanic black | 30,995 (22.8) | 16,314 (23.3) | 14,681 (22.2) | |
| Hispanic | 21,255 (15.6) | 16,583 (23.7) | 4,672 (7.1) | |
| Asian | 2,075 (1.5) | 1,313 (1.9) | 762 (1.2) | |
| Non‐Hispanic other | 9,731 (7.1) | 5,120 (7.3) | 4,611 (7.0) | |
| Payer | ||||
| Government | 68,725 (50.4) | 36,967 (52.8) | 31,758 (47.9) | <0.001 |
| Private | 48,416 (35.5) | 21,112 (30.2) | 27,304 (41.2) | |
| Other | 19,098 (14.0) | 11,904 (17) | 7,194 (10.9) | |
| Observation‐Status Patients in Hospitals With a Dedicated Observation Unit* | Observation‐Status Patients in Hospitals Without a Dedicated Observation Unit | ||||||||
|---|---|---|---|---|---|---|---|---|---|
| Rank | APR‐DRG | No. | % of All Observation Status Stays | % Began in ED | Rank | APR‐DRG | No. | % of All Observation Status Stays | % Began in ED |
| |||||||||
| 1 | Tonsil and adenoid procedures | 4,621 | 6.6 | 1.3 | 1 | Tonsil and adenoid procedures | 3,806 | 5.7 | 1.6 |
| 2 | Asthma | 4,246 | 6.1 | 85.3 | 2 | Asthma | 3,756 | 5.7 | 79.0 |
| 3 | Seizure | 3,516 | 5.0 | 52.0 | 3 | Seizure | 2,846 | 4.3 | 54.9 |
| 4 | Nonbacterial gastroenteritis | 3,286 | 4.7 | 85.8 | 4 | Upper respiratory infections | 2,733 | 4.1 | 69.6 |
| 5 | Bronchiolitis, RSV pneumonia | 3,093 | 4.4 | 78.5 | 5 | Nonbacterial gastroenteritis | 2,682 | 4.0 | 74.5 |
| 6 | Upper respiratory infections | 2,923 | 4.2 | 80.0 | 6 | Other digestive system diagnoses | 2,545 | 3.8 | 66.3 |
| 7 | Other digestive system diagnoses | 2,064 | 2.9 | 74.0 | 7 | Bronchiolitis, RSV pneumonia | 2,544 | 3.8 | 69.2 |
| 8 | Respiratory signs, symptoms, diagnoses | 2,052 | 2.9 | 81.6 | 8 | Shoulder and arm procedures | 1,862 | 2.8 | 72.6 |
| 9 | Other ENT/cranial/facial diagnoses | 1,684 | 2.4 | 43.6 | 9 | Appendectomy | 1,785 | 2.7 | 79.2 |
| 10 | Shoulder and arm procedures | 1,624 | 2.3 | 79.1 | 10 | Other ENT/cranial/facial diagnoses | 1,624 | 2.5 | 29.9 |
| 11 | Abdominal pain | 1,612 | 2.3 | 86.2 | 11 | Abdominal pain | 1,461 | 2.2 | 82.3 |
| 12 | Fever | 1,494 | 2.1 | 85.1 | 12 | Other factors influencing health status | 1,461 | 2.2 | 66.3 |
| 13 | Appendectomy | 1,465 | 2.1 | 66.4 | 13 | Cellulitis/other bacterial skin infections | 1,383 | 2.1 | 84.2 |
| 14 | Cellulitis/other bacterial skin infections | 1,393 | 2.0 | 86.4 | 14 | Respiratory signs, symptoms, diagnoses | 1,308 | 2.0 | 39.1 |
| 15 | Pneumonia NEC | 1,356 | 1.9 | 79.1 | 15 | Pneumonia NEC | 1,245 | 1.9 | 73.1 |
| Total | 36,429 | 52.0 | 57.8 | Total | 33,041 | 49.87 | 53.0 | ||
Outcomes of Observation‐Status Stays
A greater percentage of observation‐status stays in hospitals with a dedicated OU experienced a same‐day discharge (Table 4). In addition, a higher percentage of discharges occurred between midnight and 11 am in hospitals with a dedicated OU. However, overall risk‐adjusted LOS in hours (12.8 vs 12.2 hours, P=0.90) and risk‐adjusted total standardized costs ($2551 vs $2433, P=0.75) were similar between hospital types. These findings were consistent within the 1 APR‐DRGs commonly cared for by pediatric hospitalists (see Supporting Information, Appendix 1, in the online version of this article). Overall, conversion from observation to inpatient status was significantly higher in hospitals with a dedicated OU compared with hospitals without; however, this pattern was not consistent across the 10 APR‐DRGs commonly cared for by pediatric hospitalists (see Supporting Information, Appendix 1, in the online version of this article). Adjusted odds of 3‐day ED return visits and 30‐day readmissions were comparable between hospital groups.
| Observation‐Status Patients in Hospitals With a Dedicated Observation Unit | Observation‐Status Patients in Hospitals Without a Dedicated Observation Unit | P Value | |
|---|---|---|---|
| |||
| No. of hospitals | 14 | 17 | |
| Length of stay, h, median (IQR) | 12.8 (6.923.7) | 12.2 (721.3) | 0.90 |
| 0 midnights, no. (%) | 16,678 (23.8) | 14,648 (22.1) | <.001 |
| 1 midnight, no. (%) | 46,144 (65.9) | 44,559 (67.3) | |
| 2 midnights or more, no. (%) | 7,161 (10.2) | 7,049 (10.6) | |
| Discharge timing, no. (%) | |||
| Midnight5 am | 1,223 (1.9) | 408 (0.7) | <0.001 |
| 6 am11 am | 18,916 (29.3) | 15,914 (27.1) | |
| Noon5 pm | 32,699 (50.7) | 31,619 (53.9) | |
| 6 pm11 pm | 11,718 (18.2) | 10,718 (18.3) | |
| Total standardized costs, $, median (IQR) | 2,551.3 (2,053.93,169.1) | 2,433.4 (1,998.42,963) | 0.75 |
| Conversion to inpatient status | 11.06% | 9.63% | <0.01 |
| Return care, AOR (95% CI) | |||
| 3‐day ED return visit | 0.93 (0.77‐1.12) | Referent | 0.46 |
| 30‐day readmission | 0.88 (0.67‐1.15) | Referent | 0.36 |
We found similar results in sensitivity analyses comparing observation‐status stays in hospitals with a continuously open OU (open 24 hours per day, 7 days per week, for all of 2011 [n=10 hospitals]) to those without(see Supporting Information, Appendix 2, in the online version of this article). However, there were, on average, more observation‐status stays in hospitals with a continuously open OU (median 5605, IQR 42077089) than hospitals without (median 3309, IQR 26784616) (P=0.04). In contrast to our main results, conversion to inpatient status was lower in hospitals with a continuously open OU compared with hospitals without (8.52% vs 11.57%, P<0.01).
DISCUSSION
Counter to our hypothesis, we did not find hospital‐level differences in length of stay or costs for observation‐status patients cared for in hospitals with and without a dedicated OU, though hospitals with dedicated OUs did have more same‐day discharges and more morning discharges. The lack of observed differences in LOS and costs may reflect the fact that many children under observation status are treated throughout the hospital, even in facilities with a dedicated OU. Access to a dedicated OU is limited by factors including small numbers of OU beds and specific low acuity/low complexity OU admission criteria.[7] The inclusion of all children admitted under observation status in our analyses may have diluted any effect of dedicated OUs at the hospital level, but was necessary due to the inability to identify location of care for children admitted under observation status. Location of care is an important variable that should be incorporated into administrative databases to allow for comparative effectiveness research designs. Until such data are available, chart review at individual hospitals would be necessary to determine which patients received care in an OU.
We did find that discharges for observation‐status patients occurred earlier in the day in hospitals with a dedicated OU when compared with observation‐status patients in hospitals without a dedicated OU. In addition, the percentage of same‐day discharges was higher among observation‐status patients treated in hospitals with a dedicated OU. These differences may stem from policies and procedures that encourage rapid discharge in dedicated OUs, and those practices may affect other care areas. For example, OUs may enforce policies requiring family presence at the bedside or utilize staffing models where doctors and nurses are in frequent communication, both of which would facilitate discharge as soon as a patient no longer required hospital‐based care.[7] A retrospective chart review study design could be used to identify discharge processes and other key characteristics of highly performing OUs.
We found conflicting results in our main and sensitivity analyses related to conversion to inpatient status. Lower percentages of observation‐status patients converting to inpatient status indicates greater success in the delivery of observation care based on established performance metrics.[19] Lower rates of conversion to inpatient status may be the result of stricter admission criteria for some diagnosis and in hospitals with a continuously open dedicate OU, more refined processes for utilization review that allow for patients to be placed into the correct status (observation vs inpatient) at the time of admission, or efforts to educate providers about the designation of observation status.[7] It is also possible that fewer observation‐status patients convert to inpatient status in hospitals with a continuously open dedicated OU because such a change would require movement of the patient to an inpatient bed.
These analyses were more comprehensive than our prior studies[2, 20] in that we included both patients who were treated first in the ED and those who were not. In addition to the APR‐DRGs representative of conditions that have been successfully treated in ED‐based pediatric OUs (eg, asthma, seizures, gastroenteritis, cellulitis),[8, 9, 21, 22] we found observation‐status was commonly associated with procedural care. This population of patients may be relevant to hospitalists who staff OUs that provide both unscheduled and postprocedural care. The colocation of medical and postprocedural patients has been described by others[8, 23] and was reported to occur in over half of the OUs included in this study.[7] The extent to which postprocedure observation care is provided in general OUs staffed by hospitalists represents another opportunity for further study.
Hospitals face many considerations when determining if and how they will provide observation services to patients expected to experience short stays.[7] Some hospitals may be unable to justify an OU for all or part of the year based on the volume of admissions or the costs to staff an OU.[24, 25] Other hospitals may open an OU to promote patient flow and reduce ED crowding.[26] Hospitals may also be influenced by reimbursement policies related to observation‐status stays. Although we did not observe differences in overall payer mix, we did find higher percentages of observation‐status patients in hospitals with dedicated OUs to have public insurance. Although hospital contracts with payers around observation status patients are complex and beyond the scope of this analysis, it is possible that hospitals have established OUs because of increasingly stringent rules or criteria to meet inpatient status or experiences with high volumes of observation‐status patients covered by a particular payer. Nevertheless, the brief nature of many pediatric hospitalizations and the scarcity of pediatric OU beds must be considered in policy changes that result from national discussions about the appropriateness of inpatient stays shorter than 2 nights in duration.[27]
Limitations
The primary limitation to our analyses is the lack of ability to identify patients who were treated in a dedicated OU because few hospitals provided data to PHIS that allowed for the identification of the unit or location of care. Second, it is possible that some hospitals were misclassified as not having a dedicated OU based on our survey, which initially inquired about OUs that provided care to patients first treated in the ED. Therefore, OUs that exclusively care for postoperative patients or patients with scheduled treatments may be present in hospitals that we have labeled as not having a dedicated OU. This potential misclassification would bias our results toward finding no differences. Third, in any study of administrative data there is potential that diagnosis codes are incomplete or inaccurately capture the underlying reason for the episode of care. Fourth, the experiences of the free‐standing children's hospitals that contribute data to PHIS may not be generalizable to other hospitals that provide observation care to children. Finally, return care may be underestimated, as children could receive treatment at another hospital following discharge from a PHIS hospital. Care outside of PHIS hospitals would not be captured, but we do not expect this to differ for hospitals with and without dedicated OUs. It is possible that health information exchanges will permit more comprehensive analyses of care across different hospitals in the future.
CONCLUSION
Observation status patients are similar in hospitals with and without dedicated observation units that admit children from the ED. The presence of a dedicated OU appears to have an influence on same‐day and morning discharges across all observation‐status stays without impacting other hospital‐level outcomes. Inclusion of location of care (eg, geographically distinct dedicated OU vs general inpatient unit vs ED) in hospital administrative datasets would allow for meaningful comparisons of different models of care for short‐stay observation‐status patients.
Acknowledgements
The authors thank John P. Harding, MBA, FACHE, Children's Hospital of the King's Daughters, Norfolk, Virginia for his input on the study design.
Disclosures: Dr. Hall had full access to the data and takes responsibility for the integrity of the data and the accuracy of the data analysis. Internal funds from the Children's Hospital Association supported the conduct of this work. The authors have no financial relationships or conflicts of interest to disclose.
© 2015 Society of Hospital Medicine
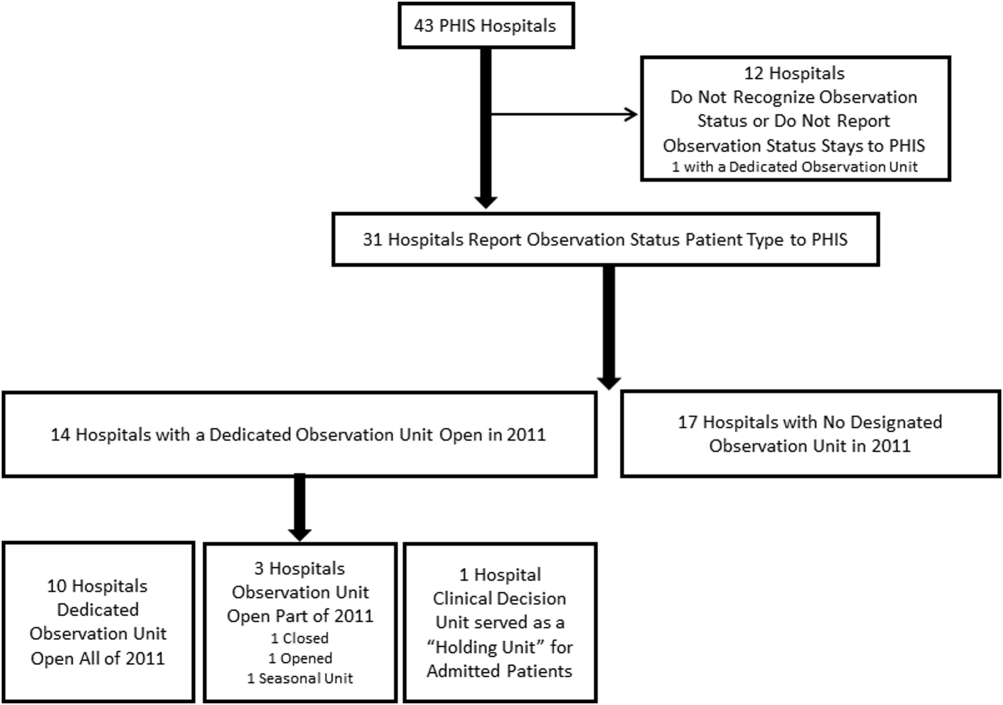
Pediatric Observation Status Stays
In recent decades, hospital lengths of stay have decreased and there has been a shift toward outpatient management for many pediatric conditions. In 2003, one‐third of all children admitted to US hospitals experienced 1‐day inpatient stays, an increase from 19% in 1993.1 Some hospitals have developed dedicated observation units for the care of children, with select diagnoses, who are expected to respond to less than 24 hours of treatment.26 Expansion of observation services has been suggested as an approach to lessen emergency department (ED) crowding7 and alleviate high‐capacity conditions within hospital inpatient units.8
In contrast to care delivered in a dedicated observation unit, observation status is an administrative label applied to patients who do not meet inpatient criteria as defined by third parties such as InterQual. While the decision to admit a patient is ultimately at the discretion of the ordering physician, many hospitals use predetermined criteria to assign observation status to patients admitted to observation and inpatient units.9 Treatment provided under observation status is designated by hospitals and payers as outpatient care, even when delivered in an inpatient bed.10 As outpatient‐designated care, observation cases do not enter publicly available administrative datasets of hospital discharges that have traditionally been used to understand hospital resource utilization, including the National Hospital Discharge Survey and the Kid's Inpatient Database.11, 12
We hypothesize that there has been an increase in observation status care delivered to children in recent years, and that the majority of children under observation were discharged home without converting to inpatient status. To determine trends in pediatric observation status care, we conducted the first longitudinal, multicenter evaluation of observation status code utilization following ED treatment in a sample of US freestanding children's hospitals. In addition, we focused on the most recent year of data among top ranking diagnoses to assess the current state of observation status stay outcomes (including conversion to inpatient status and return visits).
METHODS
Data Source
Data for this multicenter retrospective cohort study were obtained from the Pediatric Health Information System (PHIS). Freestanding children's hospital's participating in PHIS account for approximately 20% of all US tertiary care children's hospitals. The PHIS hospitals provide resource utilization data including patient demographics, International Classification of Diseases, Ninth Revision (ICD‐9) diagnosis and procedure codes, and charges applied to each stay, including room and nursing charges. Data were de‐identified prior to inclusion in the database, however encrypted identification numbers allowed for tracking individual patients across admissions. Data quality and reliability were assured through a joint effort between the Child Health Corporation of America (CHCA; Shawnee Mission, KS) and participating hospitals as described previously.13, 14 In accordance with the Common Rule (45 CFR 46.102(f)) and the policies of The Children's Hospital of Philadelphia Institutional Review Board, this research, using a de‐identified dataset, was considered exempt from review.
Hospital Selection
Each year from 2004 to 2009, there were 18 hospitals participating in PHIS that reported data from both inpatient discharges and outpatient visits (including observation status discharges). To assess data quality for observation status stays, we evaluated observation status discharges for the presence of associated observation billing codes applied to charge records reported to PHIS including: 1) observation per hour, 2) ED observation time, or 3) other codes mentioning observation in the hospital charge master description document. The 16 hospitals with observation charges assigned to at least 90% of observation status discharges in each study year were selected for analysis.
Visit Identification
Within the 16 study hospitals, we identified all visits between January 1, 2004 and December 31, 2009 with ED facility charges. From these ED visits, we included any stays designated by the hospital as observation or inpatient status, excluding transfers and ED discharges.
Variable Definitions
Hospitals submitting records to PHIS assigned a single patient type to the episode of care. The Observation patient type was assigned to patients discharged from observation status. Although the duration of observation is often less than 24 hours, hospitals may allow a patient to remain under observation for longer durations.15, 16 Duration of stay is not defined precisely enough within PHIS to determine hours of inpatient care. Therefore, length of stay (LOS) was not used to determine observation status stays.
The Inpatient patient type was assigned to patients who were discharged from inpatient status, including those patients admitted to inpatient care from the ED and also those who converted to inpatient status from observation. Patients who converted from observation status to inpatient status during the episode of care could be identified through the presence of observation charge codes as described above.
Given the potential for differences in the application of observation status, we also identified 1‐Day Stays where discharge occurred on the day of, or the day following, an inpatient status admission. These 1‐Day Stays represent hospitalizations that may, by their duration, be suitable for care in an observation unit. We considered discharges in the Observation and 1‐Day Stay categories to be Short‐Stays.
DATA ANALYSIS
For each of the 6 years of study, we calculated the following proportions to determine trends over time: 1) the number of Observation Status admissions from the ED as a proportion of the total number of ED visits resulting in Observation or Inpatient admission, and 2) the number of 1‐Day Stays admitted from the ED as a proportion of the total number of ED visits resulting in Observation or Inpatient admissions. Trends were analyzed using linear regression. Trends were also calculated for the total volume of admissions from the ED and the case‐mix index (CMI). CMI was assessed to evaluate for changes in the severity of illness for children admitted from the ED over the study period. Each hospital's CMI was calculated as an average of their Observation and Inpatient Status discharges' charge weights during the study period. Charge weights were calculated at the All Patient Refined Diagnosis Related Groups (APR‐DRG)/severity of illness level (3M Health Information Systems, St Paul, MN) and were normalized national average charges derived by Thomson‐Reuters from their Pediatric Projected National Database. Weights were then assigned to each discharge based on the discharge's APR‐DRG and severity level assignment.
To assess the current outcomes for observation, we analyzed stays with associated observation billing codes from the most recent year of available data (2009). Stays with Observation patient type were considered to have been discharged from observation, while those with an Inpatient Status patient type were considered to have converted to an inpatient admission during the observation period.
Using the 2009 data, we calculated descriptive statistics for patient characteristics (eg, age, gender, payer) comparing Observation Stays, 1‐Day Stays, and longer‐duration Inpatient admissions using chi‐square statistics. Age was categorized using the American Academy of Pediatrics groupings: <30 days, 30 days1 year, 12 years, 34 years, 512 years, 1317 years, >18 years. Designated payer was categorized into government, private, and other, including self‐pay and uninsured groups.
We used the Severity Classification Systems (SCS) developed for pediatric emergency care to estimate severity of illness for the visit.17 In this 5‐level system, each ICD‐9 diagnosis code is associated with a score related to the intensity of ED resources needed to care for a child with that diagnosis. In our analyses, each case was assigned the maximal SCS category based on the highest severity ICD‐9 code associated with the stay. Within the SCS, a score of 1 indicates minor illness (eg, diaper dermatitis) and 5 indicates major illness (eg, septic shock). The proportions of visits within categorical SCS scores were compared for Observation Stays, 1‐Day Stays, and longer‐duration Inpatient admissions using chi‐square statistics.
We determined the top 10 ranking diagnoses for which children were admitted from the ED in 2009 using the Diagnosis Grouping System (DGS).18 The DGS was designed specifically to categorize pediatric ED visits into clinically meaningful groups. The ICD‐9 code for the principal discharge diagnosis was used to assign records to 1 of the 77 DGS subgroups. Within each of the top ranking DGS subgroups, we determined the proportion of Observation Stays, 1‐Day Stays, and longer‐duration Inpatient admissions.
To provide clinically relevant outcomes of Observation Stays for common conditions, we selected stays with observation charges from within the top 10 ranking observation stay DGS subgroups in 2009. Outcomes for observation included: 1) immediate outcome of the observation stay (ie, discharge or conversion to inpatient status), 2) return visits to the ED in the 3 days following observation, and 3) readmissions to the hospital in the 3 and 30 days following observation. Bivariate comparisons of return visits and readmissions for Observation versus 1‐Day Stays within DGS subgroups were analyzed using chi‐square tests. Multivariate analyses of return visits and readmissions were conducted using Generalized Estimating Equations adjusting for severity of illness by SCS score and clustering by hospital. To account for local practice patterns, we also adjusted for a grouped treatment variable that included the site level proportion of children admitted to Observation Status, 1‐Day‐Stays, and longer Inpatient admissions. All statistical analyses were performed using SAS (version 9.2, SAS Institute, Inc, Cary, NC); P values <0.05 were considered statistically significant.
RESULTS
Trends in Short‐Stays
An increase in proportion of Observation Stays was mirrored by a decrease in proportion of 1‐Day Stays over the study period (Figure 1). In 2009, there were 1.4 times more Observation Stays than 1‐Day Stays (25,653 vs 18,425) compared with 14,242 and 20,747, respectively, in 2004. This shift toward more Observation Stays occurred as hospitals faced a 16% increase in the total number of admissions from the ED (91,318 to 108,217) and change in CMI from 1.48 to 1.51. Over the study period, roughly 40% of all admissions from the ED were Short‐Stays (Observation and 1‐Day Stays). Median LOS for Observation Status stays was 1 day (interquartile range [IQR]: 11).

Patient Characteristics in 2009
Table 1 presents comparisons between Observation, 1‐Day Stays, and longer‐duration Inpatient admissions. Of potential clinical significance, children under Observation Status were slightly younger (median, 4.0 years; IQR: 1.310.0) when compared with children admitted for 1‐Day Stays (median, 5.0 years; IQR: 1.411.4; P < 0.001) and longer‐duration Inpatient stays (median, 4.7 years; IQR: 0.912.2; P < 0.001). Nearly two‐thirds of Observation Status stays had SCS scores of 3 or lower compared with less than half of 1‐Day Stays and longer‐duration Inpatient admissions.
| Short‐Stays | LOS >1 Day | |||||
|---|---|---|---|---|---|---|
| Observation | 1‐Day Stay | Longer Admission | ||||
| N = 25,653* (24%) | N = 18,425* (17%) | P Value Comparing Observation to 1‐Day Stay | N = 64,139* (59%) | P Value Comparing Short‐Stays to LOS >1 Day | ||
| ||||||
| Sex | Male | 14,586 (57) | 10,474 (57) | P = 0.663 | 34,696 (54) | P < 0.001 |
| Female | 11,000 (43) | 7,940 (43) | 29,403 (46) | |||
| Payer | Government | 13,247 (58) | 8,944 (55) | P < 0.001 | 35,475 (61) | P < 0.001 |
| Private | 7,123 (31) | 5,105 (32) | 16,507 (28) | |||
| Other | 2,443 (11) | 2,087 (13) | 6,157 (11) | |||
| Age | <30 days | 793 (3) | 687 (4) | P < 0.001 | 3,932 (6) | P < 0.001 |
| 30 days1 yr | 4,499 (17) | 2,930 (16) | 13,139 (21) | |||
| 12 yr | 5,793 (23) | 3,566 (19) | 10,229 (16) | |||
| 34 yr | 3,040 (12) | 2,056 (11) | 5,551 (9) | |||
| 512 yr | 7,427 (29) | 5,570 (30) | 17,057 (27) | |||
| 1317 yr | 3,560 (14) | 3,136 (17) | 11,860 (18) | |||
| >17 yr | 541 (2) | 480 (3) | 2,371 (4) | |||
| Race | White | 17,249 (70) | 12,123 (70) | P < 0.001 | 40,779 (67) | P <0.001 |
| Black | 6,298 (25) | 4,216 (25) | 16,855 (28) | |||
| Asian | 277 (1) | 295 (2) | 995 (2) | |||
| Other | 885 (4) | 589 (3) | 2,011 (3) | |||
| SCS | 1 Minor illness | 64 (<1) | 37 (<1) | P < 0.001 | 84 (<1) | P < 0.001 |
| 2 | 1,190 (5) | 658 (4) | 1,461 (2) | |||
| 3 | 14,553 (57) | 7,617 (42) | 20,760 (33) | |||
| 4 | 8,994 (36) | 9,317 (51) | 35,632 (56) | |||
| 5 Major illness | 490 (2) | 579 (3) | 5,689 (9) | |||
In 2009, the top 10 DGS subgroups accounted for half of all admissions from the ED. The majority of admissions for extremity fractures, head trauma, dehydration, and asthma were Short‐Stays, as were roughly 50% of admissions for seizures, appendicitis, and gastroenteritis (Table 2). Respiratory infections and asthma were the top 1 and 2 ranking DGS subgroups for Observation Stays, 1‐Day Stays, and longer‐duration Inpatient admissions. While rank order differed, 9 of the 10 top ranking Observation Stay DGS subgroups were also top ranking DGS subgroups for 1‐Day Stays. Gastroenteritis ranked 10th among Observation Stays and 11th among 1‐Day Stays. Diabetes mellitus ranked 26th among Observation Stays compared with 8th among 1‐Day Stays.
| Short‐Stays | LOS >1 Day | ||
|---|---|---|---|
| % Observation | % 1‐Day Stay | % Longer Admission | |
| |||
| All admissions from the ED | 23.7 | 17.0 | 59.3 |
| n = 108,217 | |||
| Respiratory infections | 22.3 | 15.3 | 62.4 |
| n = 14,455 (13%) | |||
| Asthma | 32.0 | 23.8 | 44.2 |
| n = 8,853 (8%) | |||
| Other GI diseases | 24.1 | 16.2 | 59.7 |
| n = 6,519 (6%) | |||
| Appendicitis | 21.0 | 29.5 | 49.5 |
| n = 4,480 (4%) | |||
| Skin infections | 20.7 | 14.3 | 65.0 |
| n = 4,743 (4%) | |||
| Seizures | 29.5 | 22 | 48.5 |
| n = 4,088 (4%) | |||
| Extremity fractures | 49.4 | 20.5 | 30.1 |
| n = 3,681 (3%) | |||
| Dehydration | 37.8 | 19.0 | 43.2 |
| n = 2,773 (3%) | |||
| Gastroenteritis | 30.3 | 18.7 | 50.9 |
| n = 2,603 (2%) | |||
| Head trauma | 44.1 | 43.9 | 32.0 |
| n = 2,153 (2%) | |||
Average maximum SCS scores were clinically comparable for Observation and 1‐Day Stays and generally lower than for longer‐duration Inpatient admissions within the top 10 most common DGS subgroups. Average maximum SCS scores were statistically lower for Observation Stays compared with 1‐Day Stays for respiratory infections (3.2 vs 3.4), asthma (3.4 vs 3.6), diabetes (3.5 vs 3.8), gastroenteritis (3.0 vs 3.1), other gastrointestinal diseases (3.2 vs 3.4), head trauma (3.3 vs 3.5), and extremity fractures (3.2 vs 3.4) (P < 0.01). There were no differences in SCS scores for skin infections (SCS = 3.0) and appendicitis (SCS = 4.0) when comparing Observation and 1‐Day Stays.
Outcomes for Observation Stays in 2009
Within 6 of the top 10 DGS subgroups for Observation Stays, >75% of patients were discharged home from Observation Status (Table 3). Mean LOS for stays that converted from Observation to Inpatient Status ranged from 2.85 days for extremity fractures to 4.66 days for appendicitis.
| Return to ED in 3 Days n = 421 (1.6%) | Hospital Readmissions in 3 Days n = 247 (1.0%) | Hospital Readmissions in 30 Days n = 819 (3.2%) | ||
|---|---|---|---|---|
| DGS subgroup | % Discharged From Observation | Adjusted* Odds Ratio (95% CI) | Adjusted* Odds Ratio (95% CI) | Adjusted* Odds Ratio (95% CI) |
| ||||
| Respiratory infections | 72 | 1.1 (0.71.8) | 0.8 (0.51.3) | 0.9 (0.71.3) |
| Asthma | 80 | 1.3 (0.63.0) | 1.0 (0.61.8) | 0.5 (0.31.0) |
| Other GI diseases | 74 | 0.8 (0.51.3) | 2.2 (1.33.8) | 1.0 (0.71.5) |
| Appendicitis | 82 | NE | NE | NE |
| Skin infections | 68 | 1.8 (0.84.4) | 1.4 (0.45.3) | 0.9 (0.61.6) |
| Seizures | 79 | 0.8 (0.41.6) | 0.8 (0.31.8) | 0.7 (0.51.0) |
| Extremity fractures | 92 | 0.9 (0.42.1) | 0.2 (01.3) | 1.2 (0.53.2) |
| Dehydration | 81 | 0.9 (0.61.4) | 0.8 (0.31.9) | 0.7 (0.41.1) |
| Gastroenteritis | 74 | 0.9 (0.42.0) | 0.6 (0.41.2) | 0.6 (0.41) |
| Head trauma | 92 | 0.6 (0.21.7) | 0.3 (02.1) | 1.0 (0.42.8) |
Among children with Observation Stays for 1 of the top 10 DGS subgroups, adjusted return ED visit rates were <3% and readmission rates were <1.6% within 3 days following the index stay. Thirty‐day readmission rates were highest following observation for other GI illnesses and seizures. In unadjusted analysis, Observation Stays for asthma, respiratory infections, and skin infections were associated with greater proportions of return ED visits when compared with 1‐Day Stays. Differences were no longer statistically significant after adjusting for SCS score, clustering by hospital, and the grouped treatment variable. Adjusted odds of readmission were significantly higher at 3 days following observation for other GI illnesses and lower at 30 days following observation for seizures when compared with 1‐Day Stays (Table 3).
DISCUSSION
In this first, multicenter longitudinal study of pediatric observation following an ED visit, we found that Observation Status code utilization has increased steadily over the past 6 years and, in 2007, the proportion of children admitted to observation status surpassed the proportion of children experiencing a 1‐day inpatient admission. Taken together, Short‐Stays made up more than 40% of the hospital‐based care delivered to children admitted from an ED. Stable trends in CMI over time suggest that observation status may be replacing inpatient status designated care for pediatric Short‐Stays in these hospitals. Our findings suggest the lines between outpatient observation and short‐stay inpatient care are becoming increasingly blurred. These trends have occurred in the setting of changing policies for hospital reimbursement, requirements for patients to meet criteria to qualify for inpatient admissions, and efforts to avoid stays deemed unnecessary or inappropriate by their brief duration.19 Therefore there is a growing need to understand the impact of children under observation on the structure, delivery, and financing of acute hospital care for children.
Our results also have implications for pediatric health services research that relies on hospital administrative databases that do not contain observation stays. Currently, observation stays are systematically excluded from many inpatient administrative datasets.11, 12 Analyses of datasets that do not account for observation stays likely result in underestimation of hospitalization rates and hospital resource utilization for children. This may be particularly important for high‐volume conditions, such as asthma and acute infections, for which children commonly require brief periods of hospital‐based care beyond an ED encounter. Data from pediatric observation status admissions should be consistently included in hospital administrative datasets to allow for more comprehensive analyses of hospital resource utilization among children.
Prior research has shown that the diagnoses commonly treated in pediatric observation units overlap with the diagnoses for which children experience 1‐Day Stays.1, 20 We found a similar pattern of conditions for which children were under Observation Status and 1‐Day Stays with comparable severity of illness between the groups in terms of SCS scores. Our findings imply a need to determine how and why hospitals differentiate Observation Status from 1‐Day‐Stay groups in order to improve the assignment of observation status. Assuming continued pressures from payers to provide more care in outpatient or observation settings, there is potential for expansion of dedicated observation services for children in the US. Without designated observation units or processes to group patients with lower severity conditions, there may be limited opportunities to realize more efficient hospital care simply through the application of the label of observation status.
For more than 30 years, observation services have been provided to children who require a period of monitoring to determine their response to therapy and the need for acute inpatient admission from the ED.21While we were not able to determine the location of care for observation status patients in this study, we know that few children's hospitals have dedicated observation units and, even when an observation unit is present, not all observation status patients are cared for in dedicated observation units.9 This, in essence, means that most children under observation status are cared for in virtual observation by inpatient teams using inpatient beds. If observation patients are treated in inpatient beds and consume the same resources as inpatients, then cost‐savings based on reimbursement contracts with payers may not reflect an actual reduction in services. Pediatric institutions will need to closely monitor the financial implications of observation status given the historical differences in payment for observation and inpatient care.
With more than 70% of children being discharged home following observation, our results are comparable to the published literature2, 5, 6, 22, 23 and guidelines for observation unit operations.24 Similar to prior studies,4, 15, 2530 our results also indicate that return visits and readmissions following observation are uncommon events. Our findings can serve as initial benchmarks for condition‐specific outcomes for pediatric observation care. Studies are needed both to identify the clinical characteristics predictive of successful discharge home from observation and to explore the hospital‐to‐hospital variability in outcomes for observation. Such studies are necessary to identify the most successful healthcare delivery models for pediatric observation stays.
LIMITATIONS
The primary limitation to our results is that data from a subset of freestanding children's hospitals may not reflect observation stays at other children's hospitals or the community hospitals that care for children across the US. Only 18 of 42 current PHIS member hospitals have provided both outpatient visit and inpatient stay data for each year of the study period and were considered eligible. In an effort to ensure the quality of observation stay data, we included the 16 hospitals that assigned observation charges to at least 90% of their observation status stays in the PHIS database. The exclusion of the 2 hospitals where <90% of observation status patients were assigned observation charges likely resulted in an underestimation of the utilization of observation status.
Second, there is potential for misclassification of patient type given institutional variations in the assignment of patient status. The PHIS database does not contain information about the factors that were considered in the assignment of observation status. At the time of admission from the ED, observation or inpatient status is assigned. While this decision is clearly reserved for the admitting physician, the process is not standardized across hospitals.9 Some institutions have Utilization Managers on site to help guide decision‐making, while others allow the assignment to be made by physicians without specific guidance. As a result, some patients may be assigned to observation status at admission and reassigned to inpatient status following Utilization Review, which may bias our results toward overestimation of the number of observation stays that converted to inpatient status.
The third limitation to our results relates to return visits. An accurate assessment of return visits is subject to the patient returning to the same hospital. If children do not return to the same hospital, our results would underestimate return visits and readmissions. In addition, we did not assess the reason for return visit as there was no way to verify if the return visit was truly related to the index visit without detailed chart review. Assuming children return to the same hospital for different reasons, our results would overestimate return visits associated with observation stays. We suspect that many 3‐day return visits result from the progression of acute illness or failure to respond to initial treatment, and 30‐day readmissions reflect recurrent hospital care needs related to chronic illnesses.
Lastly, severity classification is difficult when analyzing administrative datasets without physiologic patient data, and the SCS may not provide enough detail to reveal clinically important differences between patient groups.
CONCLUSIONS
Short‐stay hospitalizations following ED visits are common among children, and the majority of pediatric short‐stays are under observation status. Analyses of inpatient administrative databases that exclude observation stays likely result in an underestimation of hospital resource utilization for children. Efforts are needed to ensure that patients under observation status are accounted for in hospital administrative datasets used for pediatric health services research, and healthcare resource allocation, as it relates to hospital‐based care. While the clinical outcomes for observation patients appear favorable in terms of conversion to inpatient admissions and return visits, the financial implications of observation status care within children's hospitals are currently unknown.
- ,,,,,.Trends in high‐turnover stays among children hospitalized in the United States, 1993–2003.Pediatrics.2009;123(3):996–1002.
- ,,,,.Utilization and unexpected hospitalization rates of a pediatric emergency department 23‐hour observation unit.Pediatr Emerg Care.2008;24(9):589–594.
- ,,.When the patient requires observation not hospitalization.J Nurs Admin.1988;18(10):20–23.
- ,,,.Pediatric observation status beds on an inpatient unit: an integrated care model.Pediatr Emerg Care.2004;20(1):17–21.
- ,,.Use of an observation unit by a pediatric emergency department for common pediatric illnesses.Pediatr Emerg Care.2001;17(5):321–323.
- ,,.The pediatric hybrid observation unit: an analysis of 6477 consecutive patient encounters.Pediatrics.2005;115(5):e535–e542.
- ACEP. Emergency Department Crowding: High‐Impact Solutions. Task Force Report on Boarding.2008. Available at: http://www.acep.org/WorkArea/downloadasset.aspx?id=37960. Accessed July 21, 2010.
- ,,, et al.Children's hospitals do not acutely respond to high occupancy.Pediatrics.2010;125(5):974–981.
- ,,, et al.Differences in observation care practices in US freestanding children's hospitals: are they virtual or real?J Hosp Med.2011. Available at: http://www.cms.gov/transmittals/downloads/R770HO.pdf. Accessed January 10, 2011.
- CMS.Medicare Hospital Manual, Section 455.Department of Health and Human Services, Centers for Medicare and Medicaid Services;2001. Available at: http://www.hcup‐us.ahrq.gov/reports/methods/FinalReportonObservationStatus_v2Final.pdf. Accessed on May 3, 2007.
- HCUP.Methods Series Report #2002–3. Observation Status Related to U.S. Hospital Records. Healthcare Cost and Utilization Project.Rockville, MD:Agency for Healthcare Research and Quality;2002.
- ,.Design and operation of the National Hospital Discharge Survey: 1988 redesign.Vital Health Stat.2000;1(39):1–43.
- ,,,.Corticosteroids and mortality in children with bacterial meningitis.JAMA.2008;299(17):2048–2055.
- ,,,,.Intravenous immunoglobulin in children with streptococcal toxic shock syndrome.Clin Infect Dis.2009;49(9):1369–1376.
- ,,,.Impact of a short stay unit on asthma patients admitted to a tertiary pediatric hospital.Qual Manag Health Care.1997;6(1):14–22.
- ,,.An observation unit in a pediatric emergency department: one children's hospital's experience.J Emerg Nurs.2002;28(5):407–413.
- ,,,.Developing a diagnosis‐based severity classification system for use in emergency medical systems for children. Pediatric Academic Societies' Annual Meeting, Platform Presentation; Toronto, Canada;2007.
- ,,,,.A new diagnosis grouping system for child emergency department visits.Acad Emerg Med.2010;17(2):204–213.
- .Observation medicine: the healthcare system's tincture of time. In: Graff LG, ed.Principles of Observation Medicine.American College of Emergency Physicians;2010. Available at: http://www. acep.org/content.aspx?id=46142. Accessed February 18, 2011.
- ,,,,.High turnover stays for pediatric asthma in the United States: analysis of the 2006 Kids' Inpatient Database.Med Care.2010;48(9):827–833.
- ,,,,.Pediatric observation units in the United States: a systematic review.J Hosp Med.2010;5(3):172–182.
- ,.Observation unit in childrens hospital—adjunct to delivery and teaching of ambulatory pediatric care.N Y State J Med.1980;80(11):1684–1686.
- ,,.Short stay in an outpatient department. An alternative to hospitalization.Am J Dis Child.1972;123(2):128–132.
- ACEP.Practice Management Committee, American College of Emergency Physicians. Management of Observation Units.Irving, TX:American College of Emergency Physicians;1994.
- ,,,,.Return visits to a pediatric emergency department.Pediatr Emerg Care.2004;20(3):166–171.
- ,.Postreduction management of intussusception in a children's hospital emergency department.Pediatrics.2003;112(6 pt 1):1302–1307.
- ,,,,.Pediatric closed head injuries treated in an observation unit.Pediatr Emerg Care.2005;21(10):639–644.
- ,,,.Use of pediatric observation unit for treatment of children with dehydration caused by gastroenteritis.Pediatr Emerg Care.2006;22(1):1–6.
- ,,,.Children with asthma admitted to a pediatric observation unit.Pediatr Emerg Care.2005;21(10):645–649.
- ,,, et al.How well can hospital readmission be predicted in a cohort of hospitalized children? A retrospective, multicenter study.Pediatrics.2009;123(1):286–293.
In recent decades, hospital lengths of stay have decreased and there has been a shift toward outpatient management for many pediatric conditions. In 2003, one‐third of all children admitted to US hospitals experienced 1‐day inpatient stays, an increase from 19% in 1993.1 Some hospitals have developed dedicated observation units for the care of children, with select diagnoses, who are expected to respond to less than 24 hours of treatment.26 Expansion of observation services has been suggested as an approach to lessen emergency department (ED) crowding7 and alleviate high‐capacity conditions within hospital inpatient units.8
In contrast to care delivered in a dedicated observation unit, observation status is an administrative label applied to patients who do not meet inpatient criteria as defined by third parties such as InterQual. While the decision to admit a patient is ultimately at the discretion of the ordering physician, many hospitals use predetermined criteria to assign observation status to patients admitted to observation and inpatient units.9 Treatment provided under observation status is designated by hospitals and payers as outpatient care, even when delivered in an inpatient bed.10 As outpatient‐designated care, observation cases do not enter publicly available administrative datasets of hospital discharges that have traditionally been used to understand hospital resource utilization, including the National Hospital Discharge Survey and the Kid's Inpatient Database.11, 12
We hypothesize that there has been an increase in observation status care delivered to children in recent years, and that the majority of children under observation were discharged home without converting to inpatient status. To determine trends in pediatric observation status care, we conducted the first longitudinal, multicenter evaluation of observation status code utilization following ED treatment in a sample of US freestanding children's hospitals. In addition, we focused on the most recent year of data among top ranking diagnoses to assess the current state of observation status stay outcomes (including conversion to inpatient status and return visits).
METHODS
Data Source
Data for this multicenter retrospective cohort study were obtained from the Pediatric Health Information System (PHIS). Freestanding children's hospital's participating in PHIS account for approximately 20% of all US tertiary care children's hospitals. The PHIS hospitals provide resource utilization data including patient demographics, International Classification of Diseases, Ninth Revision (ICD‐9) diagnosis and procedure codes, and charges applied to each stay, including room and nursing charges. Data were de‐identified prior to inclusion in the database, however encrypted identification numbers allowed for tracking individual patients across admissions. Data quality and reliability were assured through a joint effort between the Child Health Corporation of America (CHCA; Shawnee Mission, KS) and participating hospitals as described previously.13, 14 In accordance with the Common Rule (45 CFR 46.102(f)) and the policies of The Children's Hospital of Philadelphia Institutional Review Board, this research, using a de‐identified dataset, was considered exempt from review.
Hospital Selection
Each year from 2004 to 2009, there were 18 hospitals participating in PHIS that reported data from both inpatient discharges and outpatient visits (including observation status discharges). To assess data quality for observation status stays, we evaluated observation status discharges for the presence of associated observation billing codes applied to charge records reported to PHIS including: 1) observation per hour, 2) ED observation time, or 3) other codes mentioning observation in the hospital charge master description document. The 16 hospitals with observation charges assigned to at least 90% of observation status discharges in each study year were selected for analysis.
Visit Identification
Within the 16 study hospitals, we identified all visits between January 1, 2004 and December 31, 2009 with ED facility charges. From these ED visits, we included any stays designated by the hospital as observation or inpatient status, excluding transfers and ED discharges.
Variable Definitions
Hospitals submitting records to PHIS assigned a single patient type to the episode of care. The Observation patient type was assigned to patients discharged from observation status. Although the duration of observation is often less than 24 hours, hospitals may allow a patient to remain under observation for longer durations.15, 16 Duration of stay is not defined precisely enough within PHIS to determine hours of inpatient care. Therefore, length of stay (LOS) was not used to determine observation status stays.
The Inpatient patient type was assigned to patients who were discharged from inpatient status, including those patients admitted to inpatient care from the ED and also those who converted to inpatient status from observation. Patients who converted from observation status to inpatient status during the episode of care could be identified through the presence of observation charge codes as described above.
Given the potential for differences in the application of observation status, we also identified 1‐Day Stays where discharge occurred on the day of, or the day following, an inpatient status admission. These 1‐Day Stays represent hospitalizations that may, by their duration, be suitable for care in an observation unit. We considered discharges in the Observation and 1‐Day Stay categories to be Short‐Stays.
DATA ANALYSIS
For each of the 6 years of study, we calculated the following proportions to determine trends over time: 1) the number of Observation Status admissions from the ED as a proportion of the total number of ED visits resulting in Observation or Inpatient admission, and 2) the number of 1‐Day Stays admitted from the ED as a proportion of the total number of ED visits resulting in Observation or Inpatient admissions. Trends were analyzed using linear regression. Trends were also calculated for the total volume of admissions from the ED and the case‐mix index (CMI). CMI was assessed to evaluate for changes in the severity of illness for children admitted from the ED over the study period. Each hospital's CMI was calculated as an average of their Observation and Inpatient Status discharges' charge weights during the study period. Charge weights were calculated at the All Patient Refined Diagnosis Related Groups (APR‐DRG)/severity of illness level (3M Health Information Systems, St Paul, MN) and were normalized national average charges derived by Thomson‐Reuters from their Pediatric Projected National Database. Weights were then assigned to each discharge based on the discharge's APR‐DRG and severity level assignment.
To assess the current outcomes for observation, we analyzed stays with associated observation billing codes from the most recent year of available data (2009). Stays with Observation patient type were considered to have been discharged from observation, while those with an Inpatient Status patient type were considered to have converted to an inpatient admission during the observation period.
Using the 2009 data, we calculated descriptive statistics for patient characteristics (eg, age, gender, payer) comparing Observation Stays, 1‐Day Stays, and longer‐duration Inpatient admissions using chi‐square statistics. Age was categorized using the American Academy of Pediatrics groupings: <30 days, 30 days1 year, 12 years, 34 years, 512 years, 1317 years, >18 years. Designated payer was categorized into government, private, and other, including self‐pay and uninsured groups.
We used the Severity Classification Systems (SCS) developed for pediatric emergency care to estimate severity of illness for the visit.17 In this 5‐level system, each ICD‐9 diagnosis code is associated with a score related to the intensity of ED resources needed to care for a child with that diagnosis. In our analyses, each case was assigned the maximal SCS category based on the highest severity ICD‐9 code associated with the stay. Within the SCS, a score of 1 indicates minor illness (eg, diaper dermatitis) and 5 indicates major illness (eg, septic shock). The proportions of visits within categorical SCS scores were compared for Observation Stays, 1‐Day Stays, and longer‐duration Inpatient admissions using chi‐square statistics.
We determined the top 10 ranking diagnoses for which children were admitted from the ED in 2009 using the Diagnosis Grouping System (DGS).18 The DGS was designed specifically to categorize pediatric ED visits into clinically meaningful groups. The ICD‐9 code for the principal discharge diagnosis was used to assign records to 1 of the 77 DGS subgroups. Within each of the top ranking DGS subgroups, we determined the proportion of Observation Stays, 1‐Day Stays, and longer‐duration Inpatient admissions.
To provide clinically relevant outcomes of Observation Stays for common conditions, we selected stays with observation charges from within the top 10 ranking observation stay DGS subgroups in 2009. Outcomes for observation included: 1) immediate outcome of the observation stay (ie, discharge or conversion to inpatient status), 2) return visits to the ED in the 3 days following observation, and 3) readmissions to the hospital in the 3 and 30 days following observation. Bivariate comparisons of return visits and readmissions for Observation versus 1‐Day Stays within DGS subgroups were analyzed using chi‐square tests. Multivariate analyses of return visits and readmissions were conducted using Generalized Estimating Equations adjusting for severity of illness by SCS score and clustering by hospital. To account for local practice patterns, we also adjusted for a grouped treatment variable that included the site level proportion of children admitted to Observation Status, 1‐Day‐Stays, and longer Inpatient admissions. All statistical analyses were performed using SAS (version 9.2, SAS Institute, Inc, Cary, NC); P values <0.05 were considered statistically significant.
RESULTS
Trends in Short‐Stays
An increase in proportion of Observation Stays was mirrored by a decrease in proportion of 1‐Day Stays over the study period (Figure 1). In 2009, there were 1.4 times more Observation Stays than 1‐Day Stays (25,653 vs 18,425) compared with 14,242 and 20,747, respectively, in 2004. This shift toward more Observation Stays occurred as hospitals faced a 16% increase in the total number of admissions from the ED (91,318 to 108,217) and change in CMI from 1.48 to 1.51. Over the study period, roughly 40% of all admissions from the ED were Short‐Stays (Observation and 1‐Day Stays). Median LOS for Observation Status stays was 1 day (interquartile range [IQR]: 11).
Patient Characteristics in 2009
Table 1 presents comparisons between Observation, 1‐Day Stays, and longer‐duration Inpatient admissions. Of potential clinical significance, children under Observation Status were slightly younger (median, 4.0 years; IQR: 1.310.0) when compared with children admitted for 1‐Day Stays (median, 5.0 years; IQR: 1.411.4; P < 0.001) and longer‐duration Inpatient stays (median, 4.7 years; IQR: 0.912.2; P < 0.001). Nearly two‐thirds of Observation Status stays had SCS scores of 3 or lower compared with less than half of 1‐Day Stays and longer‐duration Inpatient admissions.
| Short‐Stays | LOS >1 Day | |||||
|---|---|---|---|---|---|---|
| Observation | 1‐Day Stay | Longer Admission | ||||
| N = 25,653* (24%) | N = 18,425* (17%) | P Value Comparing Observation to 1‐Day Stay | N = 64,139* (59%) | P Value Comparing Short‐Stays to LOS >1 Day | ||
| ||||||
| Sex | Male | 14,586 (57) | 10,474 (57) | P = 0.663 | 34,696 (54) | P < 0.001 |
| Female | 11,000 (43) | 7,940 (43) | 29,403 (46) | |||
| Payer | Government | 13,247 (58) | 8,944 (55) | P < 0.001 | 35,475 (61) | P < 0.001 |
| Private | 7,123 (31) | 5,105 (32) | 16,507 (28) | |||
| Other | 2,443 (11) | 2,087 (13) | 6,157 (11) | |||
| Age | <30 days | 793 (3) | 687 (4) | P < 0.001 | 3,932 (6) | P < 0.001 |
| 30 days1 yr | 4,499 (17) | 2,930 (16) | 13,139 (21) | |||
| 12 yr | 5,793 (23) | 3,566 (19) | 10,229 (16) | |||
| 34 yr | 3,040 (12) | 2,056 (11) | 5,551 (9) | |||
| 512 yr | 7,427 (29) | 5,570 (30) | 17,057 (27) | |||
| 1317 yr | 3,560 (14) | 3,136 (17) | 11,860 (18) | |||
| >17 yr | 541 (2) | 480 (3) | 2,371 (4) | |||
| Race | White | 17,249 (70) | 12,123 (70) | P < 0.001 | 40,779 (67) | P <0.001 |
| Black | 6,298 (25) | 4,216 (25) | 16,855 (28) | |||
| Asian | 277 (1) | 295 (2) | 995 (2) | |||
| Other | 885 (4) | 589 (3) | 2,011 (3) | |||
| SCS | 1 Minor illness | 64 (<1) | 37 (<1) | P < 0.001 | 84 (<1) | P < 0.001 |
| 2 | 1,190 (5) | 658 (4) | 1,461 (2) | |||
| 3 | 14,553 (57) | 7,617 (42) | 20,760 (33) | |||
| 4 | 8,994 (36) | 9,317 (51) | 35,632 (56) | |||
| 5 Major illness | 490 (2) | 579 (3) | 5,689 (9) | |||
In 2009, the top 10 DGS subgroups accounted for half of all admissions from the ED. The majority of admissions for extremity fractures, head trauma, dehydration, and asthma were Short‐Stays, as were roughly 50% of admissions for seizures, appendicitis, and gastroenteritis (Table 2). Respiratory infections and asthma were the top 1 and 2 ranking DGS subgroups for Observation Stays, 1‐Day Stays, and longer‐duration Inpatient admissions. While rank order differed, 9 of the 10 top ranking Observation Stay DGS subgroups were also top ranking DGS subgroups for 1‐Day Stays. Gastroenteritis ranked 10th among Observation Stays and 11th among 1‐Day Stays. Diabetes mellitus ranked 26th among Observation Stays compared with 8th among 1‐Day Stays.
| Short‐Stays | LOS >1 Day | ||
|---|---|---|---|
| % Observation | % 1‐Day Stay | % Longer Admission | |
| |||
| All admissions from the ED | 23.7 | 17.0 | 59.3 |
| n = 108,217 | |||
| Respiratory infections | 22.3 | 15.3 | 62.4 |
| n = 14,455 (13%) | |||
| Asthma | 32.0 | 23.8 | 44.2 |
| n = 8,853 (8%) | |||
| Other GI diseases | 24.1 | 16.2 | 59.7 |
| n = 6,519 (6%) | |||
| Appendicitis | 21.0 | 29.5 | 49.5 |
| n = 4,480 (4%) | |||
| Skin infections | 20.7 | 14.3 | 65.0 |
| n = 4,743 (4%) | |||
| Seizures | 29.5 | 22 | 48.5 |
| n = 4,088 (4%) | |||
| Extremity fractures | 49.4 | 20.5 | 30.1 |
| n = 3,681 (3%) | |||
| Dehydration | 37.8 | 19.0 | 43.2 |
| n = 2,773 (3%) | |||
| Gastroenteritis | 30.3 | 18.7 | 50.9 |
| n = 2,603 (2%) | |||
| Head trauma | 44.1 | 43.9 | 32.0 |
| n = 2,153 (2%) | |||
Average maximum SCS scores were clinically comparable for Observation and 1‐Day Stays and generally lower than for longer‐duration Inpatient admissions within the top 10 most common DGS subgroups. Average maximum SCS scores were statistically lower for Observation Stays compared with 1‐Day Stays for respiratory infections (3.2 vs 3.4), asthma (3.4 vs 3.6), diabetes (3.5 vs 3.8), gastroenteritis (3.0 vs 3.1), other gastrointestinal diseases (3.2 vs 3.4), head trauma (3.3 vs 3.5), and extremity fractures (3.2 vs 3.4) (P < 0.01). There were no differences in SCS scores for skin infections (SCS = 3.0) and appendicitis (SCS = 4.0) when comparing Observation and 1‐Day Stays.
Outcomes for Observation Stays in 2009
Within 6 of the top 10 DGS subgroups for Observation Stays, >75% of patients were discharged home from Observation Status (Table 3). Mean LOS for stays that converted from Observation to Inpatient Status ranged from 2.85 days for extremity fractures to 4.66 days for appendicitis.
| Return to ED in 3 Days n = 421 (1.6%) | Hospital Readmissions in 3 Days n = 247 (1.0%) | Hospital Readmissions in 30 Days n = 819 (3.2%) | ||
|---|---|---|---|---|
| DGS subgroup | % Discharged From Observation | Adjusted* Odds Ratio (95% CI) | Adjusted* Odds Ratio (95% CI) | Adjusted* Odds Ratio (95% CI) |
| ||||
| Respiratory infections | 72 | 1.1 (0.71.8) | 0.8 (0.51.3) | 0.9 (0.71.3) |
| Asthma | 80 | 1.3 (0.63.0) | 1.0 (0.61.8) | 0.5 (0.31.0) |
| Other GI diseases | 74 | 0.8 (0.51.3) | 2.2 (1.33.8) | 1.0 (0.71.5) |
| Appendicitis | 82 | NE | NE | NE |
| Skin infections | 68 | 1.8 (0.84.4) | 1.4 (0.45.3) | 0.9 (0.61.6) |
| Seizures | 79 | 0.8 (0.41.6) | 0.8 (0.31.8) | 0.7 (0.51.0) |
| Extremity fractures | 92 | 0.9 (0.42.1) | 0.2 (01.3) | 1.2 (0.53.2) |
| Dehydration | 81 | 0.9 (0.61.4) | 0.8 (0.31.9) | 0.7 (0.41.1) |
| Gastroenteritis | 74 | 0.9 (0.42.0) | 0.6 (0.41.2) | 0.6 (0.41) |
| Head trauma | 92 | 0.6 (0.21.7) | 0.3 (02.1) | 1.0 (0.42.8) |
Among children with Observation Stays for 1 of the top 10 DGS subgroups, adjusted return ED visit rates were <3% and readmission rates were <1.6% within 3 days following the index stay. Thirty‐day readmission rates were highest following observation for other GI illnesses and seizures. In unadjusted analysis, Observation Stays for asthma, respiratory infections, and skin infections were associated with greater proportions of return ED visits when compared with 1‐Day Stays. Differences were no longer statistically significant after adjusting for SCS score, clustering by hospital, and the grouped treatment variable. Adjusted odds of readmission were significantly higher at 3 days following observation for other GI illnesses and lower at 30 days following observation for seizures when compared with 1‐Day Stays (Table 3).
DISCUSSION
In this first, multicenter longitudinal study of pediatric observation following an ED visit, we found that Observation Status code utilization has increased steadily over the past 6 years and, in 2007, the proportion of children admitted to observation status surpassed the proportion of children experiencing a 1‐day inpatient admission. Taken together, Short‐Stays made up more than 40% of the hospital‐based care delivered to children admitted from an ED. Stable trends in CMI over time suggest that observation status may be replacing inpatient status designated care for pediatric Short‐Stays in these hospitals. Our findings suggest the lines between outpatient observation and short‐stay inpatient care are becoming increasingly blurred. These trends have occurred in the setting of changing policies for hospital reimbursement, requirements for patients to meet criteria to qualify for inpatient admissions, and efforts to avoid stays deemed unnecessary or inappropriate by their brief duration.19 Therefore there is a growing need to understand the impact of children under observation on the structure, delivery, and financing of acute hospital care for children.
Our results also have implications for pediatric health services research that relies on hospital administrative databases that do not contain observation stays. Currently, observation stays are systematically excluded from many inpatient administrative datasets.11, 12 Analyses of datasets that do not account for observation stays likely result in underestimation of hospitalization rates and hospital resource utilization for children. This may be particularly important for high‐volume conditions, such as asthma and acute infections, for which children commonly require brief periods of hospital‐based care beyond an ED encounter. Data from pediatric observation status admissions should be consistently included in hospital administrative datasets to allow for more comprehensive analyses of hospital resource utilization among children.
Prior research has shown that the diagnoses commonly treated in pediatric observation units overlap with the diagnoses for which children experience 1‐Day Stays.1, 20 We found a similar pattern of conditions for which children were under Observation Status and 1‐Day Stays with comparable severity of illness between the groups in terms of SCS scores. Our findings imply a need to determine how and why hospitals differentiate Observation Status from 1‐Day‐Stay groups in order to improve the assignment of observation status. Assuming continued pressures from payers to provide more care in outpatient or observation settings, there is potential for expansion of dedicated observation services for children in the US. Without designated observation units or processes to group patients with lower severity conditions, there may be limited opportunities to realize more efficient hospital care simply through the application of the label of observation status.
For more than 30 years, observation services have been provided to children who require a period of monitoring to determine their response to therapy and the need for acute inpatient admission from the ED.21While we were not able to determine the location of care for observation status patients in this study, we know that few children's hospitals have dedicated observation units and, even when an observation unit is present, not all observation status patients are cared for in dedicated observation units.9 This, in essence, means that most children under observation status are cared for in virtual observation by inpatient teams using inpatient beds. If observation patients are treated in inpatient beds and consume the same resources as inpatients, then cost‐savings based on reimbursement contracts with payers may not reflect an actual reduction in services. Pediatric institutions will need to closely monitor the financial implications of observation status given the historical differences in payment for observation and inpatient care.
With more than 70% of children being discharged home following observation, our results are comparable to the published literature2, 5, 6, 22, 23 and guidelines for observation unit operations.24 Similar to prior studies,4, 15, 2530 our results also indicate that return visits and readmissions following observation are uncommon events. Our findings can serve as initial benchmarks for condition‐specific outcomes for pediatric observation care. Studies are needed both to identify the clinical characteristics predictive of successful discharge home from observation and to explore the hospital‐to‐hospital variability in outcomes for observation. Such studies are necessary to identify the most successful healthcare delivery models for pediatric observation stays.
LIMITATIONS
The primary limitation to our results is that data from a subset of freestanding children's hospitals may not reflect observation stays at other children's hospitals or the community hospitals that care for children across the US. Only 18 of 42 current PHIS member hospitals have provided both outpatient visit and inpatient stay data for each year of the study period and were considered eligible. In an effort to ensure the quality of observation stay data, we included the 16 hospitals that assigned observation charges to at least 90% of their observation status stays in the PHIS database. The exclusion of the 2 hospitals where <90% of observation status patients were assigned observation charges likely resulted in an underestimation of the utilization of observation status.
Second, there is potential for misclassification of patient type given institutional variations in the assignment of patient status. The PHIS database does not contain information about the factors that were considered in the assignment of observation status. At the time of admission from the ED, observation or inpatient status is assigned. While this decision is clearly reserved for the admitting physician, the process is not standardized across hospitals.9 Some institutions have Utilization Managers on site to help guide decision‐making, while others allow the assignment to be made by physicians without specific guidance. As a result, some patients may be assigned to observation status at admission and reassigned to inpatient status following Utilization Review, which may bias our results toward overestimation of the number of observation stays that converted to inpatient status.
The third limitation to our results relates to return visits. An accurate assessment of return visits is subject to the patient returning to the same hospital. If children do not return to the same hospital, our results would underestimate return visits and readmissions. In addition, we did not assess the reason for return visit as there was no way to verify if the return visit was truly related to the index visit without detailed chart review. Assuming children return to the same hospital for different reasons, our results would overestimate return visits associated with observation stays. We suspect that many 3‐day return visits result from the progression of acute illness or failure to respond to initial treatment, and 30‐day readmissions reflect recurrent hospital care needs related to chronic illnesses.
Lastly, severity classification is difficult when analyzing administrative datasets without physiologic patient data, and the SCS may not provide enough detail to reveal clinically important differences between patient groups.
CONCLUSIONS
Short‐stay hospitalizations following ED visits are common among children, and the majority of pediatric short‐stays are under observation status. Analyses of inpatient administrative databases that exclude observation stays likely result in an underestimation of hospital resource utilization for children. Efforts are needed to ensure that patients under observation status are accounted for in hospital administrative datasets used for pediatric health services research, and healthcare resource allocation, as it relates to hospital‐based care. While the clinical outcomes for observation patients appear favorable in terms of conversion to inpatient admissions and return visits, the financial implications of observation status care within children's hospitals are currently unknown.
- ,,,,,.Trends in high‐turnover stays among children hospitalized in the United States, 1993–2003.Pediatrics.2009;123(3):996–1002.
- ,,,,.Utilization and unexpected hospitalization rates of a pediatric emergency department 23‐hour observation unit.Pediatr Emerg Care.2008;24(9):589–594.
- ,,.When the patient requires observation not hospitalization.J Nurs Admin.1988;18(10):20–23.
- ,,,.Pediatric observation status beds on an inpatient unit: an integrated care model.Pediatr Emerg Care.2004;20(1):17–21.
- ,,.Use of an observation unit by a pediatric emergency department for common pediatric illnesses.Pediatr Emerg Care.2001;17(5):321–323.
- ,,.The pediatric hybrid observation unit: an analysis of 6477 consecutive patient encounters.Pediatrics.2005;115(5):e535–e542.
- ACEP. Emergency Department Crowding: High‐Impact Solutions. Task Force Report on Boarding.2008. Available at: http://www.acep.org/WorkArea/downloadasset.aspx?id=37960. Accessed July 21, 2010.
- ,,, et al.Children's hospitals do not acutely respond to high occupancy.Pediatrics.2010;125(5):974–981.
- ,,, et al.Differences in observation care practices in US freestanding children's hospitals: are they virtual or real?J Hosp Med.2011. Available at: http://www.cms.gov/transmittals/downloads/R770HO.pdf. Accessed January 10, 2011.
- CMS.Medicare Hospital Manual, Section 455.Department of Health and Human Services, Centers for Medicare and Medicaid Services;2001. Available at: http://www.hcup‐us.ahrq.gov/reports/methods/FinalReportonObservationStatus_v2Final.pdf. Accessed on May 3, 2007.
- HCUP.Methods Series Report #2002–3. Observation Status Related to U.S. Hospital Records. Healthcare Cost and Utilization Project.Rockville, MD:Agency for Healthcare Research and Quality;2002.
- ,.Design and operation of the National Hospital Discharge Survey: 1988 redesign.Vital Health Stat.2000;1(39):1–43.
- ,,,.Corticosteroids and mortality in children with bacterial meningitis.JAMA.2008;299(17):2048–2055.
- ,,,,.Intravenous immunoglobulin in children with streptococcal toxic shock syndrome.Clin Infect Dis.2009;49(9):1369–1376.
- ,,,.Impact of a short stay unit on asthma patients admitted to a tertiary pediatric hospital.Qual Manag Health Care.1997;6(1):14–22.
- ,,.An observation unit in a pediatric emergency department: one children's hospital's experience.J Emerg Nurs.2002;28(5):407–413.
- ,,,.Developing a diagnosis‐based severity classification system for use in emergency medical systems for children. Pediatric Academic Societies' Annual Meeting, Platform Presentation; Toronto, Canada;2007.
- ,,,,.A new diagnosis grouping system for child emergency department visits.Acad Emerg Med.2010;17(2):204–213.
- .Observation medicine: the healthcare system's tincture of time. In: Graff LG, ed.Principles of Observation Medicine.American College of Emergency Physicians;2010. Available at: http://www. acep.org/content.aspx?id=46142. Accessed February 18, 2011.
- ,,,,.High turnover stays for pediatric asthma in the United States: analysis of the 2006 Kids' Inpatient Database.Med Care.2010;48(9):827–833.
- ,,,,.Pediatric observation units in the United States: a systematic review.J Hosp Med.2010;5(3):172–182.
- ,.Observation unit in childrens hospital—adjunct to delivery and teaching of ambulatory pediatric care.N Y State J Med.1980;80(11):1684–1686.
- ,,.Short stay in an outpatient department. An alternative to hospitalization.Am J Dis Child.1972;123(2):128–132.
- ACEP.Practice Management Committee, American College of Emergency Physicians. Management of Observation Units.Irving, TX:American College of Emergency Physicians;1994.
- ,,,,.Return visits to a pediatric emergency department.Pediatr Emerg Care.2004;20(3):166–171.
- ,.Postreduction management of intussusception in a children's hospital emergency department.Pediatrics.2003;112(6 pt 1):1302–1307.
- ,,,,.Pediatric closed head injuries treated in an observation unit.Pediatr Emerg Care.2005;21(10):639–644.
- ,,,.Use of pediatric observation unit for treatment of children with dehydration caused by gastroenteritis.Pediatr Emerg Care.2006;22(1):1–6.
- ,,,.Children with asthma admitted to a pediatric observation unit.Pediatr Emerg Care.2005;21(10):645–649.
- ,,, et al.How well can hospital readmission be predicted in a cohort of hospitalized children? A retrospective, multicenter study.Pediatrics.2009;123(1):286–293.
Copyright © 2012 Society of Hospital Medicine
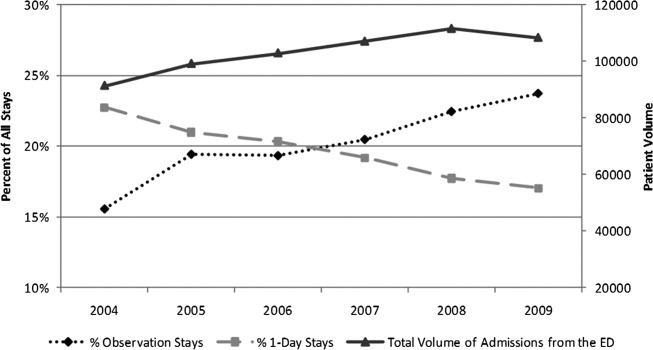
Observation Care in Children's Hospitals
Observation medicine has grown in recent decades out of changes in policies for hospital reimbursement, requirements for patients to meet admission criteria to qualify for inpatient admission, and efforts to avoid unnecessary or inappropriate admissions.1 Emergency physicians are frequently faced with patients who are too sick to be discharged home, but do not clearly meet criteria for an inpatient status admission. These patients often receive extended outpatient services (typically extending 24 to 48 hours) under the designation of observation status, in order to determine their response to treatment and need for hospitalization.
Observation care delivered to adult patients has increased substantially in recent years, and the confusion around the designation of observation versus inpatient care has received increasing attention in the lay press.27 According to the Centers for Medicare and Medicaid Services (CMS)8:
Observation care is a well‐defined set of specific, clinically appropriate services, which include ongoing short term treatment, assessment, and reassessment before a decision can be made regarding whether patients will require further treatment as hospital inpatients. Observation services are commonly ordered for patients who present to the emergency department and who then require a significant period of treatment or monitoring in order to make a decision concerning their admission or discharge.
Observation status is an administrative label that is applied to patients who do not meet inpatient level of care criteria, as defined by third parties such as InterQual. These criteria usually include a combination of the patient's clinical diagnoses, severity of illness, and expected needs for monitoring and interventions, in order to determine the admission status to which the patient may be assigned (eg, observation, inpatient, or intensive care). Observation services can be provided, in a variety of settings, to those patients who do not meet inpatient level of care but require a period of observation. Some hospitals provide observation care in discrete units in the emergency department (ED) or specific inpatient unit, and others have no designated unit but scatter observation patients throughout the institution, termed virtual observation units.9
For more than 30 years, observation unit (OU) admission has offered an alternative to traditional inpatient hospitalization for children with a variety of acute conditions.10, 11 Historically, the published literature on observation care for children in the United States has been largely based in dedicated emergency department OUs.12 Yet, in a 2001 survey of 21 pediatric EDs, just 6 reported the presence of a 23‐hour unit.13 There are single‐site examples of observation care delivered in other settings.14, 15 In 2 national surveys of US General Hospitals, 25% provided observation services in beds adjacent to the ED, and the remainder provided observation services in hospital inpatient units.16, 17 However, we are not aware of any previous multi‐institution studies exploring hospital‐wide practices related to observation care for children.
Recognizing that observation status can be designated using various standards, and that observation care can be delivered in locations outside of dedicated OUs,9 we developed 2 web‐based surveys to examine the current models of pediatric observation medicine in US children's hospitals. We hypothesized that observation care is most commonly applied as a billing designation and does not necessarily represent care delivered in a structurally or functionally distinct OU, nor does it represent a difference in care provided to those patients with inpatient designation.
METHODS
Study Design
Two web‐based surveys were distributed, in April 2010, to the 42 freestanding, tertiary care children's hospitals affiliated with the Child Health Corporation of America (CHCA; Shawnee Mission, KS) which contribute data to the Pediatric Health Information System (PHIS) database. The PHIS is a national administrative database that contains resource utilization data from participating hospitals located in noncompeting markets of 27 states plus the District of Columbia. These hospitals account for 20% of all tertiary care children's hospitals in the United States.
Survey Content
Survey 1
A survey of hospital observation status practices has been developed by CHCA as a part of the PHIS data quality initiative (see Supporting Appendix: Survey 1 in the online version of this article). Hospitals that did not provide observation patient data to PHIS were excluded after an initial screening question. This survey obtained information regarding the designation of observation status within each hospital. Hospitals provided free‐text responses to questions related to the criteria used to define observation, and to admit patients into observation status. Fixed‐choice response questions were used to determine specific observation status utilization criteria and clinical guidelines (eg, InterQual and Milliman) used by hospitals for the designation of observation status to patients.
Survey 2
We developed a detailed follow‐up survey in order to characterize the structures and processes of care associated with observation status (see Supporting Appendix: Survey 2 in the online version of this article). Within the follow‐up survey, an initial screening question was used to determine all types of patients to which observation status is assigned within the responding hospitals. All other questions in Survey 2 were focused specifically on those patients who required additional care following ED evaluation and treatment. Fixed‐choice response questions were used to explore differences in care for patients under observation and those admitted as inpatients. We also inquired of hospital practices related to boarding of patients in the ED while awaiting admission to an inpatient bed.
Survey Distribution
Two web‐based surveys were distributed to all 42 CHCA hospitals that contribute data to PHIS. During the month of April 2010, each hospital's designated PHIS operational contact received e‐mail correspondence requesting their participation in each survey. Within hospitals participating in PHIS, Operational Contacts have been assigned to serve as the day‐to‐day PHIS contact person based upon their experience working with the PHIS data. The Operational Contacts are CHCA's primary contact for issues related to the hospital's data quality and reporting to PHIS. Non‐responders were contacted by e‐mail for additional requests to complete the surveys. Each e‐mail provided an introduction to the topic of the survey and a link to complete the survey. The e‐mail requesting participation in Survey 1 was distributed the first week of April 2010, and the survey was open for responses during the first 3 weeks of the month. The e‐mail requesting participation in Survey 2 was sent the third week of April 2010, and the survey was open for responses during the subsequent 2 weeks.
DATA ANALYSIS
Survey responses were collected and are presented as a descriptive summary of results. Hospital characteristics were summarized with medians and interquartile ranges for continuous variables, and with percents for categorical variables. Characteristics were compared between hospitals that responded and those that did not respond to Survey 2 using Wilcoxon rank‐sum tests and chi‐square tests as appropriate. All analyses were performed using SAS v.9.2 (SAS Institute, Cary, NC), and a P value <0.05 was considered statistically significant. The study was reviewed by the University of Michigan Institutional Review Board and considered exempt.
RESULTS
Responses to Survey 1 were available from 37 of 42 (88%) of PHIS hospitals (Figure 1). For Survey 2, we received responses from 20 of 42 (48%) of PHIS hospitals. Based on information available from Survey 1, we know that 20 of the 31 (65%) PHIS hospitals that report observation status patient data to PHIS responded to Survey 2. Characteristics of the hospitals responding and not responding to Survey 2 are presented in Table 1. Respondents provided hospital identifying information which allowed for the linkage of data, from Survey 1, to 17 of the 20 hospitals responding to Survey 2. We did not have information available to link responses from 3 hospitals.
| Respondent N = 20 | Non‐Respondent N = 22 | P Value | |
|---|---|---|---|
| |||
| No. of inpatient beds Median [IQR] (excluding Obstetrics) | 245 [219283] | 282 [250381] | 0.076 |
| Annual admissions Median [IQR] (excluding births) | 11,658 [8,64213,213] | 13,522 [9,83018,705] | 0.106 |
| ED volume Median [IQR] | 60,528 [47,85082,955] | 64,486 [47,38684,450] | 0.640 |
| Percent government payer Median [IQR] | 53% [4662] | 49% [4158] | 0.528 |
| Region | |||
| Northeast | 37% | 0% | 0.021 |
| Midwest | 21% | 33% | |
| South | 21% | 50% | |
| West | 21% | 17% | |
| Reports observation status patients to PHIS | 85% | 90% | 0.555 |
Based on responses to the surveys and our knowledge of data reported to PHIS, our current understanding of patient flow from ED through observation to discharge home, and the application of observation status to the encounter, is presented in Figure 2. According to free‐text responses to Survey 1, various methods were applied to designate observation status (gray shaded boxes in Figure 2). Fixed‐choice responses to Survey 2 revealed that observation status patients were cared for in a variety of locations within hospitals, including ED beds, designated observation units, and inpatient beds (dashed boxes in Figure 2). Not every facility utilized all of the listed locations for observation care. Space constraints could dictate the location of care, regardless of patient status (eg, observation vs inpatient), in hospitals with more than one location of care available to observation patients. While patient status could change during a visit, only the final patient status at discharge enters the administrative record submitted to PHIS (black boxes in Figure 2). Facility charges for observation remained a part of the visit record and were reported to PHIS. Hospitals may or may not bill for all assigned charges depending on patient status, length of stay, or other specific criteria determined by contracts with individual payers.
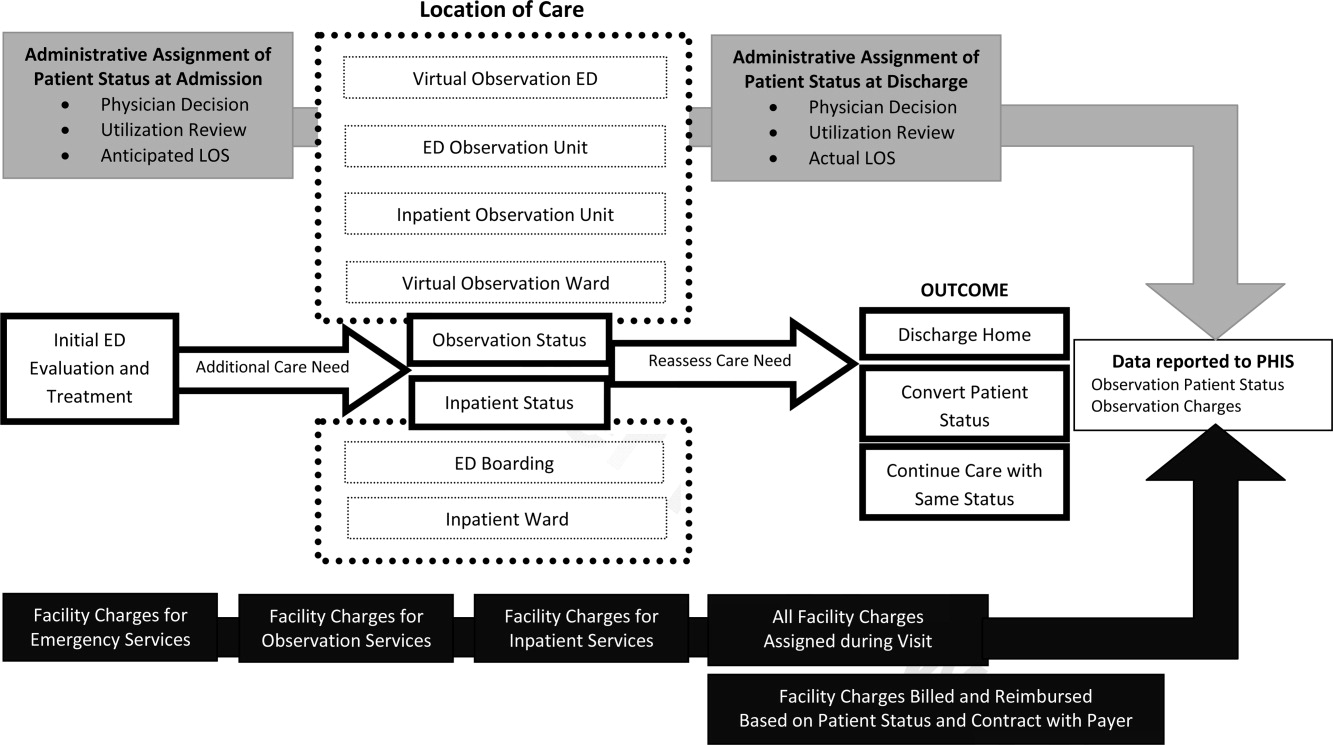
Survey 1: Classification of Observation Patients and Presence of Observation Units in PHIS Hospitals
According to responses to Survey 1, designated OUs were not widespread, present in only 12 of the 31 hospitals. No hospital reported treating all observation status patients exclusively in a designated OU. Observation status was defined by both duration of treatment and either level of care criteria or clinical care guidelines in 21 of the 31 hospitals responding to Survey 1. Of the remaining 10 hospitals, 1 reported that treatment duration alone defines observation status, and the others relied on prespecified observation criteria. When considering duration of treatment, hospitals variably indicated that anticipated or actual lengths of stay were used to determine observation status. Regarding the maximum hours a patient can be observed, 12 hospitals limited observation to 24 hours or fewer, 12 hospitals observed patients for no more than 36 to 48 hours, and the remaining 7 hospitals allowed observation periods of 72 hours or longer.
When admitting patients to observation status, 30 of 31 hospitals specified the criteria that were used to determine observation admissions. InterQual criteria, the most common response, were used by 23 of the 30 hospitals reporting specified criteria; the remaining 7 hospitals had developed hospital‐specific criteria or modified existing criteria, such as InterQual or Milliman, to determine observation status admissions. In addition to these criteria, 11 hospitals required a physician order for admission to observation status. Twenty‐four hospitals indicated that policies were in place to change patient status from observation to inpatient, or inpatient to observation, typically through processes of utilization review and application of criteria listed above.
Most hospitals indicated that they faced substantial variation in the standards used from one payer to another when considering reimbursement for care delivered under observation status. Hospitals noted that duration‐of‐carebased reimbursement practices included hourly rates, per diem, and reimbursement for only the first 24 or 48 hours of observation care. Hospitals identified that payers variably determined reimbursement for observation based on InterQual level of care criteria and Milliman care guidelines. One hospital reported that it was not their practice to bill for the observation bed.
Survey 2: Understanding Observation Patient Type Administrative Data Following ED Care Within PHIS Hospitals
Of the 20 hospitals responding to Survey 2, there were 2 hospitals that did not apply observation status to patients after ED care and 2 hospitals that did not provide complete responses. The remaining 16 hospitals provided information regarding observation status as applied to patients after receiving treatment in the ED. The settings available for observation care and patient groups treated within each area are presented in Table 2. In addition to the patient groups listed in Table 2, there were 4 hospitals where patients could be admitted to observation status directly from an outpatient clinic. All responding hospitals provided virtual observation care (ie, observation status is assigned but the patient is cared for in the existing ED or inpatient ward). Nine hospitals also provided observation care within a dedicated ED or ward‐based OU (ie, a separate clinical area in which observation patients are treated).
| Hospital No. | Available Observation Settings | Patient Groups Under Observation in Each Setting | UR to Assign Obs Status | When Obs Status Is Assigned | ||
|---|---|---|---|---|---|---|
| ED | Post‐Op | Test/Treat | ||||
| ||||||
| 1 | Virtual inpatient | X | X | X | Yes | Discharge |
| Ward‐based OU | X | X | No | |||
| 2 | Virtual inpatient | X | X | Yes | Admission | |
| Ward‐based OU | X | X | X | No | ||
| 3 | Virtual inpatient | X | X | X | Yes | Discharge |
| Ward‐based OU | X | X | X | Yes | ||
| ED OU | X | Yes | ||||
| Virtual ED | X | Yes | ||||
| 4 | Virtual inpatient | X | X | X | Yes | Discharge |
| ED OU | X | No | ||||
| Virtual ED | X | No | ||||
| 5 | Virtual inpatient | X | X | X | N/A | Discharge |
| 6 | Virtual inpatient | X | X | X | Yes | Discharge |
| 7 | Virtual inpatient | X | X | Yes | No response | |
| Ward‐based OU | X | Yes | ||||
| Virtual ED | X | Yes | ||||
| 8 | Virtual inpatient | X | X | X | Yes | Admission |
| 9 | Virtual inpatient | X | X | Yes | Discharge | |
| ED OU | X | Yes | ||||
| Virtual ED | X | Yes | ||||
| 10 | Virtual inpatient | X | X | X | Yes | Admission |
| ED OU | X | Yes | ||||
| 11 | Virtual inpatient | X | X | Yes | Discharge | |
| Ward‐based OU | X | X | Yes | |||
| ED OU | X | Yes | ||||
| Virtual ED | X | Yes | ||||
| 12 | Virtual inpatient | X | X | X | Yes | Admission |
| 13 | Virtual inpatient | X | X | N/A | Discharge | |
| Virtual ED | X | N/A | ||||
| 14 | Virtual inpatient | X | X | X | Yes | Both |
| 15 | Virtual inpatient | X | X | Yes | Admission | |
| Ward‐based OU | X | X | Yes | |||
| 16 | Virtual inpatient | X | Yes | Admission | ||
When asked to identify differences between clinical care delivered to patients admitted under virtual observation and those admitted under inpatient status, 14 of 16 hospitals selected the option There are no differences in the care delivery of these patients. The differences identified by 2 hospitals included patient care orders, treatment protocols, and physician documentation. Within the hospitals that reported utilization of virtual ED observation, 2 reported differences in care compared with other ED patients, including patient care orders, physician rounds, documentation, and discharge process. When admitted patients were boarded in the ED while awaiting an inpatient bed, 11 of 16 hospitals allowed for observation or inpatient level of care to be provided in the ED. Fourteen hospitals allow an admitted patient to be discharged home from boarding in the ED without ever receiving care in an inpatient bed. The discharge decision was made by ED providers in 7 hospitals, and inpatient providers in the other 7 hospitals.
Responses to questions providing detailed information on the process of utilization review were provided by 12 hospitals. Among this subset of hospitals, utilization review was consistently used to assign virtual inpatient observation status and was applied at admission (n = 6) or discharge (n = 8), depending on the hospital. One hospital applied observation status at both admission and discharge; 1 hospital did not provide a response. Responses to questions regarding utilization review are presented in Table 3.
| Survey Question | Yes N (%) | No N (%) |
|---|---|---|
| Preadmission utilization review is conducted at my hospital. | 3 (25) | 9 (75) |
| Utilization review occurs daily at my hospital. | 10 (83) | 2 (17) |
| A nonclinician can initiate an order for observation status. | 4 (33) | 8 (67) |
| Status can be changed after the patient has been discharged. | 10 (83) | 2 (17) |
| Inpatient status would always be assigned to a patient who receives less than 24 hours of care and meets inpatient criteria. | 9 (75) | 3 (25) |
| The same status would be assigned to different patients who received the same treatment of the same duration but have different payers. | 6 (50) | 6 (50) |
DISCUSSION
This is the largest descriptive study of pediatric observation status practices in US freestanding children's hospitals and, to our knowledge, the first to include information about both the ED and inpatient treatment environments. There are two important findings of this study. First, designated OUs were uncommon among the group of freestanding children's hospitals that reported observation patient data to PHIS in 2010. Second, despite the fact that hospitals reported observation care was delivered in a variety of settings, virtual inpatient observation status was nearly ubiquitous. Among the subset of hospitals that provided information about the clinical care delivered to patients admitted under virtual inpatient observation, hospitals frequently reported there were no differences in the care delivered to observation patients when compared with other inpatients.
The results of our survey indicate that designated OUs are not a commonly available model of observation care in the study hospitals. In fact, the vast majority of the hospitals used virtual inpatient observation care, which did not differ from the care delivered to a child admitted as an inpatient. ED‐based OUs, which often provide operationally and physically distinct care to observation patients, have been touted as cost‐effective alternatives to inpatient care,1820 resulting in fewer admissions and reductions in length of stay19, 20 without a resultant increase in return ED‐visits or readmissions.2123 Research is needed to determine the patient‐level outcomes for short‐stay patients in the variety of available treatment settings (eg, physically or operationally distinct OUs and virtual observation), and to evaluate these outcomes in comparison to results published from designated OUs. The operationally and physically distinct features of a designated OU may be required to realize the benefits of observation attributed to individual patients.
While observation care has been historically provided by emergency physicians, there is increasing interest in the role of inpatient providers in observation care.9 According to our survey, children were admitted to observation status directly from clinics, following surgical procedures, scheduled tests and treatment, or after evaluation and treatment in the ED. As many of these children undergo virtual observation in inpatient areas, the role of inpatient providers, such as pediatric hospitalists, in observation care may be an important area for future study, education, and professional development. Novel models of care, with hospitalists collaborating with emergency physicians, may be of benefit to the children who require observation following initial stabilization and treatment in the ED.24, 25
We identified variation between hospitals in the methods used to assign observation status to an episode of care, including a wide range of length of stay criteria and different approaches to utilization review. In addition, the criteria payers use to reimburse for observation varied between payers, even within individual hospitals. The results of our survey may be driven by issues of reimbursement and not based on a model of optimizing patient care outcomes using designated OUs. Variations in reimbursement may limit hospital efforts to refine models of observation care for children. Designated OUs have been suggested as a method for improving ED patient flow,26 increasing inpatient capacity,27 and reducing costs of care.28 Standardization of observation status criteria and consistent reimbursement for observation services may be necessary for hospitals to develop operationally and physically distinct OUs, which may be essential to achieving the proposed benefits of observation medicine on costs of care, patient flow, and hospital capacity.
LIMITATIONS
Our study results should be interpreted with the following limitations in mind. First, the surveys were distributed only to freestanding children's hospitals who participate in PHIS. As a result, our findings may not be generalizable to the experiences of other children's hospitals or general hospitals caring for children. Questions in Survey 2 were focused on understanding observation care, delivered to patients following ED care, which may differ from observation practices related to a direct admission or following scheduled procedures, tests, or treatments. It is important to note that, hospitals that do not report observation status patient data to PHIS are still providing care to children with acute conditions that respond to brief periods of hospital treatment, even though it is not labeled observation. However, it was beyond the scope of this study to characterize the care delivered to all patients who experience a short stay.
The second main limitation of our study is the lower response rate to Survey 2. In addition, several surveys contained incomplete responses which further limits our sample size for some questions, specifically those related to utilization review. The lower response to Survey 2 could be related to the timing of the distribution of the 2 surveys, or to the information contained in the introductory e‐mail describing Survey 2. Hospitals with designated observation units, or where observation status care has been receiving attention, may have been more likely to respond to our survey, which may bias our results to reflect the experiences of hospitals experiencing particular successes or challenges with observation status care. A comparison of known hospital characteristics revealed no differences between hospitals that did and did not provide responses to Survey 2, but other unmeasured differences may exist.
CONCLUSION
Observation status is assigned using duration of treatment, clinical care guidelines, and level of care criteria, and is defined differently by individual hospitals and payers. Currently, the most widely available setting for pediatric observation status is within a virtual inpatient unit. Our results suggest that the care delivered to observation patients in virtual inpatient units is consistent with care provided to other inpatients. As such, observation status is largely an administrative/billing designation, which does not appear to reflect differences in clinical care. A consistent approach to the assignment of patients to observation status, and treatment of patients under observation among hospitals and payers, may be necessary to compare quality outcomes. Studies of the clinical care delivery and processes of care for short‐stay patients are needed to optimize models of pediatric observation care.
- .Observation medicine: the healthcare system's tincture of time. In: Graff LG, ed.Principles of Observation Medicine.Dallas, TX:American College of Emergency Physicians;2010. Available at: http://www.acep.org/content.aspx?id=46142. Accessed February 18,year="2011"2011.
- .Hospital ‘observation’ status a matter of billing.The Columbus Dispatch. February 14,2011.
- .Hospital payments downgraded.Philadelphia Business Journal. February 18,2011.
- .Medicare rules give full hospital benefits only to those with ‘inpatient’ status.The Washington Post. September 7,2010.
- .Hospitals caught between a rock and a hard place over observation.Health Leaders Media. September 15,2010.
- .AHA: observation status fears on the rise.Health Leaders Media. October 29,2010.
- .Put your hospital bill under a microscope.The New York Times. September 13,2010.
- Medicare Hospital Manual Section 455.Washington, DC:Department of Health and Human Services, Centers for Medicare and Medicaid Services;2001.
- ,,,,.The Observation Unit: An Operational Overview for the Hospitalist. Society of Hospital Medicine White Paper. May 21, 2009. Available at: http://www.hospitalmedicine.org/Content/NavigationMenu/Publications/White Papers/White_Papers.htm. Accessed May 21,2009.
- ,,,,.Utilization and unexpected hospitalization rates of a pediatric emergency department 23‐hour observation unit.Pediatr Emerg Care.2008;24(9):589–594.
- ,,.The pediatric hybrid observation unit: an analysis of 6477 consecutive patient encounters.Pediatrics.2005;115(5):e535–e542.
- ,,,,.Pediatric observation units in the United States: a systematic review.J Hosp Med.2010;5(3):172–182.
- ,,.Pediatric emergency department directors' benchmarking survey: fiscal year 2001.Pediatr Emerg Care.2003;19(3):143–147.
- ,,,.Pediatric observation status beds on an inpatient unit: an integrated care model.Pediatr Emerg Care.2004;20(1):17–21.
- ,,,.Impact of a short stay unit on asthma patients admitted to a tertiary pediatric hospital.Qual Manag Health Care.1997;6(1):14–22.
- ,,,.A national survey of observation units in the United States.Am J Emerg Med.2003;21(7):529–533.
- ,,,.A survey of observation units in the United States.Am J Emerg Med.1989;7(6):576–580.
- ,,.When the patient requires observation not hospitalization.J Nurs Admin.1988;18(10):20–23.
- ,,.A reduction in hospitalization, length of stay, and hospital charges for croup with the institution of a pediatric observation unit.Am J Emerg Med.2006;24(7):818–821.
- ,,.Outpatient oral rehydration in the United States.Am J Dis Child.1986;140(3):211–215.
- ,,,,.Pediatric closed head injuries treated in an observation unit.Pediatr Emerg Care.2005;21(10):639–644.
- ,,,.Use of pediatric observation unit for treatment of children with dehydration caused by gastroenteritis.Pediatr Emerg Care.2006;22(1):1–6.
- ,,,.Children with asthma admitted to a pediatric observation unit.Pediatr Emerg Care.2005;21(10):645–649.
- ,,,.Redefining the community pediatric hospitalist: the combined pediatric ED/inpatient unit.Pediatr Emerg Care.2007;23(1):33–37.
- ,,,.Program description: a hospitalist‐run, medical short‐stay unit in a teaching hospital.Can Med Assoc J.2000;163(11):1477–1480.
- ,.Impact of an observation unit and an emergency department‐admitted patient transfer mandate in decreasing overcrowding in a pediatric emergency department: a discrete event simulation exercise.Pediatr Emerg Care.2009;25(3):160–163.
- ,,, et al.Children's hospitals do not acutely respond to high occupancy.Pediatrics.125(5):974–981.
- ,,,,,.Trends in high‐turnover stays among children hospitalized in the United States, 1993‐2003.Pediatrics.2009;123(3):996–1002.
Observation medicine has grown in recent decades out of changes in policies for hospital reimbursement, requirements for patients to meet admission criteria to qualify for inpatient admission, and efforts to avoid unnecessary or inappropriate admissions.1 Emergency physicians are frequently faced with patients who are too sick to be discharged home, but do not clearly meet criteria for an inpatient status admission. These patients often receive extended outpatient services (typically extending 24 to 48 hours) under the designation of observation status, in order to determine their response to treatment and need for hospitalization.
Observation care delivered to adult patients has increased substantially in recent years, and the confusion around the designation of observation versus inpatient care has received increasing attention in the lay press.27 According to the Centers for Medicare and Medicaid Services (CMS)8:
Observation care is a well‐defined set of specific, clinically appropriate services, which include ongoing short term treatment, assessment, and reassessment before a decision can be made regarding whether patients will require further treatment as hospital inpatients. Observation services are commonly ordered for patients who present to the emergency department and who then require a significant period of treatment or monitoring in order to make a decision concerning their admission or discharge.
Observation status is an administrative label that is applied to patients who do not meet inpatient level of care criteria, as defined by third parties such as InterQual. These criteria usually include a combination of the patient's clinical diagnoses, severity of illness, and expected needs for monitoring and interventions, in order to determine the admission status to which the patient may be assigned (eg, observation, inpatient, or intensive care). Observation services can be provided, in a variety of settings, to those patients who do not meet inpatient level of care but require a period of observation. Some hospitals provide observation care in discrete units in the emergency department (ED) or specific inpatient unit, and others have no designated unit but scatter observation patients throughout the institution, termed virtual observation units.9
For more than 30 years, observation unit (OU) admission has offered an alternative to traditional inpatient hospitalization for children with a variety of acute conditions.10, 11 Historically, the published literature on observation care for children in the United States has been largely based in dedicated emergency department OUs.12 Yet, in a 2001 survey of 21 pediatric EDs, just 6 reported the presence of a 23‐hour unit.13 There are single‐site examples of observation care delivered in other settings.14, 15 In 2 national surveys of US General Hospitals, 25% provided observation services in beds adjacent to the ED, and the remainder provided observation services in hospital inpatient units.16, 17 However, we are not aware of any previous multi‐institution studies exploring hospital‐wide practices related to observation care for children.
Recognizing that observation status can be designated using various standards, and that observation care can be delivered in locations outside of dedicated OUs,9 we developed 2 web‐based surveys to examine the current models of pediatric observation medicine in US children's hospitals. We hypothesized that observation care is most commonly applied as a billing designation and does not necessarily represent care delivered in a structurally or functionally distinct OU, nor does it represent a difference in care provided to those patients with inpatient designation.
METHODS
Study Design
Two web‐based surveys were distributed, in April 2010, to the 42 freestanding, tertiary care children's hospitals affiliated with the Child Health Corporation of America (CHCA; Shawnee Mission, KS) which contribute data to the Pediatric Health Information System (PHIS) database. The PHIS is a national administrative database that contains resource utilization data from participating hospitals located in noncompeting markets of 27 states plus the District of Columbia. These hospitals account for 20% of all tertiary care children's hospitals in the United States.
Survey Content
Survey 1
A survey of hospital observation status practices has been developed by CHCA as a part of the PHIS data quality initiative (see Supporting Appendix: Survey 1 in the online version of this article). Hospitals that did not provide observation patient data to PHIS were excluded after an initial screening question. This survey obtained information regarding the designation of observation status within each hospital. Hospitals provided free‐text responses to questions related to the criteria used to define observation, and to admit patients into observation status. Fixed‐choice response questions were used to determine specific observation status utilization criteria and clinical guidelines (eg, InterQual and Milliman) used by hospitals for the designation of observation status to patients.
Survey 2
We developed a detailed follow‐up survey in order to characterize the structures and processes of care associated with observation status (see Supporting Appendix: Survey 2 in the online version of this article). Within the follow‐up survey, an initial screening question was used to determine all types of patients to which observation status is assigned within the responding hospitals. All other questions in Survey 2 were focused specifically on those patients who required additional care following ED evaluation and treatment. Fixed‐choice response questions were used to explore differences in care for patients under observation and those admitted as inpatients. We also inquired of hospital practices related to boarding of patients in the ED while awaiting admission to an inpatient bed.
Survey Distribution
Two web‐based surveys were distributed to all 42 CHCA hospitals that contribute data to PHIS. During the month of April 2010, each hospital's designated PHIS operational contact received e‐mail correspondence requesting their participation in each survey. Within hospitals participating in PHIS, Operational Contacts have been assigned to serve as the day‐to‐day PHIS contact person based upon their experience working with the PHIS data. The Operational Contacts are CHCA's primary contact for issues related to the hospital's data quality and reporting to PHIS. Non‐responders were contacted by e‐mail for additional requests to complete the surveys. Each e‐mail provided an introduction to the topic of the survey and a link to complete the survey. The e‐mail requesting participation in Survey 1 was distributed the first week of April 2010, and the survey was open for responses during the first 3 weeks of the month. The e‐mail requesting participation in Survey 2 was sent the third week of April 2010, and the survey was open for responses during the subsequent 2 weeks.
DATA ANALYSIS
Survey responses were collected and are presented as a descriptive summary of results. Hospital characteristics were summarized with medians and interquartile ranges for continuous variables, and with percents for categorical variables. Characteristics were compared between hospitals that responded and those that did not respond to Survey 2 using Wilcoxon rank‐sum tests and chi‐square tests as appropriate. All analyses were performed using SAS v.9.2 (SAS Institute, Cary, NC), and a P value <0.05 was considered statistically significant. The study was reviewed by the University of Michigan Institutional Review Board and considered exempt.
RESULTS
Responses to Survey 1 were available from 37 of 42 (88%) of PHIS hospitals (Figure 1). For Survey 2, we received responses from 20 of 42 (48%) of PHIS hospitals. Based on information available from Survey 1, we know that 20 of the 31 (65%) PHIS hospitals that report observation status patient data to PHIS responded to Survey 2. Characteristics of the hospitals responding and not responding to Survey 2 are presented in Table 1. Respondents provided hospital identifying information which allowed for the linkage of data, from Survey 1, to 17 of the 20 hospitals responding to Survey 2. We did not have information available to link responses from 3 hospitals.
| Respondent N = 20 | Non‐Respondent N = 22 | P Value | |
|---|---|---|---|
| |||
| No. of inpatient beds Median [IQR] (excluding Obstetrics) | 245 [219283] | 282 [250381] | 0.076 |
| Annual admissions Median [IQR] (excluding births) | 11,658 [8,64213,213] | 13,522 [9,83018,705] | 0.106 |
| ED volume Median [IQR] | 60,528 [47,85082,955] | 64,486 [47,38684,450] | 0.640 |
| Percent government payer Median [IQR] | 53% [4662] | 49% [4158] | 0.528 |
| Region | |||
| Northeast | 37% | 0% | 0.021 |
| Midwest | 21% | 33% | |
| South | 21% | 50% | |
| West | 21% | 17% | |
| Reports observation status patients to PHIS | 85% | 90% | 0.555 |
Based on responses to the surveys and our knowledge of data reported to PHIS, our current understanding of patient flow from ED through observation to discharge home, and the application of observation status to the encounter, is presented in Figure 2. According to free‐text responses to Survey 1, various methods were applied to designate observation status (gray shaded boxes in Figure 2). Fixed‐choice responses to Survey 2 revealed that observation status patients were cared for in a variety of locations within hospitals, including ED beds, designated observation units, and inpatient beds (dashed boxes in Figure 2). Not every facility utilized all of the listed locations for observation care. Space constraints could dictate the location of care, regardless of patient status (eg, observation vs inpatient), in hospitals with more than one location of care available to observation patients. While patient status could change during a visit, only the final patient status at discharge enters the administrative record submitted to PHIS (black boxes in Figure 2). Facility charges for observation remained a part of the visit record and were reported to PHIS. Hospitals may or may not bill for all assigned charges depending on patient status, length of stay, or other specific criteria determined by contracts with individual payers.
Survey 1: Classification of Observation Patients and Presence of Observation Units in PHIS Hospitals
According to responses to Survey 1, designated OUs were not widespread, present in only 12 of the 31 hospitals. No hospital reported treating all observation status patients exclusively in a designated OU. Observation status was defined by both duration of treatment and either level of care criteria or clinical care guidelines in 21 of the 31 hospitals responding to Survey 1. Of the remaining 10 hospitals, 1 reported that treatment duration alone defines observation status, and the others relied on prespecified observation criteria. When considering duration of treatment, hospitals variably indicated that anticipated or actual lengths of stay were used to determine observation status. Regarding the maximum hours a patient can be observed, 12 hospitals limited observation to 24 hours or fewer, 12 hospitals observed patients for no more than 36 to 48 hours, and the remaining 7 hospitals allowed observation periods of 72 hours or longer.
When admitting patients to observation status, 30 of 31 hospitals specified the criteria that were used to determine observation admissions. InterQual criteria, the most common response, were used by 23 of the 30 hospitals reporting specified criteria; the remaining 7 hospitals had developed hospital‐specific criteria or modified existing criteria, such as InterQual or Milliman, to determine observation status admissions. In addition to these criteria, 11 hospitals required a physician order for admission to observation status. Twenty‐four hospitals indicated that policies were in place to change patient status from observation to inpatient, or inpatient to observation, typically through processes of utilization review and application of criteria listed above.
Most hospitals indicated that they faced substantial variation in the standards used from one payer to another when considering reimbursement for care delivered under observation status. Hospitals noted that duration‐of‐carebased reimbursement practices included hourly rates, per diem, and reimbursement for only the first 24 or 48 hours of observation care. Hospitals identified that payers variably determined reimbursement for observation based on InterQual level of care criteria and Milliman care guidelines. One hospital reported that it was not their practice to bill for the observation bed.
Survey 2: Understanding Observation Patient Type Administrative Data Following ED Care Within PHIS Hospitals
Of the 20 hospitals responding to Survey 2, there were 2 hospitals that did not apply observation status to patients after ED care and 2 hospitals that did not provide complete responses. The remaining 16 hospitals provided information regarding observation status as applied to patients after receiving treatment in the ED. The settings available for observation care and patient groups treated within each area are presented in Table 2. In addition to the patient groups listed in Table 2, there were 4 hospitals where patients could be admitted to observation status directly from an outpatient clinic. All responding hospitals provided virtual observation care (ie, observation status is assigned but the patient is cared for in the existing ED or inpatient ward). Nine hospitals also provided observation care within a dedicated ED or ward‐based OU (ie, a separate clinical area in which observation patients are treated).
| Hospital No. | Available Observation Settings | Patient Groups Under Observation in Each Setting | UR to Assign Obs Status | When Obs Status Is Assigned | ||
|---|---|---|---|---|---|---|
| ED | Post‐Op | Test/Treat | ||||
| ||||||
| 1 | Virtual inpatient | X | X | X | Yes | Discharge |
| Ward‐based OU | X | X | No | |||
| 2 | Virtual inpatient | X | X | Yes | Admission | |
| Ward‐based OU | X | X | X | No | ||
| 3 | Virtual inpatient | X | X | X | Yes | Discharge |
| Ward‐based OU | X | X | X | Yes | ||
| ED OU | X | Yes | ||||
| Virtual ED | X | Yes | ||||
| 4 | Virtual inpatient | X | X | X | Yes | Discharge |
| ED OU | X | No | ||||
| Virtual ED | X | No | ||||
| 5 | Virtual inpatient | X | X | X | N/A | Discharge |
| 6 | Virtual inpatient | X | X | X | Yes | Discharge |
| 7 | Virtual inpatient | X | X | Yes | No response | |
| Ward‐based OU | X | Yes | ||||
| Virtual ED | X | Yes | ||||
| 8 | Virtual inpatient | X | X | X | Yes | Admission |
| 9 | Virtual inpatient | X | X | Yes | Discharge | |
| ED OU | X | Yes | ||||
| Virtual ED | X | Yes | ||||
| 10 | Virtual inpatient | X | X | X | Yes | Admission |
| ED OU | X | Yes | ||||
| 11 | Virtual inpatient | X | X | Yes | Discharge | |
| Ward‐based OU | X | X | Yes | |||
| ED OU | X | Yes | ||||
| Virtual ED | X | Yes | ||||
| 12 | Virtual inpatient | X | X | X | Yes | Admission |
| 13 | Virtual inpatient | X | X | N/A | Discharge | |
| Virtual ED | X | N/A | ||||
| 14 | Virtual inpatient | X | X | X | Yes | Both |
| 15 | Virtual inpatient | X | X | Yes | Admission | |
| Ward‐based OU | X | X | Yes | |||
| 16 | Virtual inpatient | X | Yes | Admission | ||
When asked to identify differences between clinical care delivered to patients admitted under virtual observation and those admitted under inpatient status, 14 of 16 hospitals selected the option There are no differences in the care delivery of these patients. The differences identified by 2 hospitals included patient care orders, treatment protocols, and physician documentation. Within the hospitals that reported utilization of virtual ED observation, 2 reported differences in care compared with other ED patients, including patient care orders, physician rounds, documentation, and discharge process. When admitted patients were boarded in the ED while awaiting an inpatient bed, 11 of 16 hospitals allowed for observation or inpatient level of care to be provided in the ED. Fourteen hospitals allow an admitted patient to be discharged home from boarding in the ED without ever receiving care in an inpatient bed. The discharge decision was made by ED providers in 7 hospitals, and inpatient providers in the other 7 hospitals.
Responses to questions providing detailed information on the process of utilization review were provided by 12 hospitals. Among this subset of hospitals, utilization review was consistently used to assign virtual inpatient observation status and was applied at admission (n = 6) or discharge (n = 8), depending on the hospital. One hospital applied observation status at both admission and discharge; 1 hospital did not provide a response. Responses to questions regarding utilization review are presented in Table 3.
| Survey Question | Yes N (%) | No N (%) |
|---|---|---|
| Preadmission utilization review is conducted at my hospital. | 3 (25) | 9 (75) |
| Utilization review occurs daily at my hospital. | 10 (83) | 2 (17) |
| A nonclinician can initiate an order for observation status. | 4 (33) | 8 (67) |
| Status can be changed after the patient has been discharged. | 10 (83) | 2 (17) |
| Inpatient status would always be assigned to a patient who receives less than 24 hours of care and meets inpatient criteria. | 9 (75) | 3 (25) |
| The same status would be assigned to different patients who received the same treatment of the same duration but have different payers. | 6 (50) | 6 (50) |
DISCUSSION
This is the largest descriptive study of pediatric observation status practices in US freestanding children's hospitals and, to our knowledge, the first to include information about both the ED and inpatient treatment environments. There are two important findings of this study. First, designated OUs were uncommon among the group of freestanding children's hospitals that reported observation patient data to PHIS in 2010. Second, despite the fact that hospitals reported observation care was delivered in a variety of settings, virtual inpatient observation status was nearly ubiquitous. Among the subset of hospitals that provided information about the clinical care delivered to patients admitted under virtual inpatient observation, hospitals frequently reported there were no differences in the care delivered to observation patients when compared with other inpatients.
The results of our survey indicate that designated OUs are not a commonly available model of observation care in the study hospitals. In fact, the vast majority of the hospitals used virtual inpatient observation care, which did not differ from the care delivered to a child admitted as an inpatient. ED‐based OUs, which often provide operationally and physically distinct care to observation patients, have been touted as cost‐effective alternatives to inpatient care,1820 resulting in fewer admissions and reductions in length of stay19, 20 without a resultant increase in return ED‐visits or readmissions.2123 Research is needed to determine the patient‐level outcomes for short‐stay patients in the variety of available treatment settings (eg, physically or operationally distinct OUs and virtual observation), and to evaluate these outcomes in comparison to results published from designated OUs. The operationally and physically distinct features of a designated OU may be required to realize the benefits of observation attributed to individual patients.
While observation care has been historically provided by emergency physicians, there is increasing interest in the role of inpatient providers in observation care.9 According to our survey, children were admitted to observation status directly from clinics, following surgical procedures, scheduled tests and treatment, or after evaluation and treatment in the ED. As many of these children undergo virtual observation in inpatient areas, the role of inpatient providers, such as pediatric hospitalists, in observation care may be an important area for future study, education, and professional development. Novel models of care, with hospitalists collaborating with emergency physicians, may be of benefit to the children who require observation following initial stabilization and treatment in the ED.24, 25
We identified variation between hospitals in the methods used to assign observation status to an episode of care, including a wide range of length of stay criteria and different approaches to utilization review. In addition, the criteria payers use to reimburse for observation varied between payers, even within individual hospitals. The results of our survey may be driven by issues of reimbursement and not based on a model of optimizing patient care outcomes using designated OUs. Variations in reimbursement may limit hospital efforts to refine models of observation care for children. Designated OUs have been suggested as a method for improving ED patient flow,26 increasing inpatient capacity,27 and reducing costs of care.28 Standardization of observation status criteria and consistent reimbursement for observation services may be necessary for hospitals to develop operationally and physically distinct OUs, which may be essential to achieving the proposed benefits of observation medicine on costs of care, patient flow, and hospital capacity.
LIMITATIONS
Our study results should be interpreted with the following limitations in mind. First, the surveys were distributed only to freestanding children's hospitals who participate in PHIS. As a result, our findings may not be generalizable to the experiences of other children's hospitals or general hospitals caring for children. Questions in Survey 2 were focused on understanding observation care, delivered to patients following ED care, which may differ from observation practices related to a direct admission or following scheduled procedures, tests, or treatments. It is important to note that, hospitals that do not report observation status patient data to PHIS are still providing care to children with acute conditions that respond to brief periods of hospital treatment, even though it is not labeled observation. However, it was beyond the scope of this study to characterize the care delivered to all patients who experience a short stay.
The second main limitation of our study is the lower response rate to Survey 2. In addition, several surveys contained incomplete responses which further limits our sample size for some questions, specifically those related to utilization review. The lower response to Survey 2 could be related to the timing of the distribution of the 2 surveys, or to the information contained in the introductory e‐mail describing Survey 2. Hospitals with designated observation units, or where observation status care has been receiving attention, may have been more likely to respond to our survey, which may bias our results to reflect the experiences of hospitals experiencing particular successes or challenges with observation status care. A comparison of known hospital characteristics revealed no differences between hospitals that did and did not provide responses to Survey 2, but other unmeasured differences may exist.
CONCLUSION
Observation status is assigned using duration of treatment, clinical care guidelines, and level of care criteria, and is defined differently by individual hospitals and payers. Currently, the most widely available setting for pediatric observation status is within a virtual inpatient unit. Our results suggest that the care delivered to observation patients in virtual inpatient units is consistent with care provided to other inpatients. As such, observation status is largely an administrative/billing designation, which does not appear to reflect differences in clinical care. A consistent approach to the assignment of patients to observation status, and treatment of patients under observation among hospitals and payers, may be necessary to compare quality outcomes. Studies of the clinical care delivery and processes of care for short‐stay patients are needed to optimize models of pediatric observation care.
- .Observation medicine: the healthcare system's tincture of time. In: Graff LG, ed.Principles of Observation Medicine.Dallas, TX:American College of Emergency Physicians;2010. Available at: http://www.acep.org/content.aspx?id=46142. Accessed February 18,year="2011"2011.
- .Hospital ‘observation’ status a matter of billing.The Columbus Dispatch. February 14,2011.
- .Hospital payments downgraded.Philadelphia Business Journal. February 18,2011.
- .Medicare rules give full hospital benefits only to those with ‘inpatient’ status.The Washington Post. September 7,2010.
- .Hospitals caught between a rock and a hard place over observation.Health Leaders Media. September 15,2010.
- .AHA: observation status fears on the rise.Health Leaders Media. October 29,2010.
- .Put your hospital bill under a microscope.The New York Times. September 13,2010.
- Medicare Hospital Manual Section 455.Washington, DC:Department of Health and Human Services, Centers for Medicare and Medicaid Services;2001.
- ,,,,.The Observation Unit: An Operational Overview for the Hospitalist. Society of Hospital Medicine White Paper. May 21, 2009. Available at: http://www.hospitalmedicine.org/Content/NavigationMenu/Publications/White Papers/White_Papers.htm. Accessed May 21,2009.
- ,,,,.Utilization and unexpected hospitalization rates of a pediatric emergency department 23‐hour observation unit.Pediatr Emerg Care.2008;24(9):589–594.
- ,,.The pediatric hybrid observation unit: an analysis of 6477 consecutive patient encounters.Pediatrics.2005;115(5):e535–e542.
- ,,,,.Pediatric observation units in the United States: a systematic review.J Hosp Med.2010;5(3):172–182.
- ,,.Pediatric emergency department directors' benchmarking survey: fiscal year 2001.Pediatr Emerg Care.2003;19(3):143–147.
- ,,,.Pediatric observation status beds on an inpatient unit: an integrated care model.Pediatr Emerg Care.2004;20(1):17–21.
- ,,,.Impact of a short stay unit on asthma patients admitted to a tertiary pediatric hospital.Qual Manag Health Care.1997;6(1):14–22.
- ,,,.A national survey of observation units in the United States.Am J Emerg Med.2003;21(7):529–533.
- ,,,.A survey of observation units in the United States.Am J Emerg Med.1989;7(6):576–580.
- ,,.When the patient requires observation not hospitalization.J Nurs Admin.1988;18(10):20–23.
- ,,.A reduction in hospitalization, length of stay, and hospital charges for croup with the institution of a pediatric observation unit.Am J Emerg Med.2006;24(7):818–821.
- ,,.Outpatient oral rehydration in the United States.Am J Dis Child.1986;140(3):211–215.
- ,,,,.Pediatric closed head injuries treated in an observation unit.Pediatr Emerg Care.2005;21(10):639–644.
- ,,,.Use of pediatric observation unit for treatment of children with dehydration caused by gastroenteritis.Pediatr Emerg Care.2006;22(1):1–6.
- ,,,.Children with asthma admitted to a pediatric observation unit.Pediatr Emerg Care.2005;21(10):645–649.
- ,,,.Redefining the community pediatric hospitalist: the combined pediatric ED/inpatient unit.Pediatr Emerg Care.2007;23(1):33–37.
- ,,,.Program description: a hospitalist‐run, medical short‐stay unit in a teaching hospital.Can Med Assoc J.2000;163(11):1477–1480.
- ,.Impact of an observation unit and an emergency department‐admitted patient transfer mandate in decreasing overcrowding in a pediatric emergency department: a discrete event simulation exercise.Pediatr Emerg Care.2009;25(3):160–163.
- ,,, et al.Children's hospitals do not acutely respond to high occupancy.Pediatrics.125(5):974–981.
- ,,,,,.Trends in high‐turnover stays among children hospitalized in the United States, 1993‐2003.Pediatrics.2009;123(3):996–1002.
Copyright © 2011 Society of Hospital Medicine

Pediatric OUs in the United States
The first observation units were implemented more than 40 years ago with the goal of reducing the number and duration of inpatient stays. Since then, observation units (OUs) have evolved as a safe alternative to hospitalization14 for the delivery of finite periods of care, typically less than 24 hours.58 Observation services allow for time to determine the need for hospitalization in cases that are unclear after their initial evaluation and treatment.9 Observation status is an administrative classification related to reimbursement that can be applied to patients whose diagnosis, treatment, stabilization, and discharge can reasonably be expected within 24 hours.10, 11 The site of care for observation is dependent in part upon existing facility structures; some institutions utilize virtual OUs within the emergency department (ED) or hospital ward, while others have dedicated, geographically distinct OUs, which may function as an extension of either the ED or inpatient settings.9
OUs have been instrumental in providing care to adult patients with chest pain, asthma, and acute infections.1218 Recently, there has been an increase in the number of publications from pediatric OUs in the United States and abroad. Observation may be a preferred model of care for select pediatric patients, as hospitalized children often experience brief stays.1921 Previous reviews on this model of care have combined adult and pediatric literature and have included research from countries with healthcare structures that differ considerably from the United States.2224 To date, no systematic review has summarized the pediatric OU literature with a focus on the US healthcare system.
As payers and hospitals seek cost‐effective alternatives to traditional inpatient care, geographically distinct OUs may become integral to the future of healthcare delivery for children. This systematic review provides a descriptive overview of the structure and function of pediatric OUs in the United States. We also scrutinize the outcome measures presented in the included publications and propose future directions for research to improve both observation unit care, as well as the care delivered to patients under observation status within general inpatient or ED settings.
Methods
Literature Search
With the assistance of a health services librarian, a search of the following electronic databases from January 1, 1950 through February 5, 2009 was conducted: Medline, Web of Science, Cumulative Index to Nursing and Allied Health Literature (CINAHL), Health Care Advisory Board (HCAB), Lexis‐Nexis, National Guideline Clearinghouse, and Cochrane Reviews. Key words used for the Boolean search are included in Appendix A. In addition, we conducted a manual search of reference lists from reviews, guidelines, and articles meeting inclusion criteria.
We included English language peer‐reviewed publications that reported on pediatric OU care in the United States. Studies were included if they reported outcomes including lengths of stay, admission from observation rates, return visit rates, costs or charges. Descriptive publications of pediatric OU structure and function were also included. Studies were excluded if they were conducted outside the United States, evaluated psychiatric or intensive care, reported on observation status in an ED without an OU or observation status on a traditional inpatient ward. Two reviewers (M.M. and C.K.) identified articles for inclusion. Any disagreements between the reviewers were resolved by discussion and consensus agreement. Interrater reliability was assessed using the kappa statistic.
Quality Assessment
The quality of each study was rated using the Oxford Centre for Evidence‐based Medicine levels of evidence.25 With this system, levels of evidence range from 1a (homogeneous systematic review of randomized, controlled trials) to 5 (expert opinion without explicit critical appraisal).
Data Synthesis
Data on study design, OU characteristics, patient populations, and outcomes were extracted using a standardized form. Heterogeneity of study design, interventions, and outcomes precluded the ability to conduct meta‐analyses.
Results
A systematic search of the electronic databases identified 222 unique citations (Figure 1). A total of 107 abstracts were evaluated. We identified 48 articles for full‐text review, of which 18 met inclusion criteria. Hand search of references yielded 24 additional articles, of which 3 met inclusion criteria. Interrater agreement for selected articles was high at 98% (kappa = 0.85).
Observation Unit Characteristics
The majority of research on OUs has been conducted at large academic pediatric centers. One publication was from a community hospital.26 These studies present data on more than 22,000 children cared for in OUs of 11 hospitals over a 32‐year time span. Most studies were level 2 evidence: 2b, retrospective cohort studies and low‐quality randomized, controlled trials; or 2c, outcomes research. Three were descriptive and not assigned a formal evidence level.2729
Table 1 highlights general features of U.S. pediatric OUs. Five institutions renovated or expanded clinical space in order to open the OU.27, 2932 Units ranged in size from 3 to 23 beds. The OU was located in or near the ED in all but 2 hospitals, which had ward‐based units. The ED was the primary entry point into the OU with only 2 open model units accepting patients from other settings.5, 32 The annual number of observation cases ranged from 1000 to 3000 in children's hospitals. Approximately 500 ward‐based observation cases per year were cared for in the single community hospital studied. Three reports included time trends showing increased OU utilization over study years.5, 30, 31
| Publication (Year); Condition | Study Design; Level of Evidence; Time Frame; Sample Size | Hospital; Observation Setting; Year Opened | Site | Beds | Entry Point | Staffing; Physicians; Nurses |
|---|---|---|---|---|---|---|
| ||||||
| Gururaj et al.43 (1972); all conditions | Retrospective cohort; 2c; 1 year; 437 cases under observation | King's County Downstate Brooklyn; short‐stay unit | ED | 3 | Not reported | Pediatric residents; general pediatricians |
| Ellerstein and Sullivan,32 (1980); all conditions | Retrospective cohort; 2c; 6 years; 5858 cases of unscheduled care plus 1403 elective surgery cases | Children's Hospital Buffalo; observation unit; 1972 | ED | 8 | ED, clinic, procedure/OR | Primary care pediatricians; other specialists; pediatric residents |
| O'Brien et al.37 (1980); asthma | Retrospective cohort; 2c; 1 month; 434 cases of asthma, 328 discharged directly from ED, 106 treated in holding unit | Children's National DC; holding unit | ED | 6 | ED | 1‐2 pediatric residents; 1‐2 nurses |
| Willert et al.35 (1985); asthma | Randomized*; 2b; 578 cases of asthma; 166 cases 1.5 hours postaminophylline, 103 randomized, 52 to holding unit | Children's Memorial Chicago; holding room | ED | 5 | ED | General pediatricians; pediatric residents; PEM nurses |
| Listernick et al.38 (1986); dehydration | Randomized; 2b; 29 cases of dehydration; 22 to holding unit | Children's Memorial Chicago | ||||
| Balik et al.31 (1988); all conditions | Descriptive; none given | Minneapolis Children's; short‐stay unit observation area; 1985 | Day surgery area adjacent to ED | Not reported | Not reported | General pediatricians; pediatric nurses (shared with ED) |
| Marks et al.7 (1997); all conditions | Retrospective cohort; 2c; 5 months; 968 cases in short‐stay unit | Children's Hospital Boston; short‐stay unit; 1994 | Ward | 4‐18 | ED | Primary care pediatricians; PEM physicians; pediatric residents; pediatric nurses; 1:6 nurse:patient ratio |
| Marks et al.7 (1997); asthma | Pre‐post; 2b; 400 cases of asthma; 102 pre/298 post short‐stay unit | Children's Hospital Boston | ||||
| Wiley et al.6 (1998); all conditions | Retrospective cohort; 2c; 1 year; 805 cases of unscheduled observation; plus 595 scheduled cases | Connecticut Children's; outpatient extended treatment site | ED | 10 | Not reported | PEM physicians; other specialists; 1:5 nurse:patient ratio |
| Scribano et al.65 (2001); all conditions | Retrospective cohort; 2b; 2 years; 1798 cases under observation | Connecticut Children's | ||||
| Leduc et al.30 (2002); all conditions | Retrospective cohort; 2c; 6 months; 686 cases under observation (4.8% of ED visits) | Children's Hospital Denver; OU | ED | 6 | Not reported | Not reported |
| Bajaj and Roback,30 (2003); intussusception | Retrospective cohort; 2b; 4.5 years; 78 cases of intussusception (51 under observation) | Children's Hospital Denver | ||||
| Wathen et al.36 (2004); dehydration | Convenience sample; 2c; 10 months; 182 cases of dehydration (48 under observation) | Children's Hospital Denver | ||||
| Crocetti et al.26 (2004); all conditions | Retrospective cohort; 2b; 2 years; 956 cases under observation | John Hopkin's Bayview; observation status beds; 1997 | Ward | Not reported | 99% ED 1% other location | General pediatricians covering ED and ward |
| Silvestri et al.29 (2005); all conditions | Descriptive; none given | Children's Hospital of Philadelphia; OU; 1999 | ED | 12 | ED | PEM physicians; PEM fellows; urgent care pediatricians; ED nurse practitioner; inpatient nurses |
| Alpern et al.34 (2008); all conditions | Prospective cohort; 1b; 30 months; 4453 cases under observation | Children's Hospital of Philadelphia | ||||
| Thomas27 (2000); all conditions | Descriptive; none given | Primary Children's Medical Center; RTU; 1999 | ED | 22‐26 | ED, clinic, procedure/OR | PEM physicians; general pediatricians; other specialists; no residents |
| Zebrack et al.25 (2005); all conditions | Retrospective cohort; 2b; 2 years; 4189 cases of unscheduled observation plus 2288 scheduled cases | Primary Children's Medical Center | PEM nurses; 1:4 nurse:patient ratio | |||
| Miescier et al.40 (2005); asthma | Retrospective cohort; 2b; 2 years; 3029 asthma visits; 384 admitted, 301 observed, 161cases met inclusion | Primary Children's Medical Center | ||||
| Holsti et al.41 (2005); head injury | Retrospective cohort; 2b; 2 years; 827 CHI visits, 273 admitted, 285 observed, 284 cases met inclusion | Primary Children's Medical Center | ||||
| Greenberg et al.42 (2006); croup | Retrospective pre‐post; 2b; 1 year each; 694 croup cases pre‐RTU, 66 admitted; 789 croup cases post‐RTU, 33 admitted; 76 observed | Primary Children's Medical Center | ||||
| Mallory et al.33 (2006); dehydration | Retrospective cohort; 2b; 1 year; 430 dehydration cases under observation | Primary Children's Medical Center | ||||
Staffing and Workflow
Staffing models varied and have undergone transitions over time. Prior to 1997, general pediatricians primarily provided physician services. In more recent years, OUs have utilized pediatric emergency medicine (PEM) providers. Three of the 11 units allowed for direct patient care by subspecialists.5, 6, 32 One OU was staffed by nurse practitioners.29 OU nursing backgrounds included pediatrics, emergency medicine, or PEM.
Five institutions assembled multidisciplinary teams to define the unit's role and establish policies and procedures.7, 27, 2931 Workflow in the OU focused on optimizing efficiency through standardized orders, condition‐specific treatment protocols, and bedside charting.7, 26, 33 Several units emphasized the importance of ongoing evaluations by attending physicians who could immediately respond to patient needs. Rounds occurred as often as every 4 hours.5, 7 Two centers utilized combined physician‐nursing rounds to enhance provider communication.7, 34 No publications reported on patient transitions between sites of care or at shift changes.
Criteria for Observation
All 11 hospitals have developed protocols to guide OU admissions (Table 2). Nine publications from 4 OUs commented on treatments delivered prior to observation.33, 3542 The most commonly cited criteria for admission was approval by the unit's supervising physician. Utilization review was not mentioned as an element in the OU admission decision. Common OU exclusions were the need for intensive care or monitoring while awaiting an inpatient bed; however, these were not universal. Eight centers placed bounds around the duration of OU stays, with minimum stays of 2 hours and maximum stays of 8 to 24 hours.
| Hospital | Entry Criteria | Age Range | Time | Exclusion Criteria |
|---|---|---|---|---|
| ||||
| King's County, Downstate Brooklyn | Otherwise required inpatient admission | 0‐13 years | Maximum 24 hours | Not reported |
| Acute problem of uncertain severity | ||||
| Acute problem not readily diagnosed | ||||
| Short course periodic treatment | ||||
| Diagnostic procedures impractical as outpatient | ||||
| Children's Hospital, Buffalo | Admission from any source | 0‐21 years | Maximum 24 hours | Intensive care needs |
| Short stay elective surgery | Routine diagnostic tests | |||
| Estimated length of stay <24 hours | Holding prior to admission | |||
| Children's National, Washington, DC | Inadequate response to 3 subcutaneous epinephrine injections | 8 months to 19 years | Not reported | Not reported |
| Children's Memorial, Chicago | Asthma: | |||
| Available parentAsthma score 5Inadequate response to ED treatment | >1 year | Maximum 24 hours | Past history of BPD, CF, CHD, other debilitating disease | |
| Dehydration: | ||||
| Cases receiving oral hydration | 3‐24 months | 12 hours for oral | Intensive care need | |
| Parent preference if given IV hydration | 8 to 12 hours for IV | Hypernatremia | ||
| Minneapolis Children's | Conditions listed in Table 3 | Not reported | Maximum 10 hours | Not reported |
| Children's Hospital, Boston | Straightforward diagnoses as determined by ED staff | Not reported | Not reported | Other complex medical issues |
| Bed availability | ||||
| Connecticut Children's | PEM attending discretionLimited severity of illnessUsually confined to a single organ systemClearly identified plan of care | Not reported | After 3‐4 hours in ED Low likelihood of requiring extended care >23 hours | Asthma: no supplemental O2 need, nebulized treatments >Q2 hourCroup: no supplemental O2 need, <2 racemic epinephrine treatmentsDehydration: inability to tolerate orals, bicarbonate >10, 40 mL/kg IVFSeizure: partial or generalized, postictal, unable to tolerate oralsPoisoning: mild or no symptoms, poison control recommendation |
| Children's Hospital, Denver | Intussusception: following reduction | 0‐18 years | After 3‐4 hours in ED | Not reported |
| Dehydration: based on clinical status | ||||
| Johns Hopkins, Bayview | Consultation with on‐duty pediatrician | 0‐18 years | Minimum of 2 hours | Patients requiring subspecialty or intensive care services |
| High likelihood of discharge at 24 hours | ||||
| Children's Hospital of Philadelphia | Sole discretion of the ED attending | Not reported | Minimum 4 hours | No direct admissions |
| Single focused acute condition | Maximum 23 hours | Diagnostic dilemmas | ||
| Clinical conditions appropriate for observation | Underlying complex medical problems | |||
| Primary Children's Medical Center | Observation unit attending discretion | 0‐21 years | Minimum 3 hours | Admission holds |
| Scheduled procedures as space available | Maximum 24 hours | Intensive care needs | ||
| ED admit after consult with OU doctor | Complicated, multisystem disease | |||
| Clear patient care goals | Need for multiple specialty consults | |||
| Limited severity of illness | Psychiatric patients | |||
| Diagnostic evaluation | ||||
Ages of Children Under Observation
Seven of 11 hospitals reported the age range of patients accepted in their OU (Table 2). All but 1 unit accepted children from infants to young adults, 18 to 21 years of age.43 In the 6 units that reported the age distribution of their OU population, roughly 20% were <1 year, more than 50% were <5 years, and fewer than 30% fell into an adolescent age range.5, 6, 26, 32, 34, 43
Conditions Under Observation
Many conditions under observation were common across time and location (Table 3). The list of conditions cared for in OUs has expanded in recent years. Medical conditions predominated over surgical. While the majority of observation cases required acute care, nearly one‐half of the units accepted children with scheduled care needs (eg, routine postoperative care, procedures requiring sedation, infusions, and extended evaluations such as electroencephalograms or pH probes). These scheduled cases, cared for within the OU structure, provided more steady demand for OU services.
| King's County, Downstate Brooklyn | Children's Hospital, Buffalo | Minneapolis Children's | Children's Hospital, Boston | Connecticut Children's | Children's Hospital, Denver | Johns Hopkins, Bayview | Children's Hospital of Philadelphia | Primary Children's Medical Center, Salt Lake City | |
|---|---|---|---|---|---|---|---|---|---|
| |||||||||
| Respiratory | |||||||||
| Asthma | |||||||||
| Pneumonia | |||||||||
| Bronchiolitis | |||||||||
| Croup | |||||||||
| Allergic reaction | |||||||||
| Cardiology | |||||||||
| Gastrointestinal | |||||||||
| Vomiting | |||||||||
| Gastro/dehydration | |||||||||
| Abdominal pain | |||||||||
| Constipation | |||||||||
| Diabetes | |||||||||
| Neurologic | |||||||||
| Seizure | |||||||||
| Head injury | |||||||||
| Infection | |||||||||
| Sepsis evaluation | |||||||||
| UTI/pyelonephritis | |||||||||
| Cellulitis | |||||||||
| Fever | |||||||||
| Pharyngitis | |||||||||
| Otitis media | |||||||||
| Adenitis | |||||||||
| Ingestion/poisoning | |||||||||
| Hematologic | |||||||||
| Sickle cell disease | |||||||||
| Transfusion/emnfusion | |||||||||
| Psychological/social | |||||||||
| Dental | |||||||||
| Surgical conditions | |||||||||
| Foreign body | |||||||||
| Trauma | |||||||||
| Burn | |||||||||
| Orthopaedic injury | |||||||||
| Postoperative complication | |||||||||
| Scheduled care | |||||||||
| Diagnostic workup | |||||||||
| Procedures/sedation | |||||||||
| Elective surgery | |||||||||
Reimbursement
One publication highlighted the special billing rules that must be considered for observation care.27 In 3 studies, payers recognized cost‐savings associated with the OU's ability to provide outpatient management for cases that would traditionally require inpatient care.31, 35, 38
Observation Unit Outcomes
Outcomes reported for pediatric OU stays fall into 4 major categories: length of stay (LOS), admission rates, return visit rates, and costs. Despite these seemingly straightforward groupings, there was significant heterogeneity in reporting these outcomes.
Length of Stay
The start time for OU length of stay (LOS) is not clearly defined in the articles included in this review. While the start of an observation period is assumed to begin at the time the order for observation is placed, it is possible that the LOS reported in these publications began at the time of ED arrival or the time the patient was physically transferred to the OU. The average LOS for individual OUs ranged from 10 to 15 hours.5, 6, 26, 30, 35, 38, 40, 41, 43 One ward‐based and 1 ED‐based unit reported LOS extending beyond 24 hours,7, 30 with averages of 35 and 9 hours, respectively. Two units limited the duration of care to <10 hours.31, 38
For studies that included a comparison group, OU stays were consistently shorter than a traditional inpatient stay by 6 to 110 hours.7, 36, 38, 39, 42 No significant differences in clinical parameters between groups were reported. There was appreciable variation in the average LOS across institutions for similar conditions, 12 to 35 hours for asthma,5, 7, 34, 35 and 9 to 18 hours for dehydration.5, 34, 36, 38
Admission Rates
Rates of hospital admission after observation from the 9 OUs reporting this outcome are presented in Table 4. Three publications from a single institution counted hospital admission in the 48 to 72 hours following discharge from the OU as though the patient were admitted to the hospital directly from the index OU stay.33, 40, 41 Conditions with the lowest admission rates, <10%, included croup, neurologic conditions, ingestions, trauma, and orthopedic injuries. The highest admission rates, >50%, were for respiratory conditions including asthma, pneumonia, and bronchiolitis.
| King's County, Downstate Brooklyn (%) | Children's Hospital, Buffalo (%) | Connecticut Children's (%) | Johns Hopkins, Bayview (%) | Children's Hospital of Philadelphia (%) | Primary Children's Medical Center, Salt Lake City (%) | |
|---|---|---|---|---|---|---|
| ||||||
| Unscheduled care | 42 | 17 | 11 | 25 | 25 | 15 |
| Respiratory | 32 | |||||
| Asthma | 57 | 16 | 26 | 22 | 22‐25* | |
| Pneumonia | 50 | 23 | 30‐48 | |||
| Bronchiolitis | 46 | 32 | 43 | |||
| Croup | 9 | 17 | 9 | 4‐6 | ||
| Allergic reaction | 3 | |||||
| Cardiology | 22 | |||||
| Gastrointestinal | 43 | 19 | ||||
| Vomiting | 5 | 22 | ||||
| Gastro/dehydration | 23 | 15/21 | 16* | |||
| Abdominal pain | 9 | 17 | 27 | |||
| Constipation | 9 | |||||
| Diabetes | 17 | |||||
| Neurologic | 10 | |||||
| Seizure | 19 | 8 | 17 | 18 | ||
| Head injury | 7 | 5* | ||||
| Infection | 19 | 34 | ||||
| Sepsis evaluation | 25 | 22 | ||||
| UTI/pyelonephritis | 25 | 16 | ||||
| Cellulitis | 15 | |||||
| Fever | 16 | 26 | ||||
| Pharyngitis | 13 | |||||
| Otitis media | 21 | |||||
| Ingestion/poisoning | 9 | 4 | 4 | 9 | 10 | 5 |
| Hematologic | 23 | |||||
| Transfusion/emnfusion | 2 | |||||
| Psychological/social | 21 | 80 | 17 | |||
| Dental | 14 | |||||
| Surgical conditions | ||||||
| Foreign body | ||||||
| Trauma | 13 | 2 | 53 | 5 | ||
| Burn | 13 | |||||
| Orthopedic injury | 22 | 3 | ||||
| Postoperative complication | 26 | 16 | ||||
| Scheduled care | ||||||
| Diagnostic workup | 0‐5 | |||||
| Procedures/sedation | 0.1‐9.0 | |||||
| Elective surgery | 13 | 0‐5 | ||||
Return Visit Rates
Unscheduled return visit rates were reported in 9 publications from 6 institutions and ranged from 0.01% to 5%.7, 26, 33, 3537, 3941 Follow‐up timeframes ranged from 48 hours to 1 month. Return visits were inconsistently defined. In most studies, rates were measured in terms of ED visits.26, 33, 3537, 39, 41 One ward‐based unit counted only hospital readmissions toward return visit rates.7 Three publications, from ED‐based units, counted hospital readmissions in the 2 to 5 days following observation toward admission rates and not as return visits.33, 40, 41 In most studies, data on return visits were collected from patient logs or patient tracking systems. Three studies contacted patients by phone and counted return visits to the clinic.3537 No studies reported on adherence to scheduled visits following observation.
Costs
Seven studies reported financial benefits of OU care when compared with traditional hospital care.7, 30, 31, 35, 37, 38, 42 Two centers admitted patients to inpatient care if their observation period reached a set time limit, after which cost savings were no longer realized.31, 35 Cost savings associated with the OU treatment of asthma and dehydration were attributed to lower charges for an OU bed.35, 38 Decreased charges for the OU treatment of croup were related to shorter LOS.42
Discussion
In the 40 years since the first studies of pediatric OUs, several US health systems have extended observation services to children. This model of care may be expanding, as suggested by an increase in the number of publications in the past 10 years. However, the number of centers within the US reporting on their OU experience remains small. Our systematic review identified a recurrent theme related to OUsthe opportunity to improve operational processes of care compared with the traditional inpatient alternative. We have identified the need to standardize OU outcomes and propose measures for future OU research.
Observation Unit Operations
The OU care model expands outpatient management of acute conditions to include children who are neither ready for discharge nor clear candidates for inpatient admission. OUs have demonstrated the ability to care for patients across the pediatric age spectrum. Over the decades spanning these publications, advances in medical therapy such as antiemetics for gastroenteritis and early administration of systemic steroids for asthma may have resulted in lower admission rates or shorter time to recovery.44, 45 Despite these advances, there are marked consistencies in the conditions cared for within OUs over time. The data summarized here may help guide institutions as they consider specific pediatric conditions amenable to observation care.
The hospitals included in this review either added physical space or revised services within existing structures to establish their OU. Hospitals facing physical constraints may look to underutilized areas, such as recovery rooms, to provide observation care, as observation does not require the use of licensed inpatient beds. Several units have responded to daily fluctuations in unscheduled observation cases by also serving patients who require outpatient procedures, brief therapeutic interventions, and diagnostic testing. By caring for patients with these scheduled care needs during the day, there is a more steady flow of patients into the OU. While hospitals traditionally have used postanesthesia care units and treatment rooms for scheduled cases, OUs appear to benefit from the consistent resource allocation associated with a constant demand for services.
To date, the vast majority of pediatric OUs in the published literature have emerged as an extension of ED services. Now, with the expansion of pediatric hospitalist services and movement toward 24/7 inpatient physician coverage, there may be increased development of ward‐based OUs and the designation of inpatient observation status. While ward‐based OUs managed by pediatric hospitalists may be well established, we were not able to identify published reports on this structure of care. A national survey of health systems should be undertaken to gather information regarding the current state of pediatric observation services.
When creating policies and procedures for OUs, input should be sought from stakeholders including hospitalists, PEM providers, primary care providers, subspecialists, mid‐level providers, nurses, and ancillary staff. As patients requiring observation level of care do not neatly fit an outpatient or inpatient designation, they present an opportunity for hospitalist and PEM physician groups to collaborate.4648 Calling on the clinical experiences of inpatient and ED providers could offer unique perspectives leading to the development of innovative observation care models.
This review focused on institutions with dedicated observation services, which in all but 1 study26 consisted of a defined geographic unit. It is possible that the practices implemented in an OU could have hospital‐wide impact. For example, 1 study reported reduction in LOS for all asthma cases after opening a ward‐based unit.7 Further, pediatric hospitalist services have been associated with shorter LOS49 and increased use of observation status beds compared with traditional ward services.50 As pediatric hospitalists expand their scope of practice to include both observation and inpatient care, clinical practice may be enhanced across these care areas. It follows that the impact of observation protocols on care in the ward setting should be independently evaluated.
The costs associated with the establishment and daily operations of an OU were not addressed in the reviewed publications. Assertions that observation provides a cost‐effective alternative to inpatient care4, 7, 23, 42 should be balanced by the possibility that OUs extend care for patients who could otherwise be discharged directly home. Studies have not evaluated the cost of OU care compared with ED care alone. Research is also needed to assess variations in testing and treatment intensity in OUs compared with the ED and inpatient alternatives. Reimbursement for observation is dependent in part upon institutional contracts with payers. A full discussion of reimbursement issues around observation services is beyond the scope of this review.
Observation Unit Outcomes
Length of Stay
Although most studies reported LOS, direct comparisons across institutions are difficult given the lack of a consistently referenced start to the observation period. Without this, LOS could begin at the time of ED arrival, time of first treatment, or time of admission to the OU. Identifying and reporting the elements contributing to LOS for observation care is necessary. The time of OU admission is important for billing considerations; the time of first treatment is important to understanding the patient's response to medical interventions; the time of ED arrival is important to evaluating ED efficiency. Each of these LOS measures should be reported in future studies.
Direct comparisons of LOS are further complicated by variability in the maximum permissible duration of an OU stay, ranging from 8 to 24 hours in the included studies. Despite these limits, some OU care will extend beyond set limits due to structural bottlenecks. For example, once the inpatient setting reaches capacity, observation LOS for patients who require admission will be prolonged. The best evaluation of LOS would come from prospective study design utilizing either randomization or quality improvement methods.
Defining Success and Failure in Observation Care
In the reviewed literature, observation failures have been defined in terms of admission after observation and unscheduled return visit rates. Admission rates are heavily dependent on appropriate selection of cases for observation. Although some observation cases are expected to require inpatient admission, OUs should question the validity of their unit's acceptance guidelines if the rate of admission is >30%.51 High rates could be the result of inadequate treatment or the selection of children too sick to improve within 24 hours. Low rates could indicate overutilization of observation for children who could be discharged directly home. Full reporting on the number of children presenting with a given condition and the different disposition pathways for each is needed to evaluate the success of OUs. Condition‐specific benchmarks for admission after observation rates could guide hospitals in their continuous improvement processes.
Unscheduled return visits may reflect premature discharge from care, diagnostic errors, or development of a new illness. OU care may influence patient adherence to scheduled follow‐up care but this has not been evaluated to date. In future research, both scheduled and unscheduled return visits following ED visits, observation stays, and brief inpatient admissions for similar disease states should be reported for comparison. Standard methodology for identifying return visits should include medical record review, claims analyses, and direct patient contact.
As hospitals function at or near capacity,52, 53 it becomes important to delineate the appropriate length of time to monitor for response to treatments in a given setting. Limited capacity was a frequently cited reason for opening a pediatric OU; however, the impact of OUs on capacity has not yet been evaluated. Operations research methods could be used to model OU services' potential to expand hospital capacity. This research could be guided by evaluation of administrative data from across institutions to identify current best practices for pediatric OU and observation status care.
OU benchmarking in the United States has begun with a small number of adult units participating in the ED OU Benchmark Alliance (EDOBA).54 In Table 5, we propose dashboard measures for pediatric OU continuous quality improvement. The proposed measures emphasize the role of observation along the continuum of care for acute conditions, from the ED through the OU with or without an inpatient stay to clinic follow‐up. Depending on the structure of observation services, individual institutions may select to monitor different dashboard measures from the proposed list. Patient safety and quality of care measures for the conditions commonly receiving pediatric OU care should also be developed.
| ED |
OU |
Inpatient |
Clinic | |
|---|---|---|---|---|
| ||||
| Length of stay* | ED arrival to OU admission | OU admit to disposition | Inpatient admit to discharge | |
| ED arrival to discharge home from OU | ||||
| ED arrival to discharge from inpatient following OU care | ||||
| OU admission to discharge home from inpatient care | ||||
| Admission* | % ED census admitted inpatient | % OU census admitted | ||
| % ED census that is observed | ||||
| Unscheduled return visits* | To ED | Requiring OU admission | Requiring inpatient admission | |
| Scheduled follow‐up* | To ED | To primary care or subspecialist office | ||
| Capacity | ED crowding scales | Unable to accept transfers | ||
| ED left before evaluation rates | Inpatient occupancy | |||
| Ambulance diversion | ||||
| Satisfaction | Patient/Parent | |||
| ED providers | OU providers | Inpatient providers | Follow‐up providers | |
| Cost | ED care | OU care | Inpatient care | |
| Total encounter | ||||
Limitations
The most important limitations to this review are the heterogeneity in interventions and reporting of outcomes, which precluded our ability to combine data or conduct meta‐analyses. We attempted to organize the outcomes data into clear and consistent groupings. However, we could not compare the performance of 1 center with another due to differences in OU structure, function, and design.
In order to focus this systematic review, we chose to include only peer reviewed publications that describe pediatric OUs within the United States. This excludes expert guidelines, which may be of value to institutions developing observation services.
Our search found only a small number of centers that utilize OUs and have published their experience. Thus, our review is likely subject to publication bias. Along this line, we identified 9 additional publications where children were cared for alongside adults within a general OU.5563 This suggests an unmeasured group of children under observation in general EDs, where more than 90% of US children receive acute care.64 These articles were excluded because we were unable to distinguish pediatric specific outcomes from the larger study population.
Finally, retrospective study design is subject to information bias. Without a comparable control group, it is difficult to understand the effects of OUs. Patients directly admitted or discharged from the ED and patients who require admission after observation all differ from patients discharged from observation in ways that should be controlled for with a randomized study design.
Conclusions
OUs have emerged to provide treatment at the intersection of outpatient and inpatient care during a time of dramatic change in both emergency and hospital medicine. As hospitalists expand their scope of practice to include observation care, opportunities will arise to collaborate with ED physicians and share their growing expertise in quality and efficiency of hospital care delivery to improve observation services for children. OUs have been established with laudable goalsto reduce inpatient admissions, increase patient safety, improve efficiency, and control costs. The current evidence is not adequate to determine if this model of healthcare delivery achieves these goals for children. Through synthesis of existing data, we have identified a need for standard reporting for OU outcomes and propose consistent measures for future observation care research. Only through prospective evaluation of comparable outcomes can we appraise the performance of pediatric OUs across institutions.
- .Observation medicine.Acad Emerg Med.1994;1(2):152–154.
- ,.Principles of observation medicine.Emerg Med Clin North Am.2001;19(1):1–17.
- ,,, et al.Emergency department observation beds improve patient care: Society for Academic Emergency Medicine debate.Ann Emerg Med.1992;21(8):967–975.
- .Pediatric observation medicine.Emerg Med Clin North Am.2001;19(1):239–254.
- ,,.The pediatric hybrid observation unit: an analysis of 6477 consecutive patient encounters.Pediatrics.2005;115(5):e535–e542.
- ,,, et al.Observation units: the role of an outpatient extended treatment site in pediatric care.Pediatr Emerg Care.1998;14(6):444–447.
- ,,, et al.Impact of a short stay unit on asthma patients admitted to a tertiary pediatric hospital.Qual Manag Health Care.1997;6(1):14–22.
- ,,, et al.Management of observation units. American College of Emergency Physicians.Ann Emerg Med.1995;25(6):823–830.
- ,,, et al. The observation unit: an operational overview for the hospitalist. Society of Hospital Medicine White Paper 2009; Available at: http://www.hospitalmedicine.org/Content/NavigationMenu/Publications/WhitePapers/White_Papers.htm. Accessed July2009.
- Acute Criteria Pediatric InterQual Level of Care.San Francisco, CA:McKesson Corporation;2006.
- Observation Status Related to U.S. Hospital Records.Healthcare Cost and Utilization Project. HCUP Methods Series Report #2002‐3. Rockville, MD: Agency for Healthcare Research and Quality;2002.
- ,,, et al.Emergency department observation unit versus hospital inpatient care for a chronic asthmatic population: a randomized trial of health status outcome and cost.Med Care.1998;36(4):599–609.
- ,,, et al.Costs of an emergency department‐based accelerated diagnostic protocol vs hospitalization in patients with chest pain: a randomized controlled trial.JAMA.1997;278(20):1670–1676.
- .Management of patients with infectious diseases in an emergency department observation unit.Emerg Med Clin North Am.2001;19(1):187–207.
- ,,, et al.A comparison between emergency diagnostic and treatment unit and inpatient care in the management of acute asthma.Arch Intern Med.1997;157(18):2055–2062.
- .Chest pain observation units.Emerg Med J.2001;18(2):148.
- ,,, et al.Randomised controlled trial and economic evaluation of a chest pain observation unit compared with routine care.BMJ.2004;328(7434):254.
- ,,, et al.A cooperative care model: cardiologists and hospitalists reduce length of stay in a chest pain observation. In:5th Scientific Forum on Quality of Care and Outcomes Research in Cardiovascular Disease and Stroke, Washington, DC, May 15‐17, 2003.Philadelphia, PA:Lippincott Williams 2003. p.P186.
- ,.Observation unit management of pediatric emergencies.Emerg Med Clin North Am.1991;9(3):669–676.
- .A short stay or 23‐hour ward in a general and academic children's hospital: are they effective?Pediatr Emerg Care.2000;16(4):223–229.
- ,,, et al.Trends in high turnover stays among children hospitalized in the United States, 1993 through 2003.Pediatrics.2009;123:996–1002.
- .Hospital based alternatives to acute paediatric admission: a systematic review.Arch Dis Child.2005;90(2):138–142.
- ,,.Short‐stay units and observation medicine: a systematic review.Med J Aust.2003;178(11):559–563.
- ,,.Use of emergency observation and assessment wards: a systematic literature review.Emerg Med J.2003;20(2):138–142.
- Oxford Centre for Evidence‐Based Medicine. Levels of evidence and grades of recommendation (May 2001). Available at: http://www.cebm.net/levels_of_evidence.asp. Accessed July2009.
- ,,, et al.Pediatric observation status beds on an inpatient unit: an integrated care model.Pediatr Emerg Care.2004;20(1):17–21.
- .Pediatric update. Our new rapid treatment unit: an innovative adaptation of the “less than 24‐hour stay” holding unit.J Emerg Nurs.2000;26(5):507.
- ,,.Use of an observation unit by a pediatric emergency department for common pediatric illnesses.Pediatr Emerg Care.2001;17(5):321–323.
- ,,, et al.Observation medicine: the expanded role of the nurse practitioner in a pediatric emergency department extended care unit.Pediatr Emerg Care.2005;21(3):199–202.
- ,,.An observation unit in a pediatric emergency department: one children's hospital's experience.J Emerg Nurs.2002;28(5):407–413.
- ,,.When the patient requires observation not hospitalization.J Nurs Admin.1988;18(10):20–23.
- ,.Observation unit in Children's Hospital—Adjunct to delivery and teaching of ambulatory pediatric care.N Y State J Med.1980;80(11):1684–1686.
- ,,, et al.Use of pediatric observation unit for treatment of children with dehydration caused by gastroenteritis.Pediatr Emerg Care.2006;22(1):1–6.
- ,,, et al.Utilization and unexpected hospitalization rates of a pediatric emergency department 23‐hour observation unit.Pediatr Emerg Care.2008;24(9):589–594.
- ,,, et al.Short‐term holding room treatment of asthmatic‐children.J Pediatr.1985;106(5):707–711.
- ,,.Usefulness of the serum electrolyte panel in the management of pediatric dehydration treated with intravenously administered fluids.Pediatrics.2004;114(5):1227–1234.
- ,,.Treatment of acute asthmatic attacks in a holding unit of a pediatric emergency room.Ann Allergy.1980;45(3):159–162.
- ,,.Outpatient oral rehydration in the United States.Am J Dis Child.1986;140(3):211–215.
- ,.Postreduction management of intussusception in a children's hospital emergency department.Pediatrics.2003;112(6 Pt 1):1302–1307.
- ,,, et al.Children with asthma admitted to a pediatric observation unit.Pediatr Emerg Care.2005;21(10):645–649.
- ,,, et al.Pediatric closed head injuries treated in an observation unit.Pediatr Emerg Care.2005;21(10):639–644.
- ,,.A reduction in hospitalization, length of stay, and hospital charges for croup with the institution of a pediatric observation unit.Am J Emerg Med.2006;24(7):818–821.
- ,,.Short stay in an outpatient department. An alternative to hospitalization.Am J Dis Child.1972;123(2):128–132.
- ,,.The role of oral ondansetron in children with vomiting as a result of acute gastritis/gastroenteritis who have failed oral rehydration therapy: a randomized controlled trial.Ann Emerg Med.2008;52(1):22–29.e6.
- ,,, et al.Oral ondansetron for gastroenteritis in a pediatric emergency department.N Engl J Med.2006;354(16):1698–1705.
- ,,, et al.Integrated hospital emergency care improves efficiency.Emerg Med J.2008;25(2):78–82.
- ,,, et al.Redefining the community pediatric hospitalist: the combined pediatric ED/inpatient unit.Pediatr Emerg Care.2007;23(1):33–37.
- ,,, et al.Program description: a hospitalist‐run, medical short‐stay unit in a teaching hospital.CMAJ.2000;163(11):1477–1480.
- ,.Evaluation of a pediatric hospitalist service: impact on length of stay and hospital charges.Pediatrics.2000;105(3 Pt 1):478–484.
- ,,, et al.Restructuring an academic pediatric inpatient service using concepts developed by hospitalists.Clin Pediatr (Phila).2001;40(12):653–660; discussion 661‐662.
- ,,, et al.American College of Emergency Physicians (ACEP).Practice Management Committee, American College of Emergency Physicians. Management of Observation Units. Irving, TX: American College of Emergency Physicians; July1994.
- Overcrowding crisis in our nation's emergency departments:is our safety net unraveling?Pediatrics.2004;114(3):878–888.
- ,.Emergency department overcrowding in the United States: an emerging threat to patient safety and public health.Emerg Med J.2003;20(5):402–405.
- ,,, et al.Characteristics of high volume teaching hospital observation units: data from the Emergency Department Observation Unit Benchmark Alliance (EDOBA).Acad Emerg Med.2009;16(s1):Abstract 628.
- ,,.Use of the emergency department observation unit in the treatment of acute asthma.Ann Emerg Med.1982;11(2):77–83.
- ,,, et al.Management of acute pyelonephritis in an emergency department observation unit.[see Comment].Ann Emerg Med.1991;20(3):253–257.
- ,,, et al.Patterns of use of an emergency department‐based observation unit.Am J Ther.2002;9(6):499–502.
- ,,, et al.Emergency department observation of poisoned patients: how long is necessary?[see Comment].Acad Emerg Med.1999;6(9):887–894.
- ,,, et al.False‐negative and false‐positive errors in abdominal pain evaluation: failure to diagnose acute appendicitis and unnecessary surgery.Acad Emerg Med.2000;7(11):1244–1255.
- .Resource use by younger versus older patients.Fam Pract Res J.1993;13(3):283–290.
- ,,, et al.Trauma 24‐hour observation critical path.J Trauma.1998;45(1):147–150.
- ,,, et al.The role of an emergency department observation unit in the management of trauma patients.J Emerg Med.1985;2(5):325–333.
- ,.Observation unit impact on ED admission for asthma.Am J Emerg Med.1994;12(1):11–14.
- ,.Emergency care for children in pediatric and general emergency departments.Pediatr Emerg Care.2007;23(2):94–102.
The first observation units were implemented more than 40 years ago with the goal of reducing the number and duration of inpatient stays. Since then, observation units (OUs) have evolved as a safe alternative to hospitalization14 for the delivery of finite periods of care, typically less than 24 hours.58 Observation services allow for time to determine the need for hospitalization in cases that are unclear after their initial evaluation and treatment.9 Observation status is an administrative classification related to reimbursement that can be applied to patients whose diagnosis, treatment, stabilization, and discharge can reasonably be expected within 24 hours.10, 11 The site of care for observation is dependent in part upon existing facility structures; some institutions utilize virtual OUs within the emergency department (ED) or hospital ward, while others have dedicated, geographically distinct OUs, which may function as an extension of either the ED or inpatient settings.9
OUs have been instrumental in providing care to adult patients with chest pain, asthma, and acute infections.1218 Recently, there has been an increase in the number of publications from pediatric OUs in the United States and abroad. Observation may be a preferred model of care for select pediatric patients, as hospitalized children often experience brief stays.1921 Previous reviews on this model of care have combined adult and pediatric literature and have included research from countries with healthcare structures that differ considerably from the United States.2224 To date, no systematic review has summarized the pediatric OU literature with a focus on the US healthcare system.
As payers and hospitals seek cost‐effective alternatives to traditional inpatient care, geographically distinct OUs may become integral to the future of healthcare delivery for children. This systematic review provides a descriptive overview of the structure and function of pediatric OUs in the United States. We also scrutinize the outcome measures presented in the included publications and propose future directions for research to improve both observation unit care, as well as the care delivered to patients under observation status within general inpatient or ED settings.
Methods
Literature Search
With the assistance of a health services librarian, a search of the following electronic databases from January 1, 1950 through February 5, 2009 was conducted: Medline, Web of Science, Cumulative Index to Nursing and Allied Health Literature (CINAHL), Health Care Advisory Board (HCAB), Lexis‐Nexis, National Guideline Clearinghouse, and Cochrane Reviews. Key words used for the Boolean search are included in Appendix A. In addition, we conducted a manual search of reference lists from reviews, guidelines, and articles meeting inclusion criteria.
We included English language peer‐reviewed publications that reported on pediatric OU care in the United States. Studies were included if they reported outcomes including lengths of stay, admission from observation rates, return visit rates, costs or charges. Descriptive publications of pediatric OU structure and function were also included. Studies were excluded if they were conducted outside the United States, evaluated psychiatric or intensive care, reported on observation status in an ED without an OU or observation status on a traditional inpatient ward. Two reviewers (M.M. and C.K.) identified articles for inclusion. Any disagreements between the reviewers were resolved by discussion and consensus agreement. Interrater reliability was assessed using the kappa statistic.
Quality Assessment
The quality of each study was rated using the Oxford Centre for Evidence‐based Medicine levels of evidence.25 With this system, levels of evidence range from 1a (homogeneous systematic review of randomized, controlled trials) to 5 (expert opinion without explicit critical appraisal).
Data Synthesis
Data on study design, OU characteristics, patient populations, and outcomes were extracted using a standardized form. Heterogeneity of study design, interventions, and outcomes precluded the ability to conduct meta‐analyses.
Results
A systematic search of the electronic databases identified 222 unique citations (Figure 1). A total of 107 abstracts were evaluated. We identified 48 articles for full‐text review, of which 18 met inclusion criteria. Hand search of references yielded 24 additional articles, of which 3 met inclusion criteria. Interrater agreement for selected articles was high at 98% (kappa = 0.85).
Observation Unit Characteristics
The majority of research on OUs has been conducted at large academic pediatric centers. One publication was from a community hospital.26 These studies present data on more than 22,000 children cared for in OUs of 11 hospitals over a 32‐year time span. Most studies were level 2 evidence: 2b, retrospective cohort studies and low‐quality randomized, controlled trials; or 2c, outcomes research. Three were descriptive and not assigned a formal evidence level.2729
Table 1 highlights general features of U.S. pediatric OUs. Five institutions renovated or expanded clinical space in order to open the OU.27, 2932 Units ranged in size from 3 to 23 beds. The OU was located in or near the ED in all but 2 hospitals, which had ward‐based units. The ED was the primary entry point into the OU with only 2 open model units accepting patients from other settings.5, 32 The annual number of observation cases ranged from 1000 to 3000 in children's hospitals. Approximately 500 ward‐based observation cases per year were cared for in the single community hospital studied. Three reports included time trends showing increased OU utilization over study years.5, 30, 31
| Publication (Year); Condition | Study Design; Level of Evidence; Time Frame; Sample Size | Hospital; Observation Setting; Year Opened | Site | Beds | Entry Point | Staffing; Physicians; Nurses |
|---|---|---|---|---|---|---|
| ||||||
| Gururaj et al.43 (1972); all conditions | Retrospective cohort; 2c; 1 year; 437 cases under observation | King's County Downstate Brooklyn; short‐stay unit | ED | 3 | Not reported | Pediatric residents; general pediatricians |
| Ellerstein and Sullivan,32 (1980); all conditions | Retrospective cohort; 2c; 6 years; 5858 cases of unscheduled care plus 1403 elective surgery cases | Children's Hospital Buffalo; observation unit; 1972 | ED | 8 | ED, clinic, procedure/OR | Primary care pediatricians; other specialists; pediatric residents |
| O'Brien et al.37 (1980); asthma | Retrospective cohort; 2c; 1 month; 434 cases of asthma, 328 discharged directly from ED, 106 treated in holding unit | Children's National DC; holding unit | ED | 6 | ED | 1‐2 pediatric residents; 1‐2 nurses |
| Willert et al.35 (1985); asthma | Randomized*; 2b; 578 cases of asthma; 166 cases 1.5 hours postaminophylline, 103 randomized, 52 to holding unit | Children's Memorial Chicago; holding room | ED | 5 | ED | General pediatricians; pediatric residents; PEM nurses |
| Listernick et al.38 (1986); dehydration | Randomized; 2b; 29 cases of dehydration; 22 to holding unit | Children's Memorial Chicago | ||||
| Balik et al.31 (1988); all conditions | Descriptive; none given | Minneapolis Children's; short‐stay unit observation area; 1985 | Day surgery area adjacent to ED | Not reported | Not reported | General pediatricians; pediatric nurses (shared with ED) |
| Marks et al.7 (1997); all conditions | Retrospective cohort; 2c; 5 months; 968 cases in short‐stay unit | Children's Hospital Boston; short‐stay unit; 1994 | Ward | 4‐18 | ED | Primary care pediatricians; PEM physicians; pediatric residents; pediatric nurses; 1:6 nurse:patient ratio |
| Marks et al.7 (1997); asthma | Pre‐post; 2b; 400 cases of asthma; 102 pre/298 post short‐stay unit | Children's Hospital Boston | ||||
| Wiley et al.6 (1998); all conditions | Retrospective cohort; 2c; 1 year; 805 cases of unscheduled observation; plus 595 scheduled cases | Connecticut Children's; outpatient extended treatment site | ED | 10 | Not reported | PEM physicians; other specialists; 1:5 nurse:patient ratio |
| Scribano et al.65 (2001); all conditions | Retrospective cohort; 2b; 2 years; 1798 cases under observation | Connecticut Children's | ||||
| Leduc et al.30 (2002); all conditions | Retrospective cohort; 2c; 6 months; 686 cases under observation (4.8% of ED visits) | Children's Hospital Denver; OU | ED | 6 | Not reported | Not reported |
| Bajaj and Roback,30 (2003); intussusception | Retrospective cohort; 2b; 4.5 years; 78 cases of intussusception (51 under observation) | Children's Hospital Denver | ||||
| Wathen et al.36 (2004); dehydration | Convenience sample; 2c; 10 months; 182 cases of dehydration (48 under observation) | Children's Hospital Denver | ||||
| Crocetti et al.26 (2004); all conditions | Retrospective cohort; 2b; 2 years; 956 cases under observation | John Hopkin's Bayview; observation status beds; 1997 | Ward | Not reported | 99% ED 1% other location | General pediatricians covering ED and ward |
| Silvestri et al.29 (2005); all conditions | Descriptive; none given | Children's Hospital of Philadelphia; OU; 1999 | ED | 12 | ED | PEM physicians; PEM fellows; urgent care pediatricians; ED nurse practitioner; inpatient nurses |
| Alpern et al.34 (2008); all conditions | Prospective cohort; 1b; 30 months; 4453 cases under observation | Children's Hospital of Philadelphia | ||||
| Thomas27 (2000); all conditions | Descriptive; none given | Primary Children's Medical Center; RTU; 1999 | ED | 22‐26 | ED, clinic, procedure/OR | PEM physicians; general pediatricians; other specialists; no residents |
| Zebrack et al.25 (2005); all conditions | Retrospective cohort; 2b; 2 years; 4189 cases of unscheduled observation plus 2288 scheduled cases | Primary Children's Medical Center | PEM nurses; 1:4 nurse:patient ratio | |||
| Miescier et al.40 (2005); asthma | Retrospective cohort; 2b; 2 years; 3029 asthma visits; 384 admitted, 301 observed, 161cases met inclusion | Primary Children's Medical Center | ||||
| Holsti et al.41 (2005); head injury | Retrospective cohort; 2b; 2 years; 827 CHI visits, 273 admitted, 285 observed, 284 cases met inclusion | Primary Children's Medical Center | ||||
| Greenberg et al.42 (2006); croup | Retrospective pre‐post; 2b; 1 year each; 694 croup cases pre‐RTU, 66 admitted; 789 croup cases post‐RTU, 33 admitted; 76 observed | Primary Children's Medical Center | ||||
| Mallory et al.33 (2006); dehydration | Retrospective cohort; 2b; 1 year; 430 dehydration cases under observation | Primary Children's Medical Center | ||||
Staffing and Workflow
Staffing models varied and have undergone transitions over time. Prior to 1997, general pediatricians primarily provided physician services. In more recent years, OUs have utilized pediatric emergency medicine (PEM) providers. Three of the 11 units allowed for direct patient care by subspecialists.5, 6, 32 One OU was staffed by nurse practitioners.29 OU nursing backgrounds included pediatrics, emergency medicine, or PEM.
Five institutions assembled multidisciplinary teams to define the unit's role and establish policies and procedures.7, 27, 2931 Workflow in the OU focused on optimizing efficiency through standardized orders, condition‐specific treatment protocols, and bedside charting.7, 26, 33 Several units emphasized the importance of ongoing evaluations by attending physicians who could immediately respond to patient needs. Rounds occurred as often as every 4 hours.5, 7 Two centers utilized combined physician‐nursing rounds to enhance provider communication.7, 34 No publications reported on patient transitions between sites of care or at shift changes.
Criteria for Observation
All 11 hospitals have developed protocols to guide OU admissions (Table 2). Nine publications from 4 OUs commented on treatments delivered prior to observation.33, 3542 The most commonly cited criteria for admission was approval by the unit's supervising physician. Utilization review was not mentioned as an element in the OU admission decision. Common OU exclusions were the need for intensive care or monitoring while awaiting an inpatient bed; however, these were not universal. Eight centers placed bounds around the duration of OU stays, with minimum stays of 2 hours and maximum stays of 8 to 24 hours.
| Hospital | Entry Criteria | Age Range | Time | Exclusion Criteria |
|---|---|---|---|---|
| ||||
| King's County, Downstate Brooklyn | Otherwise required inpatient admission | 0‐13 years | Maximum 24 hours | Not reported |
| Acute problem of uncertain severity | ||||
| Acute problem not readily diagnosed | ||||
| Short course periodic treatment | ||||
| Diagnostic procedures impractical as outpatient | ||||
| Children's Hospital, Buffalo | Admission from any source | 0‐21 years | Maximum 24 hours | Intensive care needs |
| Short stay elective surgery | Routine diagnostic tests | |||
| Estimated length of stay <24 hours | Holding prior to admission | |||
| Children's National, Washington, DC | Inadequate response to 3 subcutaneous epinephrine injections | 8 months to 19 years | Not reported | Not reported |
| Children's Memorial, Chicago | Asthma: | |||
| Available parentAsthma score 5Inadequate response to ED treatment | >1 year | Maximum 24 hours | Past history of BPD, CF, CHD, other debilitating disease | |
| Dehydration: | ||||
| Cases receiving oral hydration | 3‐24 months | 12 hours for oral | Intensive care need | |
| Parent preference if given IV hydration | 8 to 12 hours for IV | Hypernatremia | ||
| Minneapolis Children's | Conditions listed in Table 3 | Not reported | Maximum 10 hours | Not reported |
| Children's Hospital, Boston | Straightforward diagnoses as determined by ED staff | Not reported | Not reported | Other complex medical issues |
| Bed availability | ||||
| Connecticut Children's | PEM attending discretionLimited severity of illnessUsually confined to a single organ systemClearly identified plan of care | Not reported | After 3‐4 hours in ED Low likelihood of requiring extended care >23 hours | Asthma: no supplemental O2 need, nebulized treatments >Q2 hourCroup: no supplemental O2 need, <2 racemic epinephrine treatmentsDehydration: inability to tolerate orals, bicarbonate >10, 40 mL/kg IVFSeizure: partial or generalized, postictal, unable to tolerate oralsPoisoning: mild or no symptoms, poison control recommendation |
| Children's Hospital, Denver | Intussusception: following reduction | 0‐18 years | After 3‐4 hours in ED | Not reported |
| Dehydration: based on clinical status | ||||
| Johns Hopkins, Bayview | Consultation with on‐duty pediatrician | 0‐18 years | Minimum of 2 hours | Patients requiring subspecialty or intensive care services |
| High likelihood of discharge at 24 hours | ||||
| Children's Hospital of Philadelphia | Sole discretion of the ED attending | Not reported | Minimum 4 hours | No direct admissions |
| Single focused acute condition | Maximum 23 hours | Diagnostic dilemmas | ||
| Clinical conditions appropriate for observation | Underlying complex medical problems | |||
| Primary Children's Medical Center | Observation unit attending discretion | 0‐21 years | Minimum 3 hours | Admission holds |
| Scheduled procedures as space available | Maximum 24 hours | Intensive care needs | ||
| ED admit after consult with OU doctor | Complicated, multisystem disease | |||
| Clear patient care goals | Need for multiple specialty consults | |||
| Limited severity of illness | Psychiatric patients | |||
| Diagnostic evaluation | ||||
Ages of Children Under Observation
Seven of 11 hospitals reported the age range of patients accepted in their OU (Table 2). All but 1 unit accepted children from infants to young adults, 18 to 21 years of age.43 In the 6 units that reported the age distribution of their OU population, roughly 20% were <1 year, more than 50% were <5 years, and fewer than 30% fell into an adolescent age range.5, 6, 26, 32, 34, 43
Conditions Under Observation
Many conditions under observation were common across time and location (Table 3). The list of conditions cared for in OUs has expanded in recent years. Medical conditions predominated over surgical. While the majority of observation cases required acute care, nearly one‐half of the units accepted children with scheduled care needs (eg, routine postoperative care, procedures requiring sedation, infusions, and extended evaluations such as electroencephalograms or pH probes). These scheduled cases, cared for within the OU structure, provided more steady demand for OU services.
| King's County, Downstate Brooklyn | Children's Hospital, Buffalo | Minneapolis Children's | Children's Hospital, Boston | Connecticut Children's | Children's Hospital, Denver | Johns Hopkins, Bayview | Children's Hospital of Philadelphia | Primary Children's Medical Center, Salt Lake City | |
|---|---|---|---|---|---|---|---|---|---|
| |||||||||
| Respiratory | |||||||||
| Asthma | |||||||||
| Pneumonia | |||||||||
| Bronchiolitis | |||||||||
| Croup | |||||||||
| Allergic reaction | |||||||||
| Cardiology | |||||||||
| Gastrointestinal | |||||||||
| Vomiting | |||||||||
| Gastro/dehydration | |||||||||
| Abdominal pain | |||||||||
| Constipation | |||||||||
| Diabetes | |||||||||
| Neurologic | |||||||||
| Seizure | |||||||||
| Head injury | |||||||||
| Infection | |||||||||
| Sepsis evaluation | |||||||||
| UTI/pyelonephritis | |||||||||
| Cellulitis | |||||||||
| Fever | |||||||||
| Pharyngitis | |||||||||
| Otitis media | |||||||||
| Adenitis | |||||||||
| Ingestion/poisoning | |||||||||
| Hematologic | |||||||||
| Sickle cell disease | |||||||||
| Transfusion/emnfusion | |||||||||
| Psychological/social | |||||||||
| Dental | |||||||||
| Surgical conditions | |||||||||
| Foreign body | |||||||||
| Trauma | |||||||||
| Burn | |||||||||
| Orthopaedic injury | |||||||||
| Postoperative complication | |||||||||
| Scheduled care | |||||||||
| Diagnostic workup | |||||||||
| Procedures/sedation | |||||||||
| Elective surgery | |||||||||
Reimbursement
One publication highlighted the special billing rules that must be considered for observation care.27 In 3 studies, payers recognized cost‐savings associated with the OU's ability to provide outpatient management for cases that would traditionally require inpatient care.31, 35, 38
Observation Unit Outcomes
Outcomes reported for pediatric OU stays fall into 4 major categories: length of stay (LOS), admission rates, return visit rates, and costs. Despite these seemingly straightforward groupings, there was significant heterogeneity in reporting these outcomes.
Length of Stay
The start time for OU length of stay (LOS) is not clearly defined in the articles included in this review. While the start of an observation period is assumed to begin at the time the order for observation is placed, it is possible that the LOS reported in these publications began at the time of ED arrival or the time the patient was physically transferred to the OU. The average LOS for individual OUs ranged from 10 to 15 hours.5, 6, 26, 30, 35, 38, 40, 41, 43 One ward‐based and 1 ED‐based unit reported LOS extending beyond 24 hours,7, 30 with averages of 35 and 9 hours, respectively. Two units limited the duration of care to <10 hours.31, 38
For studies that included a comparison group, OU stays were consistently shorter than a traditional inpatient stay by 6 to 110 hours.7, 36, 38, 39, 42 No significant differences in clinical parameters between groups were reported. There was appreciable variation in the average LOS across institutions for similar conditions, 12 to 35 hours for asthma,5, 7, 34, 35 and 9 to 18 hours for dehydration.5, 34, 36, 38
Admission Rates
Rates of hospital admission after observation from the 9 OUs reporting this outcome are presented in Table 4. Three publications from a single institution counted hospital admission in the 48 to 72 hours following discharge from the OU as though the patient were admitted to the hospital directly from the index OU stay.33, 40, 41 Conditions with the lowest admission rates, <10%, included croup, neurologic conditions, ingestions, trauma, and orthopedic injuries. The highest admission rates, >50%, were for respiratory conditions including asthma, pneumonia, and bronchiolitis.
| King's County, Downstate Brooklyn (%) | Children's Hospital, Buffalo (%) | Connecticut Children's (%) | Johns Hopkins, Bayview (%) | Children's Hospital of Philadelphia (%) | Primary Children's Medical Center, Salt Lake City (%) | |
|---|---|---|---|---|---|---|
| ||||||
| Unscheduled care | 42 | 17 | 11 | 25 | 25 | 15 |
| Respiratory | 32 | |||||
| Asthma | 57 | 16 | 26 | 22 | 22‐25* | |
| Pneumonia | 50 | 23 | 30‐48 | |||
| Bronchiolitis | 46 | 32 | 43 | |||
| Croup | 9 | 17 | 9 | 4‐6 | ||
| Allergic reaction | 3 | |||||
| Cardiology | 22 | |||||
| Gastrointestinal | 43 | 19 | ||||
| Vomiting | 5 | 22 | ||||
| Gastro/dehydration | 23 | 15/21 | 16* | |||
| Abdominal pain | 9 | 17 | 27 | |||
| Constipation | 9 | |||||
| Diabetes | 17 | |||||
| Neurologic | 10 | |||||
| Seizure | 19 | 8 | 17 | 18 | ||
| Head injury | 7 | 5* | ||||
| Infection | 19 | 34 | ||||
| Sepsis evaluation | 25 | 22 | ||||
| UTI/pyelonephritis | 25 | 16 | ||||
| Cellulitis | 15 | |||||
| Fever | 16 | 26 | ||||
| Pharyngitis | 13 | |||||
| Otitis media | 21 | |||||
| Ingestion/poisoning | 9 | 4 | 4 | 9 | 10 | 5 |
| Hematologic | 23 | |||||
| Transfusion/emnfusion | 2 | |||||
| Psychological/social | 21 | 80 | 17 | |||
| Dental | 14 | |||||
| Surgical conditions | ||||||
| Foreign body | ||||||
| Trauma | 13 | 2 | 53 | 5 | ||
| Burn | 13 | |||||
| Orthopedic injury | 22 | 3 | ||||
| Postoperative complication | 26 | 16 | ||||
| Scheduled care | ||||||
| Diagnostic workup | 0‐5 | |||||
| Procedures/sedation | 0.1‐9.0 | |||||
| Elective surgery | 13 | 0‐5 | ||||
Return Visit Rates
Unscheduled return visit rates were reported in 9 publications from 6 institutions and ranged from 0.01% to 5%.7, 26, 33, 3537, 3941 Follow‐up timeframes ranged from 48 hours to 1 month. Return visits were inconsistently defined. In most studies, rates were measured in terms of ED visits.26, 33, 3537, 39, 41 One ward‐based unit counted only hospital readmissions toward return visit rates.7 Three publications, from ED‐based units, counted hospital readmissions in the 2 to 5 days following observation toward admission rates and not as return visits.33, 40, 41 In most studies, data on return visits were collected from patient logs or patient tracking systems. Three studies contacted patients by phone and counted return visits to the clinic.3537 No studies reported on adherence to scheduled visits following observation.
Costs
Seven studies reported financial benefits of OU care when compared with traditional hospital care.7, 30, 31, 35, 37, 38, 42 Two centers admitted patients to inpatient care if their observation period reached a set time limit, after which cost savings were no longer realized.31, 35 Cost savings associated with the OU treatment of asthma and dehydration were attributed to lower charges for an OU bed.35, 38 Decreased charges for the OU treatment of croup were related to shorter LOS.42
Discussion
In the 40 years since the first studies of pediatric OUs, several US health systems have extended observation services to children. This model of care may be expanding, as suggested by an increase in the number of publications in the past 10 years. However, the number of centers within the US reporting on their OU experience remains small. Our systematic review identified a recurrent theme related to OUsthe opportunity to improve operational processes of care compared with the traditional inpatient alternative. We have identified the need to standardize OU outcomes and propose measures for future OU research.
Observation Unit Operations
The OU care model expands outpatient management of acute conditions to include children who are neither ready for discharge nor clear candidates for inpatient admission. OUs have demonstrated the ability to care for patients across the pediatric age spectrum. Over the decades spanning these publications, advances in medical therapy such as antiemetics for gastroenteritis and early administration of systemic steroids for asthma may have resulted in lower admission rates or shorter time to recovery.44, 45 Despite these advances, there are marked consistencies in the conditions cared for within OUs over time. The data summarized here may help guide institutions as they consider specific pediatric conditions amenable to observation care.
The hospitals included in this review either added physical space or revised services within existing structures to establish their OU. Hospitals facing physical constraints may look to underutilized areas, such as recovery rooms, to provide observation care, as observation does not require the use of licensed inpatient beds. Several units have responded to daily fluctuations in unscheduled observation cases by also serving patients who require outpatient procedures, brief therapeutic interventions, and diagnostic testing. By caring for patients with these scheduled care needs during the day, there is a more steady flow of patients into the OU. While hospitals traditionally have used postanesthesia care units and treatment rooms for scheduled cases, OUs appear to benefit from the consistent resource allocation associated with a constant demand for services.
To date, the vast majority of pediatric OUs in the published literature have emerged as an extension of ED services. Now, with the expansion of pediatric hospitalist services and movement toward 24/7 inpatient physician coverage, there may be increased development of ward‐based OUs and the designation of inpatient observation status. While ward‐based OUs managed by pediatric hospitalists may be well established, we were not able to identify published reports on this structure of care. A national survey of health systems should be undertaken to gather information regarding the current state of pediatric observation services.
When creating policies and procedures for OUs, input should be sought from stakeholders including hospitalists, PEM providers, primary care providers, subspecialists, mid‐level providers, nurses, and ancillary staff. As patients requiring observation level of care do not neatly fit an outpatient or inpatient designation, they present an opportunity for hospitalist and PEM physician groups to collaborate.4648 Calling on the clinical experiences of inpatient and ED providers could offer unique perspectives leading to the development of innovative observation care models.
This review focused on institutions with dedicated observation services, which in all but 1 study26 consisted of a defined geographic unit. It is possible that the practices implemented in an OU could have hospital‐wide impact. For example, 1 study reported reduction in LOS for all asthma cases after opening a ward‐based unit.7 Further, pediatric hospitalist services have been associated with shorter LOS49 and increased use of observation status beds compared with traditional ward services.50 As pediatric hospitalists expand their scope of practice to include both observation and inpatient care, clinical practice may be enhanced across these care areas. It follows that the impact of observation protocols on care in the ward setting should be independently evaluated.
The costs associated with the establishment and daily operations of an OU were not addressed in the reviewed publications. Assertions that observation provides a cost‐effective alternative to inpatient care4, 7, 23, 42 should be balanced by the possibility that OUs extend care for patients who could otherwise be discharged directly home. Studies have not evaluated the cost of OU care compared with ED care alone. Research is also needed to assess variations in testing and treatment intensity in OUs compared with the ED and inpatient alternatives. Reimbursement for observation is dependent in part upon institutional contracts with payers. A full discussion of reimbursement issues around observation services is beyond the scope of this review.
Observation Unit Outcomes
Length of Stay
Although most studies reported LOS, direct comparisons across institutions are difficult given the lack of a consistently referenced start to the observation period. Without this, LOS could begin at the time of ED arrival, time of first treatment, or time of admission to the OU. Identifying and reporting the elements contributing to LOS for observation care is necessary. The time of OU admission is important for billing considerations; the time of first treatment is important to understanding the patient's response to medical interventions; the time of ED arrival is important to evaluating ED efficiency. Each of these LOS measures should be reported in future studies.
Direct comparisons of LOS are further complicated by variability in the maximum permissible duration of an OU stay, ranging from 8 to 24 hours in the included studies. Despite these limits, some OU care will extend beyond set limits due to structural bottlenecks. For example, once the inpatient setting reaches capacity, observation LOS for patients who require admission will be prolonged. The best evaluation of LOS would come from prospective study design utilizing either randomization or quality improvement methods.
Defining Success and Failure in Observation Care
In the reviewed literature, observation failures have been defined in terms of admission after observation and unscheduled return visit rates. Admission rates are heavily dependent on appropriate selection of cases for observation. Although some observation cases are expected to require inpatient admission, OUs should question the validity of their unit's acceptance guidelines if the rate of admission is >30%.51 High rates could be the result of inadequate treatment or the selection of children too sick to improve within 24 hours. Low rates could indicate overutilization of observation for children who could be discharged directly home. Full reporting on the number of children presenting with a given condition and the different disposition pathways for each is needed to evaluate the success of OUs. Condition‐specific benchmarks for admission after observation rates could guide hospitals in their continuous improvement processes.
Unscheduled return visits may reflect premature discharge from care, diagnostic errors, or development of a new illness. OU care may influence patient adherence to scheduled follow‐up care but this has not been evaluated to date. In future research, both scheduled and unscheduled return visits following ED visits, observation stays, and brief inpatient admissions for similar disease states should be reported for comparison. Standard methodology for identifying return visits should include medical record review, claims analyses, and direct patient contact.
As hospitals function at or near capacity,52, 53 it becomes important to delineate the appropriate length of time to monitor for response to treatments in a given setting. Limited capacity was a frequently cited reason for opening a pediatric OU; however, the impact of OUs on capacity has not yet been evaluated. Operations research methods could be used to model OU services' potential to expand hospital capacity. This research could be guided by evaluation of administrative data from across institutions to identify current best practices for pediatric OU and observation status care.
OU benchmarking in the United States has begun with a small number of adult units participating in the ED OU Benchmark Alliance (EDOBA).54 In Table 5, we propose dashboard measures for pediatric OU continuous quality improvement. The proposed measures emphasize the role of observation along the continuum of care for acute conditions, from the ED through the OU with or without an inpatient stay to clinic follow‐up. Depending on the structure of observation services, individual institutions may select to monitor different dashboard measures from the proposed list. Patient safety and quality of care measures for the conditions commonly receiving pediatric OU care should also be developed.
| ED |
OU |
Inpatient |
Clinic | |
|---|---|---|---|---|
| ||||
| Length of stay* | ED arrival to OU admission | OU admit to disposition | Inpatient admit to discharge | |
| ED arrival to discharge home from OU | ||||
| ED arrival to discharge from inpatient following OU care | ||||
| OU admission to discharge home from inpatient care | ||||
| Admission* | % ED census admitted inpatient | % OU census admitted | ||
| % ED census that is observed | ||||
| Unscheduled return visits* | To ED | Requiring OU admission | Requiring inpatient admission | |
| Scheduled follow‐up* | To ED | To primary care or subspecialist office | ||
| Capacity | ED crowding scales | Unable to accept transfers | ||
| ED left before evaluation rates | Inpatient occupancy | |||
| Ambulance diversion | ||||
| Satisfaction | Patient/Parent | |||
| ED providers | OU providers | Inpatient providers | Follow‐up providers | |
| Cost | ED care | OU care | Inpatient care | |
| Total encounter | ||||
Limitations
The most important limitations to this review are the heterogeneity in interventions and reporting of outcomes, which precluded our ability to combine data or conduct meta‐analyses. We attempted to organize the outcomes data into clear and consistent groupings. However, we could not compare the performance of 1 center with another due to differences in OU structure, function, and design.
In order to focus this systematic review, we chose to include only peer reviewed publications that describe pediatric OUs within the United States. This excludes expert guidelines, which may be of value to institutions developing observation services.
Our search found only a small number of centers that utilize OUs and have published their experience. Thus, our review is likely subject to publication bias. Along this line, we identified 9 additional publications where children were cared for alongside adults within a general OU.5563 This suggests an unmeasured group of children under observation in general EDs, where more than 90% of US children receive acute care.64 These articles were excluded because we were unable to distinguish pediatric specific outcomes from the larger study population.
Finally, retrospective study design is subject to information bias. Without a comparable control group, it is difficult to understand the effects of OUs. Patients directly admitted or discharged from the ED and patients who require admission after observation all differ from patients discharged from observation in ways that should be controlled for with a randomized study design.
Conclusions
OUs have emerged to provide treatment at the intersection of outpatient and inpatient care during a time of dramatic change in both emergency and hospital medicine. As hospitalists expand their scope of practice to include observation care, opportunities will arise to collaborate with ED physicians and share their growing expertise in quality and efficiency of hospital care delivery to improve observation services for children. OUs have been established with laudable goalsto reduce inpatient admissions, increase patient safety, improve efficiency, and control costs. The current evidence is not adequate to determine if this model of healthcare delivery achieves these goals for children. Through synthesis of existing data, we have identified a need for standard reporting for OU outcomes and propose consistent measures for future observation care research. Only through prospective evaluation of comparable outcomes can we appraise the performance of pediatric OUs across institutions.
- .Observation medicine.Acad Emerg Med.1994;1(2):152–154.
- ,.Principles of observation medicine.Emerg Med Clin North Am.2001;19(1):1–17.
- ,,, et al.Emergency department observation beds improve patient care: Society for Academic Emergency Medicine debate.Ann Emerg Med.1992;21(8):967–975.
- .Pediatric observation medicine.Emerg Med Clin North Am.2001;19(1):239–254.
- ,,.The pediatric hybrid observation unit: an analysis of 6477 consecutive patient encounters.Pediatrics.2005;115(5):e535–e542.
- ,,, et al.Observation units: the role of an outpatient extended treatment site in pediatric care.Pediatr Emerg Care.1998;14(6):444–447.
- ,,, et al.Impact of a short stay unit on asthma patients admitted to a tertiary pediatric hospital.Qual Manag Health Care.1997;6(1):14–22.
- ,,, et al.Management of observation units. American College of Emergency Physicians.Ann Emerg Med.1995;25(6):823–830.
- ,,, et al. The observation unit: an operational overview for the hospitalist. Society of Hospital Medicine White Paper 2009; Available at: http://www.hospitalmedicine.org/Content/NavigationMenu/Publications/WhitePapers/White_Papers.htm. Accessed July2009.
- Acute Criteria Pediatric InterQual Level of Care.San Francisco, CA:McKesson Corporation;2006.
- Observation Status Related to U.S. Hospital Records.Healthcare Cost and Utilization Project. HCUP Methods Series Report #2002‐3. Rockville, MD: Agency for Healthcare Research and Quality;2002.
- ,,, et al.Emergency department observation unit versus hospital inpatient care for a chronic asthmatic population: a randomized trial of health status outcome and cost.Med Care.1998;36(4):599–609.
- ,,, et al.Costs of an emergency department‐based accelerated diagnostic protocol vs hospitalization in patients with chest pain: a randomized controlled trial.JAMA.1997;278(20):1670–1676.
- .Management of patients with infectious diseases in an emergency department observation unit.Emerg Med Clin North Am.2001;19(1):187–207.
- ,,, et al.A comparison between emergency diagnostic and treatment unit and inpatient care in the management of acute asthma.Arch Intern Med.1997;157(18):2055–2062.
- .Chest pain observation units.Emerg Med J.2001;18(2):148.
- ,,, et al.Randomised controlled trial and economic evaluation of a chest pain observation unit compared with routine care.BMJ.2004;328(7434):254.
- ,,, et al.A cooperative care model: cardiologists and hospitalists reduce length of stay in a chest pain observation. In:5th Scientific Forum on Quality of Care and Outcomes Research in Cardiovascular Disease and Stroke, Washington, DC, May 15‐17, 2003.Philadelphia, PA:Lippincott Williams 2003. p.P186.
- ,.Observation unit management of pediatric emergencies.Emerg Med Clin North Am.1991;9(3):669–676.
- .A short stay or 23‐hour ward in a general and academic children's hospital: are they effective?Pediatr Emerg Care.2000;16(4):223–229.
- ,,, et al.Trends in high turnover stays among children hospitalized in the United States, 1993 through 2003.Pediatrics.2009;123:996–1002.
- .Hospital based alternatives to acute paediatric admission: a systematic review.Arch Dis Child.2005;90(2):138–142.
- ,,.Short‐stay units and observation medicine: a systematic review.Med J Aust.2003;178(11):559–563.
- ,,.Use of emergency observation and assessment wards: a systematic literature review.Emerg Med J.2003;20(2):138–142.
- Oxford Centre for Evidence‐Based Medicine. Levels of evidence and grades of recommendation (May 2001). Available at: http://www.cebm.net/levels_of_evidence.asp. Accessed July2009.
- ,,, et al.Pediatric observation status beds on an inpatient unit: an integrated care model.Pediatr Emerg Care.2004;20(1):17–21.
- .Pediatric update. Our new rapid treatment unit: an innovative adaptation of the “less than 24‐hour stay” holding unit.J Emerg Nurs.2000;26(5):507.
- ,,.Use of an observation unit by a pediatric emergency department for common pediatric illnesses.Pediatr Emerg Care.2001;17(5):321–323.
- ,,, et al.Observation medicine: the expanded role of the nurse practitioner in a pediatric emergency department extended care unit.Pediatr Emerg Care.2005;21(3):199–202.
- ,,.An observation unit in a pediatric emergency department: one children's hospital's experience.J Emerg Nurs.2002;28(5):407–413.
- ,,.When the patient requires observation not hospitalization.J Nurs Admin.1988;18(10):20–23.
- ,.Observation unit in Children's Hospital—Adjunct to delivery and teaching of ambulatory pediatric care.N Y State J Med.1980;80(11):1684–1686.
- ,,, et al.Use of pediatric observation unit for treatment of children with dehydration caused by gastroenteritis.Pediatr Emerg Care.2006;22(1):1–6.
- ,,, et al.Utilization and unexpected hospitalization rates of a pediatric emergency department 23‐hour observation unit.Pediatr Emerg Care.2008;24(9):589–594.
- ,,, et al.Short‐term holding room treatment of asthmatic‐children.J Pediatr.1985;106(5):707–711.
- ,,.Usefulness of the serum electrolyte panel in the management of pediatric dehydration treated with intravenously administered fluids.Pediatrics.2004;114(5):1227–1234.
- ,,.Treatment of acute asthmatic attacks in a holding unit of a pediatric emergency room.Ann Allergy.1980;45(3):159–162.
- ,,.Outpatient oral rehydration in the United States.Am J Dis Child.1986;140(3):211–215.
- ,.Postreduction management of intussusception in a children's hospital emergency department.Pediatrics.2003;112(6 Pt 1):1302–1307.
- ,,, et al.Children with asthma admitted to a pediatric observation unit.Pediatr Emerg Care.2005;21(10):645–649.
- ,,, et al.Pediatric closed head injuries treated in an observation unit.Pediatr Emerg Care.2005;21(10):639–644.
- ,,.A reduction in hospitalization, length of stay, and hospital charges for croup with the institution of a pediatric observation unit.Am J Emerg Med.2006;24(7):818–821.
- ,,.Short stay in an outpatient department. An alternative to hospitalization.Am J Dis Child.1972;123(2):128–132.
- ,,.The role of oral ondansetron in children with vomiting as a result of acute gastritis/gastroenteritis who have failed oral rehydration therapy: a randomized controlled trial.Ann Emerg Med.2008;52(1):22–29.e6.
- ,,, et al.Oral ondansetron for gastroenteritis in a pediatric emergency department.N Engl J Med.2006;354(16):1698–1705.
- ,,, et al.Integrated hospital emergency care improves efficiency.Emerg Med J.2008;25(2):78–82.
- ,,, et al.Redefining the community pediatric hospitalist: the combined pediatric ED/inpatient unit.Pediatr Emerg Care.2007;23(1):33–37.
- ,,, et al.Program description: a hospitalist‐run, medical short‐stay unit in a teaching hospital.CMAJ.2000;163(11):1477–1480.
- ,.Evaluation of a pediatric hospitalist service: impact on length of stay and hospital charges.Pediatrics.2000;105(3 Pt 1):478–484.
- ,,, et al.Restructuring an academic pediatric inpatient service using concepts developed by hospitalists.Clin Pediatr (Phila).2001;40(12):653–660; discussion 661‐662.
- ,,, et al.American College of Emergency Physicians (ACEP).Practice Management Committee, American College of Emergency Physicians. Management of Observation Units. Irving, TX: American College of Emergency Physicians; July1994.
- Overcrowding crisis in our nation's emergency departments:is our safety net unraveling?Pediatrics.2004;114(3):878–888.
- ,.Emergency department overcrowding in the United States: an emerging threat to patient safety and public health.Emerg Med J.2003;20(5):402–405.
- ,,, et al.Characteristics of high volume teaching hospital observation units: data from the Emergency Department Observation Unit Benchmark Alliance (EDOBA).Acad Emerg Med.2009;16(s1):Abstract 628.
- ,,.Use of the emergency department observation unit in the treatment of acute asthma.Ann Emerg Med.1982;11(2):77–83.
- ,,, et al.Management of acute pyelonephritis in an emergency department observation unit.[see Comment].Ann Emerg Med.1991;20(3):253–257.
- ,,, et al.Patterns of use of an emergency department‐based observation unit.Am J Ther.2002;9(6):499–502.
- ,,, et al.Emergency department observation of poisoned patients: how long is necessary?[see Comment].Acad Emerg Med.1999;6(9):887–894.
- ,,, et al.False‐negative and false‐positive errors in abdominal pain evaluation: failure to diagnose acute appendicitis and unnecessary surgery.Acad Emerg Med.2000;7(11):1244–1255.
- .Resource use by younger versus older patients.Fam Pract Res J.1993;13(3):283–290.
- ,,, et al.Trauma 24‐hour observation critical path.J Trauma.1998;45(1):147–150.
- ,,, et al.The role of an emergency department observation unit in the management of trauma patients.J Emerg Med.1985;2(5):325–333.
- ,.Observation unit impact on ED admission for asthma.Am J Emerg Med.1994;12(1):11–14.
- ,.Emergency care for children in pediatric and general emergency departments.Pediatr Emerg Care.2007;23(2):94–102.
