User login
Hospital Unit‐Based Leadership Models
Hospital‐based care has become more complex over time. Patients are sicker, with more chronic comorbid conditions requiring greater collaboration to provide coordinated patient care.[1, 2] Care coordination requires an interdisciplinary approach during hospitalization and especially during transitions of care.[3, 4] In addition, hospitals are tasked with managing and improving clinical workflow efficiencies, and implementing electronic health records (EHR)[5] that require healthcare professionals to learn new systems of care and technology. Payment models have also started to shift toward an incentive and penalty‐based structure in the form of value‐based purchasing, readmission penalties, hospital‐acquired conditions, and meaningful use.[4, 6]
In response to these pressures, hospitals are searching for ways to reliably deliver quality care that is safe, effective, patient centered, timely, efficient, and equitable.[7] Previous efforts to improve quality in the general medical inpatient setting have included redesign of the clinical work environment and new workflows through the use of checklists and whiteboards to enhance communication, patient‐centered bedside rounds, standardized protocols and handovers, and integrated clinical decision support using health information technology.[8, 9, 10, 11, 12, 13] Although each of these care coordination activities has potential value, integrating them at the unit level often remains a challenge. Some hospitals have addressed this challenge by establishing and supporting a unit‐based leadership model, where a medical director and nurse manager work together to assess and improve the quality, safety, efficiency, and patient experience‐based mission of the organization.[14, 15] However, there are few descriptions of this leadership model in the current literature. Herein, we present the unit‐based leadership model that has been developed and implemented at 6 hospitals.
MODELS OF UNIT‐BASED LEADERSHIP
The unit‐based leadership model is grounded on the idea that culture and clinical care are products of frontline structure, process, and relationships, and that leaders at the site of care can have the greatest influence on the local work environment.[16, 17] The objective is to influence care and culture at the bedside and the unit, where care is delivered and where alignment with organizational vision and mission must occur. The concept of the inpatient unit medical director is not new, and hospitals in the past have recruited physician leaders to become clinical champions for quality improvement and help establish a collaborative work environment for physicians and unit‐based staff.[18, 19, 20, 21, 22] These studies report on the challenges and benefits of incorporating a medical director to inpatient psychiatry or general care units, but do not provide specific details about the recruitment and responsibilities for unit‐based dyad partnerships, which are critical factors for success on multidisciplinary inpatient care units.
There are several logistical matters to consider when instituting a unit‐based leadership model. These include the composition of the leadership team, selection process of the leaders, the presence of trainees and permanent faculty, and whether the units are able to geographically cohort patients. Other considerations include a clear role description with established shared goals and expectations, and a compensation model that includes effort and incentives. In addition, there should be a clearly established reporting structure to senior leadership, and the unit leaders should be given opportunities for professional growth and development. Table 1 provides a summary overview of 6 hospitals' experiences to date.
| Structure | Hospital of the University of Pennsylvania | Northwestern Memorial Hospital | Emory University Hospital | University of Michigan Health System | Christiana Care Health System | St. Joseph Mercy Health System/Integrated Health Associates |
|---|---|---|---|---|---|---|
| ||||||
| Description of hospital(s) | Academic medical center, 784 beds, 40,000 annual admissions | Academic medical center, 897 beds, 53,000 annual admissions | Academic medical center, 579 beds, 24,000 annual admissions | Academic medical center, 839 beds, 45,000 annual admissions | Independent academic medical center, 1,100 beds, 53,000 annual admissions | Tertiary community hospital that is part of a larger health care system (Trinity Health), 579 beds, 33,000 annual admissions |
| Unit leadership model | Triad of medical director, nurse manager, and quality improvement specialist/project manager | Dyad of medical director and nurse manager | Dyad of medical director and nurse manager | Dyad of medical director and nurse manager | Dyad of medical director and nurse manager | Dyad of medical director and nurse manager |
| Percent effort time supported for unit medical director | 10% | 17% | 10% | 20% | 20% | 10% |
| Incentives built into unit leaders' performance in outcomes metrics | No | Yes | No | No | No | Yes |
| Professional development/leadership training | Quality improvement method: PDSA, Six Sigma, Lean Healthcare | Quality improvement method: Six Sigma | Situational leadership training with 1:1 mentoring | Quality improvement method: Lean Healthcare, service excellence program | Quality Improvement method: Six Sigma, Lean Healthcare | Quality improvement method: Six Sigma |
| Additional leadership development through Penn Medicine Leadership Academy and Wharton Executive Education | Additional leadership development through Northwestern's professional development center and simulation training center | Conflict resolution skill development | Attend patient and Family Centered Care conference | Additional leadership development through Christiana Care Learning Institute | Attend educational course on Crucial Conversations | |
| Personality profile with coaching | Additional leadership development through University of Michigan Health System's human resources group | |||||
| Outcomes metrics monitored | Patient satisfaction | Patient satisfaction | Patient satisfaction | Patient satisfaction | Patient satisfaction | Patient satisfaction |
| Efficiency of multidisciplinary rounds | Teamwork climate (survey) | Teamwork and implementation of structured interdisciplinary bedside rounds | Multidisciplinary rounds | Interdisciplinary rounds | Participation in interdisciplinary rounds | |
| RNMD work environment surveys | Adverse events | Unit‐based patient safety culture survey | Patient‐centered, bedside rounds | Readmission rates | ||
| Hospital‐acquired conditions (CAUTI, CLABSI, VAP, DVT, pressure ulcers) | Hospital‐acquired conditions (fall rates, pressure ulcers | Hospital‐acquired conditions (CAUTI, CLABSI, fall rates, pressure ulcers) | Hospital‐acquired conditions (CAUTI) | Hospital‐acquired conditions (fall rates, pressure ulcers) | Core measures | |
| Readmission rates | Readmission rates | Mortality | Readmission rates | Readmission rates | Medication reconciliation | |
| Core measures, patient safety indicators | Core measures | Length of stay | DVT prophylaxis | Hand hygiene | Discharge by 11 am | |
| Mortality (observed to expected, transfer, inpatient) | Hand hygiene | Glycemic control | Meeting attendance | Length of stay | Use of patient teach‐back | |
| Medication reconciliation | Restraint use | Communication with PCPs | ||||
| Home care, hospice, post‐acute care referral rates | ||||||
| Organizational leadership structure support for clinical unit partnership program | CMO, CNO, vice president of quality/patient safety, directors of medical and surgical nursing | Associate chair of medicine, director of medicine nursing; all medical directors are members of the department of medicine quality management committee | CMO, CNO, CEO, CQO | CMO, CNO | All teams report to and are supported by 3 overarching, system‐wide committees: (1) safety first, (2) think of yourself as a patient, (3) clinical excellence. Those committees, in turn, report up to the senior management quality/safety coordinating council. | Director of hospitalist program (reports to CMO); nursing director of acute care (reports to CNO) |
DISCUSSION
In reviewing our 6 organization's collective experiences, we identified several common themes and some notable differences across sites. The core of the leadership team was primarily composed of the medical director and nurse manager on the unit. Across all 6 organizations, medical directors had a portion of their effort supported for their leadership work on the unit. Leadership development training was provided at all of our sites, with particular emphasis on quality improvement (QI) methods such as Six‐Sigma, Lean, or Plan, Do, Study, Act (PDSA). Additional leadership development sessions were provided through the organization's human resources or affiliated university. Common outcome measures of interest include patient satisfaction, interdisciplinary practice, and collaboration on the unit, and some hospital‐acquired condition measures. Last, there is a direct reporting relationship to a chief or senior nurse or physician leader within each organization. These commonalities and variances are further detailed below.
Establishing the Unit‐Based Leadership Model
The composition of the unit‐based leadership model in our 6 organizations is predominantly a dyad partnership of medical directors and nurse managers. Although informal physician‐nurse collaborative practices have likely been in existence at many hospitals, formalizing this dyad partnership is an important step to fostering collaborative efforts to improve quality of care. It is also essential for hospital leadership to clearly articulate the need for this unit‐based leadership model. Whether the motivation for change is from a previously untenable practice environment, or part of an ongoing improvement program, the model should be presented in a manner that supports the organization's commitment to improve collaborative practices for better patient care. One of our 6 hospitals initiated this leadership model based on troubling relationships between nurses and physicians on some of their inpatient care units, which threatened to stall the organization's Magnet application. Implementation of the leadership model at the unit level yielded improvements in nursephysician interactions, patient satisfaction, and staff turnover.[15, 23] Another of the hospitals first evaluated why a previous attempt at this model did not deliver the intended outcomes, and redesigned the model based on its analysis.[14]
Across all of the organizations featured here, a common driver behind the adoption of the unit‐based leadership model was to bridge the divide between physician services and nursing and other allied health providers. We found that many of the physicians routinely had patients on multiple units, limiting the quantity and quality of collaborative practices between unit‐based staff and physician teams. The unit‐based dyad leaders are ideally positioned to build and foster a culture of collaboration, and our organizations have been inclusive to ensure the participation of a multidisciplinary group of providers, including representatives from pharmacy, environmental services, physical therapy, respiratory therapy, social work, case management, and nutrition at leadership meetings or in daily patient‐care discussions. In addition, 2 of the organizations have added quality improvement specialist/project managers to their teams to support the physiciannurse manager leaders on the unit.
Selection Process and Professional Development
The traditional approach to hiring a physician leader or a nurse manager has been an isolated process of drafting a job description for each position and hiring within their respective departments. For the dyad partnership to be successful, there should be established goals and expectations that require shared responsibilities between the 2 partners, which should guide the selection of these leaders. Other leadership attributes and essential character traits that should be modeled by the unit‐based leaders include good communication skills, respect among coworkers, and a collaborative approach to decision making and action. In addition, both physician leaders and nurse managers in these roles should have the ability to take a system's view, recognizing that within the complex network of healthcare providers and processes on their unit, these elements interact with each other, which lead to the outcomes achieved on their units.[24, 25] Table 2 lists some general shared responsibilities, highlighting specific activities that can be used to achieve the established outcomes. As the unit's dyad leadership works together to address these shared responsibilities, they should keep their sights focused on the overall strategic goals of the healthcare organization. Bohmer has defined 4 habits of the high‐value healthcare organization that in turn can be reflected through the inpatient unit leadership model to capture these activities at the local level: (1) planning care for specific patient populations, (2) microsystem design, (3) measurement and oversight, and (4) self‐study.[26] In determining specific shared responsibilities for each dyad partner, it is important for these leaders to understand the clinical microsystem of their unit such as their patient population, interdisciplinary care team, approach to process improvement, and performance patterns over time.[27]
| General Shared Responsibilities of Physician and Nurse Unit Directors | Examples of Specific Activities |
|---|---|
| |
| Serve as management partners to enhance culture of the unit | Co‐craft and deliver consistent leadership message |
| Co‐establish and enforce unit processes and protocols | |
| Co‐lead recruitment and retention efforts | |
| Co‐orient trainees and faculty rotating through unit | |
| Co‐educate on the management of common medical and surgical conditions | |
| Facilitate interstaff conflict resolution sessions | |
| Regular leadership meetings | |
| Actively manage unit processes and outcomes | Quality: improve core quality measure performance |
| Safety: improve culture of patient safety within the unit as measured by surveys and incident reporting systems | |
| Efficiency: reduce unnecessary length of stay and variability in resource use | |
| Patient experience: focus on improving patient‐family experience with targeted outcomes in patient experience metrics (eg, HCAHPS) | |
| Education: develop trainee and staff clinical and teamwork competencies | |
| Continuous process improvement initiatives (eg, PDSA cycles) | Improve the discharge transitions process, tailoring the process to each individual patient's identified risk factors |
| Focus improvement efforts on reduction in specific hospital acquired conditions such as CAUTI, VTE, CLABSI, pressure ulcers, falls | |
| Measure, analyze, reassess, and improve in all described areas of shared responsibilities | |
| Perform unit level chart reviews to evaluate readmissions and LOS and identify improvement opportunities | |
In our collective experience, the dyad leaders bring passion and commitment to improving care; however, many (the medical directors in particular) have minimal prior formal training in leadership, quality improvement, or hospital management. Recognizing that unit leaders require specialized knowledge and skills, each of our organizations has enrolled unit medical directors and nurse managers in leadership development courses or educational programs. Many healthcare organizations have become more grounded in a QI methodology including Six‐Sigma, Lean Healthcare, PDSA, and other scientifically based methods, and the unit‐based leaders should receive advanced training in the preferred methods of their institution. Additional training in quality improvement, patient safety, and physician leadership can also be obtained through supplemental coursework specifically designed to train hospital leaders, with some programs leading to a certification or additional credentials.[28]
Beyond such formal educational opportunities, hospitals should not overlook the opportunity to learn from and share experiences with the other dyad leadership units within the hospital. One of the organizations described here holds monthly meetings with all of the unit dyad leaders, and 2 other organizations conduct quarterly meetings to share experiences and best practices related to specific improvement initiatives in a learning network model. Those units with more experience in specific initiatives are asked to share their lessons learned with others, as well as support each other in their efforts to collectively meet the strategic goals of the hospital.
Time and Organizational Support
In addition to leadership development, hospitals and the clinical department leadership need to support the medical directors with dedicated time away from their usual clinical duties. Some organizations in this report are providing up to 20% effort for the medical director's unit‐based leadership work; however, there is some variation in practice with regard to physician effort across sites. The University of Pennsylvania has a smaller effort support at 10%; however, some of that effort differential may be offset through the allocation of the quality improvement specialist/project manager assigned to work with the medical director and nurse manager dyad. St. Joseph Mercy Hospital also has a lower allocation, as there is additional financial compensation for the role that is at risk and not included in this 10% allocation.
It is also important to assure that the medical directors have institutional support to carry out their work in partnership with their nursing leadership. The 6 health systems described here report that although most of the physicians have appointments within a physician group or clinical department, there is hospital leadership oversight from a chief medical, nursing, or operating officer. This organizational structure may be an important aspect of the model as the unit‐based leaders seek to align their efforts with that of the hospital. Further, this form of organizational oversight can ensure that the unit leaders will receive timely and essential unit‐ and hospital‐based performance measures to manage local improvement efforts. These measures may include some components of patient experiences as reported in the Hospital Consumer Assessment of Healthcare Providers and Systems survey, readmission rates, hospital‐acquired condition rates, length of stay, observed to expected mortality rates, and results of staff satisfaction and safety culture surveys. As highlighted by several studies and commentaries, our collective experiences also identified interdisciplinary teamwork, collaboration, and communication as desirable outcome measures through the unit‐based leadership structure.[21, 22, 24, 29, 30] The medical director and nurse manager dyads can prioritize their improvement efforts based on the data provided to them, and mobilize the appropriate group of multidisciplinary practitioners and support staff on the unit.
OTHER CONSIDERATIONS
Other infrastructure variables that may increase the effectiveness of the unit leadership dyad include unit‐based clinical services (geographic localization), engaging the frontline team members in the design and implementation of change innovations, a commitment to patient and family centered practices on the unit, and enhancing clinical workflow through the support of EHR functions such as concurrent documentation and provider order entry. Geographic localization, placing the fewest possible clinical service providers on the unit to work alongside unit‐based staff, allows for a cohesive interdisciplinary unit‐based team to develop under the dyad leadership, and has been shown to improve communication practices.[9, 31] Beyond geographic localization of patients, it is critical to ensure team members are committed to the changes in workflow by directly involving them through the design and implementation of new models of care taking place on the unit. This commitment starts from the top senior nurse and physician leaders in the organization, and extends to the unit‐based dyad partners, and down to each individual interdisciplinary team member on the unit.[1] Thus, it is critical to clarify roles and responsibilities and how team members on the unit will interact with each other. For some situations, conflict management training will be helpful to the unit‐based leaders to resolve issues. To appreciate potential barriers to successful rollout of this unit leadership model, a phased implementation of pilot units, followed by successive waves, should be considered. Many of the units that instituted unit‐based interdisciplinary team rounds solicited and implemented direct feedback from frontline team members in efforts to improve communication and be more patient centered. Conversely, there are also likely to be situations where the unit‐based leaders will be confronted with hindrances to their unit‐based collaborative improvement efforts. To help prepare the dyad leaders, many of our unit‐based leaders have received specific training on how to coach and conduct difficult conversations with individuals who have performance gaps or are perceived to be hindering the progress of the unit's work. These crucial negotiation skills are not innate among most managers and should be explicitly provided to new leaders across organizations.
The goals and merits of patient‐ and family‐centered care (PFCC) have been well described.[32, 33, 34] Organizational support to teach and disseminate PFCC practices throughout all settings of care may help the leadership dyads implement rounding strategies that engage all staff, patients, and family members throughout the hospital course and during the transitions out of the hospital.
Clinical workflow has become heavily dependent on the EHR systems. For those organizations that have yet to adopt a particular EHR system, the leadership dyads should be involved throughout the EHR design process to help ensure that the technological solutions will be built to assist the clinical workflow, and once the system has been built, the leadership dyad should monitor and enhance the interface between workflow and EHR system so that it can support the creation and advancement of interdisciplinary plans of care on the unit.
CONCLUSION
The care of the hospitalized patient has become more complex over time. Interdisciplinary teamwork needs to be improved at the unit level to achieve the strategic goals of the hospital. Although quality improvement is an organizational goal, change takes place locally. Physician leaders, in partnership with nurse managers, are needed now more than ever to take on this task to improve the hospital‐care experience for patients by functioning as the primary effector arms for changing the landscape of hospital‐based care. We have described characteristics of unit‐based leadership programs adopted across 6 organizations. Hospitalists with clinical experience as the principal providers of inpatient‐based care and quality improvement experience and training, have been key participants in the development and implementation of the local leadership models in each of these hospital systems. We hope the comparison of the various models featured in this article serves as a valuable reference to hospitals and healthcare organizations who are contemplating the incorporation of this model into their strategic plan.
- , , , et al. Organizational predictors of coordination in inpatient medicine [published online ahead of print February 26, 2014]. Health Care Manage Rev. doi: 10.1097/HMR.0000000000000004.
- . Trends in case‐mix in the medicare population. Paper presented at: American Hospital Association, Federation of American Hospitals, Association of American Medical Colleges; http://www.aha.org/content/00‐10/100715‐CMItrends.pdf. July 15, 2010.
- . A requirement to reduce readmissions: take care of the patient, not just the disease. JAMA. 2013;309(4):394–396.
- , . Value‐based purchasing—national programs to move from volume to value. N Engl J Med. 2012;367(4):292–295.
- Medicare and Medicaid programs; electronic health record incentive program. Final rule. Fed Regist. 2010;75(144):44313–44588.
- . The Center for Medicare and Medicaid innovation's blueprint for rapid‐cycle evaluation of new care and payment models. Health Aff (Millwood). 2013;32(4):807–812.
- Institute of Medicine. Crossing the Quality Chasm: A New Health System for the 21st Century. Washington, DC: National Academies Press; 2001.
- , , , , , . Improving teamwork: impact of structured interdisciplinary rounds on a medical teaching unit. J Gen Intern Med. 2010;25(8):826–832.
- , , , et al. Impact of localizing physicians to hospital units on nurse‐physician communication and agreement on the plan of care. J Gen Intern Med. 2009;24(11):1223–1227.
- , , , . A review on systematic reviews of health information system studies. J Am Med Inform Assoc. 2010;17(6):637–645.
- , , , , . Patient whiteboards as a communication tool in the hospital setting: a survey of practices and recommendations. J Hosp Med. Apr 2010;5(4):234–239.
- , , . Development of a checklist for documenting team and collaborative behaviors during multidisciplinary bedside rounds. J Nurs Adm. 2013;43(5):280–285.
- , , , , . Assessment of teamwork during structured interdisciplinary rounds on medical units. J Hosp Med. 2012;7(9):679–683.
- , , , et al. Leadership at the front line: a clinical partnership model on general care inpatient units. Am J Med Qual. 2012;27(2):106–111.
- , . AHRQ health care innovations exchange: improvement projects led by unit‐based teams of nurse, physician, and quality leaders reduce infections, lower costs, improve patient satisfaction, and nurse‐physician communication. Available at: http://www.innovations.ahrq.gov/content.aspx?id=2719. Published April 14, 2010. Accessed November 26, 2011.
- , , , , , . Microsystems in health care: part 8. Developing people and improving work life: what front‐line staff told us. Jt Comm J Qual Saf. 2003;29(10):512–522.
- , , , et al. Microsystems in health care: part 5. How leaders are leading. Jt Comm J Qual Saf. 2003;29(6):297–308.
- , , . The academic dilemma of the inpatient unit director. Am J Psychiatry. 1989;146(1):73–76.
- , , , , . Improving and sustaining core measure performance through effective accountability of clinical microsystems in an academic medical center. Jt Comm J Qual Patient Saf. 2010;36(9):387–398.
- , , . Physician leadership and quality improvement in the acute child and adolescent psychiatric care setting. Child Adolesc Psychiatr Clin N Am. 2010;19(1):1–19; table of contents.
- , , , . Effect of a multidisciplinary intervention on communication and collaboration among physicians and nurses. Am J Crit Care. 2005;14(1):71–77.
- , . Nurse‐physician leadership: insights into interprofessional collaboration. J Nurs Adm. 2013;43(12):653–659.
- The Advisory Board. University of Pennsylvania Health System pilots unit clinical leadership model to spur quality gains. Nurs Exec Watch. 2008;9(2):4–6.
- , . Physicians as leaders in improving health care: a new series in Annals of Internal Medicine. Ann Intern Med. 1998;128(4):289–292.
- . Understanding medical systems. Ann Intern Med. 1998;128(4):293–298.
- . The four habits of high‐value health care organizations. N Engl J Med. 2011;365(22):2045–2047.
- , , , et al. Microsystems in health care: Part 1. Learning from high‐performing front‐line clinical units. Jt Comm J Qual Improv. 2002;28(9):472–493.
- , , , et al. The quality and safety educators academy: fulfilling an unmet need for faculty development. Am J Med Qual. 2014;29(1):5–12.
- , , , . Cooperation: the foundation of improvement. Ann Intern Med. 1998;128(12 pt 1):1004–1009.
- , , , , , . Ten principles of good interdisciplinary team work. Hum Resour Health 2013;11(1):19.
- , , , et al. Impact of localizing general medical teams to a single nursing unit. J Hosp Med. 2012;7(7):551–556.
- , , , . Integrating patient‐ and family‐centered care with health policy: four proposed policy approaches. Qual Manag Health Care. 2013;22(2):137–145.
- , , . Incorporating patient‐ and family‐centered care into resident education: approaches, benefits, and challenges. J Grad Med Educ. 2011;3(2):272–278.
- Smith M, Saunders R, Stuckhardt L, McGinnis JM, eds. Best Care at Lower Cost: The Path to Continuously Learning Health Care in America. Washington, DC: National Academies Press; 2012.
Hospital‐based care has become more complex over time. Patients are sicker, with more chronic comorbid conditions requiring greater collaboration to provide coordinated patient care.[1, 2] Care coordination requires an interdisciplinary approach during hospitalization and especially during transitions of care.[3, 4] In addition, hospitals are tasked with managing and improving clinical workflow efficiencies, and implementing electronic health records (EHR)[5] that require healthcare professionals to learn new systems of care and technology. Payment models have also started to shift toward an incentive and penalty‐based structure in the form of value‐based purchasing, readmission penalties, hospital‐acquired conditions, and meaningful use.[4, 6]
In response to these pressures, hospitals are searching for ways to reliably deliver quality care that is safe, effective, patient centered, timely, efficient, and equitable.[7] Previous efforts to improve quality in the general medical inpatient setting have included redesign of the clinical work environment and new workflows through the use of checklists and whiteboards to enhance communication, patient‐centered bedside rounds, standardized protocols and handovers, and integrated clinical decision support using health information technology.[8, 9, 10, 11, 12, 13] Although each of these care coordination activities has potential value, integrating them at the unit level often remains a challenge. Some hospitals have addressed this challenge by establishing and supporting a unit‐based leadership model, where a medical director and nurse manager work together to assess and improve the quality, safety, efficiency, and patient experience‐based mission of the organization.[14, 15] However, there are few descriptions of this leadership model in the current literature. Herein, we present the unit‐based leadership model that has been developed and implemented at 6 hospitals.
MODELS OF UNIT‐BASED LEADERSHIP
The unit‐based leadership model is grounded on the idea that culture and clinical care are products of frontline structure, process, and relationships, and that leaders at the site of care can have the greatest influence on the local work environment.[16, 17] The objective is to influence care and culture at the bedside and the unit, where care is delivered and where alignment with organizational vision and mission must occur. The concept of the inpatient unit medical director is not new, and hospitals in the past have recruited physician leaders to become clinical champions for quality improvement and help establish a collaborative work environment for physicians and unit‐based staff.[18, 19, 20, 21, 22] These studies report on the challenges and benefits of incorporating a medical director to inpatient psychiatry or general care units, but do not provide specific details about the recruitment and responsibilities for unit‐based dyad partnerships, which are critical factors for success on multidisciplinary inpatient care units.
There are several logistical matters to consider when instituting a unit‐based leadership model. These include the composition of the leadership team, selection process of the leaders, the presence of trainees and permanent faculty, and whether the units are able to geographically cohort patients. Other considerations include a clear role description with established shared goals and expectations, and a compensation model that includes effort and incentives. In addition, there should be a clearly established reporting structure to senior leadership, and the unit leaders should be given opportunities for professional growth and development. Table 1 provides a summary overview of 6 hospitals' experiences to date.
| Structure | Hospital of the University of Pennsylvania | Northwestern Memorial Hospital | Emory University Hospital | University of Michigan Health System | Christiana Care Health System | St. Joseph Mercy Health System/Integrated Health Associates |
|---|---|---|---|---|---|---|
| ||||||
| Description of hospital(s) | Academic medical center, 784 beds, 40,000 annual admissions | Academic medical center, 897 beds, 53,000 annual admissions | Academic medical center, 579 beds, 24,000 annual admissions | Academic medical center, 839 beds, 45,000 annual admissions | Independent academic medical center, 1,100 beds, 53,000 annual admissions | Tertiary community hospital that is part of a larger health care system (Trinity Health), 579 beds, 33,000 annual admissions |
| Unit leadership model | Triad of medical director, nurse manager, and quality improvement specialist/project manager | Dyad of medical director and nurse manager | Dyad of medical director and nurse manager | Dyad of medical director and nurse manager | Dyad of medical director and nurse manager | Dyad of medical director and nurse manager |
| Percent effort time supported for unit medical director | 10% | 17% | 10% | 20% | 20% | 10% |
| Incentives built into unit leaders' performance in outcomes metrics | No | Yes | No | No | No | Yes |
| Professional development/leadership training | Quality improvement method: PDSA, Six Sigma, Lean Healthcare | Quality improvement method: Six Sigma | Situational leadership training with 1:1 mentoring | Quality improvement method: Lean Healthcare, service excellence program | Quality Improvement method: Six Sigma, Lean Healthcare | Quality improvement method: Six Sigma |
| Additional leadership development through Penn Medicine Leadership Academy and Wharton Executive Education | Additional leadership development through Northwestern's professional development center and simulation training center | Conflict resolution skill development | Attend patient and Family Centered Care conference | Additional leadership development through Christiana Care Learning Institute | Attend educational course on Crucial Conversations | |
| Personality profile with coaching | Additional leadership development through University of Michigan Health System's human resources group | |||||
| Outcomes metrics monitored | Patient satisfaction | Patient satisfaction | Patient satisfaction | Patient satisfaction | Patient satisfaction | Patient satisfaction |
| Efficiency of multidisciplinary rounds | Teamwork climate (survey) | Teamwork and implementation of structured interdisciplinary bedside rounds | Multidisciplinary rounds | Interdisciplinary rounds | Participation in interdisciplinary rounds | |
| RNMD work environment surveys | Adverse events | Unit‐based patient safety culture survey | Patient‐centered, bedside rounds | Readmission rates | ||
| Hospital‐acquired conditions (CAUTI, CLABSI, VAP, DVT, pressure ulcers) | Hospital‐acquired conditions (fall rates, pressure ulcers | Hospital‐acquired conditions (CAUTI, CLABSI, fall rates, pressure ulcers) | Hospital‐acquired conditions (CAUTI) | Hospital‐acquired conditions (fall rates, pressure ulcers) | Core measures | |
| Readmission rates | Readmission rates | Mortality | Readmission rates | Readmission rates | Medication reconciliation | |
| Core measures, patient safety indicators | Core measures | Length of stay | DVT prophylaxis | Hand hygiene | Discharge by 11 am | |
| Mortality (observed to expected, transfer, inpatient) | Hand hygiene | Glycemic control | Meeting attendance | Length of stay | Use of patient teach‐back | |
| Medication reconciliation | Restraint use | Communication with PCPs | ||||
| Home care, hospice, post‐acute care referral rates | ||||||
| Organizational leadership structure support for clinical unit partnership program | CMO, CNO, vice president of quality/patient safety, directors of medical and surgical nursing | Associate chair of medicine, director of medicine nursing; all medical directors are members of the department of medicine quality management committee | CMO, CNO, CEO, CQO | CMO, CNO | All teams report to and are supported by 3 overarching, system‐wide committees: (1) safety first, (2) think of yourself as a patient, (3) clinical excellence. Those committees, in turn, report up to the senior management quality/safety coordinating council. | Director of hospitalist program (reports to CMO); nursing director of acute care (reports to CNO) |
DISCUSSION
In reviewing our 6 organization's collective experiences, we identified several common themes and some notable differences across sites. The core of the leadership team was primarily composed of the medical director and nurse manager on the unit. Across all 6 organizations, medical directors had a portion of their effort supported for their leadership work on the unit. Leadership development training was provided at all of our sites, with particular emphasis on quality improvement (QI) methods such as Six‐Sigma, Lean, or Plan, Do, Study, Act (PDSA). Additional leadership development sessions were provided through the organization's human resources or affiliated university. Common outcome measures of interest include patient satisfaction, interdisciplinary practice, and collaboration on the unit, and some hospital‐acquired condition measures. Last, there is a direct reporting relationship to a chief or senior nurse or physician leader within each organization. These commonalities and variances are further detailed below.
Establishing the Unit‐Based Leadership Model
The composition of the unit‐based leadership model in our 6 organizations is predominantly a dyad partnership of medical directors and nurse managers. Although informal physician‐nurse collaborative practices have likely been in existence at many hospitals, formalizing this dyad partnership is an important step to fostering collaborative efforts to improve quality of care. It is also essential for hospital leadership to clearly articulate the need for this unit‐based leadership model. Whether the motivation for change is from a previously untenable practice environment, or part of an ongoing improvement program, the model should be presented in a manner that supports the organization's commitment to improve collaborative practices for better patient care. One of our 6 hospitals initiated this leadership model based on troubling relationships between nurses and physicians on some of their inpatient care units, which threatened to stall the organization's Magnet application. Implementation of the leadership model at the unit level yielded improvements in nursephysician interactions, patient satisfaction, and staff turnover.[15, 23] Another of the hospitals first evaluated why a previous attempt at this model did not deliver the intended outcomes, and redesigned the model based on its analysis.[14]
Across all of the organizations featured here, a common driver behind the adoption of the unit‐based leadership model was to bridge the divide between physician services and nursing and other allied health providers. We found that many of the physicians routinely had patients on multiple units, limiting the quantity and quality of collaborative practices between unit‐based staff and physician teams. The unit‐based dyad leaders are ideally positioned to build and foster a culture of collaboration, and our organizations have been inclusive to ensure the participation of a multidisciplinary group of providers, including representatives from pharmacy, environmental services, physical therapy, respiratory therapy, social work, case management, and nutrition at leadership meetings or in daily patient‐care discussions. In addition, 2 of the organizations have added quality improvement specialist/project managers to their teams to support the physiciannurse manager leaders on the unit.
Selection Process and Professional Development
The traditional approach to hiring a physician leader or a nurse manager has been an isolated process of drafting a job description for each position and hiring within their respective departments. For the dyad partnership to be successful, there should be established goals and expectations that require shared responsibilities between the 2 partners, which should guide the selection of these leaders. Other leadership attributes and essential character traits that should be modeled by the unit‐based leaders include good communication skills, respect among coworkers, and a collaborative approach to decision making and action. In addition, both physician leaders and nurse managers in these roles should have the ability to take a system's view, recognizing that within the complex network of healthcare providers and processes on their unit, these elements interact with each other, which lead to the outcomes achieved on their units.[24, 25] Table 2 lists some general shared responsibilities, highlighting specific activities that can be used to achieve the established outcomes. As the unit's dyad leadership works together to address these shared responsibilities, they should keep their sights focused on the overall strategic goals of the healthcare organization. Bohmer has defined 4 habits of the high‐value healthcare organization that in turn can be reflected through the inpatient unit leadership model to capture these activities at the local level: (1) planning care for specific patient populations, (2) microsystem design, (3) measurement and oversight, and (4) self‐study.[26] In determining specific shared responsibilities for each dyad partner, it is important for these leaders to understand the clinical microsystem of their unit such as their patient population, interdisciplinary care team, approach to process improvement, and performance patterns over time.[27]
| General Shared Responsibilities of Physician and Nurse Unit Directors | Examples of Specific Activities |
|---|---|
| |
| Serve as management partners to enhance culture of the unit | Co‐craft and deliver consistent leadership message |
| Co‐establish and enforce unit processes and protocols | |
| Co‐lead recruitment and retention efforts | |
| Co‐orient trainees and faculty rotating through unit | |
| Co‐educate on the management of common medical and surgical conditions | |
| Facilitate interstaff conflict resolution sessions | |
| Regular leadership meetings | |
| Actively manage unit processes and outcomes | Quality: improve core quality measure performance |
| Safety: improve culture of patient safety within the unit as measured by surveys and incident reporting systems | |
| Efficiency: reduce unnecessary length of stay and variability in resource use | |
| Patient experience: focus on improving patient‐family experience with targeted outcomes in patient experience metrics (eg, HCAHPS) | |
| Education: develop trainee and staff clinical and teamwork competencies | |
| Continuous process improvement initiatives (eg, PDSA cycles) | Improve the discharge transitions process, tailoring the process to each individual patient's identified risk factors |
| Focus improvement efforts on reduction in specific hospital acquired conditions such as CAUTI, VTE, CLABSI, pressure ulcers, falls | |
| Measure, analyze, reassess, and improve in all described areas of shared responsibilities | |
| Perform unit level chart reviews to evaluate readmissions and LOS and identify improvement opportunities | |
In our collective experience, the dyad leaders bring passion and commitment to improving care; however, many (the medical directors in particular) have minimal prior formal training in leadership, quality improvement, or hospital management. Recognizing that unit leaders require specialized knowledge and skills, each of our organizations has enrolled unit medical directors and nurse managers in leadership development courses or educational programs. Many healthcare organizations have become more grounded in a QI methodology including Six‐Sigma, Lean Healthcare, PDSA, and other scientifically based methods, and the unit‐based leaders should receive advanced training in the preferred methods of their institution. Additional training in quality improvement, patient safety, and physician leadership can also be obtained through supplemental coursework specifically designed to train hospital leaders, with some programs leading to a certification or additional credentials.[28]
Beyond such formal educational opportunities, hospitals should not overlook the opportunity to learn from and share experiences with the other dyad leadership units within the hospital. One of the organizations described here holds monthly meetings with all of the unit dyad leaders, and 2 other organizations conduct quarterly meetings to share experiences and best practices related to specific improvement initiatives in a learning network model. Those units with more experience in specific initiatives are asked to share their lessons learned with others, as well as support each other in their efforts to collectively meet the strategic goals of the hospital.
Time and Organizational Support
In addition to leadership development, hospitals and the clinical department leadership need to support the medical directors with dedicated time away from their usual clinical duties. Some organizations in this report are providing up to 20% effort for the medical director's unit‐based leadership work; however, there is some variation in practice with regard to physician effort across sites. The University of Pennsylvania has a smaller effort support at 10%; however, some of that effort differential may be offset through the allocation of the quality improvement specialist/project manager assigned to work with the medical director and nurse manager dyad. St. Joseph Mercy Hospital also has a lower allocation, as there is additional financial compensation for the role that is at risk and not included in this 10% allocation.
It is also important to assure that the medical directors have institutional support to carry out their work in partnership with their nursing leadership. The 6 health systems described here report that although most of the physicians have appointments within a physician group or clinical department, there is hospital leadership oversight from a chief medical, nursing, or operating officer. This organizational structure may be an important aspect of the model as the unit‐based leaders seek to align their efforts with that of the hospital. Further, this form of organizational oversight can ensure that the unit leaders will receive timely and essential unit‐ and hospital‐based performance measures to manage local improvement efforts. These measures may include some components of patient experiences as reported in the Hospital Consumer Assessment of Healthcare Providers and Systems survey, readmission rates, hospital‐acquired condition rates, length of stay, observed to expected mortality rates, and results of staff satisfaction and safety culture surveys. As highlighted by several studies and commentaries, our collective experiences also identified interdisciplinary teamwork, collaboration, and communication as desirable outcome measures through the unit‐based leadership structure.[21, 22, 24, 29, 30] The medical director and nurse manager dyads can prioritize their improvement efforts based on the data provided to them, and mobilize the appropriate group of multidisciplinary practitioners and support staff on the unit.
OTHER CONSIDERATIONS
Other infrastructure variables that may increase the effectiveness of the unit leadership dyad include unit‐based clinical services (geographic localization), engaging the frontline team members in the design and implementation of change innovations, a commitment to patient and family centered practices on the unit, and enhancing clinical workflow through the support of EHR functions such as concurrent documentation and provider order entry. Geographic localization, placing the fewest possible clinical service providers on the unit to work alongside unit‐based staff, allows for a cohesive interdisciplinary unit‐based team to develop under the dyad leadership, and has been shown to improve communication practices.[9, 31] Beyond geographic localization of patients, it is critical to ensure team members are committed to the changes in workflow by directly involving them through the design and implementation of new models of care taking place on the unit. This commitment starts from the top senior nurse and physician leaders in the organization, and extends to the unit‐based dyad partners, and down to each individual interdisciplinary team member on the unit.[1] Thus, it is critical to clarify roles and responsibilities and how team members on the unit will interact with each other. For some situations, conflict management training will be helpful to the unit‐based leaders to resolve issues. To appreciate potential barriers to successful rollout of this unit leadership model, a phased implementation of pilot units, followed by successive waves, should be considered. Many of the units that instituted unit‐based interdisciplinary team rounds solicited and implemented direct feedback from frontline team members in efforts to improve communication and be more patient centered. Conversely, there are also likely to be situations where the unit‐based leaders will be confronted with hindrances to their unit‐based collaborative improvement efforts. To help prepare the dyad leaders, many of our unit‐based leaders have received specific training on how to coach and conduct difficult conversations with individuals who have performance gaps or are perceived to be hindering the progress of the unit's work. These crucial negotiation skills are not innate among most managers and should be explicitly provided to new leaders across organizations.
The goals and merits of patient‐ and family‐centered care (PFCC) have been well described.[32, 33, 34] Organizational support to teach and disseminate PFCC practices throughout all settings of care may help the leadership dyads implement rounding strategies that engage all staff, patients, and family members throughout the hospital course and during the transitions out of the hospital.
Clinical workflow has become heavily dependent on the EHR systems. For those organizations that have yet to adopt a particular EHR system, the leadership dyads should be involved throughout the EHR design process to help ensure that the technological solutions will be built to assist the clinical workflow, and once the system has been built, the leadership dyad should monitor and enhance the interface between workflow and EHR system so that it can support the creation and advancement of interdisciplinary plans of care on the unit.
CONCLUSION
The care of the hospitalized patient has become more complex over time. Interdisciplinary teamwork needs to be improved at the unit level to achieve the strategic goals of the hospital. Although quality improvement is an organizational goal, change takes place locally. Physician leaders, in partnership with nurse managers, are needed now more than ever to take on this task to improve the hospital‐care experience for patients by functioning as the primary effector arms for changing the landscape of hospital‐based care. We have described characteristics of unit‐based leadership programs adopted across 6 organizations. Hospitalists with clinical experience as the principal providers of inpatient‐based care and quality improvement experience and training, have been key participants in the development and implementation of the local leadership models in each of these hospital systems. We hope the comparison of the various models featured in this article serves as a valuable reference to hospitals and healthcare organizations who are contemplating the incorporation of this model into their strategic plan.
- , , , et al. Organizational predictors of coordination in inpatient medicine [published online ahead of print February 26, 2014]. Health Care Manage Rev. doi: 10.1097/HMR.0000000000000004.
- . Trends in case‐mix in the medicare population. Paper presented at: American Hospital Association, Federation of American Hospitals, Association of American Medical Colleges; http://www.aha.org/content/00‐10/100715‐CMItrends.pdf. July 15, 2010.
- . A requirement to reduce readmissions: take care of the patient, not just the disease. JAMA. 2013;309(4):394–396.
- , . Value‐based purchasing—national programs to move from volume to value. N Engl J Med. 2012;367(4):292–295.
- Medicare and Medicaid programs; electronic health record incentive program. Final rule. Fed Regist. 2010;75(144):44313–44588.
- . The Center for Medicare and Medicaid innovation's blueprint for rapid‐cycle evaluation of new care and payment models. Health Aff (Millwood). 2013;32(4):807–812.
- Institute of Medicine. Crossing the Quality Chasm: A New Health System for the 21st Century. Washington, DC: National Academies Press; 2001.
- , , , , , . Improving teamwork: impact of structured interdisciplinary rounds on a medical teaching unit. J Gen Intern Med. 2010;25(8):826–832.
- , , , et al. Impact of localizing physicians to hospital units on nurse‐physician communication and agreement on the plan of care. J Gen Intern Med. 2009;24(11):1223–1227.
- , , , . A review on systematic reviews of health information system studies. J Am Med Inform Assoc. 2010;17(6):637–645.
- , , , , . Patient whiteboards as a communication tool in the hospital setting: a survey of practices and recommendations. J Hosp Med. Apr 2010;5(4):234–239.
- , , . Development of a checklist for documenting team and collaborative behaviors during multidisciplinary bedside rounds. J Nurs Adm. 2013;43(5):280–285.
- , , , , . Assessment of teamwork during structured interdisciplinary rounds on medical units. J Hosp Med. 2012;7(9):679–683.
- , , , et al. Leadership at the front line: a clinical partnership model on general care inpatient units. Am J Med Qual. 2012;27(2):106–111.
- , . AHRQ health care innovations exchange: improvement projects led by unit‐based teams of nurse, physician, and quality leaders reduce infections, lower costs, improve patient satisfaction, and nurse‐physician communication. Available at: http://www.innovations.ahrq.gov/content.aspx?id=2719. Published April 14, 2010. Accessed November 26, 2011.
- , , , , , . Microsystems in health care: part 8. Developing people and improving work life: what front‐line staff told us. Jt Comm J Qual Saf. 2003;29(10):512–522.
- , , , et al. Microsystems in health care: part 5. How leaders are leading. Jt Comm J Qual Saf. 2003;29(6):297–308.
- , , . The academic dilemma of the inpatient unit director. Am J Psychiatry. 1989;146(1):73–76.
- , , , , . Improving and sustaining core measure performance through effective accountability of clinical microsystems in an academic medical center. Jt Comm J Qual Patient Saf. 2010;36(9):387–398.
- , , . Physician leadership and quality improvement in the acute child and adolescent psychiatric care setting. Child Adolesc Psychiatr Clin N Am. 2010;19(1):1–19; table of contents.
- , , , . Effect of a multidisciplinary intervention on communication and collaboration among physicians and nurses. Am J Crit Care. 2005;14(1):71–77.
- , . Nurse‐physician leadership: insights into interprofessional collaboration. J Nurs Adm. 2013;43(12):653–659.
- The Advisory Board. University of Pennsylvania Health System pilots unit clinical leadership model to spur quality gains. Nurs Exec Watch. 2008;9(2):4–6.
- , . Physicians as leaders in improving health care: a new series in Annals of Internal Medicine. Ann Intern Med. 1998;128(4):289–292.
- . Understanding medical systems. Ann Intern Med. 1998;128(4):293–298.
- . The four habits of high‐value health care organizations. N Engl J Med. 2011;365(22):2045–2047.
- , , , et al. Microsystems in health care: Part 1. Learning from high‐performing front‐line clinical units. Jt Comm J Qual Improv. 2002;28(9):472–493.
- , , , et al. The quality and safety educators academy: fulfilling an unmet need for faculty development. Am J Med Qual. 2014;29(1):5–12.
- , , , . Cooperation: the foundation of improvement. Ann Intern Med. 1998;128(12 pt 1):1004–1009.
- , , , , , . Ten principles of good interdisciplinary team work. Hum Resour Health 2013;11(1):19.
- , , , et al. Impact of localizing general medical teams to a single nursing unit. J Hosp Med. 2012;7(7):551–556.
- , , , . Integrating patient‐ and family‐centered care with health policy: four proposed policy approaches. Qual Manag Health Care. 2013;22(2):137–145.
- , , . Incorporating patient‐ and family‐centered care into resident education: approaches, benefits, and challenges. J Grad Med Educ. 2011;3(2):272–278.
- Smith M, Saunders R, Stuckhardt L, McGinnis JM, eds. Best Care at Lower Cost: The Path to Continuously Learning Health Care in America. Washington, DC: National Academies Press; 2012.
Dear Doctor: A Patient‐Centered Tool
In their seminal report Crossing the Quality Chasm, the Institute of Medicine outlined patient‐centered care as 1 of its 6 aims to improve the healthcare delivery system.[1] Patients who are more involved in their diagnosis and treatment plan are more likely to feel respected, be satisfied with their healthcare experience, and ultimately have better outcomes.[2, 3] In a study of hospitalized patients, only 42% were able to state their diagnosis at the time of discharge, suggesting that hospital providers could communicate better with patients about their hospital care.[4] Additionally, only 28% of hospitalized patients were able to list their medications, and only 37% were able to state the purpose of their medications. Although hospitals have taken great strides to improve the quality of patient care, publicly reported patient care surveys, such as the Hospital Consumer Assessment of Hospitals and Health Systems (HCAHPS), suggest that physician communication with patients could be further improved.[1, 5] Furthermore, a recent report by the Institute of Medicine stresses the need to get patients and families involved in their care.[6] Thus, hospital‐based providers should seek to enhance the quality of their communication with patients.
With greater emphasis placed on patient‐ and family‐centered care at many health systems, simple and easy‐to‐implement strategies to improve communication with patients need to be developed and tested.[7, 8] Patients who actively participate in their healthcare by asking questions of their doctor are able to control the focus of their interaction and adjust the amount of information provided.[9] Simply asking questions can have a critical impact, as 1 study found that the frequency with which patients asked questions was significantly related to the amount of information received about general and specific medical matters.[10] The notepad is a common tool for reminders and personal interactions that is used in everyday life, but has not been formalized in the hospital. We introduced Dear Doctor (DD) notes, a bedside notepad designed to prompt patient questions, with the goal of facilitating patient communication with their hospitalist physicians (Figure 1). As hospitalists provide direct and indirect care to a growing number of hospitalized patients, they are likely to be asked questions and opinions about the patients' diagnoses and plans. Furthermore, hospitalists are poised to lead institutional quality, safety, efficiency, and service improvement efforts in the inpatient setting. Becoming familiar with communication‐enhancing tools, such as the DD notes, may help hospitalists in their improvement team roles.
METHODS
Setting
We conducted a study between July 2009 and September 2009 on inpatient medical wards at a large academic medical center with 610 beds and over 44,000 annual discharges.[11] The internal medicine services served by attending physicians and residents comprise a large proportion of hospitalized patients, accounting for over 17,000 discharges per year. Each medical unit includes 32 beds.
Population
Patients over the age of 18 years admitted to a general medicine or cardiology unit and who were able to verbally communicate in English were eligible to be surveyed in the study. Patients with a length of stay <24 hours were excluded. A total of 664 patients were surveyed for inclusion in the study, 440 patients in the intervention group and 224 patients in the control group.
Intervention
The DD notepad included sample questions and informational prompts derived with input from a community focus group. The community focus group consisted of current and formerly hospitalized patients and family members who were asked by members of the study group what they thought would be important to include on a notepad provided to patients. From their answers the study team developed the DD notepad prototype. The DD notepad included 3 general categories of questions: (1) diagnosis and treatment, (2) tests and procedures, and (3) medications. To address other miscellaneous topics such as discharge and posthospital care needs, a section was designated for the patient to check off as I have a few more questions (Use the back of the sheet).
All patients admitted to the study units were intended to receive the DD notepad and pen, which were placed on the bedside table during the room change by our custodial staff. Patients who did not receive DD notepads in the intervention group during their first hospitalization day were provided with 1 by the clinical assistants working with the hospitalists. These patients did not initially receive the notepad due to logistical reasons from temporary rotating staff who were not instructed to provide the notepads. Patients were not formally prompted to use the notepad. Hospitalists, residents, and nurses on the study units were informed about the distribution of DD notes to patients on these units; however, they were not provided with any specific instructions on how they should incorporate the DD notes into their interactions with their patients. The use of the DD notepad was left to each healthcare professional's own discretion.
Members of the study team surveyed patients who had been in the hospital for a minimum of 24 hours in the intervention and control groups twice weekly. All responses were deidentified of any personal or health information. Patients were asked to rate on a scale from 1 to 5 their use of the DD notepads, their perceived value, the circumstances in which the notepads were used, and their level of satisfaction with how their physicians communicated and answered their questions (1 = no improvement, 5 = significant improvement). For control patients, questions pertaining to DD notepads were not applicable and were therefore excluded.
Statistical Analysis
The data were analyzed in an intention‐to‐treat analysis of all 440 patients in the intervention group. Intervention and control groups were compared using 2, rank sum, and Fisher exact statistical tests, with significance assigned as P < 0.05, using SPSS software version 17.0 (SPSS, Inc., Chicago, IL). Our project was approved by the University of Michigan's institutional review board.
RESULTS
Of the 440 patients surveyed in the intervention group (1 general medicine and 1 cardiology unit), 343 (78%) received the notepads in their rooms and 207 (47%) used them (Figure 2). Not every patient in the intervention group received DD notepads due to inconsistent placement of DD notepads upon every room turnover. Of the patients admitted to the control group (1 general medicine and 1 cardiology unit), 224 were surveyed. Fifty‐four percent of the 440 patients in the intervention group reported that they took notes related to their hospital care, compared to only 22% of the 224 patients in the control group (P < 0.001). Of the patients who took notes within the intervention group (n = 207), 91% of them utilized the DD notepads.
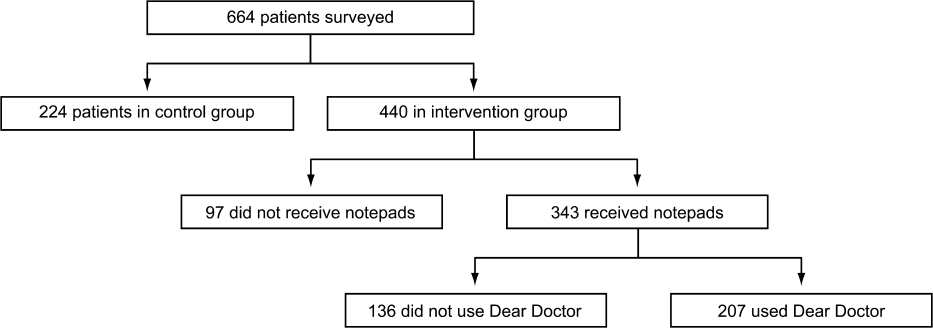
Patients in the intervention group who received and used the DD notes (n = 207) compared to patients in the control group (n = 224) were more likely to report that their questions were answered by their physicians (4.63 vs 4.45, P < 0.001). In an intention‐to‐treat analysis of all 440 patients in the intervention group, the overall satisfaction with physician communication was not significantly different between the intervention and control groups as measured on a 5‐point Likert scale (4.55 vs 4.55, P = 0.89). However, 89% of the patients in the intervention group who used the notepads felt that DD notepads either moderately or significantly improved their communication with their providers (Figure 3).

When the 207 patients who received DD notepads were asked how they used this tool, 99% of these patients used DD to write down questions, 82% to keep track of tests and procedures, and 54% indicated that their family and friends also used the notepads during the hospital stay (Table 1). Among these patients who utilized the DD notepads, 93% reported that they would use them again in the future.
| Wrote Notes? (P < 0.001) (%) | Used DD? (%) | Use in Future? (%) | Frequency of Questions Answered (P < 0.001) | DD Improved Communication | Satisfied With Communication? (P = 0.89) | |
|---|---|---|---|---|---|---|
| ||||||
| Intervention (n = 440) | 54 | 91 | 93.2 | 4.63 | 3.76 | 4.55 |
| Control (n = 224) | 22 | 4.45 | 4.55 | |||
Of the 97 patients in the intervention group who did not receive a DD notepad, we asked if they would use the DD notepad if they were made aware of such a tool. Of these patients, 77% agreed that they would use DD notes if they were made available in the future, 100% of them said that they would use DD to write down questions, 97% indicated that they would write notes about tests and procedures, and 88% of them believed that their families and friends would use DD notes.
DISCUSSION
As hospitals place greater emphasis and value on patient‐centered care as part of their clinical mission, it is important to develop tools to help facilitate the doctor‐patient relationship. We found that patients who were provided the Dear Doctor notepad were more satisfied that their doctors answered their questions and felt this tool enhanced their ability to communicate with their physicians. Employing the use of a familiar tool such as the notepad to remind patients about specific issues in their interactions with their providers can be a powerful intervention. Our study demonstrated that the DD notepad was widely accepted by patients, and that almost all of them would use this tool if it were made available to them in the future.
Other tools and methods to enhance the quality of communication between patients and their healthcare providers have included using whiteboards in the patients' rooms to relay the care plan to the patients, implementing bedside rounds by the healthcare team, and multidisciplinary huddling to coordinate information to the patient.[12, 13] Studies of these communication tools have shown potential to improve teamwork, interaction, and patient care. All of these have their own merit and value, and our DD notepad should be considered an adjunct to existing methods to enhance the patient care experience. A bedside tool that is familiar in form to most patients also needs to have the feature of easy access and use. Once this barrier has been removed for the patient and their family members, tools such as the DD notepad can impact the patient‐centeredness by fostering increased and better quality dialogue between the patients, their family members, and healthcare providers.
The DD notepad represents a means of communication that may have the potential to empower patients. It is possible that through question prompts, the DD notepad stimulates the patient to be an active partner with his or her healthcare team. This may enable patients to have some sense of control and accountability of their care in a setting where they would otherwise feel overwhelmed or powerless. The 3 general categories to help patients write down their questions included diagnosis, treatment plan, and medications. In the inpatient setting, where patient‐care activities can be fast paced, and patients are unable to recall some details when speaking to the healthcare team, these notes may remind the patient to write their thoughts down so that they may be remembered for a future time. In situations where patients may not know which questions to ask, the question prompts may be particularly helpful. We did not assess whether our particular question prompts were the key elements that resulted in their perceived value, or whether simply placing a blank notepad at the bedside would also have been successful. However, the specific questions were suggested by the focus groups. Enhanced communication, focusing on the patients' understanding of their condition, and the need to pursue certain diagnostic or therapeutic interventions, may help patients to be better prepared for the next course of plan. These topics of reasons for hospitalization, treatment plan, and medication changes are also important for patients to be active participants in their care, in particular as they transition from 1 site of care to the next, and their healthcare will be delivered by different providers.
There are several limitations to our study. First, this intervention was performed at a single hospital site with only 2 clinical services (general medicine, cardiology) represented in the study groups. Although we do not have any causal reasons to believe this tool would be looked upon differently by patients on other clinical services, it is possible that patients on a different clinical unit or service may view this tool as less or more useful. Second, as the patients were not randomized to intervention, but rather based on the units to which they were admitted, it is possible that other variables, such as the experience of the unit staff, the patient's condition, and housestaff‐based service versus hospitalist‐based service may have played a role in how the patients perceived the use of DD notes. Third, patients were only surveyed if they were able to verbally communicate in English. These notes may not be as useful in hospital settings to populations with language or literacy barriers. Fourth, the logistical implementation of DD notes limited our ability to deliver the DD notepads in every patient's rooms, where only 78% of the intervention group received the DD notepads. This may be the reason that we did not find that overall satisfaction with physician communication differed between intervention and control groups. Nonetheless, we performed an intention‐to‐treat analysis to minimize any biases in our analysis. Last, although our survey of patients asked about their satisfaction in using the DD note pads, we did not compare these results with those of Press‐Ganey or HCAHPS scores of patients on the intervention group versus the control group. Additionally, lack of data about type, quality, and quantity of questions asked by a control group to see if the notepads actually improved quality of questions asked is a limitation; however, we believe our outcomes of interest were most specifically evaluated through our survey questions.
DD notes show that the majority of patients who use this tool feel a modest to significant improvement in communication with their providers. Although the quality of medical care is undoubtedly the first priority, the patients' view of their care, which includes communication, is arguably just as important. An often‐forgotten goal of hospitals and clinics is to provide service excellence along with high‐quality care. Thus, it is imperative for hospitals and their care providers to not only focus on the quality and safety of the clinical care, but also be mindful of the patient's entire experience throughout their hospital stay. Many of the categories of questions asked in the HCAHPS address the patient's experience and perspectives of hospital care. Furthermore, the role of the HCAHPS survey in the Value‐Based Purchasing rules may enhance the importance of these notepads. As the results of HCAHPS are becoming more transparent and available to the public, the impact of such results will have a greater significance to the future of the hospital's clinical mission.
CONCLUSION
DD notepads are a simple, low‐cost, patient‐centered tool that can be an effective reminder for patients to ask their healthcare providers questions related to their hospital care. Utilizing a common tool such as the notepad, redesigned for the healthcare setting, can serve to help healthcare providers interact with their patients. Patient satisfaction may be higher in patients who use the DD notepad.
Disclosures: Aaron S. Farberg, MD, and Andrew M. Lin, MD, contributed equally in every way and should be considered co‐first authors. This work was supported by a University of Michigan Fostering Innovations Grant. The authors have no conflicting financial interests.
- Committee on Quality of Health Care in America, Institute of Medicine. Crossing the Quality Chasm: A New Health System for the 21st Century. Washington, DC: National Academy Press; 2001.
- , , , . An evidence base for patient‐centered cancer care: a meta‐analysis of studies of observed communication between cancer specialists and their patients. Patient Educ Couns. 2009;77(3):379–383.
- . Effective physician‐patient communication and health outcomes: a review. Can Med Assoc J. 1995;152:1423–1433.
- , . Patients' understanding of their treatment plans and diagnosis at discharge. Mayo Clin Proc. 2005;80(8):991–994.
- , , , . Patients' perception of hospital care in the United States. N Engl J Med. 2008;359:1921–1931.
- Institute of Medicine of the National Academies.Best care at lower cost: the path to continuously learning health care in America. Available at: http://www.iom.edu/Reports/2012/Best‐Care‐at‐Lower‐Cost‐The‐Path‐to‐Continuously‐Learning‐Health‐Care‐in‐America.aspx. Accessed October 5, 2012.
- , . An introduction to technology for patient‐centered collaborative care. J Ambul Care Manage. 2006;29:195–198.
- , , , , , . Effect on health‐related outcome of interventions to alter the interaction between patients and practitioners: a systematic review of trials. Ann Fam Med. 2004;2(6):595–608
- , , , , . Characteristics of physicians with participatory decision‐making styles. Ann Intern Med. 1996;124(5):497–504.
- . Information‐giving consultations: the influence of patients' communicative styles and personal characteristics. Soc Sci Med. 1991:32(5):541–548.
- University of Michigan Health System.Patient care and University of Michigan Health System. Available at: http://www.uofmhealth.org/about%2Bumhs/about‐clinical‐care. Accessed August 31, 2012.
- , , , et al. It's the writing on the wall: whiteboards improve inpatient satisfaction with provider communication. Am J Med Qual. 2011;26(2):127–131
- , , , , . Patient whiteboards as a communication tool in the hospital setting: a survey of practices and recommendations. J Hosp Med. 2010;5(4):234–239.
In their seminal report Crossing the Quality Chasm, the Institute of Medicine outlined patient‐centered care as 1 of its 6 aims to improve the healthcare delivery system.[1] Patients who are more involved in their diagnosis and treatment plan are more likely to feel respected, be satisfied with their healthcare experience, and ultimately have better outcomes.[2, 3] In a study of hospitalized patients, only 42% were able to state their diagnosis at the time of discharge, suggesting that hospital providers could communicate better with patients about their hospital care.[4] Additionally, only 28% of hospitalized patients were able to list their medications, and only 37% were able to state the purpose of their medications. Although hospitals have taken great strides to improve the quality of patient care, publicly reported patient care surveys, such as the Hospital Consumer Assessment of Hospitals and Health Systems (HCAHPS), suggest that physician communication with patients could be further improved.[1, 5] Furthermore, a recent report by the Institute of Medicine stresses the need to get patients and families involved in their care.[6] Thus, hospital‐based providers should seek to enhance the quality of their communication with patients.
With greater emphasis placed on patient‐ and family‐centered care at many health systems, simple and easy‐to‐implement strategies to improve communication with patients need to be developed and tested.[7, 8] Patients who actively participate in their healthcare by asking questions of their doctor are able to control the focus of their interaction and adjust the amount of information provided.[9] Simply asking questions can have a critical impact, as 1 study found that the frequency with which patients asked questions was significantly related to the amount of information received about general and specific medical matters.[10] The notepad is a common tool for reminders and personal interactions that is used in everyday life, but has not been formalized in the hospital. We introduced Dear Doctor (DD) notes, a bedside notepad designed to prompt patient questions, with the goal of facilitating patient communication with their hospitalist physicians (Figure 1). As hospitalists provide direct and indirect care to a growing number of hospitalized patients, they are likely to be asked questions and opinions about the patients' diagnoses and plans. Furthermore, hospitalists are poised to lead institutional quality, safety, efficiency, and service improvement efforts in the inpatient setting. Becoming familiar with communication‐enhancing tools, such as the DD notes, may help hospitalists in their improvement team roles.
METHODS
Setting
We conducted a study between July 2009 and September 2009 on inpatient medical wards at a large academic medical center with 610 beds and over 44,000 annual discharges.[11] The internal medicine services served by attending physicians and residents comprise a large proportion of hospitalized patients, accounting for over 17,000 discharges per year. Each medical unit includes 32 beds.
Population
Patients over the age of 18 years admitted to a general medicine or cardiology unit and who were able to verbally communicate in English were eligible to be surveyed in the study. Patients with a length of stay <24 hours were excluded. A total of 664 patients were surveyed for inclusion in the study, 440 patients in the intervention group and 224 patients in the control group.
Intervention
The DD notepad included sample questions and informational prompts derived with input from a community focus group. The community focus group consisted of current and formerly hospitalized patients and family members who were asked by members of the study group what they thought would be important to include on a notepad provided to patients. From their answers the study team developed the DD notepad prototype. The DD notepad included 3 general categories of questions: (1) diagnosis and treatment, (2) tests and procedures, and (3) medications. To address other miscellaneous topics such as discharge and posthospital care needs, a section was designated for the patient to check off as I have a few more questions (Use the back of the sheet).
All patients admitted to the study units were intended to receive the DD notepad and pen, which were placed on the bedside table during the room change by our custodial staff. Patients who did not receive DD notepads in the intervention group during their first hospitalization day were provided with 1 by the clinical assistants working with the hospitalists. These patients did not initially receive the notepad due to logistical reasons from temporary rotating staff who were not instructed to provide the notepads. Patients were not formally prompted to use the notepad. Hospitalists, residents, and nurses on the study units were informed about the distribution of DD notes to patients on these units; however, they were not provided with any specific instructions on how they should incorporate the DD notes into their interactions with their patients. The use of the DD notepad was left to each healthcare professional's own discretion.
Members of the study team surveyed patients who had been in the hospital for a minimum of 24 hours in the intervention and control groups twice weekly. All responses were deidentified of any personal or health information. Patients were asked to rate on a scale from 1 to 5 their use of the DD notepads, their perceived value, the circumstances in which the notepads were used, and their level of satisfaction with how their physicians communicated and answered their questions (1 = no improvement, 5 = significant improvement). For control patients, questions pertaining to DD notepads were not applicable and were therefore excluded.
Statistical Analysis
The data were analyzed in an intention‐to‐treat analysis of all 440 patients in the intervention group. Intervention and control groups were compared using 2, rank sum, and Fisher exact statistical tests, with significance assigned as P < 0.05, using SPSS software version 17.0 (SPSS, Inc., Chicago, IL). Our project was approved by the University of Michigan's institutional review board.
RESULTS
Of the 440 patients surveyed in the intervention group (1 general medicine and 1 cardiology unit), 343 (78%) received the notepads in their rooms and 207 (47%) used them (Figure 2). Not every patient in the intervention group received DD notepads due to inconsistent placement of DD notepads upon every room turnover. Of the patients admitted to the control group (1 general medicine and 1 cardiology unit), 224 were surveyed. Fifty‐four percent of the 440 patients in the intervention group reported that they took notes related to their hospital care, compared to only 22% of the 224 patients in the control group (P < 0.001). Of the patients who took notes within the intervention group (n = 207), 91% of them utilized the DD notepads.
Patients in the intervention group who received and used the DD notes (n = 207) compared to patients in the control group (n = 224) were more likely to report that their questions were answered by their physicians (4.63 vs 4.45, P < 0.001). In an intention‐to‐treat analysis of all 440 patients in the intervention group, the overall satisfaction with physician communication was not significantly different between the intervention and control groups as measured on a 5‐point Likert scale (4.55 vs 4.55, P = 0.89). However, 89% of the patients in the intervention group who used the notepads felt that DD notepads either moderately or significantly improved their communication with their providers (Figure 3).
When the 207 patients who received DD notepads were asked how they used this tool, 99% of these patients used DD to write down questions, 82% to keep track of tests and procedures, and 54% indicated that their family and friends also used the notepads during the hospital stay (Table 1). Among these patients who utilized the DD notepads, 93% reported that they would use them again in the future.
| Wrote Notes? (P < 0.001) (%) | Used DD? (%) | Use in Future? (%) | Frequency of Questions Answered (P < 0.001) | DD Improved Communication | Satisfied With Communication? (P = 0.89) | |
|---|---|---|---|---|---|---|
| ||||||
| Intervention (n = 440) | 54 | 91 | 93.2 | 4.63 | 3.76 | 4.55 |
| Control (n = 224) | 22 | 4.45 | 4.55 | |||
Of the 97 patients in the intervention group who did not receive a DD notepad, we asked if they would use the DD notepad if they were made aware of such a tool. Of these patients, 77% agreed that they would use DD notes if they were made available in the future, 100% of them said that they would use DD to write down questions, 97% indicated that they would write notes about tests and procedures, and 88% of them believed that their families and friends would use DD notes.
DISCUSSION
As hospitals place greater emphasis and value on patient‐centered care as part of their clinical mission, it is important to develop tools to help facilitate the doctor‐patient relationship. We found that patients who were provided the Dear Doctor notepad were more satisfied that their doctors answered their questions and felt this tool enhanced their ability to communicate with their physicians. Employing the use of a familiar tool such as the notepad to remind patients about specific issues in their interactions with their providers can be a powerful intervention. Our study demonstrated that the DD notepad was widely accepted by patients, and that almost all of them would use this tool if it were made available to them in the future.
Other tools and methods to enhance the quality of communication between patients and their healthcare providers have included using whiteboards in the patients' rooms to relay the care plan to the patients, implementing bedside rounds by the healthcare team, and multidisciplinary huddling to coordinate information to the patient.[12, 13] Studies of these communication tools have shown potential to improve teamwork, interaction, and patient care. All of these have their own merit and value, and our DD notepad should be considered an adjunct to existing methods to enhance the patient care experience. A bedside tool that is familiar in form to most patients also needs to have the feature of easy access and use. Once this barrier has been removed for the patient and their family members, tools such as the DD notepad can impact the patient‐centeredness by fostering increased and better quality dialogue between the patients, their family members, and healthcare providers.
The DD notepad represents a means of communication that may have the potential to empower patients. It is possible that through question prompts, the DD notepad stimulates the patient to be an active partner with his or her healthcare team. This may enable patients to have some sense of control and accountability of their care in a setting where they would otherwise feel overwhelmed or powerless. The 3 general categories to help patients write down their questions included diagnosis, treatment plan, and medications. In the inpatient setting, where patient‐care activities can be fast paced, and patients are unable to recall some details when speaking to the healthcare team, these notes may remind the patient to write their thoughts down so that they may be remembered for a future time. In situations where patients may not know which questions to ask, the question prompts may be particularly helpful. We did not assess whether our particular question prompts were the key elements that resulted in their perceived value, or whether simply placing a blank notepad at the bedside would also have been successful. However, the specific questions were suggested by the focus groups. Enhanced communication, focusing on the patients' understanding of their condition, and the need to pursue certain diagnostic or therapeutic interventions, may help patients to be better prepared for the next course of plan. These topics of reasons for hospitalization, treatment plan, and medication changes are also important for patients to be active participants in their care, in particular as they transition from 1 site of care to the next, and their healthcare will be delivered by different providers.
There are several limitations to our study. First, this intervention was performed at a single hospital site with only 2 clinical services (general medicine, cardiology) represented in the study groups. Although we do not have any causal reasons to believe this tool would be looked upon differently by patients on other clinical services, it is possible that patients on a different clinical unit or service may view this tool as less or more useful. Second, as the patients were not randomized to intervention, but rather based on the units to which they were admitted, it is possible that other variables, such as the experience of the unit staff, the patient's condition, and housestaff‐based service versus hospitalist‐based service may have played a role in how the patients perceived the use of DD notes. Third, patients were only surveyed if they were able to verbally communicate in English. These notes may not be as useful in hospital settings to populations with language or literacy barriers. Fourth, the logistical implementation of DD notes limited our ability to deliver the DD notepads in every patient's rooms, where only 78% of the intervention group received the DD notepads. This may be the reason that we did not find that overall satisfaction with physician communication differed between intervention and control groups. Nonetheless, we performed an intention‐to‐treat analysis to minimize any biases in our analysis. Last, although our survey of patients asked about their satisfaction in using the DD note pads, we did not compare these results with those of Press‐Ganey or HCAHPS scores of patients on the intervention group versus the control group. Additionally, lack of data about type, quality, and quantity of questions asked by a control group to see if the notepads actually improved quality of questions asked is a limitation; however, we believe our outcomes of interest were most specifically evaluated through our survey questions.
DD notes show that the majority of patients who use this tool feel a modest to significant improvement in communication with their providers. Although the quality of medical care is undoubtedly the first priority, the patients' view of their care, which includes communication, is arguably just as important. An often‐forgotten goal of hospitals and clinics is to provide service excellence along with high‐quality care. Thus, it is imperative for hospitals and their care providers to not only focus on the quality and safety of the clinical care, but also be mindful of the patient's entire experience throughout their hospital stay. Many of the categories of questions asked in the HCAHPS address the patient's experience and perspectives of hospital care. Furthermore, the role of the HCAHPS survey in the Value‐Based Purchasing rules may enhance the importance of these notepads. As the results of HCAHPS are becoming more transparent and available to the public, the impact of such results will have a greater significance to the future of the hospital's clinical mission.
CONCLUSION
DD notepads are a simple, low‐cost, patient‐centered tool that can be an effective reminder for patients to ask their healthcare providers questions related to their hospital care. Utilizing a common tool such as the notepad, redesigned for the healthcare setting, can serve to help healthcare providers interact with their patients. Patient satisfaction may be higher in patients who use the DD notepad.
Disclosures: Aaron S. Farberg, MD, and Andrew M. Lin, MD, contributed equally in every way and should be considered co‐first authors. This work was supported by a University of Michigan Fostering Innovations Grant. The authors have no conflicting financial interests.
- Committee on Quality of Health Care in America, Institute of Medicine. Crossing the Quality Chasm: A New Health System for the 21st Century. Washington, DC: National Academy Press; 2001.
- , , , . An evidence base for patient‐centered cancer care: a meta‐analysis of studies of observed communication between cancer specialists and their patients. Patient Educ Couns. 2009;77(3):379–383.
- . Effective physician‐patient communication and health outcomes: a review. Can Med Assoc J. 1995;152:1423–1433.
- , . Patients' understanding of their treatment plans and diagnosis at discharge. Mayo Clin Proc. 2005;80(8):991–994.
- , , , . Patients' perception of hospital care in the United States. N Engl J Med. 2008;359:1921–1931.
- Institute of Medicine of the National Academies.Best care at lower cost: the path to continuously learning health care in America. Available at: http://www.iom.edu/Reports/2012/Best‐Care‐at‐Lower‐Cost‐The‐Path‐to‐Continuously‐Learning‐Health‐Care‐in‐America.aspx. Accessed October 5, 2012.
- , . An introduction to technology for patient‐centered collaborative care. J Ambul Care Manage. 2006;29:195–198.
- , , , , , . Effect on health‐related outcome of interventions to alter the interaction between patients and practitioners: a systematic review of trials. Ann Fam Med. 2004;2(6):595–608
- , , , , . Characteristics of physicians with participatory decision‐making styles. Ann Intern Med. 1996;124(5):497–504.
- . Information‐giving consultations: the influence of patients' communicative styles and personal characteristics. Soc Sci Med. 1991:32(5):541–548.
- University of Michigan Health System.Patient care and University of Michigan Health System. Available at: http://www.uofmhealth.org/about%2Bumhs/about‐clinical‐care. Accessed August 31, 2012.
- , , , et al. It's the writing on the wall: whiteboards improve inpatient satisfaction with provider communication. Am J Med Qual. 2011;26(2):127–131
- , , , , . Patient whiteboards as a communication tool in the hospital setting: a survey of practices and recommendations. J Hosp Med. 2010;5(4):234–239.
© 2013 Society of Hospital Medicine

Hospitalist Time Usage and Cyclicality
Many academic medical centers (AMCs) employ hospitalists to provide care for patients on resident services as supervising attendings,1, 2 as well as on nonresident services.3 The number of hospitalists working on nonresident services at AMCs has grown exponentially, as the Accreditation Council for Graduate Medical Education (ACGME) implemented duty‐hour standards for residents.3 According to the latest Society of Hospital Medicine (SHM) estimates, the number of practicing hospitalists is projected to grow to 30,000 by 2010.4 As astonishing as this growth may sound, it is anticipated that more hospitalists will be needed to meet the demand for these physicians.5 Further, as financial realities require AMCs to be increasingly efficient without compromising patient care, and hospitalists provide a greater range of clinical services, it is important to better understand how hospitalists spend their time in the hospital. Understanding the daily work flow of hospitalists can identify how these physicians can be better supported. A previous report by O'Leary et al.6 highlighted how hospitalists spent their time during their usual day shifts at an AMC. It is important to validate their study to determine broadly applicable findings. We performed a time‐motion study where we followed the admitting hospitalists during the day and night shifts. We felt it was important to focus on hospitalists who are admitting patients, as this has potential patient safety and quality implications related to multitasking, triaging, and helping patients navigate through a complex admission process involving multiple clinical services. Our goal was to better understand how the flow of patients impacted these physicians, and determine how our hospitalists spent their time providing direct and indirect patient care‐related activities. In addition, we looked for predictable variations in activities throughout the day that might be associated with the timely care of patients.
Materials and Methods
Setting
The University of Michigan Health System (UMHS) is a tertiary care AMC, with more than 800 beds, and over 34,000 annual adult discharges. Internal Medicine services comprise a large proportion of those discharged, accounting for over 17,000 discharges per year; and is projected to grow at an annual rate of 4%. As service caps and work‐hour restrictions have limited the total number of patients that medical residents are able to care for, our hospitalist group has increased the number of physicians on the nonresident hospitalist service. At the time of the study, there were 23 hospitalists, equivalent to 18.25 full‐time equivalents (FTEs), staffing the service. The hospitalists provide in‐house patient care 24 hours a day and 7 days a week. Hospitalists also provide general medicine consult services, surgical comanagement and perioperative care, procedures, inpatient cardiopulmonary arrest response, rapid response team supervision, and observation care; and are also the primary inpatient physicians for many of the hospitalized interventional radiology and dermatology patients. These direct patient care activities account for 4500 annual discharges from the nonresident service.
Data Collection
Four university undergraduate business administration program students shadowed 11 hospitalists over a 3‐week period in 4‐hour to 12‐hour time blocks. The students followed the hospitalist on the shift that was taking admission calls, during day and night. A data collection tool was designed to track physicians' actions in 1‐minute increments, using categories similar to those used in a previously published time‐motion study of hospitalists' activities (Table 1).6 Physicians' activities each minute were assigned to a single category that most represented their action during that time period. At our AMC, 6 hospitalists work during the day shifts, and 2 on the night shifts. Our hospitalists may have patients in any of the 14 general care units in the hospital, as our hospitalists' services are not geographically based. The day hospitalists' shifts are scheduled from 7 AM to 7 PM. Two of the 6 hospitalists rotate through a 3‐day cycle as the admitting physician. Their duties include triaging and admitting patients until 2 PM, providing the day‐to‐day care for their patients until 7 PM, and occasionally cross‐covering for the other day‐shift hospitalists that have left for the day. The 4 other day‐shift hospitalists, not on their rotation as the admitting physician, may sign out and leave as early as 4 PM if their work for the day is done. At 2 PM, a separate swing‐shift hospitalist takes over the role of triaging and admitting until 7 PM. During the day shift, consults and perioperative management of patients are provided by a separate hospitalist on the consult service. At 7 PM, 2 nocturnists arrive for their 7 PM to 7 AM shift. The nocturnists, in addition to cross‐covering service patients, admit a maximum of 6 patients each, or until midnightwhichever comes first.
| Category | Code | Description |
|---|---|---|
| Direct patient care | DPIH | Initial history |
| DPDI | Discharge instructions | |
| DPFM | Family meetings | |
| DPRV | Revisit | |
| DPCC | Cross‐cover | |
| Indirect patient care | ||
| Documentation | IDGD | General documentation |
| IDDN | Daily notes | |
| IDDD | Discharge navigator | |
| Records/Results | IPMR | Review medical records |
| Communication | ICHH | Patient handoffs |
| ICFF | Face‐to‐face | |
| ICIP | Incoming page | |
| ICOP | Outgoing page | |
| ICIC | Incoming call | |
| ICOC | Outgoing call | |
| ICEE | E‐mail communications | |
| ICDP | Discharge planner | |
| Orders | IOWO | Writing orders |
| Professional development | PDRR | Reading articles, textbooks, references |
| Education | EEWR | Teaching during work rounds |
| Travel | TTTT | Travel |
| Personal | PPPP | Personal |
| Down time | DDDD | Downtime |
The students observed 11 different hospitalists, and followed these physicians during 9 weekday shifts, 5 weekday swing shifts, 10 weekday night shifts, and 4 weekend night shifts. The variance in the number of each type of shifts monitored was likely due to scheduling limitations of the students. In total, they collected data on 8,915 minutes of hospitalists' activities. The students monitored the hospitalists representing time periods from 7 AM to 2 AM. Analysis from 2 AM to 7 AM was excluded, because after 2 AM the hospitalists did not routinely evaluate new patients with the exception of emergent requests. New admissions after midnight are handled by a night float service staffed by residents.
Results
Overall, time spent on patient care activities comprised the bulk of hospitalists' shifts (82%) (Figure 1). Patient care activities were further categorized as direct patient caredefined as face‐to‐face patient or family time; and indirect patient caredefined as activities related to patient care, but without patient or family contact. Direct and indirect patient care accounted for 15% and 67% of the hospitalists' time, respectively. The other 18% of the hospitalists' time spent in the hospital were broadly categorized into: professional development, education, personal, downtime, and travel. Professional development included activities such as looking up information (eg, literature search); education included times that hospitalists spent with residents or medical students; personal time included only restroom and food breaks; and travel included time spent moving from 1 area to the next during their shift.
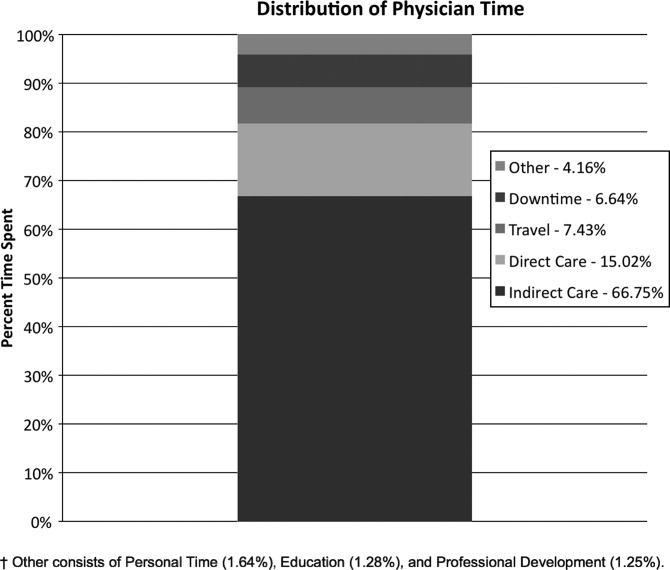
The majority of the hospitalists' direct patient care time was spent on evaluating new patients (79%). Significantly smaller amounts of time were spent on other direct care activities: cross‐covering other patients (8%), follow‐up visits (7%), family meetings (4%), and discharge instructions (2%) (Figure 2).
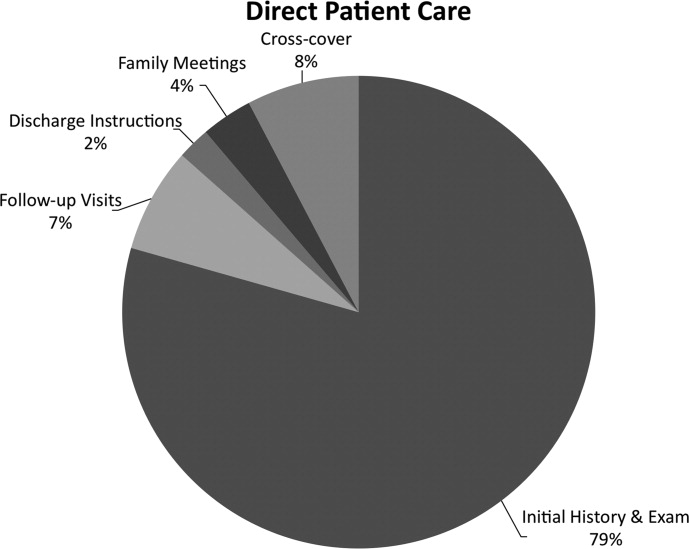
Indirect patient care activities included, 41% of time used to communicate with other healthcare providers, 26% on medical documentation, 20% reviewing medical records and results, and 13% of time writing orders (Figure 3). Communication accounted for a large proportion of a hospitalists' work, and included telephone conversations with Emergency Department (ED) or other admitting providers, handoffs, paging, face‐to‐face conversations with consultants and other support staff, and e‐mail.
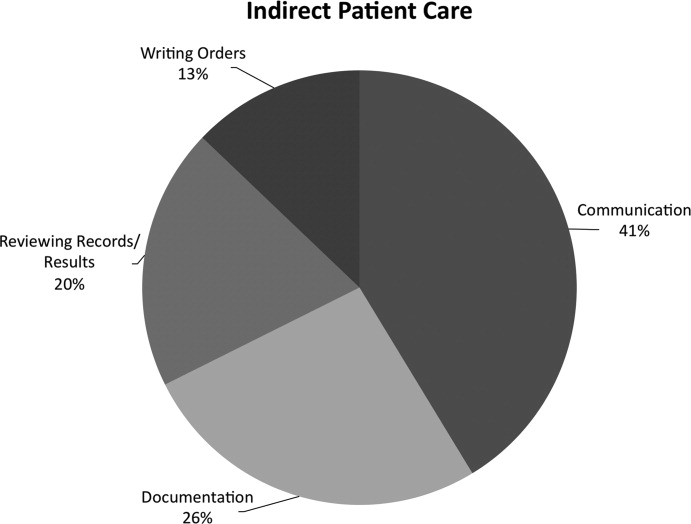
Figure 4 shows the hourly distribution of time spent on direct and indirect patient care by a hospitalist throughout the day. The day‐time hospitalists pick up their signout from the nocturnists at 7 AM to begin their shift. The swing hospitalists arrive at 2 PM during the weekdays, and their primary duty is to triage and admit patients until 7 PM. The nocturnists start their shift at 7 PM, at which time the daytime and swing‐shift hospitalists all sign out for the night.
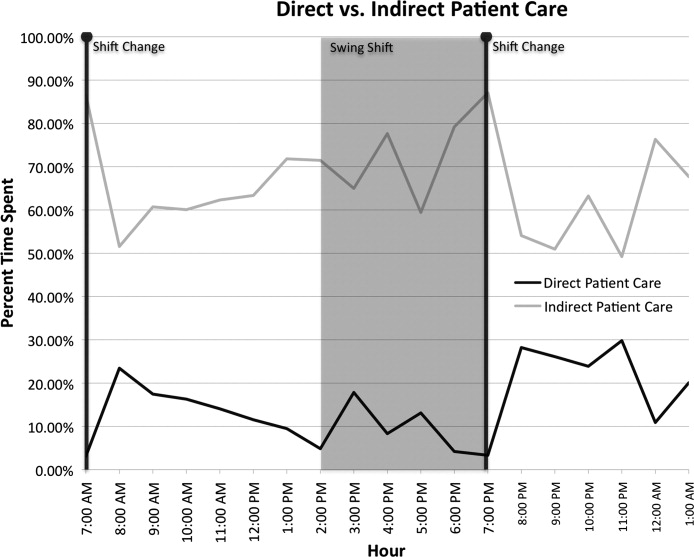
Discussion
Hospitalists on the nonresident service at our AMC utilize about 15% of their time on face‐to‐face patient care activities, 67% on indirect patient care activities, and 7% of time on moving from 1 part of the hospital to another. Hospitalists are valuable members of the physician work force who address the increasing patient care demands in the face of increasing limitations on residency work‐hours, a growing aging population, and existing inefficiencies in AMCs. The only other work‐flow study of hospitalists of which we are aware provided a single institution's perspective on time utilization by hospitalists. Our study in a different AMC setting revealed strong consistency with the O'Leary et al.6 study in the fraction of time hospitalists spent on direct patient care (15% and 18%, respectively), indirect patient care (67% and 69%); and within indirect patient care the time spent on documentation (26% and 37% of total time) and communications (41% and 35%). While travel in the O'Leary et al.6 study took up only 3% of hospitalists' time, the conclusions in that paper clearly suggest that the authors consider it an area of concern. Our study found that travel accounted for over 7% of hospitalists' time, confirming that intuition. The significant travel time may in part reflect the effects of a non‐geographically‐located hospitalist service. From these 2 studies we can be more confident that in large, tertiary care AMCs the time hospitalists spend on indirect patient care dominates that for direct patient care (by a factor of 4 in these studies), that within indirect patient care documentation and communication are dominant activities, and that travel can take a significant amount of time when patients are dispersed throughout the facility.
Both studies demonstrated that communication accounted for a significant proportion of a hospitalist's time. In our study communication accounted for 28% of their total time in the hospital, and 41% of the indirect patient care portion (Figure 3). A closer look within our communication category revealed that phone calls and handoffs accounted for two‐thirds of all communication time observed. As the hospitalists who carry the admitting pager, they receive the pages to take admission calls, but also take calls from consultants who have recommendations, as well as from nursing and other hospital staff. Depending on the nature of the conversation, the phone calls can last several minutes. While ensuring the communication between health care providers is complete and thorough, there may be opportunities to develop novel approaches to the way hospitalists communicate with other care providers. For example, at the UMHS, alternative communication methods with nursing staff have been proposed such as utilizing a website or a handheld device to help hospitalists prioritize their communications back to the nursing staff7; while standardizing the intake information from the ED or other admitting providers may help reduce the total time spent on phone calls. We will need to further explore the potential benefits of these ideas in future work.
Our data also reveal an interesting cyclicality of daily activities for the hospitalists, as shown in Figure 4. We identified batching behaviors throughout the day, which cause delays in seeing patients and can be deleterious to smooth workflows in support services. Spikes in indirect patient care, followed closely by spikes in direct patient care, occur regularly at shift changes (7 AM, 2 PM, and 7 PM). Also, in the night shift, indirect patient care drops to its lowest levels (in % of time spent) throughout the day, and direct patient care reaches its highest levels. The day‐shift indirect care profile is counter‐cyclical with direct care, as the hospitalist shifts between direct care and indirect care depending on the time of the day. We discuss these phenomena in turn.
It is known that variability in any operation causes congestion and delay, as an unavoidable consequence of the physics of material and information flows.8 Indeed, an entire subindustry based on Lean manufacturing principles has evolved from the Toyota Production System based on the elimination of unnecessary variability in operations.9 Lean processes have been ongoing in manufacturing facilities for decades, and these efforts are just recently being embraced by the service sector in general, and health care specifically.10, 11 Batching is an extreme form of variability, where there is a lull in the amount of work being done and then a burst of work is done over a short period of time. This means that jobs pile up in the queue waiting for the next spike of activity. Our data indicate batching seems to be a common phenomenon for our hospitalists. The majority of the patients admitted to our hospitalist service are unscheduled admissions that arrive primarily through the ED. One potential result of the unscheduled admissions is that patients could be referred to our hospitalist service at a pace that is not well predictable on an hour‐to‐hour basis. This could lead to an unintended result of multiple patients admitted over a short period of time. This means that many patients wait for intake, delaying the onset of their care by the inpatient physician. Also, since an initial exam often results in orders for laboratory tests and studies, batching on the floor will translate into batching of orders going to nursing, pathology, radiology, and other hospital support services. This imposes the cost of variability on these other services in the hospital. From a systems perspective, efficiency will improve if these activities can be smoothed throughout the day. This may suggest opportunities to work with the ED, to help smooth the inflow of patients into the hospital system.
Within the hospital, all of the day‐shift hospitalists can be reached about the needs of their respective patients, however, the physician carrying the admission pager also fields calls for admissions, and acts as the default contact person for the hospitalist group. As this hospitalist receives information on new admissions, he/she is aware of patients ready for intake but cannot evaluate them at the rate they are being referred, so the queue builds. This continues into the swing shift, which also fields referrals faster than they can attend to them. The volatility in indirect care during the swing shift, 2 PM to 7 PM, reflects a significant amount of triaging and fielding general calls about hospitalist patients. These activities further reduce the swing shift's ability to clear the intake queue. The night shift finally gets to these patients and, eventually, clears the queue. There may be an opportunity to consider the use of multiple input pagers or other process changes that can smooth this flow and rationalize the recurring tasks of finding patients and the responsible physician.
Another concept in Lean thinking is that variability is costly when it represents a mismatch between demand for a service and the capacity to serve. With regards to admitted patients, when demand outpaces capacity, patients will wait. When capacity outpaces demand, there is excess capacity in the system. The ideal is to match demand and capacity at all times, so nobody waits and the system carries no costly excess capacity. As the intake providers for admitted patients, we can attack this problem from the capacity side. Here, 2 generic Lean tactics are to: (1) reallocate resources to a bottleneck that is holding up the entire system, and (2) relieve workers of time‐consuming but non‐value‐adding work so they have more capacity to devote to serving demand. In our study, carrying multiple input pagers is an example of tactic (1), and efficient communication technologies and practices that reduce indirect time is an example of (2). Systemwide improvements would require further investigation by working with the variability on the input side (eg, ED admissions).
Our study also found that a significant percent of the time observed was spent traveling (7.4%) from room to room between different floors in the hospital. Travel time, which is non‐value‐adding, is one of the major forms of waste Lean thinking.12 Our hospitalists can provide care to patients at any of the general medical‐surgical beds we have available at our health system. These beds are distributed across 14 units on 5 different floors, as well as in the ED if a bed is not available for an admitted patient. In hospitals routinely operating at high occupancy, such as our AMC, patients often get distributed throughout the facility for lack of beds on the appropriate service's ward. One cost for this is a potential mismatch between a patient's needs and floor nurses' training. Our study reveals another cost, and that is its contribution to the significant amount of time hospitalists spent on travel, which is largely driven by the need to see dispersed patients. Reducing this cost requires a systemic, rather than service‐specific, solution. Our AMC is adding observation‐status beds to relieve some of the pressure on licensed beds, and considering bed management (including parts of the admissions and discharge processes) changes designed to promote better collocation of patients with services. Further study on these and other collocation tactics is warranted.
The spike in indirect activities at 4 PM represents, in part, an early signout by 1 or more of the hospitalists who are not scheduled to hold the admission pager, and have completed their work for the day. This handoff will be replicated at 7 PM when the nocturnists arrive for their night shift. In addition to a significant indirect load on physicians, multiple handoffs have been associated with decreased quality of care.13 Again, it is worthwhile considering the feasibility of alternative shift schedules that can minimize handoffs.
Finally, our findings revealed that a low percentage of time was dedicated to providing discharge instructions (2.24% of direct patient care time, and 0.34% of total time). Because the task of discharging patients falls primarily on the day‐shift hospitalists, when combined with swing‐shift and night‐shift hospitalists' data, the low percentage measured on discharge instructions may have been diluted. Nonetheless, this may point to the need for further investigation on how hospitalists provide direct patient encounter time during this critical phase of transition out of the hospital.
Our study is not without limitations. The student observers shadowed a representative group of hospitalists, but they were not able to follow everyone in the group. More specifically, their observations were made on the hospitalist who was carrying the primary hospitalist service admitting pager. Although it was the intent of our study to focus on the hospitalists we felt would be the busiest, our results may not be generalizable to all hospitalists. Although our research supports the previous findings by O'Leary et al.,6 a second limitation to our study is that our analysis was done at a single hospitalist group in an AMC, and hence the results may not be generalizable to other hospitalist groups. Another limitation may be that we did not do an evaluation of the hours between 2 AM to 7 AM. This period of time is used to catch up on medical documentation and to be available for medical emergencies. As more hospitalist programs are employing the use of nocturnists, it may be informative to have this time period tracked for activities.
Conclusions
Our study supports the broad allocation of hospitalist time found in an earlier study at a different AMC,6 suggesting that these might be generally representative in other AMCs. We found that travel constitutes a significant claim in hospitalists' time, due in part to the inability to collocate hospitalist service patients. Remedies are not likely to be service‐specific, but will require systemwide analyses of admission and discharge processes. Communication takes a significant amount of hospitalist time, with pages and phone calls related to handoffs accounting for most of the total communication time. As hospitalists working at non‐AMC settings may experience different work flow issues, we would like to see time‐motion studies of hospitalists in other types of hospitals. Future studies should also seek to better understand the how hospitals at high occupancy may reduce batching and streamline both the discharge and admission process, determine the factors that account for the significant communication time and how these processes could be streamlined, and evaluate the potential benefits of geographical localization of hospitalists' patients.
Acknowledgements
The authors thank Tracey Jackson, Michael Paulsen, Deepak Srinivasin, and Ryan Werblow, who were students in the undergraduate business school program, for their invaluable contribution in shadowing hospitalists to collect the time study data.
- , , , .Where should hospitalists sit within the academic medical center?J Gen Intern Med.2008;23:1269–1272.
- , .Hospitalists in teaching hospitals: opportunities but not without danger.J Gen Intern Med.2004;19:392–393.
- , , , , .Non‐housestaff medicine services in academic centers: models and challenges.J Hosp Med.2008;3:247–255.
- Society of Hospital Medicine. Society of Hospital Medicine Releases Results of the 2007–2008 Survey on the State of the Hospital Medicine Movement.2008. Available at: http://www.hospitalmedicine.org/AM/Template.cfm? Section=Press_Releases3:398–402.
- , , .How hospitalists spend their time: insights on efficiency and safety.J Hosp Med.2006;1:88–93.
- , .MCOMM: Redefining Medical Communication in the 21st Century, University of Michigan Health System. In: Society of Hospital Medicine Annual Meeting, Best of Innovations Presentation; 2009; Chicago, IL;2009.
- , .Factory Physics: Foundations of Manufacturing Management.Boston:Irwin, McGraw‐Hill;1996.
- .The Toyota Way.1st ed.Madison, WI:McGraw‐Hill;2004.
- Going Lean in Health Care.White Paper.Boston, MA:Institute for Healthcare Improvement;2005 January and February, 2005. Available at: http://www.ihconline.org/toolkits/LeanInHealthcare/GoingLeaninHealth CareWhitePaper.pdf. Accessed September 2009.
- , , , .Lean health care: what can hospitals learn from a world‐class automaker?J Hosp Med.2006;1:191–199.
- , , , , .Managing Business Process Flows.Upper Saddle River, NJ:Prentice Hall;2006.
- , .The patient handoff: medicine's Formula One moment.Chest.2008;134:9–12.
Many academic medical centers (AMCs) employ hospitalists to provide care for patients on resident services as supervising attendings,1, 2 as well as on nonresident services.3 The number of hospitalists working on nonresident services at AMCs has grown exponentially, as the Accreditation Council for Graduate Medical Education (ACGME) implemented duty‐hour standards for residents.3 According to the latest Society of Hospital Medicine (SHM) estimates, the number of practicing hospitalists is projected to grow to 30,000 by 2010.4 As astonishing as this growth may sound, it is anticipated that more hospitalists will be needed to meet the demand for these physicians.5 Further, as financial realities require AMCs to be increasingly efficient without compromising patient care, and hospitalists provide a greater range of clinical services, it is important to better understand how hospitalists spend their time in the hospital. Understanding the daily work flow of hospitalists can identify how these physicians can be better supported. A previous report by O'Leary et al.6 highlighted how hospitalists spent their time during their usual day shifts at an AMC. It is important to validate their study to determine broadly applicable findings. We performed a time‐motion study where we followed the admitting hospitalists during the day and night shifts. We felt it was important to focus on hospitalists who are admitting patients, as this has potential patient safety and quality implications related to multitasking, triaging, and helping patients navigate through a complex admission process involving multiple clinical services. Our goal was to better understand how the flow of patients impacted these physicians, and determine how our hospitalists spent their time providing direct and indirect patient care‐related activities. In addition, we looked for predictable variations in activities throughout the day that might be associated with the timely care of patients.
Materials and Methods
Setting
The University of Michigan Health System (UMHS) is a tertiary care AMC, with more than 800 beds, and over 34,000 annual adult discharges. Internal Medicine services comprise a large proportion of those discharged, accounting for over 17,000 discharges per year; and is projected to grow at an annual rate of 4%. As service caps and work‐hour restrictions have limited the total number of patients that medical residents are able to care for, our hospitalist group has increased the number of physicians on the nonresident hospitalist service. At the time of the study, there were 23 hospitalists, equivalent to 18.25 full‐time equivalents (FTEs), staffing the service. The hospitalists provide in‐house patient care 24 hours a day and 7 days a week. Hospitalists also provide general medicine consult services, surgical comanagement and perioperative care, procedures, inpatient cardiopulmonary arrest response, rapid response team supervision, and observation care; and are also the primary inpatient physicians for many of the hospitalized interventional radiology and dermatology patients. These direct patient care activities account for 4500 annual discharges from the nonresident service.
Data Collection
Four university undergraduate business administration program students shadowed 11 hospitalists over a 3‐week period in 4‐hour to 12‐hour time blocks. The students followed the hospitalist on the shift that was taking admission calls, during day and night. A data collection tool was designed to track physicians' actions in 1‐minute increments, using categories similar to those used in a previously published time‐motion study of hospitalists' activities (Table 1).6 Physicians' activities each minute were assigned to a single category that most represented their action during that time period. At our AMC, 6 hospitalists work during the day shifts, and 2 on the night shifts. Our hospitalists may have patients in any of the 14 general care units in the hospital, as our hospitalists' services are not geographically based. The day hospitalists' shifts are scheduled from 7 AM to 7 PM. Two of the 6 hospitalists rotate through a 3‐day cycle as the admitting physician. Their duties include triaging and admitting patients until 2 PM, providing the day‐to‐day care for their patients until 7 PM, and occasionally cross‐covering for the other day‐shift hospitalists that have left for the day. The 4 other day‐shift hospitalists, not on their rotation as the admitting physician, may sign out and leave as early as 4 PM if their work for the day is done. At 2 PM, a separate swing‐shift hospitalist takes over the role of triaging and admitting until 7 PM. During the day shift, consults and perioperative management of patients are provided by a separate hospitalist on the consult service. At 7 PM, 2 nocturnists arrive for their 7 PM to 7 AM shift. The nocturnists, in addition to cross‐covering service patients, admit a maximum of 6 patients each, or until midnightwhichever comes first.
| Category | Code | Description |
|---|---|---|
| Direct patient care | DPIH | Initial history |
| DPDI | Discharge instructions | |
| DPFM | Family meetings | |
| DPRV | Revisit | |
| DPCC | Cross‐cover | |
| Indirect patient care | ||
| Documentation | IDGD | General documentation |
| IDDN | Daily notes | |
| IDDD | Discharge navigator | |
| Records/Results | IPMR | Review medical records |
| Communication | ICHH | Patient handoffs |
| ICFF | Face‐to‐face | |
| ICIP | Incoming page | |
| ICOP | Outgoing page | |
| ICIC | Incoming call | |
| ICOC | Outgoing call | |
| ICEE | E‐mail communications | |
| ICDP | Discharge planner | |
| Orders | IOWO | Writing orders |
| Professional development | PDRR | Reading articles, textbooks, references |
| Education | EEWR | Teaching during work rounds |
| Travel | TTTT | Travel |
| Personal | PPPP | Personal |
| Down time | DDDD | Downtime |
The students observed 11 different hospitalists, and followed these physicians during 9 weekday shifts, 5 weekday swing shifts, 10 weekday night shifts, and 4 weekend night shifts. The variance in the number of each type of shifts monitored was likely due to scheduling limitations of the students. In total, they collected data on 8,915 minutes of hospitalists' activities. The students monitored the hospitalists representing time periods from 7 AM to 2 AM. Analysis from 2 AM to 7 AM was excluded, because after 2 AM the hospitalists did not routinely evaluate new patients with the exception of emergent requests. New admissions after midnight are handled by a night float service staffed by residents.
Results
Overall, time spent on patient care activities comprised the bulk of hospitalists' shifts (82%) (Figure 1). Patient care activities were further categorized as direct patient caredefined as face‐to‐face patient or family time; and indirect patient caredefined as activities related to patient care, but without patient or family contact. Direct and indirect patient care accounted for 15% and 67% of the hospitalists' time, respectively. The other 18% of the hospitalists' time spent in the hospital were broadly categorized into: professional development, education, personal, downtime, and travel. Professional development included activities such as looking up information (eg, literature search); education included times that hospitalists spent with residents or medical students; personal time included only restroom and food breaks; and travel included time spent moving from 1 area to the next during their shift.
The majority of the hospitalists' direct patient care time was spent on evaluating new patients (79%). Significantly smaller amounts of time were spent on other direct care activities: cross‐covering other patients (8%), follow‐up visits (7%), family meetings (4%), and discharge instructions (2%) (Figure 2).
Indirect patient care activities included, 41% of time used to communicate with other healthcare providers, 26% on medical documentation, 20% reviewing medical records and results, and 13% of time writing orders (Figure 3). Communication accounted for a large proportion of a hospitalists' work, and included telephone conversations with Emergency Department (ED) or other admitting providers, handoffs, paging, face‐to‐face conversations with consultants and other support staff, and e‐mail.
Figure 4 shows the hourly distribution of time spent on direct and indirect patient care by a hospitalist throughout the day. The day‐time hospitalists pick up their signout from the nocturnists at 7 AM to begin their shift. The swing hospitalists arrive at 2 PM during the weekdays, and their primary duty is to triage and admit patients until 7 PM. The nocturnists start their shift at 7 PM, at which time the daytime and swing‐shift hospitalists all sign out for the night.
Discussion
Hospitalists on the nonresident service at our AMC utilize about 15% of their time on face‐to‐face patient care activities, 67% on indirect patient care activities, and 7% of time on moving from 1 part of the hospital to another. Hospitalists are valuable members of the physician work force who address the increasing patient care demands in the face of increasing limitations on residency work‐hours, a growing aging population, and existing inefficiencies in AMCs. The only other work‐flow study of hospitalists of which we are aware provided a single institution's perspective on time utilization by hospitalists. Our study in a different AMC setting revealed strong consistency with the O'Leary et al.6 study in the fraction of time hospitalists spent on direct patient care (15% and 18%, respectively), indirect patient care (67% and 69%); and within indirect patient care the time spent on documentation (26% and 37% of total time) and communications (41% and 35%). While travel in the O'Leary et al.6 study took up only 3% of hospitalists' time, the conclusions in that paper clearly suggest that the authors consider it an area of concern. Our study found that travel accounted for over 7% of hospitalists' time, confirming that intuition. The significant travel time may in part reflect the effects of a non‐geographically‐located hospitalist service. From these 2 studies we can be more confident that in large, tertiary care AMCs the time hospitalists spend on indirect patient care dominates that for direct patient care (by a factor of 4 in these studies), that within indirect patient care documentation and communication are dominant activities, and that travel can take a significant amount of time when patients are dispersed throughout the facility.
Both studies demonstrated that communication accounted for a significant proportion of a hospitalist's time. In our study communication accounted for 28% of their total time in the hospital, and 41% of the indirect patient care portion (Figure 3). A closer look within our communication category revealed that phone calls and handoffs accounted for two‐thirds of all communication time observed. As the hospitalists who carry the admitting pager, they receive the pages to take admission calls, but also take calls from consultants who have recommendations, as well as from nursing and other hospital staff. Depending on the nature of the conversation, the phone calls can last several minutes. While ensuring the communication between health care providers is complete and thorough, there may be opportunities to develop novel approaches to the way hospitalists communicate with other care providers. For example, at the UMHS, alternative communication methods with nursing staff have been proposed such as utilizing a website or a handheld device to help hospitalists prioritize their communications back to the nursing staff7; while standardizing the intake information from the ED or other admitting providers may help reduce the total time spent on phone calls. We will need to further explore the potential benefits of these ideas in future work.
Our data also reveal an interesting cyclicality of daily activities for the hospitalists, as shown in Figure 4. We identified batching behaviors throughout the day, which cause delays in seeing patients and can be deleterious to smooth workflows in support services. Spikes in indirect patient care, followed closely by spikes in direct patient care, occur regularly at shift changes (7 AM, 2 PM, and 7 PM). Also, in the night shift, indirect patient care drops to its lowest levels (in % of time spent) throughout the day, and direct patient care reaches its highest levels. The day‐shift indirect care profile is counter‐cyclical with direct care, as the hospitalist shifts between direct care and indirect care depending on the time of the day. We discuss these phenomena in turn.
It is known that variability in any operation causes congestion and delay, as an unavoidable consequence of the physics of material and information flows.8 Indeed, an entire subindustry based on Lean manufacturing principles has evolved from the Toyota Production System based on the elimination of unnecessary variability in operations.9 Lean processes have been ongoing in manufacturing facilities for decades, and these efforts are just recently being embraced by the service sector in general, and health care specifically.10, 11 Batching is an extreme form of variability, where there is a lull in the amount of work being done and then a burst of work is done over a short period of time. This means that jobs pile up in the queue waiting for the next spike of activity. Our data indicate batching seems to be a common phenomenon for our hospitalists. The majority of the patients admitted to our hospitalist service are unscheduled admissions that arrive primarily through the ED. One potential result of the unscheduled admissions is that patients could be referred to our hospitalist service at a pace that is not well predictable on an hour‐to‐hour basis. This could lead to an unintended result of multiple patients admitted over a short period of time. This means that many patients wait for intake, delaying the onset of their care by the inpatient physician. Also, since an initial exam often results in orders for laboratory tests and studies, batching on the floor will translate into batching of orders going to nursing, pathology, radiology, and other hospital support services. This imposes the cost of variability on these other services in the hospital. From a systems perspective, efficiency will improve if these activities can be smoothed throughout the day. This may suggest opportunities to work with the ED, to help smooth the inflow of patients into the hospital system.
Within the hospital, all of the day‐shift hospitalists can be reached about the needs of their respective patients, however, the physician carrying the admission pager also fields calls for admissions, and acts as the default contact person for the hospitalist group. As this hospitalist receives information on new admissions, he/she is aware of patients ready for intake but cannot evaluate them at the rate they are being referred, so the queue builds. This continues into the swing shift, which also fields referrals faster than they can attend to them. The volatility in indirect care during the swing shift, 2 PM to 7 PM, reflects a significant amount of triaging and fielding general calls about hospitalist patients. These activities further reduce the swing shift's ability to clear the intake queue. The night shift finally gets to these patients and, eventually, clears the queue. There may be an opportunity to consider the use of multiple input pagers or other process changes that can smooth this flow and rationalize the recurring tasks of finding patients and the responsible physician.
Another concept in Lean thinking is that variability is costly when it represents a mismatch between demand for a service and the capacity to serve. With regards to admitted patients, when demand outpaces capacity, patients will wait. When capacity outpaces demand, there is excess capacity in the system. The ideal is to match demand and capacity at all times, so nobody waits and the system carries no costly excess capacity. As the intake providers for admitted patients, we can attack this problem from the capacity side. Here, 2 generic Lean tactics are to: (1) reallocate resources to a bottleneck that is holding up the entire system, and (2) relieve workers of time‐consuming but non‐value‐adding work so they have more capacity to devote to serving demand. In our study, carrying multiple input pagers is an example of tactic (1), and efficient communication technologies and practices that reduce indirect time is an example of (2). Systemwide improvements would require further investigation by working with the variability on the input side (eg, ED admissions).
Our study also found that a significant percent of the time observed was spent traveling (7.4%) from room to room between different floors in the hospital. Travel time, which is non‐value‐adding, is one of the major forms of waste Lean thinking.12 Our hospitalists can provide care to patients at any of the general medical‐surgical beds we have available at our health system. These beds are distributed across 14 units on 5 different floors, as well as in the ED if a bed is not available for an admitted patient. In hospitals routinely operating at high occupancy, such as our AMC, patients often get distributed throughout the facility for lack of beds on the appropriate service's ward. One cost for this is a potential mismatch between a patient's needs and floor nurses' training. Our study reveals another cost, and that is its contribution to the significant amount of time hospitalists spent on travel, which is largely driven by the need to see dispersed patients. Reducing this cost requires a systemic, rather than service‐specific, solution. Our AMC is adding observation‐status beds to relieve some of the pressure on licensed beds, and considering bed management (including parts of the admissions and discharge processes) changes designed to promote better collocation of patients with services. Further study on these and other collocation tactics is warranted.
The spike in indirect activities at 4 PM represents, in part, an early signout by 1 or more of the hospitalists who are not scheduled to hold the admission pager, and have completed their work for the day. This handoff will be replicated at 7 PM when the nocturnists arrive for their night shift. In addition to a significant indirect load on physicians, multiple handoffs have been associated with decreased quality of care.13 Again, it is worthwhile considering the feasibility of alternative shift schedules that can minimize handoffs.
Finally, our findings revealed that a low percentage of time was dedicated to providing discharge instructions (2.24% of direct patient care time, and 0.34% of total time). Because the task of discharging patients falls primarily on the day‐shift hospitalists, when combined with swing‐shift and night‐shift hospitalists' data, the low percentage measured on discharge instructions may have been diluted. Nonetheless, this may point to the need for further investigation on how hospitalists provide direct patient encounter time during this critical phase of transition out of the hospital.
Our study is not without limitations. The student observers shadowed a representative group of hospitalists, but they were not able to follow everyone in the group. More specifically, their observations were made on the hospitalist who was carrying the primary hospitalist service admitting pager. Although it was the intent of our study to focus on the hospitalists we felt would be the busiest, our results may not be generalizable to all hospitalists. Although our research supports the previous findings by O'Leary et al.,6 a second limitation to our study is that our analysis was done at a single hospitalist group in an AMC, and hence the results may not be generalizable to other hospitalist groups. Another limitation may be that we did not do an evaluation of the hours between 2 AM to 7 AM. This period of time is used to catch up on medical documentation and to be available for medical emergencies. As more hospitalist programs are employing the use of nocturnists, it may be informative to have this time period tracked for activities.
Conclusions
Our study supports the broad allocation of hospitalist time found in an earlier study at a different AMC,6 suggesting that these might be generally representative in other AMCs. We found that travel constitutes a significant claim in hospitalists' time, due in part to the inability to collocate hospitalist service patients. Remedies are not likely to be service‐specific, but will require systemwide analyses of admission and discharge processes. Communication takes a significant amount of hospitalist time, with pages and phone calls related to handoffs accounting for most of the total communication time. As hospitalists working at non‐AMC settings may experience different work flow issues, we would like to see time‐motion studies of hospitalists in other types of hospitals. Future studies should also seek to better understand the how hospitals at high occupancy may reduce batching and streamline both the discharge and admission process, determine the factors that account for the significant communication time and how these processes could be streamlined, and evaluate the potential benefits of geographical localization of hospitalists' patients.
Acknowledgements
The authors thank Tracey Jackson, Michael Paulsen, Deepak Srinivasin, and Ryan Werblow, who were students in the undergraduate business school program, for their invaluable contribution in shadowing hospitalists to collect the time study data.
- , , , .Where should hospitalists sit within the academic medical center?J Gen Intern Med.2008;23:1269–1272.
- , .Hospitalists in teaching hospitals: opportunities but not without danger.J Gen Intern Med.2004;19:392–393.
- , , , , .Non‐housestaff medicine services in academic centers: models and challenges.J Hosp Med.2008;3:247–255.
- Society of Hospital Medicine. Society of Hospital Medicine Releases Results of the 2007–2008 Survey on the State of the Hospital Medicine Movement.2008. Available at: http://www.hospitalmedicine.org/AM/Template.cfm? Section=Press_Releases3:398–402.
- , , .How hospitalists spend their time: insights on efficiency and safety.J Hosp Med.2006;1:88–93.
- , .MCOMM: Redefining Medical Communication in the 21st Century, University of Michigan Health System. In: Society of Hospital Medicine Annual Meeting, Best of Innovations Presentation; 2009; Chicago, IL;2009.
- , .Factory Physics: Foundations of Manufacturing Management.Boston:Irwin, McGraw‐Hill;1996.
- .The Toyota Way.1st ed.Madison, WI:McGraw‐Hill;2004.
- Going Lean in Health Care.White Paper.Boston, MA:Institute for Healthcare Improvement;2005 January and February, 2005. Available at: http://www.ihconline.org/toolkits/LeanInHealthcare/GoingLeaninHealth CareWhitePaper.pdf. Accessed September 2009.
- , , , .Lean health care: what can hospitals learn from a world‐class automaker?J Hosp Med.2006;1:191–199.
- , , , , .Managing Business Process Flows.Upper Saddle River, NJ:Prentice Hall;2006.
- , .The patient handoff: medicine's Formula One moment.Chest.2008;134:9–12.
Copyright © 2010 Society of Hospital Medicine

Pediatric OUs in the United States
The first observation units were implemented more than 40 years ago with the goal of reducing the number and duration of inpatient stays. Since then, observation units (OUs) have evolved as a safe alternative to hospitalization14 for the delivery of finite periods of care, typically less than 24 hours.58 Observation services allow for time to determine the need for hospitalization in cases that are unclear after their initial evaluation and treatment.9 Observation status is an administrative classification related to reimbursement that can be applied to patients whose diagnosis, treatment, stabilization, and discharge can reasonably be expected within 24 hours.10, 11 The site of care for observation is dependent in part upon existing facility structures; some institutions utilize virtual OUs within the emergency department (ED) or hospital ward, while others have dedicated, geographically distinct OUs, which may function as an extension of either the ED or inpatient settings.9
OUs have been instrumental in providing care to adult patients with chest pain, asthma, and acute infections.1218 Recently, there has been an increase in the number of publications from pediatric OUs in the United States and abroad. Observation may be a preferred model of care for select pediatric patients, as hospitalized children often experience brief stays.1921 Previous reviews on this model of care have combined adult and pediatric literature and have included research from countries with healthcare structures that differ considerably from the United States.2224 To date, no systematic review has summarized the pediatric OU literature with a focus on the US healthcare system.
As payers and hospitals seek cost‐effective alternatives to traditional inpatient care, geographically distinct OUs may become integral to the future of healthcare delivery for children. This systematic review provides a descriptive overview of the structure and function of pediatric OUs in the United States. We also scrutinize the outcome measures presented in the included publications and propose future directions for research to improve both observation unit care, as well as the care delivered to patients under observation status within general inpatient or ED settings.
Methods
Literature Search
With the assistance of a health services librarian, a search of the following electronic databases from January 1, 1950 through February 5, 2009 was conducted: Medline, Web of Science, Cumulative Index to Nursing and Allied Health Literature (CINAHL), Health Care Advisory Board (HCAB), Lexis‐Nexis, National Guideline Clearinghouse, and Cochrane Reviews. Key words used for the Boolean search are included in Appendix A. In addition, we conducted a manual search of reference lists from reviews, guidelines, and articles meeting inclusion criteria.
We included English language peer‐reviewed publications that reported on pediatric OU care in the United States. Studies were included if they reported outcomes including lengths of stay, admission from observation rates, return visit rates, costs or charges. Descriptive publications of pediatric OU structure and function were also included. Studies were excluded if they were conducted outside the United States, evaluated psychiatric or intensive care, reported on observation status in an ED without an OU or observation status on a traditional inpatient ward. Two reviewers (M.M. and C.K.) identified articles for inclusion. Any disagreements between the reviewers were resolved by discussion and consensus agreement. Interrater reliability was assessed using the kappa statistic.
Quality Assessment
The quality of each study was rated using the Oxford Centre for Evidence‐based Medicine levels of evidence.25 With this system, levels of evidence range from 1a (homogeneous systematic review of randomized, controlled trials) to 5 (expert opinion without explicit critical appraisal).
Data Synthesis
Data on study design, OU characteristics, patient populations, and outcomes were extracted using a standardized form. Heterogeneity of study design, interventions, and outcomes precluded the ability to conduct meta‐analyses.
Results
A systematic search of the electronic databases identified 222 unique citations (Figure 1). A total of 107 abstracts were evaluated. We identified 48 articles for full‐text review, of which 18 met inclusion criteria. Hand search of references yielded 24 additional articles, of which 3 met inclusion criteria. Interrater agreement for selected articles was high at 98% (kappa = 0.85).
Observation Unit Characteristics
The majority of research on OUs has been conducted at large academic pediatric centers. One publication was from a community hospital.26 These studies present data on more than 22,000 children cared for in OUs of 11 hospitals over a 32‐year time span. Most studies were level 2 evidence: 2b, retrospective cohort studies and low‐quality randomized, controlled trials; or 2c, outcomes research. Three were descriptive and not assigned a formal evidence level.2729
Table 1 highlights general features of U.S. pediatric OUs. Five institutions renovated or expanded clinical space in order to open the OU.27, 2932 Units ranged in size from 3 to 23 beds. The OU was located in or near the ED in all but 2 hospitals, which had ward‐based units. The ED was the primary entry point into the OU with only 2 open model units accepting patients from other settings.5, 32 The annual number of observation cases ranged from 1000 to 3000 in children's hospitals. Approximately 500 ward‐based observation cases per year were cared for in the single community hospital studied. Three reports included time trends showing increased OU utilization over study years.5, 30, 31
| Publication (Year); Condition | Study Design; Level of Evidence; Time Frame; Sample Size | Hospital; Observation Setting; Year Opened | Site | Beds | Entry Point | Staffing; Physicians; Nurses |
|---|---|---|---|---|---|---|
| ||||||
| Gururaj et al.43 (1972); all conditions | Retrospective cohort; 2c; 1 year; 437 cases under observation | King's County Downstate Brooklyn; short‐stay unit | ED | 3 | Not reported | Pediatric residents; general pediatricians |
| Ellerstein and Sullivan,32 (1980); all conditions | Retrospective cohort; 2c; 6 years; 5858 cases of unscheduled care plus 1403 elective surgery cases | Children's Hospital Buffalo; observation unit; 1972 | ED | 8 | ED, clinic, procedure/OR | Primary care pediatricians; other specialists; pediatric residents |
| O'Brien et al.37 (1980); asthma | Retrospective cohort; 2c; 1 month; 434 cases of asthma, 328 discharged directly from ED, 106 treated in holding unit | Children's National DC; holding unit | ED | 6 | ED | 1‐2 pediatric residents; 1‐2 nurses |
| Willert et al.35 (1985); asthma | Randomized*; 2b; 578 cases of asthma; 166 cases 1.5 hours postaminophylline, 103 randomized, 52 to holding unit | Children's Memorial Chicago; holding room | ED | 5 | ED | General pediatricians; pediatric residents; PEM nurses |
| Listernick et al.38 (1986); dehydration | Randomized; 2b; 29 cases of dehydration; 22 to holding unit | Children's Memorial Chicago | ||||
| Balik et al.31 (1988); all conditions | Descriptive; none given | Minneapolis Children's; short‐stay unit observation area; 1985 | Day surgery area adjacent to ED | Not reported | Not reported | General pediatricians; pediatric nurses (shared with ED) |
| Marks et al.7 (1997); all conditions | Retrospective cohort; 2c; 5 months; 968 cases in short‐stay unit | Children's Hospital Boston; short‐stay unit; 1994 | Ward | 4‐18 | ED | Primary care pediatricians; PEM physicians; pediatric residents; pediatric nurses; 1:6 nurse:patient ratio |
| Marks et al.7 (1997); asthma | Pre‐post; 2b; 400 cases of asthma; 102 pre/298 post short‐stay unit | Children's Hospital Boston | ||||
| Wiley et al.6 (1998); all conditions | Retrospective cohort; 2c; 1 year; 805 cases of unscheduled observation; plus 595 scheduled cases | Connecticut Children's; outpatient extended treatment site | ED | 10 | Not reported | PEM physicians; other specialists; 1:5 nurse:patient ratio |
| Scribano et al.65 (2001); all conditions | Retrospective cohort; 2b; 2 years; 1798 cases under observation | Connecticut Children's | ||||
| Leduc et al.30 (2002); all conditions | Retrospective cohort; 2c; 6 months; 686 cases under observation (4.8% of ED visits) | Children's Hospital Denver; OU | ED | 6 | Not reported | Not reported |
| Bajaj and Roback,30 (2003); intussusception | Retrospective cohort; 2b; 4.5 years; 78 cases of intussusception (51 under observation) | Children's Hospital Denver | ||||
| Wathen et al.36 (2004); dehydration | Convenience sample; 2c; 10 months; 182 cases of dehydration (48 under observation) | Children's Hospital Denver | ||||
| Crocetti et al.26 (2004); all conditions | Retrospective cohort; 2b; 2 years; 956 cases under observation | John Hopkin's Bayview; observation status beds; 1997 | Ward | Not reported | 99% ED 1% other location | General pediatricians covering ED and ward |
| Silvestri et al.29 (2005); all conditions | Descriptive; none given | Children's Hospital of Philadelphia; OU; 1999 | ED | 12 | ED | PEM physicians; PEM fellows; urgent care pediatricians; ED nurse practitioner; inpatient nurses |
| Alpern et al.34 (2008); all conditions | Prospective cohort; 1b; 30 months; 4453 cases under observation | Children's Hospital of Philadelphia | ||||
| Thomas27 (2000); all conditions | Descriptive; none given | Primary Children's Medical Center; RTU; 1999 | ED | 22‐26 | ED, clinic, procedure/OR | PEM physicians; general pediatricians; other specialists; no residents |
| Zebrack et al.25 (2005); all conditions | Retrospective cohort; 2b; 2 years; 4189 cases of unscheduled observation plus 2288 scheduled cases | Primary Children's Medical Center | PEM nurses; 1:4 nurse:patient ratio | |||
| Miescier et al.40 (2005); asthma | Retrospective cohort; 2b; 2 years; 3029 asthma visits; 384 admitted, 301 observed, 161cases met inclusion | Primary Children's Medical Center | ||||
| Holsti et al.41 (2005); head injury | Retrospective cohort; 2b; 2 years; 827 CHI visits, 273 admitted, 285 observed, 284 cases met inclusion | Primary Children's Medical Center | ||||
| Greenberg et al.42 (2006); croup | Retrospective pre‐post; 2b; 1 year each; 694 croup cases pre‐RTU, 66 admitted; 789 croup cases post‐RTU, 33 admitted; 76 observed | Primary Children's Medical Center | ||||
| Mallory et al.33 (2006); dehydration | Retrospective cohort; 2b; 1 year; 430 dehydration cases under observation | Primary Children's Medical Center | ||||
Staffing and Workflow
Staffing models varied and have undergone transitions over time. Prior to 1997, general pediatricians primarily provided physician services. In more recent years, OUs have utilized pediatric emergency medicine (PEM) providers. Three of the 11 units allowed for direct patient care by subspecialists.5, 6, 32 One OU was staffed by nurse practitioners.29 OU nursing backgrounds included pediatrics, emergency medicine, or PEM.
Five institutions assembled multidisciplinary teams to define the unit's role and establish policies and procedures.7, 27, 2931 Workflow in the OU focused on optimizing efficiency through standardized orders, condition‐specific treatment protocols, and bedside charting.7, 26, 33 Several units emphasized the importance of ongoing evaluations by attending physicians who could immediately respond to patient needs. Rounds occurred as often as every 4 hours.5, 7 Two centers utilized combined physician‐nursing rounds to enhance provider communication.7, 34 No publications reported on patient transitions between sites of care or at shift changes.
Criteria for Observation
All 11 hospitals have developed protocols to guide OU admissions (Table 2). Nine publications from 4 OUs commented on treatments delivered prior to observation.33, 3542 The most commonly cited criteria for admission was approval by the unit's supervising physician. Utilization review was not mentioned as an element in the OU admission decision. Common OU exclusions were the need for intensive care or monitoring while awaiting an inpatient bed; however, these were not universal. Eight centers placed bounds around the duration of OU stays, with minimum stays of 2 hours and maximum stays of 8 to 24 hours.
| Hospital | Entry Criteria | Age Range | Time | Exclusion Criteria |
|---|---|---|---|---|
| ||||
| King's County, Downstate Brooklyn | Otherwise required inpatient admission | 0‐13 years | Maximum 24 hours | Not reported |
| Acute problem of uncertain severity | ||||
| Acute problem not readily diagnosed | ||||
| Short course periodic treatment | ||||
| Diagnostic procedures impractical as outpatient | ||||
| Children's Hospital, Buffalo | Admission from any source | 0‐21 years | Maximum 24 hours | Intensive care needs |
| Short stay elective surgery | Routine diagnostic tests | |||
| Estimated length of stay <24 hours | Holding prior to admission | |||
| Children's National, Washington, DC | Inadequate response to 3 subcutaneous epinephrine injections | 8 months to 19 years | Not reported | Not reported |
| Children's Memorial, Chicago | Asthma: | |||
| Available parentAsthma score 5Inadequate response to ED treatment | >1 year | Maximum 24 hours | Past history of BPD, CF, CHD, other debilitating disease | |
| Dehydration: | ||||
| Cases receiving oral hydration | 3‐24 months | 12 hours for oral | Intensive care need | |
| Parent preference if given IV hydration | 8 to 12 hours for IV | Hypernatremia | ||
| Minneapolis Children's | Conditions listed in Table 3 | Not reported | Maximum 10 hours | Not reported |
| Children's Hospital, Boston | Straightforward diagnoses as determined by ED staff | Not reported | Not reported | Other complex medical issues |
| Bed availability | ||||
| Connecticut Children's | PEM attending discretionLimited severity of illnessUsually confined to a single organ systemClearly identified plan of care | Not reported | After 3‐4 hours in ED Low likelihood of requiring extended care >23 hours | Asthma: no supplemental O2 need, nebulized treatments >Q2 hourCroup: no supplemental O2 need, <2 racemic epinephrine treatmentsDehydration: inability to tolerate orals, bicarbonate >10, 40 mL/kg IVFSeizure: partial or generalized, postictal, unable to tolerate oralsPoisoning: mild or no symptoms, poison control recommendation |
| Children's Hospital, Denver | Intussusception: following reduction | 0‐18 years | After 3‐4 hours in ED | Not reported |
| Dehydration: based on clinical status | ||||
| Johns Hopkins, Bayview | Consultation with on‐duty pediatrician | 0‐18 years | Minimum of 2 hours | Patients requiring subspecialty or intensive care services |
| High likelihood of discharge at 24 hours | ||||
| Children's Hospital of Philadelphia | Sole discretion of the ED attending | Not reported | Minimum 4 hours | No direct admissions |
| Single focused acute condition | Maximum 23 hours | Diagnostic dilemmas | ||
| Clinical conditions appropriate for observation | Underlying complex medical problems | |||
| Primary Children's Medical Center | Observation unit attending discretion | 0‐21 years | Minimum 3 hours | Admission holds |
| Scheduled procedures as space available | Maximum 24 hours | Intensive care needs | ||
| ED admit after consult with OU doctor | Complicated, multisystem disease | |||
| Clear patient care goals | Need for multiple specialty consults | |||
| Limited severity of illness | Psychiatric patients | |||
| Diagnostic evaluation | ||||
Ages of Children Under Observation
Seven of 11 hospitals reported the age range of patients accepted in their OU (Table 2). All but 1 unit accepted children from infants to young adults, 18 to 21 years of age.43 In the 6 units that reported the age distribution of their OU population, roughly 20% were <1 year, more than 50% were <5 years, and fewer than 30% fell into an adolescent age range.5, 6, 26, 32, 34, 43
Conditions Under Observation
Many conditions under observation were common across time and location (Table 3). The list of conditions cared for in OUs has expanded in recent years. Medical conditions predominated over surgical. While the majority of observation cases required acute care, nearly one‐half of the units accepted children with scheduled care needs (eg, routine postoperative care, procedures requiring sedation, infusions, and extended evaluations such as electroencephalograms or pH probes). These scheduled cases, cared for within the OU structure, provided more steady demand for OU services.
| King's County, Downstate Brooklyn | Children's Hospital, Buffalo | Minneapolis Children's | Children's Hospital, Boston | Connecticut Children's | Children's Hospital, Denver | Johns Hopkins, Bayview | Children's Hospital of Philadelphia | Primary Children's Medical Center, Salt Lake City | |
|---|---|---|---|---|---|---|---|---|---|
| |||||||||
| Respiratory | |||||||||
| Asthma | |||||||||
| Pneumonia | |||||||||
| Bronchiolitis | |||||||||
| Croup | |||||||||
| Allergic reaction | |||||||||
| Cardiology | |||||||||
| Gastrointestinal | |||||||||
| Vomiting | |||||||||
| Gastro/dehydration | |||||||||
| Abdominal pain | |||||||||
| Constipation | |||||||||
| Diabetes | |||||||||
| Neurologic | |||||||||
| Seizure | |||||||||
| Head injury | |||||||||
| Infection | |||||||||
| Sepsis evaluation | |||||||||
| UTI/pyelonephritis | |||||||||
| Cellulitis | |||||||||
| Fever | |||||||||
| Pharyngitis | |||||||||
| Otitis media | |||||||||
| Adenitis | |||||||||
| Ingestion/poisoning | |||||||||
| Hematologic | |||||||||
| Sickle cell disease | |||||||||
| Transfusion/emnfusion | |||||||||
| Psychological/social | |||||||||
| Dental | |||||||||
| Surgical conditions | |||||||||
| Foreign body | |||||||||
| Trauma | |||||||||
| Burn | |||||||||
| Orthopaedic injury | |||||||||
| Postoperative complication | |||||||||
| Scheduled care | |||||||||
| Diagnostic workup | |||||||||
| Procedures/sedation | |||||||||
| Elective surgery | |||||||||
Reimbursement
One publication highlighted the special billing rules that must be considered for observation care.27 In 3 studies, payers recognized cost‐savings associated with the OU's ability to provide outpatient management for cases that would traditionally require inpatient care.31, 35, 38
Observation Unit Outcomes
Outcomes reported for pediatric OU stays fall into 4 major categories: length of stay (LOS), admission rates, return visit rates, and costs. Despite these seemingly straightforward groupings, there was significant heterogeneity in reporting these outcomes.
Length of Stay
The start time for OU length of stay (LOS) is not clearly defined in the articles included in this review. While the start of an observation period is assumed to begin at the time the order for observation is placed, it is possible that the LOS reported in these publications began at the time of ED arrival or the time the patient was physically transferred to the OU. The average LOS for individual OUs ranged from 10 to 15 hours.5, 6, 26, 30, 35, 38, 40, 41, 43 One ward‐based and 1 ED‐based unit reported LOS extending beyond 24 hours,7, 30 with averages of 35 and 9 hours, respectively. Two units limited the duration of care to <10 hours.31, 38
For studies that included a comparison group, OU stays were consistently shorter than a traditional inpatient stay by 6 to 110 hours.7, 36, 38, 39, 42 No significant differences in clinical parameters between groups were reported. There was appreciable variation in the average LOS across institutions for similar conditions, 12 to 35 hours for asthma,5, 7, 34, 35 and 9 to 18 hours for dehydration.5, 34, 36, 38
Admission Rates
Rates of hospital admission after observation from the 9 OUs reporting this outcome are presented in Table 4. Three publications from a single institution counted hospital admission in the 48 to 72 hours following discharge from the OU as though the patient were admitted to the hospital directly from the index OU stay.33, 40, 41 Conditions with the lowest admission rates, <10%, included croup, neurologic conditions, ingestions, trauma, and orthopedic injuries. The highest admission rates, >50%, were for respiratory conditions including asthma, pneumonia, and bronchiolitis.
| King's County, Downstate Brooklyn (%) | Children's Hospital, Buffalo (%) | Connecticut Children's (%) | Johns Hopkins, Bayview (%) | Children's Hospital of Philadelphia (%) | Primary Children's Medical Center, Salt Lake City (%) | |
|---|---|---|---|---|---|---|
| ||||||
| Unscheduled care | 42 | 17 | 11 | 25 | 25 | 15 |
| Respiratory | 32 | |||||
| Asthma | 57 | 16 | 26 | 22 | 22‐25* | |
| Pneumonia | 50 | 23 | 30‐48 | |||
| Bronchiolitis | 46 | 32 | 43 | |||
| Croup | 9 | 17 | 9 | 4‐6 | ||
| Allergic reaction | 3 | |||||
| Cardiology | 22 | |||||
| Gastrointestinal | 43 | 19 | ||||
| Vomiting | 5 | 22 | ||||
| Gastro/dehydration | 23 | 15/21 | 16* | |||
| Abdominal pain | 9 | 17 | 27 | |||
| Constipation | 9 | |||||
| Diabetes | 17 | |||||
| Neurologic | 10 | |||||
| Seizure | 19 | 8 | 17 | 18 | ||
| Head injury | 7 | 5* | ||||
| Infection | 19 | 34 | ||||
| Sepsis evaluation | 25 | 22 | ||||
| UTI/pyelonephritis | 25 | 16 | ||||
| Cellulitis | 15 | |||||
| Fever | 16 | 26 | ||||
| Pharyngitis | 13 | |||||
| Otitis media | 21 | |||||
| Ingestion/poisoning | 9 | 4 | 4 | 9 | 10 | 5 |
| Hematologic | 23 | |||||
| Transfusion/emnfusion | 2 | |||||
| Psychological/social | 21 | 80 | 17 | |||
| Dental | 14 | |||||
| Surgical conditions | ||||||
| Foreign body | ||||||
| Trauma | 13 | 2 | 53 | 5 | ||
| Burn | 13 | |||||
| Orthopedic injury | 22 | 3 | ||||
| Postoperative complication | 26 | 16 | ||||
| Scheduled care | ||||||
| Diagnostic workup | 0‐5 | |||||
| Procedures/sedation | 0.1‐9.0 | |||||
| Elective surgery | 13 | 0‐5 | ||||
Return Visit Rates
Unscheduled return visit rates were reported in 9 publications from 6 institutions and ranged from 0.01% to 5%.7, 26, 33, 3537, 3941 Follow‐up timeframes ranged from 48 hours to 1 month. Return visits were inconsistently defined. In most studies, rates were measured in terms of ED visits.26, 33, 3537, 39, 41 One ward‐based unit counted only hospital readmissions toward return visit rates.7 Three publications, from ED‐based units, counted hospital readmissions in the 2 to 5 days following observation toward admission rates and not as return visits.33, 40, 41 In most studies, data on return visits were collected from patient logs or patient tracking systems. Three studies contacted patients by phone and counted return visits to the clinic.3537 No studies reported on adherence to scheduled visits following observation.
Costs
Seven studies reported financial benefits of OU care when compared with traditional hospital care.7, 30, 31, 35, 37, 38, 42 Two centers admitted patients to inpatient care if their observation period reached a set time limit, after which cost savings were no longer realized.31, 35 Cost savings associated with the OU treatment of asthma and dehydration were attributed to lower charges for an OU bed.35, 38 Decreased charges for the OU treatment of croup were related to shorter LOS.42
Discussion
In the 40 years since the first studies of pediatric OUs, several US health systems have extended observation services to children. This model of care may be expanding, as suggested by an increase in the number of publications in the past 10 years. However, the number of centers within the US reporting on their OU experience remains small. Our systematic review identified a recurrent theme related to OUsthe opportunity to improve operational processes of care compared with the traditional inpatient alternative. We have identified the need to standardize OU outcomes and propose measures for future OU research.
Observation Unit Operations
The OU care model expands outpatient management of acute conditions to include children who are neither ready for discharge nor clear candidates for inpatient admission. OUs have demonstrated the ability to care for patients across the pediatric age spectrum. Over the decades spanning these publications, advances in medical therapy such as antiemetics for gastroenteritis and early administration of systemic steroids for asthma may have resulted in lower admission rates or shorter time to recovery.44, 45 Despite these advances, there are marked consistencies in the conditions cared for within OUs over time. The data summarized here may help guide institutions as they consider specific pediatric conditions amenable to observation care.
The hospitals included in this review either added physical space or revised services within existing structures to establish their OU. Hospitals facing physical constraints may look to underutilized areas, such as recovery rooms, to provide observation care, as observation does not require the use of licensed inpatient beds. Several units have responded to daily fluctuations in unscheduled observation cases by also serving patients who require outpatient procedures, brief therapeutic interventions, and diagnostic testing. By caring for patients with these scheduled care needs during the day, there is a more steady flow of patients into the OU. While hospitals traditionally have used postanesthesia care units and treatment rooms for scheduled cases, OUs appear to benefit from the consistent resource allocation associated with a constant demand for services.
To date, the vast majority of pediatric OUs in the published literature have emerged as an extension of ED services. Now, with the expansion of pediatric hospitalist services and movement toward 24/7 inpatient physician coverage, there may be increased development of ward‐based OUs and the designation of inpatient observation status. While ward‐based OUs managed by pediatric hospitalists may be well established, we were not able to identify published reports on this structure of care. A national survey of health systems should be undertaken to gather information regarding the current state of pediatric observation services.
When creating policies and procedures for OUs, input should be sought from stakeholders including hospitalists, PEM providers, primary care providers, subspecialists, mid‐level providers, nurses, and ancillary staff. As patients requiring observation level of care do not neatly fit an outpatient or inpatient designation, they present an opportunity for hospitalist and PEM physician groups to collaborate.4648 Calling on the clinical experiences of inpatient and ED providers could offer unique perspectives leading to the development of innovative observation care models.
This review focused on institutions with dedicated observation services, which in all but 1 study26 consisted of a defined geographic unit. It is possible that the practices implemented in an OU could have hospital‐wide impact. For example, 1 study reported reduction in LOS for all asthma cases after opening a ward‐based unit.7 Further, pediatric hospitalist services have been associated with shorter LOS49 and increased use of observation status beds compared with traditional ward services.50 As pediatric hospitalists expand their scope of practice to include both observation and inpatient care, clinical practice may be enhanced across these care areas. It follows that the impact of observation protocols on care in the ward setting should be independently evaluated.
The costs associated with the establishment and daily operations of an OU were not addressed in the reviewed publications. Assertions that observation provides a cost‐effective alternative to inpatient care4, 7, 23, 42 should be balanced by the possibility that OUs extend care for patients who could otherwise be discharged directly home. Studies have not evaluated the cost of OU care compared with ED care alone. Research is also needed to assess variations in testing and treatment intensity in OUs compared with the ED and inpatient alternatives. Reimbursement for observation is dependent in part upon institutional contracts with payers. A full discussion of reimbursement issues around observation services is beyond the scope of this review.
Observation Unit Outcomes
Length of Stay
Although most studies reported LOS, direct comparisons across institutions are difficult given the lack of a consistently referenced start to the observation period. Without this, LOS could begin at the time of ED arrival, time of first treatment, or time of admission to the OU. Identifying and reporting the elements contributing to LOS for observation care is necessary. The time of OU admission is important for billing considerations; the time of first treatment is important to understanding the patient's response to medical interventions; the time of ED arrival is important to evaluating ED efficiency. Each of these LOS measures should be reported in future studies.
Direct comparisons of LOS are further complicated by variability in the maximum permissible duration of an OU stay, ranging from 8 to 24 hours in the included studies. Despite these limits, some OU care will extend beyond set limits due to structural bottlenecks. For example, once the inpatient setting reaches capacity, observation LOS for patients who require admission will be prolonged. The best evaluation of LOS would come from prospective study design utilizing either randomization or quality improvement methods.
Defining Success and Failure in Observation Care
In the reviewed literature, observation failures have been defined in terms of admission after observation and unscheduled return visit rates. Admission rates are heavily dependent on appropriate selection of cases for observation. Although some observation cases are expected to require inpatient admission, OUs should question the validity of their unit's acceptance guidelines if the rate of admission is >30%.51 High rates could be the result of inadequate treatment or the selection of children too sick to improve within 24 hours. Low rates could indicate overutilization of observation for children who could be discharged directly home. Full reporting on the number of children presenting with a given condition and the different disposition pathways for each is needed to evaluate the success of OUs. Condition‐specific benchmarks for admission after observation rates could guide hospitals in their continuous improvement processes.
Unscheduled return visits may reflect premature discharge from care, diagnostic errors, or development of a new illness. OU care may influence patient adherence to scheduled follow‐up care but this has not been evaluated to date. In future research, both scheduled and unscheduled return visits following ED visits, observation stays, and brief inpatient admissions for similar disease states should be reported for comparison. Standard methodology for identifying return visits should include medical record review, claims analyses, and direct patient contact.
As hospitals function at or near capacity,52, 53 it becomes important to delineate the appropriate length of time to monitor for response to treatments in a given setting. Limited capacity was a frequently cited reason for opening a pediatric OU; however, the impact of OUs on capacity has not yet been evaluated. Operations research methods could be used to model OU services' potential to expand hospital capacity. This research could be guided by evaluation of administrative data from across institutions to identify current best practices for pediatric OU and observation status care.
OU benchmarking in the United States has begun with a small number of adult units participating in the ED OU Benchmark Alliance (EDOBA).54 In Table 5, we propose dashboard measures for pediatric OU continuous quality improvement. The proposed measures emphasize the role of observation along the continuum of care for acute conditions, from the ED through the OU with or without an inpatient stay to clinic follow‐up. Depending on the structure of observation services, individual institutions may select to monitor different dashboard measures from the proposed list. Patient safety and quality of care measures for the conditions commonly receiving pediatric OU care should also be developed.
| ED |
OU |
Inpatient |
Clinic | |
|---|---|---|---|---|
| ||||
| Length of stay* | ED arrival to OU admission | OU admit to disposition | Inpatient admit to discharge | |
| ED arrival to discharge home from OU | ||||
| ED arrival to discharge from inpatient following OU care | ||||
| OU admission to discharge home from inpatient care | ||||
| Admission* | % ED census admitted inpatient | % OU census admitted | ||
| % ED census that is observed | ||||
| Unscheduled return visits* | To ED | Requiring OU admission | Requiring inpatient admission | |
| Scheduled follow‐up* | To ED | To primary care or subspecialist office | ||
| Capacity | ED crowding scales | Unable to accept transfers | ||
| ED left before evaluation rates | Inpatient occupancy | |||
| Ambulance diversion | ||||
| Satisfaction | Patient/Parent | |||
| ED providers | OU providers | Inpatient providers | Follow‐up providers | |
| Cost | ED care | OU care | Inpatient care | |
| Total encounter | ||||
Limitations
The most important limitations to this review are the heterogeneity in interventions and reporting of outcomes, which precluded our ability to combine data or conduct meta‐analyses. We attempted to organize the outcomes data into clear and consistent groupings. However, we could not compare the performance of 1 center with another due to differences in OU structure, function, and design.
In order to focus this systematic review, we chose to include only peer reviewed publications that describe pediatric OUs within the United States. This excludes expert guidelines, which may be of value to institutions developing observation services.
Our search found only a small number of centers that utilize OUs and have published their experience. Thus, our review is likely subject to publication bias. Along this line, we identified 9 additional publications where children were cared for alongside adults within a general OU.5563 This suggests an unmeasured group of children under observation in general EDs, where more than 90% of US children receive acute care.64 These articles were excluded because we were unable to distinguish pediatric specific outcomes from the larger study population.
Finally, retrospective study design is subject to information bias. Without a comparable control group, it is difficult to understand the effects of OUs. Patients directly admitted or discharged from the ED and patients who require admission after observation all differ from patients discharged from observation in ways that should be controlled for with a randomized study design.
Conclusions
OUs have emerged to provide treatment at the intersection of outpatient and inpatient care during a time of dramatic change in both emergency and hospital medicine. As hospitalists expand their scope of practice to include observation care, opportunities will arise to collaborate with ED physicians and share their growing expertise in quality and efficiency of hospital care delivery to improve observation services for children. OUs have been established with laudable goalsto reduce inpatient admissions, increase patient safety, improve efficiency, and control costs. The current evidence is not adequate to determine if this model of healthcare delivery achieves these goals for children. Through synthesis of existing data, we have identified a need for standard reporting for OU outcomes and propose consistent measures for future observation care research. Only through prospective evaluation of comparable outcomes can we appraise the performance of pediatric OUs across institutions.
- .Observation medicine.Acad Emerg Med.1994;1(2):152–154.
- ,.Principles of observation medicine.Emerg Med Clin North Am.2001;19(1):1–17.
- ,,, et al.Emergency department observation beds improve patient care: Society for Academic Emergency Medicine debate.Ann Emerg Med.1992;21(8):967–975.
- .Pediatric observation medicine.Emerg Med Clin North Am.2001;19(1):239–254.
- ,,.The pediatric hybrid observation unit: an analysis of 6477 consecutive patient encounters.Pediatrics.2005;115(5):e535–e542.
- ,,, et al.Observation units: the role of an outpatient extended treatment site in pediatric care.Pediatr Emerg Care.1998;14(6):444–447.
- ,,, et al.Impact of a short stay unit on asthma patients admitted to a tertiary pediatric hospital.Qual Manag Health Care.1997;6(1):14–22.
- ,,, et al.Management of observation units. American College of Emergency Physicians.Ann Emerg Med.1995;25(6):823–830.
- ,,, et al. The observation unit: an operational overview for the hospitalist. Society of Hospital Medicine White Paper 2009; Available at: http://www.hospitalmedicine.org/Content/NavigationMenu/Publications/WhitePapers/White_Papers.htm. Accessed July2009.
- Acute Criteria Pediatric InterQual Level of Care.San Francisco, CA:McKesson Corporation;2006.
- Observation Status Related to U.S. Hospital Records.Healthcare Cost and Utilization Project. HCUP Methods Series Report #2002‐3. Rockville, MD: Agency for Healthcare Research and Quality;2002.
- ,,, et al.Emergency department observation unit versus hospital inpatient care for a chronic asthmatic population: a randomized trial of health status outcome and cost.Med Care.1998;36(4):599–609.
- ,,, et al.Costs of an emergency department‐based accelerated diagnostic protocol vs hospitalization in patients with chest pain: a randomized controlled trial.JAMA.1997;278(20):1670–1676.
- .Management of patients with infectious diseases in an emergency department observation unit.Emerg Med Clin North Am.2001;19(1):187–207.
- ,,, et al.A comparison between emergency diagnostic and treatment unit and inpatient care in the management of acute asthma.Arch Intern Med.1997;157(18):2055–2062.
- .Chest pain observation units.Emerg Med J.2001;18(2):148.
- ,,, et al.Randomised controlled trial and economic evaluation of a chest pain observation unit compared with routine care.BMJ.2004;328(7434):254.
- ,,, et al.A cooperative care model: cardiologists and hospitalists reduce length of stay in a chest pain observation. In:5th Scientific Forum on Quality of Care and Outcomes Research in Cardiovascular Disease and Stroke, Washington, DC, May 15‐17, 2003.Philadelphia, PA:Lippincott Williams 2003. p.P186.
- ,.Observation unit management of pediatric emergencies.Emerg Med Clin North Am.1991;9(3):669–676.
- .A short stay or 23‐hour ward in a general and academic children's hospital: are they effective?Pediatr Emerg Care.2000;16(4):223–229.
- ,,, et al.Trends in high turnover stays among children hospitalized in the United States, 1993 through 2003.Pediatrics.2009;123:996–1002.
- .Hospital based alternatives to acute paediatric admission: a systematic review.Arch Dis Child.2005;90(2):138–142.
- ,,.Short‐stay units and observation medicine: a systematic review.Med J Aust.2003;178(11):559–563.
- ,,.Use of emergency observation and assessment wards: a systematic literature review.Emerg Med J.2003;20(2):138–142.
- Oxford Centre for Evidence‐Based Medicine. Levels of evidence and grades of recommendation (May 2001). Available at: http://www.cebm.net/levels_of_evidence.asp. Accessed July2009.
- ,,, et al.Pediatric observation status beds on an inpatient unit: an integrated care model.Pediatr Emerg Care.2004;20(1):17–21.
- .Pediatric update. Our new rapid treatment unit: an innovative adaptation of the “less than 24‐hour stay” holding unit.J Emerg Nurs.2000;26(5):507.
- ,,.Use of an observation unit by a pediatric emergency department for common pediatric illnesses.Pediatr Emerg Care.2001;17(5):321–323.
- ,,, et al.Observation medicine: the expanded role of the nurse practitioner in a pediatric emergency department extended care unit.Pediatr Emerg Care.2005;21(3):199–202.
- ,,.An observation unit in a pediatric emergency department: one children's hospital's experience.J Emerg Nurs.2002;28(5):407–413.
- ,,.When the patient requires observation not hospitalization.J Nurs Admin.1988;18(10):20–23.
- ,.Observation unit in Children's Hospital—Adjunct to delivery and teaching of ambulatory pediatric care.N Y State J Med.1980;80(11):1684–1686.
- ,,, et al.Use of pediatric observation unit for treatment of children with dehydration caused by gastroenteritis.Pediatr Emerg Care.2006;22(1):1–6.
- ,,, et al.Utilization and unexpected hospitalization rates of a pediatric emergency department 23‐hour observation unit.Pediatr Emerg Care.2008;24(9):589–594.
- ,,, et al.Short‐term holding room treatment of asthmatic‐children.J Pediatr.1985;106(5):707–711.
- ,,.Usefulness of the serum electrolyte panel in the management of pediatric dehydration treated with intravenously administered fluids.Pediatrics.2004;114(5):1227–1234.
- ,,.Treatment of acute asthmatic attacks in a holding unit of a pediatric emergency room.Ann Allergy.1980;45(3):159–162.
- ,,.Outpatient oral rehydration in the United States.Am J Dis Child.1986;140(3):211–215.
- ,.Postreduction management of intussusception in a children's hospital emergency department.Pediatrics.2003;112(6 Pt 1):1302–1307.
- ,,, et al.Children with asthma admitted to a pediatric observation unit.Pediatr Emerg Care.2005;21(10):645–649.
- ,,, et al.Pediatric closed head injuries treated in an observation unit.Pediatr Emerg Care.2005;21(10):639–644.
- ,,.A reduction in hospitalization, length of stay, and hospital charges for croup with the institution of a pediatric observation unit.Am J Emerg Med.2006;24(7):818–821.
- ,,.Short stay in an outpatient department. An alternative to hospitalization.Am J Dis Child.1972;123(2):128–132.
- ,,.The role of oral ondansetron in children with vomiting as a result of acute gastritis/gastroenteritis who have failed oral rehydration therapy: a randomized controlled trial.Ann Emerg Med.2008;52(1):22–29.e6.
- ,,, et al.Oral ondansetron for gastroenteritis in a pediatric emergency department.N Engl J Med.2006;354(16):1698–1705.
- ,,, et al.Integrated hospital emergency care improves efficiency.Emerg Med J.2008;25(2):78–82.
- ,,, et al.Redefining the community pediatric hospitalist: the combined pediatric ED/inpatient unit.Pediatr Emerg Care.2007;23(1):33–37.
- ,,, et al.Program description: a hospitalist‐run, medical short‐stay unit in a teaching hospital.CMAJ.2000;163(11):1477–1480.
- ,.Evaluation of a pediatric hospitalist service: impact on length of stay and hospital charges.Pediatrics.2000;105(3 Pt 1):478–484.
- ,,, et al.Restructuring an academic pediatric inpatient service using concepts developed by hospitalists.Clin Pediatr (Phila).2001;40(12):653–660; discussion 661‐662.
- ,,, et al.American College of Emergency Physicians (ACEP).Practice Management Committee, American College of Emergency Physicians. Management of Observation Units. Irving, TX: American College of Emergency Physicians; July1994.
- Overcrowding crisis in our nation's emergency departments:is our safety net unraveling?Pediatrics.2004;114(3):878–888.
- ,.Emergency department overcrowding in the United States: an emerging threat to patient safety and public health.Emerg Med J.2003;20(5):402–405.
- ,,, et al.Characteristics of high volume teaching hospital observation units: data from the Emergency Department Observation Unit Benchmark Alliance (EDOBA).Acad Emerg Med.2009;16(s1):Abstract 628.
- ,,.Use of the emergency department observation unit in the treatment of acute asthma.Ann Emerg Med.1982;11(2):77–83.
- ,,, et al.Management of acute pyelonephritis in an emergency department observation unit.[see Comment].Ann Emerg Med.1991;20(3):253–257.
- ,,, et al.Patterns of use of an emergency department‐based observation unit.Am J Ther.2002;9(6):499–502.
- ,,, et al.Emergency department observation of poisoned patients: how long is necessary?[see Comment].Acad Emerg Med.1999;6(9):887–894.
- ,,, et al.False‐negative and false‐positive errors in abdominal pain evaluation: failure to diagnose acute appendicitis and unnecessary surgery.Acad Emerg Med.2000;7(11):1244–1255.
- .Resource use by younger versus older patients.Fam Pract Res J.1993;13(3):283–290.
- ,,, et al.Trauma 24‐hour observation critical path.J Trauma.1998;45(1):147–150.
- ,,, et al.The role of an emergency department observation unit in the management of trauma patients.J Emerg Med.1985;2(5):325–333.
- ,.Observation unit impact on ED admission for asthma.Am J Emerg Med.1994;12(1):11–14.
- ,.Emergency care for children in pediatric and general emergency departments.Pediatr Emerg Care.2007;23(2):94–102.
The first observation units were implemented more than 40 years ago with the goal of reducing the number and duration of inpatient stays. Since then, observation units (OUs) have evolved as a safe alternative to hospitalization14 for the delivery of finite periods of care, typically less than 24 hours.58 Observation services allow for time to determine the need for hospitalization in cases that are unclear after their initial evaluation and treatment.9 Observation status is an administrative classification related to reimbursement that can be applied to patients whose diagnosis, treatment, stabilization, and discharge can reasonably be expected within 24 hours.10, 11 The site of care for observation is dependent in part upon existing facility structures; some institutions utilize virtual OUs within the emergency department (ED) or hospital ward, while others have dedicated, geographically distinct OUs, which may function as an extension of either the ED or inpatient settings.9
OUs have been instrumental in providing care to adult patients with chest pain, asthma, and acute infections.1218 Recently, there has been an increase in the number of publications from pediatric OUs in the United States and abroad. Observation may be a preferred model of care for select pediatric patients, as hospitalized children often experience brief stays.1921 Previous reviews on this model of care have combined adult and pediatric literature and have included research from countries with healthcare structures that differ considerably from the United States.2224 To date, no systematic review has summarized the pediatric OU literature with a focus on the US healthcare system.
As payers and hospitals seek cost‐effective alternatives to traditional inpatient care, geographically distinct OUs may become integral to the future of healthcare delivery for children. This systematic review provides a descriptive overview of the structure and function of pediatric OUs in the United States. We also scrutinize the outcome measures presented in the included publications and propose future directions for research to improve both observation unit care, as well as the care delivered to patients under observation status within general inpatient or ED settings.
Methods
Literature Search
With the assistance of a health services librarian, a search of the following electronic databases from January 1, 1950 through February 5, 2009 was conducted: Medline, Web of Science, Cumulative Index to Nursing and Allied Health Literature (CINAHL), Health Care Advisory Board (HCAB), Lexis‐Nexis, National Guideline Clearinghouse, and Cochrane Reviews. Key words used for the Boolean search are included in Appendix A. In addition, we conducted a manual search of reference lists from reviews, guidelines, and articles meeting inclusion criteria.
We included English language peer‐reviewed publications that reported on pediatric OU care in the United States. Studies were included if they reported outcomes including lengths of stay, admission from observation rates, return visit rates, costs or charges. Descriptive publications of pediatric OU structure and function were also included. Studies were excluded if they were conducted outside the United States, evaluated psychiatric or intensive care, reported on observation status in an ED without an OU or observation status on a traditional inpatient ward. Two reviewers (M.M. and C.K.) identified articles for inclusion. Any disagreements between the reviewers were resolved by discussion and consensus agreement. Interrater reliability was assessed using the kappa statistic.
Quality Assessment
The quality of each study was rated using the Oxford Centre for Evidence‐based Medicine levels of evidence.25 With this system, levels of evidence range from 1a (homogeneous systematic review of randomized, controlled trials) to 5 (expert opinion without explicit critical appraisal).
Data Synthesis
Data on study design, OU characteristics, patient populations, and outcomes were extracted using a standardized form. Heterogeneity of study design, interventions, and outcomes precluded the ability to conduct meta‐analyses.
Results
A systematic search of the electronic databases identified 222 unique citations (Figure 1). A total of 107 abstracts were evaluated. We identified 48 articles for full‐text review, of which 18 met inclusion criteria. Hand search of references yielded 24 additional articles, of which 3 met inclusion criteria. Interrater agreement for selected articles was high at 98% (kappa = 0.85).
Observation Unit Characteristics
The majority of research on OUs has been conducted at large academic pediatric centers. One publication was from a community hospital.26 These studies present data on more than 22,000 children cared for in OUs of 11 hospitals over a 32‐year time span. Most studies were level 2 evidence: 2b, retrospective cohort studies and low‐quality randomized, controlled trials; or 2c, outcomes research. Three were descriptive and not assigned a formal evidence level.2729
Table 1 highlights general features of U.S. pediatric OUs. Five institutions renovated or expanded clinical space in order to open the OU.27, 2932 Units ranged in size from 3 to 23 beds. The OU was located in or near the ED in all but 2 hospitals, which had ward‐based units. The ED was the primary entry point into the OU with only 2 open model units accepting patients from other settings.5, 32 The annual number of observation cases ranged from 1000 to 3000 in children's hospitals. Approximately 500 ward‐based observation cases per year were cared for in the single community hospital studied. Three reports included time trends showing increased OU utilization over study years.5, 30, 31
| Publication (Year); Condition | Study Design; Level of Evidence; Time Frame; Sample Size | Hospital; Observation Setting; Year Opened | Site | Beds | Entry Point | Staffing; Physicians; Nurses |
|---|---|---|---|---|---|---|
| ||||||
| Gururaj et al.43 (1972); all conditions | Retrospective cohort; 2c; 1 year; 437 cases under observation | King's County Downstate Brooklyn; short‐stay unit | ED | 3 | Not reported | Pediatric residents; general pediatricians |
| Ellerstein and Sullivan,32 (1980); all conditions | Retrospective cohort; 2c; 6 years; 5858 cases of unscheduled care plus 1403 elective surgery cases | Children's Hospital Buffalo; observation unit; 1972 | ED | 8 | ED, clinic, procedure/OR | Primary care pediatricians; other specialists; pediatric residents |
| O'Brien et al.37 (1980); asthma | Retrospective cohort; 2c; 1 month; 434 cases of asthma, 328 discharged directly from ED, 106 treated in holding unit | Children's National DC; holding unit | ED | 6 | ED | 1‐2 pediatric residents; 1‐2 nurses |
| Willert et al.35 (1985); asthma | Randomized*; 2b; 578 cases of asthma; 166 cases 1.5 hours postaminophylline, 103 randomized, 52 to holding unit | Children's Memorial Chicago; holding room | ED | 5 | ED | General pediatricians; pediatric residents; PEM nurses |
| Listernick et al.38 (1986); dehydration | Randomized; 2b; 29 cases of dehydration; 22 to holding unit | Children's Memorial Chicago | ||||
| Balik et al.31 (1988); all conditions | Descriptive; none given | Minneapolis Children's; short‐stay unit observation area; 1985 | Day surgery area adjacent to ED | Not reported | Not reported | General pediatricians; pediatric nurses (shared with ED) |
| Marks et al.7 (1997); all conditions | Retrospective cohort; 2c; 5 months; 968 cases in short‐stay unit | Children's Hospital Boston; short‐stay unit; 1994 | Ward | 4‐18 | ED | Primary care pediatricians; PEM physicians; pediatric residents; pediatric nurses; 1:6 nurse:patient ratio |
| Marks et al.7 (1997); asthma | Pre‐post; 2b; 400 cases of asthma; 102 pre/298 post short‐stay unit | Children's Hospital Boston | ||||
| Wiley et al.6 (1998); all conditions | Retrospective cohort; 2c; 1 year; 805 cases of unscheduled observation; plus 595 scheduled cases | Connecticut Children's; outpatient extended treatment site | ED | 10 | Not reported | PEM physicians; other specialists; 1:5 nurse:patient ratio |
| Scribano et al.65 (2001); all conditions | Retrospective cohort; 2b; 2 years; 1798 cases under observation | Connecticut Children's | ||||
| Leduc et al.30 (2002); all conditions | Retrospective cohort; 2c; 6 months; 686 cases under observation (4.8% of ED visits) | Children's Hospital Denver; OU | ED | 6 | Not reported | Not reported |
| Bajaj and Roback,30 (2003); intussusception | Retrospective cohort; 2b; 4.5 years; 78 cases of intussusception (51 under observation) | Children's Hospital Denver | ||||
| Wathen et al.36 (2004); dehydration | Convenience sample; 2c; 10 months; 182 cases of dehydration (48 under observation) | Children's Hospital Denver | ||||
| Crocetti et al.26 (2004); all conditions | Retrospective cohort; 2b; 2 years; 956 cases under observation | John Hopkin's Bayview; observation status beds; 1997 | Ward | Not reported | 99% ED 1% other location | General pediatricians covering ED and ward |
| Silvestri et al.29 (2005); all conditions | Descriptive; none given | Children's Hospital of Philadelphia; OU; 1999 | ED | 12 | ED | PEM physicians; PEM fellows; urgent care pediatricians; ED nurse practitioner; inpatient nurses |
| Alpern et al.34 (2008); all conditions | Prospective cohort; 1b; 30 months; 4453 cases under observation | Children's Hospital of Philadelphia | ||||
| Thomas27 (2000); all conditions | Descriptive; none given | Primary Children's Medical Center; RTU; 1999 | ED | 22‐26 | ED, clinic, procedure/OR | PEM physicians; general pediatricians; other specialists; no residents |
| Zebrack et al.25 (2005); all conditions | Retrospective cohort; 2b; 2 years; 4189 cases of unscheduled observation plus 2288 scheduled cases | Primary Children's Medical Center | PEM nurses; 1:4 nurse:patient ratio | |||
| Miescier et al.40 (2005); asthma | Retrospective cohort; 2b; 2 years; 3029 asthma visits; 384 admitted, 301 observed, 161cases met inclusion | Primary Children's Medical Center | ||||
| Holsti et al.41 (2005); head injury | Retrospective cohort; 2b; 2 years; 827 CHI visits, 273 admitted, 285 observed, 284 cases met inclusion | Primary Children's Medical Center | ||||
| Greenberg et al.42 (2006); croup | Retrospective pre‐post; 2b; 1 year each; 694 croup cases pre‐RTU, 66 admitted; 789 croup cases post‐RTU, 33 admitted; 76 observed | Primary Children's Medical Center | ||||
| Mallory et al.33 (2006); dehydration | Retrospective cohort; 2b; 1 year; 430 dehydration cases under observation | Primary Children's Medical Center | ||||
Staffing and Workflow
Staffing models varied and have undergone transitions over time. Prior to 1997, general pediatricians primarily provided physician services. In more recent years, OUs have utilized pediatric emergency medicine (PEM) providers. Three of the 11 units allowed for direct patient care by subspecialists.5, 6, 32 One OU was staffed by nurse practitioners.29 OU nursing backgrounds included pediatrics, emergency medicine, or PEM.
Five institutions assembled multidisciplinary teams to define the unit's role and establish policies and procedures.7, 27, 2931 Workflow in the OU focused on optimizing efficiency through standardized orders, condition‐specific treatment protocols, and bedside charting.7, 26, 33 Several units emphasized the importance of ongoing evaluations by attending physicians who could immediately respond to patient needs. Rounds occurred as often as every 4 hours.5, 7 Two centers utilized combined physician‐nursing rounds to enhance provider communication.7, 34 No publications reported on patient transitions between sites of care or at shift changes.
Criteria for Observation
All 11 hospitals have developed protocols to guide OU admissions (Table 2). Nine publications from 4 OUs commented on treatments delivered prior to observation.33, 3542 The most commonly cited criteria for admission was approval by the unit's supervising physician. Utilization review was not mentioned as an element in the OU admission decision. Common OU exclusions were the need for intensive care or monitoring while awaiting an inpatient bed; however, these were not universal. Eight centers placed bounds around the duration of OU stays, with minimum stays of 2 hours and maximum stays of 8 to 24 hours.
| Hospital | Entry Criteria | Age Range | Time | Exclusion Criteria |
|---|---|---|---|---|
| ||||
| King's County, Downstate Brooklyn | Otherwise required inpatient admission | 0‐13 years | Maximum 24 hours | Not reported |
| Acute problem of uncertain severity | ||||
| Acute problem not readily diagnosed | ||||
| Short course periodic treatment | ||||
| Diagnostic procedures impractical as outpatient | ||||
| Children's Hospital, Buffalo | Admission from any source | 0‐21 years | Maximum 24 hours | Intensive care needs |
| Short stay elective surgery | Routine diagnostic tests | |||
| Estimated length of stay <24 hours | Holding prior to admission | |||
| Children's National, Washington, DC | Inadequate response to 3 subcutaneous epinephrine injections | 8 months to 19 years | Not reported | Not reported |
| Children's Memorial, Chicago | Asthma: | |||
| Available parentAsthma score 5Inadequate response to ED treatment | >1 year | Maximum 24 hours | Past history of BPD, CF, CHD, other debilitating disease | |
| Dehydration: | ||||
| Cases receiving oral hydration | 3‐24 months | 12 hours for oral | Intensive care need | |
| Parent preference if given IV hydration | 8 to 12 hours for IV | Hypernatremia | ||
| Minneapolis Children's | Conditions listed in Table 3 | Not reported | Maximum 10 hours | Not reported |
| Children's Hospital, Boston | Straightforward diagnoses as determined by ED staff | Not reported | Not reported | Other complex medical issues |
| Bed availability | ||||
| Connecticut Children's | PEM attending discretionLimited severity of illnessUsually confined to a single organ systemClearly identified plan of care | Not reported | After 3‐4 hours in ED Low likelihood of requiring extended care >23 hours | Asthma: no supplemental O2 need, nebulized treatments >Q2 hourCroup: no supplemental O2 need, <2 racemic epinephrine treatmentsDehydration: inability to tolerate orals, bicarbonate >10, 40 mL/kg IVFSeizure: partial or generalized, postictal, unable to tolerate oralsPoisoning: mild or no symptoms, poison control recommendation |
| Children's Hospital, Denver | Intussusception: following reduction | 0‐18 years | After 3‐4 hours in ED | Not reported |
| Dehydration: based on clinical status | ||||
| Johns Hopkins, Bayview | Consultation with on‐duty pediatrician | 0‐18 years | Minimum of 2 hours | Patients requiring subspecialty or intensive care services |
| High likelihood of discharge at 24 hours | ||||
| Children's Hospital of Philadelphia | Sole discretion of the ED attending | Not reported | Minimum 4 hours | No direct admissions |
| Single focused acute condition | Maximum 23 hours | Diagnostic dilemmas | ||
| Clinical conditions appropriate for observation | Underlying complex medical problems | |||
| Primary Children's Medical Center | Observation unit attending discretion | 0‐21 years | Minimum 3 hours | Admission holds |
| Scheduled procedures as space available | Maximum 24 hours | Intensive care needs | ||
| ED admit after consult with OU doctor | Complicated, multisystem disease | |||
| Clear patient care goals | Need for multiple specialty consults | |||
| Limited severity of illness | Psychiatric patients | |||
| Diagnostic evaluation | ||||
Ages of Children Under Observation
Seven of 11 hospitals reported the age range of patients accepted in their OU (Table 2). All but 1 unit accepted children from infants to young adults, 18 to 21 years of age.43 In the 6 units that reported the age distribution of their OU population, roughly 20% were <1 year, more than 50% were <5 years, and fewer than 30% fell into an adolescent age range.5, 6, 26, 32, 34, 43
Conditions Under Observation
Many conditions under observation were common across time and location (Table 3). The list of conditions cared for in OUs has expanded in recent years. Medical conditions predominated over surgical. While the majority of observation cases required acute care, nearly one‐half of the units accepted children with scheduled care needs (eg, routine postoperative care, procedures requiring sedation, infusions, and extended evaluations such as electroencephalograms or pH probes). These scheduled cases, cared for within the OU structure, provided more steady demand for OU services.
| King's County, Downstate Brooklyn | Children's Hospital, Buffalo | Minneapolis Children's | Children's Hospital, Boston | Connecticut Children's | Children's Hospital, Denver | Johns Hopkins, Bayview | Children's Hospital of Philadelphia | Primary Children's Medical Center, Salt Lake City | |
|---|---|---|---|---|---|---|---|---|---|
| |||||||||
| Respiratory | |||||||||
| Asthma | |||||||||
| Pneumonia | |||||||||
| Bronchiolitis | |||||||||
| Croup | |||||||||
| Allergic reaction | |||||||||
| Cardiology | |||||||||
| Gastrointestinal | |||||||||
| Vomiting | |||||||||
| Gastro/dehydration | |||||||||
| Abdominal pain | |||||||||
| Constipation | |||||||||
| Diabetes | |||||||||
| Neurologic | |||||||||
| Seizure | |||||||||
| Head injury | |||||||||
| Infection | |||||||||
| Sepsis evaluation | |||||||||
| UTI/pyelonephritis | |||||||||
| Cellulitis | |||||||||
| Fever | |||||||||
| Pharyngitis | |||||||||
| Otitis media | |||||||||
| Adenitis | |||||||||
| Ingestion/poisoning | |||||||||
| Hematologic | |||||||||
| Sickle cell disease | |||||||||
| Transfusion/emnfusion | |||||||||
| Psychological/social | |||||||||
| Dental | |||||||||
| Surgical conditions | |||||||||
| Foreign body | |||||||||
| Trauma | |||||||||
| Burn | |||||||||
| Orthopaedic injury | |||||||||
| Postoperative complication | |||||||||
| Scheduled care | |||||||||
| Diagnostic workup | |||||||||
| Procedures/sedation | |||||||||
| Elective surgery | |||||||||
Reimbursement
One publication highlighted the special billing rules that must be considered for observation care.27 In 3 studies, payers recognized cost‐savings associated with the OU's ability to provide outpatient management for cases that would traditionally require inpatient care.31, 35, 38
Observation Unit Outcomes
Outcomes reported for pediatric OU stays fall into 4 major categories: length of stay (LOS), admission rates, return visit rates, and costs. Despite these seemingly straightforward groupings, there was significant heterogeneity in reporting these outcomes.
Length of Stay
The start time for OU length of stay (LOS) is not clearly defined in the articles included in this review. While the start of an observation period is assumed to begin at the time the order for observation is placed, it is possible that the LOS reported in these publications began at the time of ED arrival or the time the patient was physically transferred to the OU. The average LOS for individual OUs ranged from 10 to 15 hours.5, 6, 26, 30, 35, 38, 40, 41, 43 One ward‐based and 1 ED‐based unit reported LOS extending beyond 24 hours,7, 30 with averages of 35 and 9 hours, respectively. Two units limited the duration of care to <10 hours.31, 38
For studies that included a comparison group, OU stays were consistently shorter than a traditional inpatient stay by 6 to 110 hours.7, 36, 38, 39, 42 No significant differences in clinical parameters between groups were reported. There was appreciable variation in the average LOS across institutions for similar conditions, 12 to 35 hours for asthma,5, 7, 34, 35 and 9 to 18 hours for dehydration.5, 34, 36, 38
Admission Rates
Rates of hospital admission after observation from the 9 OUs reporting this outcome are presented in Table 4. Three publications from a single institution counted hospital admission in the 48 to 72 hours following discharge from the OU as though the patient were admitted to the hospital directly from the index OU stay.33, 40, 41 Conditions with the lowest admission rates, <10%, included croup, neurologic conditions, ingestions, trauma, and orthopedic injuries. The highest admission rates, >50%, were for respiratory conditions including asthma, pneumonia, and bronchiolitis.
| King's County, Downstate Brooklyn (%) | Children's Hospital, Buffalo (%) | Connecticut Children's (%) | Johns Hopkins, Bayview (%) | Children's Hospital of Philadelphia (%) | Primary Children's Medical Center, Salt Lake City (%) | |
|---|---|---|---|---|---|---|
| ||||||
| Unscheduled care | 42 | 17 | 11 | 25 | 25 | 15 |
| Respiratory | 32 | |||||
| Asthma | 57 | 16 | 26 | 22 | 22‐25* | |
| Pneumonia | 50 | 23 | 30‐48 | |||
| Bronchiolitis | 46 | 32 | 43 | |||
| Croup | 9 | 17 | 9 | 4‐6 | ||
| Allergic reaction | 3 | |||||
| Cardiology | 22 | |||||
| Gastrointestinal | 43 | 19 | ||||
| Vomiting | 5 | 22 | ||||
| Gastro/dehydration | 23 | 15/21 | 16* | |||
| Abdominal pain | 9 | 17 | 27 | |||
| Constipation | 9 | |||||
| Diabetes | 17 | |||||
| Neurologic | 10 | |||||
| Seizure | 19 | 8 | 17 | 18 | ||
| Head injury | 7 | 5* | ||||
| Infection | 19 | 34 | ||||
| Sepsis evaluation | 25 | 22 | ||||
| UTI/pyelonephritis | 25 | 16 | ||||
| Cellulitis | 15 | |||||
| Fever | 16 | 26 | ||||
| Pharyngitis | 13 | |||||
| Otitis media | 21 | |||||
| Ingestion/poisoning | 9 | 4 | 4 | 9 | 10 | 5 |
| Hematologic | 23 | |||||
| Transfusion/emnfusion | 2 | |||||
| Psychological/social | 21 | 80 | 17 | |||
| Dental | 14 | |||||
| Surgical conditions | ||||||
| Foreign body | ||||||
| Trauma | 13 | 2 | 53 | 5 | ||
| Burn | 13 | |||||
| Orthopedic injury | 22 | 3 | ||||
| Postoperative complication | 26 | 16 | ||||
| Scheduled care | ||||||
| Diagnostic workup | 0‐5 | |||||
| Procedures/sedation | 0.1‐9.0 | |||||
| Elective surgery | 13 | 0‐5 | ||||
Return Visit Rates
Unscheduled return visit rates were reported in 9 publications from 6 institutions and ranged from 0.01% to 5%.7, 26, 33, 3537, 3941 Follow‐up timeframes ranged from 48 hours to 1 month. Return visits were inconsistently defined. In most studies, rates were measured in terms of ED visits.26, 33, 3537, 39, 41 One ward‐based unit counted only hospital readmissions toward return visit rates.7 Three publications, from ED‐based units, counted hospital readmissions in the 2 to 5 days following observation toward admission rates and not as return visits.33, 40, 41 In most studies, data on return visits were collected from patient logs or patient tracking systems. Three studies contacted patients by phone and counted return visits to the clinic.3537 No studies reported on adherence to scheduled visits following observation.
Costs
Seven studies reported financial benefits of OU care when compared with traditional hospital care.7, 30, 31, 35, 37, 38, 42 Two centers admitted patients to inpatient care if their observation period reached a set time limit, after which cost savings were no longer realized.31, 35 Cost savings associated with the OU treatment of asthma and dehydration were attributed to lower charges for an OU bed.35, 38 Decreased charges for the OU treatment of croup were related to shorter LOS.42
Discussion
In the 40 years since the first studies of pediatric OUs, several US health systems have extended observation services to children. This model of care may be expanding, as suggested by an increase in the number of publications in the past 10 years. However, the number of centers within the US reporting on their OU experience remains small. Our systematic review identified a recurrent theme related to OUsthe opportunity to improve operational processes of care compared with the traditional inpatient alternative. We have identified the need to standardize OU outcomes and propose measures for future OU research.
Observation Unit Operations
The OU care model expands outpatient management of acute conditions to include children who are neither ready for discharge nor clear candidates for inpatient admission. OUs have demonstrated the ability to care for patients across the pediatric age spectrum. Over the decades spanning these publications, advances in medical therapy such as antiemetics for gastroenteritis and early administration of systemic steroids for asthma may have resulted in lower admission rates or shorter time to recovery.44, 45 Despite these advances, there are marked consistencies in the conditions cared for within OUs over time. The data summarized here may help guide institutions as they consider specific pediatric conditions amenable to observation care.
The hospitals included in this review either added physical space or revised services within existing structures to establish their OU. Hospitals facing physical constraints may look to underutilized areas, such as recovery rooms, to provide observation care, as observation does not require the use of licensed inpatient beds. Several units have responded to daily fluctuations in unscheduled observation cases by also serving patients who require outpatient procedures, brief therapeutic interventions, and diagnostic testing. By caring for patients with these scheduled care needs during the day, there is a more steady flow of patients into the OU. While hospitals traditionally have used postanesthesia care units and treatment rooms for scheduled cases, OUs appear to benefit from the consistent resource allocation associated with a constant demand for services.
To date, the vast majority of pediatric OUs in the published literature have emerged as an extension of ED services. Now, with the expansion of pediatric hospitalist services and movement toward 24/7 inpatient physician coverage, there may be increased development of ward‐based OUs and the designation of inpatient observation status. While ward‐based OUs managed by pediatric hospitalists may be well established, we were not able to identify published reports on this structure of care. A national survey of health systems should be undertaken to gather information regarding the current state of pediatric observation services.
When creating policies and procedures for OUs, input should be sought from stakeholders including hospitalists, PEM providers, primary care providers, subspecialists, mid‐level providers, nurses, and ancillary staff. As patients requiring observation level of care do not neatly fit an outpatient or inpatient designation, they present an opportunity for hospitalist and PEM physician groups to collaborate.4648 Calling on the clinical experiences of inpatient and ED providers could offer unique perspectives leading to the development of innovative observation care models.
This review focused on institutions with dedicated observation services, which in all but 1 study26 consisted of a defined geographic unit. It is possible that the practices implemented in an OU could have hospital‐wide impact. For example, 1 study reported reduction in LOS for all asthma cases after opening a ward‐based unit.7 Further, pediatric hospitalist services have been associated with shorter LOS49 and increased use of observation status beds compared with traditional ward services.50 As pediatric hospitalists expand their scope of practice to include both observation and inpatient care, clinical practice may be enhanced across these care areas. It follows that the impact of observation protocols on care in the ward setting should be independently evaluated.
The costs associated with the establishment and daily operations of an OU were not addressed in the reviewed publications. Assertions that observation provides a cost‐effective alternative to inpatient care4, 7, 23, 42 should be balanced by the possibility that OUs extend care for patients who could otherwise be discharged directly home. Studies have not evaluated the cost of OU care compared with ED care alone. Research is also needed to assess variations in testing and treatment intensity in OUs compared with the ED and inpatient alternatives. Reimbursement for observation is dependent in part upon institutional contracts with payers. A full discussion of reimbursement issues around observation services is beyond the scope of this review.
Observation Unit Outcomes
Length of Stay
Although most studies reported LOS, direct comparisons across institutions are difficult given the lack of a consistently referenced start to the observation period. Without this, LOS could begin at the time of ED arrival, time of first treatment, or time of admission to the OU. Identifying and reporting the elements contributing to LOS for observation care is necessary. The time of OU admission is important for billing considerations; the time of first treatment is important to understanding the patient's response to medical interventions; the time of ED arrival is important to evaluating ED efficiency. Each of these LOS measures should be reported in future studies.
Direct comparisons of LOS are further complicated by variability in the maximum permissible duration of an OU stay, ranging from 8 to 24 hours in the included studies. Despite these limits, some OU care will extend beyond set limits due to structural bottlenecks. For example, once the inpatient setting reaches capacity, observation LOS for patients who require admission will be prolonged. The best evaluation of LOS would come from prospective study design utilizing either randomization or quality improvement methods.
Defining Success and Failure in Observation Care
In the reviewed literature, observation failures have been defined in terms of admission after observation and unscheduled return visit rates. Admission rates are heavily dependent on appropriate selection of cases for observation. Although some observation cases are expected to require inpatient admission, OUs should question the validity of their unit's acceptance guidelines if the rate of admission is >30%.51 High rates could be the result of inadequate treatment or the selection of children too sick to improve within 24 hours. Low rates could indicate overutilization of observation for children who could be discharged directly home. Full reporting on the number of children presenting with a given condition and the different disposition pathways for each is needed to evaluate the success of OUs. Condition‐specific benchmarks for admission after observation rates could guide hospitals in their continuous improvement processes.
Unscheduled return visits may reflect premature discharge from care, diagnostic errors, or development of a new illness. OU care may influence patient adherence to scheduled follow‐up care but this has not been evaluated to date. In future research, both scheduled and unscheduled return visits following ED visits, observation stays, and brief inpatient admissions for similar disease states should be reported for comparison. Standard methodology for identifying return visits should include medical record review, claims analyses, and direct patient contact.
As hospitals function at or near capacity,52, 53 it becomes important to delineate the appropriate length of time to monitor for response to treatments in a given setting. Limited capacity was a frequently cited reason for opening a pediatric OU; however, the impact of OUs on capacity has not yet been evaluated. Operations research methods could be used to model OU services' potential to expand hospital capacity. This research could be guided by evaluation of administrative data from across institutions to identify current best practices for pediatric OU and observation status care.
OU benchmarking in the United States has begun with a small number of adult units participating in the ED OU Benchmark Alliance (EDOBA).54 In Table 5, we propose dashboard measures for pediatric OU continuous quality improvement. The proposed measures emphasize the role of observation along the continuum of care for acute conditions, from the ED through the OU with or without an inpatient stay to clinic follow‐up. Depending on the structure of observation services, individual institutions may select to monitor different dashboard measures from the proposed list. Patient safety and quality of care measures for the conditions commonly receiving pediatric OU care should also be developed.
| ED |
OU |
Inpatient |
Clinic | |
|---|---|---|---|---|
| ||||
| Length of stay* | ED arrival to OU admission | OU admit to disposition | Inpatient admit to discharge | |
| ED arrival to discharge home from OU | ||||
| ED arrival to discharge from inpatient following OU care | ||||
| OU admission to discharge home from inpatient care | ||||
| Admission* | % ED census admitted inpatient | % OU census admitted | ||
| % ED census that is observed | ||||
| Unscheduled return visits* | To ED | Requiring OU admission | Requiring inpatient admission | |
| Scheduled follow‐up* | To ED | To primary care or subspecialist office | ||
| Capacity | ED crowding scales | Unable to accept transfers | ||
| ED left before evaluation rates | Inpatient occupancy | |||
| Ambulance diversion | ||||
| Satisfaction | Patient/Parent | |||
| ED providers | OU providers | Inpatient providers | Follow‐up providers | |
| Cost | ED care | OU care | Inpatient care | |
| Total encounter | ||||
Limitations
The most important limitations to this review are the heterogeneity in interventions and reporting of outcomes, which precluded our ability to combine data or conduct meta‐analyses. We attempted to organize the outcomes data into clear and consistent groupings. However, we could not compare the performance of 1 center with another due to differences in OU structure, function, and design.
In order to focus this systematic review, we chose to include only peer reviewed publications that describe pediatric OUs within the United States. This excludes expert guidelines, which may be of value to institutions developing observation services.
Our search found only a small number of centers that utilize OUs and have published their experience. Thus, our review is likely subject to publication bias. Along this line, we identified 9 additional publications where children were cared for alongside adults within a general OU.5563 This suggests an unmeasured group of children under observation in general EDs, where more than 90% of US children receive acute care.64 These articles were excluded because we were unable to distinguish pediatric specific outcomes from the larger study population.
Finally, retrospective study design is subject to information bias. Without a comparable control group, it is difficult to understand the effects of OUs. Patients directly admitted or discharged from the ED and patients who require admission after observation all differ from patients discharged from observation in ways that should be controlled for with a randomized study design.
Conclusions
OUs have emerged to provide treatment at the intersection of outpatient and inpatient care during a time of dramatic change in both emergency and hospital medicine. As hospitalists expand their scope of practice to include observation care, opportunities will arise to collaborate with ED physicians and share their growing expertise in quality and efficiency of hospital care delivery to improve observation services for children. OUs have been established with laudable goalsto reduce inpatient admissions, increase patient safety, improve efficiency, and control costs. The current evidence is not adequate to determine if this model of healthcare delivery achieves these goals for children. Through synthesis of existing data, we have identified a need for standard reporting for OU outcomes and propose consistent measures for future observation care research. Only through prospective evaluation of comparable outcomes can we appraise the performance of pediatric OUs across institutions.
- .Observation medicine.Acad Emerg Med.1994;1(2):152–154.
- ,.Principles of observation medicine.Emerg Med Clin North Am.2001;19(1):1–17.
- ,,, et al.Emergency department observation beds improve patient care: Society for Academic Emergency Medicine debate.Ann Emerg Med.1992;21(8):967–975.
- .Pediatric observation medicine.Emerg Med Clin North Am.2001;19(1):239–254.
- ,,.The pediatric hybrid observation unit: an analysis of 6477 consecutive patient encounters.Pediatrics.2005;115(5):e535–e542.
- ,,, et al.Observation units: the role of an outpatient extended treatment site in pediatric care.Pediatr Emerg Care.1998;14(6):444–447.
- ,,, et al.Impact of a short stay unit on asthma patients admitted to a tertiary pediatric hospital.Qual Manag Health Care.1997;6(1):14–22.
- ,,, et al.Management of observation units. American College of Emergency Physicians.Ann Emerg Med.1995;25(6):823–830.
- ,,, et al. The observation unit: an operational overview for the hospitalist. Society of Hospital Medicine White Paper 2009; Available at: http://www.hospitalmedicine.org/Content/NavigationMenu/Publications/WhitePapers/White_Papers.htm. Accessed July2009.
- Acute Criteria Pediatric InterQual Level of Care.San Francisco, CA:McKesson Corporation;2006.
- Observation Status Related to U.S. Hospital Records.Healthcare Cost and Utilization Project. HCUP Methods Series Report #2002‐3. Rockville, MD: Agency for Healthcare Research and Quality;2002.
- ,,, et al.Emergency department observation unit versus hospital inpatient care for a chronic asthmatic population: a randomized trial of health status outcome and cost.Med Care.1998;36(4):599–609.
- ,,, et al.Costs of an emergency department‐based accelerated diagnostic protocol vs hospitalization in patients with chest pain: a randomized controlled trial.JAMA.1997;278(20):1670–1676.
- .Management of patients with infectious diseases in an emergency department observation unit.Emerg Med Clin North Am.2001;19(1):187–207.
- ,,, et al.A comparison between emergency diagnostic and treatment unit and inpatient care in the management of acute asthma.Arch Intern Med.1997;157(18):2055–2062.
- .Chest pain observation units.Emerg Med J.2001;18(2):148.
- ,,, et al.Randomised controlled trial and economic evaluation of a chest pain observation unit compared with routine care.BMJ.2004;328(7434):254.
- ,,, et al.A cooperative care model: cardiologists and hospitalists reduce length of stay in a chest pain observation. In:5th Scientific Forum on Quality of Care and Outcomes Research in Cardiovascular Disease and Stroke, Washington, DC, May 15‐17, 2003.Philadelphia, PA:Lippincott Williams 2003. p.P186.
- ,.Observation unit management of pediatric emergencies.Emerg Med Clin North Am.1991;9(3):669–676.
- .A short stay or 23‐hour ward in a general and academic children's hospital: are they effective?Pediatr Emerg Care.2000;16(4):223–229.
- ,,, et al.Trends in high turnover stays among children hospitalized in the United States, 1993 through 2003.Pediatrics.2009;123:996–1002.
- .Hospital based alternatives to acute paediatric admission: a systematic review.Arch Dis Child.2005;90(2):138–142.
- ,,.Short‐stay units and observation medicine: a systematic review.Med J Aust.2003;178(11):559–563.
- ,,.Use of emergency observation and assessment wards: a systematic literature review.Emerg Med J.2003;20(2):138–142.
- Oxford Centre for Evidence‐Based Medicine. Levels of evidence and grades of recommendation (May 2001). Available at: http://www.cebm.net/levels_of_evidence.asp. Accessed July2009.
- ,,, et al.Pediatric observation status beds on an inpatient unit: an integrated care model.Pediatr Emerg Care.2004;20(1):17–21.
- .Pediatric update. Our new rapid treatment unit: an innovative adaptation of the “less than 24‐hour stay” holding unit.J Emerg Nurs.2000;26(5):507.
- ,,.Use of an observation unit by a pediatric emergency department for common pediatric illnesses.Pediatr Emerg Care.2001;17(5):321–323.
- ,,, et al.Observation medicine: the expanded role of the nurse practitioner in a pediatric emergency department extended care unit.Pediatr Emerg Care.2005;21(3):199–202.
- ,,.An observation unit in a pediatric emergency department: one children's hospital's experience.J Emerg Nurs.2002;28(5):407–413.
- ,,.When the patient requires observation not hospitalization.J Nurs Admin.1988;18(10):20–23.
- ,.Observation unit in Children's Hospital—Adjunct to delivery and teaching of ambulatory pediatric care.N Y State J Med.1980;80(11):1684–1686.
- ,,, et al.Use of pediatric observation unit for treatment of children with dehydration caused by gastroenteritis.Pediatr Emerg Care.2006;22(1):1–6.
- ,,, et al.Utilization and unexpected hospitalization rates of a pediatric emergency department 23‐hour observation unit.Pediatr Emerg Care.2008;24(9):589–594.
- ,,, et al.Short‐term holding room treatment of asthmatic‐children.J Pediatr.1985;106(5):707–711.
- ,,.Usefulness of the serum electrolyte panel in the management of pediatric dehydration treated with intravenously administered fluids.Pediatrics.2004;114(5):1227–1234.
- ,,.Treatment of acute asthmatic attacks in a holding unit of a pediatric emergency room.Ann Allergy.1980;45(3):159–162.
- ,,.Outpatient oral rehydration in the United States.Am J Dis Child.1986;140(3):211–215.
- ,.Postreduction management of intussusception in a children's hospital emergency department.Pediatrics.2003;112(6 Pt 1):1302–1307.
- ,,, et al.Children with asthma admitted to a pediatric observation unit.Pediatr Emerg Care.2005;21(10):645–649.
- ,,, et al.Pediatric closed head injuries treated in an observation unit.Pediatr Emerg Care.2005;21(10):639–644.
- ,,.A reduction in hospitalization, length of stay, and hospital charges for croup with the institution of a pediatric observation unit.Am J Emerg Med.2006;24(7):818–821.
- ,,.Short stay in an outpatient department. An alternative to hospitalization.Am J Dis Child.1972;123(2):128–132.
- ,,.The role of oral ondansetron in children with vomiting as a result of acute gastritis/gastroenteritis who have failed oral rehydration therapy: a randomized controlled trial.Ann Emerg Med.2008;52(1):22–29.e6.
- ,,, et al.Oral ondansetron for gastroenteritis in a pediatric emergency department.N Engl J Med.2006;354(16):1698–1705.
- ,,, et al.Integrated hospital emergency care improves efficiency.Emerg Med J.2008;25(2):78–82.
- ,,, et al.Redefining the community pediatric hospitalist: the combined pediatric ED/inpatient unit.Pediatr Emerg Care.2007;23(1):33–37.
- ,,, et al.Program description: a hospitalist‐run, medical short‐stay unit in a teaching hospital.CMAJ.2000;163(11):1477–1480.
- ,.Evaluation of a pediatric hospitalist service: impact on length of stay and hospital charges.Pediatrics.2000;105(3 Pt 1):478–484.
- ,,, et al.Restructuring an academic pediatric inpatient service using concepts developed by hospitalists.Clin Pediatr (Phila).2001;40(12):653–660; discussion 661‐662.
- ,,, et al.American College of Emergency Physicians (ACEP).Practice Management Committee, American College of Emergency Physicians. Management of Observation Units. Irving, TX: American College of Emergency Physicians; July1994.
- Overcrowding crisis in our nation's emergency departments:is our safety net unraveling?Pediatrics.2004;114(3):878–888.
- ,.Emergency department overcrowding in the United States: an emerging threat to patient safety and public health.Emerg Med J.2003;20(5):402–405.
- ,,, et al.Characteristics of high volume teaching hospital observation units: data from the Emergency Department Observation Unit Benchmark Alliance (EDOBA).Acad Emerg Med.2009;16(s1):Abstract 628.
- ,,.Use of the emergency department observation unit in the treatment of acute asthma.Ann Emerg Med.1982;11(2):77–83.
- ,,, et al.Management of acute pyelonephritis in an emergency department observation unit.[see Comment].Ann Emerg Med.1991;20(3):253–257.
- ,,, et al.Patterns of use of an emergency department‐based observation unit.Am J Ther.2002;9(6):499–502.
- ,,, et al.Emergency department observation of poisoned patients: how long is necessary?[see Comment].Acad Emerg Med.1999;6(9):887–894.
- ,,, et al.False‐negative and false‐positive errors in abdominal pain evaluation: failure to diagnose acute appendicitis and unnecessary surgery.Acad Emerg Med.2000;7(11):1244–1255.
- .Resource use by younger versus older patients.Fam Pract Res J.1993;13(3):283–290.
- ,,, et al.Trauma 24‐hour observation critical path.J Trauma.1998;45(1):147–150.
- ,,, et al.The role of an emergency department observation unit in the management of trauma patients.J Emerg Med.1985;2(5):325–333.
- ,.Observation unit impact on ED admission for asthma.Am J Emerg Med.1994;12(1):11–14.
- ,.Emergency care for children in pediatric and general emergency departments.Pediatr Emerg Care.2007;23(2):94–102.

Hospitalists and ACC in Pandemic Flu
Major natural disasters, such as Hurricane Rita and Hurricane Katrina in 2005, have reinforced the reality that health care workers may be asked to treat patients outside the traditional hospital setting.1 The emergence of H5N1 avian influenza in Southeast Asia has also raised concerns about a potential worldwide pandemic influenza.2 Since 2003, the number of avian influenza cases in humans has totaled 387, with 245 deaths.3 While H5N1 influenza has thus far been largely confined to avian populations, the virulence of this strain has raised concern regarding the possible emergence of enhanced human transmission.4 While impossible to accurately forecast the devastation of the next pandemic on the health system, anything similar to the pandemics of the past century will require a large coordinated response by the health system. The most severe pandemic in the past century occurred in 1918 to 1919. The estimated deaths attributed to this worldwide ranges from 20 to 100 million persons,57 with >500,000 of these deaths in the United States.6, 7 In comparison, the annual rate of deaths related to influenza in the United States ranges from 30,000 to 50,000.2, 5 It has been estimated that the next pandemic influenza could cause 75 to 100 million people to become ill, and lead to as many as 1.9 million deaths in the United States.8 In response, the Department of Health and Human Services (HHS) has stressed the importance of advanced planning,9 and the most recent Homeland Security Presidential Directive (HSPD‐21) directs health care organizations and the federal government to develop preparedness plans to provide surge capacity care in times of a catastrophic health event.10 A previous report by one of the authors emphasized the need for hospitalists to play a major role in institutional planning for a pandemic influenza.11
The Alternate Care Center
The concept of offsite care in an influenza pandemic has previously been described, and we will refer to these as Alternate Care Centers (ACCs). Although the literature describes different models of care at an ACC (Table 1),12 we believe an ACC should be activated as an extension of the supporting hospital, once the hospital becomes over capacity despite measures to grow its inpatient service volume.
| Overflow hospital providing full range of care |
| Patient isolation and alternative to home care for infectious patients |
| Expanded ambulatory care |
| Care for recovering, noninfectious patients |
| Limited supportive care for noncritical patients |
| Primary triage and rapid patient screening |
| Quarantine |
Our health system is a large academic medical center, and we have been working with our state to develop a plan to establish and operate an ACC for the next pandemic influenza. Our plans call for an ACC to be activated as an overflow hospital once our hospitals are beyond 120% capacity. We have gone through several functional and tabletop exercises to help identify critical issues that are likely to arise during a real pandemic. Subsequent to these exercises, we have convened an ACC Planning Work Group, reviewed the available literature on surge hospitals, and have focused our recent efforts on several key areas.13 First, it will be important to clearly outline the general services that will be available at this offsite location (Table 2), and this information should be disseminated to the local medical community and the general public. An informed public, with a clear understanding that the ACC is an extension of the hospital with hospitalists in charge of medical care, is more likely to accept getting healthcare in this setting.
|
| IVF administration |
| Parenteral medication administration (eg, antibiotics, steroids, narcotic analgesics, antiemetics) |
| Oxygen support |
| Palliative care services |
Second, hospitals and the ACCas an extension to the main hospitalwill be asked to provide care to patients referred from several external facilities. Thus, the relationship between the ACC and the main hospital is critical. In a situation where local and even national health care assets will be overwhelmed, having a traditional hospital take full ownership of the ACC and facilitate the transport of patients in and out of the center will be vital to the maintenance of operations. Figure 1 illustrates an example of how patients may be transitioned from 1 site of care to another.
Third, the logistics of establishing an ACC should include details regarding: (1) securing a location that is able to accommodate the needs of the ACC; (2) predetermining the scope of care that can be provided; (3) procuring the necessary equipment and supplies; (4) planning for an adequate number of workforce and staff members; and (5) ensuring a reliable communication plan within the local health system and with state and federal public health officials.14 Staffing shortages and communication barriers are worthy of further emphasis. Given conservative estimates that up to 35% of staff may become ill, refuse to work, or remain home to care for ill family members,15 it is essential that hospitals and regional emergency planners develop a staffing model for the ACC, well in advance of a pandemic. These may include scenarios in which the recommended provider‐to‐patient ratio can not be met. Among the essential lessons learned from the severe acute respiratory syndrome (SARS) outbreak in Toronto (Ontario, Canada) was the importance of developing redundant and reliable communication plans among the healthcare providers.16, 17
Last, healthcare workers' concerns about occupational health and safety must be addressed, and strict measures to protect providers in the ACC need to be implemented.16 This includes providing all exposed staff with adequate personal protective equipment (eg, N‐95 masks), ensuring that all staff are vaccinated against the influenza virus, and implementing strict infection control (eg, hand washing) practices.
For more information, we refer the reader to references that contain further details on our ACC exercises13 and documents that outline concepts of operations in an ACC, developed by the Joint Commission and a multiagency working group.1, 14
The Hospitalist Physician and the ACC
During an influenza pandemic, physicians from all specialties will be vital to the success of the health systems' response. General internists,18 family practitioners, and pediatricians will be overextended in the ambulatory setting to provide intravenous (IV) fluids, antibiotics, and vaccines. Emergency physicians will be called upon to provide care for a burgeoning number of patient arrivals to the Emergency Department (ED), whose acuity is higher than in nonpandemic times. These physicians' clinical expertise at their sites of practice may be severely tested. Hospitalists, given their inpatient focus will be ideally suited to provide medical care to patients admitted to the ACC.
Previous physician leadership at surge hospitals has come from multiple specialties. Case studies describing the heroic physician leadership after Hurricane Katrina and Hurricane Rita represented pediatricians, family physicians, emergency department physicians, and internists.1 In an influenza pandemic, patients in the ACC will require medical care that would, under nonsurge situations, warrant inpatient care. Hospitalists are well poised to lead the response in the ACC for pandemic flu. Hospitalists have expanded their presence into many clinical and administrative responsibilities in their local health systems,19 and the specialty of hospital medicine has evolved to incorporate many of the skills and expertise that would be required of physician leaders who manage an ACC during an influenza pandemic.
While the actual morbidity and mortality associated with the next pandemic are uncertain, it is likely that the number of patients who seek out medical care will exceed current capacity. With constrained space and resources, patients will require appropriate and safe transition to and from the hospital and the ACC. Hospitalists have become leaders in developing and promoting quality transition of care out of acute care settings.20, 21 Their expertise in optimizing this vulnerable time period in patients' healthcare experience should help hospitalists make efficient and appropriate transition care decisions even during busy times and in an alternate care location. Many hospitalists have also developed local and national expertise in quality improvement (QI) and patient safety (PS) initiatives in acute care settings.22 Hospitalists can lead the efforts to apply QI and PS practices in the ACC. These interventions should focus on the potential to be effective in improving patient care, but also consider issues such as ease of implementation, cost, and potential for harm.23
An influenza pandemic will require all levels of the healthcare system to work together to develop a coordinated approach to patient care. Previously, Kisuule et al.24 described how hospitalists can expand their role to include public health. The hospitalists' leadership in the ACC fits well with their descriptions, and hospitalists should work with local, state, and national public health officials in pandemic flu planning. Their scope of practice and clinical expertise will call on them to play key roles in recognition of the development of a pandemic; help lead the response efforts; provide education to staff, patients, and family members; develop clinical care guidelines and pathways for patients; utilize best practices in the use of antimicrobial therapy; and provide appropriate palliative care. Depending on the severity of the influenza pandemic, mortality could be considerable. Many hospitalists have expertise in palliative care at their hospitals,2527 and this skill set will be invaluable in providing compassionate end‐of‐life care to patients in the ACC.
In a pandemic, the most vulnerable patient populations will likely be disproportionately affected, including the elderly, children, and the immune‐compromised. Hospitalists who care regularly for these diverse groups of patients through the spectrum of illness and recovery will be able to address the variety of clinical and nonclinical issues that arise. If the ACC will provide care for children, hospitalists with training in pediatrics, medicine‐pediatrics, or family medicine should be available.
Additional Considerations
While many unanswered questions remain about how to best utilize the ACC, hospitalists are ideally suited to help lead planning efforts for an ACC for pandemic flu. Other issues that may require additional considerations include: (1) whether to strictly care for patients with influenza symptoms and influenza‐related illnesses or to provide care for all patients at the ACC; (2) what to do when patients refuse transfer to and from the ACC; (3) determining the optimal staffing model for patient care providers and to provide care for a wide range of age groups; (4) how the ACC will be funded; (5) how and where to store stockpiles; (6) developing redundant and coordinated communication plans; and (7) planning for reliable access to information and technology from the ACC.
Conclusions
We have introduced the concept of the ACC for the hospitalist community, and emphasized the benefits of engaging hospitalists to lead the ACC initiative at their own health organizations during pandemic flu. As hospitalists currently serve in many of these roles and possess the skills to provide care and lead these initiatives, we encourage hospitalists to contact their hospital administrators to volunteer to assist with preparation efforts.
- Joint Commission on Accreditation of Healthcare Organizations. Surge Hospitals: Providing Safe Care in Emergencies;2006. Available at: http://www.jointcommission.org/NR/rdonlyres/802E9DA4‐AE80‐4584‐A205‐48989C5BD684/0/surge_hospital.pdf. Accessed May 2009.
- .Pandemic influenza: are we ready?Disaster Manag Response.2005;3(3):61–67.
- Cumulative Number of Confirmed Human Cases of Avian Influenza A/(H5N1) Reported to WHO.2008. Available at: http://www.who.int/csr/disease/avian_influenza/country/cases_table_2008_09_10/en/index.html. Accessed May 2009.
- ,,, et al.Human infection with highly pathogenic H5N1 influenza virus.Lancet.2008;371(9622):1464–1475.
- .Preparing for the next pandemic.N Engl J Med.2005;352(18):1839–1842.
- ,,.Influenza pandemic preparedness action plan for the United States: 2002 update.Clin Infect Dis.2002;35(5):590–596.
- ,,, et al.Nonpharmaceutical interventions implemented by US cities during the 1918‐1919 influenza pandemic.JAMA.2007;298(6):644–654.
- The Health Care Response to Pandemic Influenza: Position Paper.Philadelphia, PA:American College of Physicians;2006.
- U.S. Department of Health and Human Services (HHS). HHS Pandemic Influenza Plan. November2005. Available at: http://www.hhs.gov/pandemicflu/plan. Accessed May 2009.
- Homeland Security Presidential Directive/HSPD‐21.2007. Available at: http://www.whitehouse.gov/news/releases/2007/10/20071018‐10.html. Accessed May 2009.
- ,.Pandemic influenza and the hospitalist: apocalypse when?J Hosp Med.2006;1(2):118–123.
- ,,,,.The prospect of using alternative medical care facilities in an influenza pandemic.Biosecur Bioterror.2006;4(4):384–390.
- ,,, et al.Pandemic influenza and acute care centers (ACCs): taking care of sick patients in a non‐hospital setting.Biosecur Bioterror.2008;6(4):335–348.
- ,,.Acute Care Center. Modular Emergency Medical System: Concept of Operations for the Acute Care Center (ACC).Mass Casualty Care Strategy for A Biological Terrorism Incident. May2003. Available at: http://dms.dartmouth.edu/nnemmrs/resources/surge_capacity_guidance/documents/acute_care_center__concept_ of_operations. pdf. Accessed May 2009.
- Illinois Department of Public Health. Influenza.2007. Available at: http://www.idph.state.il.us/flu/pandemicfs.htm. Accessed May 2009.
- ,,.Learning from SARS in Hong Kong and Toronto.JAMA.2004;291(20):2483–2487.
- .Planning for epidemics—the lessons of SARS.N Engl J Med.2004;350(23):2332–2334.
- .The role of internists during epidemics, outbreaks, and bioterrorist attacks.J Gen Intern Med.2007;22(1):131–136.
- ,.The expanding role of hospitalists in the United States.Swiss Med Wkly.2006;136(37‐38):591–596.
- ,,,.Promoting effective transitions of care at hospital discharge: a review of key issues for hospitalists.J Hosp Med.2007;2(5):314–323.
- ,.Executing high‐quality care transitions: a call to do it right.J Hosp Med.2007;2(5):287–290.
- .Reflections: the hospitalist movement a decade later.J Hosp Med.2006;1(4):248–252.
- ,.Implementing patient safety interventions in your hospital: what to try and what to avoid.Med Clin North Am.2008;92(2):275–293, vii‐viii.
- ,,,.Expanding the roles of hospitalist physicians to include public health.J Hosp Med.2007;2(,2):93–101.
- ,,,,,.Evaluating the California hospital initiative in palliative services.Arch Intern Med.2006;166(2):227–230.
- .Palliative care and hospitalists: a partnership for hope.J Hosp Med.2006;1(1):5–6.
- .Palliative care in hospitals.J Hosp Med.2006;1(1):21–28.
Major natural disasters, such as Hurricane Rita and Hurricane Katrina in 2005, have reinforced the reality that health care workers may be asked to treat patients outside the traditional hospital setting.1 The emergence of H5N1 avian influenza in Southeast Asia has also raised concerns about a potential worldwide pandemic influenza.2 Since 2003, the number of avian influenza cases in humans has totaled 387, with 245 deaths.3 While H5N1 influenza has thus far been largely confined to avian populations, the virulence of this strain has raised concern regarding the possible emergence of enhanced human transmission.4 While impossible to accurately forecast the devastation of the next pandemic on the health system, anything similar to the pandemics of the past century will require a large coordinated response by the health system. The most severe pandemic in the past century occurred in 1918 to 1919. The estimated deaths attributed to this worldwide ranges from 20 to 100 million persons,57 with >500,000 of these deaths in the United States.6, 7 In comparison, the annual rate of deaths related to influenza in the United States ranges from 30,000 to 50,000.2, 5 It has been estimated that the next pandemic influenza could cause 75 to 100 million people to become ill, and lead to as many as 1.9 million deaths in the United States.8 In response, the Department of Health and Human Services (HHS) has stressed the importance of advanced planning,9 and the most recent Homeland Security Presidential Directive (HSPD‐21) directs health care organizations and the federal government to develop preparedness plans to provide surge capacity care in times of a catastrophic health event.10 A previous report by one of the authors emphasized the need for hospitalists to play a major role in institutional planning for a pandemic influenza.11
The Alternate Care Center
The concept of offsite care in an influenza pandemic has previously been described, and we will refer to these as Alternate Care Centers (ACCs). Although the literature describes different models of care at an ACC (Table 1),12 we believe an ACC should be activated as an extension of the supporting hospital, once the hospital becomes over capacity despite measures to grow its inpatient service volume.
| Overflow hospital providing full range of care |
| Patient isolation and alternative to home care for infectious patients |
| Expanded ambulatory care |
| Care for recovering, noninfectious patients |
| Limited supportive care for noncritical patients |
| Primary triage and rapid patient screening |
| Quarantine |
Our health system is a large academic medical center, and we have been working with our state to develop a plan to establish and operate an ACC for the next pandemic influenza. Our plans call for an ACC to be activated as an overflow hospital once our hospitals are beyond 120% capacity. We have gone through several functional and tabletop exercises to help identify critical issues that are likely to arise during a real pandemic. Subsequent to these exercises, we have convened an ACC Planning Work Group, reviewed the available literature on surge hospitals, and have focused our recent efforts on several key areas.13 First, it will be important to clearly outline the general services that will be available at this offsite location (Table 2), and this information should be disseminated to the local medical community and the general public. An informed public, with a clear understanding that the ACC is an extension of the hospital with hospitalists in charge of medical care, is more likely to accept getting healthcare in this setting.
|
| IVF administration |
| Parenteral medication administration (eg, antibiotics, steroids, narcotic analgesics, antiemetics) |
| Oxygen support |
| Palliative care services |
Second, hospitals and the ACCas an extension to the main hospitalwill be asked to provide care to patients referred from several external facilities. Thus, the relationship between the ACC and the main hospital is critical. In a situation where local and even national health care assets will be overwhelmed, having a traditional hospital take full ownership of the ACC and facilitate the transport of patients in and out of the center will be vital to the maintenance of operations. Figure 1 illustrates an example of how patients may be transitioned from 1 site of care to another.
Third, the logistics of establishing an ACC should include details regarding: (1) securing a location that is able to accommodate the needs of the ACC; (2) predetermining the scope of care that can be provided; (3) procuring the necessary equipment and supplies; (4) planning for an adequate number of workforce and staff members; and (5) ensuring a reliable communication plan within the local health system and with state and federal public health officials.14 Staffing shortages and communication barriers are worthy of further emphasis. Given conservative estimates that up to 35% of staff may become ill, refuse to work, or remain home to care for ill family members,15 it is essential that hospitals and regional emergency planners develop a staffing model for the ACC, well in advance of a pandemic. These may include scenarios in which the recommended provider‐to‐patient ratio can not be met. Among the essential lessons learned from the severe acute respiratory syndrome (SARS) outbreak in Toronto (Ontario, Canada) was the importance of developing redundant and reliable communication plans among the healthcare providers.16, 17
Last, healthcare workers' concerns about occupational health and safety must be addressed, and strict measures to protect providers in the ACC need to be implemented.16 This includes providing all exposed staff with adequate personal protective equipment (eg, N‐95 masks), ensuring that all staff are vaccinated against the influenza virus, and implementing strict infection control (eg, hand washing) practices.
For more information, we refer the reader to references that contain further details on our ACC exercises13 and documents that outline concepts of operations in an ACC, developed by the Joint Commission and a multiagency working group.1, 14
The Hospitalist Physician and the ACC
During an influenza pandemic, physicians from all specialties will be vital to the success of the health systems' response. General internists,18 family practitioners, and pediatricians will be overextended in the ambulatory setting to provide intravenous (IV) fluids, antibiotics, and vaccines. Emergency physicians will be called upon to provide care for a burgeoning number of patient arrivals to the Emergency Department (ED), whose acuity is higher than in nonpandemic times. These physicians' clinical expertise at their sites of practice may be severely tested. Hospitalists, given their inpatient focus will be ideally suited to provide medical care to patients admitted to the ACC.
Previous physician leadership at surge hospitals has come from multiple specialties. Case studies describing the heroic physician leadership after Hurricane Katrina and Hurricane Rita represented pediatricians, family physicians, emergency department physicians, and internists.1 In an influenza pandemic, patients in the ACC will require medical care that would, under nonsurge situations, warrant inpatient care. Hospitalists are well poised to lead the response in the ACC for pandemic flu. Hospitalists have expanded their presence into many clinical and administrative responsibilities in their local health systems,19 and the specialty of hospital medicine has evolved to incorporate many of the skills and expertise that would be required of physician leaders who manage an ACC during an influenza pandemic.
While the actual morbidity and mortality associated with the next pandemic are uncertain, it is likely that the number of patients who seek out medical care will exceed current capacity. With constrained space and resources, patients will require appropriate and safe transition to and from the hospital and the ACC. Hospitalists have become leaders in developing and promoting quality transition of care out of acute care settings.20, 21 Their expertise in optimizing this vulnerable time period in patients' healthcare experience should help hospitalists make efficient and appropriate transition care decisions even during busy times and in an alternate care location. Many hospitalists have also developed local and national expertise in quality improvement (QI) and patient safety (PS) initiatives in acute care settings.22 Hospitalists can lead the efforts to apply QI and PS practices in the ACC. These interventions should focus on the potential to be effective in improving patient care, but also consider issues such as ease of implementation, cost, and potential for harm.23
An influenza pandemic will require all levels of the healthcare system to work together to develop a coordinated approach to patient care. Previously, Kisuule et al.24 described how hospitalists can expand their role to include public health. The hospitalists' leadership in the ACC fits well with their descriptions, and hospitalists should work with local, state, and national public health officials in pandemic flu planning. Their scope of practice and clinical expertise will call on them to play key roles in recognition of the development of a pandemic; help lead the response efforts; provide education to staff, patients, and family members; develop clinical care guidelines and pathways for patients; utilize best practices in the use of antimicrobial therapy; and provide appropriate palliative care. Depending on the severity of the influenza pandemic, mortality could be considerable. Many hospitalists have expertise in palliative care at their hospitals,2527 and this skill set will be invaluable in providing compassionate end‐of‐life care to patients in the ACC.
In a pandemic, the most vulnerable patient populations will likely be disproportionately affected, including the elderly, children, and the immune‐compromised. Hospitalists who care regularly for these diverse groups of patients through the spectrum of illness and recovery will be able to address the variety of clinical and nonclinical issues that arise. If the ACC will provide care for children, hospitalists with training in pediatrics, medicine‐pediatrics, or family medicine should be available.
Additional Considerations
While many unanswered questions remain about how to best utilize the ACC, hospitalists are ideally suited to help lead planning efforts for an ACC for pandemic flu. Other issues that may require additional considerations include: (1) whether to strictly care for patients with influenza symptoms and influenza‐related illnesses or to provide care for all patients at the ACC; (2) what to do when patients refuse transfer to and from the ACC; (3) determining the optimal staffing model for patient care providers and to provide care for a wide range of age groups; (4) how the ACC will be funded; (5) how and where to store stockpiles; (6) developing redundant and coordinated communication plans; and (7) planning for reliable access to information and technology from the ACC.
Conclusions
We have introduced the concept of the ACC for the hospitalist community, and emphasized the benefits of engaging hospitalists to lead the ACC initiative at their own health organizations during pandemic flu. As hospitalists currently serve in many of these roles and possess the skills to provide care and lead these initiatives, we encourage hospitalists to contact their hospital administrators to volunteer to assist with preparation efforts.
- Joint Commission on Accreditation of Healthcare Organizations. Surge Hospitals: Providing Safe Care in Emergencies;2006. Available at: http://www.jointcommission.org/NR/rdonlyres/802E9DA4‐AE80‐4584‐A205‐48989C5BD684/0/surge_hospital.pdf. Accessed May 2009.
- .Pandemic influenza: are we ready?Disaster Manag Response.2005;3(3):61–67.
- Cumulative Number of Confirmed Human Cases of Avian Influenza A/(H5N1) Reported to WHO.2008. Available at: http://www.who.int/csr/disease/avian_influenza/country/cases_table_2008_09_10/en/index.html. Accessed May 2009.
- ,,, et al.Human infection with highly pathogenic H5N1 influenza virus.Lancet.2008;371(9622):1464–1475.
- .Preparing for the next pandemic.N Engl J Med.2005;352(18):1839–1842.
- ,,.Influenza pandemic preparedness action plan for the United States: 2002 update.Clin Infect Dis.2002;35(5):590–596.
- ,,, et al.Nonpharmaceutical interventions implemented by US cities during the 1918‐1919 influenza pandemic.JAMA.2007;298(6):644–654.
- The Health Care Response to Pandemic Influenza: Position Paper.Philadelphia, PA:American College of Physicians;2006.
- U.S. Department of Health and Human Services (HHS). HHS Pandemic Influenza Plan. November2005. Available at: http://www.hhs.gov/pandemicflu/plan. Accessed May 2009.
- Homeland Security Presidential Directive/HSPD‐21.2007. Available at: http://www.whitehouse.gov/news/releases/2007/10/20071018‐10.html. Accessed May 2009.
- ,.Pandemic influenza and the hospitalist: apocalypse when?J Hosp Med.2006;1(2):118–123.
- ,,,,.The prospect of using alternative medical care facilities in an influenza pandemic.Biosecur Bioterror.2006;4(4):384–390.
- ,,, et al.Pandemic influenza and acute care centers (ACCs): taking care of sick patients in a non‐hospital setting.Biosecur Bioterror.2008;6(4):335–348.
- ,,.Acute Care Center. Modular Emergency Medical System: Concept of Operations for the Acute Care Center (ACC).Mass Casualty Care Strategy for A Biological Terrorism Incident. May2003. Available at: http://dms.dartmouth.edu/nnemmrs/resources/surge_capacity_guidance/documents/acute_care_center__concept_ of_operations. pdf. Accessed May 2009.
- Illinois Department of Public Health. Influenza.2007. Available at: http://www.idph.state.il.us/flu/pandemicfs.htm. Accessed May 2009.
- ,,.Learning from SARS in Hong Kong and Toronto.JAMA.2004;291(20):2483–2487.
- .Planning for epidemics—the lessons of SARS.N Engl J Med.2004;350(23):2332–2334.
- .The role of internists during epidemics, outbreaks, and bioterrorist attacks.J Gen Intern Med.2007;22(1):131–136.
- ,.The expanding role of hospitalists in the United States.Swiss Med Wkly.2006;136(37‐38):591–596.
- ,,,.Promoting effective transitions of care at hospital discharge: a review of key issues for hospitalists.J Hosp Med.2007;2(5):314–323.
- ,.Executing high‐quality care transitions: a call to do it right.J Hosp Med.2007;2(5):287–290.
- .Reflections: the hospitalist movement a decade later.J Hosp Med.2006;1(4):248–252.
- ,.Implementing patient safety interventions in your hospital: what to try and what to avoid.Med Clin North Am.2008;92(2):275–293, vii‐viii.
- ,,,.Expanding the roles of hospitalist physicians to include public health.J Hosp Med.2007;2(,2):93–101.
- ,,,,,.Evaluating the California hospital initiative in palliative services.Arch Intern Med.2006;166(2):227–230.
- .Palliative care and hospitalists: a partnership for hope.J Hosp Med.2006;1(1):5–6.
- .Palliative care in hospitals.J Hosp Med.2006;1(1):21–28.

Lean Health Care
Toyota is widely recognized as one of the most successful companies in the world. Its automobiles have consistently placed at or near the top of the quality and customer satisfaction rankings published by J.D. Power and Associates and Consumer Reports. Toyota constantly focuses on the safety and well‐being of its employees and the quality of its cars through its relentless dedication to continuous improvement in everything it does. Toyota has recently become the world's number two auto manufacturer, and the company's net profit margin was more than 8 times that of the industry average. 1
How has Toyota been able to achieve such remarkable results in product quality, market share, and profit margins? Jeffrey Liker, in his book The Toyota Way, described the world‐renowned Toyota production system as supported by 2 pillars: continuous improvement and respect for people. The end result is a learning organization that values employee contributions and continuously strives to produce products of higher quality at lower cost. 1, 2 Lean production is the generic term used to describe the principles and methods of the Toyota Production System. Lean production has been implemented to improve performance in a broad array of industries, from aerospace and aluminum refining to financial services and insurance. The philosophy of lean thinking, which is derived from the Toyota Production System, is rapidly gaining a following among health care leaders, with a number of hospitals and medical groups around the country adopting a version of lean production as their systematic approach to improving quality and efficiency. In the coming years, the application of lean principles and methods could have a transformational effect on how health care is delivered, with the potential for dramatic gains in quality, safety, efficiency, and appropriateness.
LEAN CONCEPTS
To understand how lean production can be applied to improve the delivery of health care, some of the fundamental concepts and practice of lean must first be explained. 3, 4 The first step in a lean improvement initiative is to understand value as defined by our customers. 5 In clinical care delivery, external customers include patients, families, payers, and regulators. Internal customers include physicians, nurses, clerks, and others involved in the care process. What customers value usually includes care that is of high quality, safe, efficient and appropriate. The second step typically is to go to the workplace and observe firsthand how the process now operates. 6 As the flow of the process from beginning to end is seen, the observer learns to see and to understand the multiple areas of delay, inefficiency, and waste that may exist. 7, 8 A representational flowchart called a current‐state value stream map (CS VSM) is created to make the work visible and to depict graphically all the individual steps necessary to complete the process from beginning to end. It is important that the CS VSM be a factual depiction of how an entire process flows created by those who actually work in that process. The CS VSM does not state any exceptions to or provide any explanations for why certain steps are taken. It does include key measures such as process time (the actual time it takes to complete a particular step of the process), lead time (the total time it takes to complete the entire process, including waiting time), and first‐time quality (the percentage of time in which that step of the process is completed without defect); (see Figure 1).
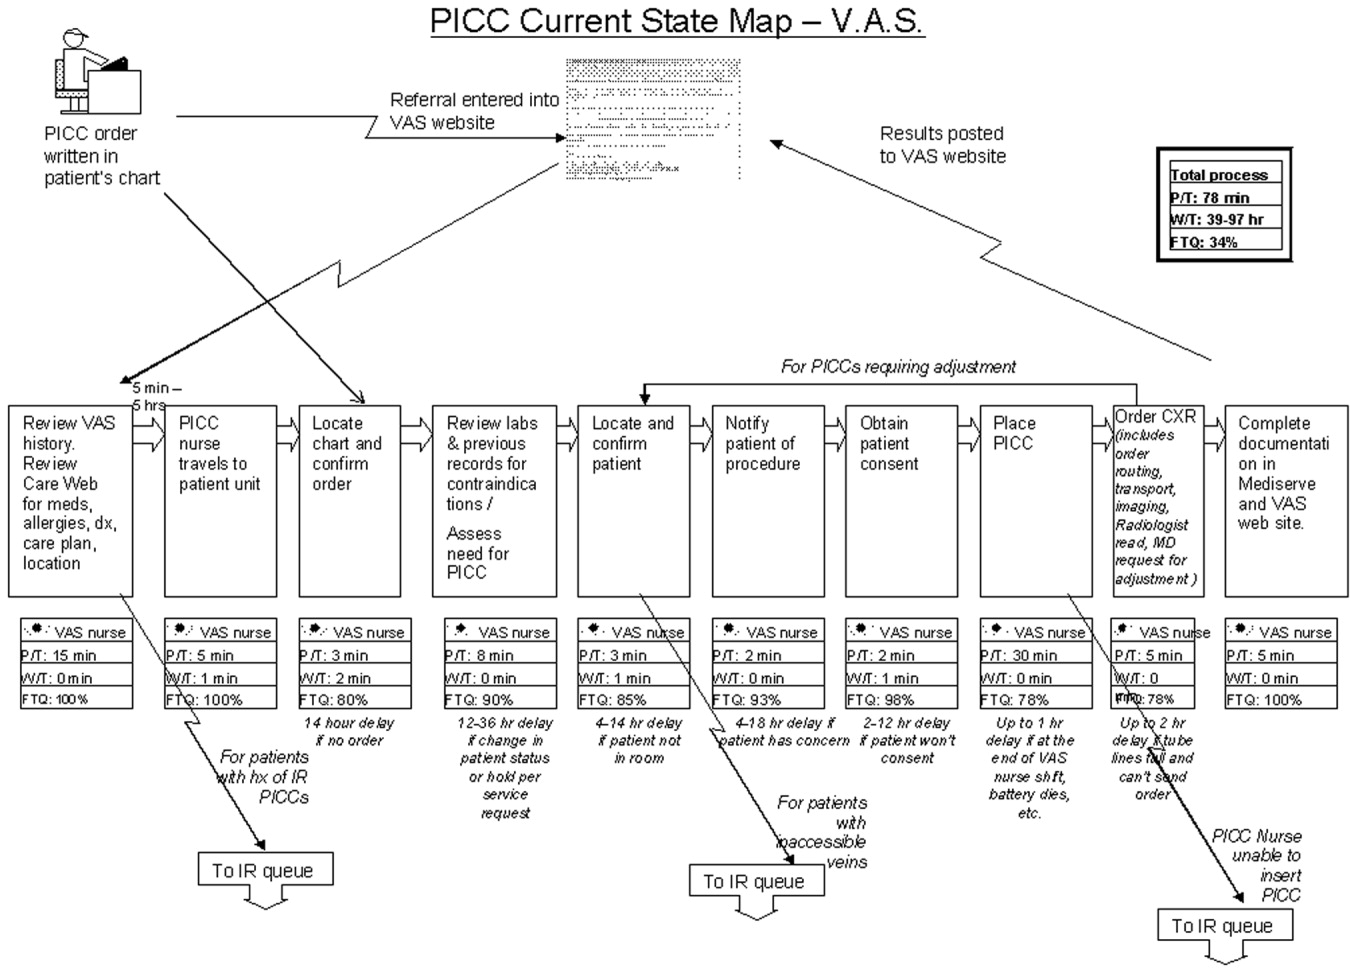
In the hands of an improvement team, the current state map becomes a powerful tool that allows participants to systematically recognize and categorize waste. The CS VSM also allows workers to visualize how much opportunity there is for improving the existing process. Working from the CS VSM, the team members can identify specific areas of waste, delay, causes of error, and inefficiency. The team then brainstorms ideas for improvement, proposing how steps of the process might be combined, eliminated, error‐proofed, or otherwise improved to transform waste into value from the customer's perspective. In the third step, the team seeks to achieve the flow state in which the steps of the process follow one another without stopping. All ideas are welcomed at this stage and are placed on the current state map itself or arrayed elsewhere for consideration. Using the ideas generated by the team, a new and better process is designed and depicted on a flow map called the future‐state value stream map (FS VSM). 9, 10 The FS VSM represents an improved and streamlined or ideal way in which the process could be accomplished, as best the team was able to envision at this point (see Figure 2). Ideally, the process described in the FS VSM also allows customers to pull value when they need goods or services provided by the organization, rather than having to do the usual requesting and waiting seen in health care and other service industries. Creating processes from which customers pull what they need is the fourth step in lean design.
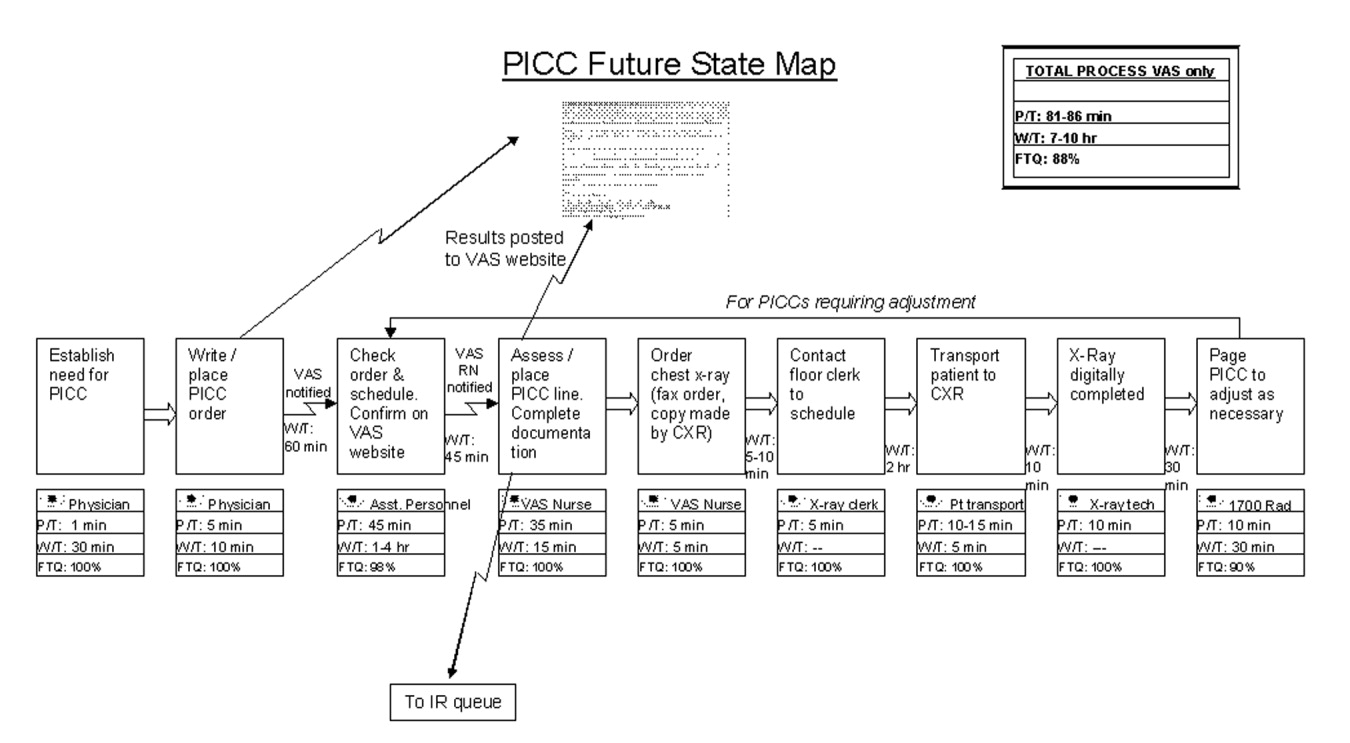
Once a future state map is devised and approved, the critical work of rapid deployment of an implementation plan for reaching the future state begins. An implementation plan explicitly identifies who is responsible for what aspect of implementation. Usually a senior leader or leadership group sponsoring the project is responsible for encouraging team members to think beyond their historical (and often political) limits and to support the team in overcoming barriers outside its control. As the individuals return to work and attempt to implement the new solutions, however, they will likely encounter areas of resistance and ambiguity that require creative solutions. The implementation phase focuses on and encourages the individual worker to experiment and work toward a solution that can be broadly adopted and disseminated for use as a standardized solution by all workers facing similar situations. 11, 12 Through this experimental development and dissemination of solutions, the agreed‐to future‐state map is revised. In this way the old future‐state map plays the role of the new current‐state map. There is an ongoing, continuous loop between the current‐ and future‐state maps through implementation and testing to develop the ideal way in which the process should flow toward the final product or service (see Figure 3). The fifth step, pursuing perfection, requires this continuous loop of all workers improving everything they do, every day. The hardest of all the steps, pursuing perfection requires an organization to commit to process improvement and the elimination of defects and waste on a daily and permanent basis. 5
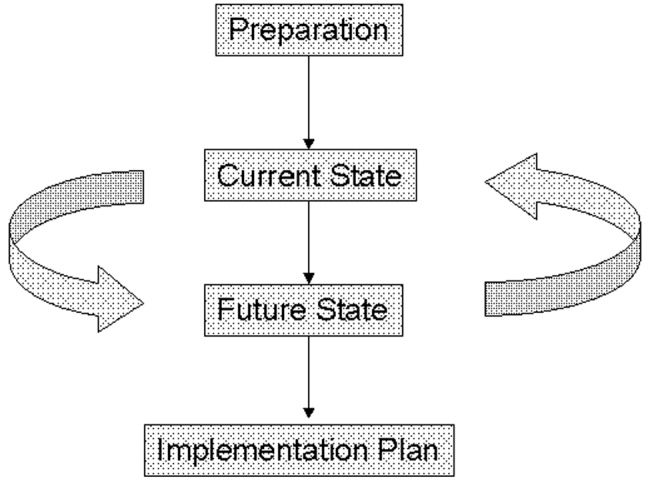
The steps outlined above provide only the basic foundations of lean concepts, of course. A detailed description of learning about and applying lean within one's own organization requires further study and help. Readers interested in learning more about value stream mapping are referred to a workbook by Mike Rother and John Shook called Learning to See, Value Stream Mapping to Create Value and Eliminate Muda. 4 Further, there are consultants with lean expertise who are available to help hospitals get started on the lean journey.
The management philosophy of lean production methods has ties to other operational and quality‐improvement models such as total quality management (TQM)/continuous quality improvement (CQI), developed by W. E. Deming, and Six Sigma, developed by Motorola and General Electric. Although there are several overlapping points of philosophy and techniques, a feature distinguishing lean from these other models is in its value stream approach to driving change and eliminating waste within the process of providing a product for the customer. Lean is unique in its focus on the specification of value from the customer's perspective and on the identification and categorization of waste and its transformation to value using specific tools. The lean approach encourages individuals within the organization (from top to bottom) to learn to see the flow of their product's process and thus to help to identify areas of waste, with the ultimate goal of creating a product with built‐in quality with the least amount of waste. Both Six Sigma and TQM/CQI focus on the delivery of a high‐quality product. Once a system has been studied and standardized, Six Sigma utilizes rigorous statistical and data measurements to drive quality improvements in product delivery. 13 Total quality management/continuous quality improvement engages the entire organization in delivering a high‐quality product from the customer's standpoint by getting everyone in the organization involved in the continuous improvement effort. 14 Lean thinking builds directly on the plandocheckact cycle of CQI but adds tools to identify and transform waste, supplies metrics of timing and resources, and, most important, focuses intently on the creation of value as defined by the customer. A more detailed comparison of lean philosophy with these other quality‐improvement management philosophies is beyond the scope of this article on the introduction of lean methods for hospitals.
DOES HEALTH CARE NEED LEAN THINKERS?
So, should health care try to emulate the successes of an automobile manufacturing company? Before answering this question, consider the following about the health care system as we know it and the significant challenges it faces.
-
A key take‐home message of the Institute of Medicine's 1999 report, To Err Is Human: Building a Safer Health System, was that errors are caused by poorly designed systems. 15
-
The Centers for Medicare and Medicaid Services (CMS) reported that the cost of health care is rising rapidly and that the rate of growth is not sustainable. 16
-
Studies by the RAND Corporation demonstrated considerable variability in the practice of medicine, raising important questions about the appropriateness and necessity of some medical care and procedures. 17, 18
-
In Crossing the Quality Chasm: a New Health System for the 21st Century, the Institute of Medicine concluded that today's health care system functions at far lower levels than it can and should and recommended 6 aims for improving the health care system: health care should be safe, effective, patient centered, timely, efficient, and equitable. 19 This report is rich in detail about what the ideal health care system should look like and how application of lean philosophy and tools can help hospitals and physicians achieve that vision.
Although these challenges reflect a view of the health care system at a very macro level, the mechanism and process of driving change will need to be initiated at the more local and organizational level. Lean production focuses on the goal of continuously transforming waste into value from the customer's perspective. It provides a rigorous and systematic approach to process improvement, error proofing, and waste reduction. Manufacturing companies such as Toyota and Alcoa and financial service organizations such as Vanguard have enjoyed tremendous success in implementing lean production, reporting gains in both quality and efficiency. 11 It is time for health care leaders and practitioners to evaluate how lean techniques can be adapted and applied to addressing the pressing challenges of safety, quality, efficiency, and appropriateness in order to improve system reliability and timeliness. As hospitalists, we are at the forefront of these challenges and therefore are in a prime position to lead the change in how health care delivery is improved continuously using a rigorous system such as the Toyota production system.
LEAN IN HEALTH CARE: EXAMPLES OF SOME EARLY RESULTS
Lean health care is still a very novel concept to most health care institutions; however, there have been some early adopters of lean health care, and some of their experiences are described here:
-
At Virginia Mason Medical Center (VMMC) in Seattle, Washington, changes implemented using lean production methods have resulted in decreased incidence of ventilator‐associated pneumoniafrom 34 cases with 5 deaths in 2002 to 4 cases with 1 death in 2004. This led to a cost reduction of nearly a half‐million dollars. VMMC has also reported increased profit margins and improvement in space utilization at its cancer center, enabling 57% more patients to be seen in the same allotted space; and it is now taking measures to decrease the number of medication errors by standardizing and mistake‐proofing the process of ordering, delivering, and administering medications, all using lean techniques. 12, 20
-
At Park Nicollet Health Services (PNHS) in Minneapolis, Minnesota, implementation of lean production has enabled improved patient access through flow improvements. Results include increasing the number of CT and MRI scans performed per day by 2 and 1, respectively; creating a capacity for 10 additional chemotherapy and antibiotic infusion patients per day in the cancer center; reducing the waiting time of patients from 122 to 52 minutes at the urgent care clinic; standardizing surgical instrument use by the general surgery group, which resulted in processing more than 40,000 fewer instruments each month. These improvements achieved through applying lean concepts have resulted in Park Nicollet being recognized by the American Medical Group Association (AMGA) with its top‐rated Acclaim Award. 21 In addition, PNHS has been able to achieve a record 3.9% operating margin, which equates to a $7.5 million profit in 2004.
-
In Pittsburgh, Pennsylvania, a group of hospitals participating in the Pittsburgh Regional Healthcare Initiative (PRHI) have implemented lean concepts to minimize the risk of developing central catheterrelated bloodstream infections. Several hospitals have been able to cut the incidence of central line infections by 50%‐90% through implementation of lean production methods. 12
-
At Community Medical Center in Missoula, Montana, a series of pilot projects have been initiated to test lean methods. Some of the early results have demonstrated a reduction in turnaround time for pathology reports from the anatomical pathology lab from 5 to 2 days, a reduction in the number of steps and therefore the time from medication order to treatment initiation from 4 hours to 12 minutes, and a reduction in time for unit clerks to process new physician orders from an average of 43 minutes to 10 minutes during the hospital's busiest hours. 22
Implications for Hospitalists
Clinical practice in the hospital setting is process rich and provides abundant opportunities for improving the delivery of patient care. As hospitalists grow in number and increase their presence in the hospital setting, many are being asked to serve on hospital management committees to develop and implement ideas that will improve operations in the inpatient venue. As they serve in this vital capacity, hospitalists should ask themselves the following question about their practice settings:
-
How often are hospital discharges prolonged because of the inability to obtain or schedule a vital test?
-
How often does a planned discharge get delayed because of poor planning for what the patient may need just prior to or after discharge?
-
How often do errors occur in medications received by or prescribed for patients after discharge?
-
How often do preventable nosocomial infections or medical errors occur in the hospital setting?
-
How often are patients readmitted to the hospital for the same illness or a related illness because of errors in communicating the accurate discharge instructions to the patient?
These are just a few examples of suboptimal care that results from suboptimal processes in many hospital settings and for which a rigorous process improvement methodology, such as lean production, could improve quality, safety, efficiency, and appropriate delivery of care. From quality and safety points of view, prevention of medical errors and nosocomial infections can lead to improved mortality and morbidity rates, as well as to significant cost savings for the health care system.
THE MICHIGAN LEAN EXPERIENCE
In the past year, the University of Michigan has begun to use lean production methods to improve the care of patients across various venues of hospitalization and flow toward discharge. Delays in placement of peripherally inserted central catheters (PICC) were associated with delays in appropriate and timely administration of intravenous medication, as well as in delays in discharges home or to extended‐care facilities (ECF) for continuation of medical care post‐hospitalization. Since the initiation of the lean PICC initiative, when adjusted for increased volume of demand, for 3 consecutive months 90%95% of the PICC lines have been inserted within 24 hours of request. This is a remarkable achievement, given that in the previous 12 months only 50%70% of PICC lines were placed within 24 hours of request. Even without adjusting for volume of demand, the lean PICC initiative has resulted in a 36% decrease in the average time to line placement and in a 50% decrease in the number of PICC referrals to interventional radiology (IR), thus decreasing the workload of a constrained resource.
As with all lean improvement projects, the entire value stream map was assessed in order to identify areas of intervention that would enhance the final product of the process for the patient (in this case, placing a PICC line as timely as possible). As we evaluated this value stream, one step in the process, occurring prior to placement of the line, appeared to be significantly wasteful: when the PICC nurse needed to search for data (such as locating a patient's chart for the order and reviewing labs and medication records) and to ensure that the patient was in his/her room and prepared for line placement. This step appeared to be inefficient use of the time of technically skilled individuals. The future state map of this process implemented the addition of an assisting individual who would ensure that these prework issues were prepared and completed in advance for the PICC nurses, thus making maximum use of the time of these skilled individuals in placing PICC lines, not in performing unskilled work. Another area where an intervention was believed beneficial was streamlining the process of chest x‐ray (CXR) ordering and reading in order to obtain PICC line confirmation. Performance of the previous process was not standardized and led to delays. The future state proposed a standard method of writing an order for a CXR, a standard method for getting that order to the radiology department, and a standard method for reading the films for dictation. This prevented the confusion and rework that had previously occurred. A last example of an intervention is that the PICC nurses began to internally defer to more experienced nurses if a less experienced nurse could not successfully place a PICC line in a patient. Previously, an unsuccessful attempt at bedside PICC placement warranted an IR referral, thus increasing the demand on an already constrained resource. This intervention by the PICC nurses drove down referrals to the IR suite by 50%. Although this may have led to a small increase in rework early in the process, it has led to a significant reduction in work downstream in the process. Thus, we believe that the overall work flow process has been served well by this intervention. As depicted in Figure 3, the lean process improvement method seeks to have continuous improvement, with the old future‐state map taking on the role of the new current‐state map. Since the initial development of these value stream maps, we have been working toward developing and implementing new areas of intervention, which will lead to new future‐state maps and to further improvement of this process, as the demand for PICC lines continues to rise.
Another critical segment in the care of hospitalized patients is the discharge process, including coordination of care to an outpatient or extended care facility (ECF) setting, which has several potential areas of disconnect that could result inpatients having untoward complications requiring rehospitalization, higher morbidity, or prolongation of suffering from their illnesses. The University of Michigan sees a tremendous opportunity to make a significant impact on patient care in this realm and has just initiated a lean project on the coordination of care. Team members on this project will be relevant process stakeholders, including those representing hospitalists, discharge planning, nursing, social work, a related home nursing company, a home infusion service, an ECF, ambulatory care, pharmacy, case management, nutrition, utilization review, patients and their families, and clinic physicians. The overall goal of the project is to optimize patient care from hospitalization to discharge and transfer of care to the outpatient setting.
CHALLENGES
The application of management philosophy and operational concepts from the manufacturing industry to health care may be a conceptual stretch for many in the health care community. Hence, both cultural and practical barriers likely will have to be overcome before lean techniques can enjoy widespread use.
On the cultural front, it will be necessary to overcome the most likely arguments against the applicability of lean manufacturing concepts to the health care sector such as people are not automobiles and each patient is unique. Yet there has been considerable success in applying lean production concepts in other service industries such as insurance and financial services, with exceptionally favorable results reported, 11, 23 and early adopters of the lean concept in health care have credited lean management concepts with their early successes, as described above.
There are also the organizational and professional cultural differences that separate the health care industry from other sectors that have incorporated lean into their practice. Health care professionals, however, are highly dedicated and motivated to providing their patients with the best possible care and are already accustomed to constant experimentation and new data driving change in the way that care is provided. Lean production concepts and tools should not be foreign to health care professionals who already understand systems thinking.
Other challenges may come from those arguing that lean is just cutting and layoffs in disguise. It is often feared that when an organization decides to go lean, the underlying goals are to cut costs and to lay off a segment of the labor force. The term lean is often misunderstood in this respect, and it is important that the phrase be explained accurately in its context and application. Some individuals wonder whether the implementation of lean production efforts means they are working themselves out of employment. A key component of the successful application of lean production methods is assuring that as process flows and operations are improved, job descriptions and duties of individuals may be redirected, but their employment will not be lost
Finally, the multiple segments of health care are often fragmented into individually functioning units operating as autonomous silos. Lean teaches that optimizing the performance of an individual area is insufficient, that the entire process flow, which requires cooperation of multiple operating units, must be improved in order to achieve meaningful and sustained improvement in performance. This is a new way of thinking that requires behavioral change for the many who are used to thinking narrowly about the performance of their own unit. The larger organization must recognize and eliminate disincentives to breaking down the silo mentality. In health care organizations, however, providers and staff across functional departments share the same ultimate goal of delivering the very best care possible to patients within the constraint of available resources. Lean provides a management philosophy, powerful tools, and an accountability structure for working toward this goal. The organization, however, must be committed from the highest levels to making the lean transformation. 1
Ultimately, health care shares with manufacturing companies such as Toyota the challenge of producing the highest‐quality products (clinical outcomes) within an environment of constrained resources, while managing a complex business operation and assuring the safety and satisfaction of workers and customers (patients). Both industries need highly reliable systems that will ultimately lead to higher quality and greater safety, efficiency, and appropriateness.
CONCLUSION
The health care industry should learn about and consider adoption of lean techniques in order to improve its processes. More specifically, hospitals are prime locales for reaping the benefits of implementation of lean production, which can significantly affect how health care is delivered to patients. Toyota and other lean exemplars in the manufacturing industry have achieved a high level of success by utilizing the practice of lean. Early results from health care organizations suggest that utilizing lean production methods can lead to substantial improvements in the quality and efficiency of health care. To determine if the magnitude of success experienced by Toyota and other lean exemplars can also be achieved in the health care sector, it will be necessary to continuously test and evaluate the impact lean health care can have. In the hospital setting, where hospitalists are at the forefront of delivering care, it is incumbent on the hospitalist community to evaluate whether these techniques can make a difference in the quality, efficiency, and safety of the care provided to patients.
Lean thinking is still a novel idea to those in the health care sector, and as early adopters of this promising management model, we are very optimistic about the benefits of applying lean concepts in our hospital. Some of the first published reports and results presented on the benefits of lean in individual organizations are encouraging; however, as health care is a scientific community, we believe that future work should undergo rigorous evaluation on the benefits of lean and that such future works should be shared among the health care community through peer‐reviewed and published works.
Acknowledgements
The authors wish to thank the peripherally inserted central catheter (PICC) team for the use of their current and future state maps on PICC line placements that were created for the lean project.
- . The Toyota Way. Madison, Wisc: McGraw‐Hill; 2004.
- , . Decoding the DNA of the Toyota Production System. Harv Bus Rev. 1999; 77( 5): 97–.
- , . The Complete Lean Enterprise, Value Stream Mapping for Administrative and Office Processes. New York, NY: Productivity Press; 2004.
- , . Learning to See, Value‐Stream Mapping to Create Value and Eliminate Muda. Brookline, Mass: The Lean Enterprise Institute, Inc; 2003.
- , . Lean Thinking, Banish Waste and Create Wealth in Your Corporation. 2nd ed. New York, NY: Free Press; 2003.
- NAM. Getting started on the lean journey: first, take a walk! [NAM.org Web site]. Available at http://www.nam.org/s_nam/doc1.asp?CID=200253sect 15.
- . Fixing health care from the inside, today. Harv Bus Rev. 2005; 83( 9): 78– 91.
- Six Sigma—what is Six Sigma? Available at http://www.isixsigma.com/sixsigma/six_sigma.asp. Accessed 2005.
- Overview of the Continuous Quality Improvement Program. 2005. Available at http://www.med.umich.edu/i/exec/cqi/overview.htm. Accessed 2005.
- Kohn LT , Corrigan J , Donaldson MS , eds. To Err Is human: Building a Safer Health System. Washington, DC: National Academy Press; 2000.
- . Testimony of Mark B. McClellan, MD, PhD, Administrator, before the House Ways and Means Subcommittee on Health on Value‐Based Purchasing for Physicians under Medicare. Washington, DC: Centers for Medicare July 21, 2005.
- , , , et al. Does inappropriate use explain geographic variations in the use of health care services? A study of three procedures.[see comment]. JAMA. 1987; 258: 2533– 2537.
- , , , et al. Variations in the use of medical and surgical services by the Medicare population. N Engl J Med. 1986; 314( 5): 285– 290.
- Committee on Quality Health Care in America, Institute of Medicine. Crossing the Quality Chasm: a New Health System for the 21st Century. Washington, DC: National Academy Press; 2001.
- Institute for Healthcare Improvement. Going Lean in Health Care. White Paper. Boston, MA: Institute for Healthcare Improvement; January and February 2005.
- Lean Production at Park Nicollet. Available at http://www.parknicollet.com/media/leanProduction.cfm. Accessed March, 2005.
- , , . Reducing waste and errors: piloting lean principles at Intermountain Healthcare. Jt Comm J Qual Patient Saf. 2005; 31( 5): 249– 257.
- . The lean service machine. Harv Bus Rev. 2003; 81( 10): 123– 129, 38 .
Toyota is widely recognized as one of the most successful companies in the world. Its automobiles have consistently placed at or near the top of the quality and customer satisfaction rankings published by J.D. Power and Associates and Consumer Reports. Toyota constantly focuses on the safety and well‐being of its employees and the quality of its cars through its relentless dedication to continuous improvement in everything it does. Toyota has recently become the world's number two auto manufacturer, and the company's net profit margin was more than 8 times that of the industry average. 1
How has Toyota been able to achieve such remarkable results in product quality, market share, and profit margins? Jeffrey Liker, in his book The Toyota Way, described the world‐renowned Toyota production system as supported by 2 pillars: continuous improvement and respect for people. The end result is a learning organization that values employee contributions and continuously strives to produce products of higher quality at lower cost. 1, 2 Lean production is the generic term used to describe the principles and methods of the Toyota Production System. Lean production has been implemented to improve performance in a broad array of industries, from aerospace and aluminum refining to financial services and insurance. The philosophy of lean thinking, which is derived from the Toyota Production System, is rapidly gaining a following among health care leaders, with a number of hospitals and medical groups around the country adopting a version of lean production as their systematic approach to improving quality and efficiency. In the coming years, the application of lean principles and methods could have a transformational effect on how health care is delivered, with the potential for dramatic gains in quality, safety, efficiency, and appropriateness.
LEAN CONCEPTS
To understand how lean production can be applied to improve the delivery of health care, some of the fundamental concepts and practice of lean must first be explained. 3, 4 The first step in a lean improvement initiative is to understand value as defined by our customers. 5 In clinical care delivery, external customers include patients, families, payers, and regulators. Internal customers include physicians, nurses, clerks, and others involved in the care process. What customers value usually includes care that is of high quality, safe, efficient and appropriate. The second step typically is to go to the workplace and observe firsthand how the process now operates. 6 As the flow of the process from beginning to end is seen, the observer learns to see and to understand the multiple areas of delay, inefficiency, and waste that may exist. 7, 8 A representational flowchart called a current‐state value stream map (CS VSM) is created to make the work visible and to depict graphically all the individual steps necessary to complete the process from beginning to end. It is important that the CS VSM be a factual depiction of how an entire process flows created by those who actually work in that process. The CS VSM does not state any exceptions to or provide any explanations for why certain steps are taken. It does include key measures such as process time (the actual time it takes to complete a particular step of the process), lead time (the total time it takes to complete the entire process, including waiting time), and first‐time quality (the percentage of time in which that step of the process is completed without defect); (see Figure 1).
In the hands of an improvement team, the current state map becomes a powerful tool that allows participants to systematically recognize and categorize waste. The CS VSM also allows workers to visualize how much opportunity there is for improving the existing process. Working from the CS VSM, the team members can identify specific areas of waste, delay, causes of error, and inefficiency. The team then brainstorms ideas for improvement, proposing how steps of the process might be combined, eliminated, error‐proofed, or otherwise improved to transform waste into value from the customer's perspective. In the third step, the team seeks to achieve the flow state in which the steps of the process follow one another without stopping. All ideas are welcomed at this stage and are placed on the current state map itself or arrayed elsewhere for consideration. Using the ideas generated by the team, a new and better process is designed and depicted on a flow map called the future‐state value stream map (FS VSM). 9, 10 The FS VSM represents an improved and streamlined or ideal way in which the process could be accomplished, as best the team was able to envision at this point (see Figure 2). Ideally, the process described in the FS VSM also allows customers to pull value when they need goods or services provided by the organization, rather than having to do the usual requesting and waiting seen in health care and other service industries. Creating processes from which customers pull what they need is the fourth step in lean design.
Once a future state map is devised and approved, the critical work of rapid deployment of an implementation plan for reaching the future state begins. An implementation plan explicitly identifies who is responsible for what aspect of implementation. Usually a senior leader or leadership group sponsoring the project is responsible for encouraging team members to think beyond their historical (and often political) limits and to support the team in overcoming barriers outside its control. As the individuals return to work and attempt to implement the new solutions, however, they will likely encounter areas of resistance and ambiguity that require creative solutions. The implementation phase focuses on and encourages the individual worker to experiment and work toward a solution that can be broadly adopted and disseminated for use as a standardized solution by all workers facing similar situations. 11, 12 Through this experimental development and dissemination of solutions, the agreed‐to future‐state map is revised. In this way the old future‐state map plays the role of the new current‐state map. There is an ongoing, continuous loop between the current‐ and future‐state maps through implementation and testing to develop the ideal way in which the process should flow toward the final product or service (see Figure 3). The fifth step, pursuing perfection, requires this continuous loop of all workers improving everything they do, every day. The hardest of all the steps, pursuing perfection requires an organization to commit to process improvement and the elimination of defects and waste on a daily and permanent basis. 5
The steps outlined above provide only the basic foundations of lean concepts, of course. A detailed description of learning about and applying lean within one's own organization requires further study and help. Readers interested in learning more about value stream mapping are referred to a workbook by Mike Rother and John Shook called Learning to See, Value Stream Mapping to Create Value and Eliminate Muda. 4 Further, there are consultants with lean expertise who are available to help hospitals get started on the lean journey.
The management philosophy of lean production methods has ties to other operational and quality‐improvement models such as total quality management (TQM)/continuous quality improvement (CQI), developed by W. E. Deming, and Six Sigma, developed by Motorola and General Electric. Although there are several overlapping points of philosophy and techniques, a feature distinguishing lean from these other models is in its value stream approach to driving change and eliminating waste within the process of providing a product for the customer. Lean is unique in its focus on the specification of value from the customer's perspective and on the identification and categorization of waste and its transformation to value using specific tools. The lean approach encourages individuals within the organization (from top to bottom) to learn to see the flow of their product's process and thus to help to identify areas of waste, with the ultimate goal of creating a product with built‐in quality with the least amount of waste. Both Six Sigma and TQM/CQI focus on the delivery of a high‐quality product. Once a system has been studied and standardized, Six Sigma utilizes rigorous statistical and data measurements to drive quality improvements in product delivery. 13 Total quality management/continuous quality improvement engages the entire organization in delivering a high‐quality product from the customer's standpoint by getting everyone in the organization involved in the continuous improvement effort. 14 Lean thinking builds directly on the plandocheckact cycle of CQI but adds tools to identify and transform waste, supplies metrics of timing and resources, and, most important, focuses intently on the creation of value as defined by the customer. A more detailed comparison of lean philosophy with these other quality‐improvement management philosophies is beyond the scope of this article on the introduction of lean methods for hospitals.
DOES HEALTH CARE NEED LEAN THINKERS?
So, should health care try to emulate the successes of an automobile manufacturing company? Before answering this question, consider the following about the health care system as we know it and the significant challenges it faces.
-
A key take‐home message of the Institute of Medicine's 1999 report, To Err Is Human: Building a Safer Health System, was that errors are caused by poorly designed systems. 15
-
The Centers for Medicare and Medicaid Services (CMS) reported that the cost of health care is rising rapidly and that the rate of growth is not sustainable. 16
-
Studies by the RAND Corporation demonstrated considerable variability in the practice of medicine, raising important questions about the appropriateness and necessity of some medical care and procedures. 17, 18
-
In Crossing the Quality Chasm: a New Health System for the 21st Century, the Institute of Medicine concluded that today's health care system functions at far lower levels than it can and should and recommended 6 aims for improving the health care system: health care should be safe, effective, patient centered, timely, efficient, and equitable. 19 This report is rich in detail about what the ideal health care system should look like and how application of lean philosophy and tools can help hospitals and physicians achieve that vision.
Although these challenges reflect a view of the health care system at a very macro level, the mechanism and process of driving change will need to be initiated at the more local and organizational level. Lean production focuses on the goal of continuously transforming waste into value from the customer's perspective. It provides a rigorous and systematic approach to process improvement, error proofing, and waste reduction. Manufacturing companies such as Toyota and Alcoa and financial service organizations such as Vanguard have enjoyed tremendous success in implementing lean production, reporting gains in both quality and efficiency. 11 It is time for health care leaders and practitioners to evaluate how lean techniques can be adapted and applied to addressing the pressing challenges of safety, quality, efficiency, and appropriateness in order to improve system reliability and timeliness. As hospitalists, we are at the forefront of these challenges and therefore are in a prime position to lead the change in how health care delivery is improved continuously using a rigorous system such as the Toyota production system.
LEAN IN HEALTH CARE: EXAMPLES OF SOME EARLY RESULTS
Lean health care is still a very novel concept to most health care institutions; however, there have been some early adopters of lean health care, and some of their experiences are described here:
-
At Virginia Mason Medical Center (VMMC) in Seattle, Washington, changes implemented using lean production methods have resulted in decreased incidence of ventilator‐associated pneumoniafrom 34 cases with 5 deaths in 2002 to 4 cases with 1 death in 2004. This led to a cost reduction of nearly a half‐million dollars. VMMC has also reported increased profit margins and improvement in space utilization at its cancer center, enabling 57% more patients to be seen in the same allotted space; and it is now taking measures to decrease the number of medication errors by standardizing and mistake‐proofing the process of ordering, delivering, and administering medications, all using lean techniques. 12, 20
-
At Park Nicollet Health Services (PNHS) in Minneapolis, Minnesota, implementation of lean production has enabled improved patient access through flow improvements. Results include increasing the number of CT and MRI scans performed per day by 2 and 1, respectively; creating a capacity for 10 additional chemotherapy and antibiotic infusion patients per day in the cancer center; reducing the waiting time of patients from 122 to 52 minutes at the urgent care clinic; standardizing surgical instrument use by the general surgery group, which resulted in processing more than 40,000 fewer instruments each month. These improvements achieved through applying lean concepts have resulted in Park Nicollet being recognized by the American Medical Group Association (AMGA) with its top‐rated Acclaim Award. 21 In addition, PNHS has been able to achieve a record 3.9% operating margin, which equates to a $7.5 million profit in 2004.
-
In Pittsburgh, Pennsylvania, a group of hospitals participating in the Pittsburgh Regional Healthcare Initiative (PRHI) have implemented lean concepts to minimize the risk of developing central catheterrelated bloodstream infections. Several hospitals have been able to cut the incidence of central line infections by 50%‐90% through implementation of lean production methods. 12
-
At Community Medical Center in Missoula, Montana, a series of pilot projects have been initiated to test lean methods. Some of the early results have demonstrated a reduction in turnaround time for pathology reports from the anatomical pathology lab from 5 to 2 days, a reduction in the number of steps and therefore the time from medication order to treatment initiation from 4 hours to 12 minutes, and a reduction in time for unit clerks to process new physician orders from an average of 43 minutes to 10 minutes during the hospital's busiest hours. 22
Implications for Hospitalists
Clinical practice in the hospital setting is process rich and provides abundant opportunities for improving the delivery of patient care. As hospitalists grow in number and increase their presence in the hospital setting, many are being asked to serve on hospital management committees to develop and implement ideas that will improve operations in the inpatient venue. As they serve in this vital capacity, hospitalists should ask themselves the following question about their practice settings:
-
How often are hospital discharges prolonged because of the inability to obtain or schedule a vital test?
-
How often does a planned discharge get delayed because of poor planning for what the patient may need just prior to or after discharge?
-
How often do errors occur in medications received by or prescribed for patients after discharge?
-
How often do preventable nosocomial infections or medical errors occur in the hospital setting?
-
How often are patients readmitted to the hospital for the same illness or a related illness because of errors in communicating the accurate discharge instructions to the patient?
These are just a few examples of suboptimal care that results from suboptimal processes in many hospital settings and for which a rigorous process improvement methodology, such as lean production, could improve quality, safety, efficiency, and appropriate delivery of care. From quality and safety points of view, prevention of medical errors and nosocomial infections can lead to improved mortality and morbidity rates, as well as to significant cost savings for the health care system.
THE MICHIGAN LEAN EXPERIENCE
In the past year, the University of Michigan has begun to use lean production methods to improve the care of patients across various venues of hospitalization and flow toward discharge. Delays in placement of peripherally inserted central catheters (PICC) were associated with delays in appropriate and timely administration of intravenous medication, as well as in delays in discharges home or to extended‐care facilities (ECF) for continuation of medical care post‐hospitalization. Since the initiation of the lean PICC initiative, when adjusted for increased volume of demand, for 3 consecutive months 90%95% of the PICC lines have been inserted within 24 hours of request. This is a remarkable achievement, given that in the previous 12 months only 50%70% of PICC lines were placed within 24 hours of request. Even without adjusting for volume of demand, the lean PICC initiative has resulted in a 36% decrease in the average time to line placement and in a 50% decrease in the number of PICC referrals to interventional radiology (IR), thus decreasing the workload of a constrained resource.
As with all lean improvement projects, the entire value stream map was assessed in order to identify areas of intervention that would enhance the final product of the process for the patient (in this case, placing a PICC line as timely as possible). As we evaluated this value stream, one step in the process, occurring prior to placement of the line, appeared to be significantly wasteful: when the PICC nurse needed to search for data (such as locating a patient's chart for the order and reviewing labs and medication records) and to ensure that the patient was in his/her room and prepared for line placement. This step appeared to be inefficient use of the time of technically skilled individuals. The future state map of this process implemented the addition of an assisting individual who would ensure that these prework issues were prepared and completed in advance for the PICC nurses, thus making maximum use of the time of these skilled individuals in placing PICC lines, not in performing unskilled work. Another area where an intervention was believed beneficial was streamlining the process of chest x‐ray (CXR) ordering and reading in order to obtain PICC line confirmation. Performance of the previous process was not standardized and led to delays. The future state proposed a standard method of writing an order for a CXR, a standard method for getting that order to the radiology department, and a standard method for reading the films for dictation. This prevented the confusion and rework that had previously occurred. A last example of an intervention is that the PICC nurses began to internally defer to more experienced nurses if a less experienced nurse could not successfully place a PICC line in a patient. Previously, an unsuccessful attempt at bedside PICC placement warranted an IR referral, thus increasing the demand on an already constrained resource. This intervention by the PICC nurses drove down referrals to the IR suite by 50%. Although this may have led to a small increase in rework early in the process, it has led to a significant reduction in work downstream in the process. Thus, we believe that the overall work flow process has been served well by this intervention. As depicted in Figure 3, the lean process improvement method seeks to have continuous improvement, with the old future‐state map taking on the role of the new current‐state map. Since the initial development of these value stream maps, we have been working toward developing and implementing new areas of intervention, which will lead to new future‐state maps and to further improvement of this process, as the demand for PICC lines continues to rise.
Another critical segment in the care of hospitalized patients is the discharge process, including coordination of care to an outpatient or extended care facility (ECF) setting, which has several potential areas of disconnect that could result inpatients having untoward complications requiring rehospitalization, higher morbidity, or prolongation of suffering from their illnesses. The University of Michigan sees a tremendous opportunity to make a significant impact on patient care in this realm and has just initiated a lean project on the coordination of care. Team members on this project will be relevant process stakeholders, including those representing hospitalists, discharge planning, nursing, social work, a related home nursing company, a home infusion service, an ECF, ambulatory care, pharmacy, case management, nutrition, utilization review, patients and their families, and clinic physicians. The overall goal of the project is to optimize patient care from hospitalization to discharge and transfer of care to the outpatient setting.
CHALLENGES
The application of management philosophy and operational concepts from the manufacturing industry to health care may be a conceptual stretch for many in the health care community. Hence, both cultural and practical barriers likely will have to be overcome before lean techniques can enjoy widespread use.
On the cultural front, it will be necessary to overcome the most likely arguments against the applicability of lean manufacturing concepts to the health care sector such as people are not automobiles and each patient is unique. Yet there has been considerable success in applying lean production concepts in other service industries such as insurance and financial services, with exceptionally favorable results reported, 11, 23 and early adopters of the lean concept in health care have credited lean management concepts with their early successes, as described above.
There are also the organizational and professional cultural differences that separate the health care industry from other sectors that have incorporated lean into their practice. Health care professionals, however, are highly dedicated and motivated to providing their patients with the best possible care and are already accustomed to constant experimentation and new data driving change in the way that care is provided. Lean production concepts and tools should not be foreign to health care professionals who already understand systems thinking.
Other challenges may come from those arguing that lean is just cutting and layoffs in disguise. It is often feared that when an organization decides to go lean, the underlying goals are to cut costs and to lay off a segment of the labor force. The term lean is often misunderstood in this respect, and it is important that the phrase be explained accurately in its context and application. Some individuals wonder whether the implementation of lean production efforts means they are working themselves out of employment. A key component of the successful application of lean production methods is assuring that as process flows and operations are improved, job descriptions and duties of individuals may be redirected, but their employment will not be lost
Finally, the multiple segments of health care are often fragmented into individually functioning units operating as autonomous silos. Lean teaches that optimizing the performance of an individual area is insufficient, that the entire process flow, which requires cooperation of multiple operating units, must be improved in order to achieve meaningful and sustained improvement in performance. This is a new way of thinking that requires behavioral change for the many who are used to thinking narrowly about the performance of their own unit. The larger organization must recognize and eliminate disincentives to breaking down the silo mentality. In health care organizations, however, providers and staff across functional departments share the same ultimate goal of delivering the very best care possible to patients within the constraint of available resources. Lean provides a management philosophy, powerful tools, and an accountability structure for working toward this goal. The organization, however, must be committed from the highest levels to making the lean transformation. 1
Ultimately, health care shares with manufacturing companies such as Toyota the challenge of producing the highest‐quality products (clinical outcomes) within an environment of constrained resources, while managing a complex business operation and assuring the safety and satisfaction of workers and customers (patients). Both industries need highly reliable systems that will ultimately lead to higher quality and greater safety, efficiency, and appropriateness.
CONCLUSION
The health care industry should learn about and consider adoption of lean techniques in order to improve its processes. More specifically, hospitals are prime locales for reaping the benefits of implementation of lean production, which can significantly affect how health care is delivered to patients. Toyota and other lean exemplars in the manufacturing industry have achieved a high level of success by utilizing the practice of lean. Early results from health care organizations suggest that utilizing lean production methods can lead to substantial improvements in the quality and efficiency of health care. To determine if the magnitude of success experienced by Toyota and other lean exemplars can also be achieved in the health care sector, it will be necessary to continuously test and evaluate the impact lean health care can have. In the hospital setting, where hospitalists are at the forefront of delivering care, it is incumbent on the hospitalist community to evaluate whether these techniques can make a difference in the quality, efficiency, and safety of the care provided to patients.
Lean thinking is still a novel idea to those in the health care sector, and as early adopters of this promising management model, we are very optimistic about the benefits of applying lean concepts in our hospital. Some of the first published reports and results presented on the benefits of lean in individual organizations are encouraging; however, as health care is a scientific community, we believe that future work should undergo rigorous evaluation on the benefits of lean and that such future works should be shared among the health care community through peer‐reviewed and published works.
Acknowledgements
The authors wish to thank the peripherally inserted central catheter (PICC) team for the use of their current and future state maps on PICC line placements that were created for the lean project.
- . The Toyota Way. Madison, Wisc: McGraw‐Hill; 2004.
- , . Decoding the DNA of the Toyota Production System. Harv Bus Rev. 1999; 77( 5): 97–.
- , . The Complete Lean Enterprise, Value Stream Mapping for Administrative and Office Processes. New York, NY: Productivity Press; 2004.
- , . Learning to See, Value‐Stream Mapping to Create Value and Eliminate Muda. Brookline, Mass: The Lean Enterprise Institute, Inc; 2003.
- , . Lean Thinking, Banish Waste and Create Wealth in Your Corporation. 2nd ed. New York, NY: Free Press; 2003.
- NAM. Getting started on the lean journey: first, take a walk! [NAM.org Web site]. Available at http://www.nam.org/s_nam/doc1.asp?CID=200253sect 15.
- . Fixing health care from the inside, today. Harv Bus Rev. 2005; 83( 9): 78– 91.
- Six Sigma—what is Six Sigma? Available at http://www.isixsigma.com/sixsigma/six_sigma.asp. Accessed 2005.
- Overview of the Continuous Quality Improvement Program. 2005. Available at http://www.med.umich.edu/i/exec/cqi/overview.htm. Accessed 2005.
- Kohn LT , Corrigan J , Donaldson MS , eds. To Err Is human: Building a Safer Health System. Washington, DC: National Academy Press; 2000.
- . Testimony of Mark B. McClellan, MD, PhD, Administrator, before the House Ways and Means Subcommittee on Health on Value‐Based Purchasing for Physicians under Medicare. Washington, DC: Centers for Medicare July 21, 2005.
- , , , et al. Does inappropriate use explain geographic variations in the use of health care services? A study of three procedures.[see comment]. JAMA. 1987; 258: 2533– 2537.
- , , , et al. Variations in the use of medical and surgical services by the Medicare population. N Engl J Med. 1986; 314( 5): 285– 290.
- Committee on Quality Health Care in America, Institute of Medicine. Crossing the Quality Chasm: a New Health System for the 21st Century. Washington, DC: National Academy Press; 2001.
- Institute for Healthcare Improvement. Going Lean in Health Care. White Paper. Boston, MA: Institute for Healthcare Improvement; January and February 2005.
- Lean Production at Park Nicollet. Available at http://www.parknicollet.com/media/leanProduction.cfm. Accessed March, 2005.
- , , . Reducing waste and errors: piloting lean principles at Intermountain Healthcare. Jt Comm J Qual Patient Saf. 2005; 31( 5): 249– 257.
- . The lean service machine. Harv Bus Rev. 2003; 81( 10): 123– 129, 38 .
