User login
Pediatric Admission and Readmission
Patient outcomes tend to be worse for adults admitted on the weekend compared to the weekday.[1, 2, 3, 4] In pediatric populations, urgent surgeries on weekends are associated with increased morbidity and mortality[5]; however, studies of mortality and admission timing in the pediatric critical care setting are mixed.[6, 7] Hospital readmission is considered a potential marker of hospital quality. We hypothesized that (1) being admitted and (2) being discharged on the weekend would adversely affect 30‐day unplanned readmission for pediatric patients.
METHODS
Population
All discharges from January 1, 2006 through December 31, 2012 from C. S. Mott Children's Hospital were initially eligible. All hospitalizations were considered potential index admissions; therefore, children may contribute more than 1 hospitalization to the dataset. We excluded hospitalizations in which the patient died, was transferred to another institution, was discharged against medical advice, or was discharged to hospice. Newborns admitted to a normal newborn service were also excluded, as they do not represent a typical hospitalization for illness. Among newborns admitted to a higher‐intensity clinical service (eg, special care nursery or neonatal intensive care), we also excluded newborns with a length of stay <5 days, given the typical length of stay of up to 4 days for uncomplicated delivery via Cesarean section that would indicate infants for whom precautionary measures had been taken but there was low estimated health risk. We used International Classification of Diseases, Ninth Revision codes to identify children with complex chronic conditions (CCCs) and technology dependency.[8]
Outcome
We examined unplanned readmission within 30 days of discharge. We defined unplanned readmission as a readmission that was not entered into the hospital registration system at least 24 hours before discharge.[9] Additionally, we performed sensitive analyses examining any 30‐day readmissions.
Statistical Analysis
We fit multivariable logistic regression models for 30‐day unplanned readmission, with the primary predictor of either weekend (Saturday or Sunday) admission or weekend discharge (in separate models). We adjusted for patient age, gender, race/ethnicity, source of admission, insurance, and length of stay. We also adjusted for patient chronic illness complexity using the number of CCCs and technology dependency (yes/no). Variance in all analyses was clustered on individual patients.
RESULTS
We included a total of 55,383 hospitalizations from 32,112 patients (see Supporting Appendix Figure in the online version of this article for cohort derivation). All‐cause 30‐day readmissions occurred in 14.9% of hospital discharges; the 30‐day unplanned readmission rate was 10.3% (see the Supporting Appendix Table in the online version of this article for demographic characteristics).
Weekend Admission
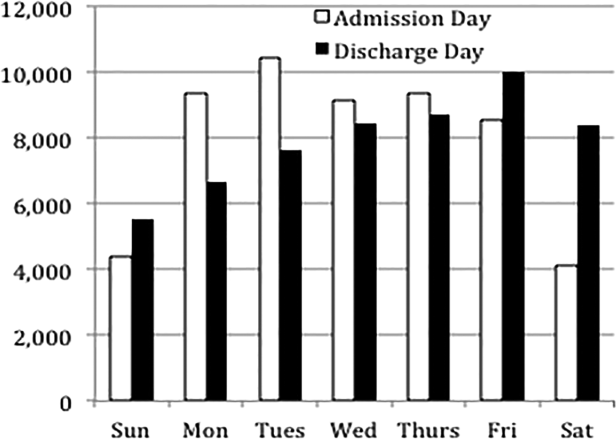
Overall, 82% of admissions occurred during the week, with Tuesday as the highest admitting volume day (Figure 1). Children admitted on the weekend had higher odds of unplanned readmission compared to children admitted on weekdays (unadjusted odds ratio [OR]=1.15 [95% confidence interval {CI}: 1.07‐1.24]). Adjusting the analysis for age, gender, race/ethnicity, insurance, length of stay, CCCs, and technology dependency, higher odds of readmission remains significantly higher than weekday admission (adjusted OR=1.09 [95% CI: 1.004‐1.18]) (Table 1). Age, admission source, payer, length of stay, number of complex chronic conditions, and technology dependency were also significantly associated with readmission in the weekend admission model (see the Supporting Appendix Table in the online version of this article). A sensitivity analysis examining the association of weekend admission and readmission within different subpopulations of children with varying numbers of CCCs (ie, among children without CCCs, with 1 CCC, 2 CCCs, and 3+ CCCs) showed that the association remains the same in each subgroup. Further, a sensitivity analysis examining odds of any 30‐day readmission was similar to the primary analysis with higher odds of readmission in adjusted analysis (adjusted OR=1.09 [95% CI: 1.02‐1.18]).
| 30‐Day Unplanned Readmission Rate | Unadjusted Odds of Unplanned Readmission (95% CI) | Weekend Admission Model: Adjusted Odds of Unplanned Readmission (95% CI) | Weekend Discharge Model: Adjusted Odds of Unplanned Readmission (95% CI) | |
|---|---|---|---|---|
| ||||
| Weekend admission, n=7,533 | 11.4%, n=973 | 1.15 (1.07‐1.24)* | 1.09 (1.004‐1.18)* | |
| Weekend discharge, n=13,911 | 9.7%, n=1,344 | 0.91 (0.85‐0.97)* | 0.97 (0.91‐1.04) | |
Weekend Discharge
Weekend discharges accounted for 34% of all discharges. Fridays had the highest discharge volumes, with lowest discharge volumes on Sunday (Figure 1). Children discharged on the weekend had lower odds of unplanned readmission compared to children discharged on weekdays in bivariate analysis (unadjusted OR=0.91 [95% CI: 0.85‐0.97]). However, when adjusting for important confounders, the relationship was no longer statistically significant (adjusted OR=0.97 [95% CI: 0.91‐1.03]) (Table 1). Age, admission source, payer, length of stay, and number of complex chronic conditions were associated with readmission in the weekend discharge model (see the Supporting Appendix Table in the online version of this article). In a sensitivity analysis examining any 30‐day readmission, weekend discharge was not associated with readmission in adjusted analysis.
DISCUSSION
Although the so‐called weekend effect has been established in adults,[1, 2, 3, 4] evidence is mixed for children. In this sample, where the 30‐day pediatric readmission rate is consistent with national pediatric rates,[10] pediatric patients admitted on the weekend have higher odds of readmission compared to children admitted during the week, even when accounting for patient characteristics and hospital length of stay. In contrast, weekend discharge was not associated with readmission.
The association of weekend admission and subsequent readmission is intriguing and may be interpreted in 1 of 2 ways: either patients admitted on the weekend are fundamentally different and thus have higher readmission rates, or care on the weekend is different. It is important to note that we adjusted the analysis for patient characteristics including number of CCCs and technology dependency to account for differences in chronic illness. We also accounted for length of stay as a marker of severity of illness in the hospital. Yet even accounting for these known differences, we cannot discern from these data if the different outcomes for children admitted on the weekend are related to residual population differences (eg, lack of access to primary care or walk‐in clinics) or differences in initial clinical management on the weekend.
Initial clinical management on weekend may be different due to differences in physician, nursing, and other ancillary staffing affecting availability of diagnostic and therapeutic interventions. Additionally, smaller staff size on the weekend may lead to increased workload. Although we are unable to directly measure resident workload in our study, prior studies suggest higher workload is associated with worse outcomes for adult patients,[11] including readmission.[12] Additionally, nurse staffing, which may vary based on day of week, has been associated with pediatric readmission.[13]
Discharge timing in our population is consistent with prior literature, with Friday being the most common discharge day of week.[14] Prior literature has shown no difference in readmission rates between Friday discharge and midweek discharge for pediatric patients.[14] Our work builds on this existing literature, demonstrating no association with weekend discharge and readmission. There were lower discharge volumes on the weekends, particularly in patients with more CCCs, suggesting that physicians avoid complicated discharges on Saturday and Sunday.
This study should be interpreted in the context of several limitations. First, this study was conducted at a single tertiary care pediatric institution. Our patient population had a high rate of children with CCCs, potentially limiting generalizability to other pediatric institutions. Ideally, we would adjust our model for clusters at the clinical service or attending physician level; however, the heterogeneity of our services and data limits prohibited these analyses. Readmissions that may have occurred at other institutions are not observable in this dataset; however, there is no reason to believe patients admitted or discharged on the weekend would have different rates of other hospital readmissions than patients admitted or discharged on weekdays. Additionally, early readmissions may be particularly affected by in‐hospital and discharge factors.[15] However, the very low rate of early readmission prohibited limiting the analyses to early readmission. Finally, we relied on administrative data to adjust for patient severity using typical methods such as CCCs; however, other patient differences may have existed beyond those that could be captured with administrative data.
CONCLUSION
Children admitted to the hospital on the weekend have higher rates of 30‐day unplanned readmission than children admitted during the week, suggesting differences of care in initial management on the weekend. Understanding this difference from the perspectives of multiple stakeholders may illuminate potential reasons for this disparity.
Disclosures
Dr. Auger received salary support from the Robert Wood Johnson Foundation Clinical Scholars program during work on this project. The hospital database was assembled with funds from a grant from the Blue Cross Blue Shield of Michigan Foundation. The authors report no conflicts of interest.
- , , , . A comparison of in‐hospital mortality risk conferred by high hospital occupancy, differences in nurse staffing levels, weekend admission, and seasonal influenza. Med Care. 2010;48(3):224–232.
- , . Mortality among patients admitted to hospitals on weekends as compared with weekdays. N Engl J Med. 2001;345(9):663–668.
- , , , . Effects of weekend admission and hospital teaching status on in‐hospital mortality. Am J Med. 2004;117(3):151–157.
- , , . Weekend admission for myocardial infarction. N Engl J Med. 2007;357(1):86–87; author reply 87–88.
- , , , et al. The "weekend effect" in pediatric surgery—increased mortality for children undergoing urgent surgery during the weekend. J Pediatr Surg. 2014;49(7):1087–1091.
- , , , , , Paediatric Intensive Care Audit Network (PICANet). Effects of out‐of‐hours and winter admissions and number of patients per unit on mortality in pediatric intensive care. J Pediatr. 2013;163(4):1039–1044.e1035.
- , , , . Do weekends or evenings matter in a pediatric intensive care unit? Pediatr Crit Care Med. 2005;6(5):523–530.
- , , , , . Pediatric complex chronic conditions classification system version 2: updated for ICD‐10 and complex medical technology dependence and transplantation. BMC Pediatr. 2014;14:199.
- , , , et al. Using hospital designation to identify unplanned pediatric readmissions [abstract]. J Hosp Med. Available at: http://www.shmabstracts.com/abstract/using‐hospital‐designation‐to‐identify‐unplanned‐pediatric‐readmissions. Accessed July 15, 2015.
- , , , et al. Rates and impact of potentially preventable readmissions at children's hospitals. J Pediatr. 2015;166(3):613–619.e615.
- , , , , . House staff team workload and organization effects on patient outcomes in an academic general internal medicine inpatient service. Arch Intern Med. 2007;167(1):47–52.
- , . A "reverse july effect": association between timing of admission, medical team workload, and 30‐day readmission rate. J Grad Med Educ. 2014;6(1):65–70.
- , , , , . An observational study of nurse staffing ratios and hospital readmission among children admitted for common conditions. BMJ Qual Saf. 2013;22(9):735–742.
- , , , , . Day of discharge and hospital readmission rates within 30 days in children: a population‐based study. Paediatr Child Health. 2006;11(7):409–412.
- , , , , . Differences between early and late readmissions among patients: a cohort study. Ann Intern Med. 2015;162(11):741–749.
Patient outcomes tend to be worse for adults admitted on the weekend compared to the weekday.[1, 2, 3, 4] In pediatric populations, urgent surgeries on weekends are associated with increased morbidity and mortality[5]; however, studies of mortality and admission timing in the pediatric critical care setting are mixed.[6, 7] Hospital readmission is considered a potential marker of hospital quality. We hypothesized that (1) being admitted and (2) being discharged on the weekend would adversely affect 30‐day unplanned readmission for pediatric patients.
METHODS
Population
All discharges from January 1, 2006 through December 31, 2012 from C. S. Mott Children's Hospital were initially eligible. All hospitalizations were considered potential index admissions; therefore, children may contribute more than 1 hospitalization to the dataset. We excluded hospitalizations in which the patient died, was transferred to another institution, was discharged against medical advice, or was discharged to hospice. Newborns admitted to a normal newborn service were also excluded, as they do not represent a typical hospitalization for illness. Among newborns admitted to a higher‐intensity clinical service (eg, special care nursery or neonatal intensive care), we also excluded newborns with a length of stay <5 days, given the typical length of stay of up to 4 days for uncomplicated delivery via Cesarean section that would indicate infants for whom precautionary measures had been taken but there was low estimated health risk. We used International Classification of Diseases, Ninth Revision codes to identify children with complex chronic conditions (CCCs) and technology dependency.[8]
Outcome
We examined unplanned readmission within 30 days of discharge. We defined unplanned readmission as a readmission that was not entered into the hospital registration system at least 24 hours before discharge.[9] Additionally, we performed sensitive analyses examining any 30‐day readmissions.
Statistical Analysis
We fit multivariable logistic regression models for 30‐day unplanned readmission, with the primary predictor of either weekend (Saturday or Sunday) admission or weekend discharge (in separate models). We adjusted for patient age, gender, race/ethnicity, source of admission, insurance, and length of stay. We also adjusted for patient chronic illness complexity using the number of CCCs and technology dependency (yes/no). Variance in all analyses was clustered on individual patients.
RESULTS
We included a total of 55,383 hospitalizations from 32,112 patients (see Supporting Appendix Figure in the online version of this article for cohort derivation). All‐cause 30‐day readmissions occurred in 14.9% of hospital discharges; the 30‐day unplanned readmission rate was 10.3% (see the Supporting Appendix Table in the online version of this article for demographic characteristics).
Weekend Admission
Overall, 82% of admissions occurred during the week, with Tuesday as the highest admitting volume day (Figure 1). Children admitted on the weekend had higher odds of unplanned readmission compared to children admitted on weekdays (unadjusted odds ratio [OR]=1.15 [95% confidence interval {CI}: 1.07‐1.24]). Adjusting the analysis for age, gender, race/ethnicity, insurance, length of stay, CCCs, and technology dependency, higher odds of readmission remains significantly higher than weekday admission (adjusted OR=1.09 [95% CI: 1.004‐1.18]) (Table 1). Age, admission source, payer, length of stay, number of complex chronic conditions, and technology dependency were also significantly associated with readmission in the weekend admission model (see the Supporting Appendix Table in the online version of this article). A sensitivity analysis examining the association of weekend admission and readmission within different subpopulations of children with varying numbers of CCCs (ie, among children without CCCs, with 1 CCC, 2 CCCs, and 3+ CCCs) showed that the association remains the same in each subgroup. Further, a sensitivity analysis examining odds of any 30‐day readmission was similar to the primary analysis with higher odds of readmission in adjusted analysis (adjusted OR=1.09 [95% CI: 1.02‐1.18]).
| 30‐Day Unplanned Readmission Rate | Unadjusted Odds of Unplanned Readmission (95% CI) | Weekend Admission Model: Adjusted Odds of Unplanned Readmission (95% CI) | Weekend Discharge Model: Adjusted Odds of Unplanned Readmission (95% CI) | |
|---|---|---|---|---|
| ||||
| Weekend admission, n=7,533 | 11.4%, n=973 | 1.15 (1.07‐1.24)* | 1.09 (1.004‐1.18)* | |
| Weekend discharge, n=13,911 | 9.7%, n=1,344 | 0.91 (0.85‐0.97)* | 0.97 (0.91‐1.04) | |
Weekend Discharge
Weekend discharges accounted for 34% of all discharges. Fridays had the highest discharge volumes, with lowest discharge volumes on Sunday (Figure 1). Children discharged on the weekend had lower odds of unplanned readmission compared to children discharged on weekdays in bivariate analysis (unadjusted OR=0.91 [95% CI: 0.85‐0.97]). However, when adjusting for important confounders, the relationship was no longer statistically significant (adjusted OR=0.97 [95% CI: 0.91‐1.03]) (Table 1). Age, admission source, payer, length of stay, and number of complex chronic conditions were associated with readmission in the weekend discharge model (see the Supporting Appendix Table in the online version of this article). In a sensitivity analysis examining any 30‐day readmission, weekend discharge was not associated with readmission in adjusted analysis.
DISCUSSION
Although the so‐called weekend effect has been established in adults,[1, 2, 3, 4] evidence is mixed for children. In this sample, where the 30‐day pediatric readmission rate is consistent with national pediatric rates,[10] pediatric patients admitted on the weekend have higher odds of readmission compared to children admitted during the week, even when accounting for patient characteristics and hospital length of stay. In contrast, weekend discharge was not associated with readmission.
The association of weekend admission and subsequent readmission is intriguing and may be interpreted in 1 of 2 ways: either patients admitted on the weekend are fundamentally different and thus have higher readmission rates, or care on the weekend is different. It is important to note that we adjusted the analysis for patient characteristics including number of CCCs and technology dependency to account for differences in chronic illness. We also accounted for length of stay as a marker of severity of illness in the hospital. Yet even accounting for these known differences, we cannot discern from these data if the different outcomes for children admitted on the weekend are related to residual population differences (eg, lack of access to primary care or walk‐in clinics) or differences in initial clinical management on the weekend.
Initial clinical management on weekend may be different due to differences in physician, nursing, and other ancillary staffing affecting availability of diagnostic and therapeutic interventions. Additionally, smaller staff size on the weekend may lead to increased workload. Although we are unable to directly measure resident workload in our study, prior studies suggest higher workload is associated with worse outcomes for adult patients,[11] including readmission.[12] Additionally, nurse staffing, which may vary based on day of week, has been associated with pediatric readmission.[13]
Discharge timing in our population is consistent with prior literature, with Friday being the most common discharge day of week.[14] Prior literature has shown no difference in readmission rates between Friday discharge and midweek discharge for pediatric patients.[14] Our work builds on this existing literature, demonstrating no association with weekend discharge and readmission. There were lower discharge volumes on the weekends, particularly in patients with more CCCs, suggesting that physicians avoid complicated discharges on Saturday and Sunday.
This study should be interpreted in the context of several limitations. First, this study was conducted at a single tertiary care pediatric institution. Our patient population had a high rate of children with CCCs, potentially limiting generalizability to other pediatric institutions. Ideally, we would adjust our model for clusters at the clinical service or attending physician level; however, the heterogeneity of our services and data limits prohibited these analyses. Readmissions that may have occurred at other institutions are not observable in this dataset; however, there is no reason to believe patients admitted or discharged on the weekend would have different rates of other hospital readmissions than patients admitted or discharged on weekdays. Additionally, early readmissions may be particularly affected by in‐hospital and discharge factors.[15] However, the very low rate of early readmission prohibited limiting the analyses to early readmission. Finally, we relied on administrative data to adjust for patient severity using typical methods such as CCCs; however, other patient differences may have existed beyond those that could be captured with administrative data.
CONCLUSION
Children admitted to the hospital on the weekend have higher rates of 30‐day unplanned readmission than children admitted during the week, suggesting differences of care in initial management on the weekend. Understanding this difference from the perspectives of multiple stakeholders may illuminate potential reasons for this disparity.
Disclosures
Dr. Auger received salary support from the Robert Wood Johnson Foundation Clinical Scholars program during work on this project. The hospital database was assembled with funds from a grant from the Blue Cross Blue Shield of Michigan Foundation. The authors report no conflicts of interest.
- , , , . A comparison of in‐hospital mortality risk conferred by high hospital occupancy, differences in nurse staffing levels, weekend admission, and seasonal influenza. Med Care. 2010;48(3):224–232.
- , . Mortality among patients admitted to hospitals on weekends as compared with weekdays. N Engl J Med. 2001;345(9):663–668.
- , , , . Effects of weekend admission and hospital teaching status on in‐hospital mortality. Am J Med. 2004;117(3):151–157.
- , , . Weekend admission for myocardial infarction. N Engl J Med. 2007;357(1):86–87; author reply 87–88.
- , , , et al. The "weekend effect" in pediatric surgery—increased mortality for children undergoing urgent surgery during the weekend. J Pediatr Surg. 2014;49(7):1087–1091.
- , , , , , Paediatric Intensive Care Audit Network (PICANet). Effects of out‐of‐hours and winter admissions and number of patients per unit on mortality in pediatric intensive care. J Pediatr. 2013;163(4):1039–1044.e1035.
- , , , . Do weekends or evenings matter in a pediatric intensive care unit? Pediatr Crit Care Med. 2005;6(5):523–530.
- , , , , . Pediatric complex chronic conditions classification system version 2: updated for ICD‐10 and complex medical technology dependence and transplantation. BMC Pediatr. 2014;14:199.
- , , , et al. Using hospital designation to identify unplanned pediatric readmissions [abstract]. J Hosp Med. Available at: http://www.shmabstracts.com/abstract/using‐hospital‐designation‐to‐identify‐unplanned‐pediatric‐readmissions. Accessed July 15, 2015.
- , , , et al. Rates and impact of potentially preventable readmissions at children's hospitals. J Pediatr. 2015;166(3):613–619.e615.
- , , , , . House staff team workload and organization effects on patient outcomes in an academic general internal medicine inpatient service. Arch Intern Med. 2007;167(1):47–52.
- , . A "reverse july effect": association between timing of admission, medical team workload, and 30‐day readmission rate. J Grad Med Educ. 2014;6(1):65–70.
- , , , , . An observational study of nurse staffing ratios and hospital readmission among children admitted for common conditions. BMJ Qual Saf. 2013;22(9):735–742.
- , , , , . Day of discharge and hospital readmission rates within 30 days in children: a population‐based study. Paediatr Child Health. 2006;11(7):409–412.
- , , , , . Differences between early and late readmissions among patients: a cohort study. Ann Intern Med. 2015;162(11):741–749.

Pediatric Discharge Systematic Review
The process of discharging a pediatric patient from an acute care facility is currently fraught with difficulties. More than 20% of parents report problems in the transition of care from the hospital to the home and ambulatory care setting.[1] Clinical providers likewise note communication challenges around the time of discharge,[2, 3] especially when inpatient and outpatient providers are different, as with the hospitalist model.[4] Poor communication and problems in discharge transition and continuity of care often culminate in adverse events,[5, 6] including return to emergency department (ED) care and hospital readmission.[7]
Thirty‐day readmissions are common for certain pediatric conditions, such as oncologic diseases, transplantation, and sickle cell anemia and vary significantly across children's hospitals.[8] Discharge planning may decrease 30‐day readmissions in hospitalized adults[9]; however, it is not clear that the same is true in children. Both the preventability of pediatric readmissions[10] and the extent to which readmissions reflect suboptimal care[11] are subjects of debate. Despite these uncertainties, collaborative efforts intended to decrease pediatric readmissions[12] and improve discharge transitions[13, 14] are underway.
To inform these debates and efforts, we undertook a systematic review of the evidence of hospital‐initiated interventions to reduce repeat utilization of the ED and hospital. Acknowledging that existing evidence for condition‐specific discharge interventions in pediatrics might be limited, we sought to identify common elements of successful interventions across pediatric conditions.
METHODS
Search Strategy
With the assistance of a research librarian, we searched MEDLINE and CINAHL (Cumulative Index to Nursing and Allied Health Literature) from the inception of these databases through to March 28, 2012 (for search strategies, see the Supporting Information, Appendix, Part 1, in the online version of this article).
Study Selection
Two authors (K.A. and C.K.) independently reviewed abstracts identified by the initial search, as well as abstracts of references of included articles. Eligibility criteria for inclusion in full review included: (1) discharge‐oriented process or intervention initiated in the inpatient setting, (2) study outcomes related to subsequent utilization including hospital readmission or emergency department visit after hospitalization, (3) child‐ or adolescent‐focused or child‐specific results presented separately, and (4) written or available in English. If abstract review did not sufficiently clarify whether all eligibility criteria were met, the article was included in the full review. Two authors (K.A. and C.K.) independently reviewed articles meeting criteria for full review to determine eligibility. Disagreements regarding inclusion in the final analysis were discussed with all 4 authors. We excluded studies in countries with low or lower‐middle incomes,[15] as discharge interventions in these countries may not be broadly applicable.
Data Abstraction, Quality Assessment, and Data Synthesis
Two authors (K.A. and C.K.) independently abstracted data using a modified Cochrane Collaboration data collection form.[16] We independently scored the included studies using the Downs and Black checklist, which assesses the risk of bias and the quality of both randomized and nonrandomized studies.[17] This checklist yields a composite score of 0 to 28 points, excluding the item assessing power. As many studies either lacked power calculations or included power calculations based on outcomes not included in our review, we performed calculations to determine the sample size needed to detect a decrease in readmission or ED utilization by 20% from baseline or control rates. Due to the heterogeneous nature of included studies in terms of population, interventions, study design, and outcomes, meta‐analysis was not performed.
RESULTS
Electronic search yielded a total of 1296 unique citations. Review of abstracts identified 40 studies for full article review. We identified 10 articles that met all inclusion criteria. Subsequent review of references of included articles identified 20 additional articles for full review, 7 of which met all inclusion criteria. However, 3 articles[18, 19, 20] assessed the impact of violence interventions primarily on preventing reinjury and recidivism and thus were excluded (see Supporting Information, Appendix, Part 2, in the online version of this article for findings of the 3 articles). In total, we included 14 articles in our review[21, 22, 23, 24, 25, 26, 27, 28, 29, 30, 31, 32, 33, 34] (Figure 1).

Patient Populations and Intervention Timing and Components
Studies varied regarding the specific medical conditions they evaluated. Eight of the papers reported discharge interventions for children with asthma, 5 papers focused on discharge from the neonatal intensive care unit (NICU), and a final study discussed a discharge intervention for children with cancer (Table 1). Although our primary goal was to synthesize discharge interventions across pediatric conditions, we provide a summary of discharge interventions by condition (see Supporting Information, Appendix, Part 3, in the online version of this article).
| Author, Year | Study Design | Age | Inclusion | Exclusion | Intervention | Control |
|---|---|---|---|---|---|---|
| ||||||
| Asthma | ||||||
| Davis, 2011[21] | Retrospective matched case control | 12 months18 years | Admitted for asthma at a single hospital in California. | 45 minutes of enhanced asthma education and phone call 3 weeks after discharge (n=698) | Patients were matched on age and past utilization who received standard education/care (n=698) | |
| Espinoza‐Palma, 2009[22] | RCT | 515 years | Admitted for asthma at a single hospital in Chile. | Chronic lung disease or neurologic alteration. | Self‐management education program with a postdischarge game to reinforce educational concepts (n=42) | Standard education (n=46) |
| Ng, 2006[23] | RCT | 215 years | Admitted for asthma in a pediatric ward at a single hospital in China. | Admitted to PICU or non‐Chinese speaking. | Evaluation by asthma nurse, animated asthma education booklet, 50‐minute discharge teaching session, follow‐up by phone at 1 week (n=55) | Evaluation by asthma nurse by physician referral, a written asthma education booklet, 30‐minute discharge teaching session (n=45) |
| Stevens, 2002[24] | RCT | 18 months5 years | In ED or admitted with primary diagnosis of asthma/wheezing at 2 hospitals in the United Kingdom. | Admitted when no researcher available. | Enhanced asthma education and follow‐up in a clinic 1 month after encounter (n=101) | Usual care (n=99) |
| Wesseldine, 1999[25] | RCT | 216 years | Admitted for asthma at a single hospital in the United Kingdom. | Admitted when no researcher available. | 20 minutes of enhanced asthma education including: guided self‐management plan, booklet, asthma hotline contact, and sometimes oral steroids (n=80) | Standard discharge that varied by provider (n=80) |
| Madge, 1997[26] | RCT | 214 years | Admitted for asthma at a single hospital in the United Kingdom. | Admitted on weekend. | 45 minutes of enhanced asthma education with written asthma plan, a nurse follow‐up visit 23 weeks postdischarge, telephone support, and a course of oral steroids (n=96) | Standard education (did not include written asthma plan) (n=105) |
| Taggart, 1991[27] | Pre‐post | 612 years | Admitted for asthma at single institution in Washington, DC with history of at least one ED visit in prior 6 months. | If resided outside of metro area. | Received written educational materials, adherence assistance, discussed emotions of asthma, video education provided, and tailored nursing interactions (n=40) | Enrolled patient's prior utilization |
| Mitchell, 1986[28] | RCT | >2 years | Admitted for asthma at single institution in New Zealand. | Having a previous life‐threatening attack. | 6 monthly postdischarge education sessions on lung anatomy/physiology, triggers and avoidance, asthma medication, advice on when and where to seek care (n=94 children of European descent, n=84 children of Polynesian descent) | Standard discharge (n=106 children of European descent; n=84 children of Polynesian descent) |
| Cancer | ||||||
| Caliskan Yilmaz, 2009[29] | Quasiexperimental | <18 years | New oncologic diagnoses in hospital in Turkey. | Children who died during follow‐up. | Frequent needs assessment, education, home visits, fever guidance, telephone consultation, and manual for home care; patients lived in Izmir (n=25) | Routine hospital services without formal education; patients lived outside of Izmir (n=24) |
| NICU | ||||||
| Broyles, 2000[30] | RCT | Neonate | Infants with birth weight <1500 g with mechanical vent use in 48 hours of life, born at single NICU in Texas. | Infant death, infant adopted or moved out of enrollment county. | Specialized follow‐up available 5 days a week for well or sick visits; access to medical advice via phone 24 hours a day, transportation to ED provided when needed; home visitation, parent education, and "foster grandmother" offered (n=446) | Specialized follow‐up available 2 mornings a week for well or sick visits; all other sick visits to be made through acute care clinic or ED (n=441) |
| Finello, 1998[31] | RCT | Neonate | Infants with birth weight between 750 and1750 g; discharged from 2 NICUs in California. | Infants with gross abnormalities. | Three separate intervention groups (n=20 in each): (1) home healthhome visits during the first 4 weeks after discharge, with physician consultation available at all times; (2) home visitinghealth and development support, parental support, support with referral services for 2 years after discharge; (3) home health and home visiting arms combined | Standard discharge (n=20). |
| Kotagal, 1995[32] | Pre‐post | Neonate | Infants discharged from a single NICU in Ohio. | Patients (n=257) discharged after restructuring of discharge practices including: removal of discharge weight criteria, engagement of family prior to discharge, evaluation of home environment prior to discharge, and arrangement of home health visits and follow‐up | Patients discharged before discharge restructuring (n=483) | |
| Casiro, 1993[33] | RCT | Neonate | Infants meeting discharge criteria from 1 of 2 NICUs in Canada. | Congenital anomalies, chronic neonatal illness, parent refusal, family complications, and death. | Early discharge based on prespecified criteria with 8 weeks of services including: assistance with infant care, sibling care and housekeeping; nurse availability via phone; follow‐up phone calls and home visitation tailored to family need (n=50) | Discharged at the discretion of their attending physicians; standard newborn public health referral for routine follow‐up (n=50) |
| Brooten, 1986[34] | RCT | Neonate | Infants born <1500 g at a single NICU in Pennsylvania. | Death, life‐threatening congenital anomalies, grade 4 IVH, surgical history, O2 requirement >10 weeks, family complications. | Early discharge based on prespecified criteria with weekly education prior to discharge, postdischarge follow‐up phone call, and home nurse visitation; consistent nurse availability via phone (n=39) | Standard discharge practices with a discharge weight minimum of 2.2 kg (n=40) |
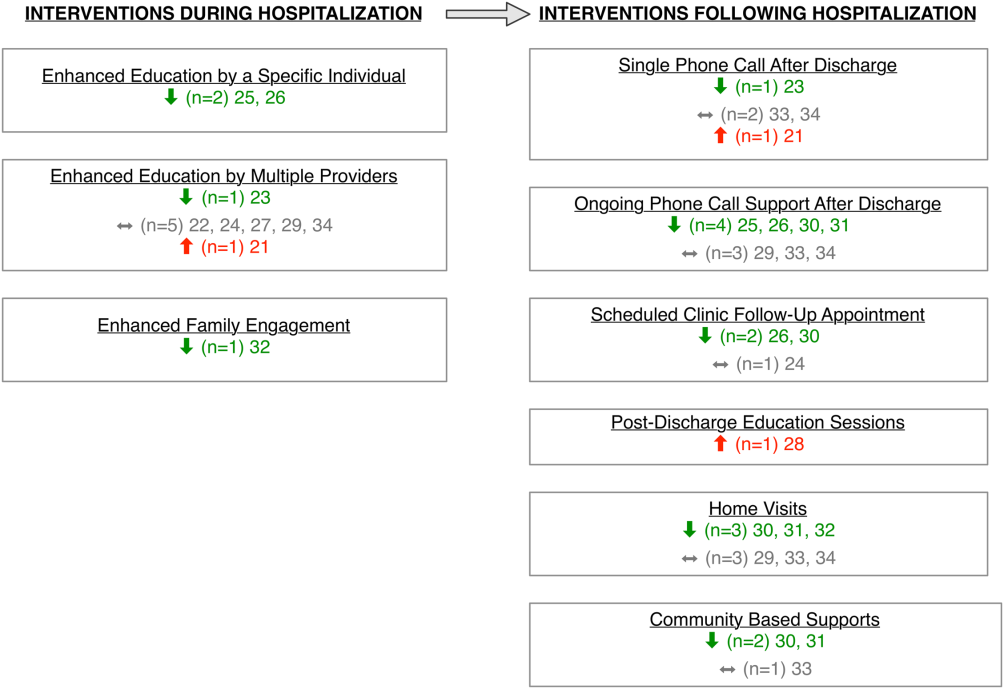
Studies varied regarding the timing and nature of the intervention components. Eight discharge interventions included a major inpatient component, in addition to outpatient support or follow‐up.[21, 23, 24, 25, 26, 29, 32, 34] Two studies included an inpatient education component only.[22, 27] The remainder were initiated during index hospitalization but focused primarily on home visitation, enhanced follow‐up, and support after discharge (Figure 2).[28, 30, 31, 33]
Outcome Assessment Methods
Readmission and subsequent ED utilization events were identified using multiple techniques. Some authors accessed claims records to capture all outcomes.[30, 33] Others relied on chart review.[21, 25, 26, 27, 28, 31, 32] One study supplemented hospital records with outpatient records.[24] Some investigators used parental reports.[22, 23, 31] Two studies did not describe methods for identifying postdischarge events.[29, 34]
Study Quality
The quality of the included studies varied (Table 2). Many of the studies had inadequate sample size to detect a difference in either readmission or ED visit subsequent to discharge. Eight studies found differences in either subsequent ED utilization, hospitalization, or both and were considered adequately powered for these specific outcomes.[21, 23, 25, 26, 28, 30, 31, 32] In contrast, among studies with readmission as an outcome, 6 were not adequately powered to detect a difference in this particular outcome.[24, 30, 31, 32, 33, 34] In these 6 studies, all except 1 study30 had <10% of the sample size required to detect differences in readmission. Further, 2 studies that examined ED utilization were underpowered to detect differences between intervention and control groups.[24, 26] We were unable to perform power calculations for 3 studies,[22, 27, 29] as the authors presented the number of events without clear denominators.
| Author, Year | Study Design | D&B Score* | Adequately Powered (Yes/No)** | Timing of Outcome | Major Findings | Major Limitations |
|---|---|---|---|---|---|---|
| ||||||
| Asthma | ||||||
| Davis, 2011[21] | Retrospective matched case control | 14 | Readmission: N/A; ED: yes | 1 year | Patients with enhanced education had higher hazards of return to ED visit. | Intervention not randomized; only 29% of eligible children enrolled with unclear selection decisions due to lack of study personnel or caregiver presence in hospital; only 67% completed the intervention; 50% of patients were not local; follow‐up was not well described. |
| Espinoza‐Palma, 2009[22] | RCT | 19 | Readmission: b; ED:b | 1 year | No difference between the intervention and control in hospitalizations or ED visits. ED visits and hospitalizations decreased in year after compared to the year prior for both intervention and control. | Pre‐post analysis with similar effects in cases and controls, results may reflect regression to mean; follow‐up was not well described, and 12.5% who were lost to follow‐up were excluded from analysis; study was in Chile with different demographics than in the United States. |
| Ng, 2006[23] | RCT | 20 | Readmission: yes; ED: yes | 3 months | Patients in the intervention group were less likely to be readmitted or visit the ED. | Recruitment/refusal was not well described; number lost to follow‐up was not reported; study was in China with different demographics than the United States. |
| Stevens, 2002[24] | RCT | 20 | Readmission: no ED: no | 1 year | No differences between intervention and control for any outcomes. | 11% were lost to follow‐up; number of patients who refused was not reported; analysis did not adjust for site of recruitment (ED vs inpatient); 30% of children did not have a prior diagnosis of asthma; study was in England with different demographics than in the United States. |
| Wesseldine, 1999[25] | RCT | 20 | Readmission: yes; ED: yes | 6 months | Patients in intervention group less likely to be readmitted or visit ED. | Unclear if intervention group received oral steroids that might drive effect; number lost to follow‐up was not reported; high miss rate for recruitment; study was in England with different demographics than the United States. |
| Madge, 1997 [26] | RCT | 22 | Readmission: yes; ED: no | 214 months | Patients in intervention group were less likely to be readmitted compared to controls. No differences in repeat ED visits. | Unclear if education or oral steroids drove effect; number of patients who refused or were lost to follow‐not reported; time to outcome (214 months) varied for different patients, which may introduce bias given the seasonality of asthma; study was in Scotland with different demographics than the United States. |
| Taggart, 1991[27] | Pre‐post | 12 | Readmission:b; ED:b | 15 months | Overall there was no change in ED or hospitalization utilization from pre to post. When limited to children with severe asthma, there was a decrease in ED utilization after the intervention compared to prior ED use. | Use of historical utilization as a comparison does not account for potential effects of regression to mean or improvement with age; over one‐half of eligible patients were excluded due to lack of consent or inability to collect baseline data; inclusion criterion did not specify that prior utilization was necessarily for asthma exacerbation; number lost to follow‐up was not reported. |
| Mitchell, 1986[28] | RCT | 14 | Readmission: yesc; ED: N/A | 6 months and 618 months | Increase in percentage of readmission between 6 and 18 months for children of European descent. | Unclear exclusion criterion; full compliance with intervention only 52%; number of patients lost to follow‐up (outcome) was not reported; statistical analysis was not clearly described. |
| Cancer | ||||||
| Caliskan Yilmaz, 2009[29] | Quasiexperimental | 10 | Readmission:b; ED: N/A | Not specified | For the first readmission to the hospital, more of the readmissions were planned in the intervention group compared to the control group. Number of readmissions was not assessed. | Intervention was not randomized; children who died were excluded (4%); planned vs unplanned distinction not validated; unclear cointerventions regarding chemotherapy administration; recruitment and follow‐up was not well described; not all comparisons were described in methods. |
| NICU | ||||||
| Broyles, 2000[30] | RCT | 23 | Readmission: no; ED: yes | At 1 year adjusted age | Overall hospitalization rates were similar but there were fewer admissions to the ICU. Intervention group had fewer ED visits. Total costs were less in intervention group. | 10% refused to participate or consent was not sought, and 12% were excluded after randomization; different periods of follow‐up (outcomes observed at 1 year of life regardless of discharge timing); analysis did not adjust for site of recruitment (1 of 2 nurseries). |
| Finello, 1998[31] | RCT | 11 | Readmission: nod; ED: yes | At 6 months adjusted age and between 6 and 12 months adjusted age | No changes in hospitalization rates.d The home health+home visit arm had fewer ED visits between 6 and 12 months of life. Intervention was reported as saving money by decreasing initial length of stay. | Inclusion and exclusion criteria, recruitment/refusal, outcomes, and analysis plan were not clearly described; sample size was too small for effective randomization; different periods of follow‐up (outcomes observed at 1 year of life regardless of discharge timing); analysis did not adjust for site of recruitment; 15% of outcomes were missing. |
| Kotagal, 1995[32] | Pre‐post | 15 | Readmission: no; ED: yes | 14 days | Decreased number of ED visits in patients in intervention. No difference in readmission. Costs and length of stay were less in intervention. | Designed to decrease length of stay; pre‐post nature of study allows for possibility of other changes to practices other than the intervention. |
| Casiro, 1993[33] | RCT | 18 | Readmission: no; ED: N/A | 1 year of life | There were no differences in the readmissions or number of ambulatory care visits after discharge. Infants were discharged earlier in the intervention group, which resulted in cost savings. | Designed to decrease length of stay; 13% refused or were excluded due to family complications; and 8% were lost to follow‐up; different periods of follow‐up (outcomes observed at 1 year of life regardless of discharge timing); analysis did not adjust for site of recruitment (1 of 2 nurseries); 81% of infants were born to Caucasian women, which may limit generalizability. |
| Brooten, 1986[34] | RCT | 15 | Readmission: no; ED: N/A | 14 days and 18 months | No difference in readmission. Significantly lower charges during initial hospitalization for intervention group. | Designed to decrease length of stay; unclear when randomization occurred and exclusions unclear; 12.5% were excluded due to refusal or family issues; follow‐up not well described, and loss to follow‐up was unknown. |
Excluding the assessment of statistical power, Downs and Black scores ranged from 10 to 23 (maximum 28 possible points) indicating varying quality. As would be expected with discharge interventions, studies did not blind participants; 2 studies did, however, appropriately blind the outcome evaluators to intervention assignment.[22, 30] Even though 10 out of the 14 studies were randomized controlled trials, randomization may not have been completely effective due to sample size being too small for effective randomization,[31] large numbers of excluded subjects after randomization,[30] and unclear randomization process.[34] Several studies had varying follow‐up periods for patients within a given study. For example, 3 NICU studies assessed readmission at 1‐year corrected age,[30, 31, 33] creating the analytic difficulty that the amount of time a given patient was at risk for readmission was dependent on when the patient was discharged, yet this was not accounted for in the analyses. Only 2 studies demonstrated low rates of loss to follow‐up (<10%).[30, 33] The remainder of the studies either had high incompletion/loss to follow‐up rates (>10%)[22, 24, 31] or did not report rates.[21, 23, 25, 26, 27, 28, 29, 32, 34] Finally, 3 studies recruited patients from multiple sites,[24, 31, 33] and none adjusted for potential differences in effect based on enrollment site.
Findings Across Patient Populations Regarding Readmission
Of the 4 studies that demonstrated change in overall readmission,[23, 25, 26, 28] all were asthma focused; 3 demonstrated a decrease in readmissions,[23, 25, 26] and 1 an increase in readmissions.[28] The 3 effective interventions included 1‐on‐1 inpatient education delivered by an asthma nurse, in addition to postdischarge follow‐up support, either by telephone or clinic visit. Two of these interventions provided rescue oral steroids to some patients on discharge.[25, 26] In contrast, a study from New Zealand evaluated a series of postdischarge visits using an existing public health nurse infrastructure and demonstrated an increase in readmission between 6 to 18 months after admission in European children.[28] An additional study focused on outpatient support after discharge from the NICU, and demonstrated a lower frequency of readmission to the intensive care unit without overall reduction of hospital readmission (Tables 1 and 2).[30]
Findings Across Patient Populations Regarding Subsequent ED Visits
Of all the discharge interventions, 6 demonstrated differences in return to the ED after discharge. Five studies described a decrease in ED visits after hospitalization,[23, 25, 30, 31, 32] and 1 showed an increase.[21] Three studies in the NICU population demonstrated decreased ED utilization through a combination of augmented family engagement during hospitalization and/or enhanced support after discharge. Two inpatient asthma education interventions with structured postdischarge follow‐up decreased return visitation to the ED.[23, 26] The intervention that worsened subsequent ED utilization (ie, increased ED visit hazard compared to matched controls) provided enhanced inpatient education to a nonrandom group of children hospitalized with asthma and provided a follow‐up phone call 3 weeks after discharge (Tables 1 and 2).[21]
DISCUSSION
In this review, we synthesized evidence regarding pediatric hospital discharge‐focused interventions intended to reduce subsequent utilization through decreased readmission and ED visits. Our review identified 14 studies clustered in 3 clinical areas: asthma, NICU care (chiefly prematurity), and cancer. Overall, 6 interventions demonstrated a reduction either in subsequent hospitalization or ED use. Four of the 6 positive interventions included both an enhanced inpatient education and engagement component as well as enhanced follow‐up after discharge. Importantly, all of the interventions were multifaceted; thus, we could not ascertain which specific aspects of the interventions mediated the change. Many of the included studies had significant methodological limitations.
Current Conceptual Framework
There are a number of existing discharge transitional care frameworks from prior studies[35, 36] and professional societies.[37] The Stepping Up to the Plate (SUTTP) alliance, a collaborative of 9 professional organizations, including the American Academy of Pediatrics, introduced 1 such framework in 2007. SUTTP sought to enhance care transitions by outlining principles of discharge transitional care including: (1) enhanced accountability, (2) creation of a central coordination hub charged with communicating expectations for care, (3) clear and direct communication of treatment plans and follow‐up, (4) timely feedback/feed‐forward of relevant information, and (5) involvement of family member at every stage.[38] In the context of the SUTTP framework, we present 3 hypotheses based on our findings to guide future work.
Hypothesis: Appointing a Dedicated Individual or Coordinating Hub Reduces Subsequent Utilization
Ostensibly, each discharge intervention included in this review sought to enhance accountability of providers or their health systems for discharge transitional care. Two of the asthma interventions appointed a particular provider to coordinate the discharge transition and demonstrated reductions in readmission.[25, 26] The successful NICU discharge interventions provided an integrated accountability structure across the health system, with a transition of accountability to an outpatient provider or central coordinating hub available to provide assistance and resources for an extended period following discharge.
By contrast, interventions with more than 1 individual intervener or without a centrally coordinated system for discharge transitional care tended not to demonstrate reduction in subsequent utilization.[21, 24, 27, 28] In fact, the 1 asthma intervention that utilized a previously existing public health nurse infrastructure demonstrated an increase in readmission.[28] Future efforts to enhance transitional care might investigate directly the impact of accountability structure on subsequent utilization by varying the number of effector individuals or the organization to which they report (eg, hospital system vs public health department).
Hypothesis: Individualized Task Learning and Feedback Enhances Effectiveness
Studies varied with respect to the extent they incorporated the principles of enhanced communication of the treatment and follow‐up plan and timely feedback/feed‐forward of relevant information. Successful efforts, however, seemed to embrace these strategies. Each of the 3 interventions that demonstrated readmission reduction[23, 25, 26] developed an individualized treatment plan during hospitalization, with either a specific follow‐up plan or resources for outpatient support. Two of these interventions assessed asthma inhaler technique prior to discharge, creating an inpatient audit and feedback loop allowing for assessment of competence prior to discharge. Audit and feedback has demonstrated promise modifying provider behavior[39] and is a plausible approach to enhancing patient and family self‐care.
Hypothesis: Timing of Intervention Enhances Effectiveness
Discrete sentinel events such as inpatient admission, may serve as a teachable moment[40, 41] or a tipping point[42] for some patients/families to initiate behavior change. Four of the 6 positive studies had a robust inpatient education component. By providing enhanced inpatient support, providers may be engaging the family at a timely opportunity to improve care. Both timing of the intervention (at admission vs discharge) and content (education‐ vs family‐engagement focused) are likely important to their effect and should be further explored with prospective study.
Persistent Literature Gaps
Follow‐up with a primary care provider after discharge is another intervention that might decrease postdischarge utilization. We did not identify any studies that specifically examined primary care follow‐up. However, 2 studies[43, 44] that did not meet our inclusion criteria (because they included adults and did not stratify by age group in the analysis) examined any outpatient follow‐up after discharge using state‐specific Medicaid claims. One study found that outpatient follow‐up after sickle cell hospitalization was associated with lower rates of readmission.[43] The other found no difference in readmission across multiple conditions.[44] One recent review of outpatient follow‐up from the ED for asthma found that even when increases in follow‐up were achieved, no reduction in the subsequent utilization was observed.[45]
Additional important questions remain underexplored. First, are condition‐specific interventions superior to those that span conditions? All of the interventions that demonstrated reductions in readmission were condition‐specific, yet no generic interventions met our inclusion criteria. Importantly, only 1 study[29] in our review examined discharge processes from 1 of the pediatric conditions with the most variation[8] in readmission. Further, no studies focused on children with complex medical conditions, who are known to be at increased risk of readmission,[46] indicating a sizable knowledge gap persists in understanding how to prevent readmissions in the most vulnerable pediatric populations.
Lastly, who are the most appropriate effector individuals for discharge‐focused transitional care interventions? Demographically matched effector individuals have shown promise in improving care using community health workers.[47, 48] The degree to which the identity of the intervener mediates subsequent ED and hospital utilization warrants further investigation.
Limitations of This Systematic Review
The studies included in this review assessed different outcomes at different intervals, precluding meta‐analysis. With greater consistency in the collection of data on the quality of discharge processes and their subsequent outcomes, future studies may offer further clarity as to which discharge‐oriented practices are more effective than others. Because we only identified literature in 3 pediatric conditions, generalizability beyond these conditions may be limited. The settings of the interventions also occurred in multiple countries; we excluded countries from low or low‐middle incomes to facilitate generalizability. As many of the discharge processes contained multiple interventions, it is not possible to ascertain which, if any, singular action may decrease posthospitalization utilization. Additionally, some of the included interventions are older, and it is plausible that discharge processes have evolved with the expansion of the hospitalist model.
Methods of data collection influence the quality of results in the included studies. Most of the studies included in this review used either medical record review or parental self‐report of utilization. Parental report may be sufficient for hospitalizations and ED utilization; however, it is subject to recall bias. Chart review likely underestimates the number of postdischarge events, depending on the individual institution's proportion of the market and the tendency of individuals to seek care at multiple institutions. Claims data may offer the most accurate assessments of ED and hospital utilization and cost, but can be more difficult to obtain and do not provide the same potential for granularity as parent report or medical records review.
Finally, subsequent ED visits, readmissions, and cost may not be the best measures of the quality of discharge transitional care. A number of tools have been developed to more specifically evaluate the quality of transitional care in adults,[49, 50] including a validated instrument that consists of only 3 items,[50] which primarily assesses the extent to which patients are prepared for self‐care upon discharge. For pediatric populations, validated tools assessing caregiver experience with discharge[51] and discharge readiness[52] are also available. These instruments may assist those interested in assessing process‐related outcomes that specifically assess discharge transitional care elements and may mediate subsequent ED visits or hospitalizations.
CONCLUSION
Successful discharge interventions to reduce pediatric readmission and ED have some common features, including an individual or team with specialized knowledge of the condition that assumed responsibility for the inpatient‐to‐outpatient transition and offered ongoing support to the family following discharge. All studies included in our review examined multiple discharge interventions; however, many did not have enough participants to detect differences in the outcomes of interest. Future studies might adapt common features of effective interventions, which are consistent with professional societies' recommendations.
Acknowledgements
The authors thank Marisa Conte for her help with developing the search algorithms for the review.
Disclosures: Drs. Auger and Kenyon received salary support from the Robert Wood Johnson Foundation Clinical Scholars program. Dr. Feudtner does not have any funding sources to disclose. Dr. Davis is funded in part by the Michigan Department of Community Health to serve as the Chief Medical Executive. The views expressed herein are not necessarily the views of the Department of Community Health. The authors have no conflicts of interest to report.
- , , , , . Are hospital characteristics associated with parental views of pediatric inpatient care quality? Pediatrics. 2003;111(2):308–314.
- , , , , , . Deficits in communication and information transfer between hospital‐based and primary care physicians: implications for patient safety and continuity of care. JAMA. 2007;297(8):831–841.
- , , , et al. Improving transitions of care at hospital discharge‐‐implications for pediatric hospitalists and primary care providers. J Healthc Qual. 2010;32(5):51–60.
- , . Hospitalists in children's hospitals: what we know now and what we need to know. J Pediatr. 2006;148(3):296–299.
- , , , , . The incidence and severity of adverse events affecting patients after discharge from the hospital. Ann Intern Med. 2003;138(3):161–167.
- , , , et al. Adverse events among medical patients after discharge from hospital. CMAJ. 2004;170(3):345–349.
- , , , . Medical errors related to discontinuity of care from an inpatient to an outpatient setting. J Gen Intern Med. 2003;18(8):646–651.
- , , , et al. Pediatric readmission prevalence and variability across hospitals. JAMA. 2013;309:372–380.
- , , , , , . Discharge planning from hospital to home. Cochrane Database Syst Rev. 2013;(1):CD000313.
- , , , , , . Preventability of early readmissions at a children's hospital. Pediatrics. 2012;131(1):e171–e181.
- , , , et al. State‐level child health system performance and the likelihood of readmission to children's hospitals. J Pediatr. 2010;157(1):98–102.e1.
- Ohio Children's Hospitals' solutions for patient safety. Available at: http://solutionsforpatientsafety.org/files/sps‐fact‐sheet.pdf. Accessed July 24, 2013.
- American Academy of Pediatrics. Value in inpatient pediatrics (VIP) network projects. Available at: http://www.aap.org/en‐us/professional‐resources/practice‐support/quality‐improvement/Quality‐Improvement‐Innovation‐Networks/Pages/Value‐in‐Inpatient‐Pediatrics‐Network‐Projects.aspx. Accessed July 24, 2013.
- Child Health Corporation of America. Resources for managing the patient discharge process. Available at: http://www.chca.com/news/index.html. Accessed October 31, 2013.
- The World Bank. World Development Indicators 2012. Available at: http://data.worldbank.org/sites/default/files/wdi‐2012‐ebook.pdf. Accessed July 5, 2013.
- The Cochrane Collaboration. Data collection form: Intervention review—RCTs and non‐RCTs. Available at: http://hiv.cochrane.org/sites/hiv.cochrane.org/files/uploads/Data%20extraction%20form_all%20studies.docx. Accessed July 24, 2013.
- , . The feasibility of creating a checklist for the assessment of the methodological quality both of randomised and non‐randomised studies of health care interventions. J Epidemiol Community Health. 1998;52(6):377–384.
- , , , et al. Brief violence interventions with community case management services are effective for high‐risk trauma patients. J Trauma. 2011;71(1):228–237.
- , , , , , . Benefits of a hospital‐based peer intervention program for violently injured youth. J Am Coll Surg. 2007;205(5):684–689.
- , , , , . Caught in the crossfire: the effects of a peer‐based intervention program for violently injured youth. J Adolesc Health. 2004;34(3):177–183.
- , , , , . A matched‐cohort evaluation of a bedside asthma intervention for patients hospitalized at a large urban children's hospital. J Urban Health. 2011;88(suppl 1):49–60.
- , , , et al. Effectiveness of asthma education with and without a self‐management plan in hospitalized children. J Asthma. 2009;46(9):906–910.
- , , , , And . Effect of a structured asthma education program on hospitalized asthmatic children: a randomized controlled study. Pediatr Int. 2006;48(2):158–162.
- , , , , , Parental education and guided self‐management of asthma and wheezing in the pre‐school child: a randomised controlled trial. Thorax. 2002;57(1):39–44.
- , , . Structured discharge procedure for children admitted to hospital with acute asthma: a randomised controlled trial of nursing practice. Arch Dis Child. 1999;80(2):110–114.
- , , . Impact of a nurse‐led home management training programme in children admitted to hospital with acute asthma: a randomised controlled study. Thorax. 1997;52(3):223–228.
- , , , et al. You Can Control Asthma: evaluation of an asthma education program for hospitalized inner‐city children. Patient Educ Couns. 1991;17(1):35–47.
- , , . Asthma education by community child health nurses. Arch Dis Child. 1986;61(12):1184–1189.
- , . Effectiveness of a discharge‐planning program and home visits for meeting the physical care needs of children with cancer. Support Care Cancer. 2009;18(2):243–253.
- , , , et al. Comprehensive follow‐up care and life‐threatening illnesses among high‐risk infants: a randomized controlled trial. JAMA. 2000;284(16):2070–2076.
- , , , . Very low birth weight infants and their families during the first year of life: comparisons of medical outcomes based on after care services. J Perinatol. 1998;18(5):365–371.
- , , , , . Description and evaluation of a program for the early discharge of infants from a neonatal intensive care unit. J Pediatr. 1995;127(2):285–290.
- , , , et al. Earlier discharge with community‐based intervention for low birth weight infants: a randomized trial. Pediatrics. 1993;92(1):128–134.
- , , , et al. A randomized clinical trial of early hospital discharge and home follow‐up of very‐low‐birth‐weight infants. N Engl J Med. 1986;315(15):934–939.
- , , . Care transitions from inpatient to outpatient settings: ongoing challenges and emerging best practices. Hosp Pract (1995). 2011;39(3):128–139.
- , , , , . Interventions to reduce 30‐day rehospitalization: a systematic review. Ann Intern Med. 2011;155(8):520–528.
- . Clinical report—physicians' roles in coordinating care of hospitalized children. Pediatrics. 2010;126(4):829–832.
- . White space or black hole: what can we do to improve care transitions? ABIM Foundation. Available at: http://www.abimfoundation.org/∼/media/Files/Publications/F06‐05‐2007_6.ashx. Accessed September 5, 2012.
- , , , et al. Audit and feedback: effects on professional practice and healthcare outcomes. Cochrane Database Syst Rev. 2012;(6):CD000259.
- , , , , . A smoking cessation intervention for parents of children who are hospitalized for respiratory illness: the stop tobacco outreach program. Pediatrics. 2003;111(1):140–145.
- , . A randomized, controlled trial of smoking cessation counseling provided during child hospitalization for respiratory illness. Pediatr Pulmonol. 2008;43(6):561–566.
- , . Embracing chaos and complexity: a quantum change for public health. Am J Public Health. 2008;98(8):1382–1389.
- , , , , , . Outpatient follow‐up and rehospitalizations for sickle cell disease patients. Pediatr Blood Cancer. 2012;58(3):406–409.
- , , . Does having an outpatient visit after hospital discharge reduce the likelihood of readmission? Del Med J. 2003;75(8):291–298.
- , , . Follow‐up after acute asthma episodes. Proc Am Thorac Soc. 2009;6(4):386–393.
- , , , et al. Hospital utilization and characteristics of patients experiencing recurrent readmissions within children's hospitals. JAMA. 2011;305(7):682–690.
- , , , et al. A randomized controlled evaluation of the effect of community health workers on hospitalization for asthma: the asthma coach. Arch Pediatr Adolesc Med. 2009;163(3):225–232.
- , , , . The Seattle‐King County Healthy Homes Project: a randomized, controlled trial of a community health worker intervention to decrease exposure to indoor asthma triggers. Am J Public Health. 2005;95(4):652–659.
- , , , , , . Development and testing of a measure designed to assess the quality of care transitions. Int J Integr Care. 2002;2:e02.
- , , , . Assessing the quality of transitional care: further applications of the care transitions measure. Med Care. 2008;46(3):317–322.
- , , , et al. Hospital readmission and parent perceptions of their child's hospital discharge. Int J Qual Health Care. 2013;25(5):573–581.
- , . Psychometric properties of the Readiness for Hospital Discharge Scale. J Nurs Meas. 2006;14(3):163–180.
The process of discharging a pediatric patient from an acute care facility is currently fraught with difficulties. More than 20% of parents report problems in the transition of care from the hospital to the home and ambulatory care setting.[1] Clinical providers likewise note communication challenges around the time of discharge,[2, 3] especially when inpatient and outpatient providers are different, as with the hospitalist model.[4] Poor communication and problems in discharge transition and continuity of care often culminate in adverse events,[5, 6] including return to emergency department (ED) care and hospital readmission.[7]
Thirty‐day readmissions are common for certain pediatric conditions, such as oncologic diseases, transplantation, and sickle cell anemia and vary significantly across children's hospitals.[8] Discharge planning may decrease 30‐day readmissions in hospitalized adults[9]; however, it is not clear that the same is true in children. Both the preventability of pediatric readmissions[10] and the extent to which readmissions reflect suboptimal care[11] are subjects of debate. Despite these uncertainties, collaborative efforts intended to decrease pediatric readmissions[12] and improve discharge transitions[13, 14] are underway.
To inform these debates and efforts, we undertook a systematic review of the evidence of hospital‐initiated interventions to reduce repeat utilization of the ED and hospital. Acknowledging that existing evidence for condition‐specific discharge interventions in pediatrics might be limited, we sought to identify common elements of successful interventions across pediatric conditions.
METHODS
Search Strategy
With the assistance of a research librarian, we searched MEDLINE and CINAHL (Cumulative Index to Nursing and Allied Health Literature) from the inception of these databases through to March 28, 2012 (for search strategies, see the Supporting Information, Appendix, Part 1, in the online version of this article).
Study Selection
Two authors (K.A. and C.K.) independently reviewed abstracts identified by the initial search, as well as abstracts of references of included articles. Eligibility criteria for inclusion in full review included: (1) discharge‐oriented process or intervention initiated in the inpatient setting, (2) study outcomes related to subsequent utilization including hospital readmission or emergency department visit after hospitalization, (3) child‐ or adolescent‐focused or child‐specific results presented separately, and (4) written or available in English. If abstract review did not sufficiently clarify whether all eligibility criteria were met, the article was included in the full review. Two authors (K.A. and C.K.) independently reviewed articles meeting criteria for full review to determine eligibility. Disagreements regarding inclusion in the final analysis were discussed with all 4 authors. We excluded studies in countries with low or lower‐middle incomes,[15] as discharge interventions in these countries may not be broadly applicable.
Data Abstraction, Quality Assessment, and Data Synthesis
Two authors (K.A. and C.K.) independently abstracted data using a modified Cochrane Collaboration data collection form.[16] We independently scored the included studies using the Downs and Black checklist, which assesses the risk of bias and the quality of both randomized and nonrandomized studies.[17] This checklist yields a composite score of 0 to 28 points, excluding the item assessing power. As many studies either lacked power calculations or included power calculations based on outcomes not included in our review, we performed calculations to determine the sample size needed to detect a decrease in readmission or ED utilization by 20% from baseline or control rates. Due to the heterogeneous nature of included studies in terms of population, interventions, study design, and outcomes, meta‐analysis was not performed.
RESULTS
Electronic search yielded a total of 1296 unique citations. Review of abstracts identified 40 studies for full article review. We identified 10 articles that met all inclusion criteria. Subsequent review of references of included articles identified 20 additional articles for full review, 7 of which met all inclusion criteria. However, 3 articles[18, 19, 20] assessed the impact of violence interventions primarily on preventing reinjury and recidivism and thus were excluded (see Supporting Information, Appendix, Part 2, in the online version of this article for findings of the 3 articles). In total, we included 14 articles in our review[21, 22, 23, 24, 25, 26, 27, 28, 29, 30, 31, 32, 33, 34] (Figure 1).
Patient Populations and Intervention Timing and Components
Studies varied regarding the specific medical conditions they evaluated. Eight of the papers reported discharge interventions for children with asthma, 5 papers focused on discharge from the neonatal intensive care unit (NICU), and a final study discussed a discharge intervention for children with cancer (Table 1). Although our primary goal was to synthesize discharge interventions across pediatric conditions, we provide a summary of discharge interventions by condition (see Supporting Information, Appendix, Part 3, in the online version of this article).
| Author, Year | Study Design | Age | Inclusion | Exclusion | Intervention | Control |
|---|---|---|---|---|---|---|
| ||||||
| Asthma | ||||||
| Davis, 2011[21] | Retrospective matched case control | 12 months18 years | Admitted for asthma at a single hospital in California. | 45 minutes of enhanced asthma education and phone call 3 weeks after discharge (n=698) | Patients were matched on age and past utilization who received standard education/care (n=698) | |
| Espinoza‐Palma, 2009[22] | RCT | 515 years | Admitted for asthma at a single hospital in Chile. | Chronic lung disease or neurologic alteration. | Self‐management education program with a postdischarge game to reinforce educational concepts (n=42) | Standard education (n=46) |
| Ng, 2006[23] | RCT | 215 years | Admitted for asthma in a pediatric ward at a single hospital in China. | Admitted to PICU or non‐Chinese speaking. | Evaluation by asthma nurse, animated asthma education booklet, 50‐minute discharge teaching session, follow‐up by phone at 1 week (n=55) | Evaluation by asthma nurse by physician referral, a written asthma education booklet, 30‐minute discharge teaching session (n=45) |
| Stevens, 2002[24] | RCT | 18 months5 years | In ED or admitted with primary diagnosis of asthma/wheezing at 2 hospitals in the United Kingdom. | Admitted when no researcher available. | Enhanced asthma education and follow‐up in a clinic 1 month after encounter (n=101) | Usual care (n=99) |
| Wesseldine, 1999[25] | RCT | 216 years | Admitted for asthma at a single hospital in the United Kingdom. | Admitted when no researcher available. | 20 minutes of enhanced asthma education including: guided self‐management plan, booklet, asthma hotline contact, and sometimes oral steroids (n=80) | Standard discharge that varied by provider (n=80) |
| Madge, 1997[26] | RCT | 214 years | Admitted for asthma at a single hospital in the United Kingdom. | Admitted on weekend. | 45 minutes of enhanced asthma education with written asthma plan, a nurse follow‐up visit 23 weeks postdischarge, telephone support, and a course of oral steroids (n=96) | Standard education (did not include written asthma plan) (n=105) |
| Taggart, 1991[27] | Pre‐post | 612 years | Admitted for asthma at single institution in Washington, DC with history of at least one ED visit in prior 6 months. | If resided outside of metro area. | Received written educational materials, adherence assistance, discussed emotions of asthma, video education provided, and tailored nursing interactions (n=40) | Enrolled patient's prior utilization |
| Mitchell, 1986[28] | RCT | >2 years | Admitted for asthma at single institution in New Zealand. | Having a previous life‐threatening attack. | 6 monthly postdischarge education sessions on lung anatomy/physiology, triggers and avoidance, asthma medication, advice on when and where to seek care (n=94 children of European descent, n=84 children of Polynesian descent) | Standard discharge (n=106 children of European descent; n=84 children of Polynesian descent) |
| Cancer | ||||||
| Caliskan Yilmaz, 2009[29] | Quasiexperimental | <18 years | New oncologic diagnoses in hospital in Turkey. | Children who died during follow‐up. | Frequent needs assessment, education, home visits, fever guidance, telephone consultation, and manual for home care; patients lived in Izmir (n=25) | Routine hospital services without formal education; patients lived outside of Izmir (n=24) |
| NICU | ||||||
| Broyles, 2000[30] | RCT | Neonate | Infants with birth weight <1500 g with mechanical vent use in 48 hours of life, born at single NICU in Texas. | Infant death, infant adopted or moved out of enrollment county. | Specialized follow‐up available 5 days a week for well or sick visits; access to medical advice via phone 24 hours a day, transportation to ED provided when needed; home visitation, parent education, and "foster grandmother" offered (n=446) | Specialized follow‐up available 2 mornings a week for well or sick visits; all other sick visits to be made through acute care clinic or ED (n=441) |
| Finello, 1998[31] | RCT | Neonate | Infants with birth weight between 750 and1750 g; discharged from 2 NICUs in California. | Infants with gross abnormalities. | Three separate intervention groups (n=20 in each): (1) home healthhome visits during the first 4 weeks after discharge, with physician consultation available at all times; (2) home visitinghealth and development support, parental support, support with referral services for 2 years after discharge; (3) home health and home visiting arms combined | Standard discharge (n=20). |
| Kotagal, 1995[32] | Pre‐post | Neonate | Infants discharged from a single NICU in Ohio. | Patients (n=257) discharged after restructuring of discharge practices including: removal of discharge weight criteria, engagement of family prior to discharge, evaluation of home environment prior to discharge, and arrangement of home health visits and follow‐up | Patients discharged before discharge restructuring (n=483) | |
| Casiro, 1993[33] | RCT | Neonate | Infants meeting discharge criteria from 1 of 2 NICUs in Canada. | Congenital anomalies, chronic neonatal illness, parent refusal, family complications, and death. | Early discharge based on prespecified criteria with 8 weeks of services including: assistance with infant care, sibling care and housekeeping; nurse availability via phone; follow‐up phone calls and home visitation tailored to family need (n=50) | Discharged at the discretion of their attending physicians; standard newborn public health referral for routine follow‐up (n=50) |
| Brooten, 1986[34] | RCT | Neonate | Infants born <1500 g at a single NICU in Pennsylvania. | Death, life‐threatening congenital anomalies, grade 4 IVH, surgical history, O2 requirement >10 weeks, family complications. | Early discharge based on prespecified criteria with weekly education prior to discharge, postdischarge follow‐up phone call, and home nurse visitation; consistent nurse availability via phone (n=39) | Standard discharge practices with a discharge weight minimum of 2.2 kg (n=40) |
Studies varied regarding the timing and nature of the intervention components. Eight discharge interventions included a major inpatient component, in addition to outpatient support or follow‐up.[21, 23, 24, 25, 26, 29, 32, 34] Two studies included an inpatient education component only.[22, 27] The remainder were initiated during index hospitalization but focused primarily on home visitation, enhanced follow‐up, and support after discharge (Figure 2).[28, 30, 31, 33]
Outcome Assessment Methods
Readmission and subsequent ED utilization events were identified using multiple techniques. Some authors accessed claims records to capture all outcomes.[30, 33] Others relied on chart review.[21, 25, 26, 27, 28, 31, 32] One study supplemented hospital records with outpatient records.[24] Some investigators used parental reports.[22, 23, 31] Two studies did not describe methods for identifying postdischarge events.[29, 34]
Study Quality
The quality of the included studies varied (Table 2). Many of the studies had inadequate sample size to detect a difference in either readmission or ED visit subsequent to discharge. Eight studies found differences in either subsequent ED utilization, hospitalization, or both and were considered adequately powered for these specific outcomes.[21, 23, 25, 26, 28, 30, 31, 32] In contrast, among studies with readmission as an outcome, 6 were not adequately powered to detect a difference in this particular outcome.[24, 30, 31, 32, 33, 34] In these 6 studies, all except 1 study30 had <10% of the sample size required to detect differences in readmission. Further, 2 studies that examined ED utilization were underpowered to detect differences between intervention and control groups.[24, 26] We were unable to perform power calculations for 3 studies,[22, 27, 29] as the authors presented the number of events without clear denominators.
| Author, Year | Study Design | D&B Score* | Adequately Powered (Yes/No)** | Timing of Outcome | Major Findings | Major Limitations |
|---|---|---|---|---|---|---|
| ||||||
| Asthma | ||||||
| Davis, 2011[21] | Retrospective matched case control | 14 | Readmission: N/A; ED: yes | 1 year | Patients with enhanced education had higher hazards of return to ED visit. | Intervention not randomized; only 29% of eligible children enrolled with unclear selection decisions due to lack of study personnel or caregiver presence in hospital; only 67% completed the intervention; 50% of patients were not local; follow‐up was not well described. |
| Espinoza‐Palma, 2009[22] | RCT | 19 | Readmission: b; ED:b | 1 year | No difference between the intervention and control in hospitalizations or ED visits. ED visits and hospitalizations decreased in year after compared to the year prior for both intervention and control. | Pre‐post analysis with similar effects in cases and controls, results may reflect regression to mean; follow‐up was not well described, and 12.5% who were lost to follow‐up were excluded from analysis; study was in Chile with different demographics than in the United States. |
| Ng, 2006[23] | RCT | 20 | Readmission: yes; ED: yes | 3 months | Patients in the intervention group were less likely to be readmitted or visit the ED. | Recruitment/refusal was not well described; number lost to follow‐up was not reported; study was in China with different demographics than the United States. |
| Stevens, 2002[24] | RCT | 20 | Readmission: no ED: no | 1 year | No differences between intervention and control for any outcomes. | 11% were lost to follow‐up; number of patients who refused was not reported; analysis did not adjust for site of recruitment (ED vs inpatient); 30% of children did not have a prior diagnosis of asthma; study was in England with different demographics than in the United States. |
| Wesseldine, 1999[25] | RCT | 20 | Readmission: yes; ED: yes | 6 months | Patients in intervention group less likely to be readmitted or visit ED. | Unclear if intervention group received oral steroids that might drive effect; number lost to follow‐up was not reported; high miss rate for recruitment; study was in England with different demographics than the United States. |
| Madge, 1997 [26] | RCT | 22 | Readmission: yes; ED: no | 214 months | Patients in intervention group were less likely to be readmitted compared to controls. No differences in repeat ED visits. | Unclear if education or oral steroids drove effect; number of patients who refused or were lost to follow‐not reported; time to outcome (214 months) varied for different patients, which may introduce bias given the seasonality of asthma; study was in Scotland with different demographics than the United States. |
| Taggart, 1991[27] | Pre‐post | 12 | Readmission:b; ED:b | 15 months | Overall there was no change in ED or hospitalization utilization from pre to post. When limited to children with severe asthma, there was a decrease in ED utilization after the intervention compared to prior ED use. | Use of historical utilization as a comparison does not account for potential effects of regression to mean or improvement with age; over one‐half of eligible patients were excluded due to lack of consent or inability to collect baseline data; inclusion criterion did not specify that prior utilization was necessarily for asthma exacerbation; number lost to follow‐up was not reported. |
| Mitchell, 1986[28] | RCT | 14 | Readmission: yesc; ED: N/A | 6 months and 618 months | Increase in percentage of readmission between 6 and 18 months for children of European descent. | Unclear exclusion criterion; full compliance with intervention only 52%; number of patients lost to follow‐up (outcome) was not reported; statistical analysis was not clearly described. |
| Cancer | ||||||
| Caliskan Yilmaz, 2009[29] | Quasiexperimental | 10 | Readmission:b; ED: N/A | Not specified | For the first readmission to the hospital, more of the readmissions were planned in the intervention group compared to the control group. Number of readmissions was not assessed. | Intervention was not randomized; children who died were excluded (4%); planned vs unplanned distinction not validated; unclear cointerventions regarding chemotherapy administration; recruitment and follow‐up was not well described; not all comparisons were described in methods. |
| NICU | ||||||
| Broyles, 2000[30] | RCT | 23 | Readmission: no; ED: yes | At 1 year adjusted age | Overall hospitalization rates were similar but there were fewer admissions to the ICU. Intervention group had fewer ED visits. Total costs were less in intervention group. | 10% refused to participate or consent was not sought, and 12% were excluded after randomization; different periods of follow‐up (outcomes observed at 1 year of life regardless of discharge timing); analysis did not adjust for site of recruitment (1 of 2 nurseries). |
| Finello, 1998[31] | RCT | 11 | Readmission: nod; ED: yes | At 6 months adjusted age and between 6 and 12 months adjusted age | No changes in hospitalization rates.d The home health+home visit arm had fewer ED visits between 6 and 12 months of life. Intervention was reported as saving money by decreasing initial length of stay. | Inclusion and exclusion criteria, recruitment/refusal, outcomes, and analysis plan were not clearly described; sample size was too small for effective randomization; different periods of follow‐up (outcomes observed at 1 year of life regardless of discharge timing); analysis did not adjust for site of recruitment; 15% of outcomes were missing. |
| Kotagal, 1995[32] | Pre‐post | 15 | Readmission: no; ED: yes | 14 days | Decreased number of ED visits in patients in intervention. No difference in readmission. Costs and length of stay were less in intervention. | Designed to decrease length of stay; pre‐post nature of study allows for possibility of other changes to practices other than the intervention. |
| Casiro, 1993[33] | RCT | 18 | Readmission: no; ED: N/A | 1 year of life | There were no differences in the readmissions or number of ambulatory care visits after discharge. Infants were discharged earlier in the intervention group, which resulted in cost savings. | Designed to decrease length of stay; 13% refused or were excluded due to family complications; and 8% were lost to follow‐up; different periods of follow‐up (outcomes observed at 1 year of life regardless of discharge timing); analysis did not adjust for site of recruitment (1 of 2 nurseries); 81% of infants were born to Caucasian women, which may limit generalizability. |
| Brooten, 1986[34] | RCT | 15 | Readmission: no; ED: N/A | 14 days and 18 months | No difference in readmission. Significantly lower charges during initial hospitalization for intervention group. | Designed to decrease length of stay; unclear when randomization occurred and exclusions unclear; 12.5% were excluded due to refusal or family issues; follow‐up not well described, and loss to follow‐up was unknown. |
Excluding the assessment of statistical power, Downs and Black scores ranged from 10 to 23 (maximum 28 possible points) indicating varying quality. As would be expected with discharge interventions, studies did not blind participants; 2 studies did, however, appropriately blind the outcome evaluators to intervention assignment.[22, 30] Even though 10 out of the 14 studies were randomized controlled trials, randomization may not have been completely effective due to sample size being too small for effective randomization,[31] large numbers of excluded subjects after randomization,[30] and unclear randomization process.[34] Several studies had varying follow‐up periods for patients within a given study. For example, 3 NICU studies assessed readmission at 1‐year corrected age,[30, 31, 33] creating the analytic difficulty that the amount of time a given patient was at risk for readmission was dependent on when the patient was discharged, yet this was not accounted for in the analyses. Only 2 studies demonstrated low rates of loss to follow‐up (<10%).[30, 33] The remainder of the studies either had high incompletion/loss to follow‐up rates (>10%)[22, 24, 31] or did not report rates.[21, 23, 25, 26, 27, 28, 29, 32, 34] Finally, 3 studies recruited patients from multiple sites,[24, 31, 33] and none adjusted for potential differences in effect based on enrollment site.
Findings Across Patient Populations Regarding Readmission
Of the 4 studies that demonstrated change in overall readmission,[23, 25, 26, 28] all were asthma focused; 3 demonstrated a decrease in readmissions,[23, 25, 26] and 1 an increase in readmissions.[28] The 3 effective interventions included 1‐on‐1 inpatient education delivered by an asthma nurse, in addition to postdischarge follow‐up support, either by telephone or clinic visit. Two of these interventions provided rescue oral steroids to some patients on discharge.[25, 26] In contrast, a study from New Zealand evaluated a series of postdischarge visits using an existing public health nurse infrastructure and demonstrated an increase in readmission between 6 to 18 months after admission in European children.[28] An additional study focused on outpatient support after discharge from the NICU, and demonstrated a lower frequency of readmission to the intensive care unit without overall reduction of hospital readmission (Tables 1 and 2).[30]
Findings Across Patient Populations Regarding Subsequent ED Visits
Of all the discharge interventions, 6 demonstrated differences in return to the ED after discharge. Five studies described a decrease in ED visits after hospitalization,[23, 25, 30, 31, 32] and 1 showed an increase.[21] Three studies in the NICU population demonstrated decreased ED utilization through a combination of augmented family engagement during hospitalization and/or enhanced support after discharge. Two inpatient asthma education interventions with structured postdischarge follow‐up decreased return visitation to the ED.[23, 26] The intervention that worsened subsequent ED utilization (ie, increased ED visit hazard compared to matched controls) provided enhanced inpatient education to a nonrandom group of children hospitalized with asthma and provided a follow‐up phone call 3 weeks after discharge (Tables 1 and 2).[21]
DISCUSSION
In this review, we synthesized evidence regarding pediatric hospital discharge‐focused interventions intended to reduce subsequent utilization through decreased readmission and ED visits. Our review identified 14 studies clustered in 3 clinical areas: asthma, NICU care (chiefly prematurity), and cancer. Overall, 6 interventions demonstrated a reduction either in subsequent hospitalization or ED use. Four of the 6 positive interventions included both an enhanced inpatient education and engagement component as well as enhanced follow‐up after discharge. Importantly, all of the interventions were multifaceted; thus, we could not ascertain which specific aspects of the interventions mediated the change. Many of the included studies had significant methodological limitations.
Current Conceptual Framework
There are a number of existing discharge transitional care frameworks from prior studies[35, 36] and professional societies.[37] The Stepping Up to the Plate (SUTTP) alliance, a collaborative of 9 professional organizations, including the American Academy of Pediatrics, introduced 1 such framework in 2007. SUTTP sought to enhance care transitions by outlining principles of discharge transitional care including: (1) enhanced accountability, (2) creation of a central coordination hub charged with communicating expectations for care, (3) clear and direct communication of treatment plans and follow‐up, (4) timely feedback/feed‐forward of relevant information, and (5) involvement of family member at every stage.[38] In the context of the SUTTP framework, we present 3 hypotheses based on our findings to guide future work.
Hypothesis: Appointing a Dedicated Individual or Coordinating Hub Reduces Subsequent Utilization
Ostensibly, each discharge intervention included in this review sought to enhance accountability of providers or their health systems for discharge transitional care. Two of the asthma interventions appointed a particular provider to coordinate the discharge transition and demonstrated reductions in readmission.[25, 26] The successful NICU discharge interventions provided an integrated accountability structure across the health system, with a transition of accountability to an outpatient provider or central coordinating hub available to provide assistance and resources for an extended period following discharge.
By contrast, interventions with more than 1 individual intervener or without a centrally coordinated system for discharge transitional care tended not to demonstrate reduction in subsequent utilization.[21, 24, 27, 28] In fact, the 1 asthma intervention that utilized a previously existing public health nurse infrastructure demonstrated an increase in readmission.[28] Future efforts to enhance transitional care might investigate directly the impact of accountability structure on subsequent utilization by varying the number of effector individuals or the organization to which they report (eg, hospital system vs public health department).
Hypothesis: Individualized Task Learning and Feedback Enhances Effectiveness
Studies varied with respect to the extent they incorporated the principles of enhanced communication of the treatment and follow‐up plan and timely feedback/feed‐forward of relevant information. Successful efforts, however, seemed to embrace these strategies. Each of the 3 interventions that demonstrated readmission reduction[23, 25, 26] developed an individualized treatment plan during hospitalization, with either a specific follow‐up plan or resources for outpatient support. Two of these interventions assessed asthma inhaler technique prior to discharge, creating an inpatient audit and feedback loop allowing for assessment of competence prior to discharge. Audit and feedback has demonstrated promise modifying provider behavior[39] and is a plausible approach to enhancing patient and family self‐care.
Hypothesis: Timing of Intervention Enhances Effectiveness
Discrete sentinel events such as inpatient admission, may serve as a teachable moment[40, 41] or a tipping point[42] for some patients/families to initiate behavior change. Four of the 6 positive studies had a robust inpatient education component. By providing enhanced inpatient support, providers may be engaging the family at a timely opportunity to improve care. Both timing of the intervention (at admission vs discharge) and content (education‐ vs family‐engagement focused) are likely important to their effect and should be further explored with prospective study.
Persistent Literature Gaps
Follow‐up with a primary care provider after discharge is another intervention that might decrease postdischarge utilization. We did not identify any studies that specifically examined primary care follow‐up. However, 2 studies[43, 44] that did not meet our inclusion criteria (because they included adults and did not stratify by age group in the analysis) examined any outpatient follow‐up after discharge using state‐specific Medicaid claims. One study found that outpatient follow‐up after sickle cell hospitalization was associated with lower rates of readmission.[43] The other found no difference in readmission across multiple conditions.[44] One recent review of outpatient follow‐up from the ED for asthma found that even when increases in follow‐up were achieved, no reduction in the subsequent utilization was observed.[45]
Additional important questions remain underexplored. First, are condition‐specific interventions superior to those that span conditions? All of the interventions that demonstrated reductions in readmission were condition‐specific, yet no generic interventions met our inclusion criteria. Importantly, only 1 study[29] in our review examined discharge processes from 1 of the pediatric conditions with the most variation[8] in readmission. Further, no studies focused on children with complex medical conditions, who are known to be at increased risk of readmission,[46] indicating a sizable knowledge gap persists in understanding how to prevent readmissions in the most vulnerable pediatric populations.
Lastly, who are the most appropriate effector individuals for discharge‐focused transitional care interventions? Demographically matched effector individuals have shown promise in improving care using community health workers.[47, 48] The degree to which the identity of the intervener mediates subsequent ED and hospital utilization warrants further investigation.
Limitations of This Systematic Review
The studies included in this review assessed different outcomes at different intervals, precluding meta‐analysis. With greater consistency in the collection of data on the quality of discharge processes and their subsequent outcomes, future studies may offer further clarity as to which discharge‐oriented practices are more effective than others. Because we only identified literature in 3 pediatric conditions, generalizability beyond these conditions may be limited. The settings of the interventions also occurred in multiple countries; we excluded countries from low or low‐middle incomes to facilitate generalizability. As many of the discharge processes contained multiple interventions, it is not possible to ascertain which, if any, singular action may decrease posthospitalization utilization. Additionally, some of the included interventions are older, and it is plausible that discharge processes have evolved with the expansion of the hospitalist model.
Methods of data collection influence the quality of results in the included studies. Most of the studies included in this review used either medical record review or parental self‐report of utilization. Parental report may be sufficient for hospitalizations and ED utilization; however, it is subject to recall bias. Chart review likely underestimates the number of postdischarge events, depending on the individual institution's proportion of the market and the tendency of individuals to seek care at multiple institutions. Claims data may offer the most accurate assessments of ED and hospital utilization and cost, but can be more difficult to obtain and do not provide the same potential for granularity as parent report or medical records review.
Finally, subsequent ED visits, readmissions, and cost may not be the best measures of the quality of discharge transitional care. A number of tools have been developed to more specifically evaluate the quality of transitional care in adults,[49, 50] including a validated instrument that consists of only 3 items,[50] which primarily assesses the extent to which patients are prepared for self‐care upon discharge. For pediatric populations, validated tools assessing caregiver experience with discharge[51] and discharge readiness[52] are also available. These instruments may assist those interested in assessing process‐related outcomes that specifically assess discharge transitional care elements and may mediate subsequent ED visits or hospitalizations.
CONCLUSION
Successful discharge interventions to reduce pediatric readmission and ED have some common features, including an individual or team with specialized knowledge of the condition that assumed responsibility for the inpatient‐to‐outpatient transition and offered ongoing support to the family following discharge. All studies included in our review examined multiple discharge interventions; however, many did not have enough participants to detect differences in the outcomes of interest. Future studies might adapt common features of effective interventions, which are consistent with professional societies' recommendations.
Acknowledgements
The authors thank Marisa Conte for her help with developing the search algorithms for the review.
Disclosures: Drs. Auger and Kenyon received salary support from the Robert Wood Johnson Foundation Clinical Scholars program. Dr. Feudtner does not have any funding sources to disclose. Dr. Davis is funded in part by the Michigan Department of Community Health to serve as the Chief Medical Executive. The views expressed herein are not necessarily the views of the Department of Community Health. The authors have no conflicts of interest to report.
- , , , , . Are hospital characteristics associated with parental views of pediatric inpatient care quality? Pediatrics. 2003;111(2):308–314.
- , , , , , . Deficits in communication and information transfer between hospital‐based and primary care physicians: implications for patient safety and continuity of care. JAMA. 2007;297(8):831–841.
- , , , et al. Improving transitions of care at hospital discharge‐‐implications for pediatric hospitalists and primary care providers. J Healthc Qual. 2010;32(5):51–60.
- , . Hospitalists in children's hospitals: what we know now and what we need to know. J Pediatr. 2006;148(3):296–299.
- , , , , . The incidence and severity of adverse events affecting patients after discharge from the hospital. Ann Intern Med. 2003;138(3):161–167.
- , , , et al. Adverse events among medical patients after discharge from hospital. CMAJ. 2004;170(3):345–349.
- , , , . Medical errors related to discontinuity of care from an inpatient to an outpatient setting. J Gen Intern Med. 2003;18(8):646–651.
- , , , et al. Pediatric readmission prevalence and variability across hospitals. JAMA. 2013;309:372–380.
- , , , , , . Discharge planning from hospital to home. Cochrane Database Syst Rev. 2013;(1):CD000313.
- , , , , , . Preventability of early readmissions at a children's hospital. Pediatrics. 2012;131(1):e171–e181.
- , , , et al. State‐level child health system performance and the likelihood of readmission to children's hospitals. J Pediatr. 2010;157(1):98–102.e1.
- Ohio Children's Hospitals' solutions for patient safety. Available at: http://solutionsforpatientsafety.org/files/sps‐fact‐sheet.pdf. Accessed July 24, 2013.
- American Academy of Pediatrics. Value in inpatient pediatrics (VIP) network projects. Available at: http://www.aap.org/en‐us/professional‐resources/practice‐support/quality‐improvement/Quality‐Improvement‐Innovation‐Networks/Pages/Value‐in‐Inpatient‐Pediatrics‐Network‐Projects.aspx. Accessed July 24, 2013.
- Child Health Corporation of America. Resources for managing the patient discharge process. Available at: http://www.chca.com/news/index.html. Accessed October 31, 2013.
- The World Bank. World Development Indicators 2012. Available at: http://data.worldbank.org/sites/default/files/wdi‐2012‐ebook.pdf. Accessed July 5, 2013.
- The Cochrane Collaboration. Data collection form: Intervention review—RCTs and non‐RCTs. Available at: http://hiv.cochrane.org/sites/hiv.cochrane.org/files/uploads/Data%20extraction%20form_all%20studies.docx. Accessed July 24, 2013.
- , . The feasibility of creating a checklist for the assessment of the methodological quality both of randomised and non‐randomised studies of health care interventions. J Epidemiol Community Health. 1998;52(6):377–384.
- , , , et al. Brief violence interventions with community case management services are effective for high‐risk trauma patients. J Trauma. 2011;71(1):228–237.
- , , , , , . Benefits of a hospital‐based peer intervention program for violently injured youth. J Am Coll Surg. 2007;205(5):684–689.
- , , , , . Caught in the crossfire: the effects of a peer‐based intervention program for violently injured youth. J Adolesc Health. 2004;34(3):177–183.
- , , , , . A matched‐cohort evaluation of a bedside asthma intervention for patients hospitalized at a large urban children's hospital. J Urban Health. 2011;88(suppl 1):49–60.
- , , , et al. Effectiveness of asthma education with and without a self‐management plan in hospitalized children. J Asthma. 2009;46(9):906–910.
- , , , , And . Effect of a structured asthma education program on hospitalized asthmatic children: a randomized controlled study. Pediatr Int. 2006;48(2):158–162.
- , , , , , Parental education and guided self‐management of asthma and wheezing in the pre‐school child: a randomised controlled trial. Thorax. 2002;57(1):39–44.
- , , . Structured discharge procedure for children admitted to hospital with acute asthma: a randomised controlled trial of nursing practice. Arch Dis Child. 1999;80(2):110–114.
- , , . Impact of a nurse‐led home management training programme in children admitted to hospital with acute asthma: a randomised controlled study. Thorax. 1997;52(3):223–228.
- , , , et al. You Can Control Asthma: evaluation of an asthma education program for hospitalized inner‐city children. Patient Educ Couns. 1991;17(1):35–47.
- , , . Asthma education by community child health nurses. Arch Dis Child. 1986;61(12):1184–1189.
- , . Effectiveness of a discharge‐planning program and home visits for meeting the physical care needs of children with cancer. Support Care Cancer. 2009;18(2):243–253.
- , , , et al. Comprehensive follow‐up care and life‐threatening illnesses among high‐risk infants: a randomized controlled trial. JAMA. 2000;284(16):2070–2076.
- , , , . Very low birth weight infants and their families during the first year of life: comparisons of medical outcomes based on after care services. J Perinatol. 1998;18(5):365–371.
- , , , , . Description and evaluation of a program for the early discharge of infants from a neonatal intensive care unit. J Pediatr. 1995;127(2):285–290.
- , , , et al. Earlier discharge with community‐based intervention for low birth weight infants: a randomized trial. Pediatrics. 1993;92(1):128–134.
- , , , et al. A randomized clinical trial of early hospital discharge and home follow‐up of very‐low‐birth‐weight infants. N Engl J Med. 1986;315(15):934–939.
- , , . Care transitions from inpatient to outpatient settings: ongoing challenges and emerging best practices. Hosp Pract (1995). 2011;39(3):128–139.
- , , , , . Interventions to reduce 30‐day rehospitalization: a systematic review. Ann Intern Med. 2011;155(8):520–528.
- . Clinical report—physicians' roles in coordinating care of hospitalized children. Pediatrics. 2010;126(4):829–832.
- . White space or black hole: what can we do to improve care transitions? ABIM Foundation. Available at: http://www.abimfoundation.org/∼/media/Files/Publications/F06‐05‐2007_6.ashx. Accessed September 5, 2012.
- , , , et al. Audit and feedback: effects on professional practice and healthcare outcomes. Cochrane Database Syst Rev. 2012;(6):CD000259.
- , , , , . A smoking cessation intervention for parents of children who are hospitalized for respiratory illness: the stop tobacco outreach program. Pediatrics. 2003;111(1):140–145.
- , . A randomized, controlled trial of smoking cessation counseling provided during child hospitalization for respiratory illness. Pediatr Pulmonol. 2008;43(6):561–566.
- , . Embracing chaos and complexity: a quantum change for public health. Am J Public Health. 2008;98(8):1382–1389.
- , , , , , . Outpatient follow‐up and rehospitalizations for sickle cell disease patients. Pediatr Blood Cancer. 2012;58(3):406–409.
- , , . Does having an outpatient visit after hospital discharge reduce the likelihood of readmission? Del Med J. 2003;75(8):291–298.
- , , . Follow‐up after acute asthma episodes. Proc Am Thorac Soc. 2009;6(4):386–393.
- , , , et al. Hospital utilization and characteristics of patients experiencing recurrent readmissions within children's hospitals. JAMA. 2011;305(7):682–690.
- , , , et al. A randomized controlled evaluation of the effect of community health workers on hospitalization for asthma: the asthma coach. Arch Pediatr Adolesc Med. 2009;163(3):225–232.
- , , , . The Seattle‐King County Healthy Homes Project: a randomized, controlled trial of a community health worker intervention to decrease exposure to indoor asthma triggers. Am J Public Health. 2005;95(4):652–659.
- , , , , , . Development and testing of a measure designed to assess the quality of care transitions. Int J Integr Care. 2002;2:e02.
- , , , . Assessing the quality of transitional care: further applications of the care transitions measure. Med Care. 2008;46(3):317–322.
- , , , et al. Hospital readmission and parent perceptions of their child's hospital discharge. Int J Qual Health Care. 2013;25(5):573–581.
- , . Psychometric properties of the Readiness for Hospital Discharge Scale. J Nurs Meas. 2006;14(3):163–180.
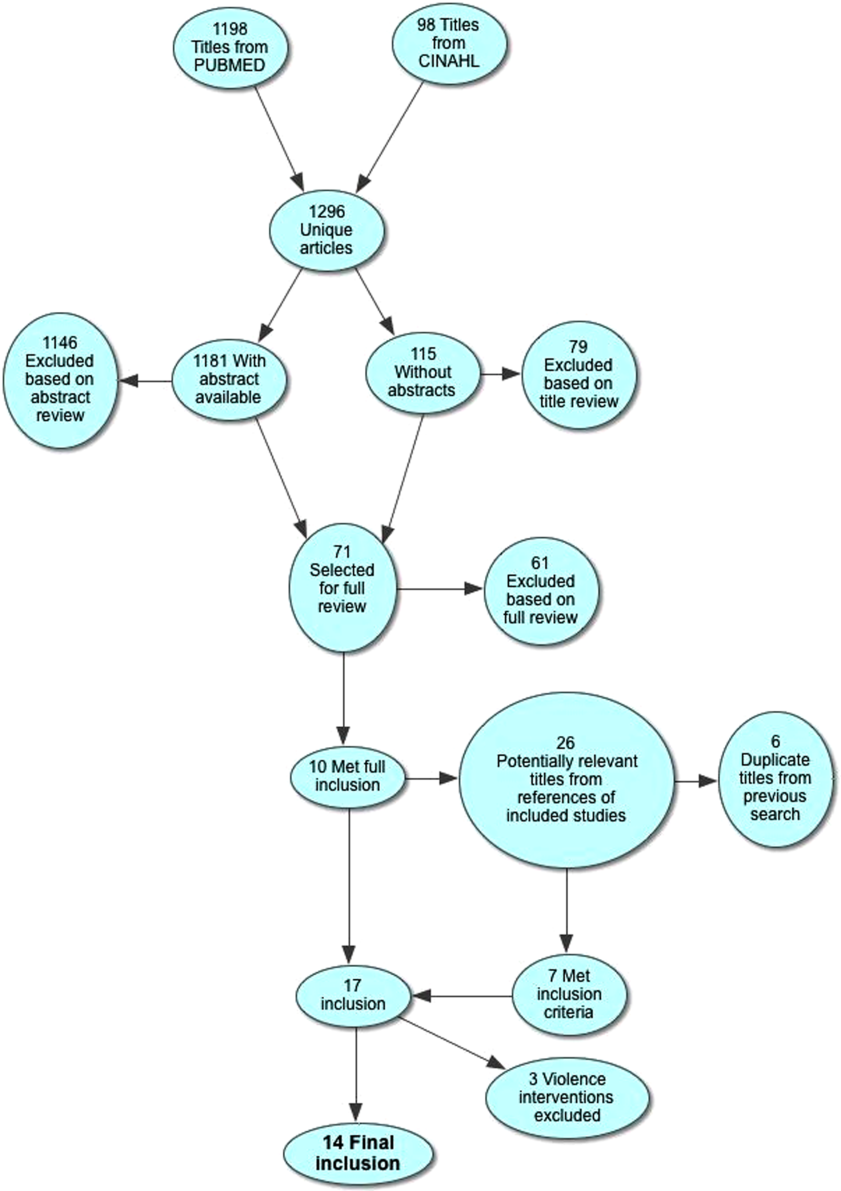
Hospitals and Recession
With the United States mired in its most severe recession in decades, stories of hospital struggles have emerged. Beaumont Hospital, located near the headquarters of major automakers and several assembly plants outside Detroit, recently cut hundreds of jobs and put major construction on indefinite hold.1 The CEO of Boston's Beth Israel Deaconess Medical Center made an agreement with employees to take large cuts in pay and vacation time to prevent laying off 10% of the staff.2 The University of Chicago Medical Center made plans to limit the number of emergency room beds, thereby decreasing low‐reimbursing emergency admissions while making beds available for higher‐paying elective hospitalizations.3
What is surprising about these stories is that hospitals have long been considered recession‐proof. Yet, with one‐half of US hospitals having reduced their staff to balance their budgets4 and with hospitals' financial margins falling dramatically,5 economic struggles are now a widespread problem.
Furthermore, it is difficult to determine if hospitals' clinical care has been damaged by the recession. The measurement of hospital quality is new and still under‐developed: there is virtually no reliable information on hospital quality from previous recessions, and even now it will be difficult to assess quality in real time.
Critics of waste and excess in the US health care system may see tough economic times as a Darwinian proving ground for hospitals, through which efficiency will improve and poor performers will close their doors. But more likely, hospital cutbacks will risk the quality and safety of health care delivery. For reasons of both public health and fiscal impact on communities, state and federal leaders may need to watch these trends closely to design and to be ready to implement potential government remedies for hospitals' fiscal woes.
In this commentary, we describe how hospitals have fared historically during recessions, how this recession could have different effectsfirst fiscally, then clinically, and we examine policy options to mitigate these untoward effects.
Decades of Recession‐Proof Hospitals
During the Great Depression, hospital insolvency was a national problem that prompted federal and state aid. Keeping hospitals alive was a critical policy goal and proved central to the early development of health insurance that focused on payment for hospital care.6
Since WWII, growth in America's hospitals has been only loosely related to national macroeconomic trends, with other changes like technological innovations and the advent of managed care far more influential to hospital finances. In fact, during recessions, hospital care spending growth often escalates in tandem with worsening unemployment (Figure 1). One explanation for this phenomenon is that economic pressures lead to declining primary care utilization, with adverse consequences for individuals' health.7

Hospitals' Current Fiscal Vulnerability
However, the current recession is the worst in 70 years. Every method of income generation available to hospitals appears at risk, including reimbursement per discharge (70% of hospitals report moderate or significant increases in uncompensated care), number of inpatient admissions (over one‐half report a moderate or significant decrease), difficulty obtaining bonds (60% report at least significant problems), and charitable donations.4 Over 50% of US hospitals had negative margins in the fourth quarter of 2008, though there has been some improvement since that time.8
Future hospital stability concerns remain. Growth in revenue per discharge is still below the norm.5 Because employment lags a recovering economy, further reimbursement decreases are possible from increasing proportions of patients with low‐reimbursing insurers or no coverage at all, decreasing payment rates from all payers, and decreasing elective care. The lower‐reimbursing payers, like state Medicaid programs, are experiencing increased enrollment as Americans lose their jobs and their better‐paying, employer‐sponsored private insurance.9 There's also evidence that reimbursement rates are declining from both Medicare and private insurers,10 which threatens the fragile cost‐shift through which hospitals have long used private insurance reimbursement to subsidize government reimbursements.11
Hospitals' specific financial challenges will likely vary across markets. The authors' state of Michigan has been hit particularly long and hard by the current recession. Unemployment rates exceeding 11% are expected to cause dramatic losses in private health insurance.9 Patients' increasing need with decreasing ability to pay will make markets in the deepest recession particularly vulnerable.
Hospital Quality and Safety at Risk?
The effect of the recession on the quality of hospital care is less clear. Until the 1990s, hospital quality was essentially assumed and virtually unmeasured. Even now, measuring hospital quality is difficult and rarely timely. Medicare data often take 1 to 2 years to become publicly available for analysis. Reports by trade organizations like the American Hospital Association are up‐to‐date but have conflicts of interest and are less rigorous. The most timely measures of hospitals' distressflawed as they may bewill come from the hospitals themselves, just like reports of economic woe from other businesses and government agencies during challenging economic times.
However, since the publication of the 1999 report To Err is Human,12 major improvements in hospital quality and safety have transformed the delivery of inpatient care. These improvements have taken the form of simple interventions like nationally consistent medical abbreviations, management initiatives like Six Sigma, and technological advances including computerized health records.
Nonetheless, during this recession and recovery, slashed hospital budgets may slow or even stop the momentum towards further improvements in quality and safety. Frontline care delivery could be at risk. Understaffed and under financed hospitals are rarely safe. Dissatisfaction and layoffs hurt the interactions between employees and patients. Robust nurse‐to‐patient ratios which have proven vital to patients' hospital outcomes could be at risk.13 Admittedly, recession‐induced threats to quality and safety are conjectures on our part: unfortunately, no recession measures of hospitals' specific spending on staffing, technology, or process improvements exist.
However, there are many small, evidence‐based changes that could improve hospital safety dramatically in the near future. Michigan's Keystone ICU Initiative showed that systematic interventions in routine care delivery could reduce the risk of catheter‐related bloodstream infections, which currently are implicated in the death of 28,000 Americans per year, to nearly zero.14 The Institute for Healthcare Improvement's 100,000 Lives Campaign also illustrated that dramatic improvements in hospital‐related mortality can occur with fairly focused interventions. In the month after discharge, more than one‐quarter of all hospitalized patients go to an emergency room or need to be rehospitalized. This rate can be cut by 30% by inserting a nurse discharge advocate into the discharge process.15 Instituting a simple safety checklist before surgery decreased surgery‐related mortality and complications by over one‐third.16
Such interventions are effective, reasonable, and widely accessible. Over the long‐term, many may even be cost‐saving. But, importantly, they all require an institutional investment in start‐up money and an organizational will to change how things have been done. In a period of recession with severe cost‐cutting, and a recovery period of cautious spending, this may not be possible.
A Possible Stimulus: Investing in Quality Initiatives at Fiscally Vulnerable Hospitals
It is not enough to keep hospitals' doors open in a recession. Hospitals must continue to improve the quality and safety of the care they delivervital for their future patients and also for their communities who depend on them as anchors of health systems. We believe there is a need for a new, federally supported alignment of hospital finance and hospital quality that can limit damage to hospitals, help community employment, and improve patient safety.
Timely, structural quality measures could speed the introduction of functional value‐based purchasing, promote hospital safety, and help local economies at the same time. There are many simple structural measures that could be examined, such as development of discharge coordinators, promoting effective nurse‐to‐patient ratios, and encouraging health information technology (IT). Importantly, this would not duplicate efforts already underway to promote quality with process measures. With effective financial monitoring in real time, these measures could focus on high‐risk, fiscally disadvantaged hospitals.
To its credit, the Obama administration has already reached out to support hospitals, although aid has not been targeted specifically to hospitals in the most dire financial circumstances. Along with support for Medicaid and community health centers to improve primary care during the recession, the administration has provided a $268 million increase in Disproportionate Share Hospital payments towards hospitals that care for vulnerable patients, an increase of about 3%.17 Concurrently, the Centers for Medicare and Medicaid Services are implementing a value‐based purchasing program that starts with a 5% withhold in reimbursement that institutions need to earn back through a combination of mortality, process, and patient satisfaction metrics.18 The administration also reserved $19 billion to promote improvement of health IT for American medicine.19
Using health IT investment to help hospitals is an appealing concept, but for many institutions the infrastructure required to make that transition directly competes with other patient needs, including bedside patient care. IT investments have large initial costs, at a time when bank loans are difficult to acquire and few organizations can make expensive capital improvements. In fact, one‐quarter of hospitals report scaling back health IT investments that they had already started, in spite of the stimulus funds available.4
Instead, the administration may have more influence on improving care delivery by focusing on connecting hospital safety with hospital financial stability, by appropriating stimulus funds to center on quality and safety programs like those described above. Here is how: a hospital that would receive stimulus money for employing nurse discharge advocates would preserve employment while advancing patient safety, as would a hospital that retains a nurse‐to‐patient ratio above a specified threshold. By focusing on measures of structural quality, the government could improve care in ways that are easy to measure and maximize local economic stimulus without difficult outcomes assessment, insurance reform, or duplicating process measure efforts. There could even be an innovation differential (ie, payment/reward) for hospitals that improve quality while holding flat or lowering overall costs.
Equally important is to use this national financial crisis as an opportunity to improve monitoring of hospital quality. While quality assessment of hospitals is difficult, increased federal awareness of local medical need, hospital financial stability, and government awareness of emergency services overcrowding, nurse‐to‐patient ratios, and IT utilization are all valuable and easy to measure.
None of these quality‐focused fiscal interventions would be guaranteed to prevent hospital closure. Especially in small population centers, hospital closures can affect an entire community's financial growth and clinical safety net,20 while leaving hundreds or even thousands unemployed. Hospital closure should be assessed by state and federal government officials in these larger terms, perhaps even encouraging closure when appropriate, and helping prevent it when necessary.
Conclusion
Hospitals, as complex pieces of America's health care system, are central to communities' safety and economic growth. While national health coverage reform, as currently being discussed in Washington, would make hospital infrastructure less sensitive to macroeconomic changes, major reform would not come fast enough if hospitals start closing. While the worst of the recession may be over, recovery and the continuing rise in unemployment is a tenuous lifeline for hospitals on the financial brink.
We are not arguing against all hospital layoffs, or even closures. Indeed, this recession is a lean time for most industries and is likely to lead to closures for hospitals that cannot compete on efficiency or quality. But a hospital closure is a major event for a community and should not be permitted to occur without thorough consideration of alternatives. Current data on hospitals' financial status and clinical safety are limited, potentially biased, and not timely enough for this rapidly changing economic crisis. Therefore, state and federal government officials should assess whether hospitals would be eligible not just for possible emergency loans, but for linking loans to quality of care and community need. In so doing, this difficult time could be an opportunity to help hospitals improve their care, rather than watching it diminish.
- Michigan's Health Care Safety Net: In Jeopardy.2009.
- .Final budget decisions.Running A Hospital. Vol 2009.Boston, MA;2009.
- .Doctors Plan to Limit Beds in ER.Wall Street Journal.2009.
- The Impact of the Economic Crisis on Health Services for Patients and Communities.Washington, DC2009.
- ,.Hospital Operational and Financial Performance Improving.Ann Arbor, MI:Thomson Reuters Center for Healthcare Improvement.2009.
- .The Social Transformation of American Medicine.New York, NY:Basic Books;1983.
- AAFP.Patient Care during the 2008‐2009 Recession – Online Survey.Leawood, KS:AAFP.2009.
- The Impact of the Economic Crisis on Health Services for Patients and Communities.Washington, D.C.:American Hospital Association.2009.
- The economic downturn and its impact on hospitals. American Hospital Association Trendwatch.2009.
- ,,.The Current Recession and U.S. Hospitals:Center for Healthcare Improvement.2009.
- ,,.The cost‐shift payment ‘hydraulic’: foundation, history, and implications.Health Aff (Millwood).2006;25(1):22–33.
- ,.To Err Is Human: Building a Safer Health System.Washington, DC:National Academy Press;1999.
- ,,,,.Nurse‐staffing levels and the quality of care in hospitals.N Engl J Med.2002;346(22):1715–1722.
- ,,, et al.An intervention to decrease catheter‐related bloodstream infections in the ICU.N Engl J Med.2006;355(26):2725–2732.
- ,,, et al.A reengineered hospital discharge program to decrease rehospitalization: a randomized trial.Ann Intern Med.2009;150(3):178–187.
- ,,, et al.A surgical safety checklist to reduce morbidity and mortality in a global population.N Engl J Med.2009;360(5):491–499.
- Disproportionate Share Hospital (DSH). Available at: http://www.hhs. gov/recovery/cms/dsh.html. Accessed December 2009.
- ,,.Measuring outcomes and efficiency in medicare value‐based purchasing.Health Aff (Millwood).2009;28(2):w251–w261.
- .Stimulating the adoption of health information technology.N Engl J Med.2009;360(15):1477–1479.
- ,,,.The effect of rural hospital closures on community economic health.Health Serv Res.2006;41(2):467–485.
With the United States mired in its most severe recession in decades, stories of hospital struggles have emerged. Beaumont Hospital, located near the headquarters of major automakers and several assembly plants outside Detroit, recently cut hundreds of jobs and put major construction on indefinite hold.1 The CEO of Boston's Beth Israel Deaconess Medical Center made an agreement with employees to take large cuts in pay and vacation time to prevent laying off 10% of the staff.2 The University of Chicago Medical Center made plans to limit the number of emergency room beds, thereby decreasing low‐reimbursing emergency admissions while making beds available for higher‐paying elective hospitalizations.3
What is surprising about these stories is that hospitals have long been considered recession‐proof. Yet, with one‐half of US hospitals having reduced their staff to balance their budgets4 and with hospitals' financial margins falling dramatically,5 economic struggles are now a widespread problem.
Furthermore, it is difficult to determine if hospitals' clinical care has been damaged by the recession. The measurement of hospital quality is new and still under‐developed: there is virtually no reliable information on hospital quality from previous recessions, and even now it will be difficult to assess quality in real time.
Critics of waste and excess in the US health care system may see tough economic times as a Darwinian proving ground for hospitals, through which efficiency will improve and poor performers will close their doors. But more likely, hospital cutbacks will risk the quality and safety of health care delivery. For reasons of both public health and fiscal impact on communities, state and federal leaders may need to watch these trends closely to design and to be ready to implement potential government remedies for hospitals' fiscal woes.
In this commentary, we describe how hospitals have fared historically during recessions, how this recession could have different effectsfirst fiscally, then clinically, and we examine policy options to mitigate these untoward effects.
Decades of Recession‐Proof Hospitals
During the Great Depression, hospital insolvency was a national problem that prompted federal and state aid. Keeping hospitals alive was a critical policy goal and proved central to the early development of health insurance that focused on payment for hospital care.6
Since WWII, growth in America's hospitals has been only loosely related to national macroeconomic trends, with other changes like technological innovations and the advent of managed care far more influential to hospital finances. In fact, during recessions, hospital care spending growth often escalates in tandem with worsening unemployment (Figure 1). One explanation for this phenomenon is that economic pressures lead to declining primary care utilization, with adverse consequences for individuals' health.7
Hospitals' Current Fiscal Vulnerability
However, the current recession is the worst in 70 years. Every method of income generation available to hospitals appears at risk, including reimbursement per discharge (70% of hospitals report moderate or significant increases in uncompensated care), number of inpatient admissions (over one‐half report a moderate or significant decrease), difficulty obtaining bonds (60% report at least significant problems), and charitable donations.4 Over 50% of US hospitals had negative margins in the fourth quarter of 2008, though there has been some improvement since that time.8
Future hospital stability concerns remain. Growth in revenue per discharge is still below the norm.5 Because employment lags a recovering economy, further reimbursement decreases are possible from increasing proportions of patients with low‐reimbursing insurers or no coverage at all, decreasing payment rates from all payers, and decreasing elective care. The lower‐reimbursing payers, like state Medicaid programs, are experiencing increased enrollment as Americans lose their jobs and their better‐paying, employer‐sponsored private insurance.9 There's also evidence that reimbursement rates are declining from both Medicare and private insurers,10 which threatens the fragile cost‐shift through which hospitals have long used private insurance reimbursement to subsidize government reimbursements.11
Hospitals' specific financial challenges will likely vary across markets. The authors' state of Michigan has been hit particularly long and hard by the current recession. Unemployment rates exceeding 11% are expected to cause dramatic losses in private health insurance.9 Patients' increasing need with decreasing ability to pay will make markets in the deepest recession particularly vulnerable.
Hospital Quality and Safety at Risk?
The effect of the recession on the quality of hospital care is less clear. Until the 1990s, hospital quality was essentially assumed and virtually unmeasured. Even now, measuring hospital quality is difficult and rarely timely. Medicare data often take 1 to 2 years to become publicly available for analysis. Reports by trade organizations like the American Hospital Association are up‐to‐date but have conflicts of interest and are less rigorous. The most timely measures of hospitals' distressflawed as they may bewill come from the hospitals themselves, just like reports of economic woe from other businesses and government agencies during challenging economic times.
However, since the publication of the 1999 report To Err is Human,12 major improvements in hospital quality and safety have transformed the delivery of inpatient care. These improvements have taken the form of simple interventions like nationally consistent medical abbreviations, management initiatives like Six Sigma, and technological advances including computerized health records.
Nonetheless, during this recession and recovery, slashed hospital budgets may slow or even stop the momentum towards further improvements in quality and safety. Frontline care delivery could be at risk. Understaffed and under financed hospitals are rarely safe. Dissatisfaction and layoffs hurt the interactions between employees and patients. Robust nurse‐to‐patient ratios which have proven vital to patients' hospital outcomes could be at risk.13 Admittedly, recession‐induced threats to quality and safety are conjectures on our part: unfortunately, no recession measures of hospitals' specific spending on staffing, technology, or process improvements exist.
However, there are many small, evidence‐based changes that could improve hospital safety dramatically in the near future. Michigan's Keystone ICU Initiative showed that systematic interventions in routine care delivery could reduce the risk of catheter‐related bloodstream infections, which currently are implicated in the death of 28,000 Americans per year, to nearly zero.14 The Institute for Healthcare Improvement's 100,000 Lives Campaign also illustrated that dramatic improvements in hospital‐related mortality can occur with fairly focused interventions. In the month after discharge, more than one‐quarter of all hospitalized patients go to an emergency room or need to be rehospitalized. This rate can be cut by 30% by inserting a nurse discharge advocate into the discharge process.15 Instituting a simple safety checklist before surgery decreased surgery‐related mortality and complications by over one‐third.16
Such interventions are effective, reasonable, and widely accessible. Over the long‐term, many may even be cost‐saving. But, importantly, they all require an institutional investment in start‐up money and an organizational will to change how things have been done. In a period of recession with severe cost‐cutting, and a recovery period of cautious spending, this may not be possible.
A Possible Stimulus: Investing in Quality Initiatives at Fiscally Vulnerable Hospitals
It is not enough to keep hospitals' doors open in a recession. Hospitals must continue to improve the quality and safety of the care they delivervital for their future patients and also for their communities who depend on them as anchors of health systems. We believe there is a need for a new, federally supported alignment of hospital finance and hospital quality that can limit damage to hospitals, help community employment, and improve patient safety.
Timely, structural quality measures could speed the introduction of functional value‐based purchasing, promote hospital safety, and help local economies at the same time. There are many simple structural measures that could be examined, such as development of discharge coordinators, promoting effective nurse‐to‐patient ratios, and encouraging health information technology (IT). Importantly, this would not duplicate efforts already underway to promote quality with process measures. With effective financial monitoring in real time, these measures could focus on high‐risk, fiscally disadvantaged hospitals.
To its credit, the Obama administration has already reached out to support hospitals, although aid has not been targeted specifically to hospitals in the most dire financial circumstances. Along with support for Medicaid and community health centers to improve primary care during the recession, the administration has provided a $268 million increase in Disproportionate Share Hospital payments towards hospitals that care for vulnerable patients, an increase of about 3%.17 Concurrently, the Centers for Medicare and Medicaid Services are implementing a value‐based purchasing program that starts with a 5% withhold in reimbursement that institutions need to earn back through a combination of mortality, process, and patient satisfaction metrics.18 The administration also reserved $19 billion to promote improvement of health IT for American medicine.19
Using health IT investment to help hospitals is an appealing concept, but for many institutions the infrastructure required to make that transition directly competes with other patient needs, including bedside patient care. IT investments have large initial costs, at a time when bank loans are difficult to acquire and few organizations can make expensive capital improvements. In fact, one‐quarter of hospitals report scaling back health IT investments that they had already started, in spite of the stimulus funds available.4
Instead, the administration may have more influence on improving care delivery by focusing on connecting hospital safety with hospital financial stability, by appropriating stimulus funds to center on quality and safety programs like those described above. Here is how: a hospital that would receive stimulus money for employing nurse discharge advocates would preserve employment while advancing patient safety, as would a hospital that retains a nurse‐to‐patient ratio above a specified threshold. By focusing on measures of structural quality, the government could improve care in ways that are easy to measure and maximize local economic stimulus without difficult outcomes assessment, insurance reform, or duplicating process measure efforts. There could even be an innovation differential (ie, payment/reward) for hospitals that improve quality while holding flat or lowering overall costs.
Equally important is to use this national financial crisis as an opportunity to improve monitoring of hospital quality. While quality assessment of hospitals is difficult, increased federal awareness of local medical need, hospital financial stability, and government awareness of emergency services overcrowding, nurse‐to‐patient ratios, and IT utilization are all valuable and easy to measure.
None of these quality‐focused fiscal interventions would be guaranteed to prevent hospital closure. Especially in small population centers, hospital closures can affect an entire community's financial growth and clinical safety net,20 while leaving hundreds or even thousands unemployed. Hospital closure should be assessed by state and federal government officials in these larger terms, perhaps even encouraging closure when appropriate, and helping prevent it when necessary.
Conclusion
Hospitals, as complex pieces of America's health care system, are central to communities' safety and economic growth. While national health coverage reform, as currently being discussed in Washington, would make hospital infrastructure less sensitive to macroeconomic changes, major reform would not come fast enough if hospitals start closing. While the worst of the recession may be over, recovery and the continuing rise in unemployment is a tenuous lifeline for hospitals on the financial brink.
We are not arguing against all hospital layoffs, or even closures. Indeed, this recession is a lean time for most industries and is likely to lead to closures for hospitals that cannot compete on efficiency or quality. But a hospital closure is a major event for a community and should not be permitted to occur without thorough consideration of alternatives. Current data on hospitals' financial status and clinical safety are limited, potentially biased, and not timely enough for this rapidly changing economic crisis. Therefore, state and federal government officials should assess whether hospitals would be eligible not just for possible emergency loans, but for linking loans to quality of care and community need. In so doing, this difficult time could be an opportunity to help hospitals improve their care, rather than watching it diminish.
- Michigan's Health Care Safety Net: In Jeopardy.2009.
- .Final budget decisions.Running A Hospital. Vol 2009.Boston, MA;2009.
- .Doctors Plan to Limit Beds in ER.Wall Street Journal.2009.
- The Impact of the Economic Crisis on Health Services for Patients and Communities.Washington, DC2009.
- ,.Hospital Operational and Financial Performance Improving.Ann Arbor, MI:Thomson Reuters Center for Healthcare Improvement.2009.
- .The Social Transformation of American Medicine.New York, NY:Basic Books;1983.
- AAFP.Patient Care during the 2008‐2009 Recession – Online Survey.Leawood, KS:AAFP.2009.
- The Impact of the Economic Crisis on Health Services for Patients and Communities.Washington, D.C.:American Hospital Association.2009.
- The economic downturn and its impact on hospitals. American Hospital Association Trendwatch.2009.
- ,,.The Current Recession and U.S. Hospitals:Center for Healthcare Improvement.2009.
- ,,.The cost‐shift payment ‘hydraulic’: foundation, history, and implications.Health Aff (Millwood).2006;25(1):22–33.
- ,.To Err Is Human: Building a Safer Health System.Washington, DC:National Academy Press;1999.
- ,,,,.Nurse‐staffing levels and the quality of care in hospitals.N Engl J Med.2002;346(22):1715–1722.
- ,,, et al.An intervention to decrease catheter‐related bloodstream infections in the ICU.N Engl J Med.2006;355(26):2725–2732.
- ,,, et al.A reengineered hospital discharge program to decrease rehospitalization: a randomized trial.Ann Intern Med.2009;150(3):178–187.
- ,,, et al.A surgical safety checklist to reduce morbidity and mortality in a global population.N Engl J Med.2009;360(5):491–499.
- Disproportionate Share Hospital (DSH). Available at: http://www.hhs. gov/recovery/cms/dsh.html. Accessed December 2009.
- ,,.Measuring outcomes and efficiency in medicare value‐based purchasing.Health Aff (Millwood).2009;28(2):w251–w261.
- .Stimulating the adoption of health information technology.N Engl J Med.2009;360(15):1477–1479.
- ,,,.The effect of rural hospital closures on community economic health.Health Serv Res.2006;41(2):467–485.
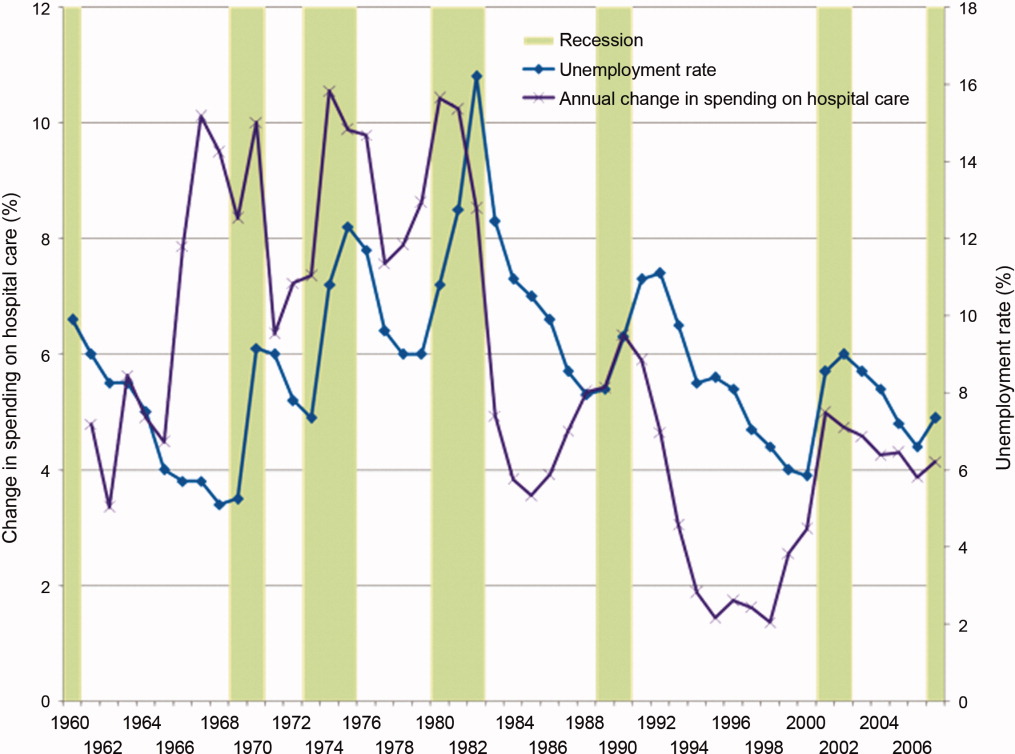
Pediatric OUs in the United States
The first observation units were implemented more than 40 years ago with the goal of reducing the number and duration of inpatient stays. Since then, observation units (OUs) have evolved as a safe alternative to hospitalization14 for the delivery of finite periods of care, typically less than 24 hours.58 Observation services allow for time to determine the need for hospitalization in cases that are unclear after their initial evaluation and treatment.9 Observation status is an administrative classification related to reimbursement that can be applied to patients whose diagnosis, treatment, stabilization, and discharge can reasonably be expected within 24 hours.10, 11 The site of care for observation is dependent in part upon existing facility structures; some institutions utilize virtual OUs within the emergency department (ED) or hospital ward, while others have dedicated, geographically distinct OUs, which may function as an extension of either the ED or inpatient settings.9
OUs have been instrumental in providing care to adult patients with chest pain, asthma, and acute infections.1218 Recently, there has been an increase in the number of publications from pediatric OUs in the United States and abroad. Observation may be a preferred model of care for select pediatric patients, as hospitalized children often experience brief stays.1921 Previous reviews on this model of care have combined adult and pediatric literature and have included research from countries with healthcare structures that differ considerably from the United States.2224 To date, no systematic review has summarized the pediatric OU literature with a focus on the US healthcare system.
As payers and hospitals seek cost‐effective alternatives to traditional inpatient care, geographically distinct OUs may become integral to the future of healthcare delivery for children. This systematic review provides a descriptive overview of the structure and function of pediatric OUs in the United States. We also scrutinize the outcome measures presented in the included publications and propose future directions for research to improve both observation unit care, as well as the care delivered to patients under observation status within general inpatient or ED settings.
Methods
Literature Search
With the assistance of a health services librarian, a search of the following electronic databases from January 1, 1950 through February 5, 2009 was conducted: Medline, Web of Science, Cumulative Index to Nursing and Allied Health Literature (CINAHL), Health Care Advisory Board (HCAB), Lexis‐Nexis, National Guideline Clearinghouse, and Cochrane Reviews. Key words used for the Boolean search are included in Appendix A. In addition, we conducted a manual search of reference lists from reviews, guidelines, and articles meeting inclusion criteria.
We included English language peer‐reviewed publications that reported on pediatric OU care in the United States. Studies were included if they reported outcomes including lengths of stay, admission from observation rates, return visit rates, costs or charges. Descriptive publications of pediatric OU structure and function were also included. Studies were excluded if they were conducted outside the United States, evaluated psychiatric or intensive care, reported on observation status in an ED without an OU or observation status on a traditional inpatient ward. Two reviewers (M.M. and C.K.) identified articles for inclusion. Any disagreements between the reviewers were resolved by discussion and consensus agreement. Interrater reliability was assessed using the kappa statistic.
Quality Assessment
The quality of each study was rated using the Oxford Centre for Evidence‐based Medicine levels of evidence.25 With this system, levels of evidence range from 1a (homogeneous systematic review of randomized, controlled trials) to 5 (expert opinion without explicit critical appraisal).
Data Synthesis
Data on study design, OU characteristics, patient populations, and outcomes were extracted using a standardized form. Heterogeneity of study design, interventions, and outcomes precluded the ability to conduct meta‐analyses.
Results
A systematic search of the electronic databases identified 222 unique citations (Figure 1). A total of 107 abstracts were evaluated. We identified 48 articles for full‐text review, of which 18 met inclusion criteria. Hand search of references yielded 24 additional articles, of which 3 met inclusion criteria. Interrater agreement for selected articles was high at 98% (kappa = 0.85).
Observation Unit Characteristics
The majority of research on OUs has been conducted at large academic pediatric centers. One publication was from a community hospital.26 These studies present data on more than 22,000 children cared for in OUs of 11 hospitals over a 32‐year time span. Most studies were level 2 evidence: 2b, retrospective cohort studies and low‐quality randomized, controlled trials; or 2c, outcomes research. Three were descriptive and not assigned a formal evidence level.2729
Table 1 highlights general features of U.S. pediatric OUs. Five institutions renovated or expanded clinical space in order to open the OU.27, 2932 Units ranged in size from 3 to 23 beds. The OU was located in or near the ED in all but 2 hospitals, which had ward‐based units. The ED was the primary entry point into the OU with only 2 open model units accepting patients from other settings.5, 32 The annual number of observation cases ranged from 1000 to 3000 in children's hospitals. Approximately 500 ward‐based observation cases per year were cared for in the single community hospital studied. Three reports included time trends showing increased OU utilization over study years.5, 30, 31
| Publication (Year); Condition | Study Design; Level of Evidence; Time Frame; Sample Size | Hospital; Observation Setting; Year Opened | Site | Beds | Entry Point | Staffing; Physicians; Nurses |
|---|---|---|---|---|---|---|
| ||||||
| Gururaj et al.43 (1972); all conditions | Retrospective cohort; 2c; 1 year; 437 cases under observation | King's County Downstate Brooklyn; short‐stay unit | ED | 3 | Not reported | Pediatric residents; general pediatricians |
| Ellerstein and Sullivan,32 (1980); all conditions | Retrospective cohort; 2c; 6 years; 5858 cases of unscheduled care plus 1403 elective surgery cases | Children's Hospital Buffalo; observation unit; 1972 | ED | 8 | ED, clinic, procedure/OR | Primary care pediatricians; other specialists; pediatric residents |
| O'Brien et al.37 (1980); asthma | Retrospective cohort; 2c; 1 month; 434 cases of asthma, 328 discharged directly from ED, 106 treated in holding unit | Children's National DC; holding unit | ED | 6 | ED | 1‐2 pediatric residents; 1‐2 nurses |
| Willert et al.35 (1985); asthma | Randomized*; 2b; 578 cases of asthma; 166 cases 1.5 hours postaminophylline, 103 randomized, 52 to holding unit | Children's Memorial Chicago; holding room | ED | 5 | ED | General pediatricians; pediatric residents; PEM nurses |
| Listernick et al.38 (1986); dehydration | Randomized; 2b; 29 cases of dehydration; 22 to holding unit | Children's Memorial Chicago | ||||
| Balik et al.31 (1988); all conditions | Descriptive; none given | Minneapolis Children's; short‐stay unit observation area; 1985 | Day surgery area adjacent to ED | Not reported | Not reported | General pediatricians; pediatric nurses (shared with ED) |
| Marks et al.7 (1997); all conditions | Retrospective cohort; 2c; 5 months; 968 cases in short‐stay unit | Children's Hospital Boston; short‐stay unit; 1994 | Ward | 4‐18 | ED | Primary care pediatricians; PEM physicians; pediatric residents; pediatric nurses; 1:6 nurse:patient ratio |
| Marks et al.7 (1997); asthma | Pre‐post; 2b; 400 cases of asthma; 102 pre/298 post short‐stay unit | Children's Hospital Boston | ||||
| Wiley et al.6 (1998); all conditions | Retrospective cohort; 2c; 1 year; 805 cases of unscheduled observation; plus 595 scheduled cases | Connecticut Children's; outpatient extended treatment site | ED | 10 | Not reported | PEM physicians; other specialists; 1:5 nurse:patient ratio |
| Scribano et al.65 (2001); all conditions | Retrospective cohort; 2b; 2 years; 1798 cases under observation | Connecticut Children's | ||||
| Leduc et al.30 (2002); all conditions | Retrospective cohort; 2c; 6 months; 686 cases under observation (4.8% of ED visits) | Children's Hospital Denver; OU | ED | 6 | Not reported | Not reported |
| Bajaj and Roback,30 (2003); intussusception | Retrospective cohort; 2b; 4.5 years; 78 cases of intussusception (51 under observation) | Children's Hospital Denver | ||||
| Wathen et al.36 (2004); dehydration | Convenience sample; 2c; 10 months; 182 cases of dehydration (48 under observation) | Children's Hospital Denver | ||||
| Crocetti et al.26 (2004); all conditions | Retrospective cohort; 2b; 2 years; 956 cases under observation | John Hopkin's Bayview; observation status beds; 1997 | Ward | Not reported | 99% ED 1% other location | General pediatricians covering ED and ward |
| Silvestri et al.29 (2005); all conditions | Descriptive; none given | Children's Hospital of Philadelphia; OU; 1999 | ED | 12 | ED | PEM physicians; PEM fellows; urgent care pediatricians; ED nurse practitioner; inpatient nurses |
| Alpern et al.34 (2008); all conditions | Prospective cohort; 1b; 30 months; 4453 cases under observation | Children's Hospital of Philadelphia | ||||
| Thomas27 (2000); all conditions | Descriptive; none given | Primary Children's Medical Center; RTU; 1999 | ED | 22‐26 | ED, clinic, procedure/OR | PEM physicians; general pediatricians; other specialists; no residents |
| Zebrack et al.25 (2005); all conditions | Retrospective cohort; 2b; 2 years; 4189 cases of unscheduled observation plus 2288 scheduled cases | Primary Children's Medical Center | PEM nurses; 1:4 nurse:patient ratio | |||
| Miescier et al.40 (2005); asthma | Retrospective cohort; 2b; 2 years; 3029 asthma visits; 384 admitted, 301 observed, 161cases met inclusion | Primary Children's Medical Center | ||||
| Holsti et al.41 (2005); head injury | Retrospective cohort; 2b; 2 years; 827 CHI visits, 273 admitted, 285 observed, 284 cases met inclusion | Primary Children's Medical Center | ||||
| Greenberg et al.42 (2006); croup | Retrospective pre‐post; 2b; 1 year each; 694 croup cases pre‐RTU, 66 admitted; 789 croup cases post‐RTU, 33 admitted; 76 observed | Primary Children's Medical Center | ||||
| Mallory et al.33 (2006); dehydration | Retrospective cohort; 2b; 1 year; 430 dehydration cases under observation | Primary Children's Medical Center | ||||
Staffing and Workflow
Staffing models varied and have undergone transitions over time. Prior to 1997, general pediatricians primarily provided physician services. In more recent years, OUs have utilized pediatric emergency medicine (PEM) providers. Three of the 11 units allowed for direct patient care by subspecialists.5, 6, 32 One OU was staffed by nurse practitioners.29 OU nursing backgrounds included pediatrics, emergency medicine, or PEM.
Five institutions assembled multidisciplinary teams to define the unit's role and establish policies and procedures.7, 27, 2931 Workflow in the OU focused on optimizing efficiency through standardized orders, condition‐specific treatment protocols, and bedside charting.7, 26, 33 Several units emphasized the importance of ongoing evaluations by attending physicians who could immediately respond to patient needs. Rounds occurred as often as every 4 hours.5, 7 Two centers utilized combined physician‐nursing rounds to enhance provider communication.7, 34 No publications reported on patient transitions between sites of care or at shift changes.
Criteria for Observation
All 11 hospitals have developed protocols to guide OU admissions (Table 2). Nine publications from 4 OUs commented on treatments delivered prior to observation.33, 3542 The most commonly cited criteria for admission was approval by the unit's supervising physician. Utilization review was not mentioned as an element in the OU admission decision. Common OU exclusions were the need for intensive care or monitoring while awaiting an inpatient bed; however, these were not universal. Eight centers placed bounds around the duration of OU stays, with minimum stays of 2 hours and maximum stays of 8 to 24 hours.
| Hospital | Entry Criteria | Age Range | Time | Exclusion Criteria |
|---|---|---|---|---|
| ||||
| King's County, Downstate Brooklyn | Otherwise required inpatient admission | 0‐13 years | Maximum 24 hours | Not reported |
| Acute problem of uncertain severity | ||||
| Acute problem not readily diagnosed | ||||
| Short course periodic treatment | ||||
| Diagnostic procedures impractical as outpatient | ||||
| Children's Hospital, Buffalo | Admission from any source | 0‐21 years | Maximum 24 hours | Intensive care needs |
| Short stay elective surgery | Routine diagnostic tests | |||
| Estimated length of stay <24 hours | Holding prior to admission | |||
| Children's National, Washington, DC | Inadequate response to 3 subcutaneous epinephrine injections | 8 months to 19 years | Not reported | Not reported |
| Children's Memorial, Chicago | Asthma: | |||
| Available parentAsthma score 5Inadequate response to ED treatment | >1 year | Maximum 24 hours | Past history of BPD, CF, CHD, other debilitating disease | |
| Dehydration: | ||||
| Cases receiving oral hydration | 3‐24 months | 12 hours for oral | Intensive care need | |
| Parent preference if given IV hydration | 8 to 12 hours for IV | Hypernatremia | ||
| Minneapolis Children's | Conditions listed in Table 3 | Not reported | Maximum 10 hours | Not reported |
| Children's Hospital, Boston | Straightforward diagnoses as determined by ED staff | Not reported | Not reported | Other complex medical issues |
| Bed availability | ||||
| Connecticut Children's | PEM attending discretionLimited severity of illnessUsually confined to a single organ systemClearly identified plan of care | Not reported | After 3‐4 hours in ED Low likelihood of requiring extended care >23 hours | Asthma: no supplemental O2 need, nebulized treatments >Q2 hourCroup: no supplemental O2 need, <2 racemic epinephrine treatmentsDehydration: inability to tolerate orals, bicarbonate >10, 40 mL/kg IVFSeizure: partial or generalized, postictal, unable to tolerate oralsPoisoning: mild or no symptoms, poison control recommendation |
| Children's Hospital, Denver | Intussusception: following reduction | 0‐18 years | After 3‐4 hours in ED | Not reported |
| Dehydration: based on clinical status | ||||
| Johns Hopkins, Bayview | Consultation with on‐duty pediatrician | 0‐18 years | Minimum of 2 hours | Patients requiring subspecialty or intensive care services |
| High likelihood of discharge at 24 hours | ||||
| Children's Hospital of Philadelphia | Sole discretion of the ED attending | Not reported | Minimum 4 hours | No direct admissions |
| Single focused acute condition | Maximum 23 hours | Diagnostic dilemmas | ||
| Clinical conditions appropriate for observation | Underlying complex medical problems | |||
| Primary Children's Medical Center | Observation unit attending discretion | 0‐21 years | Minimum 3 hours | Admission holds |
| Scheduled procedures as space available | Maximum 24 hours | Intensive care needs | ||
| ED admit after consult with OU doctor | Complicated, multisystem disease | |||
| Clear patient care goals | Need for multiple specialty consults | |||
| Limited severity of illness | Psychiatric patients | |||
| Diagnostic evaluation | ||||
Ages of Children Under Observation
Seven of 11 hospitals reported the age range of patients accepted in their OU (Table 2). All but 1 unit accepted children from infants to young adults, 18 to 21 years of age.43 In the 6 units that reported the age distribution of their OU population, roughly 20% were <1 year, more than 50% were <5 years, and fewer than 30% fell into an adolescent age range.5, 6, 26, 32, 34, 43
Conditions Under Observation
Many conditions under observation were common across time and location (Table 3). The list of conditions cared for in OUs has expanded in recent years. Medical conditions predominated over surgical. While the majority of observation cases required acute care, nearly one‐half of the units accepted children with scheduled care needs (eg, routine postoperative care, procedures requiring sedation, infusions, and extended evaluations such as electroencephalograms or pH probes). These scheduled cases, cared for within the OU structure, provided more steady demand for OU services.
| King's County, Downstate Brooklyn | Children's Hospital, Buffalo | Minneapolis Children's | Children's Hospital, Boston | Connecticut Children's | Children's Hospital, Denver | Johns Hopkins, Bayview | Children's Hospital of Philadelphia | Primary Children's Medical Center, Salt Lake City | |
|---|---|---|---|---|---|---|---|---|---|
| |||||||||
| Respiratory | |||||||||
| Asthma | |||||||||
| Pneumonia | |||||||||
| Bronchiolitis | |||||||||
| Croup | |||||||||
| Allergic reaction | |||||||||
| Cardiology | |||||||||
| Gastrointestinal | |||||||||
| Vomiting | |||||||||
| Gastro/dehydration | |||||||||
| Abdominal pain | |||||||||
| Constipation | |||||||||
| Diabetes | |||||||||
| Neurologic | |||||||||
| Seizure | |||||||||
| Head injury | |||||||||
| Infection | |||||||||
| Sepsis evaluation | |||||||||
| UTI/pyelonephritis | |||||||||
| Cellulitis | |||||||||
| Fever | |||||||||
| Pharyngitis | |||||||||
| Otitis media | |||||||||
| Adenitis | |||||||||
| Ingestion/poisoning | |||||||||
| Hematologic | |||||||||
| Sickle cell disease | |||||||||
| Transfusion/emnfusion | |||||||||
| Psychological/social | |||||||||
| Dental | |||||||||
| Surgical conditions | |||||||||
| Foreign body | |||||||||
| Trauma | |||||||||
| Burn | |||||||||
| Orthopaedic injury | |||||||||
| Postoperative complication | |||||||||
| Scheduled care | |||||||||
| Diagnostic workup | |||||||||
| Procedures/sedation | |||||||||
| Elective surgery | |||||||||
Reimbursement
One publication highlighted the special billing rules that must be considered for observation care.27 In 3 studies, payers recognized cost‐savings associated with the OU's ability to provide outpatient management for cases that would traditionally require inpatient care.31, 35, 38
Observation Unit Outcomes
Outcomes reported for pediatric OU stays fall into 4 major categories: length of stay (LOS), admission rates, return visit rates, and costs. Despite these seemingly straightforward groupings, there was significant heterogeneity in reporting these outcomes.
Length of Stay
The start time for OU length of stay (LOS) is not clearly defined in the articles included in this review. While the start of an observation period is assumed to begin at the time the order for observation is placed, it is possible that the LOS reported in these publications began at the time of ED arrival or the time the patient was physically transferred to the OU. The average LOS for individual OUs ranged from 10 to 15 hours.5, 6, 26, 30, 35, 38, 40, 41, 43 One ward‐based and 1 ED‐based unit reported LOS extending beyond 24 hours,7, 30 with averages of 35 and 9 hours, respectively. Two units limited the duration of care to <10 hours.31, 38
For studies that included a comparison group, OU stays were consistently shorter than a traditional inpatient stay by 6 to 110 hours.7, 36, 38, 39, 42 No significant differences in clinical parameters between groups were reported. There was appreciable variation in the average LOS across institutions for similar conditions, 12 to 35 hours for asthma,5, 7, 34, 35 and 9 to 18 hours for dehydration.5, 34, 36, 38
Admission Rates
Rates of hospital admission after observation from the 9 OUs reporting this outcome are presented in Table 4. Three publications from a single institution counted hospital admission in the 48 to 72 hours following discharge from the OU as though the patient were admitted to the hospital directly from the index OU stay.33, 40, 41 Conditions with the lowest admission rates, <10%, included croup, neurologic conditions, ingestions, trauma, and orthopedic injuries. The highest admission rates, >50%, were for respiratory conditions including asthma, pneumonia, and bronchiolitis.
| King's County, Downstate Brooklyn (%) | Children's Hospital, Buffalo (%) | Connecticut Children's (%) | Johns Hopkins, Bayview (%) | Children's Hospital of Philadelphia (%) | Primary Children's Medical Center, Salt Lake City (%) | |
|---|---|---|---|---|---|---|
| ||||||
| Unscheduled care | 42 | 17 | 11 | 25 | 25 | 15 |
| Respiratory | 32 | |||||
| Asthma | 57 | 16 | 26 | 22 | 22‐25* | |
| Pneumonia | 50 | 23 | 30‐48 | |||
| Bronchiolitis | 46 | 32 | 43 | |||
| Croup | 9 | 17 | 9 | 4‐6 | ||
| Allergic reaction | 3 | |||||
| Cardiology | 22 | |||||
| Gastrointestinal | 43 | 19 | ||||
| Vomiting | 5 | 22 | ||||
| Gastro/dehydration | 23 | 15/21 | 16* | |||
| Abdominal pain | 9 | 17 | 27 | |||
| Constipation | 9 | |||||
| Diabetes | 17 | |||||
| Neurologic | 10 | |||||
| Seizure | 19 | 8 | 17 | 18 | ||
| Head injury | 7 | 5* | ||||
| Infection | 19 | 34 | ||||
| Sepsis evaluation | 25 | 22 | ||||
| UTI/pyelonephritis | 25 | 16 | ||||
| Cellulitis | 15 | |||||
| Fever | 16 | 26 | ||||
| Pharyngitis | 13 | |||||
| Otitis media | 21 | |||||
| Ingestion/poisoning | 9 | 4 | 4 | 9 | 10 | 5 |
| Hematologic | 23 | |||||
| Transfusion/emnfusion | 2 | |||||
| Psychological/social | 21 | 80 | 17 | |||
| Dental | 14 | |||||
| Surgical conditions | ||||||
| Foreign body | ||||||
| Trauma | 13 | 2 | 53 | 5 | ||
| Burn | 13 | |||||
| Orthopedic injury | 22 | 3 | ||||
| Postoperative complication | 26 | 16 | ||||
| Scheduled care | ||||||
| Diagnostic workup | 0‐5 | |||||
| Procedures/sedation | 0.1‐9.0 | |||||
| Elective surgery | 13 | 0‐5 | ||||
Return Visit Rates
Unscheduled return visit rates were reported in 9 publications from 6 institutions and ranged from 0.01% to 5%.7, 26, 33, 3537, 3941 Follow‐up timeframes ranged from 48 hours to 1 month. Return visits were inconsistently defined. In most studies, rates were measured in terms of ED visits.26, 33, 3537, 39, 41 One ward‐based unit counted only hospital readmissions toward return visit rates.7 Three publications, from ED‐based units, counted hospital readmissions in the 2 to 5 days following observation toward admission rates and not as return visits.33, 40, 41 In most studies, data on return visits were collected from patient logs or patient tracking systems. Three studies contacted patients by phone and counted return visits to the clinic.3537 No studies reported on adherence to scheduled visits following observation.
Costs
Seven studies reported financial benefits of OU care when compared with traditional hospital care.7, 30, 31, 35, 37, 38, 42 Two centers admitted patients to inpatient care if their observation period reached a set time limit, after which cost savings were no longer realized.31, 35 Cost savings associated with the OU treatment of asthma and dehydration were attributed to lower charges for an OU bed.35, 38 Decreased charges for the OU treatment of croup were related to shorter LOS.42
Discussion
In the 40 years since the first studies of pediatric OUs, several US health systems have extended observation services to children. This model of care may be expanding, as suggested by an increase in the number of publications in the past 10 years. However, the number of centers within the US reporting on their OU experience remains small. Our systematic review identified a recurrent theme related to OUsthe opportunity to improve operational processes of care compared with the traditional inpatient alternative. We have identified the need to standardize OU outcomes and propose measures for future OU research.
Observation Unit Operations
The OU care model expands outpatient management of acute conditions to include children who are neither ready for discharge nor clear candidates for inpatient admission. OUs have demonstrated the ability to care for patients across the pediatric age spectrum. Over the decades spanning these publications, advances in medical therapy such as antiemetics for gastroenteritis and early administration of systemic steroids for asthma may have resulted in lower admission rates or shorter time to recovery.44, 45 Despite these advances, there are marked consistencies in the conditions cared for within OUs over time. The data summarized here may help guide institutions as they consider specific pediatric conditions amenable to observation care.
The hospitals included in this review either added physical space or revised services within existing structures to establish their OU. Hospitals facing physical constraints may look to underutilized areas, such as recovery rooms, to provide observation care, as observation does not require the use of licensed inpatient beds. Several units have responded to daily fluctuations in unscheduled observation cases by also serving patients who require outpatient procedures, brief therapeutic interventions, and diagnostic testing. By caring for patients with these scheduled care needs during the day, there is a more steady flow of patients into the OU. While hospitals traditionally have used postanesthesia care units and treatment rooms for scheduled cases, OUs appear to benefit from the consistent resource allocation associated with a constant demand for services.
To date, the vast majority of pediatric OUs in the published literature have emerged as an extension of ED services. Now, with the expansion of pediatric hospitalist services and movement toward 24/7 inpatient physician coverage, there may be increased development of ward‐based OUs and the designation of inpatient observation status. While ward‐based OUs managed by pediatric hospitalists may be well established, we were not able to identify published reports on this structure of care. A national survey of health systems should be undertaken to gather information regarding the current state of pediatric observation services.
When creating policies and procedures for OUs, input should be sought from stakeholders including hospitalists, PEM providers, primary care providers, subspecialists, mid‐level providers, nurses, and ancillary staff. As patients requiring observation level of care do not neatly fit an outpatient or inpatient designation, they present an opportunity for hospitalist and PEM physician groups to collaborate.4648 Calling on the clinical experiences of inpatient and ED providers could offer unique perspectives leading to the development of innovative observation care models.
This review focused on institutions with dedicated observation services, which in all but 1 study26 consisted of a defined geographic unit. It is possible that the practices implemented in an OU could have hospital‐wide impact. For example, 1 study reported reduction in LOS for all asthma cases after opening a ward‐based unit.7 Further, pediatric hospitalist services have been associated with shorter LOS49 and increased use of observation status beds compared with traditional ward services.50 As pediatric hospitalists expand their scope of practice to include both observation and inpatient care, clinical practice may be enhanced across these care areas. It follows that the impact of observation protocols on care in the ward setting should be independently evaluated.
The costs associated with the establishment and daily operations of an OU were not addressed in the reviewed publications. Assertions that observation provides a cost‐effective alternative to inpatient care4, 7, 23, 42 should be balanced by the possibility that OUs extend care for patients who could otherwise be discharged directly home. Studies have not evaluated the cost of OU care compared with ED care alone. Research is also needed to assess variations in testing and treatment intensity in OUs compared with the ED and inpatient alternatives. Reimbursement for observation is dependent in part upon institutional contracts with payers. A full discussion of reimbursement issues around observation services is beyond the scope of this review.
Observation Unit Outcomes
Length of Stay
Although most studies reported LOS, direct comparisons across institutions are difficult given the lack of a consistently referenced start to the observation period. Without this, LOS could begin at the time of ED arrival, time of first treatment, or time of admission to the OU. Identifying and reporting the elements contributing to LOS for observation care is necessary. The time of OU admission is important for billing considerations; the time of first treatment is important to understanding the patient's response to medical interventions; the time of ED arrival is important to evaluating ED efficiency. Each of these LOS measures should be reported in future studies.
Direct comparisons of LOS are further complicated by variability in the maximum permissible duration of an OU stay, ranging from 8 to 24 hours in the included studies. Despite these limits, some OU care will extend beyond set limits due to structural bottlenecks. For example, once the inpatient setting reaches capacity, observation LOS for patients who require admission will be prolonged. The best evaluation of LOS would come from prospective study design utilizing either randomization or quality improvement methods.
Defining Success and Failure in Observation Care
In the reviewed literature, observation failures have been defined in terms of admission after observation and unscheduled return visit rates. Admission rates are heavily dependent on appropriate selection of cases for observation. Although some observation cases are expected to require inpatient admission, OUs should question the validity of their unit's acceptance guidelines if the rate of admission is >30%.51 High rates could be the result of inadequate treatment or the selection of children too sick to improve within 24 hours. Low rates could indicate overutilization of observation for children who could be discharged directly home. Full reporting on the number of children presenting with a given condition and the different disposition pathways for each is needed to evaluate the success of OUs. Condition‐specific benchmarks for admission after observation rates could guide hospitals in their continuous improvement processes.
Unscheduled return visits may reflect premature discharge from care, diagnostic errors, or development of a new illness. OU care may influence patient adherence to scheduled follow‐up care but this has not been evaluated to date. In future research, both scheduled and unscheduled return visits following ED visits, observation stays, and brief inpatient admissions for similar disease states should be reported for comparison. Standard methodology for identifying return visits should include medical record review, claims analyses, and direct patient contact.
As hospitals function at or near capacity,52, 53 it becomes important to delineate the appropriate length of time to monitor for response to treatments in a given setting. Limited capacity was a frequently cited reason for opening a pediatric OU; however, the impact of OUs on capacity has not yet been evaluated. Operations research methods could be used to model OU services' potential to expand hospital capacity. This research could be guided by evaluation of administrative data from across institutions to identify current best practices for pediatric OU and observation status care.
OU benchmarking in the United States has begun with a small number of adult units participating in the ED OU Benchmark Alliance (EDOBA).54 In Table 5, we propose dashboard measures for pediatric OU continuous quality improvement. The proposed measures emphasize the role of observation along the continuum of care for acute conditions, from the ED through the OU with or without an inpatient stay to clinic follow‐up. Depending on the structure of observation services, individual institutions may select to monitor different dashboard measures from the proposed list. Patient safety and quality of care measures for the conditions commonly receiving pediatric OU care should also be developed.
| ED |
OU |
Inpatient |
Clinic | |
|---|---|---|---|---|
| ||||
| Length of stay* | ED arrival to OU admission | OU admit to disposition | Inpatient admit to discharge | |
| ED arrival to discharge home from OU | ||||
| ED arrival to discharge from inpatient following OU care | ||||
| OU admission to discharge home from inpatient care | ||||
| Admission* | % ED census admitted inpatient | % OU census admitted | ||
| % ED census that is observed | ||||
| Unscheduled return visits* | To ED | Requiring OU admission | Requiring inpatient admission | |
| Scheduled follow‐up* | To ED | To primary care or subspecialist office | ||
| Capacity | ED crowding scales | Unable to accept transfers | ||
| ED left before evaluation rates | Inpatient occupancy | |||
| Ambulance diversion | ||||
| Satisfaction | Patient/Parent | |||
| ED providers | OU providers | Inpatient providers | Follow‐up providers | |
| Cost | ED care | OU care | Inpatient care | |
| Total encounter | ||||
Limitations
The most important limitations to this review are the heterogeneity in interventions and reporting of outcomes, which precluded our ability to combine data or conduct meta‐analyses. We attempted to organize the outcomes data into clear and consistent groupings. However, we could not compare the performance of 1 center with another due to differences in OU structure, function, and design.
In order to focus this systematic review, we chose to include only peer reviewed publications that describe pediatric OUs within the United States. This excludes expert guidelines, which may be of value to institutions developing observation services.
Our search found only a small number of centers that utilize OUs and have published their experience. Thus, our review is likely subject to publication bias. Along this line, we identified 9 additional publications where children were cared for alongside adults within a general OU.5563 This suggests an unmeasured group of children under observation in general EDs, where more than 90% of US children receive acute care.64 These articles were excluded because we were unable to distinguish pediatric specific outcomes from the larger study population.
Finally, retrospective study design is subject to information bias. Without a comparable control group, it is difficult to understand the effects of OUs. Patients directly admitted or discharged from the ED and patients who require admission after observation all differ from patients discharged from observation in ways that should be controlled for with a randomized study design.
Conclusions
OUs have emerged to provide treatment at the intersection of outpatient and inpatient care during a time of dramatic change in both emergency and hospital medicine. As hospitalists expand their scope of practice to include observation care, opportunities will arise to collaborate with ED physicians and share their growing expertise in quality and efficiency of hospital care delivery to improve observation services for children. OUs have been established with laudable goalsto reduce inpatient admissions, increase patient safety, improve efficiency, and control costs. The current evidence is not adequate to determine if this model of healthcare delivery achieves these goals for children. Through synthesis of existing data, we have identified a need for standard reporting for OU outcomes and propose consistent measures for future observation care research. Only through prospective evaluation of comparable outcomes can we appraise the performance of pediatric OUs across institutions.
- .Observation medicine.Acad Emerg Med.1994;1(2):152–154.
- ,.Principles of observation medicine.Emerg Med Clin North Am.2001;19(1):1–17.
- ,,, et al.Emergency department observation beds improve patient care: Society for Academic Emergency Medicine debate.Ann Emerg Med.1992;21(8):967–975.
- .Pediatric observation medicine.Emerg Med Clin North Am.2001;19(1):239–254.
- ,,.The pediatric hybrid observation unit: an analysis of 6477 consecutive patient encounters.Pediatrics.2005;115(5):e535–e542.
- ,,, et al.Observation units: the role of an outpatient extended treatment site in pediatric care.Pediatr Emerg Care.1998;14(6):444–447.
- ,,, et al.Impact of a short stay unit on asthma patients admitted to a tertiary pediatric hospital.Qual Manag Health Care.1997;6(1):14–22.
- ,,, et al.Management of observation units. American College of Emergency Physicians.Ann Emerg Med.1995;25(6):823–830.
- ,,, et al. The observation unit: an operational overview for the hospitalist. Society of Hospital Medicine White Paper 2009; Available at: http://www.hospitalmedicine.org/Content/NavigationMenu/Publications/WhitePapers/White_Papers.htm. Accessed July2009.
- Acute Criteria Pediatric InterQual Level of Care.San Francisco, CA:McKesson Corporation;2006.
- Observation Status Related to U.S. Hospital Records.Healthcare Cost and Utilization Project. HCUP Methods Series Report #2002‐3. Rockville, MD: Agency for Healthcare Research and Quality;2002.
- ,,, et al.Emergency department observation unit versus hospital inpatient care for a chronic asthmatic population: a randomized trial of health status outcome and cost.Med Care.1998;36(4):599–609.
- ,,, et al.Costs of an emergency department‐based accelerated diagnostic protocol vs hospitalization in patients with chest pain: a randomized controlled trial.JAMA.1997;278(20):1670–1676.
- .Management of patients with infectious diseases in an emergency department observation unit.Emerg Med Clin North Am.2001;19(1):187–207.
- ,,, et al.A comparison between emergency diagnostic and treatment unit and inpatient care in the management of acute asthma.Arch Intern Med.1997;157(18):2055–2062.
- .Chest pain observation units.Emerg Med J.2001;18(2):148.
- ,,, et al.Randomised controlled trial and economic evaluation of a chest pain observation unit compared with routine care.BMJ.2004;328(7434):254.
- ,,, et al.A cooperative care model: cardiologists and hospitalists reduce length of stay in a chest pain observation. In:5th Scientific Forum on Quality of Care and Outcomes Research in Cardiovascular Disease and Stroke, Washington, DC, May 15‐17, 2003.Philadelphia, PA:Lippincott Williams 2003. p.P186.
- ,.Observation unit management of pediatric emergencies.Emerg Med Clin North Am.1991;9(3):669–676.
- .A short stay or 23‐hour ward in a general and academic children's hospital: are they effective?Pediatr Emerg Care.2000;16(4):223–229.
- ,,, et al.Trends in high turnover stays among children hospitalized in the United States, 1993 through 2003.Pediatrics.2009;123:996–1002.
- .Hospital based alternatives to acute paediatric admission: a systematic review.Arch Dis Child.2005;90(2):138–142.
- ,,.Short‐stay units and observation medicine: a systematic review.Med J Aust.2003;178(11):559–563.
- ,,.Use of emergency observation and assessment wards: a systematic literature review.Emerg Med J.2003;20(2):138–142.
- Oxford Centre for Evidence‐Based Medicine. Levels of evidence and grades of recommendation (May 2001). Available at: http://www.cebm.net/levels_of_evidence.asp. Accessed July2009.
- ,,, et al.Pediatric observation status beds on an inpatient unit: an integrated care model.Pediatr Emerg Care.2004;20(1):17–21.
- .Pediatric update. Our new rapid treatment unit: an innovative adaptation of the “less than 24‐hour stay” holding unit.J Emerg Nurs.2000;26(5):507.
- ,,.Use of an observation unit by a pediatric emergency department for common pediatric illnesses.Pediatr Emerg Care.2001;17(5):321–323.
- ,,, et al.Observation medicine: the expanded role of the nurse practitioner in a pediatric emergency department extended care unit.Pediatr Emerg Care.2005;21(3):199–202.
- ,,.An observation unit in a pediatric emergency department: one children's hospital's experience.J Emerg Nurs.2002;28(5):407–413.
- ,,.When the patient requires observation not hospitalization.J Nurs Admin.1988;18(10):20–23.
- ,.Observation unit in Children's Hospital—Adjunct to delivery and teaching of ambulatory pediatric care.N Y State J Med.1980;80(11):1684–1686.
- ,,, et al.Use of pediatric observation unit for treatment of children with dehydration caused by gastroenteritis.Pediatr Emerg Care.2006;22(1):1–6.
- ,,, et al.Utilization and unexpected hospitalization rates of a pediatric emergency department 23‐hour observation unit.Pediatr Emerg Care.2008;24(9):589–594.
- ,,, et al.Short‐term holding room treatment of asthmatic‐children.J Pediatr.1985;106(5):707–711.
- ,,.Usefulness of the serum electrolyte panel in the management of pediatric dehydration treated with intravenously administered fluids.Pediatrics.2004;114(5):1227–1234.
- ,,.Treatment of acute asthmatic attacks in a holding unit of a pediatric emergency room.Ann Allergy.1980;45(3):159–162.
- ,,.Outpatient oral rehydration in the United States.Am J Dis Child.1986;140(3):211–215.
- ,.Postreduction management of intussusception in a children's hospital emergency department.Pediatrics.2003;112(6 Pt 1):1302–1307.
- ,,, et al.Children with asthma admitted to a pediatric observation unit.Pediatr Emerg Care.2005;21(10):645–649.
- ,,, et al.Pediatric closed head injuries treated in an observation unit.Pediatr Emerg Care.2005;21(10):639–644.
- ,,.A reduction in hospitalization, length of stay, and hospital charges for croup with the institution of a pediatric observation unit.Am J Emerg Med.2006;24(7):818–821.
- ,,.Short stay in an outpatient department. An alternative to hospitalization.Am J Dis Child.1972;123(2):128–132.
- ,,.The role of oral ondansetron in children with vomiting as a result of acute gastritis/gastroenteritis who have failed oral rehydration therapy: a randomized controlled trial.Ann Emerg Med.2008;52(1):22–29.e6.
- ,,, et al.Oral ondansetron for gastroenteritis in a pediatric emergency department.N Engl J Med.2006;354(16):1698–1705.
- ,,, et al.Integrated hospital emergency care improves efficiency.Emerg Med J.2008;25(2):78–82.
- ,,, et al.Redefining the community pediatric hospitalist: the combined pediatric ED/inpatient unit.Pediatr Emerg Care.2007;23(1):33–37.
- ,,, et al.Program description: a hospitalist‐run, medical short‐stay unit in a teaching hospital.CMAJ.2000;163(11):1477–1480.
- ,.Evaluation of a pediatric hospitalist service: impact on length of stay and hospital charges.Pediatrics.2000;105(3 Pt 1):478–484.
- ,,, et al.Restructuring an academic pediatric inpatient service using concepts developed by hospitalists.Clin Pediatr (Phila).2001;40(12):653–660; discussion 661‐662.
- ,,, et al.American College of Emergency Physicians (ACEP).Practice Management Committee, American College of Emergency Physicians. Management of Observation Units. Irving, TX: American College of Emergency Physicians; July1994.
- Overcrowding crisis in our nation's emergency departments:is our safety net unraveling?Pediatrics.2004;114(3):878–888.
- ,.Emergency department overcrowding in the United States: an emerging threat to patient safety and public health.Emerg Med J.2003;20(5):402–405.
- ,,, et al.Characteristics of high volume teaching hospital observation units: data from the Emergency Department Observation Unit Benchmark Alliance (EDOBA).Acad Emerg Med.2009;16(s1):Abstract 628.
- ,,.Use of the emergency department observation unit in the treatment of acute asthma.Ann Emerg Med.1982;11(2):77–83.
- ,,, et al.Management of acute pyelonephritis in an emergency department observation unit.[see Comment].Ann Emerg Med.1991;20(3):253–257.
- ,,, et al.Patterns of use of an emergency department‐based observation unit.Am J Ther.2002;9(6):499–502.
- ,,, et al.Emergency department observation of poisoned patients: how long is necessary?[see Comment].Acad Emerg Med.1999;6(9):887–894.
- ,,, et al.False‐negative and false‐positive errors in abdominal pain evaluation: failure to diagnose acute appendicitis and unnecessary surgery.Acad Emerg Med.2000;7(11):1244–1255.
- .Resource use by younger versus older patients.Fam Pract Res J.1993;13(3):283–290.
- ,,, et al.Trauma 24‐hour observation critical path.J Trauma.1998;45(1):147–150.
- ,,, et al.The role of an emergency department observation unit in the management of trauma patients.J Emerg Med.1985;2(5):325–333.
- ,.Observation unit impact on ED admission for asthma.Am J Emerg Med.1994;12(1):11–14.
- ,.Emergency care for children in pediatric and general emergency departments.Pediatr Emerg Care.2007;23(2):94–102.
The first observation units were implemented more than 40 years ago with the goal of reducing the number and duration of inpatient stays. Since then, observation units (OUs) have evolved as a safe alternative to hospitalization14 for the delivery of finite periods of care, typically less than 24 hours.58 Observation services allow for time to determine the need for hospitalization in cases that are unclear after their initial evaluation and treatment.9 Observation status is an administrative classification related to reimbursement that can be applied to patients whose diagnosis, treatment, stabilization, and discharge can reasonably be expected within 24 hours.10, 11 The site of care for observation is dependent in part upon existing facility structures; some institutions utilize virtual OUs within the emergency department (ED) or hospital ward, while others have dedicated, geographically distinct OUs, which may function as an extension of either the ED or inpatient settings.9
OUs have been instrumental in providing care to adult patients with chest pain, asthma, and acute infections.1218 Recently, there has been an increase in the number of publications from pediatric OUs in the United States and abroad. Observation may be a preferred model of care for select pediatric patients, as hospitalized children often experience brief stays.1921 Previous reviews on this model of care have combined adult and pediatric literature and have included research from countries with healthcare structures that differ considerably from the United States.2224 To date, no systematic review has summarized the pediatric OU literature with a focus on the US healthcare system.
As payers and hospitals seek cost‐effective alternatives to traditional inpatient care, geographically distinct OUs may become integral to the future of healthcare delivery for children. This systematic review provides a descriptive overview of the structure and function of pediatric OUs in the United States. We also scrutinize the outcome measures presented in the included publications and propose future directions for research to improve both observation unit care, as well as the care delivered to patients under observation status within general inpatient or ED settings.
Methods
Literature Search
With the assistance of a health services librarian, a search of the following electronic databases from January 1, 1950 through February 5, 2009 was conducted: Medline, Web of Science, Cumulative Index to Nursing and Allied Health Literature (CINAHL), Health Care Advisory Board (HCAB), Lexis‐Nexis, National Guideline Clearinghouse, and Cochrane Reviews. Key words used for the Boolean search are included in Appendix A. In addition, we conducted a manual search of reference lists from reviews, guidelines, and articles meeting inclusion criteria.
We included English language peer‐reviewed publications that reported on pediatric OU care in the United States. Studies were included if they reported outcomes including lengths of stay, admission from observation rates, return visit rates, costs or charges. Descriptive publications of pediatric OU structure and function were also included. Studies were excluded if they were conducted outside the United States, evaluated psychiatric or intensive care, reported on observation status in an ED without an OU or observation status on a traditional inpatient ward. Two reviewers (M.M. and C.K.) identified articles for inclusion. Any disagreements between the reviewers were resolved by discussion and consensus agreement. Interrater reliability was assessed using the kappa statistic.
Quality Assessment
The quality of each study was rated using the Oxford Centre for Evidence‐based Medicine levels of evidence.25 With this system, levels of evidence range from 1a (homogeneous systematic review of randomized, controlled trials) to 5 (expert opinion without explicit critical appraisal).
Data Synthesis
Data on study design, OU characteristics, patient populations, and outcomes were extracted using a standardized form. Heterogeneity of study design, interventions, and outcomes precluded the ability to conduct meta‐analyses.
Results
A systematic search of the electronic databases identified 222 unique citations (Figure 1). A total of 107 abstracts were evaluated. We identified 48 articles for full‐text review, of which 18 met inclusion criteria. Hand search of references yielded 24 additional articles, of which 3 met inclusion criteria. Interrater agreement for selected articles was high at 98% (kappa = 0.85).
Observation Unit Characteristics
The majority of research on OUs has been conducted at large academic pediatric centers. One publication was from a community hospital.26 These studies present data on more than 22,000 children cared for in OUs of 11 hospitals over a 32‐year time span. Most studies were level 2 evidence: 2b, retrospective cohort studies and low‐quality randomized, controlled trials; or 2c, outcomes research. Three were descriptive and not assigned a formal evidence level.2729
Table 1 highlights general features of U.S. pediatric OUs. Five institutions renovated or expanded clinical space in order to open the OU.27, 2932 Units ranged in size from 3 to 23 beds. The OU was located in or near the ED in all but 2 hospitals, which had ward‐based units. The ED was the primary entry point into the OU with only 2 open model units accepting patients from other settings.5, 32 The annual number of observation cases ranged from 1000 to 3000 in children's hospitals. Approximately 500 ward‐based observation cases per year were cared for in the single community hospital studied. Three reports included time trends showing increased OU utilization over study years.5, 30, 31
| Publication (Year); Condition | Study Design; Level of Evidence; Time Frame; Sample Size | Hospital; Observation Setting; Year Opened | Site | Beds | Entry Point | Staffing; Physicians; Nurses |
|---|---|---|---|---|---|---|
| ||||||
| Gururaj et al.43 (1972); all conditions | Retrospective cohort; 2c; 1 year; 437 cases under observation | King's County Downstate Brooklyn; short‐stay unit | ED | 3 | Not reported | Pediatric residents; general pediatricians |
| Ellerstein and Sullivan,32 (1980); all conditions | Retrospective cohort; 2c; 6 years; 5858 cases of unscheduled care plus 1403 elective surgery cases | Children's Hospital Buffalo; observation unit; 1972 | ED | 8 | ED, clinic, procedure/OR | Primary care pediatricians; other specialists; pediatric residents |
| O'Brien et al.37 (1980); asthma | Retrospective cohort; 2c; 1 month; 434 cases of asthma, 328 discharged directly from ED, 106 treated in holding unit | Children's National DC; holding unit | ED | 6 | ED | 1‐2 pediatric residents; 1‐2 nurses |
| Willert et al.35 (1985); asthma | Randomized*; 2b; 578 cases of asthma; 166 cases 1.5 hours postaminophylline, 103 randomized, 52 to holding unit | Children's Memorial Chicago; holding room | ED | 5 | ED | General pediatricians; pediatric residents; PEM nurses |
| Listernick et al.38 (1986); dehydration | Randomized; 2b; 29 cases of dehydration; 22 to holding unit | Children's Memorial Chicago | ||||
| Balik et al.31 (1988); all conditions | Descriptive; none given | Minneapolis Children's; short‐stay unit observation area; 1985 | Day surgery area adjacent to ED | Not reported | Not reported | General pediatricians; pediatric nurses (shared with ED) |
| Marks et al.7 (1997); all conditions | Retrospective cohort; 2c; 5 months; 968 cases in short‐stay unit | Children's Hospital Boston; short‐stay unit; 1994 | Ward | 4‐18 | ED | Primary care pediatricians; PEM physicians; pediatric residents; pediatric nurses; 1:6 nurse:patient ratio |
| Marks et al.7 (1997); asthma | Pre‐post; 2b; 400 cases of asthma; 102 pre/298 post short‐stay unit | Children's Hospital Boston | ||||
| Wiley et al.6 (1998); all conditions | Retrospective cohort; 2c; 1 year; 805 cases of unscheduled observation; plus 595 scheduled cases | Connecticut Children's; outpatient extended treatment site | ED | 10 | Not reported | PEM physicians; other specialists; 1:5 nurse:patient ratio |
| Scribano et al.65 (2001); all conditions | Retrospective cohort; 2b; 2 years; 1798 cases under observation | Connecticut Children's | ||||
| Leduc et al.30 (2002); all conditions | Retrospective cohort; 2c; 6 months; 686 cases under observation (4.8% of ED visits) | Children's Hospital Denver; OU | ED | 6 | Not reported | Not reported |
| Bajaj and Roback,30 (2003); intussusception | Retrospective cohort; 2b; 4.5 years; 78 cases of intussusception (51 under observation) | Children's Hospital Denver | ||||
| Wathen et al.36 (2004); dehydration | Convenience sample; 2c; 10 months; 182 cases of dehydration (48 under observation) | Children's Hospital Denver | ||||
| Crocetti et al.26 (2004); all conditions | Retrospective cohort; 2b; 2 years; 956 cases under observation | John Hopkin's Bayview; observation status beds; 1997 | Ward | Not reported | 99% ED 1% other location | General pediatricians covering ED and ward |
| Silvestri et al.29 (2005); all conditions | Descriptive; none given | Children's Hospital of Philadelphia; OU; 1999 | ED | 12 | ED | PEM physicians; PEM fellows; urgent care pediatricians; ED nurse practitioner; inpatient nurses |
| Alpern et al.34 (2008); all conditions | Prospective cohort; 1b; 30 months; 4453 cases under observation | Children's Hospital of Philadelphia | ||||
| Thomas27 (2000); all conditions | Descriptive; none given | Primary Children's Medical Center; RTU; 1999 | ED | 22‐26 | ED, clinic, procedure/OR | PEM physicians; general pediatricians; other specialists; no residents |
| Zebrack et al.25 (2005); all conditions | Retrospective cohort; 2b; 2 years; 4189 cases of unscheduled observation plus 2288 scheduled cases | Primary Children's Medical Center | PEM nurses; 1:4 nurse:patient ratio | |||
| Miescier et al.40 (2005); asthma | Retrospective cohort; 2b; 2 years; 3029 asthma visits; 384 admitted, 301 observed, 161cases met inclusion | Primary Children's Medical Center | ||||
| Holsti et al.41 (2005); head injury | Retrospective cohort; 2b; 2 years; 827 CHI visits, 273 admitted, 285 observed, 284 cases met inclusion | Primary Children's Medical Center | ||||
| Greenberg et al.42 (2006); croup | Retrospective pre‐post; 2b; 1 year each; 694 croup cases pre‐RTU, 66 admitted; 789 croup cases post‐RTU, 33 admitted; 76 observed | Primary Children's Medical Center | ||||
| Mallory et al.33 (2006); dehydration | Retrospective cohort; 2b; 1 year; 430 dehydration cases under observation | Primary Children's Medical Center | ||||
Staffing and Workflow
Staffing models varied and have undergone transitions over time. Prior to 1997, general pediatricians primarily provided physician services. In more recent years, OUs have utilized pediatric emergency medicine (PEM) providers. Three of the 11 units allowed for direct patient care by subspecialists.5, 6, 32 One OU was staffed by nurse practitioners.29 OU nursing backgrounds included pediatrics, emergency medicine, or PEM.
Five institutions assembled multidisciplinary teams to define the unit's role and establish policies and procedures.7, 27, 2931 Workflow in the OU focused on optimizing efficiency through standardized orders, condition‐specific treatment protocols, and bedside charting.7, 26, 33 Several units emphasized the importance of ongoing evaluations by attending physicians who could immediately respond to patient needs. Rounds occurred as often as every 4 hours.5, 7 Two centers utilized combined physician‐nursing rounds to enhance provider communication.7, 34 No publications reported on patient transitions between sites of care or at shift changes.
Criteria for Observation
All 11 hospitals have developed protocols to guide OU admissions (Table 2). Nine publications from 4 OUs commented on treatments delivered prior to observation.33, 3542 The most commonly cited criteria for admission was approval by the unit's supervising physician. Utilization review was not mentioned as an element in the OU admission decision. Common OU exclusions were the need for intensive care or monitoring while awaiting an inpatient bed; however, these were not universal. Eight centers placed bounds around the duration of OU stays, with minimum stays of 2 hours and maximum stays of 8 to 24 hours.
| Hospital | Entry Criteria | Age Range | Time | Exclusion Criteria |
|---|---|---|---|---|
| ||||
| King's County, Downstate Brooklyn | Otherwise required inpatient admission | 0‐13 years | Maximum 24 hours | Not reported |
| Acute problem of uncertain severity | ||||
| Acute problem not readily diagnosed | ||||
| Short course periodic treatment | ||||
| Diagnostic procedures impractical as outpatient | ||||
| Children's Hospital, Buffalo | Admission from any source | 0‐21 years | Maximum 24 hours | Intensive care needs |
| Short stay elective surgery | Routine diagnostic tests | |||
| Estimated length of stay <24 hours | Holding prior to admission | |||
| Children's National, Washington, DC | Inadequate response to 3 subcutaneous epinephrine injections | 8 months to 19 years | Not reported | Not reported |
| Children's Memorial, Chicago | Asthma: | |||
| Available parentAsthma score 5Inadequate response to ED treatment | >1 year | Maximum 24 hours | Past history of BPD, CF, CHD, other debilitating disease | |
| Dehydration: | ||||
| Cases receiving oral hydration | 3‐24 months | 12 hours for oral | Intensive care need | |
| Parent preference if given IV hydration | 8 to 12 hours for IV | Hypernatremia | ||
| Minneapolis Children's | Conditions listed in Table 3 | Not reported | Maximum 10 hours | Not reported |
| Children's Hospital, Boston | Straightforward diagnoses as determined by ED staff | Not reported | Not reported | Other complex medical issues |
| Bed availability | ||||
| Connecticut Children's | PEM attending discretionLimited severity of illnessUsually confined to a single organ systemClearly identified plan of care | Not reported | After 3‐4 hours in ED Low likelihood of requiring extended care >23 hours | Asthma: no supplemental O2 need, nebulized treatments >Q2 hourCroup: no supplemental O2 need, <2 racemic epinephrine treatmentsDehydration: inability to tolerate orals, bicarbonate >10, 40 mL/kg IVFSeizure: partial or generalized, postictal, unable to tolerate oralsPoisoning: mild or no symptoms, poison control recommendation |
| Children's Hospital, Denver | Intussusception: following reduction | 0‐18 years | After 3‐4 hours in ED | Not reported |
| Dehydration: based on clinical status | ||||
| Johns Hopkins, Bayview | Consultation with on‐duty pediatrician | 0‐18 years | Minimum of 2 hours | Patients requiring subspecialty or intensive care services |
| High likelihood of discharge at 24 hours | ||||
| Children's Hospital of Philadelphia | Sole discretion of the ED attending | Not reported | Minimum 4 hours | No direct admissions |
| Single focused acute condition | Maximum 23 hours | Diagnostic dilemmas | ||
| Clinical conditions appropriate for observation | Underlying complex medical problems | |||
| Primary Children's Medical Center | Observation unit attending discretion | 0‐21 years | Minimum 3 hours | Admission holds |
| Scheduled procedures as space available | Maximum 24 hours | Intensive care needs | ||
| ED admit after consult with OU doctor | Complicated, multisystem disease | |||
| Clear patient care goals | Need for multiple specialty consults | |||
| Limited severity of illness | Psychiatric patients | |||
| Diagnostic evaluation | ||||
Ages of Children Under Observation
Seven of 11 hospitals reported the age range of patients accepted in their OU (Table 2). All but 1 unit accepted children from infants to young adults, 18 to 21 years of age.43 In the 6 units that reported the age distribution of their OU population, roughly 20% were <1 year, more than 50% were <5 years, and fewer than 30% fell into an adolescent age range.5, 6, 26, 32, 34, 43
Conditions Under Observation
Many conditions under observation were common across time and location (Table 3). The list of conditions cared for in OUs has expanded in recent years. Medical conditions predominated over surgical. While the majority of observation cases required acute care, nearly one‐half of the units accepted children with scheduled care needs (eg, routine postoperative care, procedures requiring sedation, infusions, and extended evaluations such as electroencephalograms or pH probes). These scheduled cases, cared for within the OU structure, provided more steady demand for OU services.
| King's County, Downstate Brooklyn | Children's Hospital, Buffalo | Minneapolis Children's | Children's Hospital, Boston | Connecticut Children's | Children's Hospital, Denver | Johns Hopkins, Bayview | Children's Hospital of Philadelphia | Primary Children's Medical Center, Salt Lake City | |
|---|---|---|---|---|---|---|---|---|---|
| |||||||||
| Respiratory | |||||||||
| Asthma | |||||||||
| Pneumonia | |||||||||
| Bronchiolitis | |||||||||
| Croup | |||||||||
| Allergic reaction | |||||||||
| Cardiology | |||||||||
| Gastrointestinal | |||||||||
| Vomiting | |||||||||
| Gastro/dehydration | |||||||||
| Abdominal pain | |||||||||
| Constipation | |||||||||
| Diabetes | |||||||||
| Neurologic | |||||||||
| Seizure | |||||||||
| Head injury | |||||||||
| Infection | |||||||||
| Sepsis evaluation | |||||||||
| UTI/pyelonephritis | |||||||||
| Cellulitis | |||||||||
| Fever | |||||||||
| Pharyngitis | |||||||||
| Otitis media | |||||||||
| Adenitis | |||||||||
| Ingestion/poisoning | |||||||||
| Hematologic | |||||||||
| Sickle cell disease | |||||||||
| Transfusion/emnfusion | |||||||||
| Psychological/social | |||||||||
| Dental | |||||||||
| Surgical conditions | |||||||||
| Foreign body | |||||||||
| Trauma | |||||||||
| Burn | |||||||||
| Orthopaedic injury | |||||||||
| Postoperative complication | |||||||||
| Scheduled care | |||||||||
| Diagnostic workup | |||||||||
| Procedures/sedation | |||||||||
| Elective surgery | |||||||||
Reimbursement
One publication highlighted the special billing rules that must be considered for observation care.27 In 3 studies, payers recognized cost‐savings associated with the OU's ability to provide outpatient management for cases that would traditionally require inpatient care.31, 35, 38
Observation Unit Outcomes
Outcomes reported for pediatric OU stays fall into 4 major categories: length of stay (LOS), admission rates, return visit rates, and costs. Despite these seemingly straightforward groupings, there was significant heterogeneity in reporting these outcomes.
Length of Stay
The start time for OU length of stay (LOS) is not clearly defined in the articles included in this review. While the start of an observation period is assumed to begin at the time the order for observation is placed, it is possible that the LOS reported in these publications began at the time of ED arrival or the time the patient was physically transferred to the OU. The average LOS for individual OUs ranged from 10 to 15 hours.5, 6, 26, 30, 35, 38, 40, 41, 43 One ward‐based and 1 ED‐based unit reported LOS extending beyond 24 hours,7, 30 with averages of 35 and 9 hours, respectively. Two units limited the duration of care to <10 hours.31, 38
For studies that included a comparison group, OU stays were consistently shorter than a traditional inpatient stay by 6 to 110 hours.7, 36, 38, 39, 42 No significant differences in clinical parameters between groups were reported. There was appreciable variation in the average LOS across institutions for similar conditions, 12 to 35 hours for asthma,5, 7, 34, 35 and 9 to 18 hours for dehydration.5, 34, 36, 38
Admission Rates
Rates of hospital admission after observation from the 9 OUs reporting this outcome are presented in Table 4. Three publications from a single institution counted hospital admission in the 48 to 72 hours following discharge from the OU as though the patient were admitted to the hospital directly from the index OU stay.33, 40, 41 Conditions with the lowest admission rates, <10%, included croup, neurologic conditions, ingestions, trauma, and orthopedic injuries. The highest admission rates, >50%, were for respiratory conditions including asthma, pneumonia, and bronchiolitis.
| King's County, Downstate Brooklyn (%) | Children's Hospital, Buffalo (%) | Connecticut Children's (%) | Johns Hopkins, Bayview (%) | Children's Hospital of Philadelphia (%) | Primary Children's Medical Center, Salt Lake City (%) | |
|---|---|---|---|---|---|---|
| ||||||
| Unscheduled care | 42 | 17 | 11 | 25 | 25 | 15 |
| Respiratory | 32 | |||||
| Asthma | 57 | 16 | 26 | 22 | 22‐25* | |
| Pneumonia | 50 | 23 | 30‐48 | |||
| Bronchiolitis | 46 | 32 | 43 | |||
| Croup | 9 | 17 | 9 | 4‐6 | ||
| Allergic reaction | 3 | |||||
| Cardiology | 22 | |||||
| Gastrointestinal | 43 | 19 | ||||
| Vomiting | 5 | 22 | ||||
| Gastro/dehydration | 23 | 15/21 | 16* | |||
| Abdominal pain | 9 | 17 | 27 | |||
| Constipation | 9 | |||||
| Diabetes | 17 | |||||
| Neurologic | 10 | |||||
| Seizure | 19 | 8 | 17 | 18 | ||
| Head injury | 7 | 5* | ||||
| Infection | 19 | 34 | ||||
| Sepsis evaluation | 25 | 22 | ||||
| UTI/pyelonephritis | 25 | 16 | ||||
| Cellulitis | 15 | |||||
| Fever | 16 | 26 | ||||
| Pharyngitis | 13 | |||||
| Otitis media | 21 | |||||
| Ingestion/poisoning | 9 | 4 | 4 | 9 | 10 | 5 |
| Hematologic | 23 | |||||
| Transfusion/emnfusion | 2 | |||||
| Psychological/social | 21 | 80 | 17 | |||
| Dental | 14 | |||||
| Surgical conditions | ||||||
| Foreign body | ||||||
| Trauma | 13 | 2 | 53 | 5 | ||
| Burn | 13 | |||||
| Orthopedic injury | 22 | 3 | ||||
| Postoperative complication | 26 | 16 | ||||
| Scheduled care | ||||||
| Diagnostic workup | 0‐5 | |||||
| Procedures/sedation | 0.1‐9.0 | |||||
| Elective surgery | 13 | 0‐5 | ||||
Return Visit Rates
Unscheduled return visit rates were reported in 9 publications from 6 institutions and ranged from 0.01% to 5%.7, 26, 33, 3537, 3941 Follow‐up timeframes ranged from 48 hours to 1 month. Return visits were inconsistently defined. In most studies, rates were measured in terms of ED visits.26, 33, 3537, 39, 41 One ward‐based unit counted only hospital readmissions toward return visit rates.7 Three publications, from ED‐based units, counted hospital readmissions in the 2 to 5 days following observation toward admission rates and not as return visits.33, 40, 41 In most studies, data on return visits were collected from patient logs or patient tracking systems. Three studies contacted patients by phone and counted return visits to the clinic.3537 No studies reported on adherence to scheduled visits following observation.
Costs
Seven studies reported financial benefits of OU care when compared with traditional hospital care.7, 30, 31, 35, 37, 38, 42 Two centers admitted patients to inpatient care if their observation period reached a set time limit, after which cost savings were no longer realized.31, 35 Cost savings associated with the OU treatment of asthma and dehydration were attributed to lower charges for an OU bed.35, 38 Decreased charges for the OU treatment of croup were related to shorter LOS.42
Discussion
In the 40 years since the first studies of pediatric OUs, several US health systems have extended observation services to children. This model of care may be expanding, as suggested by an increase in the number of publications in the past 10 years. However, the number of centers within the US reporting on their OU experience remains small. Our systematic review identified a recurrent theme related to OUsthe opportunity to improve operational processes of care compared with the traditional inpatient alternative. We have identified the need to standardize OU outcomes and propose measures for future OU research.
Observation Unit Operations
The OU care model expands outpatient management of acute conditions to include children who are neither ready for discharge nor clear candidates for inpatient admission. OUs have demonstrated the ability to care for patients across the pediatric age spectrum. Over the decades spanning these publications, advances in medical therapy such as antiemetics for gastroenteritis and early administration of systemic steroids for asthma may have resulted in lower admission rates or shorter time to recovery.44, 45 Despite these advances, there are marked consistencies in the conditions cared for within OUs over time. The data summarized here may help guide institutions as they consider specific pediatric conditions amenable to observation care.
The hospitals included in this review either added physical space or revised services within existing structures to establish their OU. Hospitals facing physical constraints may look to underutilized areas, such as recovery rooms, to provide observation care, as observation does not require the use of licensed inpatient beds. Several units have responded to daily fluctuations in unscheduled observation cases by also serving patients who require outpatient procedures, brief therapeutic interventions, and diagnostic testing. By caring for patients with these scheduled care needs during the day, there is a more steady flow of patients into the OU. While hospitals traditionally have used postanesthesia care units and treatment rooms for scheduled cases, OUs appear to benefit from the consistent resource allocation associated with a constant demand for services.
To date, the vast majority of pediatric OUs in the published literature have emerged as an extension of ED services. Now, with the expansion of pediatric hospitalist services and movement toward 24/7 inpatient physician coverage, there may be increased development of ward‐based OUs and the designation of inpatient observation status. While ward‐based OUs managed by pediatric hospitalists may be well established, we were not able to identify published reports on this structure of care. A national survey of health systems should be undertaken to gather information regarding the current state of pediatric observation services.
When creating policies and procedures for OUs, input should be sought from stakeholders including hospitalists, PEM providers, primary care providers, subspecialists, mid‐level providers, nurses, and ancillary staff. As patients requiring observation level of care do not neatly fit an outpatient or inpatient designation, they present an opportunity for hospitalist and PEM physician groups to collaborate.4648 Calling on the clinical experiences of inpatient and ED providers could offer unique perspectives leading to the development of innovative observation care models.
This review focused on institutions with dedicated observation services, which in all but 1 study26 consisted of a defined geographic unit. It is possible that the practices implemented in an OU could have hospital‐wide impact. For example, 1 study reported reduction in LOS for all asthma cases after opening a ward‐based unit.7 Further, pediatric hospitalist services have been associated with shorter LOS49 and increased use of observation status beds compared with traditional ward services.50 As pediatric hospitalists expand their scope of practice to include both observation and inpatient care, clinical practice may be enhanced across these care areas. It follows that the impact of observation protocols on care in the ward setting should be independently evaluated.
The costs associated with the establishment and daily operations of an OU were not addressed in the reviewed publications. Assertions that observation provides a cost‐effective alternative to inpatient care4, 7, 23, 42 should be balanced by the possibility that OUs extend care for patients who could otherwise be discharged directly home. Studies have not evaluated the cost of OU care compared with ED care alone. Research is also needed to assess variations in testing and treatment intensity in OUs compared with the ED and inpatient alternatives. Reimbursement for observation is dependent in part upon institutional contracts with payers. A full discussion of reimbursement issues around observation services is beyond the scope of this review.
Observation Unit Outcomes
Length of Stay
Although most studies reported LOS, direct comparisons across institutions are difficult given the lack of a consistently referenced start to the observation period. Without this, LOS could begin at the time of ED arrival, time of first treatment, or time of admission to the OU. Identifying and reporting the elements contributing to LOS for observation care is necessary. The time of OU admission is important for billing considerations; the time of first treatment is important to understanding the patient's response to medical interventions; the time of ED arrival is important to evaluating ED efficiency. Each of these LOS measures should be reported in future studies.
Direct comparisons of LOS are further complicated by variability in the maximum permissible duration of an OU stay, ranging from 8 to 24 hours in the included studies. Despite these limits, some OU care will extend beyond set limits due to structural bottlenecks. For example, once the inpatient setting reaches capacity, observation LOS for patients who require admission will be prolonged. The best evaluation of LOS would come from prospective study design utilizing either randomization or quality improvement methods.
Defining Success and Failure in Observation Care
In the reviewed literature, observation failures have been defined in terms of admission after observation and unscheduled return visit rates. Admission rates are heavily dependent on appropriate selection of cases for observation. Although some observation cases are expected to require inpatient admission, OUs should question the validity of their unit's acceptance guidelines if the rate of admission is >30%.51 High rates could be the result of inadequate treatment or the selection of children too sick to improve within 24 hours. Low rates could indicate overutilization of observation for children who could be discharged directly home. Full reporting on the number of children presenting with a given condition and the different disposition pathways for each is needed to evaluate the success of OUs. Condition‐specific benchmarks for admission after observation rates could guide hospitals in their continuous improvement processes.
Unscheduled return visits may reflect premature discharge from care, diagnostic errors, or development of a new illness. OU care may influence patient adherence to scheduled follow‐up care but this has not been evaluated to date. In future research, both scheduled and unscheduled return visits following ED visits, observation stays, and brief inpatient admissions for similar disease states should be reported for comparison. Standard methodology for identifying return visits should include medical record review, claims analyses, and direct patient contact.
As hospitals function at or near capacity,52, 53 it becomes important to delineate the appropriate length of time to monitor for response to treatments in a given setting. Limited capacity was a frequently cited reason for opening a pediatric OU; however, the impact of OUs on capacity has not yet been evaluated. Operations research methods could be used to model OU services' potential to expand hospital capacity. This research could be guided by evaluation of administrative data from across institutions to identify current best practices for pediatric OU and observation status care.
OU benchmarking in the United States has begun with a small number of adult units participating in the ED OU Benchmark Alliance (EDOBA).54 In Table 5, we propose dashboard measures for pediatric OU continuous quality improvement. The proposed measures emphasize the role of observation along the continuum of care for acute conditions, from the ED through the OU with or without an inpatient stay to clinic follow‐up. Depending on the structure of observation services, individual institutions may select to monitor different dashboard measures from the proposed list. Patient safety and quality of care measures for the conditions commonly receiving pediatric OU care should also be developed.
| ED |
OU |
Inpatient |
Clinic | |
|---|---|---|---|---|
| ||||
| Length of stay* | ED arrival to OU admission | OU admit to disposition | Inpatient admit to discharge | |
| ED arrival to discharge home from OU | ||||
| ED arrival to discharge from inpatient following OU care | ||||
| OU admission to discharge home from inpatient care | ||||
| Admission* | % ED census admitted inpatient | % OU census admitted | ||
| % ED census that is observed | ||||
| Unscheduled return visits* | To ED | Requiring OU admission | Requiring inpatient admission | |
| Scheduled follow‐up* | To ED | To primary care or subspecialist office | ||
| Capacity | ED crowding scales | Unable to accept transfers | ||
| ED left before evaluation rates | Inpatient occupancy | |||
| Ambulance diversion | ||||
| Satisfaction | Patient/Parent | |||
| ED providers | OU providers | Inpatient providers | Follow‐up providers | |
| Cost | ED care | OU care | Inpatient care | |
| Total encounter | ||||
Limitations
The most important limitations to this review are the heterogeneity in interventions and reporting of outcomes, which precluded our ability to combine data or conduct meta‐analyses. We attempted to organize the outcomes data into clear and consistent groupings. However, we could not compare the performance of 1 center with another due to differences in OU structure, function, and design.
In order to focus this systematic review, we chose to include only peer reviewed publications that describe pediatric OUs within the United States. This excludes expert guidelines, which may be of value to institutions developing observation services.
Our search found only a small number of centers that utilize OUs and have published their experience. Thus, our review is likely subject to publication bias. Along this line, we identified 9 additional publications where children were cared for alongside adults within a general OU.5563 This suggests an unmeasured group of children under observation in general EDs, where more than 90% of US children receive acute care.64 These articles were excluded because we were unable to distinguish pediatric specific outcomes from the larger study population.
Finally, retrospective study design is subject to information bias. Without a comparable control group, it is difficult to understand the effects of OUs. Patients directly admitted or discharged from the ED and patients who require admission after observation all differ from patients discharged from observation in ways that should be controlled for with a randomized study design.
Conclusions
OUs have emerged to provide treatment at the intersection of outpatient and inpatient care during a time of dramatic change in both emergency and hospital medicine. As hospitalists expand their scope of practice to include observation care, opportunities will arise to collaborate with ED physicians and share their growing expertise in quality and efficiency of hospital care delivery to improve observation services for children. OUs have been established with laudable goalsto reduce inpatient admissions, increase patient safety, improve efficiency, and control costs. The current evidence is not adequate to determine if this model of healthcare delivery achieves these goals for children. Through synthesis of existing data, we have identified a need for standard reporting for OU outcomes and propose consistent measures for future observation care research. Only through prospective evaluation of comparable outcomes can we appraise the performance of pediatric OUs across institutions.
- .Observation medicine.Acad Emerg Med.1994;1(2):152–154.
- ,.Principles of observation medicine.Emerg Med Clin North Am.2001;19(1):1–17.
- ,,, et al.Emergency department observation beds improve patient care: Society for Academic Emergency Medicine debate.Ann Emerg Med.1992;21(8):967–975.
- .Pediatric observation medicine.Emerg Med Clin North Am.2001;19(1):239–254.
- ,,.The pediatric hybrid observation unit: an analysis of 6477 consecutive patient encounters.Pediatrics.2005;115(5):e535–e542.
- ,,, et al.Observation units: the role of an outpatient extended treatment site in pediatric care.Pediatr Emerg Care.1998;14(6):444–447.
- ,,, et al.Impact of a short stay unit on asthma patients admitted to a tertiary pediatric hospital.Qual Manag Health Care.1997;6(1):14–22.
- ,,, et al.Management of observation units. American College of Emergency Physicians.Ann Emerg Med.1995;25(6):823–830.
- ,,, et al. The observation unit: an operational overview for the hospitalist. Society of Hospital Medicine White Paper 2009; Available at: http://www.hospitalmedicine.org/Content/NavigationMenu/Publications/WhitePapers/White_Papers.htm. Accessed July2009.
- Acute Criteria Pediatric InterQual Level of Care.San Francisco, CA:McKesson Corporation;2006.
- Observation Status Related to U.S. Hospital Records.Healthcare Cost and Utilization Project. HCUP Methods Series Report #2002‐3. Rockville, MD: Agency for Healthcare Research and Quality;2002.
- ,,, et al.Emergency department observation unit versus hospital inpatient care for a chronic asthmatic population: a randomized trial of health status outcome and cost.Med Care.1998;36(4):599–609.
- ,,, et al.Costs of an emergency department‐based accelerated diagnostic protocol vs hospitalization in patients with chest pain: a randomized controlled trial.JAMA.1997;278(20):1670–1676.
- .Management of patients with infectious diseases in an emergency department observation unit.Emerg Med Clin North Am.2001;19(1):187–207.
- ,,, et al.A comparison between emergency diagnostic and treatment unit and inpatient care in the management of acute asthma.Arch Intern Med.1997;157(18):2055–2062.
- .Chest pain observation units.Emerg Med J.2001;18(2):148.
- ,,, et al.Randomised controlled trial and economic evaluation of a chest pain observation unit compared with routine care.BMJ.2004;328(7434):254.
- ,,, et al.A cooperative care model: cardiologists and hospitalists reduce length of stay in a chest pain observation. In:5th Scientific Forum on Quality of Care and Outcomes Research in Cardiovascular Disease and Stroke, Washington, DC, May 15‐17, 2003.Philadelphia, PA:Lippincott Williams 2003. p.P186.
- ,.Observation unit management of pediatric emergencies.Emerg Med Clin North Am.1991;9(3):669–676.
- .A short stay or 23‐hour ward in a general and academic children's hospital: are they effective?Pediatr Emerg Care.2000;16(4):223–229.
- ,,, et al.Trends in high turnover stays among children hospitalized in the United States, 1993 through 2003.Pediatrics.2009;123:996–1002.
- .Hospital based alternatives to acute paediatric admission: a systematic review.Arch Dis Child.2005;90(2):138–142.
- ,,.Short‐stay units and observation medicine: a systematic review.Med J Aust.2003;178(11):559–563.
- ,,.Use of emergency observation and assessment wards: a systematic literature review.Emerg Med J.2003;20(2):138–142.
- Oxford Centre for Evidence‐Based Medicine. Levels of evidence and grades of recommendation (May 2001). Available at: http://www.cebm.net/levels_of_evidence.asp. Accessed July2009.
- ,,, et al.Pediatric observation status beds on an inpatient unit: an integrated care model.Pediatr Emerg Care.2004;20(1):17–21.
- .Pediatric update. Our new rapid treatment unit: an innovative adaptation of the “less than 24‐hour stay” holding unit.J Emerg Nurs.2000;26(5):507.
- ,,.Use of an observation unit by a pediatric emergency department for common pediatric illnesses.Pediatr Emerg Care.2001;17(5):321–323.
- ,,, et al.Observation medicine: the expanded role of the nurse practitioner in a pediatric emergency department extended care unit.Pediatr Emerg Care.2005;21(3):199–202.
- ,,.An observation unit in a pediatric emergency department: one children's hospital's experience.J Emerg Nurs.2002;28(5):407–413.
- ,,.When the patient requires observation not hospitalization.J Nurs Admin.1988;18(10):20–23.
- ,.Observation unit in Children's Hospital—Adjunct to delivery and teaching of ambulatory pediatric care.N Y State J Med.1980;80(11):1684–1686.
- ,,, et al.Use of pediatric observation unit for treatment of children with dehydration caused by gastroenteritis.Pediatr Emerg Care.2006;22(1):1–6.
- ,,, et al.Utilization and unexpected hospitalization rates of a pediatric emergency department 23‐hour observation unit.Pediatr Emerg Care.2008;24(9):589–594.
- ,,, et al.Short‐term holding room treatment of asthmatic‐children.J Pediatr.1985;106(5):707–711.
- ,,.Usefulness of the serum electrolyte panel in the management of pediatric dehydration treated with intravenously administered fluids.Pediatrics.2004;114(5):1227–1234.
- ,,.Treatment of acute asthmatic attacks in a holding unit of a pediatric emergency room.Ann Allergy.1980;45(3):159–162.
- ,,.Outpatient oral rehydration in the United States.Am J Dis Child.1986;140(3):211–215.
- ,.Postreduction management of intussusception in a children's hospital emergency department.Pediatrics.2003;112(6 Pt 1):1302–1307.
- ,,, et al.Children with asthma admitted to a pediatric observation unit.Pediatr Emerg Care.2005;21(10):645–649.
- ,,, et al.Pediatric closed head injuries treated in an observation unit.Pediatr Emerg Care.2005;21(10):639–644.
- ,,.A reduction in hospitalization, length of stay, and hospital charges for croup with the institution of a pediatric observation unit.Am J Emerg Med.2006;24(7):818–821.
- ,,.Short stay in an outpatient department. An alternative to hospitalization.Am J Dis Child.1972;123(2):128–132.
- ,,.The role of oral ondansetron in children with vomiting as a result of acute gastritis/gastroenteritis who have failed oral rehydration therapy: a randomized controlled trial.Ann Emerg Med.2008;52(1):22–29.e6.
- ,,, et al.Oral ondansetron for gastroenteritis in a pediatric emergency department.N Engl J Med.2006;354(16):1698–1705.
- ,,, et al.Integrated hospital emergency care improves efficiency.Emerg Med J.2008;25(2):78–82.
- ,,, et al.Redefining the community pediatric hospitalist: the combined pediatric ED/inpatient unit.Pediatr Emerg Care.2007;23(1):33–37.
- ,,, et al.Program description: a hospitalist‐run, medical short‐stay unit in a teaching hospital.CMAJ.2000;163(11):1477–1480.
- ,.Evaluation of a pediatric hospitalist service: impact on length of stay and hospital charges.Pediatrics.2000;105(3 Pt 1):478–484.
- ,,, et al.Restructuring an academic pediatric inpatient service using concepts developed by hospitalists.Clin Pediatr (Phila).2001;40(12):653–660; discussion 661‐662.
- ,,, et al.American College of Emergency Physicians (ACEP).Practice Management Committee, American College of Emergency Physicians. Management of Observation Units. Irving, TX: American College of Emergency Physicians; July1994.
- Overcrowding crisis in our nation's emergency departments:is our safety net unraveling?Pediatrics.2004;114(3):878–888.
- ,.Emergency department overcrowding in the United States: an emerging threat to patient safety and public health.Emerg Med J.2003;20(5):402–405.
- ,,, et al.Characteristics of high volume teaching hospital observation units: data from the Emergency Department Observation Unit Benchmark Alliance (EDOBA).Acad Emerg Med.2009;16(s1):Abstract 628.
- ,,.Use of the emergency department observation unit in the treatment of acute asthma.Ann Emerg Med.1982;11(2):77–83.
- ,,, et al.Management of acute pyelonephritis in an emergency department observation unit.[see Comment].Ann Emerg Med.1991;20(3):253–257.
- ,,, et al.Patterns of use of an emergency department‐based observation unit.Am J Ther.2002;9(6):499–502.
- ,,, et al.Emergency department observation of poisoned patients: how long is necessary?[see Comment].Acad Emerg Med.1999;6(9):887–894.
- ,,, et al.False‐negative and false‐positive errors in abdominal pain evaluation: failure to diagnose acute appendicitis and unnecessary surgery.Acad Emerg Med.2000;7(11):1244–1255.
- .Resource use by younger versus older patients.Fam Pract Res J.1993;13(3):283–290.
- ,,, et al.Trauma 24‐hour observation critical path.J Trauma.1998;45(1):147–150.
- ,,, et al.The role of an emergency department observation unit in the management of trauma patients.J Emerg Med.1985;2(5):325–333.
- ,.Observation unit impact on ED admission for asthma.Am J Emerg Med.1994;12(1):11–14.
- ,.Emergency care for children in pediatric and general emergency departments.Pediatr Emerg Care.2007;23(2):94–102.

Interhospital Transfer of Children
Interhospital transfer of critically ill and injured children is necessitated by variation in resource availability between hospitals. Critically ill children judged in need of clinical services or expertise not locally available undergo transfer to hospitals with more appropriate resource capabilities and expertise, with the expectation that clinical outcomes of transfer will be better than nontransfer.
Significant variation both in the availability of pediatric critical care services across US hospitals1 and in child mortality among hospitals without pediatric critical care services2 suggests that interhospital transfer will remain an integral part of healthcare delivery for critically ill and injured children. Timely provision of definitive care for acute life‐threatening disease is associated with good clinical outcomes.3, 4 While prior studies have examined clinical outcomes and resource consumption among critically ill adults who underwent interhospital transfer for intensive care,59 there is scarce information regarding clinical characteristics and outcomes of interhospital transfer for critically ill and injured children.
This study was conducted to test the hypothesis that, among critically ill and injured children who undergo interhospital transfer for intensive care, children transferred after an initial hospitalization at the referring facility will have higher mortality, longer length of stay (LOS), and higher resource consumption than children transferred directly from the emergency department (ED) of the referring hospitals.
METHODS
Study Design
We conducted a secondary analysis of administrative claims data from the Michigan Medicaid program for the period January 1, 2002, to December 31, 2004. The data included all paid claims for health services rendered to enrollees in the Medicaid program. The Institutional Review Board of the University of Michigan Medical School approved the study.
Study Sample and Variable Identification
A 3‐step approach was employed to identify interhospital transfer admissions for intensive care of children. Initially, the Medicaid claims were queried to identify all hospitalizations for children 018 years who received intensive care services, using Medicare revenue codes.10 Admissions for neonatal intensive care were excluded from the analysis. The American Hospital Association Guide to the Health Care Field, a compendium of US healthcare facilities, was used to verify the presence of intensive care facilities.11, 12 Subsequently, to identify the subset of children who underwent interhospital transfer, data were queried for the presence of claims from another hospital, and the date of discharge from the referring hospital had to be the same as the date of admission to the receiving hospital intensive care unit (ICU). Finally, to ascertain the source of interhospital transfer, Medicare revenue codes and current procedural terminology (CPT) codes were used to identify claims for receipt of services at specific sites within the referring hospital; namely, the ED, ward, or the ICU. This information was used to categorize admissions into 1 of 3 pathways of interhospital transfer:
ED transferFrom the ED of the referring hospital to the ICU of the receiving hospital.
Ward transferFrom the wards of the referring hospital to the ICU of the receiving hospital.
Inter‐ICU transferFrom the ICU of the referring hospital to the ICU of the receiving hospital.
Dependent Variables
Mortality at the Receiving Hospital
This is determined by linkage to vital statistics records maintained by the Michigan Department of Community Health, Division of Vital Records and Health Statistics.
LOS at the Receiving Hospital
This is determined as the count of days of hospitalization at the receiving hospital. Of note, this includes ICU days and non‐ICU days at the receiving hospital.
Independent Variables
Source of Interhospital Transfer
The main (exposure) independent variable. Categorized into ED, ward, or inter‐ICU transfers, as described.
Patient Demographics
Age and gender.
Comorbid Illness
Determined using International Classification of Diseases, ninth revision (ICD‐9) diagnosis codes, applying methodology as described.13
Organ Dysfunction at the Referring and Receiving Hospitals
Determined using ICD‐9 diagnosis codes, applying methodology as described.14
Patient Diagnostic Categories
Eleven diagnostic categories were created based on primary admission diagnoses (Appendix A).
LOS at the Referring Hospital
Determined as the count of days of hospitalization at the referring hospital.
Receipt of Cardiopulmonary Resuscitation (CPR) on the Date of Interhospital Transfer
Determined using procedure codes.
Receipt of Medical‐Surgical Procedures at the Receiving Hospital
Identified through the use of ICD‐9 procedure codes, CPT codes, and Healthcare Common Procedure Coding System codes. The procedures are listed in Appendix B.
Statistical Analysis
Descriptive statistics were used to characterize the study sample. According to the 3 sources of interhospital transfer, patient characteristics (age, gender, presence of organ dysfunction, and comorbid illness), median LOS at the referring hospital, and receipt of CPR on the date of interhospital transfer were compared using chi‐square tests for categorical variables, and Kruskal‐Wallis tests for continuous variables. Similarly, outcome variables of in‐hospital mortality and median LOS at the receiving hospital were compared across the 3 sources of interhospital transfer. Analysis of variance was used to compare mean LOS at the receiving hospital across the 3 sources of interhospital transfer. Median (with interquartile range [IQR]) and mean (with standard deviation [SD]) values are presented to describe LOS, given skew in LOS data.
To account for potential confounding of LOS and mortality at the receiving hospital by the presence of organ dysfunction and comorbid illness1316 at the referring hospital, multivariate logistic regression and multiple linear regression analyses were conducted to estimate the odds of in‐hospital mortality and the incremental LOS, respectively, for ward and inter‐ICU transfers, compared with ED transfers. Statistical analyses were conducted using Stata 8 for windows (Stata Corporation, College Station, TX). A 2‐tailed level of 0.05 was used as the threshold for statistical significance.
RESULTS
Patient Characteristics
Of 1,643 transfer admissions for intensive care during the study period, 1022 (62%) were ED transfers, 512 (31%) were ward transfers, and 109 (7%) were inter‐ICU transfers. The average age was 2 years, with male gender (57%) predominance. Comorbid illness was present in 19% of admissions, while 11% had evidence of organ dysfunction at the referring hospital. Table 1 presents key patient demographic and clinical characteristics at the referring hospitals, by transfer source. Inter‐ICU and ward transfers were younger than ED transfers, and had a higher preponderance of comorbid illness and organ dysfunction. At the time of interhospital transfer, compared with ED transfers, the proportion of admissions with organ dysfunction (a marker of illness severity) was 3‐fold and 8‐fold higher among ward and inter‐ICU transfers, respectively.
| Transfer Source | P | |||
|---|---|---|---|---|
| Characteristics | ED (n = 1022) | Ward (n = 512) | Inter‐ICU (n = 109) | |
| ||||
| Median age in years (IQR) | 2 (09) | 1 (07) | 1 (010) | <0.01 |
| Male (%) | 57.8 | 56.2 | 47.6 | 0.13 |
| Comorbid illness (% ) | 13.1 | 25.0 | 50.5 | <0.01 |
| Pretransfer hospital length of stay (days) | ||||
| Median (IQR) | 0 | 1 (02) | 3 (18) | <0.01 |
| Mean (SD) | 0.2 (5.2) | 1.6 (4.8) | 9.7 (18.0) | <0.01 |
| Pretransfer organ dysfunction (%) | 5.5 | 14.5 | 40.4 | <0.01 |
Patterns of Transfer
The leading diagnoses among all children were respiratory disease, trauma, and neurological disease (Table 2), with some variation in diagnoses by source of interhospital transfer. For example, cardiovascular disease was the second leading diagnosis after respiratory disease among the inter‐ICU transfers, while more children with endocrine disease (predominantly diabetic ketoacidosis), traumatic injury, or drug poisoning were transferred directly from the ED, than from the ward or the ICU settings. For burn care, 80% (45/56) of all transfer admissions were direct from the ED (Table 3). The majority (78%) of children with traumatic injuries were directly transferred from the ED to the ICU, while the remainder were transferred after initial care delivered on the ward (18%) or ICU (4%) settings prior to interhospital transfer for definitive intensive trauma care. Importantly, among the inter‐ICU transfers, 104 (95%) were transferred to pediatric ICUs from referring hospitals with adult and pediatric ICU facilities, suggesting uptransfer for specialized care. Five children were transferred between hospitals with adult ICU facilities.
| Transfer Source | ||||
|---|---|---|---|---|
| Diagnostic Category (%) | Overall* (n = 1639) | ED* (n = 1018) | Ward (n = 512) | Inter‐ICU (n = 109) |
| ||||
| Respiratory disease | 35.1 | 32.8 | 41.0 | 28.4 |
| Trauma | 16.2 | 20.5 | 9.2 | 9.1 |
| Neurological disease | 12.4 | 12.5 | 12.3 | 11.9 |
| Gastrointestinal disease | 6.7 | 5.4 | 7.4 | 11.9 |
| Infectious disease | 5.8 | 4.0 | 8.4 | 10.0 |
| Endocrine disease | 5.5 | 7.9 | 1.8 | 0 |
| Drug overdose/poisoning | 5.0 | 6.4 | 2.9 | 1.8 |
| Cardiovascular disease | 4.8 | 2.8 | 6.3 | 16.5 |
| Hematologic/oncologic disease | 2.0 | 1.6 | 2.9 | 1.8 |
| Cardiac arrest | 0.2 | 0 | 0.6 | 0.9 |
| Other diagnoses | 6.2 | 5.4 | 7.2 | 7.7 |
| Transfer Source | |||||
|---|---|---|---|---|---|
| Characteristics (%) | Overall (n = 1643) | ED (n = 1022) | Ward (n = 512) | Inter‐ICU (n = 109) | P |
| Respiratory | 26.8 | 19.0 | 36.7 | 54.1 | <0.01 |
| Radiological | 21.2 | 19.5 | 20.5 | 41.3 | <0.01 |
| Vascular access | 20.0 | 15.2 | 27.0 | 33.0 | <0.01 |
| Gastrointestinal | 3.9 | 3.0 | 3.7 | 12.8 | <0.01 |
| Neurological | 3.8 | 3.2 | 3.7 | 10.1 | <0.01 |
| Cardiovascular | 3.6 | 1.8 | 4.1 | 18.4 | <0.01 |
| Burn care | 3.4 | 4.5 | 2.0 | 0 | <0.01 |
| General surgery | 3.2 | 2.1 | 4.3 | 8.3 | <0.01 |
| Dialysis | 2.6 | 2.0 | 2.5 | 8.3 | <0.01 |
| ECMO | 2.1 | 1.3 | 2.2 | 9.2 | <0.01 |
CPR was performed on the date of interhospital transfer for 23 patients (1.4% of the sample), of whom 13 (56.5%) were ward transfers, 8 (34.8%) were inter‐ICU transfers, and 2 (8.7%) were ED transfers (P < 0.02). Two‐thirds of these children did not survive subsequent hospitalization at the receiving hospitals.
Clinical Outcomes and Resource Utilization at the Receiving Hospitals
At the receiving hospitals, other than burn care, medical‐surgical procedures were performed most often among the inter‐ICU transfers. Ward transfers also had higher receipt of procedures compared with ED transfers (Table 3). The inter‐ICU and ward transfers had a higher preponderance of organ dysfunction at the receiving hospitals, compared to the ED transfers (38.5% and 29.3% versus 20.8%, P < 0.01).
Clinical outcomes at the receiving hospitals varied significantly according to the source of interhospital transfer (Table 4). Sixty‐six (4%) of patients died at the receiving hospitals. In comparison with ED transfers, unadjusted in‐hospital mortality was 2‐fold and 3‐fold higher among the ward and inter‐ICU transfers, respectively. Also, hospital LOS was significantly longer among the ward and inter‐ICU transfers than for the ED transfers.
| Transfer Source | ||||
|---|---|---|---|---|
| Characteristics | ED (n = 1022) | Ward (n = 512) | Inter‐ICU (n = 109) | P |
| ||||
| Mortality (%) | 2.8 | 5.5 | 8.3 | <0.01 |
| Length of stay (days) | ||||
| Median (IQR) | 3 (27) | 5 (312) | 13 (724) | <0.01 |
| Mean (SD) | 6.7 (10.4) | 8.5 (9.2) | 21.4 (22.9) | <0.01 |
In multivariate analyses adjusting for patient age, and the presence of comorbid illness and organ dysfunction at the referring hospital, compared with ED transfers, odds of mortality were significantly higher (odds ratio [OR], 1.76; 95% confidence interval [CI], 1.023.03) for ward transfers. Inter‐ICU transfers also had higher odds of mortality (OR, 2.07; 95% CI, 0.884.86), without achieving statistical significance. Similarly, compared with ED transfers, LOS at the receiving hospital was longer by 1.5 days (95% CI, 0.32.7 days) for ward transfers, and by 13.5 days (95% CI, 11.115.8 days) for inter‐ICU transfers.
DISCUSSION
This study is the first to highlight significant variation in clinical outcomes and resource consumption after interhospital transfer of critically ill and injured children, depending on the source of transfer. In comparison with children transferred directly from the referring hospitals' ED settings, children transferred from the referring hospitals' wards had higher mortality, while those who underwent inter‐ICU transfer had significantly higher resource consumption. In addition, ward transfers had the highest proportion of children who underwent CPR on the date of interhospital transfer, highlighting elevated severity of disease prior to transfer and an urgent need for improved understanding of pretransfer clinical care and medical decision‐making. The findings raise the possibility that more timely transfer of some patients directly from community hospital EDs to regional ICUs might improve survival and reduce resource consumption.
Although interhospital transfers are common in everyday clinical practice, there has been a knowledge gap in pediatric acute and critical care medicine regarding the clinical outcomes and resource consumption among children who undergo such transfers. Findings from the current study narrow this gap by relating triage at the referring hospitals to clinical outcomes and resource utilization at the receiving hospitals.
Certain distinct transfer patterns were observed. Most children with burn injury underwent direct transfer from the ED to the ICU; this transfer pattern may be related both to the limited availability of ICUs with burn care capability in Michigan and to the acuity of burn injuries, which often mandates immediate triage to hospitals with intensive burn care facilities. Conversely, while the majority of children with traumatic injuries were directly transferred from emergency to intensive care, over one‐fifth were transferred after initial care delivered on the ward or ICU settings prior to interhospital transfer for definitive intensive trauma care. Such imperfect regionalization of trauma care suggests further study of clinical outcomes and resource utilization among injured children is warranted. Likewise, cardiovascular disease was prominent among the inter‐ICU transfers, suggesting a clinical practice pattern of stabilization and resuscitation at the initial ICU prior to interhospital vertical or uptransfer for definitive cardiac care at the receiving hospitals.
It remains unknown whether the timing of interhospital transfer of critically ill children is a determinant of clinical outcomes. Prior studies among adults have reported higher mortality with prolonged duration of pre‐ICU care on the ward.4, 17 In the current study, ward and inter‐ICU transfers were initially hospitalized for a median of 1 and 3 days, respectively, prior to transfer. While we could not determine from administrative data what the precise triggers for interhospital transfer in this study were, it is instructive to note that ward transfers comprised more than one‐half of all children who received CPR on the date of transfer. For children who received CPR, severe clinical deterioration likely triggered transfer to hospitals with ICU facilities, but because only a minority of children received CPR overall, other triggers of transfer warrant investigation. For most of the children transferred, it seems plausible that the precipitant of transfer was likely a mismatch of their clinical status with the clinical capacities of the facilities where they were initially hospitalized. Future work should investigate if there is an association between clinical outcomes at the receiving hospitals, and both the timing of interhospital transfer and the clinical status of patients at transfer.
Importantly, compared with ED transfers, ward transfers demonstrated elevated odds of mortality after adjustment for coexisting comorbid illness, patient age, and pretransfer organ dysfunction at the referring hospital. Some possible explanations for this finding include the progression of disease while receiving care on the ward, or suboptimal access to ICU facilities due to barriers to transfer at either the referring or receiving hospitals. Importantly, progression of disease in ward settings may be detected by early identification of children at high risk of clinical deterioration on the wards of hospitals without ICU facilities, prior to cardiopulmonary arrest, because death after CPR may not be averted with subsequent ICU care.18
Various approaches to facilitate rapid and appropriate triage and reassessment of children in hospitals without ICU facilities, prior to severe clinical deterioration or need for CPR, must be investigated. These approaches might include in‐hospital measures such as the establishment of medical emergency teams to respond to clinical deterioration on the wards19 or collaborative interhospital measures such as the use of telemedicine20 or similar remote communication/triage systems to enhance communication between clinical caregivers at hospitals with ICU facilities and those in hospitals without ICU facilities. Furthermore, interhospital transfer agreements may facilitate expeditious and appropriate transfer of severely ill patients to hospitals with ICU facilities.
Access to hospitals with ICU facilities might also influence outcomes for critically ill children admitted initially to wards of hospitals without ICU facilities. Kanter2 reported significant variation in mortality among children who received care at New York hospitals without ICU facilities. Of note, 27% of statewide pediatric inpatient deaths occurred in those hospitals without ICU facilities. It appeared that, while some pediatric deaths in hospitals without ICU facilities were expected, regional variation in such mortality might have been associated with reduced access to, or poor utilization of, hospitals with ICU facilities. Barriers to interhospital transfers might include underrecognition of mismatch between patient illness severity and hospital capability at referring hospitals, or lack of capacity to accept transfers at the receiving hospitals. Further study is warranted to investigate clinical decision‐making underlying the initiation of the interhospital transfer processes, and procedural or institutional barriers that might hinder the transfer of critically ill children from hospitals without ICU facilities.
Resource consumption at the receiving hospitals, measured by hospital LOS and receipt of medical‐surgical procedures, was highest among the inter‐ICU transfers. This was an expected finding, given the high frequency of organ dysfunction among the inter‐ICU transfers, before and after interhospital transfer. These patients had the highest use of advanced and resource‐intensive technology, including continuous renal replacement therapy, extracorporeal membrane oxygenation, and cardiovascular procedures such as open‐heart surgery. In addition, the duration of hospitalization at the receiving hospital was 2 weeks longer among the inter‐ICU transfers when compared with the ED transfers. Such prolonged hospitalization has been previously associated with significantly increased resource consumption.4, 6 In the absence of physiologic data pertaining to illness severity, however, it is unknown whether this observed differential LOS by source of interhospital transfer might be attributable to both unobserved illness severity and/or extensive in‐hospital post‐ICU multidisciplinary rehabilitative care for inter‐ICU transfer patients, compared with ED transfer patients.
Our study findings need to be interpreted in light of certain limitations. Administrative claims data do not allow for assessment of the quality of hospital care, a factor that might play an important role in patient clinical outcomes. The data lacked any physiologic information that might enhance the ability to estimate patient severity of illness; the analysis used the presence of organ dysfunction at the referring hospitals as a proxy for illness severity. The use of diagnosis codebased measures of severity adjustment, as employed in the current study, however, has been reported to be comparable with clinical severity measures because of the relatively complete capture of diagnosis codes for life‐threatening conditions occurring late in the hospitalization, such as prior to interhospital transfer in the current study.2123
The absence of clinical information prevented assessment of the likelihood of in‐hospital morbidity, transport complications, and need for various therapeutic interventions after ICU care, which are also highly relevant outcomes of interhospital transfers. It is unknown if the small sample size among inter‐ICU transfers limited the ability to demonstrate a statistically significant difference in odds of mortality among inter‐ICU transfers compared with ED transfers.
Also, the identification of diagnoses and procedures was made using multiple coding instruments and is therefore susceptible to inaccuracies of detection and attribution that may have biased the findings. Study findings did not include cost, because cost data were not available for children enrolled in Medicaid managed care plans under capitated arrangements. Finally, it is unknown how generalizable the current study findings might be to children with private insurance, or to children who are uninsured.
The study findings highlight potential opportunities for future research. Further studies are warranted to identify key characteristics that differentiate children admitted to nonpediatric hospitals who are subsequently transferred to pediatric hospitals with ICU facilities versus the children who are not transferred. Also, in‐depth study of the decision‐making that underlies interhospital transfer of critically ill or injured children to hospitals with ICU facilities for advanced care after initial hospitalization is vital to improved understanding of factors that might contribute to the extensive resource consumption and mortality burden borne by these children. The existence and effectiveness of interhospital transfer agreements at the state level needs to be examined specifically as it relates to patterns and clinical outcomes of interhospital transfer of critically ill and injured children in the US.
In conclusion, in this multiyear, statewide sample among critically ill and injured children enrolled by a statewide public payer, clinical outcomes were worse and resource consumption higher, among children who underwent interhospital transfer after initial hospitalization compared with those transferred directly from referring EDs. The findings raise the possibility that more timely transfer of some patients directly from community hospital EDs to regional ICUs might improve survival and reduce resource consumption.
Efforts to improve the care of critically ill and injured children may be enhanced by improved understanding of the medical decision‐making underlying interhospital transfer; application of innovative methods to identify and ensure rapid access to clinical expertise for children initially admitted to hospitals without pediatric intensive care facilities who might subsequently require intensive care; and routine reassessment of hospitalized children to ensure effective and efficient triage and re‐triage at the ED, ward, and ICU levels of referring hospitals.
- ,,,,.A national survey of pediatric critical care resources in the United States.Pediatrics.2005;115:e382–386.
- .Regional variation in child mortality at hospitals lacking a pediatric intensive care unit.Crit Care Med.2002;30:94–99.
- ,,,,,.Direct transport to tertiary trauma centers versus transfer from lower level facilities: impact on mortality and morbidity among patients with major trauma.J Trauma.1997;43:288–296.
- ,,,.Timing of intensive care unit admission in relation to ICU outcome.Crit Care Med.1990;18:1231–1235.
- ,:Admission source to the medical intensive care unit predicts hospital death independent of APACHE II score.JAMA.1990;264:2389–2394.
- ,,,,.Accepting critically ill transfer patients: adverse effect on a referral center's outcome and benchmark measures.Ann Intern Med.2003;138:882–890.
- ,,,,,.Elective intrahospital admissions versus acute interhospital transfers to a surgical intensive care unit: cost and outcome prediction.J Trauma.1991;31:915–918.
- ,,,,.Adverse effect on a referral intensive care unit's performance of accepting patients transferred from another intensive care unit.Crit Care Med.2005;33:705–710.
- ,,,.Prognostic factors for mortality following interhospital transfers to the medical intensive care unit of a tertiary referral center.Crit Care Med.2003;31:1981–1986.
- National Government Services. Medicare UB‐04 Revenue Codes. Available at http://www.ngsmedicare.com/NGSMedicare/PartA/EducationandSupport/ToolsandMaterials/0908ub‐04.pdf. Accessed April 7,2008.
- American Hospital Association.AHA Guide to the Health Care Field.2002 ed.Chicago:American Hospital Association;2002.
- American Hospital Association.AHA Guide to the Health Care Field.2003 ed.Chicago:American Hospital Association;2003.
- ,,.Pediatric deaths attributable to complex chronic conditions: a population‐based study of Washington State, 1980–1997.Pediatrics.2000;106:205–209.
- ,,,.Importance of organ dysfunction in determining hospital outcomes in children.J Pediatr.2004;144:595–601.
- ,,, et al.Cumulative influence of organ dysfunctions and septic state on mortality of critically ill children.Am J Respir Crit Care Med.2005;171:348–353.
- ,,,,,.The epidemiology of severe sepsis in children in the United States.Am J Respir Crit Care Med.2003;167:695–701.
- ,,,.The longer patients are in hospital before intensive care admission the higher their mortality.Intensive Care Med.2004;30:1908–1913.
- ,.A prospective study of outcome of in‐patient pediatric cardiopulmonary arrest.Resuscitation.2006;71:310–318.
- ,,, et al.Effect of a rapid response team on hospital‐wide mortality and code rates outside the ICU in a children's hospital.JAMA.2007;298:2267–2274.
- ,,,,,.Use of telemedicine to provide pediatric critical care consultations to underserved rural northern California.J Pediatr.2004;144:375–380.
- ,.Risk‐adjusting acute myocardial infarction mortality: are APR‐DRGs the right tool?Health Serv Res.2000;34:1469–1489.
- ,,,,.Predicting in‐hospital deaths from coronary artery bypass graft surgery: do different severity measures give different predictions?Med Care.1998;36:28–39.
- ,,.Patient and hospital correlates of clinical outcomes and resource‐utilization in severe pediatric sepsis.Pediatrics.2007;119:487–494.
Interhospital transfer of critically ill and injured children is necessitated by variation in resource availability between hospitals. Critically ill children judged in need of clinical services or expertise not locally available undergo transfer to hospitals with more appropriate resource capabilities and expertise, with the expectation that clinical outcomes of transfer will be better than nontransfer.
Significant variation both in the availability of pediatric critical care services across US hospitals1 and in child mortality among hospitals without pediatric critical care services2 suggests that interhospital transfer will remain an integral part of healthcare delivery for critically ill and injured children. Timely provision of definitive care for acute life‐threatening disease is associated with good clinical outcomes.3, 4 While prior studies have examined clinical outcomes and resource consumption among critically ill adults who underwent interhospital transfer for intensive care,59 there is scarce information regarding clinical characteristics and outcomes of interhospital transfer for critically ill and injured children.
This study was conducted to test the hypothesis that, among critically ill and injured children who undergo interhospital transfer for intensive care, children transferred after an initial hospitalization at the referring facility will have higher mortality, longer length of stay (LOS), and higher resource consumption than children transferred directly from the emergency department (ED) of the referring hospitals.
METHODS
Study Design
We conducted a secondary analysis of administrative claims data from the Michigan Medicaid program for the period January 1, 2002, to December 31, 2004. The data included all paid claims for health services rendered to enrollees in the Medicaid program. The Institutional Review Board of the University of Michigan Medical School approved the study.
Study Sample and Variable Identification
A 3‐step approach was employed to identify interhospital transfer admissions for intensive care of children. Initially, the Medicaid claims were queried to identify all hospitalizations for children 018 years who received intensive care services, using Medicare revenue codes.10 Admissions for neonatal intensive care were excluded from the analysis. The American Hospital Association Guide to the Health Care Field, a compendium of US healthcare facilities, was used to verify the presence of intensive care facilities.11, 12 Subsequently, to identify the subset of children who underwent interhospital transfer, data were queried for the presence of claims from another hospital, and the date of discharge from the referring hospital had to be the same as the date of admission to the receiving hospital intensive care unit (ICU). Finally, to ascertain the source of interhospital transfer, Medicare revenue codes and current procedural terminology (CPT) codes were used to identify claims for receipt of services at specific sites within the referring hospital; namely, the ED, ward, or the ICU. This information was used to categorize admissions into 1 of 3 pathways of interhospital transfer:
ED transferFrom the ED of the referring hospital to the ICU of the receiving hospital.
Ward transferFrom the wards of the referring hospital to the ICU of the receiving hospital.
Inter‐ICU transferFrom the ICU of the referring hospital to the ICU of the receiving hospital.
Dependent Variables
Mortality at the Receiving Hospital
This is determined by linkage to vital statistics records maintained by the Michigan Department of Community Health, Division of Vital Records and Health Statistics.
LOS at the Receiving Hospital
This is determined as the count of days of hospitalization at the receiving hospital. Of note, this includes ICU days and non‐ICU days at the receiving hospital.
Independent Variables
Source of Interhospital Transfer
The main (exposure) independent variable. Categorized into ED, ward, or inter‐ICU transfers, as described.
Patient Demographics
Age and gender.
Comorbid Illness
Determined using International Classification of Diseases, ninth revision (ICD‐9) diagnosis codes, applying methodology as described.13
Organ Dysfunction at the Referring and Receiving Hospitals
Determined using ICD‐9 diagnosis codes, applying methodology as described.14
Patient Diagnostic Categories
Eleven diagnostic categories were created based on primary admission diagnoses (Appendix A).
LOS at the Referring Hospital
Determined as the count of days of hospitalization at the referring hospital.
Receipt of Cardiopulmonary Resuscitation (CPR) on the Date of Interhospital Transfer
Determined using procedure codes.
Receipt of Medical‐Surgical Procedures at the Receiving Hospital
Identified through the use of ICD‐9 procedure codes, CPT codes, and Healthcare Common Procedure Coding System codes. The procedures are listed in Appendix B.
Statistical Analysis
Descriptive statistics were used to characterize the study sample. According to the 3 sources of interhospital transfer, patient characteristics (age, gender, presence of organ dysfunction, and comorbid illness), median LOS at the referring hospital, and receipt of CPR on the date of interhospital transfer were compared using chi‐square tests for categorical variables, and Kruskal‐Wallis tests for continuous variables. Similarly, outcome variables of in‐hospital mortality and median LOS at the receiving hospital were compared across the 3 sources of interhospital transfer. Analysis of variance was used to compare mean LOS at the receiving hospital across the 3 sources of interhospital transfer. Median (with interquartile range [IQR]) and mean (with standard deviation [SD]) values are presented to describe LOS, given skew in LOS data.
To account for potential confounding of LOS and mortality at the receiving hospital by the presence of organ dysfunction and comorbid illness1316 at the referring hospital, multivariate logistic regression and multiple linear regression analyses were conducted to estimate the odds of in‐hospital mortality and the incremental LOS, respectively, for ward and inter‐ICU transfers, compared with ED transfers. Statistical analyses were conducted using Stata 8 for windows (Stata Corporation, College Station, TX). A 2‐tailed level of 0.05 was used as the threshold for statistical significance.
RESULTS
Patient Characteristics
Of 1,643 transfer admissions for intensive care during the study period, 1022 (62%) were ED transfers, 512 (31%) were ward transfers, and 109 (7%) were inter‐ICU transfers. The average age was 2 years, with male gender (57%) predominance. Comorbid illness was present in 19% of admissions, while 11% had evidence of organ dysfunction at the referring hospital. Table 1 presents key patient demographic and clinical characteristics at the referring hospitals, by transfer source. Inter‐ICU and ward transfers were younger than ED transfers, and had a higher preponderance of comorbid illness and organ dysfunction. At the time of interhospital transfer, compared with ED transfers, the proportion of admissions with organ dysfunction (a marker of illness severity) was 3‐fold and 8‐fold higher among ward and inter‐ICU transfers, respectively.
| Transfer Source | P | |||
|---|---|---|---|---|
| Characteristics | ED (n = 1022) | Ward (n = 512) | Inter‐ICU (n = 109) | |
| ||||
| Median age in years (IQR) | 2 (09) | 1 (07) | 1 (010) | <0.01 |
| Male (%) | 57.8 | 56.2 | 47.6 | 0.13 |
| Comorbid illness (% ) | 13.1 | 25.0 | 50.5 | <0.01 |
| Pretransfer hospital length of stay (days) | ||||
| Median (IQR) | 0 | 1 (02) | 3 (18) | <0.01 |
| Mean (SD) | 0.2 (5.2) | 1.6 (4.8) | 9.7 (18.0) | <0.01 |
| Pretransfer organ dysfunction (%) | 5.5 | 14.5 | 40.4 | <0.01 |
Patterns of Transfer
The leading diagnoses among all children were respiratory disease, trauma, and neurological disease (Table 2), with some variation in diagnoses by source of interhospital transfer. For example, cardiovascular disease was the second leading diagnosis after respiratory disease among the inter‐ICU transfers, while more children with endocrine disease (predominantly diabetic ketoacidosis), traumatic injury, or drug poisoning were transferred directly from the ED, than from the ward or the ICU settings. For burn care, 80% (45/56) of all transfer admissions were direct from the ED (Table 3). The majority (78%) of children with traumatic injuries were directly transferred from the ED to the ICU, while the remainder were transferred after initial care delivered on the ward (18%) or ICU (4%) settings prior to interhospital transfer for definitive intensive trauma care. Importantly, among the inter‐ICU transfers, 104 (95%) were transferred to pediatric ICUs from referring hospitals with adult and pediatric ICU facilities, suggesting uptransfer for specialized care. Five children were transferred between hospitals with adult ICU facilities.
| Transfer Source | ||||
|---|---|---|---|---|
| Diagnostic Category (%) | Overall* (n = 1639) | ED* (n = 1018) | Ward (n = 512) | Inter‐ICU (n = 109) |
| ||||
| Respiratory disease | 35.1 | 32.8 | 41.0 | 28.4 |
| Trauma | 16.2 | 20.5 | 9.2 | 9.1 |
| Neurological disease | 12.4 | 12.5 | 12.3 | 11.9 |
| Gastrointestinal disease | 6.7 | 5.4 | 7.4 | 11.9 |
| Infectious disease | 5.8 | 4.0 | 8.4 | 10.0 |
| Endocrine disease | 5.5 | 7.9 | 1.8 | 0 |
| Drug overdose/poisoning | 5.0 | 6.4 | 2.9 | 1.8 |
| Cardiovascular disease | 4.8 | 2.8 | 6.3 | 16.5 |
| Hematologic/oncologic disease | 2.0 | 1.6 | 2.9 | 1.8 |
| Cardiac arrest | 0.2 | 0 | 0.6 | 0.9 |
| Other diagnoses | 6.2 | 5.4 | 7.2 | 7.7 |
| Transfer Source | |||||
|---|---|---|---|---|---|
| Characteristics (%) | Overall (n = 1643) | ED (n = 1022) | Ward (n = 512) | Inter‐ICU (n = 109) | P |
| Respiratory | 26.8 | 19.0 | 36.7 | 54.1 | <0.01 |
| Radiological | 21.2 | 19.5 | 20.5 | 41.3 | <0.01 |
| Vascular access | 20.0 | 15.2 | 27.0 | 33.0 | <0.01 |
| Gastrointestinal | 3.9 | 3.0 | 3.7 | 12.8 | <0.01 |
| Neurological | 3.8 | 3.2 | 3.7 | 10.1 | <0.01 |
| Cardiovascular | 3.6 | 1.8 | 4.1 | 18.4 | <0.01 |
| Burn care | 3.4 | 4.5 | 2.0 | 0 | <0.01 |
| General surgery | 3.2 | 2.1 | 4.3 | 8.3 | <0.01 |
| Dialysis | 2.6 | 2.0 | 2.5 | 8.3 | <0.01 |
| ECMO | 2.1 | 1.3 | 2.2 | 9.2 | <0.01 |
CPR was performed on the date of interhospital transfer for 23 patients (1.4% of the sample), of whom 13 (56.5%) were ward transfers, 8 (34.8%) were inter‐ICU transfers, and 2 (8.7%) were ED transfers (P < 0.02). Two‐thirds of these children did not survive subsequent hospitalization at the receiving hospitals.
Clinical Outcomes and Resource Utilization at the Receiving Hospitals
At the receiving hospitals, other than burn care, medical‐surgical procedures were performed most often among the inter‐ICU transfers. Ward transfers also had higher receipt of procedures compared with ED transfers (Table 3). The inter‐ICU and ward transfers had a higher preponderance of organ dysfunction at the receiving hospitals, compared to the ED transfers (38.5% and 29.3% versus 20.8%, P < 0.01).
Clinical outcomes at the receiving hospitals varied significantly according to the source of interhospital transfer (Table 4). Sixty‐six (4%) of patients died at the receiving hospitals. In comparison with ED transfers, unadjusted in‐hospital mortality was 2‐fold and 3‐fold higher among the ward and inter‐ICU transfers, respectively. Also, hospital LOS was significantly longer among the ward and inter‐ICU transfers than for the ED transfers.
| Transfer Source | ||||
|---|---|---|---|---|
| Characteristics | ED (n = 1022) | Ward (n = 512) | Inter‐ICU (n = 109) | P |
| ||||
| Mortality (%) | 2.8 | 5.5 | 8.3 | <0.01 |
| Length of stay (days) | ||||
| Median (IQR) | 3 (27) | 5 (312) | 13 (724) | <0.01 |
| Mean (SD) | 6.7 (10.4) | 8.5 (9.2) | 21.4 (22.9) | <0.01 |
In multivariate analyses adjusting for patient age, and the presence of comorbid illness and organ dysfunction at the referring hospital, compared with ED transfers, odds of mortality were significantly higher (odds ratio [OR], 1.76; 95% confidence interval [CI], 1.023.03) for ward transfers. Inter‐ICU transfers also had higher odds of mortality (OR, 2.07; 95% CI, 0.884.86), without achieving statistical significance. Similarly, compared with ED transfers, LOS at the receiving hospital was longer by 1.5 days (95% CI, 0.32.7 days) for ward transfers, and by 13.5 days (95% CI, 11.115.8 days) for inter‐ICU transfers.
DISCUSSION
This study is the first to highlight significant variation in clinical outcomes and resource consumption after interhospital transfer of critically ill and injured children, depending on the source of transfer. In comparison with children transferred directly from the referring hospitals' ED settings, children transferred from the referring hospitals' wards had higher mortality, while those who underwent inter‐ICU transfer had significantly higher resource consumption. In addition, ward transfers had the highest proportion of children who underwent CPR on the date of interhospital transfer, highlighting elevated severity of disease prior to transfer and an urgent need for improved understanding of pretransfer clinical care and medical decision‐making. The findings raise the possibility that more timely transfer of some patients directly from community hospital EDs to regional ICUs might improve survival and reduce resource consumption.
Although interhospital transfers are common in everyday clinical practice, there has been a knowledge gap in pediatric acute and critical care medicine regarding the clinical outcomes and resource consumption among children who undergo such transfers. Findings from the current study narrow this gap by relating triage at the referring hospitals to clinical outcomes and resource utilization at the receiving hospitals.
Certain distinct transfer patterns were observed. Most children with burn injury underwent direct transfer from the ED to the ICU; this transfer pattern may be related both to the limited availability of ICUs with burn care capability in Michigan and to the acuity of burn injuries, which often mandates immediate triage to hospitals with intensive burn care facilities. Conversely, while the majority of children with traumatic injuries were directly transferred from emergency to intensive care, over one‐fifth were transferred after initial care delivered on the ward or ICU settings prior to interhospital transfer for definitive intensive trauma care. Such imperfect regionalization of trauma care suggests further study of clinical outcomes and resource utilization among injured children is warranted. Likewise, cardiovascular disease was prominent among the inter‐ICU transfers, suggesting a clinical practice pattern of stabilization and resuscitation at the initial ICU prior to interhospital vertical or uptransfer for definitive cardiac care at the receiving hospitals.
It remains unknown whether the timing of interhospital transfer of critically ill children is a determinant of clinical outcomes. Prior studies among adults have reported higher mortality with prolonged duration of pre‐ICU care on the ward.4, 17 In the current study, ward and inter‐ICU transfers were initially hospitalized for a median of 1 and 3 days, respectively, prior to transfer. While we could not determine from administrative data what the precise triggers for interhospital transfer in this study were, it is instructive to note that ward transfers comprised more than one‐half of all children who received CPR on the date of transfer. For children who received CPR, severe clinical deterioration likely triggered transfer to hospitals with ICU facilities, but because only a minority of children received CPR overall, other triggers of transfer warrant investigation. For most of the children transferred, it seems plausible that the precipitant of transfer was likely a mismatch of their clinical status with the clinical capacities of the facilities where they were initially hospitalized. Future work should investigate if there is an association between clinical outcomes at the receiving hospitals, and both the timing of interhospital transfer and the clinical status of patients at transfer.
Importantly, compared with ED transfers, ward transfers demonstrated elevated odds of mortality after adjustment for coexisting comorbid illness, patient age, and pretransfer organ dysfunction at the referring hospital. Some possible explanations for this finding include the progression of disease while receiving care on the ward, or suboptimal access to ICU facilities due to barriers to transfer at either the referring or receiving hospitals. Importantly, progression of disease in ward settings may be detected by early identification of children at high risk of clinical deterioration on the wards of hospitals without ICU facilities, prior to cardiopulmonary arrest, because death after CPR may not be averted with subsequent ICU care.18
Various approaches to facilitate rapid and appropriate triage and reassessment of children in hospitals without ICU facilities, prior to severe clinical deterioration or need for CPR, must be investigated. These approaches might include in‐hospital measures such as the establishment of medical emergency teams to respond to clinical deterioration on the wards19 or collaborative interhospital measures such as the use of telemedicine20 or similar remote communication/triage systems to enhance communication between clinical caregivers at hospitals with ICU facilities and those in hospitals without ICU facilities. Furthermore, interhospital transfer agreements may facilitate expeditious and appropriate transfer of severely ill patients to hospitals with ICU facilities.
Access to hospitals with ICU facilities might also influence outcomes for critically ill children admitted initially to wards of hospitals without ICU facilities. Kanter2 reported significant variation in mortality among children who received care at New York hospitals without ICU facilities. Of note, 27% of statewide pediatric inpatient deaths occurred in those hospitals without ICU facilities. It appeared that, while some pediatric deaths in hospitals without ICU facilities were expected, regional variation in such mortality might have been associated with reduced access to, or poor utilization of, hospitals with ICU facilities. Barriers to interhospital transfers might include underrecognition of mismatch between patient illness severity and hospital capability at referring hospitals, or lack of capacity to accept transfers at the receiving hospitals. Further study is warranted to investigate clinical decision‐making underlying the initiation of the interhospital transfer processes, and procedural or institutional barriers that might hinder the transfer of critically ill children from hospitals without ICU facilities.
Resource consumption at the receiving hospitals, measured by hospital LOS and receipt of medical‐surgical procedures, was highest among the inter‐ICU transfers. This was an expected finding, given the high frequency of organ dysfunction among the inter‐ICU transfers, before and after interhospital transfer. These patients had the highest use of advanced and resource‐intensive technology, including continuous renal replacement therapy, extracorporeal membrane oxygenation, and cardiovascular procedures such as open‐heart surgery. In addition, the duration of hospitalization at the receiving hospital was 2 weeks longer among the inter‐ICU transfers when compared with the ED transfers. Such prolonged hospitalization has been previously associated with significantly increased resource consumption.4, 6 In the absence of physiologic data pertaining to illness severity, however, it is unknown whether this observed differential LOS by source of interhospital transfer might be attributable to both unobserved illness severity and/or extensive in‐hospital post‐ICU multidisciplinary rehabilitative care for inter‐ICU transfer patients, compared with ED transfer patients.
Our study findings need to be interpreted in light of certain limitations. Administrative claims data do not allow for assessment of the quality of hospital care, a factor that might play an important role in patient clinical outcomes. The data lacked any physiologic information that might enhance the ability to estimate patient severity of illness; the analysis used the presence of organ dysfunction at the referring hospitals as a proxy for illness severity. The use of diagnosis codebased measures of severity adjustment, as employed in the current study, however, has been reported to be comparable with clinical severity measures because of the relatively complete capture of diagnosis codes for life‐threatening conditions occurring late in the hospitalization, such as prior to interhospital transfer in the current study.2123
The absence of clinical information prevented assessment of the likelihood of in‐hospital morbidity, transport complications, and need for various therapeutic interventions after ICU care, which are also highly relevant outcomes of interhospital transfers. It is unknown if the small sample size among inter‐ICU transfers limited the ability to demonstrate a statistically significant difference in odds of mortality among inter‐ICU transfers compared with ED transfers.
Also, the identification of diagnoses and procedures was made using multiple coding instruments and is therefore susceptible to inaccuracies of detection and attribution that may have biased the findings. Study findings did not include cost, because cost data were not available for children enrolled in Medicaid managed care plans under capitated arrangements. Finally, it is unknown how generalizable the current study findings might be to children with private insurance, or to children who are uninsured.
The study findings highlight potential opportunities for future research. Further studies are warranted to identify key characteristics that differentiate children admitted to nonpediatric hospitals who are subsequently transferred to pediatric hospitals with ICU facilities versus the children who are not transferred. Also, in‐depth study of the decision‐making that underlies interhospital transfer of critically ill or injured children to hospitals with ICU facilities for advanced care after initial hospitalization is vital to improved understanding of factors that might contribute to the extensive resource consumption and mortality burden borne by these children. The existence and effectiveness of interhospital transfer agreements at the state level needs to be examined specifically as it relates to patterns and clinical outcomes of interhospital transfer of critically ill and injured children in the US.
In conclusion, in this multiyear, statewide sample among critically ill and injured children enrolled by a statewide public payer, clinical outcomes were worse and resource consumption higher, among children who underwent interhospital transfer after initial hospitalization compared with those transferred directly from referring EDs. The findings raise the possibility that more timely transfer of some patients directly from community hospital EDs to regional ICUs might improve survival and reduce resource consumption.
Efforts to improve the care of critically ill and injured children may be enhanced by improved understanding of the medical decision‐making underlying interhospital transfer; application of innovative methods to identify and ensure rapid access to clinical expertise for children initially admitted to hospitals without pediatric intensive care facilities who might subsequently require intensive care; and routine reassessment of hospitalized children to ensure effective and efficient triage and re‐triage at the ED, ward, and ICU levels of referring hospitals.
- ,,,,.A national survey of pediatric critical care resources in the United States.Pediatrics.2005;115:e382–386.
- .Regional variation in child mortality at hospitals lacking a pediatric intensive care unit.Crit Care Med.2002;30:94–99.
- ,,,,,.Direct transport to tertiary trauma centers versus transfer from lower level facilities: impact on mortality and morbidity among patients with major trauma.J Trauma.1997;43:288–296.
- ,,,.Timing of intensive care unit admission in relation to ICU outcome.Crit Care Med.1990;18:1231–1235.
- ,:Admission source to the medical intensive care unit predicts hospital death independent of APACHE II score.JAMA.1990;264:2389–2394.
- ,,,,.Accepting critically ill transfer patients: adverse effect on a referral center's outcome and benchmark measures.Ann Intern Med.2003;138:882–890.
- ,,,,,.Elective intrahospital admissions versus acute interhospital transfers to a surgical intensive care unit: cost and outcome prediction.J Trauma.1991;31:915–918.
- ,,,,.Adverse effect on a referral intensive care unit's performance of accepting patients transferred from another intensive care unit.Crit Care Med.2005;33:705–710.
- ,,,.Prognostic factors for mortality following interhospital transfers to the medical intensive care unit of a tertiary referral center.Crit Care Med.2003;31:1981–1986.
- National Government Services. Medicare UB‐04 Revenue Codes. Available at http://www.ngsmedicare.com/NGSMedicare/PartA/EducationandSupport/ToolsandMaterials/0908ub‐04.pdf. Accessed April 7,2008.
- American Hospital Association.AHA Guide to the Health Care Field.2002 ed.Chicago:American Hospital Association;2002.
- American Hospital Association.AHA Guide to the Health Care Field.2003 ed.Chicago:American Hospital Association;2003.
- ,,.Pediatric deaths attributable to complex chronic conditions: a population‐based study of Washington State, 1980–1997.Pediatrics.2000;106:205–209.
- ,,,.Importance of organ dysfunction in determining hospital outcomes in children.J Pediatr.2004;144:595–601.
- ,,, et al.Cumulative influence of organ dysfunctions and septic state on mortality of critically ill children.Am J Respir Crit Care Med.2005;171:348–353.
- ,,,,,.The epidemiology of severe sepsis in children in the United States.Am J Respir Crit Care Med.2003;167:695–701.
- ,,,.The longer patients are in hospital before intensive care admission the higher their mortality.Intensive Care Med.2004;30:1908–1913.
- ,.A prospective study of outcome of in‐patient pediatric cardiopulmonary arrest.Resuscitation.2006;71:310–318.
- ,,, et al.Effect of a rapid response team on hospital‐wide mortality and code rates outside the ICU in a children's hospital.JAMA.2007;298:2267–2274.
- ,,,,,.Use of telemedicine to provide pediatric critical care consultations to underserved rural northern California.J Pediatr.2004;144:375–380.
- ,.Risk‐adjusting acute myocardial infarction mortality: are APR‐DRGs the right tool?Health Serv Res.2000;34:1469–1489.
- ,,,,.Predicting in‐hospital deaths from coronary artery bypass graft surgery: do different severity measures give different predictions?Med Care.1998;36:28–39.
- ,,.Patient and hospital correlates of clinical outcomes and resource‐utilization in severe pediatric sepsis.Pediatrics.2007;119:487–494.
Copyright © 2009 Society of Hospital Medicine
Hospital Charges for Childhood Obesity
With increases in the prevalence of obesity among children and adults over the past 3 decades in the United States,13 healthcare expenditures attributed to obesity have climbed steadily, to over $100 billion in excess expenditures annually.4 Several studies have examined healthcare costs associated with obesity in adults,48 but these studies have not attempted to distinguish between excess expenditures in inpatient versus outpatient settings. In contrast, the only 2 national economic analyses of childhood obesity have focused exclusively on the inpatient setting, because the health and economic consequences of obesity among children may be most apparent in cases in which obesity is causally linked to other diagnoses (eg, type 2 diabetes mellitus, gall bladder disease) or is a comorbidity that complicates hospitalizations.9, 10
In our previous study of obesity as a comorbidity for hospitalized children, we examined the incremental charges and length‐of‐stay (LOS) for hospitalizations for the most common nonpregnancy/nonchildbirth pediatric diagnoses, comparing those coded with obesity as a secondary diagnosis versus those without.10 Using data from the Agency for Healthcare Research and Quality (AHRQ) Kid's Inpatient Database (KID) for the year 2000, we found that obesity was associated with higher charges and longer LOS for all 4 of the conditions studied (asthma, pneumonia, affective disorders, and appendicitis). Our findings regarding asthma and affective disorders echoed earlier analyses of hospitalizations for conditions clinically linked to obesity.9 However, our study was the first to demonstrate that childhood obesity is a clinically and economically significant complicating factor for conditions not thought to be linked to obesity (pneumonia, appendicitis).
For this current study, our objective was to use more recent child hospitalization data from 2003 to determine whether our prior findings of incremental charges and LOS associated with hospitalizations where obesity was coded as a secondary diagnosis compared to those where it was not, were stable over time, and whether the magnitude of differences was consistent over a period of 4 years. We hypothesized that incremental differences in hospital charges and LOS between discharges with and without obesity would be seen in the 2003 data and that the magnitude of these differences in 2003 would be similar to those in 2000. Because obesity prevalence among children increased from 2000 to 2003,11 we also hypothesized that there would be a corresponding increase in the proportion of hospitalizations with obesity as a comorbidity.
METHODS
Data Source and Sample
We analyzed data from the AHRQ KID. The KID is a nationally representative sample of annual pediatric hospital discharges. Analysis using the KID allows for improved estimates due to the discharges from community, nonrehabilitation hospitals.12 It provides data found in standard hospital discharge abstracts for more than 2 million pediatric discharges, including International Classification of Diseases, Ninth Revision, Clinical Modification (ICD‐9‐CM) codes, LOS, total hospital charges, and patient demographic information.12 Our original analysis (published in Obesity, July 2007)10 utilized data from the 2000 KID. For this analysis we utilized data from the 2003 KID (the most recent version available), and for comparison we converted the results from the 2000 study into 2003 dollars using the Consumer Price Index for Medical Care.
Using ICD‐9‐CM codes, the KID provides the principal diagnosis for each discharge, along with up to 14 secondary diagnoses. It also provides Clinical Classification Software (CCS) codes, a diagnostic categorization scheme that permits grouping of related conditions. ICD‐9‐CM codes are collapsed into a smaller number of categories that are sometimes more useful for presenting descriptive statistics than are individual ICD‐9‐CM codes or the much broader categories of Diagnosis Related Groups (DRGs). For example, all ICD‐9‐CM codes for specific types of pneumonia would be grouped together under 1 CCS code but would exclude other respiratory conditions such as pneumothorax which would generally be included in the respiratory condition DRG.12
The 2000 KID contained 2,516,833 unweighted discharges, representing 7,291,038 discharges in the population. In the 2003 KID, there were 2,984,129 unweighted discharges representing 7,409,162 discharges in the population. Our sample included all discharges for nonpregnancy‐related conditions, in children 2 years of age (due to the Centers for Disease Control definition for overweight based on body mass index [BMI] that starts at age 2 years)13, 14 to 18 years of age (2000 weighted n = 1,527,309; 2003 weighted n = 1,613,258); these numbers exclude discharges with obesity as a primary diagnosis.
Key Variables
Our outcome variables were LOS and total charges for each of the common nonpregnancy‐related principal discharge diagnoses studied. For the 2000 and 2003 KID, total charges included all hospital fees with the exception of professional fees.15
The main independent variable of interest was presence of obesity as a secondary diagnosis. Discharges were classified as either with or without obesity based on the presence of the ICD‐9‐CM code 278.0x as a secondary diagnosis (1 if yes, 0 if no). This code captures obesity unspecified (278.00), overweight (278.01), and morbid obesity (278.02). Of note, the distribution of these codes did not vary significantly between the 2 study years.
Other independent variables included sex, age (2‐5 years, 6‐10 years, 11‐14 years, and 15‐18 years), race/ethnicity (white, black, Hispanic, and other), region (Northeast, Midwest, South, and West), hospital type (based on classification by the National Association of Children's Hospitals and Related Institutions [NACHRI] as general hospital, children's unit in a general hospital, and children's hospital) and expected primary payer (Medicaid, private, and other). We chose independent variables due to their established association with our outcomes and for their patterns of association with childhood obesity.
We did not include LOS as a covariate in models of charges because obesity may have been associated with the outcome indirectly through LOS as well as directly as a main effect. To fully interpret the combination of these effects would require analyses beyond the scope of this work.
Analyses
Using CCS codes, we identified the 4 most common principal nonpregnancy‐related discharge diagnoses for children 2‐18 years old. For both 2000 and 2003 these were asthma (CCS 128), pneumonia (CCS 122), affective disorders (eg, depression and bipolar disorder) (CCS 69), and appendicitis (CCS 142). Importantly, this group of diagnoses included conditions clinically associated with obesity (asthma and affective disorders)16 and conditions not associated with obesity (pneumonia and appendicitis). Given this distinction we analyzed the 4 conditions separately.
For all discharges with these common principal diagnoses, we calculated mean LOS and mean total charges. Bivariate and multivariable analyses were conducted using simple and multiple linear regression, respectively. These analyses were designed to test the study hypothesis that obesity as a secondary diagnosis is associated with incremental economic charges and LOS. All analyses were performed on log‐transformed LOS and charge data. We included in our models those characteristics that we hypothesized were potentially related to hospital charges and LOS, based on published literature,4, 17, 18 and for that reason all covariates were retained in the final models regardless of bivariate findings. Differences in the incremental LOS and charges for 2003 versus 2000 were compared using t‐tests.
For each independent variable with missing data, we included in the analyses a category for unreported values. The KID is known to have a large number of missing data for race/ethnicity; therefore, in keeping with other studies utilizing the KID,10, 19 we also conducted multivariate analyses excluding those discharges with unreported race as a sensitivity analysis. Of note, analyses of these data excluding children of unreported race were not substantively different than those in which the unreported group was included. We present our findings including the unreported race category.
Predicted values on the log scale, for those with obesity and without obesity as a secondary diagnosis adjusted for the listed covariates, were obtained. We then back‐transformed these to their original scales and units using methods developed by Duan.20 For each principal diagnosis category, we analyzed the differences in predicted mean LOS and predicted mean total charges between discharges with and without obesity as a secondary diagnosis, adjusted for the listed covariates, using the P values obtained from the regression analyses. All results are presented in 2003 dollars.
In keeping with our earlier analysis we considered the potential influence of comorbidities other than obesity on LOS and charges. Therefore, we examined whether other comorbidities were coded more frequently among those discharges with obesity as a secondary diagnosis than those discharges without obesity. As seen in the 2000 KID, the 2003 data revealed that diabetes was more commonly seen with obesity‐related hospitalizations than with those hospitalizations without obesity. However, the proportion of discharges with obesity and diabetes was low for all of the principal diagnostic categories studied (asthma 4.8%, pneumonia 6.0%, affective disorders 4.2%, and appendicitis 1.9%). Thus, we judged the co‐occurrence of diabetes and obesity as secondary diagnoses too infrequent to be an explanatory factor for the overall incremental differences in LOS and charges.
All analyses were weighted to account for the complex probability sampling of the dataset and permit inferences regarding national hospital discharge patterns. The same sample of discharges was used to analyze LOS and charges, with the discharge weighting variable (DISCWT) used for all analyses. All results are presented as weighted data unless otherwise noted. Analyses were conducted using STATA 8.0 (Stata Corporation, College Station, TX) and SUDAAN version 9 (Research Triangle Institute, Research Triangle Park, NC).
This study was approved by the Institutional Review Board of the University of Michigan Medical School.
RESULTS
Sample Characteristics
The characteristics of the study population are presented in Table 1. In 2003, the overall proportion of nonpregnancy‐related discharges for children 2‐18 years old coded with obesity as a secondary diagnosis was 1.6%, an increase from 1.1% in 2000. Within the 4 most common nonpregnancy‐related CCS category diagnoses (asthma, pneumonia, affective disorders, and appendicitis) the proportion of discharges with obesity coded as a secondary diagnosis increased from 2000 to 2003 (Figure 1)

| Variables | Discharges | |||
|---|---|---|---|---|
| With Obesity as Secondary Diagnosis | Without Obesity | |||
| 2000 | 2003 | 2000 | 2003 | |
| Unweighted, n | 8,696 | 15,546 | 762,407 | 943,182 |
| Weighted population size | 17,672 | 25,709 | 1,509,637 | 1,587,549 |
| Age | ||||
| 2‐5 years (%) | 4.8 | 4.8 | 27.4 | 29.0 |
| 6‐10 years (%) | 14.7 | 15.9 | 22.4 | 22.3 |
| 11‐14 years (%) | 34.4 | 34.1 | 20.9 | 20.9 |
| 15‐18 years (%) | 46.1 | 45.2 | 29.3 | 27.8 |
| Sex | ||||
| Male (%) | 45.5 | 46.8 | 53.8 | 53.4 |
| Race/Ethnicity | ||||
| White (%) | 46.8 | 32.2 | 50.9 | 39.3 |
| Black (%) | 20.7 | 20.4 | 14.3 | 12.6 |
| Hispanic (%) | 14.9 | 16.8 | 14.3 | 14.4 |
| Other (%) | 4.8 | 5.0 | 5.6 | 5.6 |
| Unreported (%) | 12.8 | 25.6 | 14.9 | 28.1 |
| Payer | ||||
| Medicaid (%) | 42.6 | 46.5 | 32.1 | 36.9 |
| Private (%) | 47.1 | 42.6 | 58.0 | 53.3 |
| Other (%) | 9.4 | 10.6 | 9.4 | 9.6 |
| Unreported (%) | 0.9 | 0.3 | 0.5 | 0.2 |
| Hospital Region | ||||
| Northeast (%) | 17.3 | 15.9 | 21.7 | 18.7 |
| Midwest (%) | 24.6 | 24.8 | 20.0 | 23.3 |
| South (%) | 37.6 | 38.4 | 36.3 | 37.0 |
| West (%) | 20.5 | 20.9 | 22.0 | 21.0 |
| Hospital type | ||||
| General hospital (%) | 68.2 | 61.4 | 61.0 | 57.1 |
| Children's unit in general hospital (%) | 15.2 | 17.8 | 18.6 | 19.2 |
| Children's hospitals (%) | 14.3 | 14.9 | 17.9 | 17.6 |
| Unreported (%) | 2.3% | 5.9 | 2.5 | 6.1 |
Incremental Differences in Mean Charges Associated with Obesity
In Table 2, we present results for analyses of mean charges. Following the pattern in 2000 for all 4 of these common conditions, in 2003 the adjusted mean total hospital charges were statistically significantly higher for discharges in which obesity was listed as a secondary diagnosis, compared with those in which it was not. Moreover, the magnitude of these differences was somewhat greater in 2003 than in 2000, although it did not achieve statistical significance (P > 0.05) (Figure 2). Specifically, the difference in charges among asthma discharges with and without obesity as a comorbidity was 9% greater in 2003 than in 2000, 17% greater among pneumonia discharges, 121% greater among affective disorders, and 3% greater among appendicitis discharges.
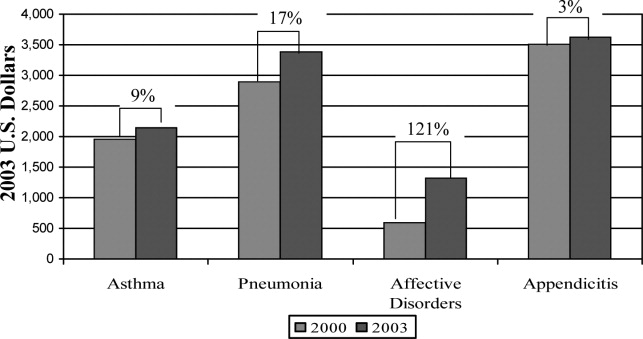
| Adjusted Mean Charges ($) | ||||||
|---|---|---|---|---|---|---|
| 2000 | 2003 | |||||
| With Obesity | Without Obesity | Difference | With Obesity | Without Obesity | Difference | |
| ||||||
| Asthma | 8,847 | 6,884 | 1,963* | 10,589 | 8,444 | 2,145 |
| Pneumonia | 13,930 | 11,036 | 2,894* | 16,609 | 13,219 | 3,390 |
| Affective disorders | 9,446 | 8,850 | 596 | 11,942 | 10,619 | 1,323 |
| Appendicitis | 16,101 | 12,587 | 3,514 | 19,213 | 15,586 | 3,627 |
Incremental Differences in Mean LOS Associated with Obesity
Compared with those discharges without obesity coded, obesity as a secondary diagnosis was associated with a statistically significantly longer mean LOS for all four diagnoses in 2003 (Table 3). In addition, for all diagnoses except asthma, the magnitude of the difference was somewhat greater in 2003 than in 2000, although it did not reach statistical significance (P > 0.05). The greatest increase was seen with appendicitis, with the incremental difference in LOS between those with obesity and those without going from 0.17 days in 2000 to 0.83 days in 2003; an increase of over 300%.
| Adjusted Mean LOS | ||||||
|---|---|---|---|---|---|---|
| 2000 | 2003 | |||||
| With Obesity | Without Obesity | Difference | With Obesity | Without Obesity | Difference | |
| ||||||
| Asthma | 3.04 | 2.45 | 0.59* | 2.88 | 2.44 | 0.44* |
| Pneumonia | 4.26 | 3.89 | 0.37 | 4.39 | 3.83 | 0.56 |
| Affective disorders | 7.72 | 7.11 | 0.61* | 8.23 | 7.42 | 0.81* |
| Appendicitis | 3.33 | 3.16 | 0.17 | 3.91 | 3.08 | 0.83* |
DISCUSSION
Prior studies have explored the resource utilization and expenditures associated with obesity in adult populations and among obese children in the outpatient setting.48, 21 Few, however, have examined charges related to inpatient care of obese children. Our studies are the first to utilize actual charge data from a nationally representative sample to explore the economic implications of obesity among children hospitalized for common pediatric illnesses.
Our findings from this national analysis support the hypothesis that, for the 4 conditions studied, statistically significantly higher mean total hospital charges and longer mean LOS for those discharges with obesity coded as a secondary diagnosis versus those without obesity coded occurred for both 2000 and 2003, even when controlling for sex, age, race/ethnicity, region, payer, and hospital type. Our analyses also suggested that the magnitude of the incremental differences in charges from 2000 to 2003 increased somewhat, and the magnitude of the incremental differences in LOS for all of these common conditions (except asthma) is also increasing.
While these findings serve to confirm higher incremental charges and LOS associated with obesity for hospitalized children, they raise the question of why charges and LOS for children with obesity might increase at a greater rate than for those without obesity. Higher hospital charges and LOS for children with obesity coded as a secondary diagnosis may be explained by greater resource utilization due to obesity that: 1) increases the technical complexity of procedures such as surgical interventions or intravenous catheter (IV) placement;22 2) leads to greater illness severity, as has been suggested in studies of adult patients;23, 24 or 3) leads to more complications such as secondary infections.22 One explanation for the possible widening of the gap in charges during the time period studied might be that discharges coded with obesity in 2003 reflect children who were more severely obese and had a greater severity of illness, leading to higher resource utilization than those with obesity in the 2000 dataset. However, the ICD‐9‐CM code for morbid obesity (278.02) was not used more often in 2003 than in 2000. Alternatively, we suspect that between 2000 and 2003, due to an increasing awareness of the problem of childhood obesity, physicians may have become more likely to order tests or consultations specifically related to the treatment or evaluation of obesity. Other than the increase in the proportion of discharges with obesity as a comorbidity from 2000 to 2003, we were unable to explore these possible explanations with the KID datasets.
In this sample of discharges, with only 1.1% and 1.6% coded with obesity as a secondary diagnosis in 2000 and 2003, respectively, it is important to note that these discharges should not be interpreted as the prevalence of obesity in hospitalized children. Indeed, in a recent study of children hospitalized for surgical procedures at a large Midwestern tertiary care hospital, 31.6% were found to be overweight or obese.25 However, we posit that the cases coded with obesity as a secondary diagnosis in this sample represent the cases in which obesity presents a recognized factor that complicated the clinical course. Further work should explore the mechanisms by which obesity impacts the care of children hospitalized for common conditions. For example, children with obesity may require more procedures and may experience more treatment complications. These specific interventions should be the target of clinically focused analyses.
Limitations
Analyses utilizing discharge data are potentially limited by the accuracy and consistency of coding. Whether the discharges coded with obesity reflect all cases in which obesity was a complicating factor is not known. Based on the national prevalence of childhood obesity it is likely than more than 1.6% of the children hospitalized in 2003 were obese. However, whether obesity impacted the hospital course sufficiently to be included among the secondary diagnoses (as stipulated by ICD‐9‐CM guidelines for official recording)26 in more than 1.6% of cases is unknown.
This study is also limited by the inability to address the processes that might account for the consistently higher charges and longer LOS seen for those discharges coded with obesity versus those without obesity coded. The KID provides some information regarding procedures performed but cannot be reliably used to examine this aspect of patient care.27 An additional limitation of the KID data set is that it contains information about deidentified discharges. This leads to the possibility of having individual patients in the dataset with multiple hospitalizations. In this study we examined the relationship between obesity as a secondary diagnosis and incremental charges and LOS for the 4 most common clinical categories for which children are hospitalized. Findings may differ for other conditions not evaluated here. Finally, information regarding costs can only be inferred from the charge data provided by the KID. However, the ratio of charges to costs would not be expected to vary by obesity status.
CONCLUSIONS
These results extend our earlier findings of higher charges and longer LOS for pediatric discharges coded with obesity versus those without. In addition, this analysis suggests a widening gap of incremental hospital charges and LOS associated with obesity as a comorbidity for common pediatric conditions. These findings present a heightening financial imperative for further research to evaluate factors associated with greater resource utilization among obese pediatric patients.
- ,,,.Prevalence and trends in overweight among US children and adolescents, 1999–2000.JAMA.2002;288(14):1728–1732.
- ,.Epidemic increase in childhood overweight, 1986–1998.JAMA.2001;286(22):2845–2848.
- ,.Overweight children and adolescents: description, epidemiology, and demographics.Pediatrics.1998;101(Pt 2):497–504.
- ,,.National medical spending attributable to overweight and obesity: how much, and who's paying?Health Aff (Millwood).2003; (Suppl Web Exclusives):W3‐219–26.
- ,,,.The impact of obesity on rising medical spending.Health Aff (Millwood).2004;(Suppl Web Exclusives):W4‐480–6.
- ,.Current estimates of the economic cost of obesity in the United States.Obes Res.1998;6(2):97–106.
- ,,,,.Lifetime health and economic benefits of weight loss among obese persons.Am J Public Health.1999;89(10):1536–1542.
- ,,.The health and cost consequences of obesity among the future elderly.Health Aff (Millwood).2005;24(Suppl 2):W5R30–W5R41.
- ,.Economic burden of obesity in youths aged 6 to 17 years: 1979–1999.Pediatrics.2002;109(5):E81–E81.
- ,,,.Incremental hospital charges associated with obesity as a secondary diagnosis.Obesity (Silver Spring).2007;15:1895–1901.
- ,,,,,.Prevalence of overweight and obesity in the United States, 1999–2004.JAMA.2006;295(13):1549–1555.
- Healthcare Cost and Utilization Project.2005. Overview of the Kid's Inpatient Database. Available at:http://www.hcup‐us.ahrq.gov/kidoverview.jsp. Accessed December 2008.
- CDC Body Mass Index: BMI for Children and Teens. Available at: http://www.cdc.gov/nccdphp/dnpa/bmi. Accessed December2008.
- ,,,,,.Prevalence of overweight among preschool children in the United States, 1971 through 1994.Pediatrics.1997;99(4):E1.
- Healthcare Cost and Utilization Project, 2002 and 2004. Description of data elements: inpatient core file. Available at: http://www.hcup‐us.ahrq.gov/db/nation/kid/DataElements_KID_Core_2000.pdf; http://www.hcup‐us.ahrq.gov/db/nation/kid/KID_2003_CORE_Volume1_A‐L.pdf;http://www.hcup‐us. ahrq.gov/db/nation/kid/KID_2003_CORE_Volume2_M‐Z.pdf. Accessed December2008.
- .Health consequences of obesity in youth: childhood predictors of adult disease.Pediatrics.1998;101:518–525.
- ,,.Lengths of stay and costs associated with children's hospitals.Pediatrics.2005;115(4):839–844.
- ,,, et al.Health care expenditures associated with overweight and obesity among US adults: importance of age and race.Am J Public Health.2005;95(1):159–165.
- ,,,.Effects of race, insurance status, and hospital volume on perforated appendicitis in children.Pediatrics.2005;115(4):920–925.
- .Smearing estimate: a nonparametric retransformation method.J Am Stat Assoc.1983;78:605–610.
- ,,,.Resource utilization and expenditures for overweight and obese children.Arch Pediatr Adolesc Med.2007 Jan;161(1):11–14.
- ,.Appendicitis in the obese child.J Pediatr Surg.2007;42(5):857–861.
- ,.Management of the obese critically ill patient.Crit Care Clin.2001;17:187–200.
- ,,,,.Total respiratory system, lung, and chest wall mechanics in sedated‐paralyzed postoperative morbidly obese patients.Chest.1996;109:144–151.
- ,,,,.Prevalence of overweight and obesity in a U.S. pediatric surgical population.J Natl Med Assoc.2007;99(1):46–48, 50–51.
- Centers for Disease Control and Prevention. ICD‐9‐CM. Official Guidelines for Coding and Reporting. Effective April 1, 2005. Available at: http://www.cdc.gov/nchs/data/icd9/icdguide.pdf. Accessed December2008.
- ,,,.Predictors of hospital charges for children admitted with asthma.Ambul Pediatr.2006;6(1):15–20.
With increases in the prevalence of obesity among children and adults over the past 3 decades in the United States,13 healthcare expenditures attributed to obesity have climbed steadily, to over $100 billion in excess expenditures annually.4 Several studies have examined healthcare costs associated with obesity in adults,48 but these studies have not attempted to distinguish between excess expenditures in inpatient versus outpatient settings. In contrast, the only 2 national economic analyses of childhood obesity have focused exclusively on the inpatient setting, because the health and economic consequences of obesity among children may be most apparent in cases in which obesity is causally linked to other diagnoses (eg, type 2 diabetes mellitus, gall bladder disease) or is a comorbidity that complicates hospitalizations.9, 10
In our previous study of obesity as a comorbidity for hospitalized children, we examined the incremental charges and length‐of‐stay (LOS) for hospitalizations for the most common nonpregnancy/nonchildbirth pediatric diagnoses, comparing those coded with obesity as a secondary diagnosis versus those without.10 Using data from the Agency for Healthcare Research and Quality (AHRQ) Kid's Inpatient Database (KID) for the year 2000, we found that obesity was associated with higher charges and longer LOS for all 4 of the conditions studied (asthma, pneumonia, affective disorders, and appendicitis). Our findings regarding asthma and affective disorders echoed earlier analyses of hospitalizations for conditions clinically linked to obesity.9 However, our study was the first to demonstrate that childhood obesity is a clinically and economically significant complicating factor for conditions not thought to be linked to obesity (pneumonia, appendicitis).
For this current study, our objective was to use more recent child hospitalization data from 2003 to determine whether our prior findings of incremental charges and LOS associated with hospitalizations where obesity was coded as a secondary diagnosis compared to those where it was not, were stable over time, and whether the magnitude of differences was consistent over a period of 4 years. We hypothesized that incremental differences in hospital charges and LOS between discharges with and without obesity would be seen in the 2003 data and that the magnitude of these differences in 2003 would be similar to those in 2000. Because obesity prevalence among children increased from 2000 to 2003,11 we also hypothesized that there would be a corresponding increase in the proportion of hospitalizations with obesity as a comorbidity.
METHODS
Data Source and Sample
We analyzed data from the AHRQ KID. The KID is a nationally representative sample of annual pediatric hospital discharges. Analysis using the KID allows for improved estimates due to the discharges from community, nonrehabilitation hospitals.12 It provides data found in standard hospital discharge abstracts for more than 2 million pediatric discharges, including International Classification of Diseases, Ninth Revision, Clinical Modification (ICD‐9‐CM) codes, LOS, total hospital charges, and patient demographic information.12 Our original analysis (published in Obesity, July 2007)10 utilized data from the 2000 KID. For this analysis we utilized data from the 2003 KID (the most recent version available), and for comparison we converted the results from the 2000 study into 2003 dollars using the Consumer Price Index for Medical Care.
Using ICD‐9‐CM codes, the KID provides the principal diagnosis for each discharge, along with up to 14 secondary diagnoses. It also provides Clinical Classification Software (CCS) codes, a diagnostic categorization scheme that permits grouping of related conditions. ICD‐9‐CM codes are collapsed into a smaller number of categories that are sometimes more useful for presenting descriptive statistics than are individual ICD‐9‐CM codes or the much broader categories of Diagnosis Related Groups (DRGs). For example, all ICD‐9‐CM codes for specific types of pneumonia would be grouped together under 1 CCS code but would exclude other respiratory conditions such as pneumothorax which would generally be included in the respiratory condition DRG.12
The 2000 KID contained 2,516,833 unweighted discharges, representing 7,291,038 discharges in the population. In the 2003 KID, there were 2,984,129 unweighted discharges representing 7,409,162 discharges in the population. Our sample included all discharges for nonpregnancy‐related conditions, in children 2 years of age (due to the Centers for Disease Control definition for overweight based on body mass index [BMI] that starts at age 2 years)13, 14 to 18 years of age (2000 weighted n = 1,527,309; 2003 weighted n = 1,613,258); these numbers exclude discharges with obesity as a primary diagnosis.
Key Variables
Our outcome variables were LOS and total charges for each of the common nonpregnancy‐related principal discharge diagnoses studied. For the 2000 and 2003 KID, total charges included all hospital fees with the exception of professional fees.15
The main independent variable of interest was presence of obesity as a secondary diagnosis. Discharges were classified as either with or without obesity based on the presence of the ICD‐9‐CM code 278.0x as a secondary diagnosis (1 if yes, 0 if no). This code captures obesity unspecified (278.00), overweight (278.01), and morbid obesity (278.02). Of note, the distribution of these codes did not vary significantly between the 2 study years.
Other independent variables included sex, age (2‐5 years, 6‐10 years, 11‐14 years, and 15‐18 years), race/ethnicity (white, black, Hispanic, and other), region (Northeast, Midwest, South, and West), hospital type (based on classification by the National Association of Children's Hospitals and Related Institutions [NACHRI] as general hospital, children's unit in a general hospital, and children's hospital) and expected primary payer (Medicaid, private, and other). We chose independent variables due to their established association with our outcomes and for their patterns of association with childhood obesity.
We did not include LOS as a covariate in models of charges because obesity may have been associated with the outcome indirectly through LOS as well as directly as a main effect. To fully interpret the combination of these effects would require analyses beyond the scope of this work.
Analyses
Using CCS codes, we identified the 4 most common principal nonpregnancy‐related discharge diagnoses for children 2‐18 years old. For both 2000 and 2003 these were asthma (CCS 128), pneumonia (CCS 122), affective disorders (eg, depression and bipolar disorder) (CCS 69), and appendicitis (CCS 142). Importantly, this group of diagnoses included conditions clinically associated with obesity (asthma and affective disorders)16 and conditions not associated with obesity (pneumonia and appendicitis). Given this distinction we analyzed the 4 conditions separately.
For all discharges with these common principal diagnoses, we calculated mean LOS and mean total charges. Bivariate and multivariable analyses were conducted using simple and multiple linear regression, respectively. These analyses were designed to test the study hypothesis that obesity as a secondary diagnosis is associated with incremental economic charges and LOS. All analyses were performed on log‐transformed LOS and charge data. We included in our models those characteristics that we hypothesized were potentially related to hospital charges and LOS, based on published literature,4, 17, 18 and for that reason all covariates were retained in the final models regardless of bivariate findings. Differences in the incremental LOS and charges for 2003 versus 2000 were compared using t‐tests.
For each independent variable with missing data, we included in the analyses a category for unreported values. The KID is known to have a large number of missing data for race/ethnicity; therefore, in keeping with other studies utilizing the KID,10, 19 we also conducted multivariate analyses excluding those discharges with unreported race as a sensitivity analysis. Of note, analyses of these data excluding children of unreported race were not substantively different than those in which the unreported group was included. We present our findings including the unreported race category.
Predicted values on the log scale, for those with obesity and without obesity as a secondary diagnosis adjusted for the listed covariates, were obtained. We then back‐transformed these to their original scales and units using methods developed by Duan.20 For each principal diagnosis category, we analyzed the differences in predicted mean LOS and predicted mean total charges between discharges with and without obesity as a secondary diagnosis, adjusted for the listed covariates, using the P values obtained from the regression analyses. All results are presented in 2003 dollars.
In keeping with our earlier analysis we considered the potential influence of comorbidities other than obesity on LOS and charges. Therefore, we examined whether other comorbidities were coded more frequently among those discharges with obesity as a secondary diagnosis than those discharges without obesity. As seen in the 2000 KID, the 2003 data revealed that diabetes was more commonly seen with obesity‐related hospitalizations than with those hospitalizations without obesity. However, the proportion of discharges with obesity and diabetes was low for all of the principal diagnostic categories studied (asthma 4.8%, pneumonia 6.0%, affective disorders 4.2%, and appendicitis 1.9%). Thus, we judged the co‐occurrence of diabetes and obesity as secondary diagnoses too infrequent to be an explanatory factor for the overall incremental differences in LOS and charges.
All analyses were weighted to account for the complex probability sampling of the dataset and permit inferences regarding national hospital discharge patterns. The same sample of discharges was used to analyze LOS and charges, with the discharge weighting variable (DISCWT) used for all analyses. All results are presented as weighted data unless otherwise noted. Analyses were conducted using STATA 8.0 (Stata Corporation, College Station, TX) and SUDAAN version 9 (Research Triangle Institute, Research Triangle Park, NC).
This study was approved by the Institutional Review Board of the University of Michigan Medical School.
RESULTS
Sample Characteristics
The characteristics of the study population are presented in Table 1. In 2003, the overall proportion of nonpregnancy‐related discharges for children 2‐18 years old coded with obesity as a secondary diagnosis was 1.6%, an increase from 1.1% in 2000. Within the 4 most common nonpregnancy‐related CCS category diagnoses (asthma, pneumonia, affective disorders, and appendicitis) the proportion of discharges with obesity coded as a secondary diagnosis increased from 2000 to 2003 (Figure 1)
| Variables | Discharges | |||
|---|---|---|---|---|
| With Obesity as Secondary Diagnosis | Without Obesity | |||
| 2000 | 2003 | 2000 | 2003 | |
| Unweighted, n | 8,696 | 15,546 | 762,407 | 943,182 |
| Weighted population size | 17,672 | 25,709 | 1,509,637 | 1,587,549 |
| Age | ||||
| 2‐5 years (%) | 4.8 | 4.8 | 27.4 | 29.0 |
| 6‐10 years (%) | 14.7 | 15.9 | 22.4 | 22.3 |
| 11‐14 years (%) | 34.4 | 34.1 | 20.9 | 20.9 |
| 15‐18 years (%) | 46.1 | 45.2 | 29.3 | 27.8 |
| Sex | ||||
| Male (%) | 45.5 | 46.8 | 53.8 | 53.4 |
| Race/Ethnicity | ||||
| White (%) | 46.8 | 32.2 | 50.9 | 39.3 |
| Black (%) | 20.7 | 20.4 | 14.3 | 12.6 |
| Hispanic (%) | 14.9 | 16.8 | 14.3 | 14.4 |
| Other (%) | 4.8 | 5.0 | 5.6 | 5.6 |
| Unreported (%) | 12.8 | 25.6 | 14.9 | 28.1 |
| Payer | ||||
| Medicaid (%) | 42.6 | 46.5 | 32.1 | 36.9 |
| Private (%) | 47.1 | 42.6 | 58.0 | 53.3 |
| Other (%) | 9.4 | 10.6 | 9.4 | 9.6 |
| Unreported (%) | 0.9 | 0.3 | 0.5 | 0.2 |
| Hospital Region | ||||
| Northeast (%) | 17.3 | 15.9 | 21.7 | 18.7 |
| Midwest (%) | 24.6 | 24.8 | 20.0 | 23.3 |
| South (%) | 37.6 | 38.4 | 36.3 | 37.0 |
| West (%) | 20.5 | 20.9 | 22.0 | 21.0 |
| Hospital type | ||||
| General hospital (%) | 68.2 | 61.4 | 61.0 | 57.1 |
| Children's unit in general hospital (%) | 15.2 | 17.8 | 18.6 | 19.2 |
| Children's hospitals (%) | 14.3 | 14.9 | 17.9 | 17.6 |
| Unreported (%) | 2.3% | 5.9 | 2.5 | 6.1 |
Incremental Differences in Mean Charges Associated with Obesity
In Table 2, we present results for analyses of mean charges. Following the pattern in 2000 for all 4 of these common conditions, in 2003 the adjusted mean total hospital charges were statistically significantly higher for discharges in which obesity was listed as a secondary diagnosis, compared with those in which it was not. Moreover, the magnitude of these differences was somewhat greater in 2003 than in 2000, although it did not achieve statistical significance (P > 0.05) (Figure 2). Specifically, the difference in charges among asthma discharges with and without obesity as a comorbidity was 9% greater in 2003 than in 2000, 17% greater among pneumonia discharges, 121% greater among affective disorders, and 3% greater among appendicitis discharges.
| Adjusted Mean Charges ($) | ||||||
|---|---|---|---|---|---|---|
| 2000 | 2003 | |||||
| With Obesity | Without Obesity | Difference | With Obesity | Without Obesity | Difference | |
| ||||||
| Asthma | 8,847 | 6,884 | 1,963* | 10,589 | 8,444 | 2,145 |
| Pneumonia | 13,930 | 11,036 | 2,894* | 16,609 | 13,219 | 3,390 |
| Affective disorders | 9,446 | 8,850 | 596 | 11,942 | 10,619 | 1,323 |
| Appendicitis | 16,101 | 12,587 | 3,514 | 19,213 | 15,586 | 3,627 |
Incremental Differences in Mean LOS Associated with Obesity
Compared with those discharges without obesity coded, obesity as a secondary diagnosis was associated with a statistically significantly longer mean LOS for all four diagnoses in 2003 (Table 3). In addition, for all diagnoses except asthma, the magnitude of the difference was somewhat greater in 2003 than in 2000, although it did not reach statistical significance (P > 0.05). The greatest increase was seen with appendicitis, with the incremental difference in LOS between those with obesity and those without going from 0.17 days in 2000 to 0.83 days in 2003; an increase of over 300%.
| Adjusted Mean LOS | ||||||
|---|---|---|---|---|---|---|
| 2000 | 2003 | |||||
| With Obesity | Without Obesity | Difference | With Obesity | Without Obesity | Difference | |
| ||||||
| Asthma | 3.04 | 2.45 | 0.59* | 2.88 | 2.44 | 0.44* |
| Pneumonia | 4.26 | 3.89 | 0.37 | 4.39 | 3.83 | 0.56 |
| Affective disorders | 7.72 | 7.11 | 0.61* | 8.23 | 7.42 | 0.81* |
| Appendicitis | 3.33 | 3.16 | 0.17 | 3.91 | 3.08 | 0.83* |
DISCUSSION
Prior studies have explored the resource utilization and expenditures associated with obesity in adult populations and among obese children in the outpatient setting.48, 21 Few, however, have examined charges related to inpatient care of obese children. Our studies are the first to utilize actual charge data from a nationally representative sample to explore the economic implications of obesity among children hospitalized for common pediatric illnesses.
Our findings from this national analysis support the hypothesis that, for the 4 conditions studied, statistically significantly higher mean total hospital charges and longer mean LOS for those discharges with obesity coded as a secondary diagnosis versus those without obesity coded occurred for both 2000 and 2003, even when controlling for sex, age, race/ethnicity, region, payer, and hospital type. Our analyses also suggested that the magnitude of the incremental differences in charges from 2000 to 2003 increased somewhat, and the magnitude of the incremental differences in LOS for all of these common conditions (except asthma) is also increasing.
While these findings serve to confirm higher incremental charges and LOS associated with obesity for hospitalized children, they raise the question of why charges and LOS for children with obesity might increase at a greater rate than for those without obesity. Higher hospital charges and LOS for children with obesity coded as a secondary diagnosis may be explained by greater resource utilization due to obesity that: 1) increases the technical complexity of procedures such as surgical interventions or intravenous catheter (IV) placement;22 2) leads to greater illness severity, as has been suggested in studies of adult patients;23, 24 or 3) leads to more complications such as secondary infections.22 One explanation for the possible widening of the gap in charges during the time period studied might be that discharges coded with obesity in 2003 reflect children who were more severely obese and had a greater severity of illness, leading to higher resource utilization than those with obesity in the 2000 dataset. However, the ICD‐9‐CM code for morbid obesity (278.02) was not used more often in 2003 than in 2000. Alternatively, we suspect that between 2000 and 2003, due to an increasing awareness of the problem of childhood obesity, physicians may have become more likely to order tests or consultations specifically related to the treatment or evaluation of obesity. Other than the increase in the proportion of discharges with obesity as a comorbidity from 2000 to 2003, we were unable to explore these possible explanations with the KID datasets.
In this sample of discharges, with only 1.1% and 1.6% coded with obesity as a secondary diagnosis in 2000 and 2003, respectively, it is important to note that these discharges should not be interpreted as the prevalence of obesity in hospitalized children. Indeed, in a recent study of children hospitalized for surgical procedures at a large Midwestern tertiary care hospital, 31.6% were found to be overweight or obese.25 However, we posit that the cases coded with obesity as a secondary diagnosis in this sample represent the cases in which obesity presents a recognized factor that complicated the clinical course. Further work should explore the mechanisms by which obesity impacts the care of children hospitalized for common conditions. For example, children with obesity may require more procedures and may experience more treatment complications. These specific interventions should be the target of clinically focused analyses.
Limitations
Analyses utilizing discharge data are potentially limited by the accuracy and consistency of coding. Whether the discharges coded with obesity reflect all cases in which obesity was a complicating factor is not known. Based on the national prevalence of childhood obesity it is likely than more than 1.6% of the children hospitalized in 2003 were obese. However, whether obesity impacted the hospital course sufficiently to be included among the secondary diagnoses (as stipulated by ICD‐9‐CM guidelines for official recording)26 in more than 1.6% of cases is unknown.
This study is also limited by the inability to address the processes that might account for the consistently higher charges and longer LOS seen for those discharges coded with obesity versus those without obesity coded. The KID provides some information regarding procedures performed but cannot be reliably used to examine this aspect of patient care.27 An additional limitation of the KID data set is that it contains information about deidentified discharges. This leads to the possibility of having individual patients in the dataset with multiple hospitalizations. In this study we examined the relationship between obesity as a secondary diagnosis and incremental charges and LOS for the 4 most common clinical categories for which children are hospitalized. Findings may differ for other conditions not evaluated here. Finally, information regarding costs can only be inferred from the charge data provided by the KID. However, the ratio of charges to costs would not be expected to vary by obesity status.
CONCLUSIONS
These results extend our earlier findings of higher charges and longer LOS for pediatric discharges coded with obesity versus those without. In addition, this analysis suggests a widening gap of incremental hospital charges and LOS associated with obesity as a comorbidity for common pediatric conditions. These findings present a heightening financial imperative for further research to evaluate factors associated with greater resource utilization among obese pediatric patients.
- ,,,.Prevalence and trends in overweight among US children and adolescents, 1999–2000.JAMA.2002;288(14):1728–1732.
- ,.Epidemic increase in childhood overweight, 1986–1998.JAMA.2001;286(22):2845–2848.
- ,.Overweight children and adolescents: description, epidemiology, and demographics.Pediatrics.1998;101(Pt 2):497–504.
- ,,.National medical spending attributable to overweight and obesity: how much, and who's paying?Health Aff (Millwood).2003; (Suppl Web Exclusives):W3‐219–26.
- ,,,.The impact of obesity on rising medical spending.Health Aff (Millwood).2004;(Suppl Web Exclusives):W4‐480–6.
- ,.Current estimates of the economic cost of obesity in the United States.Obes Res.1998;6(2):97–106.
- ,,,,.Lifetime health and economic benefits of weight loss among obese persons.Am J Public Health.1999;89(10):1536–1542.
- ,,.The health and cost consequences of obesity among the future elderly.Health Aff (Millwood).2005;24(Suppl 2):W5R30–W5R41.
- ,.Economic burden of obesity in youths aged 6 to 17 years: 1979–1999.Pediatrics.2002;109(5):E81–E81.
- ,,,.Incremental hospital charges associated with obesity as a secondary diagnosis.Obesity (Silver Spring).2007;15:1895–1901.
- ,,,,,.Prevalence of overweight and obesity in the United States, 1999–2004.JAMA.2006;295(13):1549–1555.
- Healthcare Cost and Utilization Project.2005. Overview of the Kid's Inpatient Database. Available at:http://www.hcup‐us.ahrq.gov/kidoverview.jsp. Accessed December 2008.
- CDC Body Mass Index: BMI for Children and Teens. Available at: http://www.cdc.gov/nccdphp/dnpa/bmi. Accessed December2008.
- ,,,,,.Prevalence of overweight among preschool children in the United States, 1971 through 1994.Pediatrics.1997;99(4):E1.
- Healthcare Cost and Utilization Project, 2002 and 2004. Description of data elements: inpatient core file. Available at: http://www.hcup‐us.ahrq.gov/db/nation/kid/DataElements_KID_Core_2000.pdf; http://www.hcup‐us.ahrq.gov/db/nation/kid/KID_2003_CORE_Volume1_A‐L.pdf;http://www.hcup‐us. ahrq.gov/db/nation/kid/KID_2003_CORE_Volume2_M‐Z.pdf. Accessed December2008.
- .Health consequences of obesity in youth: childhood predictors of adult disease.Pediatrics.1998;101:518–525.
- ,,.Lengths of stay and costs associated with children's hospitals.Pediatrics.2005;115(4):839–844.
- ,,, et al.Health care expenditures associated with overweight and obesity among US adults: importance of age and race.Am J Public Health.2005;95(1):159–165.
- ,,,.Effects of race, insurance status, and hospital volume on perforated appendicitis in children.Pediatrics.2005;115(4):920–925.
- .Smearing estimate: a nonparametric retransformation method.J Am Stat Assoc.1983;78:605–610.
- ,,,.Resource utilization and expenditures for overweight and obese children.Arch Pediatr Adolesc Med.2007 Jan;161(1):11–14.
- ,.Appendicitis in the obese child.J Pediatr Surg.2007;42(5):857–861.
- ,.Management of the obese critically ill patient.Crit Care Clin.2001;17:187–200.
- ,,,,.Total respiratory system, lung, and chest wall mechanics in sedated‐paralyzed postoperative morbidly obese patients.Chest.1996;109:144–151.
- ,,,,.Prevalence of overweight and obesity in a U.S. pediatric surgical population.J Natl Med Assoc.2007;99(1):46–48, 50–51.
- Centers for Disease Control and Prevention. ICD‐9‐CM. Official Guidelines for Coding and Reporting. Effective April 1, 2005. Available at: http://www.cdc.gov/nchs/data/icd9/icdguide.pdf. Accessed December2008.
- ,,,.Predictors of hospital charges for children admitted with asthma.Ambul Pediatr.2006;6(1):15–20.
Copyright © 2009 Society of Hospital Medicine
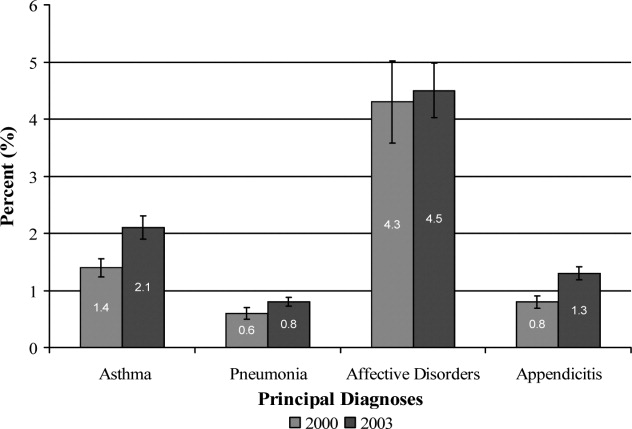
Conflicting Measures of Hospital Quality / Halasyamani and Davis
National concerns about the quality of health care in the United States have prompted calls for transparent efforts to measure and report hospital performance to the public. Consumer groups, payers, and credentialing organizations now rate the quality of hospitals and health care through a variety of mechanisms, yielding a kaleidoscope of quality measurement scorecards. However, health care consumers have minimal information about how hospital quality rating systems compare with each other or which rating system might best address their information needs.
The Hospital Compare Web site was launched in April 2005 by the Hospital Quality Alliance (HQA), a public‐private collaboration among organizations, including the Centers for Medicare and Medicaid Services (CMS). The CMS describes Hospital Compare as information [that] measures how well hospitals care for their patients.1 A limited set of Hospital Compare data from 2004 were posted online in 2005 for more than 4200 hospitals, permitting community‐specific comparisons of hospitals' self‐reported standardized core measures that reflect quality of care for acute myocardial infarction (AMI), congestive heart failure (CHF), and community‐acquired pneumonia (CAP) in adult patients.
Other current hospital quality evaluation tools target payers and purchasers of health care. However, many of these evaluations require that institutions pay a fee for submitting their data to be benchmarked against other participating institutions or require that the requesting individual or organization pay a fee to examine a hospital's performance on a specific condition or procedure.
We examined Hospital Compare data alongside that of another hospital rating system that has existed for a longer period of time and is likely better known to the lay publicthe Best Hospitals lists published annually by U.S. News and World Report.2, 3 Together, Hospital Compare and Best Hospitals are hospital quality scorecards that offer consumers assessments of hospital performance on a national scale. However, their measures of hospital quality differ, and we investigated whether they would provide consumers with concordant assessments of hospital quality.
METHODS
Data Sources
Hospital Compare
Core measure performance data were obtained by the investigators from the Hospital Compare Web site.3 Information in the database was provided by hospitals for the period January‐June 2004. Hospitals self‐reported their performance on the core measures using standardized medical record abstraction programs. The measures reported are cumulative averages based on monthly performance summaries.
Fourteen core measures were used in the study to form 3 core measure sets (Table 1): the AMI set comprised 6 measures, the CHF set comprised 4 measures, and the CAP site comprised 4 measures. Of the 17 core measures available on the Hospital Compare Web site, core measures of timing of thrombolytic agents or percutaneous transluminal coronary angioplasty for patients with AMI were excluded from the analysis because fewer than 10% of institutions reported such measures. Data on the core measure about oxygenation measurement for CAP were also excluded because of minimal variation between hospitals (national mean = 98%; the national mean for all other measures was less than 92%).3
| Condition | Core Measures |
|---|---|
| |
| Acute myocardial infarction (AMI) |
|
| Congestive heart failure (CHF) |
|
| Community‐acquired pneumonia (CAP) |
|
Core measures that CMS defined as having too few cases (< 25) to reliably ascertain an estimate of hospital performance, or for which hospitals were not reporting data, were not eligible for analysis. To generate a composite score for each of the disease‐specific core measure sets, scores for all eligible core measures within each set were summed and then divided by the number of eligible measures available. This permitted standardization of the scores in the majority of instances when institutions did not report all eligible measures within a given set.
Best Hospitals
Ratings of hospitals were drawn from the 2004 and 2005 editions of the Best Hospitals listings of the U.S. News and World Report, the editions that most closely reflect performance data and physician survey data concurrent with Hospital Compare data analyzed for this study.4 In each year, ratings were developed for more than 2000 hospitals that met specific criteria related to teaching hospital status, medical school affiliation, or availability of specific technology‐related services.5 The Best Hospitals rating system is based on 3 central elements of evaluation: (a) reputation, judged by responses to a national mail survey of physicians asked to list the 5 hospitals best in their specialty for difficult cases, without economic or geographic considerations; (b) in‐hospital mortality rates for Medicare patients, adjusted for severity of illness; and (c) a combination of other factors, such as the nurse‐to‐patient ratio and the number of a set of predetermined key technologies available, as determined from institutions' responses to the American Hospital Association's annual survey.5
The 50 Best Hospitals for heart and heart surgery, 50 Best Hospitals for respiratory disorders, and all Honor Roll hospitals (as determined by breadth of institutional excellence, with top performance in 6 or more of 17 specialties) named in 2004 and 2005 were included in this study, except that National Jewish Medical and Research Center was listed as a Best Hospital for respiratory disorders in both years but did not report sufficient numbers of cases to have eligible core measures in Hospital Compare. Of note, there were 11 institutions newly listed as Best Hospitals for heart and heart surgery and 10 institutions newly listed as Best Hospitals for respiratory disorders in 2005 versus 2004; 14 hospitals made the Best Hospitals Honor Roll in 2004, and 2 others were added for 2005.
Data Analysis
To examine the internal validity of the Hospital Compare measures, we calculated pairwise correlation coefficients among the 14 core‐measure components, using all eligible data points. We then calculated Cronbach's , a measure of the internal consistency of scales of measures, to characterize each of the sets of Hospital Compare core measures separately (AMI, CHF, CAP). We also generated Cronbach's for a measure we called the combined core‐measures score, which we intended to be analogous to the Best Hospitals Honor Roll, defined as the AMI, CHF, and CAP measure sets scored together.
To compare Hospital Compare data with the Best Hospitals rankings (for heart and heart surgery, respiratory disorders, and the Honor Roll), we first established national quartile score cut points for each of the 3 Hospital Compare core measure sets and for the combined core measures, using all U.S. hospitals eligible for our analysis. We used quartiles to avoid the misclassification that would be more likely to occur with deciles (based on confidence intervals for the core measures provided by CMS).6
We calculated Hospital Compare scores for each institution listed as a Best Hospital in 2004 and 2005 and classified the Best Hospitals into scoring quartiles based on national score cut points (eg, if the national cutoff for AMI core measures for the top quartile was 95.2%, then a Best Hospital with an AMI score for the core‐measures set 95.2% was classified in the first [top] quartile). AMI and CHF core measure sets were used for comparison with the Best Hospitals for heart and heart surgery, the CAP core‐measure set was used for comparison with the Best Hospitals for respiratory disorders, and the combined core‐measure set was used for comparison with the Honor Roll hospitals.
Sensitivity Analyses
To investigate the effect of missing Hospital Compare data on our study findings, we conducted sensitivity analyses. We used only those institutions with complete data for the AMI, CHF, and CAP core measure sets to establish new quartile cut points and then reexamined the quartile distribution for institutions in the corresponding Best Hospitals lists. We also compared the Best Hospitals' Hospital Compare data completeness with that of all Hospital Compare institutions.
RESULTS
Core Performance Measures in Hospital Compare
Of 4203 hospitals that submitted core measures as part of Hospital Compare, 4126 had at least 1 core measure eligible for analysis (> 25 observations). Of these 4126 hospitals, 2165 (52.5%) had at least 1 eligible AMI core measure, and 398 (9.7%) had all 6 measures eligible for analysis; 3130 had at least 1 eligible CHF core measure (75.9%), and 289 (7.0%) had all 4 measures eligible for analysis; and 3462 (83.9%) had at least one eligible CAP core measure and 302 (7.3%) had all 4 measures eligible for analysis. For the combined core‐measure score, 2119 (51.4%) had at least 4 eligible measures, and 120 (2.9%) had all 14 measures eligible for analysis.
Pairwise correlation coefficients within each of the disease‐specific core measure sets was highest for the AMI measures, and was generally higher for measures that reflected similar clinical activities (eg, aspirin and ‐blocker at discharge for AMI care; tobacco cessation counseling for AMI, CHF, and CAP; Table 2). In general, the AMI and CHF performance measures correlated more strongly with each other than did the AMI or CHF measures with the CAP measures.
Internal consistency within each of the disease‐specific measures was moderate to strong, with Cronbach's = .83 for AMI, Cronbach's = .58 for CHF, and Cronbach's = .49 for CAP. For the combined performance measure set (all 14 core measures together), Cronbach's = .74.
Hospital Compare Scores for Institutions Listed as Best Hospitals
Best Hospitals for heart and heart surgery and for respiratory disorders in U.S. News and World Report in 2004 and 2005 exhibited a broad distribution of Hospital Compare core measure scores (Table 3). For none of the core measure sets did a majority of Best Hospitals score in the top quartile in either year.
| Hospital Compare Scores | Best Hospitals for Heart Disease: AMI Core Measures (n = 50 hospitals)* | Best Hospitals for Heart Disease: CHF Core Measures (n = 50 hospitals)* | Best Hospitals for Respiratory Disorders: CAP Core Measures (n = 49 hospitals)* | |||
|---|---|---|---|---|---|---|
| ||||||
| 2004 | 2005 | 2004 | 2005 | 2004 | 2005 | |
| First quartile | 20 (40%) | 15 (30%) | 19 (38%) | 19 (38%) | 5 (10%) | 7 (14%) |
| Second quartile | 16 (32%) | 21 (42%) | 14 (28%) | 15 (30%) | 8 (16%) | 6 (12%) |
| Third quartile | 11 (22%) | 10 (20%) | 11 (22%) | 12 (24%) | 13 (27%) | 15 (31%) |
| Fourth quartile | 3 (6%) | 4 (8%) | 6 (12%) | 4 (8%) | 23 (47%) | 21 (43%) |
Among the 50 hospitals identified as best for cardiac care, only 20 (40%) in the 2004 list and 15 (30%) in the 2005 list had AMI core‐measure scores in the top quartile nationally, and 14 (28%) scored below the national median in both years. Among those same 50 hospitals, only 19 (38%) had CHF core‐measure scores in the top quartile nationally in both years, whereas 17 (34%) scored below the national median in 2004 and 16 in 2005. On the CAP core measures, Best Hospitals for respiratory disorders generally scored poorly, with only 5 (10%) from the 2004 list and 7 (14%) from the 2005 list in the top quartile nationally and nearly half the institutions scoring in the bottom national quartile (Table 3).
For the 14 hospitals named to the 2004 Honor Roll of Best Hospitals, the comparison with the combined core‐measure score (AMI, CHF, and CAP together) revealed a similarly broad distribution of core measure performance. Only five hospitals scored in the top quartile, 2 in the second quartile, 5 in the third quartile, and 2 in the bottom quartile. The distribution for hospitals in the 2005 Honor Roll was similar (5‐3‐6‐2 by quartile).
Sensitivity Analyses
National quartile Hospital Compare core‐measure cut points were slightly lower (1%‐2% in absolute terms) for those institutions with complete data than for institutions overall; in other words, institutions reporting on all 17 measures were generally more likely to have somewhat lower scores. These differences were substantive enough to shift the distribution of Best Hospitals in 2004 and 2005 up to higher quartiles for the AMI and CHF Hospital Compare measures but not for the CAP measures. For example, using the complete data AMI cut points, 23 of the 50 Best Hospitals for cardiac care in 2005 scored in the top quartile, 16 in the second quartile, 6 in the third quartile, and 5 in the bottom quartile (compared with 15‐21‐10‐4; Table 3). With complete data CHF cut points, the distribution was 26, 11, 9, and 4 for the 2005 Best Hospitals for cardiac care from the top through bottom quartiles, respectively (compared with 19‐15‐12‐4; Table 3). Results for 2004 sensitivity analyses were similar.
Institutions named as Best Hospitals appeared more likely than institutions overall to have complete Hospital Compare data. Whereas fewer than 10% of institutions in Hospital Compare had complete data for the AMI, CHF, and CAP core measures, 60% of Best Hospitals for cardiac care in 2005 had complete data for AMI measures and 44% for CHF measures, whereas 32% of Best Hospitals for respiratory care had complete CAP data.
DISCUSSION
With the public release of Hospital Compare data for more than 4200 hospitals in April 2005, national efforts to report hospital quality to the public passed a major milestone. Our findings indicate that the separate Hospital Compare measures for AMI, CHF, and CAP care have moderate to strong internal consistency, which suggests they are capturing similar hospital‐level care behaviors across institutions for these 3 common conditions.
However, Hospital Compare scores are largely discordant with the Best Hospital rank lists for cardiac and respiratory disorders care. Several institutions listed as Best Hospitals nationally scored below the national median on disease‐specific Hospital Compare core measures, perhaps leaving data‐conscious consumers to wonder how to synthesize rating systems that employ different indicators and measure different aspects of health care delivery.
Lack of Agreement in Hospital Quality Measurement
Discordance between the Hospital Compare and Best Hospitals rating systems is not all that surprising, given that their methods of institutional assessment differ markedly. Although both approaches share the goal of allowing consumers a comparative look at institutional performance nationally, they clearly measure different aspects of hospital care.
Hospital Compare measures focus on the delivery of disease‐specific, evidence‐based practices for 3 acute medical conditions from the emergency department to discharge. In comparison, the Best Hospitals rankings emphasize the reputation and mortality data of hospitals and health systems across a variety of general and subspecialty care settings (including several in which core quality measures have not yet been developed), combined with factors related to nursing and technology availability that may also influence consumers' choices. Of note, the Best Hospitals rating approach has been criticized in the past for its strong reliance on physicians' ratings of institutional reputation, which may have little to do with functional measures of quality.7
In essence, the Hospital Compare measures indicate how hospitals perform for an average case, while Best Hospitals relies on reputation and focus on mortality to indicate how institutions perform on the toughest cases. The question at hand is: are these institutional quality measures complementary or contradictory? Our findings suggest that Hospital Compare and Best Hospitals measures offer consumers a mix of complementary and contradictory information, depending on the institution.
The ratings systems differ in other respects as well. In Hospital Compare, performance data are available for more than 4000 hospitals, which permits consumers to examine their local institutions, whereas the Best Hospitals lists offer information only on the top performers. On the other hand, the more established Best Hospitals listings have been published annually for the last 15 years,5 permitting some longitudinal evaluation of hospitals' quality consistency. Importantly, neither rating system includes measures of patient satisfaction with hospital care.
One dimension that both rating systems share is the migration of quality measurement from the local and institutional level to the national stage. Historically, health care quality measurement has been a local phenomenon, as institutions work to gain larger shares of their local markets. A few hospitals have marketed their care and services regionally or even nationally and internationally, but these institutionswhich previously primarily used their reputation rather than specific outcome metrics to reach beyond their local communitiesare a minority of U.S. hospitals.
Although Hospital Compare and Best Hospitals are both national in scope, only Hospital Compare allows consumers to understand the quality of care in most of their community hospitals and health systems. Other investigators analyzing the same data set have highlighted significant differences in hospital performance according to for‐profit status, academic status, and size (number of beds).8
However, it is not yet clear if and how hospital ratings influence consumers' health care decisions. In fact, some studies suggest that only a minority of patients are inclined to use performance reports in their decisions about health care.9, 10 Moreover, if illness is acute, the factors driving choice of hospital may be geographic proximity, bed availability, and payer contracts rather than performance measures.
These constraints on the utility of hospital quality metrics from the consumer perspective are reminders that such metrics may have other benefits. Specifically, ratings such as Hospital Compare and Best Hospitals, as well as others such as those of the Leapfrog Group11 and the Joint Commission on Accreditation of Healthcare Organizations,12 offer differing arrays of performance measures that may induce hospitals to improve their quality of care.1, 13 Institutions that score well or improve their scores over time can use such scores not only to benchmark their processes and outcomes but also to signal the comparative value of their care to the public. In the past, hospitals named to the Best Hospitals Honor Roll have trumpeted their achievements through plaques on their walls and in advertisements for their services. Whether institutions will do the same regarding their Hospital Compare scores remains to be seen.
Study Limitations
The chief limitation of this analysis is that not all hospitals reported data for the Hospital Compare core measures. We standardized the core‐measure sets for AMI, CHF, and CAP care for the number of measures reported in each set in order to include as many hospitals as possible in our analyses. Participation in Hospital Compare is voluntary (although strongly encouraged because of better Medicare reimbursement for institutions that participate), so it is possible that there was a systematic scoring bias in hospitals' incomplete reporting across all measures, that is, hospitals might not report specific core measure scores if they were particularly poor.13 That scale score medians were slightly lower for hospitals with complete data than for hospitals overall may indicate some reporting bias in the Hospital Compare data. Nevertheless, in the sensitivity analyses we performed using only those hospitals with complete data on the Hospital Compare core measures, comparisons with the Best Hospitals lists still predominantly indicated discordance between the rating systems.
Another limitation of this work is that we examined only 2 of several currently available hospital‐rating schemes. We chose to examine Hospital Compare because it is the first governmental effort to report specific hospital quality measures to the public, and we elected to look at Hospital Compare alongside the Best Hospitals lists because the latter are arguably the hospital ratings best known to the lay public.
A third potential limitation is that the Best Hospitals lists for 2004 were based in part on mortality figures and hospital survey data from 2002, which were the most recent data available at the time of the rankings; for the 2005 Best Hospitals lists, the most recent mortality and hospital survey data were collected in 2003.4 Hospital Compare scores were calculated on the basis of patients discharged in 2004, and therefore the ratings systems reflect somewhat different time frames. Nonetheless, we do not believe that this mismatch explains the extent of discordance between the 2 rating scales, particularly because there was such stability in the Best Hospital lists over the 2 years.
CONCLUSIONS
The Best Hospitals lists and Hospital Compare core measure scores agree only a minority of the time on the best institutions for the care of cardiac and respiratory conditions in the United States. Prominent, publicly reported hospital quality scorecards that paint discordant pictures of institutional performance potentially present a conundrum for physicians, patients, and payers with growing incentives to compare institutional quality.
If the movement to improve health care quality is to succeed, the challenge will be to harness the growing professional and lay interest in quality measurement to create rating scales that reflect the best aspects of Hospital Compare and the Best Hospitals lists, with the broadest inclusion of institutions and scope of conditions. For example, it would be more helpful to the public if the Best Hospitals lists included available Hospital Compare measures. It would also benefit consumers if Hospital Compare included more metrics about preventive and elective procedures, domains in which consumers can maximally exercise their choice of health care institutions. Moreover, voluntary reporting may constrain the quality effort. Only with mandatory reporting on quality measures will consistent and sufficient institutional accountability be achieved.
- .Public performance reports and the will for change.JAMA.2002;288:1523–1524.
- .Improving the quality of care—can we practice what we preach?N Engl J Med.2003;348:2681–2683.
- U.S. Department of Health and Human Services, Centers for Medicare and Medicaid Services. Hospital Compare. Available at: http://www.hospitalcompare.hhs.gov. Accessed May 12,2005.
- U.S. News and World Report. Best hospitals 2005. Available at: http://www.usnews.com/usnews/health/best‐hospitals/tophosp.htm. Accessed July 10,2005.
- . Best hospitals 2005: methodology behind the rankings. U.S. News and World Report. Available at: http://www.usnews.com/usnews/health/best‐hospitals/methodology.htm. Accessed July 10,2005.
- U.S. Department of Health and Human Services, Centers for Medicare and Medicaid Services. Hospital Compare: information for professionals. Available at: http://www.hospitalcompare.hhs.gov/Hospital/Static/Data‐Professionals.asp?dest=NAV|Home|DataDetails|ProfessionalInfo#TabTop. Accessed May 12,2005.
- ,,,.In search of America's best hospitals: the promise and reality of quality assessment.JAMA.1997;277:1152–1155.
- ,,,.Care in US hospitals—the Hospital Quality Alliance program.N Engl Jour Med.2005;353:265–274.
- ,.Use of public performance reports: a survey of patients undergoing cardiac surgery.JAMA.1998;279:1638–1642.
- Kaiser Family Foundation and Agency for Health Care Research and Quality.National Survey on Consumers' Experiences with Patient Safety and Quality Information.Washington, DC:Kaiser Family Foundation;2004.
- Leapfrog Group for Patient Safety. Available at: http://www.leapfroggroup.org. Accessed May 12,2005.
- Joint Commission on Accreditation of Healthcare Organizations. Quality check. Available at: http://www.jcaho.org/quality+check/index.htm. Accessed May 12,2005.
- ,.The unintended consequences of publicly reporting quality information.JAMA.2005;293:1239–1244.
National concerns about the quality of health care in the United States have prompted calls for transparent efforts to measure and report hospital performance to the public. Consumer groups, payers, and credentialing organizations now rate the quality of hospitals and health care through a variety of mechanisms, yielding a kaleidoscope of quality measurement scorecards. However, health care consumers have minimal information about how hospital quality rating systems compare with each other or which rating system might best address their information needs.
The Hospital Compare Web site was launched in April 2005 by the Hospital Quality Alliance (HQA), a public‐private collaboration among organizations, including the Centers for Medicare and Medicaid Services (CMS). The CMS describes Hospital Compare as information [that] measures how well hospitals care for their patients.1 A limited set of Hospital Compare data from 2004 were posted online in 2005 for more than 4200 hospitals, permitting community‐specific comparisons of hospitals' self‐reported standardized core measures that reflect quality of care for acute myocardial infarction (AMI), congestive heart failure (CHF), and community‐acquired pneumonia (CAP) in adult patients.
Other current hospital quality evaluation tools target payers and purchasers of health care. However, many of these evaluations require that institutions pay a fee for submitting their data to be benchmarked against other participating institutions or require that the requesting individual or organization pay a fee to examine a hospital's performance on a specific condition or procedure.
We examined Hospital Compare data alongside that of another hospital rating system that has existed for a longer period of time and is likely better known to the lay publicthe Best Hospitals lists published annually by U.S. News and World Report.2, 3 Together, Hospital Compare and Best Hospitals are hospital quality scorecards that offer consumers assessments of hospital performance on a national scale. However, their measures of hospital quality differ, and we investigated whether they would provide consumers with concordant assessments of hospital quality.
METHODS
Data Sources
Hospital Compare
Core measure performance data were obtained by the investigators from the Hospital Compare Web site.3 Information in the database was provided by hospitals for the period January‐June 2004. Hospitals self‐reported their performance on the core measures using standardized medical record abstraction programs. The measures reported are cumulative averages based on monthly performance summaries.
Fourteen core measures were used in the study to form 3 core measure sets (Table 1): the AMI set comprised 6 measures, the CHF set comprised 4 measures, and the CAP site comprised 4 measures. Of the 17 core measures available on the Hospital Compare Web site, core measures of timing of thrombolytic agents or percutaneous transluminal coronary angioplasty for patients with AMI were excluded from the analysis because fewer than 10% of institutions reported such measures. Data on the core measure about oxygenation measurement for CAP were also excluded because of minimal variation between hospitals (national mean = 98%; the national mean for all other measures was less than 92%).3
| Condition | Core Measures |
|---|---|
| |
| Acute myocardial infarction (AMI) |
|
| Congestive heart failure (CHF) |
|
| Community‐acquired pneumonia (CAP) |
|
Core measures that CMS defined as having too few cases (< 25) to reliably ascertain an estimate of hospital performance, or for which hospitals were not reporting data, were not eligible for analysis. To generate a composite score for each of the disease‐specific core measure sets, scores for all eligible core measures within each set were summed and then divided by the number of eligible measures available. This permitted standardization of the scores in the majority of instances when institutions did not report all eligible measures within a given set.
Best Hospitals
Ratings of hospitals were drawn from the 2004 and 2005 editions of the Best Hospitals listings of the U.S. News and World Report, the editions that most closely reflect performance data and physician survey data concurrent with Hospital Compare data analyzed for this study.4 In each year, ratings were developed for more than 2000 hospitals that met specific criteria related to teaching hospital status, medical school affiliation, or availability of specific technology‐related services.5 The Best Hospitals rating system is based on 3 central elements of evaluation: (a) reputation, judged by responses to a national mail survey of physicians asked to list the 5 hospitals best in their specialty for difficult cases, without economic or geographic considerations; (b) in‐hospital mortality rates for Medicare patients, adjusted for severity of illness; and (c) a combination of other factors, such as the nurse‐to‐patient ratio and the number of a set of predetermined key technologies available, as determined from institutions' responses to the American Hospital Association's annual survey.5
The 50 Best Hospitals for heart and heart surgery, 50 Best Hospitals for respiratory disorders, and all Honor Roll hospitals (as determined by breadth of institutional excellence, with top performance in 6 or more of 17 specialties) named in 2004 and 2005 were included in this study, except that National Jewish Medical and Research Center was listed as a Best Hospital for respiratory disorders in both years but did not report sufficient numbers of cases to have eligible core measures in Hospital Compare. Of note, there were 11 institutions newly listed as Best Hospitals for heart and heart surgery and 10 institutions newly listed as Best Hospitals for respiratory disorders in 2005 versus 2004; 14 hospitals made the Best Hospitals Honor Roll in 2004, and 2 others were added for 2005.
Data Analysis
To examine the internal validity of the Hospital Compare measures, we calculated pairwise correlation coefficients among the 14 core‐measure components, using all eligible data points. We then calculated Cronbach's , a measure of the internal consistency of scales of measures, to characterize each of the sets of Hospital Compare core measures separately (AMI, CHF, CAP). We also generated Cronbach's for a measure we called the combined core‐measures score, which we intended to be analogous to the Best Hospitals Honor Roll, defined as the AMI, CHF, and CAP measure sets scored together.
To compare Hospital Compare data with the Best Hospitals rankings (for heart and heart surgery, respiratory disorders, and the Honor Roll), we first established national quartile score cut points for each of the 3 Hospital Compare core measure sets and for the combined core measures, using all U.S. hospitals eligible for our analysis. We used quartiles to avoid the misclassification that would be more likely to occur with deciles (based on confidence intervals for the core measures provided by CMS).6
We calculated Hospital Compare scores for each institution listed as a Best Hospital in 2004 and 2005 and classified the Best Hospitals into scoring quartiles based on national score cut points (eg, if the national cutoff for AMI core measures for the top quartile was 95.2%, then a Best Hospital with an AMI score for the core‐measures set 95.2% was classified in the first [top] quartile). AMI and CHF core measure sets were used for comparison with the Best Hospitals for heart and heart surgery, the CAP core‐measure set was used for comparison with the Best Hospitals for respiratory disorders, and the combined core‐measure set was used for comparison with the Honor Roll hospitals.
Sensitivity Analyses
To investigate the effect of missing Hospital Compare data on our study findings, we conducted sensitivity analyses. We used only those institutions with complete data for the AMI, CHF, and CAP core measure sets to establish new quartile cut points and then reexamined the quartile distribution for institutions in the corresponding Best Hospitals lists. We also compared the Best Hospitals' Hospital Compare data completeness with that of all Hospital Compare institutions.
RESULTS
Core Performance Measures in Hospital Compare
Of 4203 hospitals that submitted core measures as part of Hospital Compare, 4126 had at least 1 core measure eligible for analysis (> 25 observations). Of these 4126 hospitals, 2165 (52.5%) had at least 1 eligible AMI core measure, and 398 (9.7%) had all 6 measures eligible for analysis; 3130 had at least 1 eligible CHF core measure (75.9%), and 289 (7.0%) had all 4 measures eligible for analysis; and 3462 (83.9%) had at least one eligible CAP core measure and 302 (7.3%) had all 4 measures eligible for analysis. For the combined core‐measure score, 2119 (51.4%) had at least 4 eligible measures, and 120 (2.9%) had all 14 measures eligible for analysis.
Pairwise correlation coefficients within each of the disease‐specific core measure sets was highest for the AMI measures, and was generally higher for measures that reflected similar clinical activities (eg, aspirin and ‐blocker at discharge for AMI care; tobacco cessation counseling for AMI, CHF, and CAP; Table 2). In general, the AMI and CHF performance measures correlated more strongly with each other than did the AMI or CHF measures with the CAP measures.
Internal consistency within each of the disease‐specific measures was moderate to strong, with Cronbach's = .83 for AMI, Cronbach's = .58 for CHF, and Cronbach's = .49 for CAP. For the combined performance measure set (all 14 core measures together), Cronbach's = .74.
Hospital Compare Scores for Institutions Listed as Best Hospitals
Best Hospitals for heart and heart surgery and for respiratory disorders in U.S. News and World Report in 2004 and 2005 exhibited a broad distribution of Hospital Compare core measure scores (Table 3). For none of the core measure sets did a majority of Best Hospitals score in the top quartile in either year.
| Hospital Compare Scores | Best Hospitals for Heart Disease: AMI Core Measures (n = 50 hospitals)* | Best Hospitals for Heart Disease: CHF Core Measures (n = 50 hospitals)* | Best Hospitals for Respiratory Disorders: CAP Core Measures (n = 49 hospitals)* | |||
|---|---|---|---|---|---|---|
| ||||||
| 2004 | 2005 | 2004 | 2005 | 2004 | 2005 | |
| First quartile | 20 (40%) | 15 (30%) | 19 (38%) | 19 (38%) | 5 (10%) | 7 (14%) |
| Second quartile | 16 (32%) | 21 (42%) | 14 (28%) | 15 (30%) | 8 (16%) | 6 (12%) |
| Third quartile | 11 (22%) | 10 (20%) | 11 (22%) | 12 (24%) | 13 (27%) | 15 (31%) |
| Fourth quartile | 3 (6%) | 4 (8%) | 6 (12%) | 4 (8%) | 23 (47%) | 21 (43%) |
Among the 50 hospitals identified as best for cardiac care, only 20 (40%) in the 2004 list and 15 (30%) in the 2005 list had AMI core‐measure scores in the top quartile nationally, and 14 (28%) scored below the national median in both years. Among those same 50 hospitals, only 19 (38%) had CHF core‐measure scores in the top quartile nationally in both years, whereas 17 (34%) scored below the national median in 2004 and 16 in 2005. On the CAP core measures, Best Hospitals for respiratory disorders generally scored poorly, with only 5 (10%) from the 2004 list and 7 (14%) from the 2005 list in the top quartile nationally and nearly half the institutions scoring in the bottom national quartile (Table 3).
For the 14 hospitals named to the 2004 Honor Roll of Best Hospitals, the comparison with the combined core‐measure score (AMI, CHF, and CAP together) revealed a similarly broad distribution of core measure performance. Only five hospitals scored in the top quartile, 2 in the second quartile, 5 in the third quartile, and 2 in the bottom quartile. The distribution for hospitals in the 2005 Honor Roll was similar (5‐3‐6‐2 by quartile).
Sensitivity Analyses
National quartile Hospital Compare core‐measure cut points were slightly lower (1%‐2% in absolute terms) for those institutions with complete data than for institutions overall; in other words, institutions reporting on all 17 measures were generally more likely to have somewhat lower scores. These differences were substantive enough to shift the distribution of Best Hospitals in 2004 and 2005 up to higher quartiles for the AMI and CHF Hospital Compare measures but not for the CAP measures. For example, using the complete data AMI cut points, 23 of the 50 Best Hospitals for cardiac care in 2005 scored in the top quartile, 16 in the second quartile, 6 in the third quartile, and 5 in the bottom quartile (compared with 15‐21‐10‐4; Table 3). With complete data CHF cut points, the distribution was 26, 11, 9, and 4 for the 2005 Best Hospitals for cardiac care from the top through bottom quartiles, respectively (compared with 19‐15‐12‐4; Table 3). Results for 2004 sensitivity analyses were similar.
Institutions named as Best Hospitals appeared more likely than institutions overall to have complete Hospital Compare data. Whereas fewer than 10% of institutions in Hospital Compare had complete data for the AMI, CHF, and CAP core measures, 60% of Best Hospitals for cardiac care in 2005 had complete data for AMI measures and 44% for CHF measures, whereas 32% of Best Hospitals for respiratory care had complete CAP data.
DISCUSSION
With the public release of Hospital Compare data for more than 4200 hospitals in April 2005, national efforts to report hospital quality to the public passed a major milestone. Our findings indicate that the separate Hospital Compare measures for AMI, CHF, and CAP care have moderate to strong internal consistency, which suggests they are capturing similar hospital‐level care behaviors across institutions for these 3 common conditions.
However, Hospital Compare scores are largely discordant with the Best Hospital rank lists for cardiac and respiratory disorders care. Several institutions listed as Best Hospitals nationally scored below the national median on disease‐specific Hospital Compare core measures, perhaps leaving data‐conscious consumers to wonder how to synthesize rating systems that employ different indicators and measure different aspects of health care delivery.
Lack of Agreement in Hospital Quality Measurement
Discordance between the Hospital Compare and Best Hospitals rating systems is not all that surprising, given that their methods of institutional assessment differ markedly. Although both approaches share the goal of allowing consumers a comparative look at institutional performance nationally, they clearly measure different aspects of hospital care.
Hospital Compare measures focus on the delivery of disease‐specific, evidence‐based practices for 3 acute medical conditions from the emergency department to discharge. In comparison, the Best Hospitals rankings emphasize the reputation and mortality data of hospitals and health systems across a variety of general and subspecialty care settings (including several in which core quality measures have not yet been developed), combined with factors related to nursing and technology availability that may also influence consumers' choices. Of note, the Best Hospitals rating approach has been criticized in the past for its strong reliance on physicians' ratings of institutional reputation, which may have little to do with functional measures of quality.7
In essence, the Hospital Compare measures indicate how hospitals perform for an average case, while Best Hospitals relies on reputation and focus on mortality to indicate how institutions perform on the toughest cases. The question at hand is: are these institutional quality measures complementary or contradictory? Our findings suggest that Hospital Compare and Best Hospitals measures offer consumers a mix of complementary and contradictory information, depending on the institution.
The ratings systems differ in other respects as well. In Hospital Compare, performance data are available for more than 4000 hospitals, which permits consumers to examine their local institutions, whereas the Best Hospitals lists offer information only on the top performers. On the other hand, the more established Best Hospitals listings have been published annually for the last 15 years,5 permitting some longitudinal evaluation of hospitals' quality consistency. Importantly, neither rating system includes measures of patient satisfaction with hospital care.
One dimension that both rating systems share is the migration of quality measurement from the local and institutional level to the national stage. Historically, health care quality measurement has been a local phenomenon, as institutions work to gain larger shares of their local markets. A few hospitals have marketed their care and services regionally or even nationally and internationally, but these institutionswhich previously primarily used their reputation rather than specific outcome metrics to reach beyond their local communitiesare a minority of U.S. hospitals.
Although Hospital Compare and Best Hospitals are both national in scope, only Hospital Compare allows consumers to understand the quality of care in most of their community hospitals and health systems. Other investigators analyzing the same data set have highlighted significant differences in hospital performance according to for‐profit status, academic status, and size (number of beds).8
However, it is not yet clear if and how hospital ratings influence consumers' health care decisions. In fact, some studies suggest that only a minority of patients are inclined to use performance reports in their decisions about health care.9, 10 Moreover, if illness is acute, the factors driving choice of hospital may be geographic proximity, bed availability, and payer contracts rather than performance measures.
These constraints on the utility of hospital quality metrics from the consumer perspective are reminders that such metrics may have other benefits. Specifically, ratings such as Hospital Compare and Best Hospitals, as well as others such as those of the Leapfrog Group11 and the Joint Commission on Accreditation of Healthcare Organizations,12 offer differing arrays of performance measures that may induce hospitals to improve their quality of care.1, 13 Institutions that score well or improve their scores over time can use such scores not only to benchmark their processes and outcomes but also to signal the comparative value of their care to the public. In the past, hospitals named to the Best Hospitals Honor Roll have trumpeted their achievements through plaques on their walls and in advertisements for their services. Whether institutions will do the same regarding their Hospital Compare scores remains to be seen.
Study Limitations
The chief limitation of this analysis is that not all hospitals reported data for the Hospital Compare core measures. We standardized the core‐measure sets for AMI, CHF, and CAP care for the number of measures reported in each set in order to include as many hospitals as possible in our analyses. Participation in Hospital Compare is voluntary (although strongly encouraged because of better Medicare reimbursement for institutions that participate), so it is possible that there was a systematic scoring bias in hospitals' incomplete reporting across all measures, that is, hospitals might not report specific core measure scores if they were particularly poor.13 That scale score medians were slightly lower for hospitals with complete data than for hospitals overall may indicate some reporting bias in the Hospital Compare data. Nevertheless, in the sensitivity analyses we performed using only those hospitals with complete data on the Hospital Compare core measures, comparisons with the Best Hospitals lists still predominantly indicated discordance between the rating systems.
Another limitation of this work is that we examined only 2 of several currently available hospital‐rating schemes. We chose to examine Hospital Compare because it is the first governmental effort to report specific hospital quality measures to the public, and we elected to look at Hospital Compare alongside the Best Hospitals lists because the latter are arguably the hospital ratings best known to the lay public.
A third potential limitation is that the Best Hospitals lists for 2004 were based in part on mortality figures and hospital survey data from 2002, which were the most recent data available at the time of the rankings; for the 2005 Best Hospitals lists, the most recent mortality and hospital survey data were collected in 2003.4 Hospital Compare scores were calculated on the basis of patients discharged in 2004, and therefore the ratings systems reflect somewhat different time frames. Nonetheless, we do not believe that this mismatch explains the extent of discordance between the 2 rating scales, particularly because there was such stability in the Best Hospital lists over the 2 years.
CONCLUSIONS
The Best Hospitals lists and Hospital Compare core measure scores agree only a minority of the time on the best institutions for the care of cardiac and respiratory conditions in the United States. Prominent, publicly reported hospital quality scorecards that paint discordant pictures of institutional performance potentially present a conundrum for physicians, patients, and payers with growing incentives to compare institutional quality.
If the movement to improve health care quality is to succeed, the challenge will be to harness the growing professional and lay interest in quality measurement to create rating scales that reflect the best aspects of Hospital Compare and the Best Hospitals lists, with the broadest inclusion of institutions and scope of conditions. For example, it would be more helpful to the public if the Best Hospitals lists included available Hospital Compare measures. It would also benefit consumers if Hospital Compare included more metrics about preventive and elective procedures, domains in which consumers can maximally exercise their choice of health care institutions. Moreover, voluntary reporting may constrain the quality effort. Only with mandatory reporting on quality measures will consistent and sufficient institutional accountability be achieved.
- .Public performance reports and the will for change.JAMA.2002;288:1523–1524.
- .Improving the quality of care—can we practice what we preach?N Engl J Med.2003;348:2681–2683.
- U.S. Department of Health and Human Services, Centers for Medicare and Medicaid Services. Hospital Compare. Available at: http://www.hospitalcompare.hhs.gov. Accessed May 12,2005.
- U.S. News and World Report. Best hospitals 2005. Available at: http://www.usnews.com/usnews/health/best‐hospitals/tophosp.htm. Accessed July 10,2005.
- . Best hospitals 2005: methodology behind the rankings. U.S. News and World Report. Available at: http://www.usnews.com/usnews/health/best‐hospitals/methodology.htm. Accessed July 10,2005.
- U.S. Department of Health and Human Services, Centers for Medicare and Medicaid Services. Hospital Compare: information for professionals. Available at: http://www.hospitalcompare.hhs.gov/Hospital/Static/Data‐Professionals.asp?dest=NAV|Home|DataDetails|ProfessionalInfo#TabTop. Accessed May 12,2005.
- ,,,.In search of America's best hospitals: the promise and reality of quality assessment.JAMA.1997;277:1152–1155.
- ,,,.Care in US hospitals—the Hospital Quality Alliance program.N Engl Jour Med.2005;353:265–274.
- ,.Use of public performance reports: a survey of patients undergoing cardiac surgery.JAMA.1998;279:1638–1642.
- Kaiser Family Foundation and Agency for Health Care Research and Quality.National Survey on Consumers' Experiences with Patient Safety and Quality Information.Washington, DC:Kaiser Family Foundation;2004.
- Leapfrog Group for Patient Safety. Available at: http://www.leapfroggroup.org. Accessed May 12,2005.
- Joint Commission on Accreditation of Healthcare Organizations. Quality check. Available at: http://www.jcaho.org/quality+check/index.htm. Accessed May 12,2005.
- ,.The unintended consequences of publicly reporting quality information.JAMA.2005;293:1239–1244.
Copyright © 2007 Society of Hospital Medicine