User login
Generating Mortality Predictions
The systematic deployment of prediction rules within health systems remains a challenge, although such decision aids have been available for decades.[1, 2] We previously developed and validated a prediction rule for 30‐day mortality in a retrospective cohort, noting that the mortality risk is associated with a number of other clinical events.[3] These relationships suggest risk strata, defined by the predicted probability of 30‐day mortality, and could trigger a number of coordinated care processes proportional to the level of risk.[4] For example, patients within the higher‐risk strata could be considered for placement into an intermediate or intensive care unit (ICU), be monitored more closely by physician and nurse team members for clinical deterioration, be seen by a physician within a few days of hospital discharge, and be considered for advance care planning discussions.[3, 4, 5, 6, 7] Patients within the lower‐risk strata might not need the same intensity of these processes routinely unless some other indication were present.
However attractive this conceptual framework may be, its realization is dependent on the willingness of clinical staff to generate predictions consistently on a substantial portion of the patient population, and on the accuracy of the predictions when the risk factors are determined with some level of uncertainty at the beginning of the hospitalization.[2, 8] Skepticism is justified, because the work involved in completing the prediction rule might be incompatible with existing workflow. A patient might not be scored if the emergency physician lacks time or if technical issues arise with the information system and computation process.[9] There is also a generic concern that the predictions will prove to be less accurate outside of the original study population.[8, 9, 10] A more specific concern for our rule is how well present on admission diagnoses can be determined during the relatively short emergency department or presurgery evaluation period. For example, a final diagnosis of heart failure might not be established until later in the hospitalization, after the results of diagnostic testing and clinical response to treatment are known. Moreover, our retrospective prediction rule requires an assessment of the presence or absence of sepsis and respiratory failure. These diagnoses appear to be susceptible to secular trends in medical record coding practices, suggesting the rule's accuracy might not be stable over time.[11]
We report the feasibility of having emergency physicians and the surgical preparation center team generate mortality predictions before an inpatient bed is assigned. We evaluate and report the accuracy of these prospective predictions.
METHODS
The study population consisted of all patients 18 years of age or less than 100 years who were admitted from the emergency department or assigned an inpatient bed following elective surgery at a tertiary, community teaching hospital in the Midwestern United States from September 1, 2012 through February 15, 2013. Although patients entering the hospital from these 2 pathways would be expected to have different levels of mortality risk, we used the original prediction rule for both because such distinctions were not made in its derivation and validation. Patients were not considered if they were admitted for childbirth or other obstetrical reasons, admitted directly from physician offices, the cardiac catheterization laboratory, hemodialysis unit, or from another hospital. The site institutional review board approved this study.
The implementation process began with presentations to the administrative and medical staff leadership on the accuracy of the retrospectively generated mortality predictions and risk of other adverse events.[3] The chief medical and nursing officers became project champions, secured internal funding for the technical components, and arranged to have 2 project comanagers available. A multidisciplinary task force endorsed the implementation details at biweekly meetings throughout the planning year. The leadership of the emergency department and surgical preparation center committed their colleagues to generate the predictions. The support of the emergency leadership was contingent on the completion of the entire prediction generating process in a very short time (within the time a physician could hold his/her breath). The chief medical officer, with the support of the leadership of the hospitalists and emergency physicians, made the administrative decision that a prediction must be generated prior to the assignment of a hospital room.
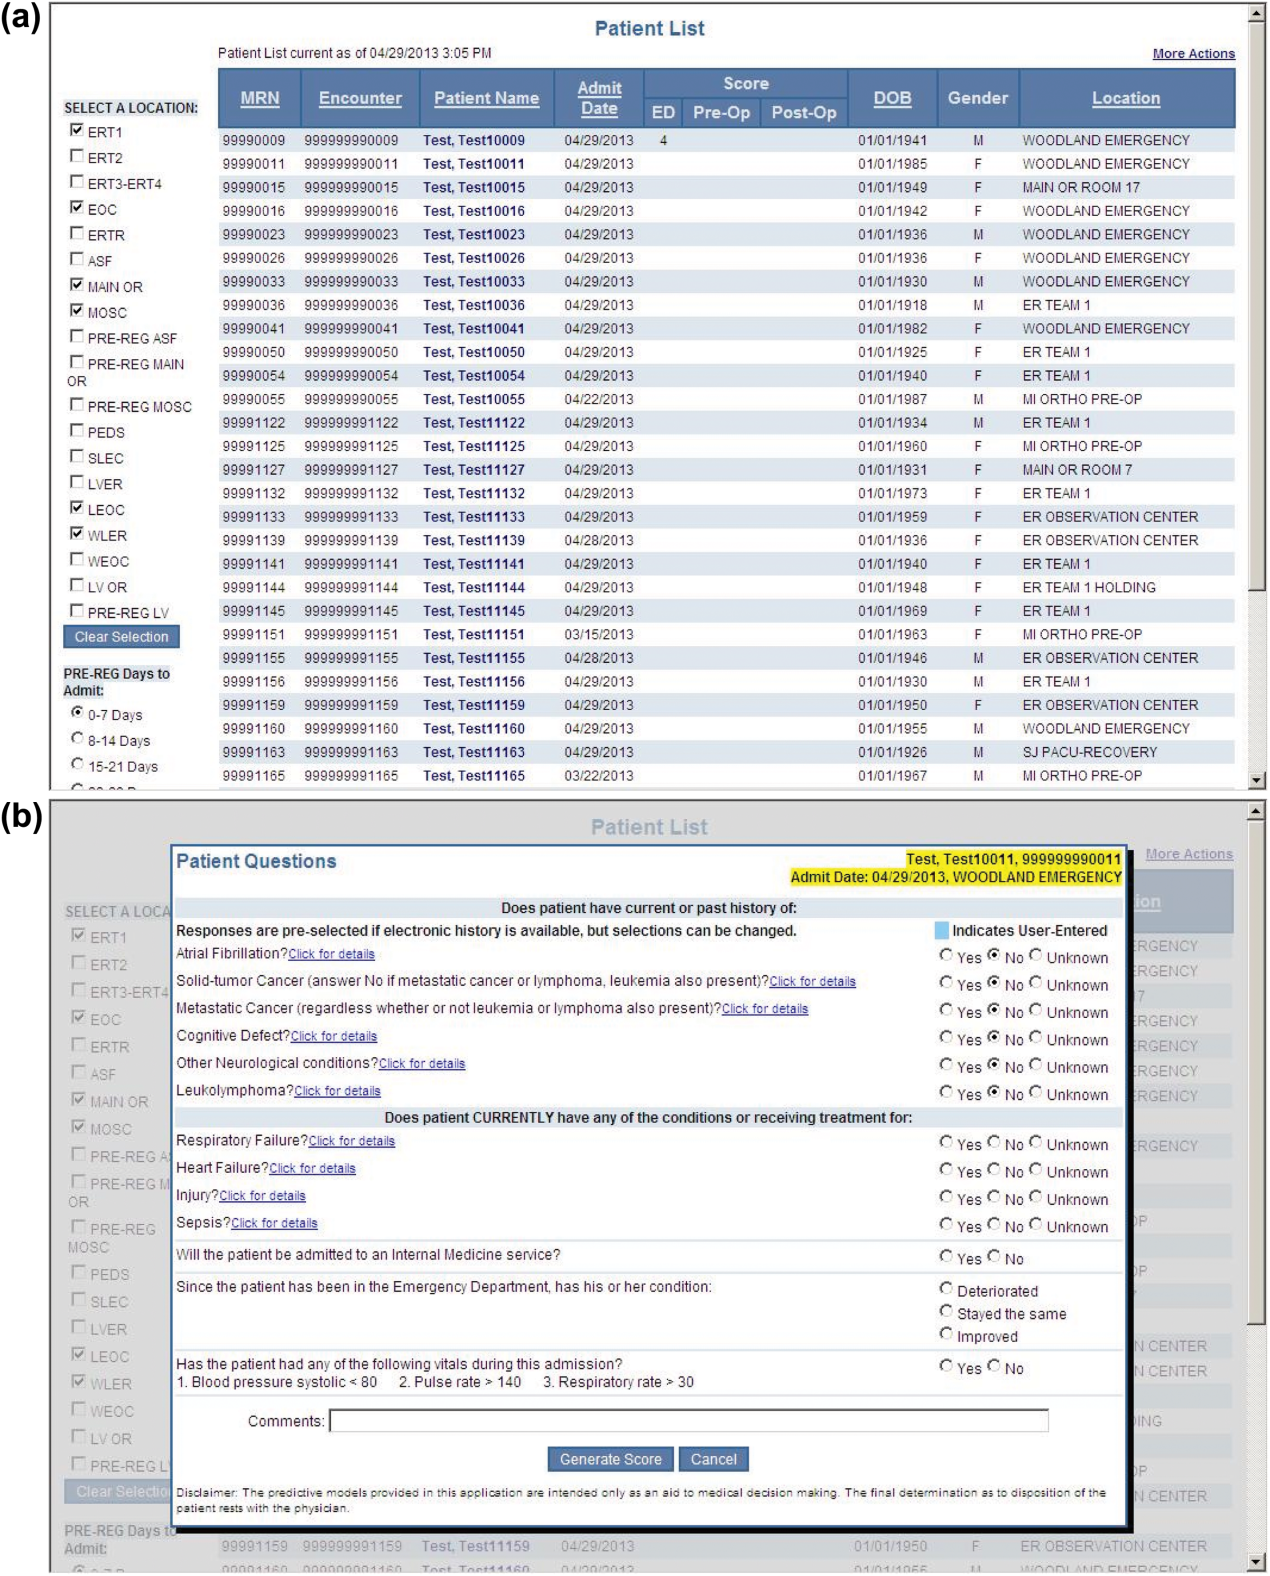
During the consensus‐building phase, a Web‐based application was developed to generate the predictions. Emergency physicians and surgical preparation staff were trained on the definitions of the risk factors (see Supporting Information, Appendix, in the online version of this article) and how to use the Web application. Three supporting databases were created. Each midnight, a past medical history database was updated, identifying those who had been discharged from the study hospital in the previous 365 days, and whether or not their diagnoses included atrial fibrillation, leukemia/lymphoma, metastatic cancer, cancer other than leukemia, lymphoma, cognitive disorder, or other neurological conditions (eg, Parkinson's, multiple sclerosis, epilepsy, coma, and stupor). Similarly, a clinical laboratory results database was created and updated real time through an HL7 (Health Level Seven, a standard data exchange format[12]) interface with the laboratory information system for the following tests performed in the preceding 30 days at a hospital‐affiliated facility: hemoglobin, platelet count, white blood count, serum troponin, blood urea nitrogen, serum albumin, serum lactate, arterial pH, arterial partial pressure of oxygen values. The third database, admission‐discharge‐transfer, was created and updated every 15 minutes to identify patients currently in the emergency room or scheduled for surgery. When a patient registration event was added to this database, the Web application created a record, retrieved all relevant data, and displayed the patient name for scoring. When the decision for hospitalization was made, the clinician selected the patient's name and reviewed the pre‐populated medical diagnoses of interest, which could be overwritten based on his/her own assessment (Figure 1A,B). The clinician then indicated (yes, no, or unknown) if the patient currently had or was being treated for each of the following: injury, heart failure, sepsis, respiratory failure, and whether or not the admitting service would be medicine (ie, nonsurgical, nonobstetrical). We considered unknown status to indicate the patient did not have the condition. When laboratory values were not available, a normal value was imputed using a previously developed algorithm.[3] Two additional questions, not used in the current prediction process, were answered to provide data for a future analysis: 1 concerning the change in the patient's condition while in the emergency department and the other concerning the presence of abnormal vital signs. The probability of 30‐day mortality was calculated via the Web application using the risk information supplied and the scoring weights (ie, parameter estimates) provided in the Appendices of our original publication.[3] Predictions were updated every minute as new laboratory values became available, and flagged with an alert if a more severe score resulted.

For the analyses of this study, the last prospective prediction viewed by emergency department personnel, a hospital bed manager, or surgical suite staff prior to arrival on the nursing unit is the one referenced as prospective. Once the patient had been discharged from the hospital, we generated a second mortality prediction based on previously published parameter estimates applied to risk factor data ascertained retrospectively as was done in the original article[3]; we subsequently refer to this prediction as retrospective. We will report on the group of patients who had both prospective and retrospective scores (1 patient had a prospective but not retrospective score available).
The prediction scores were made available to the clinical teams gradually during the study period. All scores were viewable by the midpoint of the study for emergency department admissions and near the end of the study for elective‐surgery patients. Only 2 changes in care processes based on level of risk were introduced during the study period. The first required initial placement of patients having a probability of dying of 0.3 or greater into an intensive or intermediate care unit unless the patient or family requested a less aggressive approach. The second occurred in the final 2 months of the study when a large multispecialty practice began routinely arranging for high‐risk patients to be seen within 3 or 7 days of hospital discharge.
Statistical Analyses
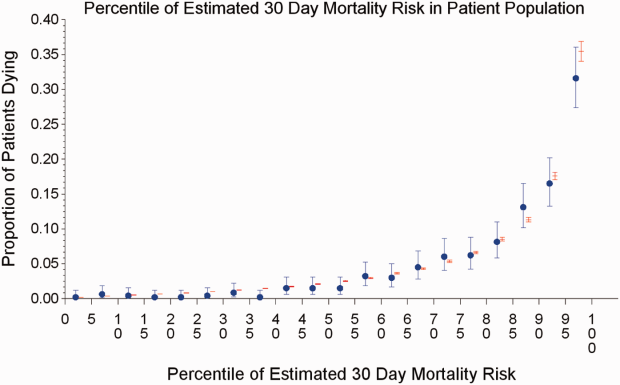
SAS version 9.3 (SAS Institute Inc., Cary, NC) was used to build the datasets and perform the analyses. Feasibility was evaluated by the number of patients who were candidates for prospective scoring with a score available at the time of admission. The validity was assessed with the primary outcome of death within 30 days from the date of hospital admission, as determined from hospital administrative data and the Social Security Death Index. The primary statistical metric is the area under the receiver operating characteristic curve (AROC) and the corresponding 95% Wald confidence limits. We needed some context for understanding the performance of the prospective predictions, assuming the accuracy could deteriorate due to the instability of the prediction rule over time and/or due to imperfect clinical information at the time the risk factors were determined. Accordingly, we also calculated an AROC based on retrospectively derived covariates (but using the same set of parameter estimates) as done in our original publication so we could gauge the stability of the original prediction rule. However, the motivation was not to determine whether retrospective versus prospective predictions were more accurate, given that only prospective predictions are useful in the context of developing real‐time care processes. Rather, we wanted to know if the prospective predictions would be sufficiently accurate for use in clinical practice. A priori, we assumed the prospective predictions should have an AROC of approximately 0.80. Therefore, a target sample size of 8660 hospitalizations was determined to be adequate to assess validity, assuming a 30‐day mortality rate of 5%, a desired lower 95% confidence boundary for the area under the prospective curve at or above 0.80, with a total confidence interval width of 0.07.[13] Calibration was assessed by comparing the actual proportion of patients dying (with 95% binomial confidence intervals) with the mean predicted mortality level within 5 percentile increments of predicted risk.
Risk Strata
We categorize the probability of 30‐day mortality into strata, with the understanding that the thresholds for defining these are a work in progress. Our hospital currently has 5 strata ranging from level 1 (highest mortality risk) to level 5 (lowest risk). The corresponding thresholds (at probabilities of death of 0.005, 0.02, 0.07, 0.20) were determined by visual inspection of the event rates and slope of curves displayed in Figure 1 of the original publication.[3]
Relationship to Secondary Clinical Outcomes of Interest
The choice of clinical care processes triggered per level of risk may be informed by understanding the frequency of events that increase with the mortality risk. We therefore examined the AROC from logistic regression models for the following outcomes using the prospectively generated probability as an explanatory variable: unplanned transfer to an ICU within the first 24 hours for patients not admitted to an ICU initially, ICU use at some point during the hospitalization, the development of a condition not present on admission (complication), receipt of palliative care by the end of the hospitalization, death during the hospitalization, 30‐day readmission, and death within 180 days. The definition of these outcomes and statistical approach used has been previously reported.[3]
RESULTS
Mortality predictions were generated on demand for 7291 out of 7777 (93.8%) eligible patients admitted from the emergency department, and for 2021 out of 2250 (89.8%) eligible elective surgical cases, for a total of 9312 predictions generated out of a possible 10,027 hospitalizations (92.9%). Table 1 displays the characteristics of the study population. The mean age was 65.2 years and 53.8% were women. The most common risk factors were atrial fibrillation (16.4%) and cancer (14.6%). Orders for a comfort care approach (rather than curative) were entered within 4 hours of admission for 32/9312 patients (0.34%), and 9/9312 (0.1%) were hospice patients on admission.
| Risk Factors | No. | Without Imputation | No. | With Imputation |
|---|---|---|---|---|
| ||||
| Clinical laboratory values within preceding 30 days | ||||
| Maximum serum blood urea nitrogen (mg/dL) | 8,484 | 22.7 (17.7) | 9,312 | 22.3 (16.9) |
| Minimum hemoglobin, g/dL, | 8,750 | 12.5 (2.4) | 9,312 | 12.4 (2.4) |
| Minimum platelet count, 1,000/UL | 8,737 | 224.1 (87.4) | 9,312 | 225.2 (84.7) |
| Maximum white blood count, 1,000/UL | 8,750 | 10.3 (5.8) | 9,312 | 10.3 (5.6) |
| Maximum serum lactate, mEq/L | 1,749 | 2.2 (1.8) | 9,312 | 0.7 (1.1) |
| Minimum serum albumin, g/dL | 4,057 | 3.4 (0.7) | 9,312 | 3.2 (0.5) |
| Minimum arterial pH | 509 | 7.36 (0.10) | 9,312 | 7.36 (0.02) |
| Minimum arterial pO2, mm Hg | 509 | 73.6 (25.2) | 9,312 | 98.6 (8.4) |
| Maximum serum troponin, ng/mL | 3,217 | 0.5 (9.3) | 9,312 | 0.2 (5.4) |
| Demographics and diagnoses | ||||
| Age, y | 9,312 | 65.2 (17.0) | ||
| Female sex | 9,312 | 5,006 (53.8%) | ||
| Previous hospitalization within past 365 days | 9,312 | 3,995 (42.9%) | ||
| Emergent admission | 9,312 | 7,288 (78.3%) | ||
| Admitted to a medicine service | 9,312 | 5,840 (62.7%) | ||
| Current or past atrial fibrillation | 9,312 | 1,526 (16.4%) | ||
| Current or past cancer without metastases, excluding leukemia or lymphoma | 9,312 | 1,356 (14.6%) | ||
| Current or past history of leukemia or lymphoma | 9,312 | 145 (1.6%) | ||
| Current or past metastatic cancer | 9,312 | 363 (3.9%) | ||
| Current or past cognitive deficiency | 9,312 | 844 (9.1%) | ||
| Current or past history of other neurological conditions (eg, Parkinson's disease, multiple sclerosis, epilepsy, coma, stupor, brain damage) | 9,312 | 952 (10.2%) | ||
| Injury such as fractures or trauma at the time of admission | 9,312 | 656 (7.0%) | ||
| Sepsis at the time of admission | 9,312 | 406 (4.4%) | ||
| Heart failure at the time of admission | 9,312 | 776 (8.3%) | ||
| Respiratory failure on admission | 9,312 | 557 (6.0%) | ||
| Outcomes of interest | ||||
| Unplanned transfer to an ICU (for those not admitted to an ICU) within 24 hours of admission | 8,377 | 86 (1.0%) | ||
| Ever in an ICU during the hospitalization | 9,312 | 1,267 (13.6%) | ||
| Development of a condition not present on admission (complication) | 9,312 | 834 (9.0%) | ||
| Within hospital mortality | 9,312 | 188 (2.0%) | ||
| Mortality within 30 days of admission | 9,312 | 466 (5.0%) | ||
| Mortality within 180 days of admission | 9,312 | 1,070 (11.5%) | ||
| Receipt of palliative care by the end of the hospitalization | 9,312 | 314 (3.4%) | ||
| Readmitted to the hospital within 30 days of discharge (patients alive at discharge) | 9,124 | 1,302 (14.3%) | ||
| Readmitted to the hospital within 30 days of discharge (patients alive on admission) | 9,312 | 1,302 (14.0%) | ||
Evaluation of Prediction Accuracy
The AROC for 30‐day mortality was 0.850 (95% confidence interval [CI]: 0.833‐0.866) for prospectively collected covariates, and 0.870 (95% CI: 0.855‐0.885) for retrospectively determined risk factors. These AROCs are not substantively different from each other, demonstrating comparable prediction performance. Calibration was excellent, as indicated in Figure 2, in which the predicted level of risk lay within the 95% confidence limits of the actual 30‐day mortality for 19 out of 20 intervals of 5 percentile increments.
Relationship to Secondary Clinical Outcomes of Interest
The relationship between the prospectively generated probability of dying within 30 days and other events is quantified by the AROC displayed in Table 2. The 30‐day mortality risk has a strong association with the receipt of palliative care by hospital discharge, in‐hospital mortality, and 180‐day mortality, a fair association with the risk for 30‐day readmissions and unplanned transfers to intensive care, and weak associations with receipt of intensive unit care ever within the hospitalization or the development of a new diagnosis that was not present on admission (complication). The frequency of these events per mortality risk strata is shown in Table 3. The level 1 stratum contains a higher frequency of these events, whereas the level 5 stratum contains relatively few, reflecting the Pareto principle by which a relatively small proportion of patients contribute a disproportionate frequency of the events of interest.
| |
| In‐hospital mortality | 0.841 (0.8140.869) |
| 180day mortality | 0.836 (0.8250.848) |
| Receipt of palliative care by discharge | 0.875 (0.8580.891) |
| 30day readmission (patients alive at discharge) | 0.649 (0.6340.664) |
| Unplanned transfer to an ICU (for those not admitted to an ICU) within 24 hours | 0.643 (0.5900.696) |
| Ever in an ICU during the hospitalization | 0.605 (0.5880.621) |
| Development of a condition not present on admission (complication) | 0.555 (0.5350.575) |
| Risk Strata | 30‐Day Mortality, Count/Cases (%) | Unplanned Transfers to ICU Within 24 Hours, Count/Cases (%) | Diagnosis Not Present on Admission, Complication, Count/Cases (%) | Palliative Status at Discharge, Count/Cases (%) | Death in Hospital, Count/Cases (%) |
|---|---|---|---|---|---|
| Risk Strata | Ever in ICU, Count/Cases (%) | 30‐Day Readmission, Count/Cases (%) | Death or Readmission Within 30 Days, Count/Cases (%) | 180‐Day Mortality, Count/Cases (%) | |
| |||||
| 1 | 155/501 (30.9%) | 6/358 (1.7%) | 58/501 (11.6%) | 110/501 (22.0%) | 72/501 (14.4%) |
| 2 | 166/1,316 (12.6%) | 22/1,166 (1.9%) | 148/1,316 (11.3%) | 121/1,316 (9.2%) | 58/1,316 (4.4%) |
| 3 | 117/2,977 (3.9%) | 35/2,701 (1.3%) | 271/2,977 (9.1%) | 75/2,977 (2.5%) | 43/2,977 (1.4%) |
| 4 | 24/3,350 (0.7%) | 20/3,042 (0.7%) | 293/3,350 (8.8%) | 6/3,350 (0.2%) | 13/3,350 (0.4%) |
| 5 | 4/1,168 (0.3%) | 3/1,110 (0.3%) | 64/1,168 (5.5%) | 2/1,168 (0.2%) | 2/1,168 (0.2%) |
| Total | 466/9,312 (5.0%) | 86/8,377 (1.0%) | 834/9,312 (9.0%) | 314/9,312 (3.4%) | 188/9,312 (2.0%) |
| 1 | 165/501 (32.9%) | 106/429 (24.7%) | 243/501 (48.5%) | 240/501 (47.9%) | |
| 2 | 213/1,316 (16.2%) | 275/1,258 (21.9%) | 418/1,316 (31.8%) | 403/1,316 (30.6%) | |
| 3 | 412/2,977 (13.8%) | 521/2,934 (17.8%) | 612/2,977 (20.6%) | 344/2,977 (11.6%) | |
| 4 | 406/3,350 (12.1%) | 348/3,337 (10.4%) | 368/3,350 (11.0%) | 77/3,350 (2.3%) | |
| 5 | 71/1,168 (6.1%) | 52/1,166 (4.5%) | 56/1,168 (4.8%) | 6/1,168 (0.5%) | |
| Total | 1,267/9,312 (13.6%) | 1,302/9,124 (14.3%) | 1,697/9,312 (18.2%) | 1,070/9,312 (11.5%) | |
DISCUSSION
Emergency physicians and surgical preparation center nurses generated predictions by the time of hospital admission for over 90% of the target population during usual workflow, without the addition of staff or resources. The discrimination of the prospectively generated predictions was very good to excellent, with an AROC of 0.850 (95% CI: 0.833‐0.866), similar to that obtained from the retrospective version. Calibration was excellent. The prospectively calculated mortality risk was associated with a number of other events. As shown in Table 3, the differing frequency of events within the risk strata support the development of differing intensities of multidisciplinary strategies according to the level of risk.[5] Our study provides useful experience for others who anticipate generating real‐time predictions. We consider the key reasons for success to be the considerable time spent achieving consensus, the technical development of the Web application, the brief clinician time required for the scoring process, the leadership of the chief medical and nursing officers, and the requirement that a prediction be generated before assignment of a hospital room.
Our study has a number of limitations, some of which were noted in our original publication, and although still relevant, will not be repeated here for space considerations. This is a single‐site study that used a prediction rule developed by the same site, albeit on a patient population 4 to 5 years earlier. It is not known how well the specific rule might perform in other hospital populations; any such use should therefore be accompanied by independent validation studies prior to implementation. Our successful experience should motivate future validation studies. Second, because the prognoses of patients scored from the emergency department are likely to be worse than those of elective surgery patients, our rule should be recalibrated for each subgroup separately. We plan to do this in the near future, as well as consider additional risk factors. Third, the other events of interest might be predicted more accurately if rules specifically developed for each were deployed. The mortality risk by itself is unlikely to be a sufficiently accurate predictor, particularly for complications and intensive care use, for reasons outlined in our original publication.[3] However, the varying levels of events within the higher versus lower strata should be noted by the clinical team as they design their team‐based processes. A follow‐up visit with a physician within a few days of discharge could address the concurrent risk of dying as well as readmission, for example. Finally, it is too early to determine if the availability of mortality predictions from this rule will benefit patients.[2, 8, 10] During the study period, we implemented only 2 new care processes based on the level of risk. This lack of interventions allowed us to evaluate the prediction accuracy with minimal additional confounding, but at the expense of not yet knowing the clinical impact of this work. After the study period, we implemented a number of other interventions and plan on evaluating their effectiveness in the future. We are also considering an evaluation of the potential information gained by updating the predictions throughout the course of the hospitalization.[14]
In conclusion, it is feasible to have a reasonably accurate prediction of mortality risk for most adult patients at the beginning of their hospitalizations. The availability of this prognostic information provides an opportunity to develop proactive care plans for high‐ and low‐risk subsets of patients.
Acknowledgements
The authors acknowledge the technical assistance of Nehal Sanghvi and Ben Sutton in the development of the Web application and related databases, and the support of the Chief Nursing Officer, Joyce Young, RN, PhD, the emergency department medical staff, Mohammad Salameh, MD, David Vandenberg, MD, and the surgical preparation center staff.
Disclosure: Nothing to report.
- , , , et al. Multifactorial index of cardiac risk in noncardiac surgical procedures. N Engl J Med. 1977;297:845–850.
- , . Methodological standards for the development of clinical decision rules in emergency medicine. Ann Emerg Med. 1999;33:437–447.
- , , , , . Mortality predictions on admission as a context for organizing care activities. J Hosp Med. 2013;8:229–235.
- , . The simple clinical score predicts mortality for 30 days after admission to an acute medical unit. QJM. 2006;99:771–781.
- , , , et al. Allocating scare resources in real‐time to reduce heart failure readmissions: a prospective, controlled study. BMJ Qual Saf. 2013;22:998–1005.
- , . Interventions to decrease hospital readmissions: keys for cost‐effectiveness. JAMA Intern Med. 2013;173:695–698.
- , , , et.al. A validated value‐based model to improve hospital‐wide perioperative outcomes. Ann Surg. 2010;252:486–498.
- , . Why is a good clinical prediction rule so hard to find? Arch Intern Med. 2011;171:1701–1702.
- , , , , , . Early detection of impending physiologic deterioration among patients who are not in intensive care: development of predictive models using data from an automated electronic medical record. J Hosp Med. 2012;7(5):388–395.
- , , . Predicting death: an empirical evaluation of predictive tools for mortality. Arch Intern Med. 2011;171:1721–1726.
- , , , , . Association of diagnostic coding with trends in hospitalizations and mortality of patients with pneumonia, 2003–2009. JAMA. 2012;307:1405–1413.
- Health Level Seven International website. Available at: http://www.hl7.org/. Accessed June 21, 2014.
- . Bounding sample size projections for the area under a ROC curve. J Stat Plan Inference. 2009;139:711–721.
- , , , , . Derivation and validation of a model to predict daily risk of death in hospital. Med Care. 2011;49:734–743.
The systematic deployment of prediction rules within health systems remains a challenge, although such decision aids have been available for decades.[1, 2] We previously developed and validated a prediction rule for 30‐day mortality in a retrospective cohort, noting that the mortality risk is associated with a number of other clinical events.[3] These relationships suggest risk strata, defined by the predicted probability of 30‐day mortality, and could trigger a number of coordinated care processes proportional to the level of risk.[4] For example, patients within the higher‐risk strata could be considered for placement into an intermediate or intensive care unit (ICU), be monitored more closely by physician and nurse team members for clinical deterioration, be seen by a physician within a few days of hospital discharge, and be considered for advance care planning discussions.[3, 4, 5, 6, 7] Patients within the lower‐risk strata might not need the same intensity of these processes routinely unless some other indication were present.
However attractive this conceptual framework may be, its realization is dependent on the willingness of clinical staff to generate predictions consistently on a substantial portion of the patient population, and on the accuracy of the predictions when the risk factors are determined with some level of uncertainty at the beginning of the hospitalization.[2, 8] Skepticism is justified, because the work involved in completing the prediction rule might be incompatible with existing workflow. A patient might not be scored if the emergency physician lacks time or if technical issues arise with the information system and computation process.[9] There is also a generic concern that the predictions will prove to be less accurate outside of the original study population.[8, 9, 10] A more specific concern for our rule is how well present on admission diagnoses can be determined during the relatively short emergency department or presurgery evaluation period. For example, a final diagnosis of heart failure might not be established until later in the hospitalization, after the results of diagnostic testing and clinical response to treatment are known. Moreover, our retrospective prediction rule requires an assessment of the presence or absence of sepsis and respiratory failure. These diagnoses appear to be susceptible to secular trends in medical record coding practices, suggesting the rule's accuracy might not be stable over time.[11]
We report the feasibility of having emergency physicians and the surgical preparation center team generate mortality predictions before an inpatient bed is assigned. We evaluate and report the accuracy of these prospective predictions.
METHODS
The study population consisted of all patients 18 years of age or less than 100 years who were admitted from the emergency department or assigned an inpatient bed following elective surgery at a tertiary, community teaching hospital in the Midwestern United States from September 1, 2012 through February 15, 2013. Although patients entering the hospital from these 2 pathways would be expected to have different levels of mortality risk, we used the original prediction rule for both because such distinctions were not made in its derivation and validation. Patients were not considered if they were admitted for childbirth or other obstetrical reasons, admitted directly from physician offices, the cardiac catheterization laboratory, hemodialysis unit, or from another hospital. The site institutional review board approved this study.
The implementation process began with presentations to the administrative and medical staff leadership on the accuracy of the retrospectively generated mortality predictions and risk of other adverse events.[3] The chief medical and nursing officers became project champions, secured internal funding for the technical components, and arranged to have 2 project comanagers available. A multidisciplinary task force endorsed the implementation details at biweekly meetings throughout the planning year. The leadership of the emergency department and surgical preparation center committed their colleagues to generate the predictions. The support of the emergency leadership was contingent on the completion of the entire prediction generating process in a very short time (within the time a physician could hold his/her breath). The chief medical officer, with the support of the leadership of the hospitalists and emergency physicians, made the administrative decision that a prediction must be generated prior to the assignment of a hospital room.
During the consensus‐building phase, a Web‐based application was developed to generate the predictions. Emergency physicians and surgical preparation staff were trained on the definitions of the risk factors (see Supporting Information, Appendix, in the online version of this article) and how to use the Web application. Three supporting databases were created. Each midnight, a past medical history database was updated, identifying those who had been discharged from the study hospital in the previous 365 days, and whether or not their diagnoses included atrial fibrillation, leukemia/lymphoma, metastatic cancer, cancer other than leukemia, lymphoma, cognitive disorder, or other neurological conditions (eg, Parkinson's, multiple sclerosis, epilepsy, coma, and stupor). Similarly, a clinical laboratory results database was created and updated real time through an HL7 (Health Level Seven, a standard data exchange format[12]) interface with the laboratory information system for the following tests performed in the preceding 30 days at a hospital‐affiliated facility: hemoglobin, platelet count, white blood count, serum troponin, blood urea nitrogen, serum albumin, serum lactate, arterial pH, arterial partial pressure of oxygen values. The third database, admission‐discharge‐transfer, was created and updated every 15 minutes to identify patients currently in the emergency room or scheduled for surgery. When a patient registration event was added to this database, the Web application created a record, retrieved all relevant data, and displayed the patient name for scoring. When the decision for hospitalization was made, the clinician selected the patient's name and reviewed the pre‐populated medical diagnoses of interest, which could be overwritten based on his/her own assessment (Figure 1A,B). The clinician then indicated (yes, no, or unknown) if the patient currently had or was being treated for each of the following: injury, heart failure, sepsis, respiratory failure, and whether or not the admitting service would be medicine (ie, nonsurgical, nonobstetrical). We considered unknown status to indicate the patient did not have the condition. When laboratory values were not available, a normal value was imputed using a previously developed algorithm.[3] Two additional questions, not used in the current prediction process, were answered to provide data for a future analysis: 1 concerning the change in the patient's condition while in the emergency department and the other concerning the presence of abnormal vital signs. The probability of 30‐day mortality was calculated via the Web application using the risk information supplied and the scoring weights (ie, parameter estimates) provided in the Appendices of our original publication.[3] Predictions were updated every minute as new laboratory values became available, and flagged with an alert if a more severe score resulted.
For the analyses of this study, the last prospective prediction viewed by emergency department personnel, a hospital bed manager, or surgical suite staff prior to arrival on the nursing unit is the one referenced as prospective. Once the patient had been discharged from the hospital, we generated a second mortality prediction based on previously published parameter estimates applied to risk factor data ascertained retrospectively as was done in the original article[3]; we subsequently refer to this prediction as retrospective. We will report on the group of patients who had both prospective and retrospective scores (1 patient had a prospective but not retrospective score available).
The prediction scores were made available to the clinical teams gradually during the study period. All scores were viewable by the midpoint of the study for emergency department admissions and near the end of the study for elective‐surgery patients. Only 2 changes in care processes based on level of risk were introduced during the study period. The first required initial placement of patients having a probability of dying of 0.3 or greater into an intensive or intermediate care unit unless the patient or family requested a less aggressive approach. The second occurred in the final 2 months of the study when a large multispecialty practice began routinely arranging for high‐risk patients to be seen within 3 or 7 days of hospital discharge.
Statistical Analyses
SAS version 9.3 (SAS Institute Inc., Cary, NC) was used to build the datasets and perform the analyses. Feasibility was evaluated by the number of patients who were candidates for prospective scoring with a score available at the time of admission. The validity was assessed with the primary outcome of death within 30 days from the date of hospital admission, as determined from hospital administrative data and the Social Security Death Index. The primary statistical metric is the area under the receiver operating characteristic curve (AROC) and the corresponding 95% Wald confidence limits. We needed some context for understanding the performance of the prospective predictions, assuming the accuracy could deteriorate due to the instability of the prediction rule over time and/or due to imperfect clinical information at the time the risk factors were determined. Accordingly, we also calculated an AROC based on retrospectively derived covariates (but using the same set of parameter estimates) as done in our original publication so we could gauge the stability of the original prediction rule. However, the motivation was not to determine whether retrospective versus prospective predictions were more accurate, given that only prospective predictions are useful in the context of developing real‐time care processes. Rather, we wanted to know if the prospective predictions would be sufficiently accurate for use in clinical practice. A priori, we assumed the prospective predictions should have an AROC of approximately 0.80. Therefore, a target sample size of 8660 hospitalizations was determined to be adequate to assess validity, assuming a 30‐day mortality rate of 5%, a desired lower 95% confidence boundary for the area under the prospective curve at or above 0.80, with a total confidence interval width of 0.07.[13] Calibration was assessed by comparing the actual proportion of patients dying (with 95% binomial confidence intervals) with the mean predicted mortality level within 5 percentile increments of predicted risk.
Risk Strata
We categorize the probability of 30‐day mortality into strata, with the understanding that the thresholds for defining these are a work in progress. Our hospital currently has 5 strata ranging from level 1 (highest mortality risk) to level 5 (lowest risk). The corresponding thresholds (at probabilities of death of 0.005, 0.02, 0.07, 0.20) were determined by visual inspection of the event rates and slope of curves displayed in Figure 1 of the original publication.[3]
Relationship to Secondary Clinical Outcomes of Interest
The choice of clinical care processes triggered per level of risk may be informed by understanding the frequency of events that increase with the mortality risk. We therefore examined the AROC from logistic regression models for the following outcomes using the prospectively generated probability as an explanatory variable: unplanned transfer to an ICU within the first 24 hours for patients not admitted to an ICU initially, ICU use at some point during the hospitalization, the development of a condition not present on admission (complication), receipt of palliative care by the end of the hospitalization, death during the hospitalization, 30‐day readmission, and death within 180 days. The definition of these outcomes and statistical approach used has been previously reported.[3]
RESULTS
Mortality predictions were generated on demand for 7291 out of 7777 (93.8%) eligible patients admitted from the emergency department, and for 2021 out of 2250 (89.8%) eligible elective surgical cases, for a total of 9312 predictions generated out of a possible 10,027 hospitalizations (92.9%). Table 1 displays the characteristics of the study population. The mean age was 65.2 years and 53.8% were women. The most common risk factors were atrial fibrillation (16.4%) and cancer (14.6%). Orders for a comfort care approach (rather than curative) were entered within 4 hours of admission for 32/9312 patients (0.34%), and 9/9312 (0.1%) were hospice patients on admission.
| Risk Factors | No. | Without Imputation | No. | With Imputation |
|---|---|---|---|---|
| ||||
| Clinical laboratory values within preceding 30 days | ||||
| Maximum serum blood urea nitrogen (mg/dL) | 8,484 | 22.7 (17.7) | 9,312 | 22.3 (16.9) |
| Minimum hemoglobin, g/dL, | 8,750 | 12.5 (2.4) | 9,312 | 12.4 (2.4) |
| Minimum platelet count, 1,000/UL | 8,737 | 224.1 (87.4) | 9,312 | 225.2 (84.7) |
| Maximum white blood count, 1,000/UL | 8,750 | 10.3 (5.8) | 9,312 | 10.3 (5.6) |
| Maximum serum lactate, mEq/L | 1,749 | 2.2 (1.8) | 9,312 | 0.7 (1.1) |
| Minimum serum albumin, g/dL | 4,057 | 3.4 (0.7) | 9,312 | 3.2 (0.5) |
| Minimum arterial pH | 509 | 7.36 (0.10) | 9,312 | 7.36 (0.02) |
| Minimum arterial pO2, mm Hg | 509 | 73.6 (25.2) | 9,312 | 98.6 (8.4) |
| Maximum serum troponin, ng/mL | 3,217 | 0.5 (9.3) | 9,312 | 0.2 (5.4) |
| Demographics and diagnoses | ||||
| Age, y | 9,312 | 65.2 (17.0) | ||
| Female sex | 9,312 | 5,006 (53.8%) | ||
| Previous hospitalization within past 365 days | 9,312 | 3,995 (42.9%) | ||
| Emergent admission | 9,312 | 7,288 (78.3%) | ||
| Admitted to a medicine service | 9,312 | 5,840 (62.7%) | ||
| Current or past atrial fibrillation | 9,312 | 1,526 (16.4%) | ||
| Current or past cancer without metastases, excluding leukemia or lymphoma | 9,312 | 1,356 (14.6%) | ||
| Current or past history of leukemia or lymphoma | 9,312 | 145 (1.6%) | ||
| Current or past metastatic cancer | 9,312 | 363 (3.9%) | ||
| Current or past cognitive deficiency | 9,312 | 844 (9.1%) | ||
| Current or past history of other neurological conditions (eg, Parkinson's disease, multiple sclerosis, epilepsy, coma, stupor, brain damage) | 9,312 | 952 (10.2%) | ||
| Injury such as fractures or trauma at the time of admission | 9,312 | 656 (7.0%) | ||
| Sepsis at the time of admission | 9,312 | 406 (4.4%) | ||
| Heart failure at the time of admission | 9,312 | 776 (8.3%) | ||
| Respiratory failure on admission | 9,312 | 557 (6.0%) | ||
| Outcomes of interest | ||||
| Unplanned transfer to an ICU (for those not admitted to an ICU) within 24 hours of admission | 8,377 | 86 (1.0%) | ||
| Ever in an ICU during the hospitalization | 9,312 | 1,267 (13.6%) | ||
| Development of a condition not present on admission (complication) | 9,312 | 834 (9.0%) | ||
| Within hospital mortality | 9,312 | 188 (2.0%) | ||
| Mortality within 30 days of admission | 9,312 | 466 (5.0%) | ||
| Mortality within 180 days of admission | 9,312 | 1,070 (11.5%) | ||
| Receipt of palliative care by the end of the hospitalization | 9,312 | 314 (3.4%) | ||
| Readmitted to the hospital within 30 days of discharge (patients alive at discharge) | 9,124 | 1,302 (14.3%) | ||
| Readmitted to the hospital within 30 days of discharge (patients alive on admission) | 9,312 | 1,302 (14.0%) | ||
Evaluation of Prediction Accuracy
The AROC for 30‐day mortality was 0.850 (95% confidence interval [CI]: 0.833‐0.866) for prospectively collected covariates, and 0.870 (95% CI: 0.855‐0.885) for retrospectively determined risk factors. These AROCs are not substantively different from each other, demonstrating comparable prediction performance. Calibration was excellent, as indicated in Figure 2, in which the predicted level of risk lay within the 95% confidence limits of the actual 30‐day mortality for 19 out of 20 intervals of 5 percentile increments.
Relationship to Secondary Clinical Outcomes of Interest
The relationship between the prospectively generated probability of dying within 30 days and other events is quantified by the AROC displayed in Table 2. The 30‐day mortality risk has a strong association with the receipt of palliative care by hospital discharge, in‐hospital mortality, and 180‐day mortality, a fair association with the risk for 30‐day readmissions and unplanned transfers to intensive care, and weak associations with receipt of intensive unit care ever within the hospitalization or the development of a new diagnosis that was not present on admission (complication). The frequency of these events per mortality risk strata is shown in Table 3. The level 1 stratum contains a higher frequency of these events, whereas the level 5 stratum contains relatively few, reflecting the Pareto principle by which a relatively small proportion of patients contribute a disproportionate frequency of the events of interest.
| |
| In‐hospital mortality | 0.841 (0.8140.869) |
| 180day mortality | 0.836 (0.8250.848) |
| Receipt of palliative care by discharge | 0.875 (0.8580.891) |
| 30day readmission (patients alive at discharge) | 0.649 (0.6340.664) |
| Unplanned transfer to an ICU (for those not admitted to an ICU) within 24 hours | 0.643 (0.5900.696) |
| Ever in an ICU during the hospitalization | 0.605 (0.5880.621) |
| Development of a condition not present on admission (complication) | 0.555 (0.5350.575) |
| Risk Strata | 30‐Day Mortality, Count/Cases (%) | Unplanned Transfers to ICU Within 24 Hours, Count/Cases (%) | Diagnosis Not Present on Admission, Complication, Count/Cases (%) | Palliative Status at Discharge, Count/Cases (%) | Death in Hospital, Count/Cases (%) |
|---|---|---|---|---|---|
| Risk Strata | Ever in ICU, Count/Cases (%) | 30‐Day Readmission, Count/Cases (%) | Death or Readmission Within 30 Days, Count/Cases (%) | 180‐Day Mortality, Count/Cases (%) | |
| |||||
| 1 | 155/501 (30.9%) | 6/358 (1.7%) | 58/501 (11.6%) | 110/501 (22.0%) | 72/501 (14.4%) |
| 2 | 166/1,316 (12.6%) | 22/1,166 (1.9%) | 148/1,316 (11.3%) | 121/1,316 (9.2%) | 58/1,316 (4.4%) |
| 3 | 117/2,977 (3.9%) | 35/2,701 (1.3%) | 271/2,977 (9.1%) | 75/2,977 (2.5%) | 43/2,977 (1.4%) |
| 4 | 24/3,350 (0.7%) | 20/3,042 (0.7%) | 293/3,350 (8.8%) | 6/3,350 (0.2%) | 13/3,350 (0.4%) |
| 5 | 4/1,168 (0.3%) | 3/1,110 (0.3%) | 64/1,168 (5.5%) | 2/1,168 (0.2%) | 2/1,168 (0.2%) |
| Total | 466/9,312 (5.0%) | 86/8,377 (1.0%) | 834/9,312 (9.0%) | 314/9,312 (3.4%) | 188/9,312 (2.0%) |
| 1 | 165/501 (32.9%) | 106/429 (24.7%) | 243/501 (48.5%) | 240/501 (47.9%) | |
| 2 | 213/1,316 (16.2%) | 275/1,258 (21.9%) | 418/1,316 (31.8%) | 403/1,316 (30.6%) | |
| 3 | 412/2,977 (13.8%) | 521/2,934 (17.8%) | 612/2,977 (20.6%) | 344/2,977 (11.6%) | |
| 4 | 406/3,350 (12.1%) | 348/3,337 (10.4%) | 368/3,350 (11.0%) | 77/3,350 (2.3%) | |
| 5 | 71/1,168 (6.1%) | 52/1,166 (4.5%) | 56/1,168 (4.8%) | 6/1,168 (0.5%) | |
| Total | 1,267/9,312 (13.6%) | 1,302/9,124 (14.3%) | 1,697/9,312 (18.2%) | 1,070/9,312 (11.5%) | |
DISCUSSION
Emergency physicians and surgical preparation center nurses generated predictions by the time of hospital admission for over 90% of the target population during usual workflow, without the addition of staff or resources. The discrimination of the prospectively generated predictions was very good to excellent, with an AROC of 0.850 (95% CI: 0.833‐0.866), similar to that obtained from the retrospective version. Calibration was excellent. The prospectively calculated mortality risk was associated with a number of other events. As shown in Table 3, the differing frequency of events within the risk strata support the development of differing intensities of multidisciplinary strategies according to the level of risk.[5] Our study provides useful experience for others who anticipate generating real‐time predictions. We consider the key reasons for success to be the considerable time spent achieving consensus, the technical development of the Web application, the brief clinician time required for the scoring process, the leadership of the chief medical and nursing officers, and the requirement that a prediction be generated before assignment of a hospital room.
Our study has a number of limitations, some of which were noted in our original publication, and although still relevant, will not be repeated here for space considerations. This is a single‐site study that used a prediction rule developed by the same site, albeit on a patient population 4 to 5 years earlier. It is not known how well the specific rule might perform in other hospital populations; any such use should therefore be accompanied by independent validation studies prior to implementation. Our successful experience should motivate future validation studies. Second, because the prognoses of patients scored from the emergency department are likely to be worse than those of elective surgery patients, our rule should be recalibrated for each subgroup separately. We plan to do this in the near future, as well as consider additional risk factors. Third, the other events of interest might be predicted more accurately if rules specifically developed for each were deployed. The mortality risk by itself is unlikely to be a sufficiently accurate predictor, particularly for complications and intensive care use, for reasons outlined in our original publication.[3] However, the varying levels of events within the higher versus lower strata should be noted by the clinical team as they design their team‐based processes. A follow‐up visit with a physician within a few days of discharge could address the concurrent risk of dying as well as readmission, for example. Finally, it is too early to determine if the availability of mortality predictions from this rule will benefit patients.[2, 8, 10] During the study period, we implemented only 2 new care processes based on the level of risk. This lack of interventions allowed us to evaluate the prediction accuracy with minimal additional confounding, but at the expense of not yet knowing the clinical impact of this work. After the study period, we implemented a number of other interventions and plan on evaluating their effectiveness in the future. We are also considering an evaluation of the potential information gained by updating the predictions throughout the course of the hospitalization.[14]
In conclusion, it is feasible to have a reasonably accurate prediction of mortality risk for most adult patients at the beginning of their hospitalizations. The availability of this prognostic information provides an opportunity to develop proactive care plans for high‐ and low‐risk subsets of patients.
Acknowledgements
The authors acknowledge the technical assistance of Nehal Sanghvi and Ben Sutton in the development of the Web application and related databases, and the support of the Chief Nursing Officer, Joyce Young, RN, PhD, the emergency department medical staff, Mohammad Salameh, MD, David Vandenberg, MD, and the surgical preparation center staff.
Disclosure: Nothing to report.
- , , , et al. Multifactorial index of cardiac risk in noncardiac surgical procedures. N Engl J Med. 1977;297:845–850.
- , . Methodological standards for the development of clinical decision rules in emergency medicine. Ann Emerg Med. 1999;33:437–447.
- , , , , . Mortality predictions on admission as a context for organizing care activities. J Hosp Med. 2013;8:229–235.
- , . The simple clinical score predicts mortality for 30 days after admission to an acute medical unit. QJM. 2006;99:771–781.
- , , , et al. Allocating scare resources in real‐time to reduce heart failure readmissions: a prospective, controlled study. BMJ Qual Saf. 2013;22:998–1005.
- , . Interventions to decrease hospital readmissions: keys for cost‐effectiveness. JAMA Intern Med. 2013;173:695–698.
- , , , et.al. A validated value‐based model to improve hospital‐wide perioperative outcomes. Ann Surg. 2010;252:486–498.
- , . Why is a good clinical prediction rule so hard to find? Arch Intern Med. 2011;171:1701–1702.
- , , , , , . Early detection of impending physiologic deterioration among patients who are not in intensive care: development of predictive models using data from an automated electronic medical record. J Hosp Med. 2012;7(5):388–395.
- , , . Predicting death: an empirical evaluation of predictive tools for mortality. Arch Intern Med. 2011;171:1721–1726.
- , , , , . Association of diagnostic coding with trends in hospitalizations and mortality of patients with pneumonia, 2003–2009. JAMA. 2012;307:1405–1413.
- Health Level Seven International website. Available at: http://www.hl7.org/. Accessed June 21, 2014.
- . Bounding sample size projections for the area under a ROC curve. J Stat Plan Inference. 2009;139:711–721.
- , , , , . Derivation and validation of a model to predict daily risk of death in hospital. Med Care. 2011;49:734–743.
© 2014 Society of Hospital Medicine
Prediction Mortality and Adverse Events
Favorable health outcomes are more likely to occur when the healthcare team quickly identifies and responds to patients at risk.[1, 2, 3] However, the treatment process can break down during handoffs if the clinical condition and active issues are not well communicated.[4] Patients whose decline cannot be reversed also challenge the health team. Many are referred to hospice late,[5] and some do not receive the type of end‐of‐life care matching their preferences.[6]
Progress toward the elusive goal of more effective and efficient care might be made via an industrial engineering approach, mass customization, in which bundles of services are delivered based on the anticipated needs of subsets of patients.[7, 8] An underlying rationale is the frequent finding that a small proportion of individuals experiences the majority of the events of interest, commonly referenced as the Pareto principle.[7] Clinical prediction rules can help identify these high‐risk subsets.[9] However, as more condition‐specific rules become available, the clinical team faces logistical challenges when attempting to incorporate these into practice. For example, which team member will be responsible for generating the prediction and communicating the level of risk? What actions should follow for a given level of risk? What should be done for patients with conditions not addressed by an existing rule?
In this study, we present our rationale for health systems to implement a process for generating mortality predictions at the time of admission on most, if not all, adult patients as a context for the activities of the various clinical team members. Recent studies demonstrate that in‐hospital or 30‐day mortality can be predicted with substantial accuracy using information available at the time of admission.[10, 11, 12, 13, 14, 15, 16, 17, 18, 19] Relationships are beginning to be explored among the risk factors for mortality and other outcomes such as length of stay, unplanned transfers to intensive care units, 30‐day readmissions, and extended care facility placement.[10, 20, 21, 22] We extend this work by examining how a number of adverse events can be understood through their relationship with the risk of dying. We begin by deriving and validating a new mortality prediction rule using information feasible for our institution to use in its implementation.
METHODS
The prediction rule was derived from data on all inpatients (n = 56,003) 18 to 99 years old from St. Joseph Mercy Hospital, Ann Arbor from 2008 to 2009. This is a community‐based, tertiary‐care center. We reference derivation cases as D1, validation cases from the same hospital in the following year (2010) as V1, and data from a second hospital in 2010 as V2. The V2 hospital belonged to the same parent health corporation and shared some physician specialists with D1 and V1 but had separate medical and nursing staff.
The primary outcome predicted is 30‐day mortality from the time of admission. We chose 30‐day rather than in‐hospital mortality to address concerns of potential confounding of duration of hospital stay and likelihood of dying in the hospital.[23] Risk factors were considered for inclusion into the prediction rule based on their prevalence, conceptual, and univariable association with death (details provided in the Supporting information, Appendix I and II, in the online version of this article). The types of risk factors considered were patient diagnoses as of the time of admission obtained from hospital administrative data and grouped by the 2011 Clinical Classification Software (
Prediction Rule Derivation Using D1 Dataset
Random forest procedures with a variety of variable importance measures were used with D1 data to reduce the number of potential predictor variables.[24] Model‐based recursive partitioning, a technique that combines features of multivariable logistic regression and classification and regression trees, was then used to develop the multivariable prediction model.[25, 26] Model building was done in R, employing functions provided as part of the randomForest and party packages. The final prediction rule consisted of 4 multivariable logistic regression models, each being specific to 1 of 4 possible population subgroups: females with/females without previous hospitalizations, and males with/males without previous hospitalizations. Each logistic regression model contains exactly the same predictor variables; however, the regression coefficients are subgroup specific. Therefore, the predicted probability of 30‐day mortality for a patient having a given set of predictor variables depends on the subgroup to which the patient is a member.
Validation, Discrimination, Calibration
The prediction rule was validated by generating a predicted probability of 30‐day mortality for each patient in V1 and V2, using their observed risk factor information combined with the scoring weights (ie, regression coefficients) derived from D1, then comparing predicted vs actual outcomes. Discriminatory accuracy is reported as the area under the receiver operating characteristic (ROC) curve that can range from 0.5 indicating pure chance, to 1.0 or perfect prediction.[27] Values above 0.8 are often interpreted as indicating strong predictive relationships, values between 0.7 and 0.79 as modest, and values between 0.6 and 0.69 as weak.[28] Model calibration was tested in all datasets across 20 intervals representing the spectrum of mortality risk, by assessing whether or not the 95% confidence limits for the actual proportion of patients dying encompassed the mean predicted mortality for the interval. These 20 intervals were defined using 5 percentile increments of the probability of dying for D1. The use of intervals based on percentiles ensures similarity in the level of predicted risk within an interval for V1 and V2, while allowing the proportion of patients contained within that interval to vary across hospitals.
Relationships With Other Adverse Events
We then used each patient's calculated probability of 30‐day mortality to predict the occurrence of other adverse events. We first derived scoring weights (ie, regression parameter estimates) from logistic regression models designed to relate each secondary outcome to the predicted 30‐day mortality using D1 data. These scoring weights were then respectively applied to the V1 and V2 patients' predicted 30‐day mortality rate to generate their predicted probabilities for: in‐hospital death, a stay in an intensive care unit at some point during the hospitalization, the occurrence of a condition not present on admission (a complication, see the Supporting information, Appendix I, in the online version of this article), palliative care status at the time of discharge (International Classification of Diseases, 9th Revision code V66.7), 30‐day readmission, and death within 180 days (determined for the first hospitalization of the patient in the calendar year, using hospital administrative data and the Social Security Death Index). Additionally, for V1 patients but not V2 due to unavailability of data, we predicted the occurrence of an unplanned transfer to an intensive care unit within the first 24 hours for those not admitted to the intensive care unit (ICU), and resuscitative efforts for cardiopulmonary arrests (code blue, as determined from hospital paging records and resuscitation documentation, with the realization that some resuscitations within the intensive care units might be undercaptured by this approach). Predicted vs actual outcomes were assessed using SAS version 9.2 by examining the areas under the receiver operating curves generated by the PROC LOGISTIC ROC.
Implications for Care Redesign
To illustrate how the mortality prediction provides a context for organizing the work of multiple health professionals, we created 5 risk strata[10] based on quintiles of D1 mortality risk. To display the time frame in which the peak risk of death occurs, we plotted the unadjusted hazard function per strata using SAS PROC LIFETEST.
RESULTS
Table 1 displays the risk factors used in the 30‐day mortality prediction rule, their distribution in the populations of interest, and the frequency of the outcomes of interest. The derivation (D1) and validation (V1) populations were clinically similar; the patients of hospital V2 differed in the proportion of risk factors and outcomes. The scoring weights or parameter estimates for the risk factors are given in the Appendix (see Supporting Information, Appendix I, in the online version of this article).
| Hospital A | Hospital V2 | ||
|---|---|---|---|
| D1 Derivation, N = 56,003 | V1 Validation, N = 28,441 | V2 Validation, N = 14,867 | |
| |||
| The 24 risk factors used in the prediction rule | |||
| Age in years, mean (standard deviation) | 59.8 (19.8) | 60.2 (19.8) | 66.4 (20.2) |
| Female | 33,185 (59.3%) | 16,992 (59.7%) | 8,935 (60.1%) |
| Respiratory failure on admission | 2,235 (4.0%) | 1,198 (4.2%) | 948 (6.4%) |
| Previous hospitalization | 19,560 (34.9%) | 10,155 (35.7%) | 5,925 (39.9%) |
| Hospitalization billed as an emergency admission[38] | 30,116 (53.8%) | 15,445 (54.3%) | 11,272 (75.8%) |
| Admitted to medicine service | 29,472 (52.6%) | 16,260 (57.2%) | 11,870 (79.8%) |
| Heart failure at the time of admission | 7,558 (13.5%) | 4,046 (14.2%) | 2,492 (16.8%) |
| Injury such as fractures or trauma at the time of admission | 7,007 (12.5%) | 3,612 (12.7%) | 2,205 (14.8%) |
| Sepsis at the time of admission | 2,278 (4.1%) | 1,025 (3.6%) | 850 (5.7%) |
| Current or past atrial fibrillation | 8,329 (14.9%) | 4,657 (16.4%) | 2,533 (17.0%) |
| Current or past metastatic cancer | 2,216 (4.0%) | 1,109 (3.9%) | 428 (2.9%) |
| Current or past cancer without metastases | 5,260 (9.34%) | 2,668 (9.4%) | 1,248 (8.4%) |
| Current or past history of leukemia or lymphoma | 1,025 (1.8%) | 526 (1.9%) | 278 (1.9%) |
| Current or past cognitive deficiency | 3,708 (6.6%) | 1,973 (6.9%) | 2,728 (18.4%) |
| Current or past history of other neurological conditions (such as Parkinson's disease, multiple sclerosis, epilepsy, coma, stupor, brain damage) | 4,671 (8.3%) | 2,537 (8.9%) | 1,606 (10.8%) |
| Maximum serum blood urea nitrogen (mg/dL), continuous | 21.9 (15.1) | 21.8 (15.1) | 25.9 (18.2) |
| Maximum white blood count (1,000/UL), continuous | 2.99 (4.00) | 3.10 (4.12) | 3.15 (3.81) |
| Minimum platelet count (1,000/UL), continuous | 240.5 (85.5) | 228.0 (79.6) | 220.0 (78.6) |
| Minimum hemoglobin (g/dL), continuous | 12.3 (1.83) | 12.3 (1.9) | 12.1 (1.9) |
| Minimum serum albumin (g/dL) <3.14, binary indicator | 11,032 (19.7%) | 3,848 (13.53%) | 2,235 (15.0%) |
| Minimum arterial pH <7.3, binary indicator | 1,095 (2.0%) | 473 (1.7%) | 308 (2.1%) |
| Minimum arterial pO2 (mm Hg) <85, binary indicator | 1,827 (3.3%) | 747 (2.6%) | 471 (3.2%) |
| Maximum serum troponin (ng/mL) >0.4, binary indicator | 6,268 (11.2%) | 1,154 (4.1%) | 2,312 (15.6%) |
| Maximum serum lactate (mEq/L) >4.0, binary indicator | 533 (1.0%) | 372 (1.3%) | 106 (0.7%) |
| Outcomes of interest | |||
| 30‐day mortalityprimary outcome of interest | 2,775 (5.0%) | 1,412 (5.0%) | 1,193 (8.0%) |
| In‐hospital mortality | 1,392 (2.5%) | 636 (2.2%) | 467 (3.1%) |
| 180‐day mortality (deaths/first hospitalization for patient that year) | 2,928/38,995 (7.5%) | 1,657/21,377 (7.8%) | 1,180/10,447 (11.3%) |
| Unplanned transfer to ICU within first 24 hours/number of patients with data not admitted to ICU | 434/46,647 (0.9%) | 276/25,920 (1.1%) | NA |
| Ever in ICU during hospitalization/those with ICU information available | 5,906/55,998 (10.6%) | 3,191/28,429 (11.2%) | 642/14,848 (4.32%) |
| Any complication | 6,768 (12.1%) | 2,447 (8.6%) | 868 (5.8%) |
| Cardiopulmonary arrest | 228 (0.4%) | 151 (0.5%) | NA |
| Patients discharged with palliative care V code | 1,151 (2.1%) | 962 (3.4%) | 340 (2.3%) |
| 30‐day rehospitalization/patients discharged alive | 6,616/54,606 (12.1%) | 3,602/27,793 (13.0%) | 2,002/14,381 (13.9%) |
Predicting 30‐Day Mortality
The areas under the ROC (95% confidence interval [CI]) for the D1, V1, and V2 populations were 0.876 (95% CI, 0.870‐0.882), 0.885 (95% CI, 0.877‐0.893), and 0.883 (95% CI, 0.875‐0.892), respectively. The calibration curves for all 3 populations are shown in Figure 1. The overlap of symbols indicates that the level of predicted risk matched actual mortality for most intervals, with slight underprediction for those in the highest risk percentiles.

Example of Risk Strata
Figure 2 displays the relationship between the predicted probability of dying within 30 days and the outcomes of interest for V1, and illustrates the Pareto principle for defining high‐ and low‐risk subgroups. Most of the 30‐day deaths (74.7% of D1, 74.2% of V1, and 85.3% of V2) occurred in the small subset of patients with a predicted probability of death exceeding 0.067 (the top quintile of risk of D1, the top 18 % of V1, and the top 29.8% of V2). In contrast, the mortality rate for those with a predicted risk of 0.0033 was 0.02% for the lowest quintile of risk in D1, 0.07% for the 19.3% having the lowest risk in V1, and 0% for the 9.7% of patients with the lowest risk in V2. Figure 3 indicates that the risk for dying peaks within the first few days of the hospitalization. Moreover, those in the high‐risk group remained at elevated risk relative to the lower risk strata for at least 100 days.
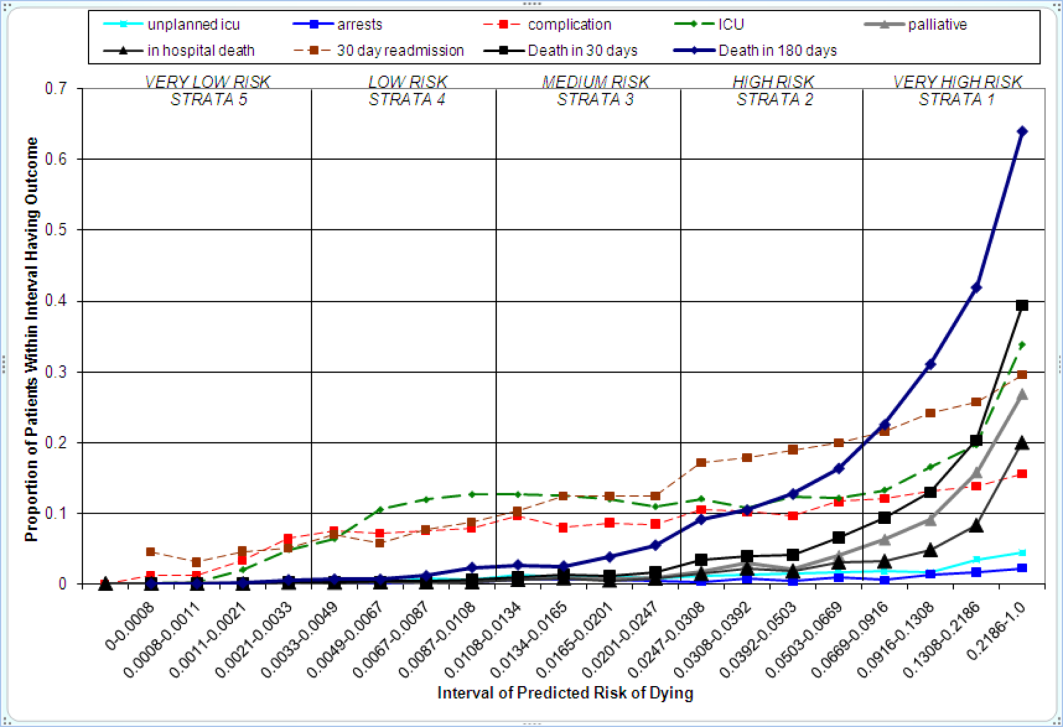
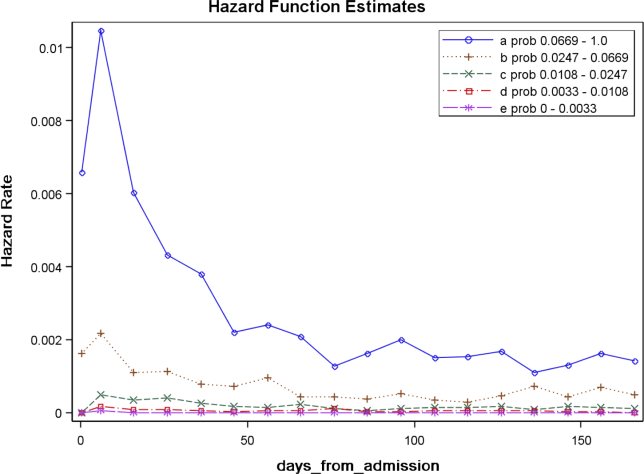
Relationships With Other Outcomes of Interest
The graphical curves of Figure 2 represent the occurrence of adverse events. The rising slopes indicate the risk for other events increases with the risk of dying within 30 days (for details and data for D1 and V2, see the Supporting Information, Appendix II, in the online version of this article). The strength of these relationships is quantified by the areas under the ROC curve (Table 2). The probability of 30‐day mortality strongly predicted the occurrence of in‐hospital death, palliative care status, and death within 180 days; modestly predicted having an unplanned transfer to an ICU within the first 24 hours of the hospitalization and undergoing resuscitative efforts for cardiopulmonary arrest; and weakly predicted intensive care unit use at some point in the hospitalization, occurrence of a condition not present on admission (complication), and being rehospitalized within 30 days
| Outcome | Hospital A | Hospital V2 | |
|---|---|---|---|
| D1Derivation | V1Validation | V2Validation | |
| |||
| Unplanned transfer to an ICU within the first 24 hours (for those not admitted to an ICU) | 0.712 (0.690‐0.734) | 0.735 (0.709‐0.761) | NA |
| Resuscitation efforts for cardiopulmonary arrest | 0.709 (0.678‐0.739) | 0.737 (0.700‐0.775) | NA |
| ICU stay at some point during the hospitalization | 0.659 (0.652‐0.666) | 0.663 (0.654‐0.672) | 0.702 (0.682‐0.722) |
| Intrahospital complication (condition not present on admission) | 0.682 (0.676‐0.689) | 0.624 (0.613‐0.635) | 0.646 (0.628‐0.664) |
| Palliative care status | 0.883 (0.875‐0.891) | 0.887 (0.878‐0.896) | 0.900 (0.888‐0.912) |
| Death within hospitalization | 0.861 (0.852‐0.870) | 0.875 (0.862‐0.887) | 0.880 (0.866‐0.893) |
| 30‐day readmission | 0.685 (0.679‐0.692) | 0.685 (0.676‐0.694) | 0.677 (0.665‐0.689) |
| Death within 180 days | 0.890 (0.885‐0.896) | 0.889 (0.882‐0.896) | 0.873 (0.864‐0.883) |
DISCUSSION
The primary contribution of our work concerns the number and strength of associations between the probability of dying within 30 days and other events, and the implications for organizing the healthcare delivery model. We also add to the growing evidence that death within 30 days can be accurately predicted at the time of admission from demographic information, modest levels of diagnostic information, and clinical laboratory values. We developed a new prediction rule with excellent accuracy that compares well to a rule recently developed by the Kaiser Permanente system.[13, 14] Feasibility considerations are likely to be the ultimate determinant of which prediction rule a health system chooses.[13, 14, 29] An independent evaluation of the candidate rules applied to the same data is required to compare their accuracy.
These results suggest a context for the coordination of clinical care processes, although mortality risk is not the only domain health systems must address. For illustrative purposes, we will refer to the risk strata shown in Figure 2. After the decisions to admit the patient to the hospital and whether or not surgical intervention is needed, the next decision concerns the level and type of nursing care needed.[10] Recent studies continue to show challenges both with unplanned transfers to intensive care units[21] and care delivered that is consistently concordant with patient wishes.[6, 30] The level of risk for multiple adverse outcomes suggests stratum 1 patients would be the priority group for perfecting the placement and preference assessment process. Our institution is currently piloting an internal placement guideline recommending that nonpalliative patients in the top 2.5 percentile of mortality risk be placed initially in either an intensive or intermediate care unit to receive the potential benefit of higher nursing staffing levels.[31] However, mortality risk cannot be the only criterion used for placement, as demonstrated by its relatively weak association with overall ICU utilization. Our findings may reflect the role of unmeasured factors such as the need for mechanical ventilation, patient preference for comfort care, bed availability, change in patient condition after admission, and inconsistent application of admission criteria.[17, 21, 32, 33, 34]
After the placement decision, the team could decide if the usual level of monitoring, physician rounding, and care coordination would be adequate for the level of risk or whether an additional anticipatory approach is needed. The weak relationship between the risk of death and incidence of complications, although not a new finding,[35, 36] suggests routine surveillance activities need to be conducted on all patients regardless of risk to detect a complication, but that a rescue plan be developed in advance for high mortality risk patients, for example strata 1 and 2, in the event they should develop a complication.[36] Inclusion of the patient's risk strata as part of the routine hand‐off communication among hospitalists, nurses, and other team members could provide a succinct common alert for the likelihood of adverse events.
The 30‐day mortality risk also informs the transition care plan following hospitalization, given the strong association with death in 180 days and the persistent level of this risk (Figure 3). Again, communication of the risk status (stratum 1) to the team caring for the patient after the hospitalization provides a common reference for prognosis and level of attention needed. However, the prediction accuracy is not sufficient to refer high‐risk patients into hospice, but rather, to identify the high‐risk subset having the most urgent need to have their preferences for future end‐of‐life care understood and addressed. The weak relationship of mortality risk with 30‐day readmissions indicates that our rule would have a limited role in identifying readmission risk per se. Others have noted the difficulty in accurately predicting readmissions, most likely because the underlying causes are multifactorial.[37] Our results suggest that 1 dynamic for readmission is the risk of dying, and so the underlying causes of this risk should be addressed in the transition plan.
There are a number of limitations with our study. First, this rule was developed and validated on data from only 2 institutions, assembled retrospectively, with diagnostic information determined from administrative data. One cannot assume the accuracy will carry over to other institutions[29] or when there is diagnostic uncertainty at the time of admission. Second, the 30‐day mortality risk should not be used as the sole criterion for determining the service intensity for individual patients because of issues with calibration, interpretation of risk, and confounding. The calibration curves (Figure 2) show the slight underprediction of the risk of dying for high‐risk groups. Other studies have also noted problems with precise calibration in validation datasets.[13, 14] Caution is also needed in the interpretation of what it means to be at high risk. Most patients in stratum 1 were alive at 30 days; therefore, being at high risk is not a death sentence. Furthermore, the relative weights of the risk factors reflect (ie, are confounded by) the level of treatment rendered. Some deaths within the higher‐risk percentiles undoubtedly occurred in patients choosing a palliative rather than a curative approach, perhaps partially explaining the slight underprediction of deaths. Conversely, the low mortality experienced by patients within the lower‐risk strata may indicate the treatment provided was effective. Low mortality risk does not imply less care is needed.
A third limitation is that we have not defined the thresholds of risk that should trigger placement and care intensity, although we provide examples on how this could be done. Each institution will need to calibrate the thresholds and associated decision‐making processes according to its own environment.[14] Interested readers can explore the sensitivity and specificity of various thresholds\ by using the tables in the Appendix (see the Supporting information, Appendix II, in the online version of this article). Finally, we do not know if identifying the mortality risk on admission will lead to better outcomes[19, 29]
CONCLUSIONS
Death within 30 days can be predicted with information known at the time of admission, and is associated with the risk of having other adverse events. We believe the probability of death can be used to define strata of risk that provide a succinct common reference point for the multidisciplinary team to anticipate the clinical course of subsets of patients and intervene with proportional intensity.
Acknowledgments
This work benefited from multiple conversations with Patricia Posa, RN, MSA, Elizabeth Van Hoek, MHSA, and the Redesigning Care Task Force of St. Joseph Mercy Hospital, Ann Arbor, Michigan.
Disclosure: Nothing to report.
- , , , et al. Importance of time to reperfusion for 30‐day and late survival and recovery of left ventricular function after primary angioplasty for acute myocardial infarction. J Am Coll Cardiol. 1998;32:1312–1319.
- , , , et al. Early goal‐directed therapy in the treatment of severe sepsis and septic shock. N Engl J Med. 2001;345:1368–1377.
- ATLANTIS, ECASS, NINDS rt‐PA Study Group Investigators. Association of outcome with early stroke treatment: pooled analysis of ATLANTIS, ECASS, and NINDS rt‐PA stroke trials. Lancet. 2004;363:768–774.
- , , , et al. Handoffs causing patient harm: a survey of medical and surgical house staff. Jt Comm J Qual Patient Saf. 2008;34:563–570.
- National Hospice and Palliative Care Organization. NHPCO facts and figures: hospice care in America 2010 Edition. Available at: http://www.nhpco.org. Accessed October 3,2011.
- , , , , . End‐of‐life discussions, goal attainment, and distress at the end of life: predictors and outcomes of receipt of care consistent with preferences. J Clin Oncol. 2010;28:1203–1208.
- Committee on Quality of Health Care in America, Institute of Medicine (IOM).Crossing the Quality Chasm: A New Health System for the 21st Century.Washington, DC:National Academies Press;2001.
- , , , et al. The surviving sepsis campaign: results of an international guideline‐based performance improvement program targeting severe sepsis. Intensive Care Med. 2010;36:222–231.
- , , , et al. A prediction rule to identify low‐risk patients with community‐acquired pneumonia. N Engl J Med. 1997;336:243–250.
- , . The simple clinical score predicts mortality for 30 days after admission to an acute medical unit. Q J Med. 2006;99:771–781.
- , , , et al. Enhancement of claims data to improve risk adjustment of hospital mortality. JAMA. 2007;297:71–76.
- , , . Using automated clinical data for risk adjustment. Med Care. 2007;45:789–805.
- , , , , , . Risk‐adjusting hospital inpatient mortality using automated inpatient, outpatient, and laboratory databases. Med Care. 2008;46:232–239.
- , , , . The Kaiser Permanente inpatient risk adjustment methodology was valid in an external patient population. J Clin Epidemiol. 2010;63:798–803.
- , , , , . An improved medical admissions risk system using multivariable fractional polynomial logistic regression modeling. Q J Med. 2010;103:23–32.
- , , , , . Risk scoring systems for adults admitted to the emergency department: a systematic review. Scand J Trauma Resusc Emerg Med. 2010;18:8.
- , , , , . Derivation and validation of a model to predict daily risk of death in hospital. Med Care. 2011;49:734–743.
- , , , . Prediction of hospital mortality from admission laboratory data and patient age: a simple model. Emerg Med Australas. 2011;23:354–363.
- , , . Predicting death: an empirical evaluation of predictive tools for mortality. Arch Intern Med. 2011;171:1721–1726.
- , , , . Length of stay predictions: improvements through the use of automated laboratory and comorbidity variables. Med Care. 2010;48:739–744.
- , , , , , . Intra‐hospital transfers to a higher level of care: contribution to total hospital and intensive care unit (ICU) mortality and length of stay (LOS). J Hosp Med. 2011;6:74–80.
- , , , et al. An automated model to identify heart failure patients at risk for 30‐day readmission or death using electronic medical record data. Med Care. 2010;48:981–988.
- , , , , , . Mortality trends during a program that publicly reported hospital performance. Med Care. 2002;40:879–890.
- , . Classification and regression by randomForest. R News. 2002;2:18–22.
- , , . Model‐based recursive partitioning. J Comput Graph Stat. 2008;17:492–514.
- , , , .Classification and Regression Trees.Belmont, CA:Wadsworth Inc.,1984.
- , , , , . Evaluating the yield of medical tests. JAMA. 1982;247:2543–2546.
- , , , . Risk stratification and therapeutic decision making in acute coronary syndromes. JAMA. 2000;284:876–878.
- , . Why is a good clinical prediction rule so hard to find?Arch Intern Med. 2011;171:1701–1702.
- , , . Advance directives and outcomes of surrogate decision making before death. N Engl J Med. 2010;362:1211–1218.
- , , , , , . Nurse staffing and inpatient hospital mortality. N Engl J Med. 2011;364:1037–1045.
- , , , et al. Survival of critically ill patients hospitalized in and out of intensive care. Crit Care Med. 2007;35:449–457.
- , , . How decisions are made to admit patients to medical intensive care units (MICUs): a survey of MICU directors at academic medical centers across the United States. Crit Care Med. 2008;36:414–420.
- , . Rethinking rapid response teams. JAMA. 2010;204:1375–1376.
- , , , . Hospital and patient characteristics associated with death after surgery: a study of adverse occurrence and failure to rescue. Med Care. 1992;30:615–629.
- , , . Variation in hospital mortality associated with inpatient surgery. N Engl J Med. 2009;361:1368–1375.
- , , , et al. Risk prediction models for hospital readmission: a systematic review. JAMA. 2011;306:1688–1698.
- Department of Health and Human Services, Centers for Medicare and Medicaid Services, CMS Manual System, Pub 100–04 Medicare Claims Processing, November 3, 2006. Available at: http://www. cms.gov/Regulations‐and‐Guidance/Guidance/Transmittals/Downloads/R1104CP.pdf. Accessed September 5,2012.
Favorable health outcomes are more likely to occur when the healthcare team quickly identifies and responds to patients at risk.[1, 2, 3] However, the treatment process can break down during handoffs if the clinical condition and active issues are not well communicated.[4] Patients whose decline cannot be reversed also challenge the health team. Many are referred to hospice late,[5] and some do not receive the type of end‐of‐life care matching their preferences.[6]
Progress toward the elusive goal of more effective and efficient care might be made via an industrial engineering approach, mass customization, in which bundles of services are delivered based on the anticipated needs of subsets of patients.[7, 8] An underlying rationale is the frequent finding that a small proportion of individuals experiences the majority of the events of interest, commonly referenced as the Pareto principle.[7] Clinical prediction rules can help identify these high‐risk subsets.[9] However, as more condition‐specific rules become available, the clinical team faces logistical challenges when attempting to incorporate these into practice. For example, which team member will be responsible for generating the prediction and communicating the level of risk? What actions should follow for a given level of risk? What should be done for patients with conditions not addressed by an existing rule?
In this study, we present our rationale for health systems to implement a process for generating mortality predictions at the time of admission on most, if not all, adult patients as a context for the activities of the various clinical team members. Recent studies demonstrate that in‐hospital or 30‐day mortality can be predicted with substantial accuracy using information available at the time of admission.[10, 11, 12, 13, 14, 15, 16, 17, 18, 19] Relationships are beginning to be explored among the risk factors for mortality and other outcomes such as length of stay, unplanned transfers to intensive care units, 30‐day readmissions, and extended care facility placement.[10, 20, 21, 22] We extend this work by examining how a number of adverse events can be understood through their relationship with the risk of dying. We begin by deriving and validating a new mortality prediction rule using information feasible for our institution to use in its implementation.
METHODS
The prediction rule was derived from data on all inpatients (n = 56,003) 18 to 99 years old from St. Joseph Mercy Hospital, Ann Arbor from 2008 to 2009. This is a community‐based, tertiary‐care center. We reference derivation cases as D1, validation cases from the same hospital in the following year (2010) as V1, and data from a second hospital in 2010 as V2. The V2 hospital belonged to the same parent health corporation and shared some physician specialists with D1 and V1 but had separate medical and nursing staff.
The primary outcome predicted is 30‐day mortality from the time of admission. We chose 30‐day rather than in‐hospital mortality to address concerns of potential confounding of duration of hospital stay and likelihood of dying in the hospital.[23] Risk factors were considered for inclusion into the prediction rule based on their prevalence, conceptual, and univariable association with death (details provided in the Supporting information, Appendix I and II, in the online version of this article). The types of risk factors considered were patient diagnoses as of the time of admission obtained from hospital administrative data and grouped by the 2011 Clinical Classification Software (
Prediction Rule Derivation Using D1 Dataset
Random forest procedures with a variety of variable importance measures were used with D1 data to reduce the number of potential predictor variables.[24] Model‐based recursive partitioning, a technique that combines features of multivariable logistic regression and classification and regression trees, was then used to develop the multivariable prediction model.[25, 26] Model building was done in R, employing functions provided as part of the randomForest and party packages. The final prediction rule consisted of 4 multivariable logistic regression models, each being specific to 1 of 4 possible population subgroups: females with/females without previous hospitalizations, and males with/males without previous hospitalizations. Each logistic regression model contains exactly the same predictor variables; however, the regression coefficients are subgroup specific. Therefore, the predicted probability of 30‐day mortality for a patient having a given set of predictor variables depends on the subgroup to which the patient is a member.
Validation, Discrimination, Calibration
The prediction rule was validated by generating a predicted probability of 30‐day mortality for each patient in V1 and V2, using their observed risk factor information combined with the scoring weights (ie, regression coefficients) derived from D1, then comparing predicted vs actual outcomes. Discriminatory accuracy is reported as the area under the receiver operating characteristic (ROC) curve that can range from 0.5 indicating pure chance, to 1.0 or perfect prediction.[27] Values above 0.8 are often interpreted as indicating strong predictive relationships, values between 0.7 and 0.79 as modest, and values between 0.6 and 0.69 as weak.[28] Model calibration was tested in all datasets across 20 intervals representing the spectrum of mortality risk, by assessing whether or not the 95% confidence limits for the actual proportion of patients dying encompassed the mean predicted mortality for the interval. These 20 intervals were defined using 5 percentile increments of the probability of dying for D1. The use of intervals based on percentiles ensures similarity in the level of predicted risk within an interval for V1 and V2, while allowing the proportion of patients contained within that interval to vary across hospitals.
Relationships With Other Adverse Events
We then used each patient's calculated probability of 30‐day mortality to predict the occurrence of other adverse events. We first derived scoring weights (ie, regression parameter estimates) from logistic regression models designed to relate each secondary outcome to the predicted 30‐day mortality using D1 data. These scoring weights were then respectively applied to the V1 and V2 patients' predicted 30‐day mortality rate to generate their predicted probabilities for: in‐hospital death, a stay in an intensive care unit at some point during the hospitalization, the occurrence of a condition not present on admission (a complication, see the Supporting information, Appendix I, in the online version of this article), palliative care status at the time of discharge (International Classification of Diseases, 9th Revision code V66.7), 30‐day readmission, and death within 180 days (determined for the first hospitalization of the patient in the calendar year, using hospital administrative data and the Social Security Death Index). Additionally, for V1 patients but not V2 due to unavailability of data, we predicted the occurrence of an unplanned transfer to an intensive care unit within the first 24 hours for those not admitted to the intensive care unit (ICU), and resuscitative efforts for cardiopulmonary arrests (code blue, as determined from hospital paging records and resuscitation documentation, with the realization that some resuscitations within the intensive care units might be undercaptured by this approach). Predicted vs actual outcomes were assessed using SAS version 9.2 by examining the areas under the receiver operating curves generated by the PROC LOGISTIC ROC.
Implications for Care Redesign
To illustrate how the mortality prediction provides a context for organizing the work of multiple health professionals, we created 5 risk strata[10] based on quintiles of D1 mortality risk. To display the time frame in which the peak risk of death occurs, we plotted the unadjusted hazard function per strata using SAS PROC LIFETEST.
RESULTS
Table 1 displays the risk factors used in the 30‐day mortality prediction rule, their distribution in the populations of interest, and the frequency of the outcomes of interest. The derivation (D1) and validation (V1) populations were clinically similar; the patients of hospital V2 differed in the proportion of risk factors and outcomes. The scoring weights or parameter estimates for the risk factors are given in the Appendix (see Supporting Information, Appendix I, in the online version of this article).
| Hospital A | Hospital V2 | ||
|---|---|---|---|
| D1 Derivation, N = 56,003 | V1 Validation, N = 28,441 | V2 Validation, N = 14,867 | |
| |||
| The 24 risk factors used in the prediction rule | |||
| Age in years, mean (standard deviation) | 59.8 (19.8) | 60.2 (19.8) | 66.4 (20.2) |
| Female | 33,185 (59.3%) | 16,992 (59.7%) | 8,935 (60.1%) |
| Respiratory failure on admission | 2,235 (4.0%) | 1,198 (4.2%) | 948 (6.4%) |
| Previous hospitalization | 19,560 (34.9%) | 10,155 (35.7%) | 5,925 (39.9%) |
| Hospitalization billed as an emergency admission[38] | 30,116 (53.8%) | 15,445 (54.3%) | 11,272 (75.8%) |
| Admitted to medicine service | 29,472 (52.6%) | 16,260 (57.2%) | 11,870 (79.8%) |
| Heart failure at the time of admission | 7,558 (13.5%) | 4,046 (14.2%) | 2,492 (16.8%) |
| Injury such as fractures or trauma at the time of admission | 7,007 (12.5%) | 3,612 (12.7%) | 2,205 (14.8%) |
| Sepsis at the time of admission | 2,278 (4.1%) | 1,025 (3.6%) | 850 (5.7%) |
| Current or past atrial fibrillation | 8,329 (14.9%) | 4,657 (16.4%) | 2,533 (17.0%) |
| Current or past metastatic cancer | 2,216 (4.0%) | 1,109 (3.9%) | 428 (2.9%) |
| Current or past cancer without metastases | 5,260 (9.34%) | 2,668 (9.4%) | 1,248 (8.4%) |
| Current or past history of leukemia or lymphoma | 1,025 (1.8%) | 526 (1.9%) | 278 (1.9%) |
| Current or past cognitive deficiency | 3,708 (6.6%) | 1,973 (6.9%) | 2,728 (18.4%) |
| Current or past history of other neurological conditions (such as Parkinson's disease, multiple sclerosis, epilepsy, coma, stupor, brain damage) | 4,671 (8.3%) | 2,537 (8.9%) | 1,606 (10.8%) |
| Maximum serum blood urea nitrogen (mg/dL), continuous | 21.9 (15.1) | 21.8 (15.1) | 25.9 (18.2) |
| Maximum white blood count (1,000/UL), continuous | 2.99 (4.00) | 3.10 (4.12) | 3.15 (3.81) |
| Minimum platelet count (1,000/UL), continuous | 240.5 (85.5) | 228.0 (79.6) | 220.0 (78.6) |
| Minimum hemoglobin (g/dL), continuous | 12.3 (1.83) | 12.3 (1.9) | 12.1 (1.9) |
| Minimum serum albumin (g/dL) <3.14, binary indicator | 11,032 (19.7%) | 3,848 (13.53%) | 2,235 (15.0%) |
| Minimum arterial pH <7.3, binary indicator | 1,095 (2.0%) | 473 (1.7%) | 308 (2.1%) |
| Minimum arterial pO2 (mm Hg) <85, binary indicator | 1,827 (3.3%) | 747 (2.6%) | 471 (3.2%) |
| Maximum serum troponin (ng/mL) >0.4, binary indicator | 6,268 (11.2%) | 1,154 (4.1%) | 2,312 (15.6%) |
| Maximum serum lactate (mEq/L) >4.0, binary indicator | 533 (1.0%) | 372 (1.3%) | 106 (0.7%) |
| Outcomes of interest | |||
| 30‐day mortalityprimary outcome of interest | 2,775 (5.0%) | 1,412 (5.0%) | 1,193 (8.0%) |
| In‐hospital mortality | 1,392 (2.5%) | 636 (2.2%) | 467 (3.1%) |
| 180‐day mortality (deaths/first hospitalization for patient that year) | 2,928/38,995 (7.5%) | 1,657/21,377 (7.8%) | 1,180/10,447 (11.3%) |
| Unplanned transfer to ICU within first 24 hours/number of patients with data not admitted to ICU | 434/46,647 (0.9%) | 276/25,920 (1.1%) | NA |
| Ever in ICU during hospitalization/those with ICU information available | 5,906/55,998 (10.6%) | 3,191/28,429 (11.2%) | 642/14,848 (4.32%) |
| Any complication | 6,768 (12.1%) | 2,447 (8.6%) | 868 (5.8%) |
| Cardiopulmonary arrest | 228 (0.4%) | 151 (0.5%) | NA |
| Patients discharged with palliative care V code | 1,151 (2.1%) | 962 (3.4%) | 340 (2.3%) |
| 30‐day rehospitalization/patients discharged alive | 6,616/54,606 (12.1%) | 3,602/27,793 (13.0%) | 2,002/14,381 (13.9%) |
Predicting 30‐Day Mortality
The areas under the ROC (95% confidence interval [CI]) for the D1, V1, and V2 populations were 0.876 (95% CI, 0.870‐0.882), 0.885 (95% CI, 0.877‐0.893), and 0.883 (95% CI, 0.875‐0.892), respectively. The calibration curves for all 3 populations are shown in Figure 1. The overlap of symbols indicates that the level of predicted risk matched actual mortality for most intervals, with slight underprediction for those in the highest risk percentiles.
Example of Risk Strata
Figure 2 displays the relationship between the predicted probability of dying within 30 days and the outcomes of interest for V1, and illustrates the Pareto principle for defining high‐ and low‐risk subgroups. Most of the 30‐day deaths (74.7% of D1, 74.2% of V1, and 85.3% of V2) occurred in the small subset of patients with a predicted probability of death exceeding 0.067 (the top quintile of risk of D1, the top 18 % of V1, and the top 29.8% of V2). In contrast, the mortality rate for those with a predicted risk of 0.0033 was 0.02% for the lowest quintile of risk in D1, 0.07% for the 19.3% having the lowest risk in V1, and 0% for the 9.7% of patients with the lowest risk in V2. Figure 3 indicates that the risk for dying peaks within the first few days of the hospitalization. Moreover, those in the high‐risk group remained at elevated risk relative to the lower risk strata for at least 100 days.
Relationships With Other Outcomes of Interest
The graphical curves of Figure 2 represent the occurrence of adverse events. The rising slopes indicate the risk for other events increases with the risk of dying within 30 days (for details and data for D1 and V2, see the Supporting Information, Appendix II, in the online version of this article). The strength of these relationships is quantified by the areas under the ROC curve (Table 2). The probability of 30‐day mortality strongly predicted the occurrence of in‐hospital death, palliative care status, and death within 180 days; modestly predicted having an unplanned transfer to an ICU within the first 24 hours of the hospitalization and undergoing resuscitative efforts for cardiopulmonary arrest; and weakly predicted intensive care unit use at some point in the hospitalization, occurrence of a condition not present on admission (complication), and being rehospitalized within 30 days
| Outcome | Hospital A | Hospital V2 | |
|---|---|---|---|
| D1Derivation | V1Validation | V2Validation | |
| |||
| Unplanned transfer to an ICU within the first 24 hours (for those not admitted to an ICU) | 0.712 (0.690‐0.734) | 0.735 (0.709‐0.761) | NA |
| Resuscitation efforts for cardiopulmonary arrest | 0.709 (0.678‐0.739) | 0.737 (0.700‐0.775) | NA |
| ICU stay at some point during the hospitalization | 0.659 (0.652‐0.666) | 0.663 (0.654‐0.672) | 0.702 (0.682‐0.722) |
| Intrahospital complication (condition not present on admission) | 0.682 (0.676‐0.689) | 0.624 (0.613‐0.635) | 0.646 (0.628‐0.664) |
| Palliative care status | 0.883 (0.875‐0.891) | 0.887 (0.878‐0.896) | 0.900 (0.888‐0.912) |
| Death within hospitalization | 0.861 (0.852‐0.870) | 0.875 (0.862‐0.887) | 0.880 (0.866‐0.893) |
| 30‐day readmission | 0.685 (0.679‐0.692) | 0.685 (0.676‐0.694) | 0.677 (0.665‐0.689) |
| Death within 180 days | 0.890 (0.885‐0.896) | 0.889 (0.882‐0.896) | 0.873 (0.864‐0.883) |
DISCUSSION
The primary contribution of our work concerns the number and strength of associations between the probability of dying within 30 days and other events, and the implications for organizing the healthcare delivery model. We also add to the growing evidence that death within 30 days can be accurately predicted at the time of admission from demographic information, modest levels of diagnostic information, and clinical laboratory values. We developed a new prediction rule with excellent accuracy that compares well to a rule recently developed by the Kaiser Permanente system.[13, 14] Feasibility considerations are likely to be the ultimate determinant of which prediction rule a health system chooses.[13, 14, 29] An independent evaluation of the candidate rules applied to the same data is required to compare their accuracy.
These results suggest a context for the coordination of clinical care processes, although mortality risk is not the only domain health systems must address. For illustrative purposes, we will refer to the risk strata shown in Figure 2. After the decisions to admit the patient to the hospital and whether or not surgical intervention is needed, the next decision concerns the level and type of nursing care needed.[10] Recent studies continue to show challenges both with unplanned transfers to intensive care units[21] and care delivered that is consistently concordant with patient wishes.[6, 30] The level of risk for multiple adverse outcomes suggests stratum 1 patients would be the priority group for perfecting the placement and preference assessment process. Our institution is currently piloting an internal placement guideline recommending that nonpalliative patients in the top 2.5 percentile of mortality risk be placed initially in either an intensive or intermediate care unit to receive the potential benefit of higher nursing staffing levels.[31] However, mortality risk cannot be the only criterion used for placement, as demonstrated by its relatively weak association with overall ICU utilization. Our findings may reflect the role of unmeasured factors such as the need for mechanical ventilation, patient preference for comfort care, bed availability, change in patient condition after admission, and inconsistent application of admission criteria.[17, 21, 32, 33, 34]
After the placement decision, the team could decide if the usual level of monitoring, physician rounding, and care coordination would be adequate for the level of risk or whether an additional anticipatory approach is needed. The weak relationship between the risk of death and incidence of complications, although not a new finding,[35, 36] suggests routine surveillance activities need to be conducted on all patients regardless of risk to detect a complication, but that a rescue plan be developed in advance for high mortality risk patients, for example strata 1 and 2, in the event they should develop a complication.[36] Inclusion of the patient's risk strata as part of the routine hand‐off communication among hospitalists, nurses, and other team members could provide a succinct common alert for the likelihood of adverse events.
The 30‐day mortality risk also informs the transition care plan following hospitalization, given the strong association with death in 180 days and the persistent level of this risk (Figure 3). Again, communication of the risk status (stratum 1) to the team caring for the patient after the hospitalization provides a common reference for prognosis and level of attention needed. However, the prediction accuracy is not sufficient to refer high‐risk patients into hospice, but rather, to identify the high‐risk subset having the most urgent need to have their preferences for future end‐of‐life care understood and addressed. The weak relationship of mortality risk with 30‐day readmissions indicates that our rule would have a limited role in identifying readmission risk per se. Others have noted the difficulty in accurately predicting readmissions, most likely because the underlying causes are multifactorial.[37] Our results suggest that 1 dynamic for readmission is the risk of dying, and so the underlying causes of this risk should be addressed in the transition plan.
There are a number of limitations with our study. First, this rule was developed and validated on data from only 2 institutions, assembled retrospectively, with diagnostic information determined from administrative data. One cannot assume the accuracy will carry over to other institutions[29] or when there is diagnostic uncertainty at the time of admission. Second, the 30‐day mortality risk should not be used as the sole criterion for determining the service intensity for individual patients because of issues with calibration, interpretation of risk, and confounding. The calibration curves (Figure 2) show the slight underprediction of the risk of dying for high‐risk groups. Other studies have also noted problems with precise calibration in validation datasets.[13, 14] Caution is also needed in the interpretation of what it means to be at high risk. Most patients in stratum 1 were alive at 30 days; therefore, being at high risk is not a death sentence. Furthermore, the relative weights of the risk factors reflect (ie, are confounded by) the level of treatment rendered. Some deaths within the higher‐risk percentiles undoubtedly occurred in patients choosing a palliative rather than a curative approach, perhaps partially explaining the slight underprediction of deaths. Conversely, the low mortality experienced by patients within the lower‐risk strata may indicate the treatment provided was effective. Low mortality risk does not imply less care is needed.
A third limitation is that we have not defined the thresholds of risk that should trigger placement and care intensity, although we provide examples on how this could be done. Each institution will need to calibrate the thresholds and associated decision‐making processes according to its own environment.[14] Interested readers can explore the sensitivity and specificity of various thresholds\ by using the tables in the Appendix (see the Supporting information, Appendix II, in the online version of this article). Finally, we do not know if identifying the mortality risk on admission will lead to better outcomes[19, 29]
CONCLUSIONS
Death within 30 days can be predicted with information known at the time of admission, and is associated with the risk of having other adverse events. We believe the probability of death can be used to define strata of risk that provide a succinct common reference point for the multidisciplinary team to anticipate the clinical course of subsets of patients and intervene with proportional intensity.
Acknowledgments
This work benefited from multiple conversations with Patricia Posa, RN, MSA, Elizabeth Van Hoek, MHSA, and the Redesigning Care Task Force of St. Joseph Mercy Hospital, Ann Arbor, Michigan.
Disclosure: Nothing to report.
- , , , et al. Importance of time to reperfusion for 30‐day and late survival and recovery of left ventricular function after primary angioplasty for acute myocardial infarction. J Am Coll Cardiol. 1998;32:1312–1319.
- , , , et al. Early goal‐directed therapy in the treatment of severe sepsis and septic shock. N Engl J Med. 2001;345:1368–1377.
- ATLANTIS, ECASS, NINDS rt‐PA Study Group Investigators. Association of outcome with early stroke treatment: pooled analysis of ATLANTIS, ECASS, and NINDS rt‐PA stroke trials. Lancet. 2004;363:768–774.
- , , , et al. Handoffs causing patient harm: a survey of medical and surgical house staff. Jt Comm J Qual Patient Saf. 2008;34:563–570.
- National Hospice and Palliative Care Organization. NHPCO facts and figures: hospice care in America 2010 Edition. Available at: http://www.nhpco.org. Accessed October 3,2011.
- , , , , . End‐of‐life discussions, goal attainment, and distress at the end of life: predictors and outcomes of receipt of care consistent with preferences. J Clin Oncol. 2010;28:1203–1208.
- Committee on Quality of Health Care in America, Institute of Medicine (IOM).Crossing the Quality Chasm: A New Health System for the 21st Century.Washington, DC:National Academies Press;2001.
- , , , et al. The surviving sepsis campaign: results of an international guideline‐based performance improvement program targeting severe sepsis. Intensive Care Med. 2010;36:222–231.
- , , , et al. A prediction rule to identify low‐risk patients with community‐acquired pneumonia. N Engl J Med. 1997;336:243–250.
- , . The simple clinical score predicts mortality for 30 days after admission to an acute medical unit. Q J Med. 2006;99:771–781.
- , , , et al. Enhancement of claims data to improve risk adjustment of hospital mortality. JAMA. 2007;297:71–76.
- , , . Using automated clinical data for risk adjustment. Med Care. 2007;45:789–805.
- , , , , , . Risk‐adjusting hospital inpatient mortality using automated inpatient, outpatient, and laboratory databases. Med Care. 2008;46:232–239.
- , , , . The Kaiser Permanente inpatient risk adjustment methodology was valid in an external patient population. J Clin Epidemiol. 2010;63:798–803.
- , , , , . An improved medical admissions risk system using multivariable fractional polynomial logistic regression modeling. Q J Med. 2010;103:23–32.
- , , , , . Risk scoring systems for adults admitted to the emergency department: a systematic review. Scand J Trauma Resusc Emerg Med. 2010;18:8.
- , , , , . Derivation and validation of a model to predict daily risk of death in hospital. Med Care. 2011;49:734–743.
- , , , . Prediction of hospital mortality from admission laboratory data and patient age: a simple model. Emerg Med Australas. 2011;23:354–363.
- , , . Predicting death: an empirical evaluation of predictive tools for mortality. Arch Intern Med. 2011;171:1721–1726.
- , , , . Length of stay predictions: improvements through the use of automated laboratory and comorbidity variables. Med Care. 2010;48:739–744.
- , , , , , . Intra‐hospital transfers to a higher level of care: contribution to total hospital and intensive care unit (ICU) mortality and length of stay (LOS). J Hosp Med. 2011;6:74–80.
- , , , et al. An automated model to identify heart failure patients at risk for 30‐day readmission or death using electronic medical record data. Med Care. 2010;48:981–988.
- , , , , , . Mortality trends during a program that publicly reported hospital performance. Med Care. 2002;40:879–890.
- , . Classification and regression by randomForest. R News. 2002;2:18–22.
- , , . Model‐based recursive partitioning. J Comput Graph Stat. 2008;17:492–514.
- , , , .Classification and Regression Trees.Belmont, CA:Wadsworth Inc.,1984.
- , , , , . Evaluating the yield of medical tests. JAMA. 1982;247:2543–2546.
- , , , . Risk stratification and therapeutic decision making in acute coronary syndromes. JAMA. 2000;284:876–878.
- , . Why is a good clinical prediction rule so hard to find?Arch Intern Med. 2011;171:1701–1702.
- , , . Advance directives and outcomes of surrogate decision making before death. N Engl J Med. 2010;362:1211–1218.
- , , , , , . Nurse staffing and inpatient hospital mortality. N Engl J Med. 2011;364:1037–1045.
- , , , et al. Survival of critically ill patients hospitalized in and out of intensive care. Crit Care Med. 2007;35:449–457.
- , , . How decisions are made to admit patients to medical intensive care units (MICUs): a survey of MICU directors at academic medical centers across the United States. Crit Care Med. 2008;36:414–420.
- , . Rethinking rapid response teams. JAMA. 2010;204:1375–1376.
- , , , . Hospital and patient characteristics associated with death after surgery: a study of adverse occurrence and failure to rescue. Med Care. 1992;30:615–629.
- , , . Variation in hospital mortality associated with inpatient surgery. N Engl J Med. 2009;361:1368–1375.
- , , , et al. Risk prediction models for hospital readmission: a systematic review. JAMA. 2011;306:1688–1698.
- Department of Health and Human Services, Centers for Medicare and Medicaid Services, CMS Manual System, Pub 100–04 Medicare Claims Processing, November 3, 2006. Available at: http://www. cms.gov/Regulations‐and‐Guidance/Guidance/Transmittals/Downloads/R1104CP.pdf. Accessed September 5,2012.
Copyright © 2012 Society of Hospital Medicine
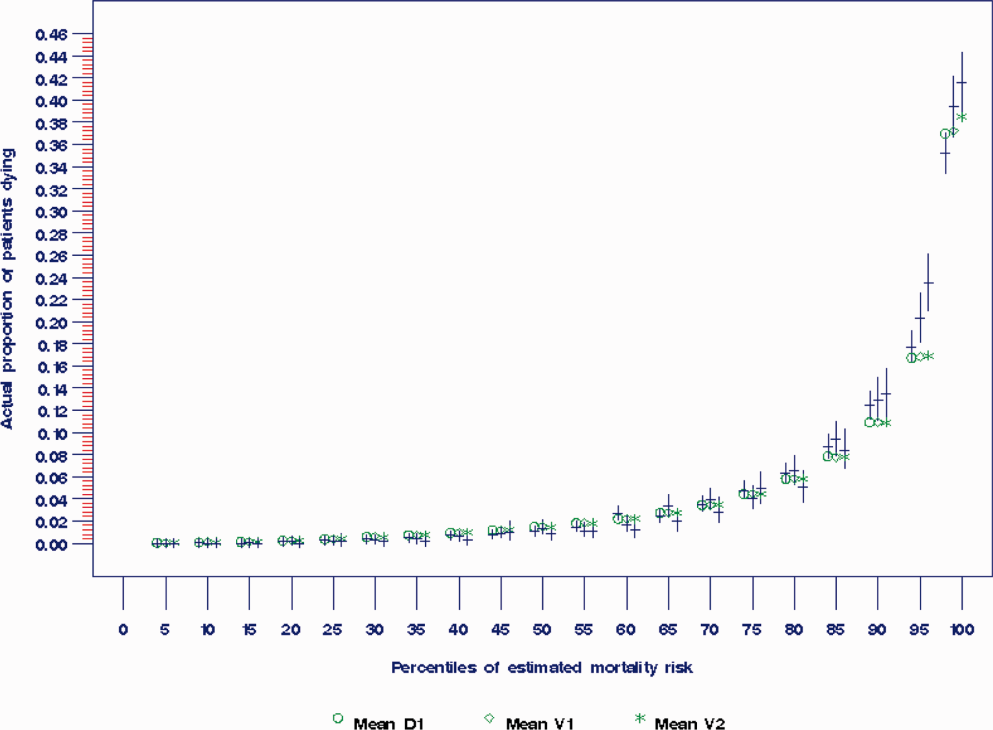
Hospitals and Recession
With the United States mired in its most severe recession in decades, stories of hospital struggles have emerged. Beaumont Hospital, located near the headquarters of major automakers and several assembly plants outside Detroit, recently cut hundreds of jobs and put major construction on indefinite hold.1 The CEO of Boston's Beth Israel Deaconess Medical Center made an agreement with employees to take large cuts in pay and vacation time to prevent laying off 10% of the staff.2 The University of Chicago Medical Center made plans to limit the number of emergency room beds, thereby decreasing low‐reimbursing emergency admissions while making beds available for higher‐paying elective hospitalizations.3
What is surprising about these stories is that hospitals have long been considered recession‐proof. Yet, with one‐half of US hospitals having reduced their staff to balance their budgets4 and with hospitals' financial margins falling dramatically,5 economic struggles are now a widespread problem.
Furthermore, it is difficult to determine if hospitals' clinical care has been damaged by the recession. The measurement of hospital quality is new and still under‐developed: there is virtually no reliable information on hospital quality from previous recessions, and even now it will be difficult to assess quality in real time.
Critics of waste and excess in the US health care system may see tough economic times as a Darwinian proving ground for hospitals, through which efficiency will improve and poor performers will close their doors. But more likely, hospital cutbacks will risk the quality and safety of health care delivery. For reasons of both public health and fiscal impact on communities, state and federal leaders may need to watch these trends closely to design and to be ready to implement potential government remedies for hospitals' fiscal woes.
In this commentary, we describe how hospitals have fared historically during recessions, how this recession could have different effectsfirst fiscally, then clinically, and we examine policy options to mitigate these untoward effects.
Decades of Recession‐Proof Hospitals
During the Great Depression, hospital insolvency was a national problem that prompted federal and state aid. Keeping hospitals alive was a critical policy goal and proved central to the early development of health insurance that focused on payment for hospital care.6
Since WWII, growth in America's hospitals has been only loosely related to national macroeconomic trends, with other changes like technological innovations and the advent of managed care far more influential to hospital finances. In fact, during recessions, hospital care spending growth often escalates in tandem with worsening unemployment (Figure 1). One explanation for this phenomenon is that economic pressures lead to declining primary care utilization, with adverse consequences for individuals' health.7

Hospitals' Current Fiscal Vulnerability
However, the current recession is the worst in 70 years. Every method of income generation available to hospitals appears at risk, including reimbursement per discharge (70% of hospitals report moderate or significant increases in uncompensated care), number of inpatient admissions (over one‐half report a moderate or significant decrease), difficulty obtaining bonds (60% report at least significant problems), and charitable donations.4 Over 50% of US hospitals had negative margins in the fourth quarter of 2008, though there has been some improvement since that time.8
Future hospital stability concerns remain. Growth in revenue per discharge is still below the norm.5 Because employment lags a recovering economy, further reimbursement decreases are possible from increasing proportions of patients with low‐reimbursing insurers or no coverage at all, decreasing payment rates from all payers, and decreasing elective care. The lower‐reimbursing payers, like state Medicaid programs, are experiencing increased enrollment as Americans lose their jobs and their better‐paying, employer‐sponsored private insurance.9 There's also evidence that reimbursement rates are declining from both Medicare and private insurers,10 which threatens the fragile cost‐shift through which hospitals have long used private insurance reimbursement to subsidize government reimbursements.11
Hospitals' specific financial challenges will likely vary across markets. The authors' state of Michigan has been hit particularly long and hard by the current recession. Unemployment rates exceeding 11% are expected to cause dramatic losses in private health insurance.9 Patients' increasing need with decreasing ability to pay will make markets in the deepest recession particularly vulnerable.
Hospital Quality and Safety at Risk?
The effect of the recession on the quality of hospital care is less clear. Until the 1990s, hospital quality was essentially assumed and virtually unmeasured. Even now, measuring hospital quality is difficult and rarely timely. Medicare data often take 1 to 2 years to become publicly available for analysis. Reports by trade organizations like the American Hospital Association are up‐to‐date but have conflicts of interest and are less rigorous. The most timely measures of hospitals' distressflawed as they may bewill come from the hospitals themselves, just like reports of economic woe from other businesses and government agencies during challenging economic times.
However, since the publication of the 1999 report To Err is Human,12 major improvements in hospital quality and safety have transformed the delivery of inpatient care. These improvements have taken the form of simple interventions like nationally consistent medical abbreviations, management initiatives like Six Sigma, and technological advances including computerized health records.
Nonetheless, during this recession and recovery, slashed hospital budgets may slow or even stop the momentum towards further improvements in quality and safety. Frontline care delivery could be at risk. Understaffed and under financed hospitals are rarely safe. Dissatisfaction and layoffs hurt the interactions between employees and patients. Robust nurse‐to‐patient ratios which have proven vital to patients' hospital outcomes could be at risk.13 Admittedly, recession‐induced threats to quality and safety are conjectures on our part: unfortunately, no recession measures of hospitals' specific spending on staffing, technology, or process improvements exist.
However, there are many small, evidence‐based changes that could improve hospital safety dramatically in the near future. Michigan's Keystone ICU Initiative showed that systematic interventions in routine care delivery could reduce the risk of catheter‐related bloodstream infections, which currently are implicated in the death of 28,000 Americans per year, to nearly zero.14 The Institute for Healthcare Improvement's 100,000 Lives Campaign also illustrated that dramatic improvements in hospital‐related mortality can occur with fairly focused interventions. In the month after discharge, more than one‐quarter of all hospitalized patients go to an emergency room or need to be rehospitalized. This rate can be cut by 30% by inserting a nurse discharge advocate into the discharge process.15 Instituting a simple safety checklist before surgery decreased surgery‐related mortality and complications by over one‐third.16
Such interventions are effective, reasonable, and widely accessible. Over the long‐term, many may even be cost‐saving. But, importantly, they all require an institutional investment in start‐up money and an organizational will to change how things have been done. In a period of recession with severe cost‐cutting, and a recovery period of cautious spending, this may not be possible.
A Possible Stimulus: Investing in Quality Initiatives at Fiscally Vulnerable Hospitals
It is not enough to keep hospitals' doors open in a recession. Hospitals must continue to improve the quality and safety of the care they delivervital for their future patients and also for their communities who depend on them as anchors of health systems. We believe there is a need for a new, federally supported alignment of hospital finance and hospital quality that can limit damage to hospitals, help community employment, and improve patient safety.
Timely, structural quality measures could speed the introduction of functional value‐based purchasing, promote hospital safety, and help local economies at the same time. There are many simple structural measures that could be examined, such as development of discharge coordinators, promoting effective nurse‐to‐patient ratios, and encouraging health information technology (IT). Importantly, this would not duplicate efforts already underway to promote quality with process measures. With effective financial monitoring in real time, these measures could focus on high‐risk, fiscally disadvantaged hospitals.
To its credit, the Obama administration has already reached out to support hospitals, although aid has not been targeted specifically to hospitals in the most dire financial circumstances. Along with support for Medicaid and community health centers to improve primary care during the recession, the administration has provided a $268 million increase in Disproportionate Share Hospital payments towards hospitals that care for vulnerable patients, an increase of about 3%.17 Concurrently, the Centers for Medicare and Medicaid Services are implementing a value‐based purchasing program that starts with a 5% withhold in reimbursement that institutions need to earn back through a combination of mortality, process, and patient satisfaction metrics.18 The administration also reserved $19 billion to promote improvement of health IT for American medicine.19
Using health IT investment to help hospitals is an appealing concept, but for many institutions the infrastructure required to make that transition directly competes with other patient needs, including bedside patient care. IT investments have large initial costs, at a time when bank loans are difficult to acquire and few organizations can make expensive capital improvements. In fact, one‐quarter of hospitals report scaling back health IT investments that they had already started, in spite of the stimulus funds available.4
Instead, the administration may have more influence on improving care delivery by focusing on connecting hospital safety with hospital financial stability, by appropriating stimulus funds to center on quality and safety programs like those described above. Here is how: a hospital that would receive stimulus money for employing nurse discharge advocates would preserve employment while advancing patient safety, as would a hospital that retains a nurse‐to‐patient ratio above a specified threshold. By focusing on measures of structural quality, the government could improve care in ways that are easy to measure and maximize local economic stimulus without difficult outcomes assessment, insurance reform, or duplicating process measure efforts. There could even be an innovation differential (ie, payment/reward) for hospitals that improve quality while holding flat or lowering overall costs.
Equally important is to use this national financial crisis as an opportunity to improve monitoring of hospital quality. While quality assessment of hospitals is difficult, increased federal awareness of local medical need, hospital financial stability, and government awareness of emergency services overcrowding, nurse‐to‐patient ratios, and IT utilization are all valuable and easy to measure.
None of these quality‐focused fiscal interventions would be guaranteed to prevent hospital closure. Especially in small population centers, hospital closures can affect an entire community's financial growth and clinical safety net,20 while leaving hundreds or even thousands unemployed. Hospital closure should be assessed by state and federal government officials in these larger terms, perhaps even encouraging closure when appropriate, and helping prevent it when necessary.
Conclusion
Hospitals, as complex pieces of America's health care system, are central to communities' safety and economic growth. While national health coverage reform, as currently being discussed in Washington, would make hospital infrastructure less sensitive to macroeconomic changes, major reform would not come fast enough if hospitals start closing. While the worst of the recession may be over, recovery and the continuing rise in unemployment is a tenuous lifeline for hospitals on the financial brink.
We are not arguing against all hospital layoffs, or even closures. Indeed, this recession is a lean time for most industries and is likely to lead to closures for hospitals that cannot compete on efficiency or quality. But a hospital closure is a major event for a community and should not be permitted to occur without thorough consideration of alternatives. Current data on hospitals' financial status and clinical safety are limited, potentially biased, and not timely enough for this rapidly changing economic crisis. Therefore, state and federal government officials should assess whether hospitals would be eligible not just for possible emergency loans, but for linking loans to quality of care and community need. In so doing, this difficult time could be an opportunity to help hospitals improve their care, rather than watching it diminish.
- Michigan's Health Care Safety Net: In Jeopardy.2009.
- .Final budget decisions.Running A Hospital. Vol 2009.Boston, MA;2009.
- .Doctors Plan to Limit Beds in ER.Wall Street Journal.2009.
- The Impact of the Economic Crisis on Health Services for Patients and Communities.Washington, DC2009.
- ,.Hospital Operational and Financial Performance Improving.Ann Arbor, MI:Thomson Reuters Center for Healthcare Improvement.2009.
- .The Social Transformation of American Medicine.New York, NY:Basic Books;1983.
- AAFP.Patient Care during the 2008‐2009 Recession – Online Survey.Leawood, KS:AAFP.2009.
- The Impact of the Economic Crisis on Health Services for Patients and Communities.Washington, D.C.:American Hospital Association.2009.
- The economic downturn and its impact on hospitals. American Hospital Association Trendwatch.2009.
- ,,.The Current Recession and U.S. Hospitals:Center for Healthcare Improvement.2009.
- ,,.The cost‐shift payment ‘hydraulic’: foundation, history, and implications.Health Aff (Millwood).2006;25(1):22–33.
- ,.To Err Is Human: Building a Safer Health System.Washington, DC:National Academy Press;1999.
- ,,,,.Nurse‐staffing levels and the quality of care in hospitals.N Engl J Med.2002;346(22):1715–1722.
- ,,, et al.An intervention to decrease catheter‐related bloodstream infections in the ICU.N Engl J Med.2006;355(26):2725–2732.
- ,,, et al.A reengineered hospital discharge program to decrease rehospitalization: a randomized trial.Ann Intern Med.2009;150(3):178–187.
- ,,, et al.A surgical safety checklist to reduce morbidity and mortality in a global population.N Engl J Med.2009;360(5):491–499.
- Disproportionate Share Hospital (DSH). Available at: http://www.hhs. gov/recovery/cms/dsh.html. Accessed December 2009.
- ,,.Measuring outcomes and efficiency in medicare value‐based purchasing.Health Aff (Millwood).2009;28(2):w251–w261.
- .Stimulating the adoption of health information technology.N Engl J Med.2009;360(15):1477–1479.
- ,,,.The effect of rural hospital closures on community economic health.Health Serv Res.2006;41(2):467–485.
With the United States mired in its most severe recession in decades, stories of hospital struggles have emerged. Beaumont Hospital, located near the headquarters of major automakers and several assembly plants outside Detroit, recently cut hundreds of jobs and put major construction on indefinite hold.1 The CEO of Boston's Beth Israel Deaconess Medical Center made an agreement with employees to take large cuts in pay and vacation time to prevent laying off 10% of the staff.2 The University of Chicago Medical Center made plans to limit the number of emergency room beds, thereby decreasing low‐reimbursing emergency admissions while making beds available for higher‐paying elective hospitalizations.3
What is surprising about these stories is that hospitals have long been considered recession‐proof. Yet, with one‐half of US hospitals having reduced their staff to balance their budgets4 and with hospitals' financial margins falling dramatically,5 economic struggles are now a widespread problem.
Furthermore, it is difficult to determine if hospitals' clinical care has been damaged by the recession. The measurement of hospital quality is new and still under‐developed: there is virtually no reliable information on hospital quality from previous recessions, and even now it will be difficult to assess quality in real time.
Critics of waste and excess in the US health care system may see tough economic times as a Darwinian proving ground for hospitals, through which efficiency will improve and poor performers will close their doors. But more likely, hospital cutbacks will risk the quality and safety of health care delivery. For reasons of both public health and fiscal impact on communities, state and federal leaders may need to watch these trends closely to design and to be ready to implement potential government remedies for hospitals' fiscal woes.
In this commentary, we describe how hospitals have fared historically during recessions, how this recession could have different effectsfirst fiscally, then clinically, and we examine policy options to mitigate these untoward effects.
Decades of Recession‐Proof Hospitals
During the Great Depression, hospital insolvency was a national problem that prompted federal and state aid. Keeping hospitals alive was a critical policy goal and proved central to the early development of health insurance that focused on payment for hospital care.6
Since WWII, growth in America's hospitals has been only loosely related to national macroeconomic trends, with other changes like technological innovations and the advent of managed care far more influential to hospital finances. In fact, during recessions, hospital care spending growth often escalates in tandem with worsening unemployment (Figure 1). One explanation for this phenomenon is that economic pressures lead to declining primary care utilization, with adverse consequences for individuals' health.7
Hospitals' Current Fiscal Vulnerability
However, the current recession is the worst in 70 years. Every method of income generation available to hospitals appears at risk, including reimbursement per discharge (70% of hospitals report moderate or significant increases in uncompensated care), number of inpatient admissions (over one‐half report a moderate or significant decrease), difficulty obtaining bonds (60% report at least significant problems), and charitable donations.4 Over 50% of US hospitals had negative margins in the fourth quarter of 2008, though there has been some improvement since that time.8
Future hospital stability concerns remain. Growth in revenue per discharge is still below the norm.5 Because employment lags a recovering economy, further reimbursement decreases are possible from increasing proportions of patients with low‐reimbursing insurers or no coverage at all, decreasing payment rates from all payers, and decreasing elective care. The lower‐reimbursing payers, like state Medicaid programs, are experiencing increased enrollment as Americans lose their jobs and their better‐paying, employer‐sponsored private insurance.9 There's also evidence that reimbursement rates are declining from both Medicare and private insurers,10 which threatens the fragile cost‐shift through which hospitals have long used private insurance reimbursement to subsidize government reimbursements.11
Hospitals' specific financial challenges will likely vary across markets. The authors' state of Michigan has been hit particularly long and hard by the current recession. Unemployment rates exceeding 11% are expected to cause dramatic losses in private health insurance.9 Patients' increasing need with decreasing ability to pay will make markets in the deepest recession particularly vulnerable.
Hospital Quality and Safety at Risk?
The effect of the recession on the quality of hospital care is less clear. Until the 1990s, hospital quality was essentially assumed and virtually unmeasured. Even now, measuring hospital quality is difficult and rarely timely. Medicare data often take 1 to 2 years to become publicly available for analysis. Reports by trade organizations like the American Hospital Association are up‐to‐date but have conflicts of interest and are less rigorous. The most timely measures of hospitals' distressflawed as they may bewill come from the hospitals themselves, just like reports of economic woe from other businesses and government agencies during challenging economic times.
However, since the publication of the 1999 report To Err is Human,12 major improvements in hospital quality and safety have transformed the delivery of inpatient care. These improvements have taken the form of simple interventions like nationally consistent medical abbreviations, management initiatives like Six Sigma, and technological advances including computerized health records.
Nonetheless, during this recession and recovery, slashed hospital budgets may slow or even stop the momentum towards further improvements in quality and safety. Frontline care delivery could be at risk. Understaffed and under financed hospitals are rarely safe. Dissatisfaction and layoffs hurt the interactions between employees and patients. Robust nurse‐to‐patient ratios which have proven vital to patients' hospital outcomes could be at risk.13 Admittedly, recession‐induced threats to quality and safety are conjectures on our part: unfortunately, no recession measures of hospitals' specific spending on staffing, technology, or process improvements exist.
However, there are many small, evidence‐based changes that could improve hospital safety dramatically in the near future. Michigan's Keystone ICU Initiative showed that systematic interventions in routine care delivery could reduce the risk of catheter‐related bloodstream infections, which currently are implicated in the death of 28,000 Americans per year, to nearly zero.14 The Institute for Healthcare Improvement's 100,000 Lives Campaign also illustrated that dramatic improvements in hospital‐related mortality can occur with fairly focused interventions. In the month after discharge, more than one‐quarter of all hospitalized patients go to an emergency room or need to be rehospitalized. This rate can be cut by 30% by inserting a nurse discharge advocate into the discharge process.15 Instituting a simple safety checklist before surgery decreased surgery‐related mortality and complications by over one‐third.16
Such interventions are effective, reasonable, and widely accessible. Over the long‐term, many may even be cost‐saving. But, importantly, they all require an institutional investment in start‐up money and an organizational will to change how things have been done. In a period of recession with severe cost‐cutting, and a recovery period of cautious spending, this may not be possible.
A Possible Stimulus: Investing in Quality Initiatives at Fiscally Vulnerable Hospitals
It is not enough to keep hospitals' doors open in a recession. Hospitals must continue to improve the quality and safety of the care they delivervital for their future patients and also for their communities who depend on them as anchors of health systems. We believe there is a need for a new, federally supported alignment of hospital finance and hospital quality that can limit damage to hospitals, help community employment, and improve patient safety.
Timely, structural quality measures could speed the introduction of functional value‐based purchasing, promote hospital safety, and help local economies at the same time. There are many simple structural measures that could be examined, such as development of discharge coordinators, promoting effective nurse‐to‐patient ratios, and encouraging health information technology (IT). Importantly, this would not duplicate efforts already underway to promote quality with process measures. With effective financial monitoring in real time, these measures could focus on high‐risk, fiscally disadvantaged hospitals.
To its credit, the Obama administration has already reached out to support hospitals, although aid has not been targeted specifically to hospitals in the most dire financial circumstances. Along with support for Medicaid and community health centers to improve primary care during the recession, the administration has provided a $268 million increase in Disproportionate Share Hospital payments towards hospitals that care for vulnerable patients, an increase of about 3%.17 Concurrently, the Centers for Medicare and Medicaid Services are implementing a value‐based purchasing program that starts with a 5% withhold in reimbursement that institutions need to earn back through a combination of mortality, process, and patient satisfaction metrics.18 The administration also reserved $19 billion to promote improvement of health IT for American medicine.19
Using health IT investment to help hospitals is an appealing concept, but for many institutions the infrastructure required to make that transition directly competes with other patient needs, including bedside patient care. IT investments have large initial costs, at a time when bank loans are difficult to acquire and few organizations can make expensive capital improvements. In fact, one‐quarter of hospitals report scaling back health IT investments that they had already started, in spite of the stimulus funds available.4
Instead, the administration may have more influence on improving care delivery by focusing on connecting hospital safety with hospital financial stability, by appropriating stimulus funds to center on quality and safety programs like those described above. Here is how: a hospital that would receive stimulus money for employing nurse discharge advocates would preserve employment while advancing patient safety, as would a hospital that retains a nurse‐to‐patient ratio above a specified threshold. By focusing on measures of structural quality, the government could improve care in ways that are easy to measure and maximize local economic stimulus without difficult outcomes assessment, insurance reform, or duplicating process measure efforts. There could even be an innovation differential (ie, payment/reward) for hospitals that improve quality while holding flat or lowering overall costs.
Equally important is to use this national financial crisis as an opportunity to improve monitoring of hospital quality. While quality assessment of hospitals is difficult, increased federal awareness of local medical need, hospital financial stability, and government awareness of emergency services overcrowding, nurse‐to‐patient ratios, and IT utilization are all valuable and easy to measure.
None of these quality‐focused fiscal interventions would be guaranteed to prevent hospital closure. Especially in small population centers, hospital closures can affect an entire community's financial growth and clinical safety net,20 while leaving hundreds or even thousands unemployed. Hospital closure should be assessed by state and federal government officials in these larger terms, perhaps even encouraging closure when appropriate, and helping prevent it when necessary.
Conclusion
Hospitals, as complex pieces of America's health care system, are central to communities' safety and economic growth. While national health coverage reform, as currently being discussed in Washington, would make hospital infrastructure less sensitive to macroeconomic changes, major reform would not come fast enough if hospitals start closing. While the worst of the recession may be over, recovery and the continuing rise in unemployment is a tenuous lifeline for hospitals on the financial brink.
We are not arguing against all hospital layoffs, or even closures. Indeed, this recession is a lean time for most industries and is likely to lead to closures for hospitals that cannot compete on efficiency or quality. But a hospital closure is a major event for a community and should not be permitted to occur without thorough consideration of alternatives. Current data on hospitals' financial status and clinical safety are limited, potentially biased, and not timely enough for this rapidly changing economic crisis. Therefore, state and federal government officials should assess whether hospitals would be eligible not just for possible emergency loans, but for linking loans to quality of care and community need. In so doing, this difficult time could be an opportunity to help hospitals improve their care, rather than watching it diminish.
- Michigan's Health Care Safety Net: In Jeopardy.2009.
- .Final budget decisions.Running A Hospital. Vol 2009.Boston, MA;2009.
- .Doctors Plan to Limit Beds in ER.Wall Street Journal.2009.
- The Impact of the Economic Crisis on Health Services for Patients and Communities.Washington, DC2009.
- ,.Hospital Operational and Financial Performance Improving.Ann Arbor, MI:Thomson Reuters Center for Healthcare Improvement.2009.
- .The Social Transformation of American Medicine.New York, NY:Basic Books;1983.
- AAFP.Patient Care during the 2008‐2009 Recession – Online Survey.Leawood, KS:AAFP.2009.
- The Impact of the Economic Crisis on Health Services for Patients and Communities.Washington, D.C.:American Hospital Association.2009.
- The economic downturn and its impact on hospitals. American Hospital Association Trendwatch.2009.
- ,,.The Current Recession and U.S. Hospitals:Center for Healthcare Improvement.2009.
- ,,.The cost‐shift payment ‘hydraulic’: foundation, history, and implications.Health Aff (Millwood).2006;25(1):22–33.
- ,.To Err Is Human: Building a Safer Health System.Washington, DC:National Academy Press;1999.
- ,,,,.Nurse‐staffing levels and the quality of care in hospitals.N Engl J Med.2002;346(22):1715–1722.
- ,,, et al.An intervention to decrease catheter‐related bloodstream infections in the ICU.N Engl J Med.2006;355(26):2725–2732.
- ,,, et al.A reengineered hospital discharge program to decrease rehospitalization: a randomized trial.Ann Intern Med.2009;150(3):178–187.
- ,,, et al.A surgical safety checklist to reduce morbidity and mortality in a global population.N Engl J Med.2009;360(5):491–499.
- Disproportionate Share Hospital (DSH). Available at: http://www.hhs. gov/recovery/cms/dsh.html. Accessed December 2009.
- ,,.Measuring outcomes and efficiency in medicare value‐based purchasing.Health Aff (Millwood).2009;28(2):w251–w261.
- .Stimulating the adoption of health information technology.N Engl J Med.2009;360(15):1477–1479.
- ,,,.The effect of rural hospital closures on community economic health.Health Serv Res.2006;41(2):467–485.
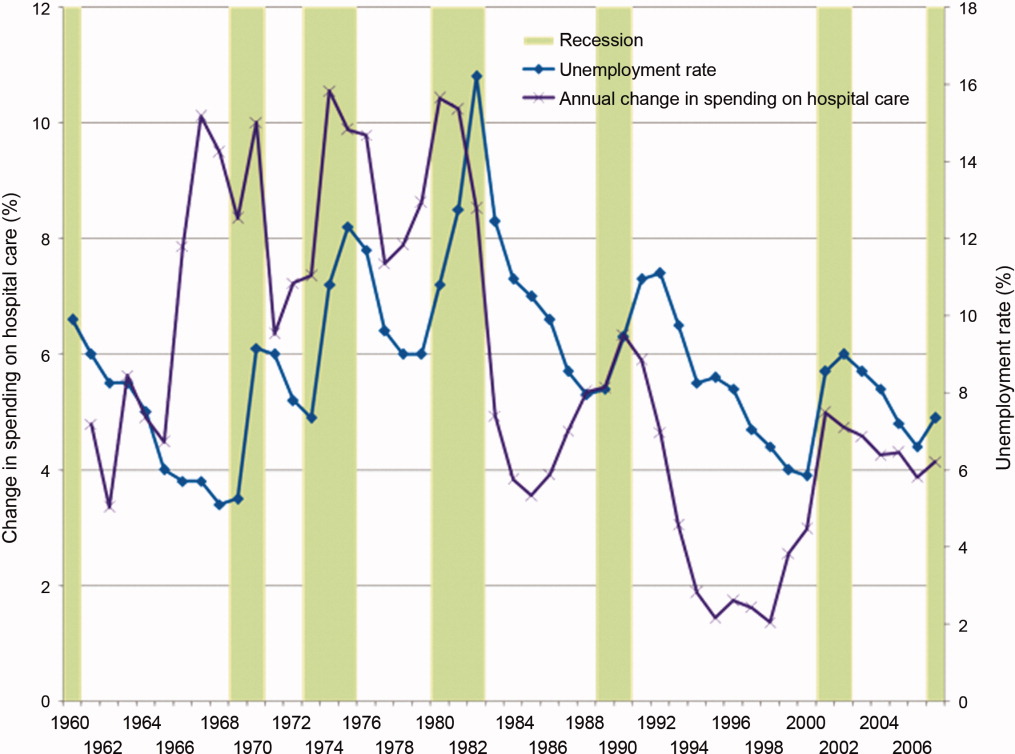
Conflicting Measures of Hospital Quality / Halasyamani and Davis
National concerns about the quality of health care in the United States have prompted calls for transparent efforts to measure and report hospital performance to the public. Consumer groups, payers, and credentialing organizations now rate the quality of hospitals and health care through a variety of mechanisms, yielding a kaleidoscope of quality measurement scorecards. However, health care consumers have minimal information about how hospital quality rating systems compare with each other or which rating system might best address their information needs.
The Hospital Compare Web site was launched in April 2005 by the Hospital Quality Alliance (HQA), a public‐private collaboration among organizations, including the Centers for Medicare and Medicaid Services (CMS). The CMS describes Hospital Compare as information [that] measures how well hospitals care for their patients.1 A limited set of Hospital Compare data from 2004 were posted online in 2005 for more than 4200 hospitals, permitting community‐specific comparisons of hospitals' self‐reported standardized core measures that reflect quality of care for acute myocardial infarction (AMI), congestive heart failure (CHF), and community‐acquired pneumonia (CAP) in adult patients.
Other current hospital quality evaluation tools target payers and purchasers of health care. However, many of these evaluations require that institutions pay a fee for submitting their data to be benchmarked against other participating institutions or require that the requesting individual or organization pay a fee to examine a hospital's performance on a specific condition or procedure.
We examined Hospital Compare data alongside that of another hospital rating system that has existed for a longer period of time and is likely better known to the lay publicthe Best Hospitals lists published annually by U.S. News and World Report.2, 3 Together, Hospital Compare and Best Hospitals are hospital quality scorecards that offer consumers assessments of hospital performance on a national scale. However, their measures of hospital quality differ, and we investigated whether they would provide consumers with concordant assessments of hospital quality.
METHODS
Data Sources
Hospital Compare
Core measure performance data were obtained by the investigators from the Hospital Compare Web site.3 Information in the database was provided by hospitals for the period January‐June 2004. Hospitals self‐reported their performance on the core measures using standardized medical record abstraction programs. The measures reported are cumulative averages based on monthly performance summaries.
Fourteen core measures were used in the study to form 3 core measure sets (Table 1): the AMI set comprised 6 measures, the CHF set comprised 4 measures, and the CAP site comprised 4 measures. Of the 17 core measures available on the Hospital Compare Web site, core measures of timing of thrombolytic agents or percutaneous transluminal coronary angioplasty for patients with AMI were excluded from the analysis because fewer than 10% of institutions reported such measures. Data on the core measure about oxygenation measurement for CAP were also excluded because of minimal variation between hospitals (national mean = 98%; the national mean for all other measures was less than 92%).3
| Condition | Core Measures |
|---|---|
| |
| Acute myocardial infarction (AMI) |
|
| Congestive heart failure (CHF) |
|
| Community‐acquired pneumonia (CAP) |
|
Core measures that CMS defined as having too few cases (< 25) to reliably ascertain an estimate of hospital performance, or for which hospitals were not reporting data, were not eligible for analysis. To generate a composite score for each of the disease‐specific core measure sets, scores for all eligible core measures within each set were summed and then divided by the number of eligible measures available. This permitted standardization of the scores in the majority of instances when institutions did not report all eligible measures within a given set.
Best Hospitals
Ratings of hospitals were drawn from the 2004 and 2005 editions of the Best Hospitals listings of the U.S. News and World Report, the editions that most closely reflect performance data and physician survey data concurrent with Hospital Compare data analyzed for this study.4 In each year, ratings were developed for more than 2000 hospitals that met specific criteria related to teaching hospital status, medical school affiliation, or availability of specific technology‐related services.5 The Best Hospitals rating system is based on 3 central elements of evaluation: (a) reputation, judged by responses to a national mail survey of physicians asked to list the 5 hospitals best in their specialty for difficult cases, without economic or geographic considerations; (b) in‐hospital mortality rates for Medicare patients, adjusted for severity of illness; and (c) a combination of other factors, such as the nurse‐to‐patient ratio and the number of a set of predetermined key technologies available, as determined from institutions' responses to the American Hospital Association's annual survey.5
The 50 Best Hospitals for heart and heart surgery, 50 Best Hospitals for respiratory disorders, and all Honor Roll hospitals (as determined by breadth of institutional excellence, with top performance in 6 or more of 17 specialties) named in 2004 and 2005 were included in this study, except that National Jewish Medical and Research Center was listed as a Best Hospital for respiratory disorders in both years but did not report sufficient numbers of cases to have eligible core measures in Hospital Compare. Of note, there were 11 institutions newly listed as Best Hospitals for heart and heart surgery and 10 institutions newly listed as Best Hospitals for respiratory disorders in 2005 versus 2004; 14 hospitals made the Best Hospitals Honor Roll in 2004, and 2 others were added for 2005.
Data Analysis
To examine the internal validity of the Hospital Compare measures, we calculated pairwise correlation coefficients among the 14 core‐measure components, using all eligible data points. We then calculated Cronbach's , a measure of the internal consistency of scales of measures, to characterize each of the sets of Hospital Compare core measures separately (AMI, CHF, CAP). We also generated Cronbach's for a measure we called the combined core‐measures score, which we intended to be analogous to the Best Hospitals Honor Roll, defined as the AMI, CHF, and CAP measure sets scored together.
To compare Hospital Compare data with the Best Hospitals rankings (for heart and heart surgery, respiratory disorders, and the Honor Roll), we first established national quartile score cut points for each of the 3 Hospital Compare core measure sets and for the combined core measures, using all U.S. hospitals eligible for our analysis. We used quartiles to avoid the misclassification that would be more likely to occur with deciles (based on confidence intervals for the core measures provided by CMS).6
We calculated Hospital Compare scores for each institution listed as a Best Hospital in 2004 and 2005 and classified the Best Hospitals into scoring quartiles based on national score cut points (eg, if the national cutoff for AMI core measures for the top quartile was 95.2%, then a Best Hospital with an AMI score for the core‐measures set 95.2% was classified in the first [top] quartile). AMI and CHF core measure sets were used for comparison with the Best Hospitals for heart and heart surgery, the CAP core‐measure set was used for comparison with the Best Hospitals for respiratory disorders, and the combined core‐measure set was used for comparison with the Honor Roll hospitals.
Sensitivity Analyses
To investigate the effect of missing Hospital Compare data on our study findings, we conducted sensitivity analyses. We used only those institutions with complete data for the AMI, CHF, and CAP core measure sets to establish new quartile cut points and then reexamined the quartile distribution for institutions in the corresponding Best Hospitals lists. We also compared the Best Hospitals' Hospital Compare data completeness with that of all Hospital Compare institutions.
RESULTS
Core Performance Measures in Hospital Compare
Of 4203 hospitals that submitted core measures as part of Hospital Compare, 4126 had at least 1 core measure eligible for analysis (> 25 observations). Of these 4126 hospitals, 2165 (52.5%) had at least 1 eligible AMI core measure, and 398 (9.7%) had all 6 measures eligible for analysis; 3130 had at least 1 eligible CHF core measure (75.9%), and 289 (7.0%) had all 4 measures eligible for analysis; and 3462 (83.9%) had at least one eligible CAP core measure and 302 (7.3%) had all 4 measures eligible for analysis. For the combined core‐measure score, 2119 (51.4%) had at least 4 eligible measures, and 120 (2.9%) had all 14 measures eligible for analysis.
Pairwise correlation coefficients within each of the disease‐specific core measure sets was highest for the AMI measures, and was generally higher for measures that reflected similar clinical activities (eg, aspirin and ‐blocker at discharge for AMI care; tobacco cessation counseling for AMI, CHF, and CAP; Table 2). In general, the AMI and CHF performance measures correlated more strongly with each other than did the AMI or CHF measures with the CAP measures.
Internal consistency within each of the disease‐specific measures was moderate to strong, with Cronbach's = .83 for AMI, Cronbach's = .58 for CHF, and Cronbach's = .49 for CAP. For the combined performance measure set (all 14 core measures together), Cronbach's = .74.
Hospital Compare Scores for Institutions Listed as Best Hospitals
Best Hospitals for heart and heart surgery and for respiratory disorders in U.S. News and World Report in 2004 and 2005 exhibited a broad distribution of Hospital Compare core measure scores (Table 3). For none of the core measure sets did a majority of Best Hospitals score in the top quartile in either year.
| Hospital Compare Scores | Best Hospitals for Heart Disease: AMI Core Measures (n = 50 hospitals)* | Best Hospitals for Heart Disease: CHF Core Measures (n = 50 hospitals)* | Best Hospitals for Respiratory Disorders: CAP Core Measures (n = 49 hospitals)* | |||
|---|---|---|---|---|---|---|
| ||||||
| 2004 | 2005 | 2004 | 2005 | 2004 | 2005 | |
| First quartile | 20 (40%) | 15 (30%) | 19 (38%) | 19 (38%) | 5 (10%) | 7 (14%) |
| Second quartile | 16 (32%) | 21 (42%) | 14 (28%) | 15 (30%) | 8 (16%) | 6 (12%) |
| Third quartile | 11 (22%) | 10 (20%) | 11 (22%) | 12 (24%) | 13 (27%) | 15 (31%) |
| Fourth quartile | 3 (6%) | 4 (8%) | 6 (12%) | 4 (8%) | 23 (47%) | 21 (43%) |
Among the 50 hospitals identified as best for cardiac care, only 20 (40%) in the 2004 list and 15 (30%) in the 2005 list had AMI core‐measure scores in the top quartile nationally, and 14 (28%) scored below the national median in both years. Among those same 50 hospitals, only 19 (38%) had CHF core‐measure scores in the top quartile nationally in both years, whereas 17 (34%) scored below the national median in 2004 and 16 in 2005. On the CAP core measures, Best Hospitals for respiratory disorders generally scored poorly, with only 5 (10%) from the 2004 list and 7 (14%) from the 2005 list in the top quartile nationally and nearly half the institutions scoring in the bottom national quartile (Table 3).
For the 14 hospitals named to the 2004 Honor Roll of Best Hospitals, the comparison with the combined core‐measure score (AMI, CHF, and CAP together) revealed a similarly broad distribution of core measure performance. Only five hospitals scored in the top quartile, 2 in the second quartile, 5 in the third quartile, and 2 in the bottom quartile. The distribution for hospitals in the 2005 Honor Roll was similar (5‐3‐6‐2 by quartile).
Sensitivity Analyses
National quartile Hospital Compare core‐measure cut points were slightly lower (1%‐2% in absolute terms) for those institutions with complete data than for institutions overall; in other words, institutions reporting on all 17 measures were generally more likely to have somewhat lower scores. These differences were substantive enough to shift the distribution of Best Hospitals in 2004 and 2005 up to higher quartiles for the AMI and CHF Hospital Compare measures but not for the CAP measures. For example, using the complete data AMI cut points, 23 of the 50 Best Hospitals for cardiac care in 2005 scored in the top quartile, 16 in the second quartile, 6 in the third quartile, and 5 in the bottom quartile (compared with 15‐21‐10‐4; Table 3). With complete data CHF cut points, the distribution was 26, 11, 9, and 4 for the 2005 Best Hospitals for cardiac care from the top through bottom quartiles, respectively (compared with 19‐15‐12‐4; Table 3). Results for 2004 sensitivity analyses were similar.
Institutions named as Best Hospitals appeared more likely than institutions overall to have complete Hospital Compare data. Whereas fewer than 10% of institutions in Hospital Compare had complete data for the AMI, CHF, and CAP core measures, 60% of Best Hospitals for cardiac care in 2005 had complete data for AMI measures and 44% for CHF measures, whereas 32% of Best Hospitals for respiratory care had complete CAP data.
DISCUSSION
With the public release of Hospital Compare data for more than 4200 hospitals in April 2005, national efforts to report hospital quality to the public passed a major milestone. Our findings indicate that the separate Hospital Compare measures for AMI, CHF, and CAP care have moderate to strong internal consistency, which suggests they are capturing similar hospital‐level care behaviors across institutions for these 3 common conditions.
However, Hospital Compare scores are largely discordant with the Best Hospital rank lists for cardiac and respiratory disorders care. Several institutions listed as Best Hospitals nationally scored below the national median on disease‐specific Hospital Compare core measures, perhaps leaving data‐conscious consumers to wonder how to synthesize rating systems that employ different indicators and measure different aspects of health care delivery.
Lack of Agreement in Hospital Quality Measurement
Discordance between the Hospital Compare and Best Hospitals rating systems is not all that surprising, given that their methods of institutional assessment differ markedly. Although both approaches share the goal of allowing consumers a comparative look at institutional performance nationally, they clearly measure different aspects of hospital care.
Hospital Compare measures focus on the delivery of disease‐specific, evidence‐based practices for 3 acute medical conditions from the emergency department to discharge. In comparison, the Best Hospitals rankings emphasize the reputation and mortality data of hospitals and health systems across a variety of general and subspecialty care settings (including several in which core quality measures have not yet been developed), combined with factors related to nursing and technology availability that may also influence consumers' choices. Of note, the Best Hospitals rating approach has been criticized in the past for its strong reliance on physicians' ratings of institutional reputation, which may have little to do with functional measures of quality.7
In essence, the Hospital Compare measures indicate how hospitals perform for an average case, while Best Hospitals relies on reputation and focus on mortality to indicate how institutions perform on the toughest cases. The question at hand is: are these institutional quality measures complementary or contradictory? Our findings suggest that Hospital Compare and Best Hospitals measures offer consumers a mix of complementary and contradictory information, depending on the institution.
The ratings systems differ in other respects as well. In Hospital Compare, performance data are available for more than 4000 hospitals, which permits consumers to examine their local institutions, whereas the Best Hospitals lists offer information only on the top performers. On the other hand, the more established Best Hospitals listings have been published annually for the last 15 years,5 permitting some longitudinal evaluation of hospitals' quality consistency. Importantly, neither rating system includes measures of patient satisfaction with hospital care.
One dimension that both rating systems share is the migration of quality measurement from the local and institutional level to the national stage. Historically, health care quality measurement has been a local phenomenon, as institutions work to gain larger shares of their local markets. A few hospitals have marketed their care and services regionally or even nationally and internationally, but these institutionswhich previously primarily used their reputation rather than specific outcome metrics to reach beyond their local communitiesare a minority of U.S. hospitals.
Although Hospital Compare and Best Hospitals are both national in scope, only Hospital Compare allows consumers to understand the quality of care in most of their community hospitals and health systems. Other investigators analyzing the same data set have highlighted significant differences in hospital performance according to for‐profit status, academic status, and size (number of beds).8
However, it is not yet clear if and how hospital ratings influence consumers' health care decisions. In fact, some studies suggest that only a minority of patients are inclined to use performance reports in their decisions about health care.9, 10 Moreover, if illness is acute, the factors driving choice of hospital may be geographic proximity, bed availability, and payer contracts rather than performance measures.
These constraints on the utility of hospital quality metrics from the consumer perspective are reminders that such metrics may have other benefits. Specifically, ratings such as Hospital Compare and Best Hospitals, as well as others such as those of the Leapfrog Group11 and the Joint Commission on Accreditation of Healthcare Organizations,12 offer differing arrays of performance measures that may induce hospitals to improve their quality of care.1, 13 Institutions that score well or improve their scores over time can use such scores not only to benchmark their processes and outcomes but also to signal the comparative value of their care to the public. In the past, hospitals named to the Best Hospitals Honor Roll have trumpeted their achievements through plaques on their walls and in advertisements for their services. Whether institutions will do the same regarding their Hospital Compare scores remains to be seen.
Study Limitations
The chief limitation of this analysis is that not all hospitals reported data for the Hospital Compare core measures. We standardized the core‐measure sets for AMI, CHF, and CAP care for the number of measures reported in each set in order to include as many hospitals as possible in our analyses. Participation in Hospital Compare is voluntary (although strongly encouraged because of better Medicare reimbursement for institutions that participate), so it is possible that there was a systematic scoring bias in hospitals' incomplete reporting across all measures, that is, hospitals might not report specific core measure scores if they were particularly poor.13 That scale score medians were slightly lower for hospitals with complete data than for hospitals overall may indicate some reporting bias in the Hospital Compare data. Nevertheless, in the sensitivity analyses we performed using only those hospitals with complete data on the Hospital Compare core measures, comparisons with the Best Hospitals lists still predominantly indicated discordance between the rating systems.
Another limitation of this work is that we examined only 2 of several currently available hospital‐rating schemes. We chose to examine Hospital Compare because it is the first governmental effort to report specific hospital quality measures to the public, and we elected to look at Hospital Compare alongside the Best Hospitals lists because the latter are arguably the hospital ratings best known to the lay public.
A third potential limitation is that the Best Hospitals lists for 2004 were based in part on mortality figures and hospital survey data from 2002, which were the most recent data available at the time of the rankings; for the 2005 Best Hospitals lists, the most recent mortality and hospital survey data were collected in 2003.4 Hospital Compare scores were calculated on the basis of patients discharged in 2004, and therefore the ratings systems reflect somewhat different time frames. Nonetheless, we do not believe that this mismatch explains the extent of discordance between the 2 rating scales, particularly because there was such stability in the Best Hospital lists over the 2 years.
CONCLUSIONS
The Best Hospitals lists and Hospital Compare core measure scores agree only a minority of the time on the best institutions for the care of cardiac and respiratory conditions in the United States. Prominent, publicly reported hospital quality scorecards that paint discordant pictures of institutional performance potentially present a conundrum for physicians, patients, and payers with growing incentives to compare institutional quality.
If the movement to improve health care quality is to succeed, the challenge will be to harness the growing professional and lay interest in quality measurement to create rating scales that reflect the best aspects of Hospital Compare and the Best Hospitals lists, with the broadest inclusion of institutions and scope of conditions. For example, it would be more helpful to the public if the Best Hospitals lists included available Hospital Compare measures. It would also benefit consumers if Hospital Compare included more metrics about preventive and elective procedures, domains in which consumers can maximally exercise their choice of health care institutions. Moreover, voluntary reporting may constrain the quality effort. Only with mandatory reporting on quality measures will consistent and sufficient institutional accountability be achieved.
- .Public performance reports and the will for change.JAMA.2002;288:1523–1524.
- .Improving the quality of care—can we practice what we preach?N Engl J Med.2003;348:2681–2683.
- U.S. Department of Health and Human Services, Centers for Medicare and Medicaid Services. Hospital Compare. Available at: http://www.hospitalcompare.hhs.gov. Accessed May 12,2005.
- U.S. News and World Report. Best hospitals 2005. Available at: http://www.usnews.com/usnews/health/best‐hospitals/tophosp.htm. Accessed July 10,2005.
- . Best hospitals 2005: methodology behind the rankings. U.S. News and World Report. Available at: http://www.usnews.com/usnews/health/best‐hospitals/methodology.htm. Accessed July 10,2005.
- U.S. Department of Health and Human Services, Centers for Medicare and Medicaid Services. Hospital Compare: information for professionals. Available at: http://www.hospitalcompare.hhs.gov/Hospital/Static/Data‐Professionals.asp?dest=NAV|Home|DataDetails|ProfessionalInfo#TabTop. Accessed May 12,2005.
- ,,,.In search of America's best hospitals: the promise and reality of quality assessment.JAMA.1997;277:1152–1155.
- ,,,.Care in US hospitals—the Hospital Quality Alliance program.N Engl Jour Med.2005;353:265–274.
- ,.Use of public performance reports: a survey of patients undergoing cardiac surgery.JAMA.1998;279:1638–1642.
- Kaiser Family Foundation and Agency for Health Care Research and Quality.National Survey on Consumers' Experiences with Patient Safety and Quality Information.Washington, DC:Kaiser Family Foundation;2004.
- Leapfrog Group for Patient Safety. Available at: http://www.leapfroggroup.org. Accessed May 12,2005.
- Joint Commission on Accreditation of Healthcare Organizations. Quality check. Available at: http://www.jcaho.org/quality+check/index.htm. Accessed May 12,2005.
- ,.The unintended consequences of publicly reporting quality information.JAMA.2005;293:1239–1244.
National concerns about the quality of health care in the United States have prompted calls for transparent efforts to measure and report hospital performance to the public. Consumer groups, payers, and credentialing organizations now rate the quality of hospitals and health care through a variety of mechanisms, yielding a kaleidoscope of quality measurement scorecards. However, health care consumers have minimal information about how hospital quality rating systems compare with each other or which rating system might best address their information needs.
The Hospital Compare Web site was launched in April 2005 by the Hospital Quality Alliance (HQA), a public‐private collaboration among organizations, including the Centers for Medicare and Medicaid Services (CMS). The CMS describes Hospital Compare as information [that] measures how well hospitals care for their patients.1 A limited set of Hospital Compare data from 2004 were posted online in 2005 for more than 4200 hospitals, permitting community‐specific comparisons of hospitals' self‐reported standardized core measures that reflect quality of care for acute myocardial infarction (AMI), congestive heart failure (CHF), and community‐acquired pneumonia (CAP) in adult patients.
Other current hospital quality evaluation tools target payers and purchasers of health care. However, many of these evaluations require that institutions pay a fee for submitting their data to be benchmarked against other participating institutions or require that the requesting individual or organization pay a fee to examine a hospital's performance on a specific condition or procedure.
We examined Hospital Compare data alongside that of another hospital rating system that has existed for a longer period of time and is likely better known to the lay publicthe Best Hospitals lists published annually by U.S. News and World Report.2, 3 Together, Hospital Compare and Best Hospitals are hospital quality scorecards that offer consumers assessments of hospital performance on a national scale. However, their measures of hospital quality differ, and we investigated whether they would provide consumers with concordant assessments of hospital quality.
METHODS
Data Sources
Hospital Compare
Core measure performance data were obtained by the investigators from the Hospital Compare Web site.3 Information in the database was provided by hospitals for the period January‐June 2004. Hospitals self‐reported their performance on the core measures using standardized medical record abstraction programs. The measures reported are cumulative averages based on monthly performance summaries.
Fourteen core measures were used in the study to form 3 core measure sets (Table 1): the AMI set comprised 6 measures, the CHF set comprised 4 measures, and the CAP site comprised 4 measures. Of the 17 core measures available on the Hospital Compare Web site, core measures of timing of thrombolytic agents or percutaneous transluminal coronary angioplasty for patients with AMI were excluded from the analysis because fewer than 10% of institutions reported such measures. Data on the core measure about oxygenation measurement for CAP were also excluded because of minimal variation between hospitals (national mean = 98%; the national mean for all other measures was less than 92%).3
| Condition | Core Measures |
|---|---|
| |
| Acute myocardial infarction (AMI) |
|
| Congestive heart failure (CHF) |
|
| Community‐acquired pneumonia (CAP) |
|
Core measures that CMS defined as having too few cases (< 25) to reliably ascertain an estimate of hospital performance, or for which hospitals were not reporting data, were not eligible for analysis. To generate a composite score for each of the disease‐specific core measure sets, scores for all eligible core measures within each set were summed and then divided by the number of eligible measures available. This permitted standardization of the scores in the majority of instances when institutions did not report all eligible measures within a given set.
Best Hospitals
Ratings of hospitals were drawn from the 2004 and 2005 editions of the Best Hospitals listings of the U.S. News and World Report, the editions that most closely reflect performance data and physician survey data concurrent with Hospital Compare data analyzed for this study.4 In each year, ratings were developed for more than 2000 hospitals that met specific criteria related to teaching hospital status, medical school affiliation, or availability of specific technology‐related services.5 The Best Hospitals rating system is based on 3 central elements of evaluation: (a) reputation, judged by responses to a national mail survey of physicians asked to list the 5 hospitals best in their specialty for difficult cases, without economic or geographic considerations; (b) in‐hospital mortality rates for Medicare patients, adjusted for severity of illness; and (c) a combination of other factors, such as the nurse‐to‐patient ratio and the number of a set of predetermined key technologies available, as determined from institutions' responses to the American Hospital Association's annual survey.5
The 50 Best Hospitals for heart and heart surgery, 50 Best Hospitals for respiratory disorders, and all Honor Roll hospitals (as determined by breadth of institutional excellence, with top performance in 6 or more of 17 specialties) named in 2004 and 2005 were included in this study, except that National Jewish Medical and Research Center was listed as a Best Hospital for respiratory disorders in both years but did not report sufficient numbers of cases to have eligible core measures in Hospital Compare. Of note, there were 11 institutions newly listed as Best Hospitals for heart and heart surgery and 10 institutions newly listed as Best Hospitals for respiratory disorders in 2005 versus 2004; 14 hospitals made the Best Hospitals Honor Roll in 2004, and 2 others were added for 2005.
Data Analysis
To examine the internal validity of the Hospital Compare measures, we calculated pairwise correlation coefficients among the 14 core‐measure components, using all eligible data points. We then calculated Cronbach's , a measure of the internal consistency of scales of measures, to characterize each of the sets of Hospital Compare core measures separately (AMI, CHF, CAP). We also generated Cronbach's for a measure we called the combined core‐measures score, which we intended to be analogous to the Best Hospitals Honor Roll, defined as the AMI, CHF, and CAP measure sets scored together.
To compare Hospital Compare data with the Best Hospitals rankings (for heart and heart surgery, respiratory disorders, and the Honor Roll), we first established national quartile score cut points for each of the 3 Hospital Compare core measure sets and for the combined core measures, using all U.S. hospitals eligible for our analysis. We used quartiles to avoid the misclassification that would be more likely to occur with deciles (based on confidence intervals for the core measures provided by CMS).6
We calculated Hospital Compare scores for each institution listed as a Best Hospital in 2004 and 2005 and classified the Best Hospitals into scoring quartiles based on national score cut points (eg, if the national cutoff for AMI core measures for the top quartile was 95.2%, then a Best Hospital with an AMI score for the core‐measures set 95.2% was classified in the first [top] quartile). AMI and CHF core measure sets were used for comparison with the Best Hospitals for heart and heart surgery, the CAP core‐measure set was used for comparison with the Best Hospitals for respiratory disorders, and the combined core‐measure set was used for comparison with the Honor Roll hospitals.
Sensitivity Analyses
To investigate the effect of missing Hospital Compare data on our study findings, we conducted sensitivity analyses. We used only those institutions with complete data for the AMI, CHF, and CAP core measure sets to establish new quartile cut points and then reexamined the quartile distribution for institutions in the corresponding Best Hospitals lists. We also compared the Best Hospitals' Hospital Compare data completeness with that of all Hospital Compare institutions.
RESULTS
Core Performance Measures in Hospital Compare
Of 4203 hospitals that submitted core measures as part of Hospital Compare, 4126 had at least 1 core measure eligible for analysis (> 25 observations). Of these 4126 hospitals, 2165 (52.5%) had at least 1 eligible AMI core measure, and 398 (9.7%) had all 6 measures eligible for analysis; 3130 had at least 1 eligible CHF core measure (75.9%), and 289 (7.0%) had all 4 measures eligible for analysis; and 3462 (83.9%) had at least one eligible CAP core measure and 302 (7.3%) had all 4 measures eligible for analysis. For the combined core‐measure score, 2119 (51.4%) had at least 4 eligible measures, and 120 (2.9%) had all 14 measures eligible for analysis.
Pairwise correlation coefficients within each of the disease‐specific core measure sets was highest for the AMI measures, and was generally higher for measures that reflected similar clinical activities (eg, aspirin and ‐blocker at discharge for AMI care; tobacco cessation counseling for AMI, CHF, and CAP; Table 2). In general, the AMI and CHF performance measures correlated more strongly with each other than did the AMI or CHF measures with the CAP measures.
Internal consistency within each of the disease‐specific measures was moderate to strong, with Cronbach's = .83 for AMI, Cronbach's = .58 for CHF, and Cronbach's = .49 for CAP. For the combined performance measure set (all 14 core measures together), Cronbach's = .74.
Hospital Compare Scores for Institutions Listed as Best Hospitals
Best Hospitals for heart and heart surgery and for respiratory disorders in U.S. News and World Report in 2004 and 2005 exhibited a broad distribution of Hospital Compare core measure scores (Table 3). For none of the core measure sets did a majority of Best Hospitals score in the top quartile in either year.
| Hospital Compare Scores | Best Hospitals for Heart Disease: AMI Core Measures (n = 50 hospitals)* | Best Hospitals for Heart Disease: CHF Core Measures (n = 50 hospitals)* | Best Hospitals for Respiratory Disorders: CAP Core Measures (n = 49 hospitals)* | |||
|---|---|---|---|---|---|---|
| ||||||
| 2004 | 2005 | 2004 | 2005 | 2004 | 2005 | |
| First quartile | 20 (40%) | 15 (30%) | 19 (38%) | 19 (38%) | 5 (10%) | 7 (14%) |
| Second quartile | 16 (32%) | 21 (42%) | 14 (28%) | 15 (30%) | 8 (16%) | 6 (12%) |
| Third quartile | 11 (22%) | 10 (20%) | 11 (22%) | 12 (24%) | 13 (27%) | 15 (31%) |
| Fourth quartile | 3 (6%) | 4 (8%) | 6 (12%) | 4 (8%) | 23 (47%) | 21 (43%) |
Among the 50 hospitals identified as best for cardiac care, only 20 (40%) in the 2004 list and 15 (30%) in the 2005 list had AMI core‐measure scores in the top quartile nationally, and 14 (28%) scored below the national median in both years. Among those same 50 hospitals, only 19 (38%) had CHF core‐measure scores in the top quartile nationally in both years, whereas 17 (34%) scored below the national median in 2004 and 16 in 2005. On the CAP core measures, Best Hospitals for respiratory disorders generally scored poorly, with only 5 (10%) from the 2004 list and 7 (14%) from the 2005 list in the top quartile nationally and nearly half the institutions scoring in the bottom national quartile (Table 3).
For the 14 hospitals named to the 2004 Honor Roll of Best Hospitals, the comparison with the combined core‐measure score (AMI, CHF, and CAP together) revealed a similarly broad distribution of core measure performance. Only five hospitals scored in the top quartile, 2 in the second quartile, 5 in the third quartile, and 2 in the bottom quartile. The distribution for hospitals in the 2005 Honor Roll was similar (5‐3‐6‐2 by quartile).
Sensitivity Analyses
National quartile Hospital Compare core‐measure cut points were slightly lower (1%‐2% in absolute terms) for those institutions with complete data than for institutions overall; in other words, institutions reporting on all 17 measures were generally more likely to have somewhat lower scores. These differences were substantive enough to shift the distribution of Best Hospitals in 2004 and 2005 up to higher quartiles for the AMI and CHF Hospital Compare measures but not for the CAP measures. For example, using the complete data AMI cut points, 23 of the 50 Best Hospitals for cardiac care in 2005 scored in the top quartile, 16 in the second quartile, 6 in the third quartile, and 5 in the bottom quartile (compared with 15‐21‐10‐4; Table 3). With complete data CHF cut points, the distribution was 26, 11, 9, and 4 for the 2005 Best Hospitals for cardiac care from the top through bottom quartiles, respectively (compared with 19‐15‐12‐4; Table 3). Results for 2004 sensitivity analyses were similar.
Institutions named as Best Hospitals appeared more likely than institutions overall to have complete Hospital Compare data. Whereas fewer than 10% of institutions in Hospital Compare had complete data for the AMI, CHF, and CAP core measures, 60% of Best Hospitals for cardiac care in 2005 had complete data for AMI measures and 44% for CHF measures, whereas 32% of Best Hospitals for respiratory care had complete CAP data.
DISCUSSION
With the public release of Hospital Compare data for more than 4200 hospitals in April 2005, national efforts to report hospital quality to the public passed a major milestone. Our findings indicate that the separate Hospital Compare measures for AMI, CHF, and CAP care have moderate to strong internal consistency, which suggests they are capturing similar hospital‐level care behaviors across institutions for these 3 common conditions.
However, Hospital Compare scores are largely discordant with the Best Hospital rank lists for cardiac and respiratory disorders care. Several institutions listed as Best Hospitals nationally scored below the national median on disease‐specific Hospital Compare core measures, perhaps leaving data‐conscious consumers to wonder how to synthesize rating systems that employ different indicators and measure different aspects of health care delivery.
Lack of Agreement in Hospital Quality Measurement
Discordance between the Hospital Compare and Best Hospitals rating systems is not all that surprising, given that their methods of institutional assessment differ markedly. Although both approaches share the goal of allowing consumers a comparative look at institutional performance nationally, they clearly measure different aspects of hospital care.
Hospital Compare measures focus on the delivery of disease‐specific, evidence‐based practices for 3 acute medical conditions from the emergency department to discharge. In comparison, the Best Hospitals rankings emphasize the reputation and mortality data of hospitals and health systems across a variety of general and subspecialty care settings (including several in which core quality measures have not yet been developed), combined with factors related to nursing and technology availability that may also influence consumers' choices. Of note, the Best Hospitals rating approach has been criticized in the past for its strong reliance on physicians' ratings of institutional reputation, which may have little to do with functional measures of quality.7
In essence, the Hospital Compare measures indicate how hospitals perform for an average case, while Best Hospitals relies on reputation and focus on mortality to indicate how institutions perform on the toughest cases. The question at hand is: are these institutional quality measures complementary or contradictory? Our findings suggest that Hospital Compare and Best Hospitals measures offer consumers a mix of complementary and contradictory information, depending on the institution.
The ratings systems differ in other respects as well. In Hospital Compare, performance data are available for more than 4000 hospitals, which permits consumers to examine their local institutions, whereas the Best Hospitals lists offer information only on the top performers. On the other hand, the more established Best Hospitals listings have been published annually for the last 15 years,5 permitting some longitudinal evaluation of hospitals' quality consistency. Importantly, neither rating system includes measures of patient satisfaction with hospital care.
One dimension that both rating systems share is the migration of quality measurement from the local and institutional level to the national stage. Historically, health care quality measurement has been a local phenomenon, as institutions work to gain larger shares of their local markets. A few hospitals have marketed their care and services regionally or even nationally and internationally, but these institutionswhich previously primarily used their reputation rather than specific outcome metrics to reach beyond their local communitiesare a minority of U.S. hospitals.
Although Hospital Compare and Best Hospitals are both national in scope, only Hospital Compare allows consumers to understand the quality of care in most of their community hospitals and health systems. Other investigators analyzing the same data set have highlighted significant differences in hospital performance according to for‐profit status, academic status, and size (number of beds).8
However, it is not yet clear if and how hospital ratings influence consumers' health care decisions. In fact, some studies suggest that only a minority of patients are inclined to use performance reports in their decisions about health care.9, 10 Moreover, if illness is acute, the factors driving choice of hospital may be geographic proximity, bed availability, and payer contracts rather than performance measures.
These constraints on the utility of hospital quality metrics from the consumer perspective are reminders that such metrics may have other benefits. Specifically, ratings such as Hospital Compare and Best Hospitals, as well as others such as those of the Leapfrog Group11 and the Joint Commission on Accreditation of Healthcare Organizations,12 offer differing arrays of performance measures that may induce hospitals to improve their quality of care.1, 13 Institutions that score well or improve their scores over time can use such scores not only to benchmark their processes and outcomes but also to signal the comparative value of their care to the public. In the past, hospitals named to the Best Hospitals Honor Roll have trumpeted their achievements through plaques on their walls and in advertisements for their services. Whether institutions will do the same regarding their Hospital Compare scores remains to be seen.
Study Limitations
The chief limitation of this analysis is that not all hospitals reported data for the Hospital Compare core measures. We standardized the core‐measure sets for AMI, CHF, and CAP care for the number of measures reported in each set in order to include as many hospitals as possible in our analyses. Participation in Hospital Compare is voluntary (although strongly encouraged because of better Medicare reimbursement for institutions that participate), so it is possible that there was a systematic scoring bias in hospitals' incomplete reporting across all measures, that is, hospitals might not report specific core measure scores if they were particularly poor.13 That scale score medians were slightly lower for hospitals with complete data than for hospitals overall may indicate some reporting bias in the Hospital Compare data. Nevertheless, in the sensitivity analyses we performed using only those hospitals with complete data on the Hospital Compare core measures, comparisons with the Best Hospitals lists still predominantly indicated discordance between the rating systems.
Another limitation of this work is that we examined only 2 of several currently available hospital‐rating schemes. We chose to examine Hospital Compare because it is the first governmental effort to report specific hospital quality measures to the public, and we elected to look at Hospital Compare alongside the Best Hospitals lists because the latter are arguably the hospital ratings best known to the lay public.
A third potential limitation is that the Best Hospitals lists for 2004 were based in part on mortality figures and hospital survey data from 2002, which were the most recent data available at the time of the rankings; for the 2005 Best Hospitals lists, the most recent mortality and hospital survey data were collected in 2003.4 Hospital Compare scores were calculated on the basis of patients discharged in 2004, and therefore the ratings systems reflect somewhat different time frames. Nonetheless, we do not believe that this mismatch explains the extent of discordance between the 2 rating scales, particularly because there was such stability in the Best Hospital lists over the 2 years.
CONCLUSIONS
The Best Hospitals lists and Hospital Compare core measure scores agree only a minority of the time on the best institutions for the care of cardiac and respiratory conditions in the United States. Prominent, publicly reported hospital quality scorecards that paint discordant pictures of institutional performance potentially present a conundrum for physicians, patients, and payers with growing incentives to compare institutional quality.
If the movement to improve health care quality is to succeed, the challenge will be to harness the growing professional and lay interest in quality measurement to create rating scales that reflect the best aspects of Hospital Compare and the Best Hospitals lists, with the broadest inclusion of institutions and scope of conditions. For example, it would be more helpful to the public if the Best Hospitals lists included available Hospital Compare measures. It would also benefit consumers if Hospital Compare included more metrics about preventive and elective procedures, domains in which consumers can maximally exercise their choice of health care institutions. Moreover, voluntary reporting may constrain the quality effort. Only with mandatory reporting on quality measures will consistent and sufficient institutional accountability be achieved.
- .Public performance reports and the will for change.JAMA.2002;288:1523–1524.
- .Improving the quality of care—can we practice what we preach?N Engl J Med.2003;348:2681–2683.
- U.S. Department of Health and Human Services, Centers for Medicare and Medicaid Services. Hospital Compare. Available at: http://www.hospitalcompare.hhs.gov. Accessed May 12,2005.
- U.S. News and World Report. Best hospitals 2005. Available at: http://www.usnews.com/usnews/health/best‐hospitals/tophosp.htm. Accessed July 10,2005.
- . Best hospitals 2005: methodology behind the rankings. U.S. News and World Report. Available at: http://www.usnews.com/usnews/health/best‐hospitals/methodology.htm. Accessed July 10,2005.
- U.S. Department of Health and Human Services, Centers for Medicare and Medicaid Services. Hospital Compare: information for professionals. Available at: http://www.hospitalcompare.hhs.gov/Hospital/Static/Data‐Professionals.asp?dest=NAV|Home|DataDetails|ProfessionalInfo#TabTop. Accessed May 12,2005.
- ,,,.In search of America's best hospitals: the promise and reality of quality assessment.JAMA.1997;277:1152–1155.
- ,,,.Care in US hospitals—the Hospital Quality Alliance program.N Engl Jour Med.2005;353:265–274.
- ,.Use of public performance reports: a survey of patients undergoing cardiac surgery.JAMA.1998;279:1638–1642.
- Kaiser Family Foundation and Agency for Health Care Research and Quality.National Survey on Consumers' Experiences with Patient Safety and Quality Information.Washington, DC:Kaiser Family Foundation;2004.
- Leapfrog Group for Patient Safety. Available at: http://www.leapfroggroup.org. Accessed May 12,2005.
- Joint Commission on Accreditation of Healthcare Organizations. Quality check. Available at: http://www.jcaho.org/quality+check/index.htm. Accessed May 12,2005.
- ,.The unintended consequences of publicly reporting quality information.JAMA.2005;293:1239–1244.
Copyright © 2007 Society of Hospital Medicine