User login
Hospital Charges for Childhood Obesity
With increases in the prevalence of obesity among children and adults over the past 3 decades in the United States,13 healthcare expenditures attributed to obesity have climbed steadily, to over $100 billion in excess expenditures annually.4 Several studies have examined healthcare costs associated with obesity in adults,48 but these studies have not attempted to distinguish between excess expenditures in inpatient versus outpatient settings. In contrast, the only 2 national economic analyses of childhood obesity have focused exclusively on the inpatient setting, because the health and economic consequences of obesity among children may be most apparent in cases in which obesity is causally linked to other diagnoses (eg, type 2 diabetes mellitus, gall bladder disease) or is a comorbidity that complicates hospitalizations.9, 10
In our previous study of obesity as a comorbidity for hospitalized children, we examined the incremental charges and length‐of‐stay (LOS) for hospitalizations for the most common nonpregnancy/nonchildbirth pediatric diagnoses, comparing those coded with obesity as a secondary diagnosis versus those without.10 Using data from the Agency for Healthcare Research and Quality (AHRQ) Kid's Inpatient Database (KID) for the year 2000, we found that obesity was associated with higher charges and longer LOS for all 4 of the conditions studied (asthma, pneumonia, affective disorders, and appendicitis). Our findings regarding asthma and affective disorders echoed earlier analyses of hospitalizations for conditions clinically linked to obesity.9 However, our study was the first to demonstrate that childhood obesity is a clinically and economically significant complicating factor for conditions not thought to be linked to obesity (pneumonia, appendicitis).
For this current study, our objective was to use more recent child hospitalization data from 2003 to determine whether our prior findings of incremental charges and LOS associated with hospitalizations where obesity was coded as a secondary diagnosis compared to those where it was not, were stable over time, and whether the magnitude of differences was consistent over a period of 4 years. We hypothesized that incremental differences in hospital charges and LOS between discharges with and without obesity would be seen in the 2003 data and that the magnitude of these differences in 2003 would be similar to those in 2000. Because obesity prevalence among children increased from 2000 to 2003,11 we also hypothesized that there would be a corresponding increase in the proportion of hospitalizations with obesity as a comorbidity.
METHODS
Data Source and Sample
We analyzed data from the AHRQ KID. The KID is a nationally representative sample of annual pediatric hospital discharges. Analysis using the KID allows for improved estimates due to the discharges from community, nonrehabilitation hospitals.12 It provides data found in standard hospital discharge abstracts for more than 2 million pediatric discharges, including International Classification of Diseases, Ninth Revision, Clinical Modification (ICD‐9‐CM) codes, LOS, total hospital charges, and patient demographic information.12 Our original analysis (published in Obesity, July 2007)10 utilized data from the 2000 KID. For this analysis we utilized data from the 2003 KID (the most recent version available), and for comparison we converted the results from the 2000 study into 2003 dollars using the Consumer Price Index for Medical Care.
Using ICD‐9‐CM codes, the KID provides the principal diagnosis for each discharge, along with up to 14 secondary diagnoses. It also provides Clinical Classification Software (CCS) codes, a diagnostic categorization scheme that permits grouping of related conditions. ICD‐9‐CM codes are collapsed into a smaller number of categories that are sometimes more useful for presenting descriptive statistics than are individual ICD‐9‐CM codes or the much broader categories of Diagnosis Related Groups (DRGs). For example, all ICD‐9‐CM codes for specific types of pneumonia would be grouped together under 1 CCS code but would exclude other respiratory conditions such as pneumothorax which would generally be included in the respiratory condition DRG.12
The 2000 KID contained 2,516,833 unweighted discharges, representing 7,291,038 discharges in the population. In the 2003 KID, there were 2,984,129 unweighted discharges representing 7,409,162 discharges in the population. Our sample included all discharges for nonpregnancy‐related conditions, in children 2 years of age (due to the Centers for Disease Control definition for overweight based on body mass index [BMI] that starts at age 2 years)13, 14 to 18 years of age (2000 weighted n = 1,527,309; 2003 weighted n = 1,613,258); these numbers exclude discharges with obesity as a primary diagnosis.
Key Variables
Our outcome variables were LOS and total charges for each of the common nonpregnancy‐related principal discharge diagnoses studied. For the 2000 and 2003 KID, total charges included all hospital fees with the exception of professional fees.15
The main independent variable of interest was presence of obesity as a secondary diagnosis. Discharges were classified as either with or without obesity based on the presence of the ICD‐9‐CM code 278.0x as a secondary diagnosis (1 if yes, 0 if no). This code captures obesity unspecified (278.00), overweight (278.01), and morbid obesity (278.02). Of note, the distribution of these codes did not vary significantly between the 2 study years.
Other independent variables included sex, age (2‐5 years, 6‐10 years, 11‐14 years, and 15‐18 years), race/ethnicity (white, black, Hispanic, and other), region (Northeast, Midwest, South, and West), hospital type (based on classification by the National Association of Children's Hospitals and Related Institutions [NACHRI] as general hospital, children's unit in a general hospital, and children's hospital) and expected primary payer (Medicaid, private, and other). We chose independent variables due to their established association with our outcomes and for their patterns of association with childhood obesity.
We did not include LOS as a covariate in models of charges because obesity may have been associated with the outcome indirectly through LOS as well as directly as a main effect. To fully interpret the combination of these effects would require analyses beyond the scope of this work.
Analyses
Using CCS codes, we identified the 4 most common principal nonpregnancy‐related discharge diagnoses for children 2‐18 years old. For both 2000 and 2003 these were asthma (CCS 128), pneumonia (CCS 122), affective disorders (eg, depression and bipolar disorder) (CCS 69), and appendicitis (CCS 142). Importantly, this group of diagnoses included conditions clinically associated with obesity (asthma and affective disorders)16 and conditions not associated with obesity (pneumonia and appendicitis). Given this distinction we analyzed the 4 conditions separately.
For all discharges with these common principal diagnoses, we calculated mean LOS and mean total charges. Bivariate and multivariable analyses were conducted using simple and multiple linear regression, respectively. These analyses were designed to test the study hypothesis that obesity as a secondary diagnosis is associated with incremental economic charges and LOS. All analyses were performed on log‐transformed LOS and charge data. We included in our models those characteristics that we hypothesized were potentially related to hospital charges and LOS, based on published literature,4, 17, 18 and for that reason all covariates were retained in the final models regardless of bivariate findings. Differences in the incremental LOS and charges for 2003 versus 2000 were compared using t‐tests.
For each independent variable with missing data, we included in the analyses a category for unreported values. The KID is known to have a large number of missing data for race/ethnicity; therefore, in keeping with other studies utilizing the KID,10, 19 we also conducted multivariate analyses excluding those discharges with unreported race as a sensitivity analysis. Of note, analyses of these data excluding children of unreported race were not substantively different than those in which the unreported group was included. We present our findings including the unreported race category.
Predicted values on the log scale, for those with obesity and without obesity as a secondary diagnosis adjusted for the listed covariates, were obtained. We then back‐transformed these to their original scales and units using methods developed by Duan.20 For each principal diagnosis category, we analyzed the differences in predicted mean LOS and predicted mean total charges between discharges with and without obesity as a secondary diagnosis, adjusted for the listed covariates, using the P values obtained from the regression analyses. All results are presented in 2003 dollars.
In keeping with our earlier analysis we considered the potential influence of comorbidities other than obesity on LOS and charges. Therefore, we examined whether other comorbidities were coded more frequently among those discharges with obesity as a secondary diagnosis than those discharges without obesity. As seen in the 2000 KID, the 2003 data revealed that diabetes was more commonly seen with obesity‐related hospitalizations than with those hospitalizations without obesity. However, the proportion of discharges with obesity and diabetes was low for all of the principal diagnostic categories studied (asthma 4.8%, pneumonia 6.0%, affective disorders 4.2%, and appendicitis 1.9%). Thus, we judged the co‐occurrence of diabetes and obesity as secondary diagnoses too infrequent to be an explanatory factor for the overall incremental differences in LOS and charges.
All analyses were weighted to account for the complex probability sampling of the dataset and permit inferences regarding national hospital discharge patterns. The same sample of discharges was used to analyze LOS and charges, with the discharge weighting variable (DISCWT) used for all analyses. All results are presented as weighted data unless otherwise noted. Analyses were conducted using STATA 8.0 (Stata Corporation, College Station, TX) and SUDAAN version 9 (Research Triangle Institute, Research Triangle Park, NC).
This study was approved by the Institutional Review Board of the University of Michigan Medical School.
RESULTS
Sample Characteristics
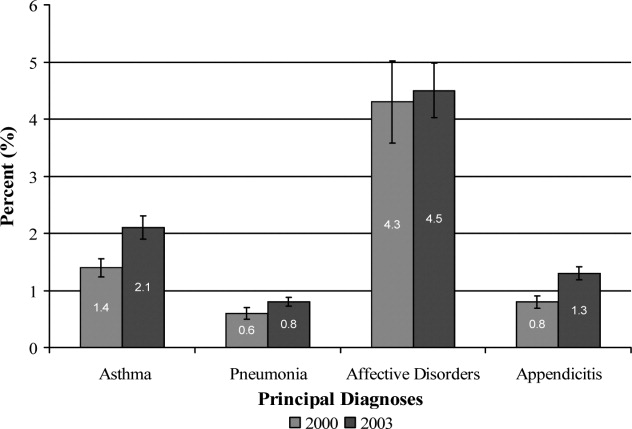
The characteristics of the study population are presented in Table 1. In 2003, the overall proportion of nonpregnancy‐related discharges for children 2‐18 years old coded with obesity as a secondary diagnosis was 1.6%, an increase from 1.1% in 2000. Within the 4 most common nonpregnancy‐related CCS category diagnoses (asthma, pneumonia, affective disorders, and appendicitis) the proportion of discharges with obesity coded as a secondary diagnosis increased from 2000 to 2003 (Figure 1)

| Variables | Discharges | |||
|---|---|---|---|---|
| With Obesity as Secondary Diagnosis | Without Obesity | |||
| 2000 | 2003 | 2000 | 2003 | |
| Unweighted, n | 8,696 | 15,546 | 762,407 | 943,182 |
| Weighted population size | 17,672 | 25,709 | 1,509,637 | 1,587,549 |
| Age | ||||
| 2‐5 years (%) | 4.8 | 4.8 | 27.4 | 29.0 |
| 6‐10 years (%) | 14.7 | 15.9 | 22.4 | 22.3 |
| 11‐14 years (%) | 34.4 | 34.1 | 20.9 | 20.9 |
| 15‐18 years (%) | 46.1 | 45.2 | 29.3 | 27.8 |
| Sex | ||||
| Male (%) | 45.5 | 46.8 | 53.8 | 53.4 |
| Race/Ethnicity | ||||
| White (%) | 46.8 | 32.2 | 50.9 | 39.3 |
| Black (%) | 20.7 | 20.4 | 14.3 | 12.6 |
| Hispanic (%) | 14.9 | 16.8 | 14.3 | 14.4 |
| Other (%) | 4.8 | 5.0 | 5.6 | 5.6 |
| Unreported (%) | 12.8 | 25.6 | 14.9 | 28.1 |
| Payer | ||||
| Medicaid (%) | 42.6 | 46.5 | 32.1 | 36.9 |
| Private (%) | 47.1 | 42.6 | 58.0 | 53.3 |
| Other (%) | 9.4 | 10.6 | 9.4 | 9.6 |
| Unreported (%) | 0.9 | 0.3 | 0.5 | 0.2 |
| Hospital Region | ||||
| Northeast (%) | 17.3 | 15.9 | 21.7 | 18.7 |
| Midwest (%) | 24.6 | 24.8 | 20.0 | 23.3 |
| South (%) | 37.6 | 38.4 | 36.3 | 37.0 |
| West (%) | 20.5 | 20.9 | 22.0 | 21.0 |
| Hospital type | ||||
| General hospital (%) | 68.2 | 61.4 | 61.0 | 57.1 |
| Children's unit in general hospital (%) | 15.2 | 17.8 | 18.6 | 19.2 |
| Children's hospitals (%) | 14.3 | 14.9 | 17.9 | 17.6 |
| Unreported (%) | 2.3% | 5.9 | 2.5 | 6.1 |
Incremental Differences in Mean Charges Associated with Obesity
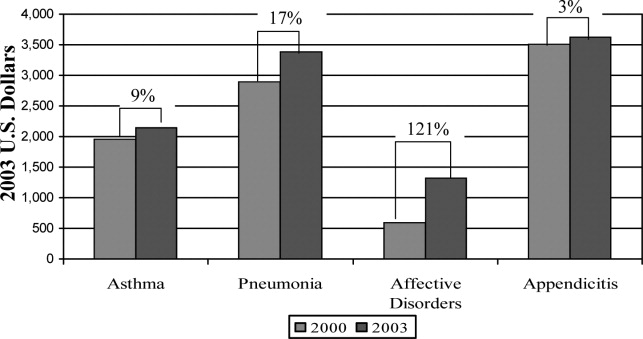
In Table 2, we present results for analyses of mean charges. Following the pattern in 2000 for all 4 of these common conditions, in 2003 the adjusted mean total hospital charges were statistically significantly higher for discharges in which obesity was listed as a secondary diagnosis, compared with those in which it was not. Moreover, the magnitude of these differences was somewhat greater in 2003 than in 2000, although it did not achieve statistical significance (P > 0.05) (Figure 2). Specifically, the difference in charges among asthma discharges with and without obesity as a comorbidity was 9% greater in 2003 than in 2000, 17% greater among pneumonia discharges, 121% greater among affective disorders, and 3% greater among appendicitis discharges.
| Adjusted Mean Charges ($) | ||||||
|---|---|---|---|---|---|---|
| 2000 | 2003 | |||||
| With Obesity | Without Obesity | Difference | With Obesity | Without Obesity | Difference | |
| ||||||
| Asthma | 8,847 | 6,884 | 1,963* | 10,589 | 8,444 | 2,145 |
| Pneumonia | 13,930 | 11,036 | 2,894* | 16,609 | 13,219 | 3,390 |
| Affective disorders | 9,446 | 8,850 | 596 | 11,942 | 10,619 | 1,323 |
| Appendicitis | 16,101 | 12,587 | 3,514 | 19,213 | 15,586 | 3,627 |
Incremental Differences in Mean LOS Associated with Obesity
Compared with those discharges without obesity coded, obesity as a secondary diagnosis was associated with a statistically significantly longer mean LOS for all four diagnoses in 2003 (Table 3). In addition, for all diagnoses except asthma, the magnitude of the difference was somewhat greater in 2003 than in 2000, although it did not reach statistical significance (P > 0.05). The greatest increase was seen with appendicitis, with the incremental difference in LOS between those with obesity and those without going from 0.17 days in 2000 to 0.83 days in 2003; an increase of over 300%.
| Adjusted Mean LOS | ||||||
|---|---|---|---|---|---|---|
| 2000 | 2003 | |||||
| With Obesity | Without Obesity | Difference | With Obesity | Without Obesity | Difference | |
| ||||||
| Asthma | 3.04 | 2.45 | 0.59* | 2.88 | 2.44 | 0.44* |
| Pneumonia | 4.26 | 3.89 | 0.37 | 4.39 | 3.83 | 0.56 |
| Affective disorders | 7.72 | 7.11 | 0.61* | 8.23 | 7.42 | 0.81* |
| Appendicitis | 3.33 | 3.16 | 0.17 | 3.91 | 3.08 | 0.83* |
DISCUSSION
Prior studies have explored the resource utilization and expenditures associated with obesity in adult populations and among obese children in the outpatient setting.48, 21 Few, however, have examined charges related to inpatient care of obese children. Our studies are the first to utilize actual charge data from a nationally representative sample to explore the economic implications of obesity among children hospitalized for common pediatric illnesses.
Our findings from this national analysis support the hypothesis that, for the 4 conditions studied, statistically significantly higher mean total hospital charges and longer mean LOS for those discharges with obesity coded as a secondary diagnosis versus those without obesity coded occurred for both 2000 and 2003, even when controlling for sex, age, race/ethnicity, region, payer, and hospital type. Our analyses also suggested that the magnitude of the incremental differences in charges from 2000 to 2003 increased somewhat, and the magnitude of the incremental differences in LOS for all of these common conditions (except asthma) is also increasing.
While these findings serve to confirm higher incremental charges and LOS associated with obesity for hospitalized children, they raise the question of why charges and LOS for children with obesity might increase at a greater rate than for those without obesity. Higher hospital charges and LOS for children with obesity coded as a secondary diagnosis may be explained by greater resource utilization due to obesity that: 1) increases the technical complexity of procedures such as surgical interventions or intravenous catheter (IV) placement;22 2) leads to greater illness severity, as has been suggested in studies of adult patients;23, 24 or 3) leads to more complications such as secondary infections.22 One explanation for the possible widening of the gap in charges during the time period studied might be that discharges coded with obesity in 2003 reflect children who were more severely obese and had a greater severity of illness, leading to higher resource utilization than those with obesity in the 2000 dataset. However, the ICD‐9‐CM code for morbid obesity (278.02) was not used more often in 2003 than in 2000. Alternatively, we suspect that between 2000 and 2003, due to an increasing awareness of the problem of childhood obesity, physicians may have become more likely to order tests or consultations specifically related to the treatment or evaluation of obesity. Other than the increase in the proportion of discharges with obesity as a comorbidity from 2000 to 2003, we were unable to explore these possible explanations with the KID datasets.
In this sample of discharges, with only 1.1% and 1.6% coded with obesity as a secondary diagnosis in 2000 and 2003, respectively, it is important to note that these discharges should not be interpreted as the prevalence of obesity in hospitalized children. Indeed, in a recent study of children hospitalized for surgical procedures at a large Midwestern tertiary care hospital, 31.6% were found to be overweight or obese.25 However, we posit that the cases coded with obesity as a secondary diagnosis in this sample represent the cases in which obesity presents a recognized factor that complicated the clinical course. Further work should explore the mechanisms by which obesity impacts the care of children hospitalized for common conditions. For example, children with obesity may require more procedures and may experience more treatment complications. These specific interventions should be the target of clinically focused analyses.
Limitations
Analyses utilizing discharge data are potentially limited by the accuracy and consistency of coding. Whether the discharges coded with obesity reflect all cases in which obesity was a complicating factor is not known. Based on the national prevalence of childhood obesity it is likely than more than 1.6% of the children hospitalized in 2003 were obese. However, whether obesity impacted the hospital course sufficiently to be included among the secondary diagnoses (as stipulated by ICD‐9‐CM guidelines for official recording)26 in more than 1.6% of cases is unknown.
This study is also limited by the inability to address the processes that might account for the consistently higher charges and longer LOS seen for those discharges coded with obesity versus those without obesity coded. The KID provides some information regarding procedures performed but cannot be reliably used to examine this aspect of patient care.27 An additional limitation of the KID data set is that it contains information about deidentified discharges. This leads to the possibility of having individual patients in the dataset with multiple hospitalizations. In this study we examined the relationship between obesity as a secondary diagnosis and incremental charges and LOS for the 4 most common clinical categories for which children are hospitalized. Findings may differ for other conditions not evaluated here. Finally, information regarding costs can only be inferred from the charge data provided by the KID. However, the ratio of charges to costs would not be expected to vary by obesity status.
CONCLUSIONS
These results extend our earlier findings of higher charges and longer LOS for pediatric discharges coded with obesity versus those without. In addition, this analysis suggests a widening gap of incremental hospital charges and LOS associated with obesity as a comorbidity for common pediatric conditions. These findings present a heightening financial imperative for further research to evaluate factors associated with greater resource utilization among obese pediatric patients.
- ,,,.Prevalence and trends in overweight among US children and adolescents, 1999–2000.JAMA.2002;288(14):1728–1732.
- ,.Epidemic increase in childhood overweight, 1986–1998.JAMA.2001;286(22):2845–2848.
- ,.Overweight children and adolescents: description, epidemiology, and demographics.Pediatrics.1998;101(Pt 2):497–504.
- ,,.National medical spending attributable to overweight and obesity: how much, and who's paying?Health Aff (Millwood).2003; (Suppl Web Exclusives):W3‐219–26.
- ,,,.The impact of obesity on rising medical spending.Health Aff (Millwood).2004;(Suppl Web Exclusives):W4‐480–6.
- ,.Current estimates of the economic cost of obesity in the United States.Obes Res.1998;6(2):97–106.
- ,,,,.Lifetime health and economic benefits of weight loss among obese persons.Am J Public Health.1999;89(10):1536–1542.
- ,,.The health and cost consequences of obesity among the future elderly.Health Aff (Millwood).2005;24(Suppl 2):W5R30–W5R41.
- ,.Economic burden of obesity in youths aged 6 to 17 years: 1979–1999.Pediatrics.2002;109(5):E81–E81.
- ,,,.Incremental hospital charges associated with obesity as a secondary diagnosis.Obesity (Silver Spring).2007;15:1895–1901.
- ,,,,,.Prevalence of overweight and obesity in the United States, 1999–2004.JAMA.2006;295(13):1549–1555.
- Healthcare Cost and Utilization Project.2005. Overview of the Kid's Inpatient Database. Available at:http://www.hcup‐us.ahrq.gov/kidoverview.jsp. Accessed December 2008.
- CDC Body Mass Index: BMI for Children and Teens. Available at: http://www.cdc.gov/nccdphp/dnpa/bmi. Accessed December2008.
- ,,,,,.Prevalence of overweight among preschool children in the United States, 1971 through 1994.Pediatrics.1997;99(4):E1.
- Healthcare Cost and Utilization Project, 2002 and 2004. Description of data elements: inpatient core file. Available at: http://www.hcup‐us.ahrq.gov/db/nation/kid/DataElements_KID_Core_2000.pdf; http://www.hcup‐us.ahrq.gov/db/nation/kid/KID_2003_CORE_Volume1_A‐L.pdf;http://www.hcup‐us. ahrq.gov/db/nation/kid/KID_2003_CORE_Volume2_M‐Z.pdf. Accessed December2008.
- .Health consequences of obesity in youth: childhood predictors of adult disease.Pediatrics.1998;101:518–525.
- ,,.Lengths of stay and costs associated with children's hospitals.Pediatrics.2005;115(4):839–844.
- ,,, et al.Health care expenditures associated with overweight and obesity among US adults: importance of age and race.Am J Public Health.2005;95(1):159–165.
- ,,,.Effects of race, insurance status, and hospital volume on perforated appendicitis in children.Pediatrics.2005;115(4):920–925.
- .Smearing estimate: a nonparametric retransformation method.J Am Stat Assoc.1983;78:605–610.
- ,,,.Resource utilization and expenditures for overweight and obese children.Arch Pediatr Adolesc Med.2007 Jan;161(1):11–14.
- ,.Appendicitis in the obese child.J Pediatr Surg.2007;42(5):857–861.
- ,.Management of the obese critically ill patient.Crit Care Clin.2001;17:187–200.
- ,,,,.Total respiratory system, lung, and chest wall mechanics in sedated‐paralyzed postoperative morbidly obese patients.Chest.1996;109:144–151.
- ,,,,.Prevalence of overweight and obesity in a U.S. pediatric surgical population.J Natl Med Assoc.2007;99(1):46–48, 50–51.
- Centers for Disease Control and Prevention. ICD‐9‐CM. Official Guidelines for Coding and Reporting. Effective April 1, 2005. Available at: http://www.cdc.gov/nchs/data/icd9/icdguide.pdf. Accessed December2008.
- ,,,.Predictors of hospital charges for children admitted with asthma.Ambul Pediatr.2006;6(1):15–20.
With increases in the prevalence of obesity among children and adults over the past 3 decades in the United States,13 healthcare expenditures attributed to obesity have climbed steadily, to over $100 billion in excess expenditures annually.4 Several studies have examined healthcare costs associated with obesity in adults,48 but these studies have not attempted to distinguish between excess expenditures in inpatient versus outpatient settings. In contrast, the only 2 national economic analyses of childhood obesity have focused exclusively on the inpatient setting, because the health and economic consequences of obesity among children may be most apparent in cases in which obesity is causally linked to other diagnoses (eg, type 2 diabetes mellitus, gall bladder disease) or is a comorbidity that complicates hospitalizations.9, 10
In our previous study of obesity as a comorbidity for hospitalized children, we examined the incremental charges and length‐of‐stay (LOS) for hospitalizations for the most common nonpregnancy/nonchildbirth pediatric diagnoses, comparing those coded with obesity as a secondary diagnosis versus those without.10 Using data from the Agency for Healthcare Research and Quality (AHRQ) Kid's Inpatient Database (KID) for the year 2000, we found that obesity was associated with higher charges and longer LOS for all 4 of the conditions studied (asthma, pneumonia, affective disorders, and appendicitis). Our findings regarding asthma and affective disorders echoed earlier analyses of hospitalizations for conditions clinically linked to obesity.9 However, our study was the first to demonstrate that childhood obesity is a clinically and economically significant complicating factor for conditions not thought to be linked to obesity (pneumonia, appendicitis).
For this current study, our objective was to use more recent child hospitalization data from 2003 to determine whether our prior findings of incremental charges and LOS associated with hospitalizations where obesity was coded as a secondary diagnosis compared to those where it was not, were stable over time, and whether the magnitude of differences was consistent over a period of 4 years. We hypothesized that incremental differences in hospital charges and LOS between discharges with and without obesity would be seen in the 2003 data and that the magnitude of these differences in 2003 would be similar to those in 2000. Because obesity prevalence among children increased from 2000 to 2003,11 we also hypothesized that there would be a corresponding increase in the proportion of hospitalizations with obesity as a comorbidity.
METHODS
Data Source and Sample
We analyzed data from the AHRQ KID. The KID is a nationally representative sample of annual pediatric hospital discharges. Analysis using the KID allows for improved estimates due to the discharges from community, nonrehabilitation hospitals.12 It provides data found in standard hospital discharge abstracts for more than 2 million pediatric discharges, including International Classification of Diseases, Ninth Revision, Clinical Modification (ICD‐9‐CM) codes, LOS, total hospital charges, and patient demographic information.12 Our original analysis (published in Obesity, July 2007)10 utilized data from the 2000 KID. For this analysis we utilized data from the 2003 KID (the most recent version available), and for comparison we converted the results from the 2000 study into 2003 dollars using the Consumer Price Index for Medical Care.
Using ICD‐9‐CM codes, the KID provides the principal diagnosis for each discharge, along with up to 14 secondary diagnoses. It also provides Clinical Classification Software (CCS) codes, a diagnostic categorization scheme that permits grouping of related conditions. ICD‐9‐CM codes are collapsed into a smaller number of categories that are sometimes more useful for presenting descriptive statistics than are individual ICD‐9‐CM codes or the much broader categories of Diagnosis Related Groups (DRGs). For example, all ICD‐9‐CM codes for specific types of pneumonia would be grouped together under 1 CCS code but would exclude other respiratory conditions such as pneumothorax which would generally be included in the respiratory condition DRG.12
The 2000 KID contained 2,516,833 unweighted discharges, representing 7,291,038 discharges in the population. In the 2003 KID, there were 2,984,129 unweighted discharges representing 7,409,162 discharges in the population. Our sample included all discharges for nonpregnancy‐related conditions, in children 2 years of age (due to the Centers for Disease Control definition for overweight based on body mass index [BMI] that starts at age 2 years)13, 14 to 18 years of age (2000 weighted n = 1,527,309; 2003 weighted n = 1,613,258); these numbers exclude discharges with obesity as a primary diagnosis.
Key Variables
Our outcome variables were LOS and total charges for each of the common nonpregnancy‐related principal discharge diagnoses studied. For the 2000 and 2003 KID, total charges included all hospital fees with the exception of professional fees.15
The main independent variable of interest was presence of obesity as a secondary diagnosis. Discharges were classified as either with or without obesity based on the presence of the ICD‐9‐CM code 278.0x as a secondary diagnosis (1 if yes, 0 if no). This code captures obesity unspecified (278.00), overweight (278.01), and morbid obesity (278.02). Of note, the distribution of these codes did not vary significantly between the 2 study years.
Other independent variables included sex, age (2‐5 years, 6‐10 years, 11‐14 years, and 15‐18 years), race/ethnicity (white, black, Hispanic, and other), region (Northeast, Midwest, South, and West), hospital type (based on classification by the National Association of Children's Hospitals and Related Institutions [NACHRI] as general hospital, children's unit in a general hospital, and children's hospital) and expected primary payer (Medicaid, private, and other). We chose independent variables due to their established association with our outcomes and for their patterns of association with childhood obesity.
We did not include LOS as a covariate in models of charges because obesity may have been associated with the outcome indirectly through LOS as well as directly as a main effect. To fully interpret the combination of these effects would require analyses beyond the scope of this work.
Analyses
Using CCS codes, we identified the 4 most common principal nonpregnancy‐related discharge diagnoses for children 2‐18 years old. For both 2000 and 2003 these were asthma (CCS 128), pneumonia (CCS 122), affective disorders (eg, depression and bipolar disorder) (CCS 69), and appendicitis (CCS 142). Importantly, this group of diagnoses included conditions clinically associated with obesity (asthma and affective disorders)16 and conditions not associated with obesity (pneumonia and appendicitis). Given this distinction we analyzed the 4 conditions separately.
For all discharges with these common principal diagnoses, we calculated mean LOS and mean total charges. Bivariate and multivariable analyses were conducted using simple and multiple linear regression, respectively. These analyses were designed to test the study hypothesis that obesity as a secondary diagnosis is associated with incremental economic charges and LOS. All analyses were performed on log‐transformed LOS and charge data. We included in our models those characteristics that we hypothesized were potentially related to hospital charges and LOS, based on published literature,4, 17, 18 and for that reason all covariates were retained in the final models regardless of bivariate findings. Differences in the incremental LOS and charges for 2003 versus 2000 were compared using t‐tests.
For each independent variable with missing data, we included in the analyses a category for unreported values. The KID is known to have a large number of missing data for race/ethnicity; therefore, in keeping with other studies utilizing the KID,10, 19 we also conducted multivariate analyses excluding those discharges with unreported race as a sensitivity analysis. Of note, analyses of these data excluding children of unreported race were not substantively different than those in which the unreported group was included. We present our findings including the unreported race category.
Predicted values on the log scale, for those with obesity and without obesity as a secondary diagnosis adjusted for the listed covariates, were obtained. We then back‐transformed these to their original scales and units using methods developed by Duan.20 For each principal diagnosis category, we analyzed the differences in predicted mean LOS and predicted mean total charges between discharges with and without obesity as a secondary diagnosis, adjusted for the listed covariates, using the P values obtained from the regression analyses. All results are presented in 2003 dollars.
In keeping with our earlier analysis we considered the potential influence of comorbidities other than obesity on LOS and charges. Therefore, we examined whether other comorbidities were coded more frequently among those discharges with obesity as a secondary diagnosis than those discharges without obesity. As seen in the 2000 KID, the 2003 data revealed that diabetes was more commonly seen with obesity‐related hospitalizations than with those hospitalizations without obesity. However, the proportion of discharges with obesity and diabetes was low for all of the principal diagnostic categories studied (asthma 4.8%, pneumonia 6.0%, affective disorders 4.2%, and appendicitis 1.9%). Thus, we judged the co‐occurrence of diabetes and obesity as secondary diagnoses too infrequent to be an explanatory factor for the overall incremental differences in LOS and charges.
All analyses were weighted to account for the complex probability sampling of the dataset and permit inferences regarding national hospital discharge patterns. The same sample of discharges was used to analyze LOS and charges, with the discharge weighting variable (DISCWT) used for all analyses. All results are presented as weighted data unless otherwise noted. Analyses were conducted using STATA 8.0 (Stata Corporation, College Station, TX) and SUDAAN version 9 (Research Triangle Institute, Research Triangle Park, NC).
This study was approved by the Institutional Review Board of the University of Michigan Medical School.
RESULTS
Sample Characteristics
The characteristics of the study population are presented in Table 1. In 2003, the overall proportion of nonpregnancy‐related discharges for children 2‐18 years old coded with obesity as a secondary diagnosis was 1.6%, an increase from 1.1% in 2000. Within the 4 most common nonpregnancy‐related CCS category diagnoses (asthma, pneumonia, affective disorders, and appendicitis) the proportion of discharges with obesity coded as a secondary diagnosis increased from 2000 to 2003 (Figure 1)
| Variables | Discharges | |||
|---|---|---|---|---|
| With Obesity as Secondary Diagnosis | Without Obesity | |||
| 2000 | 2003 | 2000 | 2003 | |
| Unweighted, n | 8,696 | 15,546 | 762,407 | 943,182 |
| Weighted population size | 17,672 | 25,709 | 1,509,637 | 1,587,549 |
| Age | ||||
| 2‐5 years (%) | 4.8 | 4.8 | 27.4 | 29.0 |
| 6‐10 years (%) | 14.7 | 15.9 | 22.4 | 22.3 |
| 11‐14 years (%) | 34.4 | 34.1 | 20.9 | 20.9 |
| 15‐18 years (%) | 46.1 | 45.2 | 29.3 | 27.8 |
| Sex | ||||
| Male (%) | 45.5 | 46.8 | 53.8 | 53.4 |
| Race/Ethnicity | ||||
| White (%) | 46.8 | 32.2 | 50.9 | 39.3 |
| Black (%) | 20.7 | 20.4 | 14.3 | 12.6 |
| Hispanic (%) | 14.9 | 16.8 | 14.3 | 14.4 |
| Other (%) | 4.8 | 5.0 | 5.6 | 5.6 |
| Unreported (%) | 12.8 | 25.6 | 14.9 | 28.1 |
| Payer | ||||
| Medicaid (%) | 42.6 | 46.5 | 32.1 | 36.9 |
| Private (%) | 47.1 | 42.6 | 58.0 | 53.3 |
| Other (%) | 9.4 | 10.6 | 9.4 | 9.6 |
| Unreported (%) | 0.9 | 0.3 | 0.5 | 0.2 |
| Hospital Region | ||||
| Northeast (%) | 17.3 | 15.9 | 21.7 | 18.7 |
| Midwest (%) | 24.6 | 24.8 | 20.0 | 23.3 |
| South (%) | 37.6 | 38.4 | 36.3 | 37.0 |
| West (%) | 20.5 | 20.9 | 22.0 | 21.0 |
| Hospital type | ||||
| General hospital (%) | 68.2 | 61.4 | 61.0 | 57.1 |
| Children's unit in general hospital (%) | 15.2 | 17.8 | 18.6 | 19.2 |
| Children's hospitals (%) | 14.3 | 14.9 | 17.9 | 17.6 |
| Unreported (%) | 2.3% | 5.9 | 2.5 | 6.1 |
Incremental Differences in Mean Charges Associated with Obesity
In Table 2, we present results for analyses of mean charges. Following the pattern in 2000 for all 4 of these common conditions, in 2003 the adjusted mean total hospital charges were statistically significantly higher for discharges in which obesity was listed as a secondary diagnosis, compared with those in which it was not. Moreover, the magnitude of these differences was somewhat greater in 2003 than in 2000, although it did not achieve statistical significance (P > 0.05) (Figure 2). Specifically, the difference in charges among asthma discharges with and without obesity as a comorbidity was 9% greater in 2003 than in 2000, 17% greater among pneumonia discharges, 121% greater among affective disorders, and 3% greater among appendicitis discharges.
| Adjusted Mean Charges ($) | ||||||
|---|---|---|---|---|---|---|
| 2000 | 2003 | |||||
| With Obesity | Without Obesity | Difference | With Obesity | Without Obesity | Difference | |
| ||||||
| Asthma | 8,847 | 6,884 | 1,963* | 10,589 | 8,444 | 2,145 |
| Pneumonia | 13,930 | 11,036 | 2,894* | 16,609 | 13,219 | 3,390 |
| Affective disorders | 9,446 | 8,850 | 596 | 11,942 | 10,619 | 1,323 |
| Appendicitis | 16,101 | 12,587 | 3,514 | 19,213 | 15,586 | 3,627 |
Incremental Differences in Mean LOS Associated with Obesity
Compared with those discharges without obesity coded, obesity as a secondary diagnosis was associated with a statistically significantly longer mean LOS for all four diagnoses in 2003 (Table 3). In addition, for all diagnoses except asthma, the magnitude of the difference was somewhat greater in 2003 than in 2000, although it did not reach statistical significance (P > 0.05). The greatest increase was seen with appendicitis, with the incremental difference in LOS between those with obesity and those without going from 0.17 days in 2000 to 0.83 days in 2003; an increase of over 300%.
| Adjusted Mean LOS | ||||||
|---|---|---|---|---|---|---|
| 2000 | 2003 | |||||
| With Obesity | Without Obesity | Difference | With Obesity | Without Obesity | Difference | |
| ||||||
| Asthma | 3.04 | 2.45 | 0.59* | 2.88 | 2.44 | 0.44* |
| Pneumonia | 4.26 | 3.89 | 0.37 | 4.39 | 3.83 | 0.56 |
| Affective disorders | 7.72 | 7.11 | 0.61* | 8.23 | 7.42 | 0.81* |
| Appendicitis | 3.33 | 3.16 | 0.17 | 3.91 | 3.08 | 0.83* |
DISCUSSION
Prior studies have explored the resource utilization and expenditures associated with obesity in adult populations and among obese children in the outpatient setting.48, 21 Few, however, have examined charges related to inpatient care of obese children. Our studies are the first to utilize actual charge data from a nationally representative sample to explore the economic implications of obesity among children hospitalized for common pediatric illnesses.
Our findings from this national analysis support the hypothesis that, for the 4 conditions studied, statistically significantly higher mean total hospital charges and longer mean LOS for those discharges with obesity coded as a secondary diagnosis versus those without obesity coded occurred for both 2000 and 2003, even when controlling for sex, age, race/ethnicity, region, payer, and hospital type. Our analyses also suggested that the magnitude of the incremental differences in charges from 2000 to 2003 increased somewhat, and the magnitude of the incremental differences in LOS for all of these common conditions (except asthma) is also increasing.
While these findings serve to confirm higher incremental charges and LOS associated with obesity for hospitalized children, they raise the question of why charges and LOS for children with obesity might increase at a greater rate than for those without obesity. Higher hospital charges and LOS for children with obesity coded as a secondary diagnosis may be explained by greater resource utilization due to obesity that: 1) increases the technical complexity of procedures such as surgical interventions or intravenous catheter (IV) placement;22 2) leads to greater illness severity, as has been suggested in studies of adult patients;23, 24 or 3) leads to more complications such as secondary infections.22 One explanation for the possible widening of the gap in charges during the time period studied might be that discharges coded with obesity in 2003 reflect children who were more severely obese and had a greater severity of illness, leading to higher resource utilization than those with obesity in the 2000 dataset. However, the ICD‐9‐CM code for morbid obesity (278.02) was not used more often in 2003 than in 2000. Alternatively, we suspect that between 2000 and 2003, due to an increasing awareness of the problem of childhood obesity, physicians may have become more likely to order tests or consultations specifically related to the treatment or evaluation of obesity. Other than the increase in the proportion of discharges with obesity as a comorbidity from 2000 to 2003, we were unable to explore these possible explanations with the KID datasets.
In this sample of discharges, with only 1.1% and 1.6% coded with obesity as a secondary diagnosis in 2000 and 2003, respectively, it is important to note that these discharges should not be interpreted as the prevalence of obesity in hospitalized children. Indeed, in a recent study of children hospitalized for surgical procedures at a large Midwestern tertiary care hospital, 31.6% were found to be overweight or obese.25 However, we posit that the cases coded with obesity as a secondary diagnosis in this sample represent the cases in which obesity presents a recognized factor that complicated the clinical course. Further work should explore the mechanisms by which obesity impacts the care of children hospitalized for common conditions. For example, children with obesity may require more procedures and may experience more treatment complications. These specific interventions should be the target of clinically focused analyses.
Limitations
Analyses utilizing discharge data are potentially limited by the accuracy and consistency of coding. Whether the discharges coded with obesity reflect all cases in which obesity was a complicating factor is not known. Based on the national prevalence of childhood obesity it is likely than more than 1.6% of the children hospitalized in 2003 were obese. However, whether obesity impacted the hospital course sufficiently to be included among the secondary diagnoses (as stipulated by ICD‐9‐CM guidelines for official recording)26 in more than 1.6% of cases is unknown.
This study is also limited by the inability to address the processes that might account for the consistently higher charges and longer LOS seen for those discharges coded with obesity versus those without obesity coded. The KID provides some information regarding procedures performed but cannot be reliably used to examine this aspect of patient care.27 An additional limitation of the KID data set is that it contains information about deidentified discharges. This leads to the possibility of having individual patients in the dataset with multiple hospitalizations. In this study we examined the relationship between obesity as a secondary diagnosis and incremental charges and LOS for the 4 most common clinical categories for which children are hospitalized. Findings may differ for other conditions not evaluated here. Finally, information regarding costs can only be inferred from the charge data provided by the KID. However, the ratio of charges to costs would not be expected to vary by obesity status.
CONCLUSIONS
These results extend our earlier findings of higher charges and longer LOS for pediatric discharges coded with obesity versus those without. In addition, this analysis suggests a widening gap of incremental hospital charges and LOS associated with obesity as a comorbidity for common pediatric conditions. These findings present a heightening financial imperative for further research to evaluate factors associated with greater resource utilization among obese pediatric patients.
- ,,,.Prevalence and trends in overweight among US children and adolescents, 1999–2000.JAMA.2002;288(14):1728–1732.
- ,.Epidemic increase in childhood overweight, 1986–1998.JAMA.2001;286(22):2845–2848.
- ,.Overweight children and adolescents: description, epidemiology, and demographics.Pediatrics.1998;101(Pt 2):497–504.
- ,,.National medical spending attributable to overweight and obesity: how much, and who's paying?Health Aff (Millwood).2003; (Suppl Web Exclusives):W3‐219–26.
- ,,,.The impact of obesity on rising medical spending.Health Aff (Millwood).2004;(Suppl Web Exclusives):W4‐480–6.
- ,.Current estimates of the economic cost of obesity in the United States.Obes Res.1998;6(2):97–106.
- ,,,,.Lifetime health and economic benefits of weight loss among obese persons.Am J Public Health.1999;89(10):1536–1542.
- ,,.The health and cost consequences of obesity among the future elderly.Health Aff (Millwood).2005;24(Suppl 2):W5R30–W5R41.
- ,.Economic burden of obesity in youths aged 6 to 17 years: 1979–1999.Pediatrics.2002;109(5):E81–E81.
- ,,,.Incremental hospital charges associated with obesity as a secondary diagnosis.Obesity (Silver Spring).2007;15:1895–1901.
- ,,,,,.Prevalence of overweight and obesity in the United States, 1999–2004.JAMA.2006;295(13):1549–1555.
- Healthcare Cost and Utilization Project.2005. Overview of the Kid's Inpatient Database. Available at:http://www.hcup‐us.ahrq.gov/kidoverview.jsp. Accessed December 2008.
- CDC Body Mass Index: BMI for Children and Teens. Available at: http://www.cdc.gov/nccdphp/dnpa/bmi. Accessed December2008.
- ,,,,,.Prevalence of overweight among preschool children in the United States, 1971 through 1994.Pediatrics.1997;99(4):E1.
- Healthcare Cost and Utilization Project, 2002 and 2004. Description of data elements: inpatient core file. Available at: http://www.hcup‐us.ahrq.gov/db/nation/kid/DataElements_KID_Core_2000.pdf; http://www.hcup‐us.ahrq.gov/db/nation/kid/KID_2003_CORE_Volume1_A‐L.pdf;http://www.hcup‐us. ahrq.gov/db/nation/kid/KID_2003_CORE_Volume2_M‐Z.pdf. Accessed December2008.
- .Health consequences of obesity in youth: childhood predictors of adult disease.Pediatrics.1998;101:518–525.
- ,,.Lengths of stay and costs associated with children's hospitals.Pediatrics.2005;115(4):839–844.
- ,,, et al.Health care expenditures associated with overweight and obesity among US adults: importance of age and race.Am J Public Health.2005;95(1):159–165.
- ,,,.Effects of race, insurance status, and hospital volume on perforated appendicitis in children.Pediatrics.2005;115(4):920–925.
- .Smearing estimate: a nonparametric retransformation method.J Am Stat Assoc.1983;78:605–610.
- ,,,.Resource utilization and expenditures for overweight and obese children.Arch Pediatr Adolesc Med.2007 Jan;161(1):11–14.
- ,.Appendicitis in the obese child.J Pediatr Surg.2007;42(5):857–861.
- ,.Management of the obese critically ill patient.Crit Care Clin.2001;17:187–200.
- ,,,,.Total respiratory system, lung, and chest wall mechanics in sedated‐paralyzed postoperative morbidly obese patients.Chest.1996;109:144–151.
- ,,,,.Prevalence of overweight and obesity in a U.S. pediatric surgical population.J Natl Med Assoc.2007;99(1):46–48, 50–51.
- Centers for Disease Control and Prevention. ICD‐9‐CM. Official Guidelines for Coding and Reporting. Effective April 1, 2005. Available at: http://www.cdc.gov/nchs/data/icd9/icdguide.pdf. Accessed December2008.
- ,,,.Predictors of hospital charges for children admitted with asthma.Ambul Pediatr.2006;6(1):15–20.
Copyright © 2009 Society of Hospital Medicine