User login
OUs and Patient Outcomes
Many pediatric hospitalizations are of short duration, and more than half of short‐stay hospitalizations are designated as observation status.[1, 2] Observation status is an administrative label assigned to patients who do not meet hospital or payer criteria for inpatient‐status care. Short‐stay observation‐status patients do not fit in traditional models of emergency department (ED) or inpatient care. EDs often focus on discharging or admitting patients within a matter of hours, whereas inpatient units tend to measure length of stay (LOS) in terms of days[3] and may not have systems in place to facilitate rapid discharge of short‐stay patients.[4] Observation units (OUs) have been established in some hospitals to address the unique care needs of short‐stay patients.[5, 6, 7]
Single‐site reports from children's hospitals with successful OUs have demonstrated shorter LOS and lower costs compared with inpatient settings.[6, 8, 9, 10, 11, 12, 13, 14] No prior study has examined hospital‐level effects of an OU on observation‐status patient outcomes. The Pediatric Health Information System (PHIS) database provides a unique opportunity to explore this question, because unlike other national hospital administrative databases,[15, 16] the PHIS dataset contains information about children under observation status. In addition, we know which PHIS hospitals had a dedicated OU in 2011.7
We hypothesized that overall observation‐status stays in hospitals with a dedicated OU would be of shorter duration with earlier discharges at lower cost than observation‐status stays in hospitals without a dedicated OU. We compared hospitals with and without a dedicated OU on secondary outcomes including rates of conversion to inpatient status and return care for any reason.
METHODS
We conducted a cross‐sectional analysis of hospital administrative data using the 2011 PHIS databasea national administrative database that contains resource utilization data from 43 participating hospitals located in 26 states plus the District of Columbia. These hospitals account for approximately 20% of pediatric hospitalizations in the United States.
For each hospital encounter, PHIS includes patient demographics, up to 41 International Classification of Diseases, Ninth Revision, Clinical Modification (ICD‐9‐CM) diagnoses, up to 41 ICD‐9‐CM procedures, and hospital charges for services. Data are deidentified prior to inclusion, but unique identifiers allow for determination of return visits and readmissions following an index visit for an individual patient. Data quality and reliability are assured jointly by the Children's Hospital Association (formerly Child Health Corporation of America, Overland Park, KS), participating hospitals, and Truven Health Analytics (New York, NY). This study, using administrative data, was not considered human subjects research by the policies of the Cincinnati Children's Hospital Medical Center Institutional Review Board.
Hospital Selection and Hospital Characteristics
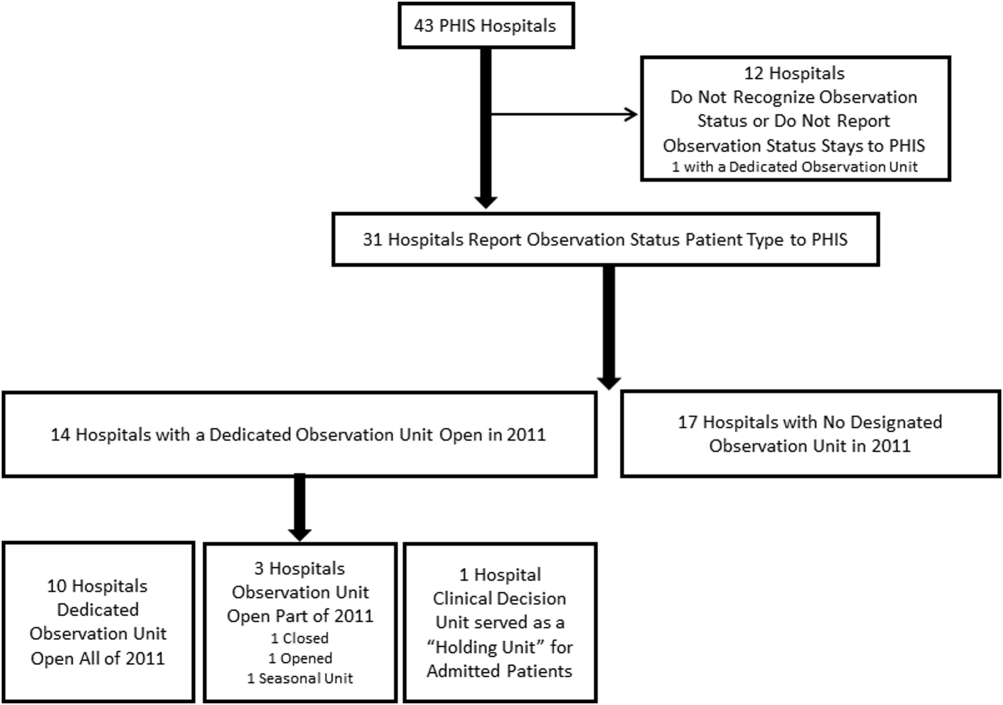
The study sample was drawn from the 31 hospitals that reported observation‐status patient data to PHIS in 2011. Analyses were conducted in 2013, at which time 2011 was the most recent year of data. We categorized 14 hospitals as having a dedicated OU during 2011 based on information collected in 2013.7 To summarize briefly, we interviewed by telephone representatives of hospitals responding to an email query as to the presence of a geographically distinct OU for the care of unscheduled patients from the ED. Three of the 14 representatives reported their hospital had 2 OUs, 1 of which was a separate surgical OU. Ten OUs cared for both ED patients and patients with scheduled procedures; 8 units received patients from non‐ED sources. Hospitalists provided staffing in more than half of the OUs.
We attempted to identify administrative data that would signal care delivered in a dedicated OU using hospital charge codes reported to PHIS, but learned this was not possible due to between‐hospital variation in the specificity of the charge codes. Therefore, we were unable to determine if patient care was delivered in a dedicated OU or another setting, such as a general inpatient unit or the ED. Other hospital characteristics available from the PHIS dataset included the number of inpatient beds, ED visits, inpatient admissions, observation‐status stays, and payer mix. We calculated the percentage of ED visits resulting in admission by dividing the number of ED visits with associated inpatient or observation status by the total number of ED visits and the percentage of admissions under observation status by dividing the number of observation‐status stays by the total number of admissions under observation or inpatient status.
Visit Selection and Patient Characteristics
All observation‐status stays regardless of the point of entry into the hospital were eligible for this study. We excluded stays that were birth‐related, included intensive care, or resulted in transfer or death. Patient demographic characteristics used to describe the cohort included age, gender, race/ethnicity, and primary payer. Stays that began in the ED were identified by an emergency room charge within PHIS. Eligible stays were categorized using All Patient Refined Diagnosis Related Groups (APR‐DRGs) version 24 using the ICD‐9‐CM code‐based proprietary 3M software (3M Health Information Systems, St. Paul, MN). We determined the 15 top‐ranking APR‐DRGs among observation‐status stays in hospitals with a dedicated OU and hospitals without. Procedural stays were identified based on procedural APR‐DRGs (eg, tonsil and adenoid procedures) or the presence of an ICD‐9‐CM procedure code (eg, 331 spinal tap).
Measured Outcomes
Outcomes of observation‐status stays were determined within 4 categories: (1) LOS, (2) standardized costs, (3) conversion to inpatient status, and (4) return visits and readmissions. LOS was calculated in terms of nights spent in hospital for all stays by subtracting the discharge date from the admission date and in terms of hours for stays in the 28 hospitals that report admission and discharge hour to the PHIS database. Discharge timing was examined in 4, 6‐hour blocks starting at midnight. Standardized costs were derived from a charge master index that was created by taking the median costs from all PHIS hospitals for each charged service.[17] Standardized costs represent the estimated cost of providing any particular clinical activity but are not the cost to patients, nor do they represent the actual cost to any given hospital. This approach allows for cost comparisons across hospitals, without biases arising from using charges or from deriving costs using hospitals' ratios of costs to charges.[18] Conversion from observation to inpatient status was calculated by dividing the number of inpatient‐status stays with observation codes by the number of observation‐statusonly stays plus the number of inpatient‐status stays with observation codes. All‐cause 3‐day ED return visits and 30‐day readmissions to the same hospital were assessed using patient‐specific identifiers that allowed for tracking of ED return visits and readmissions following the index observation stay.
Data Analysis
Descriptive statistics were calculated for hospital and patient characteristics using medians and interquartile ranges (IQRs) for continuous factors and frequencies with percentages for categorical factors. Comparisons of these factors between hospitals with dedicated OUs and without were made using [2] and Wilcoxon rank sum tests as appropriate. Multivariable regression was performed using generalized linear mixed models treating hospital as a random effect and used patient age, the case‐mix index based on the APR‐DRG severity of illness, ED visit, and procedures associated with the index observation‐status stay. For continuous outcomes, we performed a log transformation on the outcome, confirmed the normality assumption, and back transformed the results. Sensitivity analyses were conducted to compare LOS, standardized costs, and conversation rates by hospital type for 10 of the 15 top‐ranking APR‐DRGs commonly cared for by pediatric hospitalists and to compare hospitals that reported the presence of an OU that was consistently open (24 hours per day, 7 days per week) and operating during the entire 2011 calendar year, and those without. Based on information gathered from the telephone interviews, hospitals with partially open OUs were similar to hospitals with continuously open OUs, such that they were included in our main analyses. All statistical analyses were performed using SAS version 9.3 (SAS Institute, Cary, NC). P values <0.05 were considered statistically significant.
RESULTS
Hospital Characteristics
Dedicated OUs were present in 14 of the 31 hospitals that reported observation‐status patient data to PHIS (Figure 1). Three of these hospitals had OUs that were open for 5 months or less in 2011; 1 unit opened, 1 unit closed, and 1 hospital operated a seasonal unit. The remaining 17 hospitals reported no OU that admitted unscheduled patients from the ED during 2011. Hospitals with a dedicated OU had more inpatient beds and higher median number of inpatient admissions than those without (Table 1). Hospitals were statistically similar in terms of total volume of ED visits, percentage of ED visits resulting in admission, total number of observation‐status stays, percentage of admissions under observation status, and payer mix.

| Overall, Median (IQR) | Hospitals With a Dedicated Observation Unit, Median (IQR) | Hospitals Without a Dedicated Observation Unit, Median (IQR) | P Value | |
|---|---|---|---|---|
| ||||
| No. of hospitals | 31 | 14 | 17 | |
| Total no. of inpatient beds | 273 (213311) | 304 (269425) | 246 (175293) | 0.006 |
| Total no. ED visits | 62971 (47,50497,723) | 87,892 (55,102117,119) | 53,151 (4750470,882) | 0.21 |
| ED visits resulting in admission, % | 13.1 (9.715.0) | 13.8 (10.5, 19.1) | 12.5 (9.714.5) | 0.31 |
| Total no. of inpatient admissions | 11,537 (9,26814,568) | 13,206 (11,32517,869) | 10,207 (8,64013,363) | 0.04 |
| Admissions under observation status, % | 25.7 (19.733.8) | 25.5 (21.431.4) | 26.0 (16.935.1) | 0.98 |
| Total no. of observation stays | 3,820 (27935672) | 4,850 (3,309 6,196) | 3,141 (2,3654,616) | 0.07 |
| Government payer, % | 60.2 (53.371.2) | 62.1 (54.9, 65.9) | 59.2 (53.373.7) | 0.89 |
Observation‐Status Patients by Hospital Type
In 2011, there were a total of 136,239 observation‐status stays69,983 (51.4%) within the 14 hospitals with a dedicated OU and 66,256 (48.6%) within the 17 hospitals without. Patient care originated in the ED for 57.8% observation‐status stays in hospitals with an OU compared with 53.0% of observation‐status stays in hospitals without (P<0.001). Compared with hospitals with a dedicated OU, those without a dedicated OU had higher percentages of observation‐status patients older than 12 years and non‐Hispanic and a higher percentage of observation‐status patients with private payer type (Table 2). The 15 top‐ranking APR‐DRGs accounted for roughly half of all observation‐status stays and were relatively consistent between hospitals with and without a dedicated OU (Table 3). Procedural care was frequently associated with observation‐status stays.
| Overall, No. (%) | Hospitals With a Dedicated Observation Unit, No. (%)* | Hospitals Without a Dedicated Observation Unit, No. (%) | P Value | |
|---|---|---|---|---|
| ||||
| Age | ||||
| <1 year | 23,845 (17.5) | 12,101 (17.3) | 11,744 (17.7) | <0.001 |
| 15 years | 53,405 (38.5) | 28,052 (40.1) | 24,353 (36.8) | |
| 612 years | 33,674 (24.7) | 17,215 (24.6) | 16,459 (24.8) | |
| 1318 years | 23,607 (17.3) | 11,472 (16.4) | 12,135 (18.3) | |
| >18 years | 2,708 (2) | 1,143 (1.6) | 1,565 (2.4) | |
| Gender | ||||
| Male | 76,142 (55.9) | 39,178 (56) | 36,964 (55.8) | 0.43 |
| Female | 60,025 (44.1) | 30,756 (44) | 29,269 (44.2) | |
| Race/ethnicity | ||||
| Non‐Hispanic white | 72,183 (53.0) | 30,653 (43.8) | 41,530 (62.7) | <0.001 |
| Non‐Hispanic black | 30,995 (22.8) | 16,314 (23.3) | 14,681 (22.2) | |
| Hispanic | 21,255 (15.6) | 16,583 (23.7) | 4,672 (7.1) | |
| Asian | 2,075 (1.5) | 1,313 (1.9) | 762 (1.2) | |
| Non‐Hispanic other | 9,731 (7.1) | 5,120 (7.3) | 4,611 (7.0) | |
| Payer | ||||
| Government | 68,725 (50.4) | 36,967 (52.8) | 31,758 (47.9) | <0.001 |
| Private | 48,416 (35.5) | 21,112 (30.2) | 27,304 (41.2) | |
| Other | 19,098 (14.0) | 11,904 (17) | 7,194 (10.9) | |
| Observation‐Status Patients in Hospitals With a Dedicated Observation Unit* | Observation‐Status Patients in Hospitals Without a Dedicated Observation Unit | ||||||||
|---|---|---|---|---|---|---|---|---|---|
| Rank | APR‐DRG | No. | % of All Observation Status Stays | % Began in ED | Rank | APR‐DRG | No. | % of All Observation Status Stays | % Began in ED |
| |||||||||
| 1 | Tonsil and adenoid procedures | 4,621 | 6.6 | 1.3 | 1 | Tonsil and adenoid procedures | 3,806 | 5.7 | 1.6 |
| 2 | Asthma | 4,246 | 6.1 | 85.3 | 2 | Asthma | 3,756 | 5.7 | 79.0 |
| 3 | Seizure | 3,516 | 5.0 | 52.0 | 3 | Seizure | 2,846 | 4.3 | 54.9 |
| 4 | Nonbacterial gastroenteritis | 3,286 | 4.7 | 85.8 | 4 | Upper respiratory infections | 2,733 | 4.1 | 69.6 |
| 5 | Bronchiolitis, RSV pneumonia | 3,093 | 4.4 | 78.5 | 5 | Nonbacterial gastroenteritis | 2,682 | 4.0 | 74.5 |
| 6 | Upper respiratory infections | 2,923 | 4.2 | 80.0 | 6 | Other digestive system diagnoses | 2,545 | 3.8 | 66.3 |
| 7 | Other digestive system diagnoses | 2,064 | 2.9 | 74.0 | 7 | Bronchiolitis, RSV pneumonia | 2,544 | 3.8 | 69.2 |
| 8 | Respiratory signs, symptoms, diagnoses | 2,052 | 2.9 | 81.6 | 8 | Shoulder and arm procedures | 1,862 | 2.8 | 72.6 |
| 9 | Other ENT/cranial/facial diagnoses | 1,684 | 2.4 | 43.6 | 9 | Appendectomy | 1,785 | 2.7 | 79.2 |
| 10 | Shoulder and arm procedures | 1,624 | 2.3 | 79.1 | 10 | Other ENT/cranial/facial diagnoses | 1,624 | 2.5 | 29.9 |
| 11 | Abdominal pain | 1,612 | 2.3 | 86.2 | 11 | Abdominal pain | 1,461 | 2.2 | 82.3 |
| 12 | Fever | 1,494 | 2.1 | 85.1 | 12 | Other factors influencing health status | 1,461 | 2.2 | 66.3 |
| 13 | Appendectomy | 1,465 | 2.1 | 66.4 | 13 | Cellulitis/other bacterial skin infections | 1,383 | 2.1 | 84.2 |
| 14 | Cellulitis/other bacterial skin infections | 1,393 | 2.0 | 86.4 | 14 | Respiratory signs, symptoms, diagnoses | 1,308 | 2.0 | 39.1 |
| 15 | Pneumonia NEC | 1,356 | 1.9 | 79.1 | 15 | Pneumonia NEC | 1,245 | 1.9 | 73.1 |
| Total | 36,429 | 52.0 | 57.8 | Total | 33,041 | 49.87 | 53.0 | ||
Outcomes of Observation‐Status Stays
A greater percentage of observation‐status stays in hospitals with a dedicated OU experienced a same‐day discharge (Table 4). In addition, a higher percentage of discharges occurred between midnight and 11 am in hospitals with a dedicated OU. However, overall risk‐adjusted LOS in hours (12.8 vs 12.2 hours, P=0.90) and risk‐adjusted total standardized costs ($2551 vs $2433, P=0.75) were similar between hospital types. These findings were consistent within the 1 APR‐DRGs commonly cared for by pediatric hospitalists (see Supporting Information, Appendix 1, in the online version of this article). Overall, conversion from observation to inpatient status was significantly higher in hospitals with a dedicated OU compared with hospitals without; however, this pattern was not consistent across the 10 APR‐DRGs commonly cared for by pediatric hospitalists (see Supporting Information, Appendix 1, in the online version of this article). Adjusted odds of 3‐day ED return visits and 30‐day readmissions were comparable between hospital groups.
| Observation‐Status Patients in Hospitals With a Dedicated Observation Unit | Observation‐Status Patients in Hospitals Without a Dedicated Observation Unit | P Value | |
|---|---|---|---|
| |||
| No. of hospitals | 14 | 17 | |
| Length of stay, h, median (IQR) | 12.8 (6.923.7) | 12.2 (721.3) | 0.90 |
| 0 midnights, no. (%) | 16,678 (23.8) | 14,648 (22.1) | <.001 |
| 1 midnight, no. (%) | 46,144 (65.9) | 44,559 (67.3) | |
| 2 midnights or more, no. (%) | 7,161 (10.2) | 7,049 (10.6) | |
| Discharge timing, no. (%) | |||
| Midnight5 am | 1,223 (1.9) | 408 (0.7) | <0.001 |
| 6 am11 am | 18,916 (29.3) | 15,914 (27.1) | |
| Noon5 pm | 32,699 (50.7) | 31,619 (53.9) | |
| 6 pm11 pm | 11,718 (18.2) | 10,718 (18.3) | |
| Total standardized costs, $, median (IQR) | 2,551.3 (2,053.93,169.1) | 2,433.4 (1,998.42,963) | 0.75 |
| Conversion to inpatient status | 11.06% | 9.63% | <0.01 |
| Return care, AOR (95% CI) | |||
| 3‐day ED return visit | 0.93 (0.77‐1.12) | Referent | 0.46 |
| 30‐day readmission | 0.88 (0.67‐1.15) | Referent | 0.36 |
We found similar results in sensitivity analyses comparing observation‐status stays in hospitals with a continuously open OU (open 24 hours per day, 7 days per week, for all of 2011 [n=10 hospitals]) to those without(see Supporting Information, Appendix 2, in the online version of this article). However, there were, on average, more observation‐status stays in hospitals with a continuously open OU (median 5605, IQR 42077089) than hospitals without (median 3309, IQR 26784616) (P=0.04). In contrast to our main results, conversion to inpatient status was lower in hospitals with a continuously open OU compared with hospitals without (8.52% vs 11.57%, P<0.01).
DISCUSSION
Counter to our hypothesis, we did not find hospital‐level differences in length of stay or costs for observation‐status patients cared for in hospitals with and without a dedicated OU, though hospitals with dedicated OUs did have more same‐day discharges and more morning discharges. The lack of observed differences in LOS and costs may reflect the fact that many children under observation status are treated throughout the hospital, even in facilities with a dedicated OU. Access to a dedicated OU is limited by factors including small numbers of OU beds and specific low acuity/low complexity OU admission criteria.[7] The inclusion of all children admitted under observation status in our analyses may have diluted any effect of dedicated OUs at the hospital level, but was necessary due to the inability to identify location of care for children admitted under observation status. Location of care is an important variable that should be incorporated into administrative databases to allow for comparative effectiveness research designs. Until such data are available, chart review at individual hospitals would be necessary to determine which patients received care in an OU.
We did find that discharges for observation‐status patients occurred earlier in the day in hospitals with a dedicated OU when compared with observation‐status patients in hospitals without a dedicated OU. In addition, the percentage of same‐day discharges was higher among observation‐status patients treated in hospitals with a dedicated OU. These differences may stem from policies and procedures that encourage rapid discharge in dedicated OUs, and those practices may affect other care areas. For example, OUs may enforce policies requiring family presence at the bedside or utilize staffing models where doctors and nurses are in frequent communication, both of which would facilitate discharge as soon as a patient no longer required hospital‐based care.[7] A retrospective chart review study design could be used to identify discharge processes and other key characteristics of highly performing OUs.
We found conflicting results in our main and sensitivity analyses related to conversion to inpatient status. Lower percentages of observation‐status patients converting to inpatient status indicates greater success in the delivery of observation care based on established performance metrics.[19] Lower rates of conversion to inpatient status may be the result of stricter admission criteria for some diagnosis and in hospitals with a continuously open dedicate OU, more refined processes for utilization review that allow for patients to be placed into the correct status (observation vs inpatient) at the time of admission, or efforts to educate providers about the designation of observation status.[7] It is also possible that fewer observation‐status patients convert to inpatient status in hospitals with a continuously open dedicated OU because such a change would require movement of the patient to an inpatient bed.
These analyses were more comprehensive than our prior studies[2, 20] in that we included both patients who were treated first in the ED and those who were not. In addition to the APR‐DRGs representative of conditions that have been successfully treated in ED‐based pediatric OUs (eg, asthma, seizures, gastroenteritis, cellulitis),[8, 9, 21, 22] we found observation‐status was commonly associated with procedural care. This population of patients may be relevant to hospitalists who staff OUs that provide both unscheduled and postprocedural care. The colocation of medical and postprocedural patients has been described by others[8, 23] and was reported to occur in over half of the OUs included in this study.[7] The extent to which postprocedure observation care is provided in general OUs staffed by hospitalists represents another opportunity for further study.
Hospitals face many considerations when determining if and how they will provide observation services to patients expected to experience short stays.[7] Some hospitals may be unable to justify an OU for all or part of the year based on the volume of admissions or the costs to staff an OU.[24, 25] Other hospitals may open an OU to promote patient flow and reduce ED crowding.[26] Hospitals may also be influenced by reimbursement policies related to observation‐status stays. Although we did not observe differences in overall payer mix, we did find higher percentages of observation‐status patients in hospitals with dedicated OUs to have public insurance. Although hospital contracts with payers around observation status patients are complex and beyond the scope of this analysis, it is possible that hospitals have established OUs because of increasingly stringent rules or criteria to meet inpatient status or experiences with high volumes of observation‐status patients covered by a particular payer. Nevertheless, the brief nature of many pediatric hospitalizations and the scarcity of pediatric OU beds must be considered in policy changes that result from national discussions about the appropriateness of inpatient stays shorter than 2 nights in duration.[27]
Limitations
The primary limitation to our analyses is the lack of ability to identify patients who were treated in a dedicated OU because few hospitals provided data to PHIS that allowed for the identification of the unit or location of care. Second, it is possible that some hospitals were misclassified as not having a dedicated OU based on our survey, which initially inquired about OUs that provided care to patients first treated in the ED. Therefore, OUs that exclusively care for postoperative patients or patients with scheduled treatments may be present in hospitals that we have labeled as not having a dedicated OU. This potential misclassification would bias our results toward finding no differences. Third, in any study of administrative data there is potential that diagnosis codes are incomplete or inaccurately capture the underlying reason for the episode of care. Fourth, the experiences of the free‐standing children's hospitals that contribute data to PHIS may not be generalizable to other hospitals that provide observation care to children. Finally, return care may be underestimated, as children could receive treatment at another hospital following discharge from a PHIS hospital. Care outside of PHIS hospitals would not be captured, but we do not expect this to differ for hospitals with and without dedicated OUs. It is possible that health information exchanges will permit more comprehensive analyses of care across different hospitals in the future.
CONCLUSION
Observation status patients are similar in hospitals with and without dedicated observation units that admit children from the ED. The presence of a dedicated OU appears to have an influence on same‐day and morning discharges across all observation‐status stays without impacting other hospital‐level outcomes. Inclusion of location of care (eg, geographically distinct dedicated OU vs general inpatient unit vs ED) in hospital administrative datasets would allow for meaningful comparisons of different models of care for short‐stay observation‐status patients.
Acknowledgements
The authors thank John P. Harding, MBA, FACHE, Children's Hospital of the King's Daughters, Norfolk, Virginia for his input on the study design.
Disclosures: Dr. Hall had full access to the data and takes responsibility for the integrity of the data and the accuracy of the data analysis. Internal funds from the Children's Hospital Association supported the conduct of this work. The authors have no financial relationships or conflicts of interest to disclose.
Many pediatric hospitalizations are of short duration, and more than half of short‐stay hospitalizations are designated as observation status.[1, 2] Observation status is an administrative label assigned to patients who do not meet hospital or payer criteria for inpatient‐status care. Short‐stay observation‐status patients do not fit in traditional models of emergency department (ED) or inpatient care. EDs often focus on discharging or admitting patients within a matter of hours, whereas inpatient units tend to measure length of stay (LOS) in terms of days[3] and may not have systems in place to facilitate rapid discharge of short‐stay patients.[4] Observation units (OUs) have been established in some hospitals to address the unique care needs of short‐stay patients.[5, 6, 7]
Single‐site reports from children's hospitals with successful OUs have demonstrated shorter LOS and lower costs compared with inpatient settings.[6, 8, 9, 10, 11, 12, 13, 14] No prior study has examined hospital‐level effects of an OU on observation‐status patient outcomes. The Pediatric Health Information System (PHIS) database provides a unique opportunity to explore this question, because unlike other national hospital administrative databases,[15, 16] the PHIS dataset contains information about children under observation status. In addition, we know which PHIS hospitals had a dedicated OU in 2011.7
We hypothesized that overall observation‐status stays in hospitals with a dedicated OU would be of shorter duration with earlier discharges at lower cost than observation‐status stays in hospitals without a dedicated OU. We compared hospitals with and without a dedicated OU on secondary outcomes including rates of conversion to inpatient status and return care for any reason.
METHODS
We conducted a cross‐sectional analysis of hospital administrative data using the 2011 PHIS databasea national administrative database that contains resource utilization data from 43 participating hospitals located in 26 states plus the District of Columbia. These hospitals account for approximately 20% of pediatric hospitalizations in the United States.
For each hospital encounter, PHIS includes patient demographics, up to 41 International Classification of Diseases, Ninth Revision, Clinical Modification (ICD‐9‐CM) diagnoses, up to 41 ICD‐9‐CM procedures, and hospital charges for services. Data are deidentified prior to inclusion, but unique identifiers allow for determination of return visits and readmissions following an index visit for an individual patient. Data quality and reliability are assured jointly by the Children's Hospital Association (formerly Child Health Corporation of America, Overland Park, KS), participating hospitals, and Truven Health Analytics (New York, NY). This study, using administrative data, was not considered human subjects research by the policies of the Cincinnati Children's Hospital Medical Center Institutional Review Board.
Hospital Selection and Hospital Characteristics
The study sample was drawn from the 31 hospitals that reported observation‐status patient data to PHIS in 2011. Analyses were conducted in 2013, at which time 2011 was the most recent year of data. We categorized 14 hospitals as having a dedicated OU during 2011 based on information collected in 2013.7 To summarize briefly, we interviewed by telephone representatives of hospitals responding to an email query as to the presence of a geographically distinct OU for the care of unscheduled patients from the ED. Three of the 14 representatives reported their hospital had 2 OUs, 1 of which was a separate surgical OU. Ten OUs cared for both ED patients and patients with scheduled procedures; 8 units received patients from non‐ED sources. Hospitalists provided staffing in more than half of the OUs.
We attempted to identify administrative data that would signal care delivered in a dedicated OU using hospital charge codes reported to PHIS, but learned this was not possible due to between‐hospital variation in the specificity of the charge codes. Therefore, we were unable to determine if patient care was delivered in a dedicated OU or another setting, such as a general inpatient unit or the ED. Other hospital characteristics available from the PHIS dataset included the number of inpatient beds, ED visits, inpatient admissions, observation‐status stays, and payer mix. We calculated the percentage of ED visits resulting in admission by dividing the number of ED visits with associated inpatient or observation status by the total number of ED visits and the percentage of admissions under observation status by dividing the number of observation‐status stays by the total number of admissions under observation or inpatient status.
Visit Selection and Patient Characteristics
All observation‐status stays regardless of the point of entry into the hospital were eligible for this study. We excluded stays that were birth‐related, included intensive care, or resulted in transfer or death. Patient demographic characteristics used to describe the cohort included age, gender, race/ethnicity, and primary payer. Stays that began in the ED were identified by an emergency room charge within PHIS. Eligible stays were categorized using All Patient Refined Diagnosis Related Groups (APR‐DRGs) version 24 using the ICD‐9‐CM code‐based proprietary 3M software (3M Health Information Systems, St. Paul, MN). We determined the 15 top‐ranking APR‐DRGs among observation‐status stays in hospitals with a dedicated OU and hospitals without. Procedural stays were identified based on procedural APR‐DRGs (eg, tonsil and adenoid procedures) or the presence of an ICD‐9‐CM procedure code (eg, 331 spinal tap).
Measured Outcomes
Outcomes of observation‐status stays were determined within 4 categories: (1) LOS, (2) standardized costs, (3) conversion to inpatient status, and (4) return visits and readmissions. LOS was calculated in terms of nights spent in hospital for all stays by subtracting the discharge date from the admission date and in terms of hours for stays in the 28 hospitals that report admission and discharge hour to the PHIS database. Discharge timing was examined in 4, 6‐hour blocks starting at midnight. Standardized costs were derived from a charge master index that was created by taking the median costs from all PHIS hospitals for each charged service.[17] Standardized costs represent the estimated cost of providing any particular clinical activity but are not the cost to patients, nor do they represent the actual cost to any given hospital. This approach allows for cost comparisons across hospitals, without biases arising from using charges or from deriving costs using hospitals' ratios of costs to charges.[18] Conversion from observation to inpatient status was calculated by dividing the number of inpatient‐status stays with observation codes by the number of observation‐statusonly stays plus the number of inpatient‐status stays with observation codes. All‐cause 3‐day ED return visits and 30‐day readmissions to the same hospital were assessed using patient‐specific identifiers that allowed for tracking of ED return visits and readmissions following the index observation stay.
Data Analysis
Descriptive statistics were calculated for hospital and patient characteristics using medians and interquartile ranges (IQRs) for continuous factors and frequencies with percentages for categorical factors. Comparisons of these factors between hospitals with dedicated OUs and without were made using [2] and Wilcoxon rank sum tests as appropriate. Multivariable regression was performed using generalized linear mixed models treating hospital as a random effect and used patient age, the case‐mix index based on the APR‐DRG severity of illness, ED visit, and procedures associated with the index observation‐status stay. For continuous outcomes, we performed a log transformation on the outcome, confirmed the normality assumption, and back transformed the results. Sensitivity analyses were conducted to compare LOS, standardized costs, and conversation rates by hospital type for 10 of the 15 top‐ranking APR‐DRGs commonly cared for by pediatric hospitalists and to compare hospitals that reported the presence of an OU that was consistently open (24 hours per day, 7 days per week) and operating during the entire 2011 calendar year, and those without. Based on information gathered from the telephone interviews, hospitals with partially open OUs were similar to hospitals with continuously open OUs, such that they were included in our main analyses. All statistical analyses were performed using SAS version 9.3 (SAS Institute, Cary, NC). P values <0.05 were considered statistically significant.
RESULTS
Hospital Characteristics
Dedicated OUs were present in 14 of the 31 hospitals that reported observation‐status patient data to PHIS (Figure 1). Three of these hospitals had OUs that were open for 5 months or less in 2011; 1 unit opened, 1 unit closed, and 1 hospital operated a seasonal unit. The remaining 17 hospitals reported no OU that admitted unscheduled patients from the ED during 2011. Hospitals with a dedicated OU had more inpatient beds and higher median number of inpatient admissions than those without (Table 1). Hospitals were statistically similar in terms of total volume of ED visits, percentage of ED visits resulting in admission, total number of observation‐status stays, percentage of admissions under observation status, and payer mix.
| Overall, Median (IQR) | Hospitals With a Dedicated Observation Unit, Median (IQR) | Hospitals Without a Dedicated Observation Unit, Median (IQR) | P Value | |
|---|---|---|---|---|
| ||||
| No. of hospitals | 31 | 14 | 17 | |
| Total no. of inpatient beds | 273 (213311) | 304 (269425) | 246 (175293) | 0.006 |
| Total no. ED visits | 62971 (47,50497,723) | 87,892 (55,102117,119) | 53,151 (4750470,882) | 0.21 |
| ED visits resulting in admission, % | 13.1 (9.715.0) | 13.8 (10.5, 19.1) | 12.5 (9.714.5) | 0.31 |
| Total no. of inpatient admissions | 11,537 (9,26814,568) | 13,206 (11,32517,869) | 10,207 (8,64013,363) | 0.04 |
| Admissions under observation status, % | 25.7 (19.733.8) | 25.5 (21.431.4) | 26.0 (16.935.1) | 0.98 |
| Total no. of observation stays | 3,820 (27935672) | 4,850 (3,309 6,196) | 3,141 (2,3654,616) | 0.07 |
| Government payer, % | 60.2 (53.371.2) | 62.1 (54.9, 65.9) | 59.2 (53.373.7) | 0.89 |
Observation‐Status Patients by Hospital Type
In 2011, there were a total of 136,239 observation‐status stays69,983 (51.4%) within the 14 hospitals with a dedicated OU and 66,256 (48.6%) within the 17 hospitals without. Patient care originated in the ED for 57.8% observation‐status stays in hospitals with an OU compared with 53.0% of observation‐status stays in hospitals without (P<0.001). Compared with hospitals with a dedicated OU, those without a dedicated OU had higher percentages of observation‐status patients older than 12 years and non‐Hispanic and a higher percentage of observation‐status patients with private payer type (Table 2). The 15 top‐ranking APR‐DRGs accounted for roughly half of all observation‐status stays and were relatively consistent between hospitals with and without a dedicated OU (Table 3). Procedural care was frequently associated with observation‐status stays.
| Overall, No. (%) | Hospitals With a Dedicated Observation Unit, No. (%)* | Hospitals Without a Dedicated Observation Unit, No. (%) | P Value | |
|---|---|---|---|---|
| ||||
| Age | ||||
| <1 year | 23,845 (17.5) | 12,101 (17.3) | 11,744 (17.7) | <0.001 |
| 15 years | 53,405 (38.5) | 28,052 (40.1) | 24,353 (36.8) | |
| 612 years | 33,674 (24.7) | 17,215 (24.6) | 16,459 (24.8) | |
| 1318 years | 23,607 (17.3) | 11,472 (16.4) | 12,135 (18.3) | |
| >18 years | 2,708 (2) | 1,143 (1.6) | 1,565 (2.4) | |
| Gender | ||||
| Male | 76,142 (55.9) | 39,178 (56) | 36,964 (55.8) | 0.43 |
| Female | 60,025 (44.1) | 30,756 (44) | 29,269 (44.2) | |
| Race/ethnicity | ||||
| Non‐Hispanic white | 72,183 (53.0) | 30,653 (43.8) | 41,530 (62.7) | <0.001 |
| Non‐Hispanic black | 30,995 (22.8) | 16,314 (23.3) | 14,681 (22.2) | |
| Hispanic | 21,255 (15.6) | 16,583 (23.7) | 4,672 (7.1) | |
| Asian | 2,075 (1.5) | 1,313 (1.9) | 762 (1.2) | |
| Non‐Hispanic other | 9,731 (7.1) | 5,120 (7.3) | 4,611 (7.0) | |
| Payer | ||||
| Government | 68,725 (50.4) | 36,967 (52.8) | 31,758 (47.9) | <0.001 |
| Private | 48,416 (35.5) | 21,112 (30.2) | 27,304 (41.2) | |
| Other | 19,098 (14.0) | 11,904 (17) | 7,194 (10.9) | |
| Observation‐Status Patients in Hospitals With a Dedicated Observation Unit* | Observation‐Status Patients in Hospitals Without a Dedicated Observation Unit | ||||||||
|---|---|---|---|---|---|---|---|---|---|
| Rank | APR‐DRG | No. | % of All Observation Status Stays | % Began in ED | Rank | APR‐DRG | No. | % of All Observation Status Stays | % Began in ED |
| |||||||||
| 1 | Tonsil and adenoid procedures | 4,621 | 6.6 | 1.3 | 1 | Tonsil and adenoid procedures | 3,806 | 5.7 | 1.6 |
| 2 | Asthma | 4,246 | 6.1 | 85.3 | 2 | Asthma | 3,756 | 5.7 | 79.0 |
| 3 | Seizure | 3,516 | 5.0 | 52.0 | 3 | Seizure | 2,846 | 4.3 | 54.9 |
| 4 | Nonbacterial gastroenteritis | 3,286 | 4.7 | 85.8 | 4 | Upper respiratory infections | 2,733 | 4.1 | 69.6 |
| 5 | Bronchiolitis, RSV pneumonia | 3,093 | 4.4 | 78.5 | 5 | Nonbacterial gastroenteritis | 2,682 | 4.0 | 74.5 |
| 6 | Upper respiratory infections | 2,923 | 4.2 | 80.0 | 6 | Other digestive system diagnoses | 2,545 | 3.8 | 66.3 |
| 7 | Other digestive system diagnoses | 2,064 | 2.9 | 74.0 | 7 | Bronchiolitis, RSV pneumonia | 2,544 | 3.8 | 69.2 |
| 8 | Respiratory signs, symptoms, diagnoses | 2,052 | 2.9 | 81.6 | 8 | Shoulder and arm procedures | 1,862 | 2.8 | 72.6 |
| 9 | Other ENT/cranial/facial diagnoses | 1,684 | 2.4 | 43.6 | 9 | Appendectomy | 1,785 | 2.7 | 79.2 |
| 10 | Shoulder and arm procedures | 1,624 | 2.3 | 79.1 | 10 | Other ENT/cranial/facial diagnoses | 1,624 | 2.5 | 29.9 |
| 11 | Abdominal pain | 1,612 | 2.3 | 86.2 | 11 | Abdominal pain | 1,461 | 2.2 | 82.3 |
| 12 | Fever | 1,494 | 2.1 | 85.1 | 12 | Other factors influencing health status | 1,461 | 2.2 | 66.3 |
| 13 | Appendectomy | 1,465 | 2.1 | 66.4 | 13 | Cellulitis/other bacterial skin infections | 1,383 | 2.1 | 84.2 |
| 14 | Cellulitis/other bacterial skin infections | 1,393 | 2.0 | 86.4 | 14 | Respiratory signs, symptoms, diagnoses | 1,308 | 2.0 | 39.1 |
| 15 | Pneumonia NEC | 1,356 | 1.9 | 79.1 | 15 | Pneumonia NEC | 1,245 | 1.9 | 73.1 |
| Total | 36,429 | 52.0 | 57.8 | Total | 33,041 | 49.87 | 53.0 | ||
Outcomes of Observation‐Status Stays
A greater percentage of observation‐status stays in hospitals with a dedicated OU experienced a same‐day discharge (Table 4). In addition, a higher percentage of discharges occurred between midnight and 11 am in hospitals with a dedicated OU. However, overall risk‐adjusted LOS in hours (12.8 vs 12.2 hours, P=0.90) and risk‐adjusted total standardized costs ($2551 vs $2433, P=0.75) were similar between hospital types. These findings were consistent within the 1 APR‐DRGs commonly cared for by pediatric hospitalists (see Supporting Information, Appendix 1, in the online version of this article). Overall, conversion from observation to inpatient status was significantly higher in hospitals with a dedicated OU compared with hospitals without; however, this pattern was not consistent across the 10 APR‐DRGs commonly cared for by pediatric hospitalists (see Supporting Information, Appendix 1, in the online version of this article). Adjusted odds of 3‐day ED return visits and 30‐day readmissions were comparable between hospital groups.
| Observation‐Status Patients in Hospitals With a Dedicated Observation Unit | Observation‐Status Patients in Hospitals Without a Dedicated Observation Unit | P Value | |
|---|---|---|---|
| |||
| No. of hospitals | 14 | 17 | |
| Length of stay, h, median (IQR) | 12.8 (6.923.7) | 12.2 (721.3) | 0.90 |
| 0 midnights, no. (%) | 16,678 (23.8) | 14,648 (22.1) | <.001 |
| 1 midnight, no. (%) | 46,144 (65.9) | 44,559 (67.3) | |
| 2 midnights or more, no. (%) | 7,161 (10.2) | 7,049 (10.6) | |
| Discharge timing, no. (%) | |||
| Midnight5 am | 1,223 (1.9) | 408 (0.7) | <0.001 |
| 6 am11 am | 18,916 (29.3) | 15,914 (27.1) | |
| Noon5 pm | 32,699 (50.7) | 31,619 (53.9) | |
| 6 pm11 pm | 11,718 (18.2) | 10,718 (18.3) | |
| Total standardized costs, $, median (IQR) | 2,551.3 (2,053.93,169.1) | 2,433.4 (1,998.42,963) | 0.75 |
| Conversion to inpatient status | 11.06% | 9.63% | <0.01 |
| Return care, AOR (95% CI) | |||
| 3‐day ED return visit | 0.93 (0.77‐1.12) | Referent | 0.46 |
| 30‐day readmission | 0.88 (0.67‐1.15) | Referent | 0.36 |
We found similar results in sensitivity analyses comparing observation‐status stays in hospitals with a continuously open OU (open 24 hours per day, 7 days per week, for all of 2011 [n=10 hospitals]) to those without(see Supporting Information, Appendix 2, in the online version of this article). However, there were, on average, more observation‐status stays in hospitals with a continuously open OU (median 5605, IQR 42077089) than hospitals without (median 3309, IQR 26784616) (P=0.04). In contrast to our main results, conversion to inpatient status was lower in hospitals with a continuously open OU compared with hospitals without (8.52% vs 11.57%, P<0.01).
DISCUSSION
Counter to our hypothesis, we did not find hospital‐level differences in length of stay or costs for observation‐status patients cared for in hospitals with and without a dedicated OU, though hospitals with dedicated OUs did have more same‐day discharges and more morning discharges. The lack of observed differences in LOS and costs may reflect the fact that many children under observation status are treated throughout the hospital, even in facilities with a dedicated OU. Access to a dedicated OU is limited by factors including small numbers of OU beds and specific low acuity/low complexity OU admission criteria.[7] The inclusion of all children admitted under observation status in our analyses may have diluted any effect of dedicated OUs at the hospital level, but was necessary due to the inability to identify location of care for children admitted under observation status. Location of care is an important variable that should be incorporated into administrative databases to allow for comparative effectiveness research designs. Until such data are available, chart review at individual hospitals would be necessary to determine which patients received care in an OU.
We did find that discharges for observation‐status patients occurred earlier in the day in hospitals with a dedicated OU when compared with observation‐status patients in hospitals without a dedicated OU. In addition, the percentage of same‐day discharges was higher among observation‐status patients treated in hospitals with a dedicated OU. These differences may stem from policies and procedures that encourage rapid discharge in dedicated OUs, and those practices may affect other care areas. For example, OUs may enforce policies requiring family presence at the bedside or utilize staffing models where doctors and nurses are in frequent communication, both of which would facilitate discharge as soon as a patient no longer required hospital‐based care.[7] A retrospective chart review study design could be used to identify discharge processes and other key characteristics of highly performing OUs.
We found conflicting results in our main and sensitivity analyses related to conversion to inpatient status. Lower percentages of observation‐status patients converting to inpatient status indicates greater success in the delivery of observation care based on established performance metrics.[19] Lower rates of conversion to inpatient status may be the result of stricter admission criteria for some diagnosis and in hospitals with a continuously open dedicate OU, more refined processes for utilization review that allow for patients to be placed into the correct status (observation vs inpatient) at the time of admission, or efforts to educate providers about the designation of observation status.[7] It is also possible that fewer observation‐status patients convert to inpatient status in hospitals with a continuously open dedicated OU because such a change would require movement of the patient to an inpatient bed.
These analyses were more comprehensive than our prior studies[2, 20] in that we included both patients who were treated first in the ED and those who were not. In addition to the APR‐DRGs representative of conditions that have been successfully treated in ED‐based pediatric OUs (eg, asthma, seizures, gastroenteritis, cellulitis),[8, 9, 21, 22] we found observation‐status was commonly associated with procedural care. This population of patients may be relevant to hospitalists who staff OUs that provide both unscheduled and postprocedural care. The colocation of medical and postprocedural patients has been described by others[8, 23] and was reported to occur in over half of the OUs included in this study.[7] The extent to which postprocedure observation care is provided in general OUs staffed by hospitalists represents another opportunity for further study.
Hospitals face many considerations when determining if and how they will provide observation services to patients expected to experience short stays.[7] Some hospitals may be unable to justify an OU for all or part of the year based on the volume of admissions or the costs to staff an OU.[24, 25] Other hospitals may open an OU to promote patient flow and reduce ED crowding.[26] Hospitals may also be influenced by reimbursement policies related to observation‐status stays. Although we did not observe differences in overall payer mix, we did find higher percentages of observation‐status patients in hospitals with dedicated OUs to have public insurance. Although hospital contracts with payers around observation status patients are complex and beyond the scope of this analysis, it is possible that hospitals have established OUs because of increasingly stringent rules or criteria to meet inpatient status or experiences with high volumes of observation‐status patients covered by a particular payer. Nevertheless, the brief nature of many pediatric hospitalizations and the scarcity of pediatric OU beds must be considered in policy changes that result from national discussions about the appropriateness of inpatient stays shorter than 2 nights in duration.[27]
Limitations
The primary limitation to our analyses is the lack of ability to identify patients who were treated in a dedicated OU because few hospitals provided data to PHIS that allowed for the identification of the unit or location of care. Second, it is possible that some hospitals were misclassified as not having a dedicated OU based on our survey, which initially inquired about OUs that provided care to patients first treated in the ED. Therefore, OUs that exclusively care for postoperative patients or patients with scheduled treatments may be present in hospitals that we have labeled as not having a dedicated OU. This potential misclassification would bias our results toward finding no differences. Third, in any study of administrative data there is potential that diagnosis codes are incomplete or inaccurately capture the underlying reason for the episode of care. Fourth, the experiences of the free‐standing children's hospitals that contribute data to PHIS may not be generalizable to other hospitals that provide observation care to children. Finally, return care may be underestimated, as children could receive treatment at another hospital following discharge from a PHIS hospital. Care outside of PHIS hospitals would not be captured, but we do not expect this to differ for hospitals with and without dedicated OUs. It is possible that health information exchanges will permit more comprehensive analyses of care across different hospitals in the future.
CONCLUSION
Observation status patients are similar in hospitals with and without dedicated observation units that admit children from the ED. The presence of a dedicated OU appears to have an influence on same‐day and morning discharges across all observation‐status stays without impacting other hospital‐level outcomes. Inclusion of location of care (eg, geographically distinct dedicated OU vs general inpatient unit vs ED) in hospital administrative datasets would allow for meaningful comparisons of different models of care for short‐stay observation‐status patients.
Acknowledgements
The authors thank John P. Harding, MBA, FACHE, Children's Hospital of the King's Daughters, Norfolk, Virginia for his input on the study design.
Disclosures: Dr. Hall had full access to the data and takes responsibility for the integrity of the data and the accuracy of the data analysis. Internal funds from the Children's Hospital Association supported the conduct of this work. The authors have no financial relationships or conflicts of interest to disclose.
© 2015 Society of Hospital Medicine