User login
Pediatric Hospitalist Workload and Sustainability in University-Based Programs: Results from a National Interview-Based Survey
Pediatric hospital medicine (PHM) has grown tremendously since Wachter first described the specialty in 1996.1 Evidence of this growth is seen most markedly at the annual Pediatric Hospitalist Meeting, which has experienced an increase in attendance from 700 in 2013 to over 1,200 in 20172. Although the exact number of pediatric hospitalists in the United States is unknown, the American Academy of Pediatrics Section on Hospital Medicine (AAP SOHM) estimates that approximately 3,000-5,000 pediatric hospitalists currently practice in the country (personal communication).
As PHM programs have grown, variability has been reported in the roles, responsibilities, and workload among practitioners. Gosdin et al.3 reported large ranges and standard deviations in workload among full-time equivalents (FTEs) in academic PHM programs. However, this study’s ability to account for important nuances in program description was limited given that its data were obtained from an online survey.
Program variability, particularly regarding clinical hours and overall clinical burden (eg, in-house hours, census caps, and weekend coverage), is concerning given the well-reported increase in physician burn-out.4,5 Benchmarking data regarding the overall workload of pediatric hospitalists can offer nationally recognized guidance to assist program leaders in building successful programs. With this goal in mind, we sought to obtain data on university-based PHM programs to describe the current average workload for a 1.0 clinical FTE pediatric hospitalist and to assess the perceptions of program directors regarding the sustainability of the current workload.
METHODS
Study Design and Population
To obtain data with sufficient detail to compare programs, the authors, all of whom are practicing pediatric hospitalists at university-based programs, conducted structured interviews of PHM leaders in the United States. Given the absence of a single database for all PHM programs in the United States, the clinical division/program leaders of university-based programs were invited to participate through a post (with 2 reminders) to the AAP SOHM Listserv for PHM Division Leaders in May of 2017. To encourage participation, respondents were promised a summary of aggregate data. The study was exempted by the IRB of the University of Chicago.
Interview Content and Administration
The authors designed an 18-question structured interview regarding the current state of staffing in university-based PHM programs, with a focus on current descriptions of FTE, patient volume, and workload. Utilizing prior surveys3 as a basis, the authors iteratively determined the questions essential to understanding the programs’ current staffing models and ideal models. Considering the diversity of program models, interviews allowed for the clarification of questions and answers. A question regarding employment models was included to determine whether hospitalists were university-employed, hospital-employed, or a hybrid of the 2 modes of employment. The interview was also designed to establish a common language for work metrics (hours per year) for comparative purposes and to assess the perceived sustainability of the workload. Questions were provided in advance to provide respondents with sufficient time to collect data, thus increasing the accuracy of estimates. Respondents were asked, “Do you or your hospitalists have concerns about the sustainability of the model?” Sustainability was intentionally undefined to prevent limiting respondent perspective. For clarification, however, a follow-up comment that included examples was provided: “Faculty departures, reduction in total effort, and/or significant burn out.” The authors piloted the interview protocol by interviewing the division leaders of their own programs, and revisions were made based on feedback on feasibility and clarity. Finally, the AAP SOHM Subcommittee on Division Leaders provided feedback, which was incorporated.
Each author then interviewed 10-12 leaders (or designee) during May and June of 2017. Answers were recorded in REDCAP, an online survey and database tool that contains largely numeric data fields and has 1 field for narrative comments.
Data Analysis
Descriptive statistics were used to summarize interview responses, including median values with interquartile range. Data were compared between programs with models that were self-identified as either sustainable or unsustainable, with P-values in categorical variables from χ2-test or Fischer’s exact test and in continuous variables from Wilcoxon rank-sum test.
Spearman correlation coefficient was used to evaluate the association between average protected time (defined as the percent of funded time for nonclinical roles) and percentage working full-time clinical effort. It was also used to evaluate hours per year per 1.0 FTE and total weekends per year per 1.0 FTE and perceived sustainability. Linear regression was used to determine whether associations differed between groups identifying as sustainable versus unsustainable.
RESULTS
Participation and Program Characteristics
Administration
A wide variation was reported in the clinical time expected of a 1.0 FTE hospitalist. Clinical time for 1.0 FTE was defined as the amount of clinical service a full-time hospitalist is expected to complete in 12 months (Table 1). The median hours worked per year were 1800 (Interquartile range [IQR] 1620,1975; mean 1796). The median number of weekends worked per year was 15.0 (IQR 12.5, 21; mean 16.8). Only 30% of pediatric hospitalists were full-time clinicians, whereas the rest had protected time for nonclinical duties. The average amount of protected time was 20% per full-time hospitalist.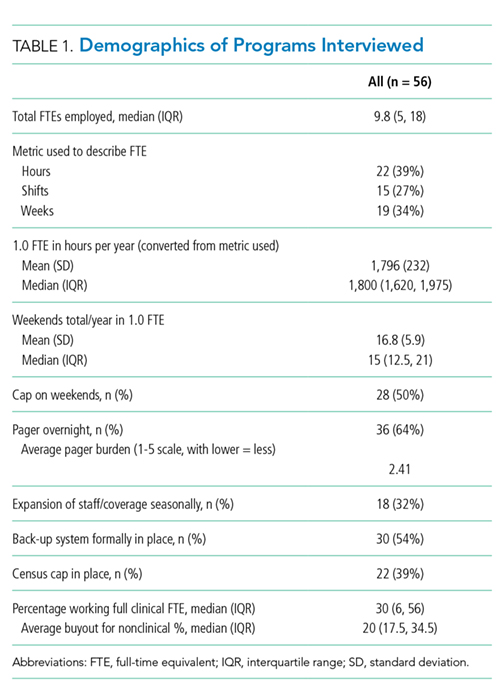
Sustainability and Ideal FTE
Half of the division leaders reported that they or their hospitalists have concerns about the sustainability of the current workload. Programs perceived as sustainable required significantly fewer weekends per year (13 vs. 16, P < .02; Table 2) than those perceived as unsustainable. University-employed programs were more likely to be perceived as unsustainable (64% unsustainable vs. 32% unsustainable, P < .048), whereas programs with other employment models were more likely to be perceived as sustainable (Table 2). 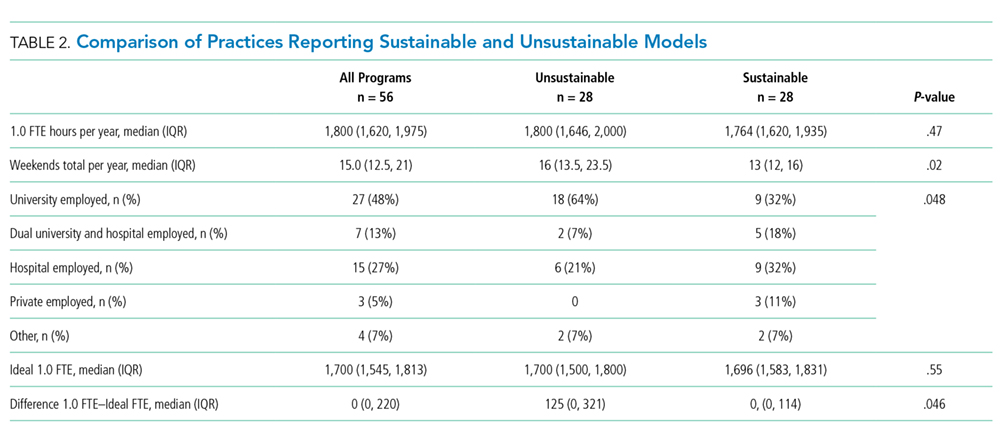
DISCUSSION
This study updates what has been previously reported about the structure and characteristics of university-based pediatric hospitalist programs.3 It also deepens our understanding of a relatively new field and the evolution of clinical coverage models. This evolution has been impacted by decreased resident work hours, increased patient complexity and acuity,6 and a broadened focus on care coordination and communication,7 while attempting to build and sustain a high-quality workforce.
This study is the first to use an interview-based method to determine the current PHM workload and to focus exclusively on university-based programs. Compared with the study by Gosdin et al,3 our study, which utilized interviews instead of surveys, was able to clarify questions and obtain workload data with a common language of hours per year. This approach allowed interviewees to incorporate subtleties, such as clinical vs. total FTE, in their responses. Our study found a slightly narrower range of clinical hours per year and extended the understanding of nonclinical duties by finding that university-based hospitalists have an average of 20% protected time from clinical duties.
In this study, we also explored the perceived sustainability of current clinical models and the ideal clinical model in hours per year. Half of respondents felt their current model was unsustainable. This result suggested that the field must continue to mitigate attrition and burnout.
Interestingly, the total number of clinical hours did not significantly differ in programs perceived to be unsustainable. Instead, a higher number of weekends worked and university employment were associated with lack of sustainability. We hypothesize that weekends have a disproportionate impact on work-life balance as compared with total hours, and that employment by a university may be a proxy for the increased academic and teaching demands of hospitalists without protected time. Future studies may better elucidate these findings and inform programmatic efforts to address sustainability.
Given that PHM is a relatively young field, considering the evolution of our clinical work model within the context of pediatric emergency medicine (PEM), a field that faces similar challenges in overnight and weekend staffing requirements, may be helpful. Gorelick et al.8 reported that total clinical work hours in PEM (combined academic and nonacademic programs) has decreased from 35.3 hours per week in 1998 to 26.7 in 2013. Extrapolating these numbers to an annual position with 5 weeks PTO/CME, the average PEM attending physician works 1254 clinical hours. These numbers demonstrate a marked difference compared with the average 1800 clinical work hours for PHM found in our study.
Although total hours trend lower in PEM, the authors noted continued challenges in sustainability with an estimated half of all PEM respondents indicating a plan to reduce hours or leave the field in the next 5 years and endorsing symptoms of burnout.6 These findings from PEM may motivate PHM leaders to be more aggressive in adjusting work models toward sustainability in the future.
Our study has several limitations. We utilized a convenience sampling approach that requires the voluntary participation of division directors. Although we had robust interest from respondents representing all major geographic areas, the respondent pool might conceivably over-represent those most interested in understanding and/or changing PHM clinical models. Overall, our sample size was smaller than that achieved by a survey approach. Nevertheless, this limitation was offset by controlling respondent type and clarifying questions, thus improving the quality of our obtained data.
CONCLUSION
This interview-based study of PHM directors describes the current state of clinical work models for university-based hospitalists. University-based PHM programs have similar mean and median total clinical hours per year. However, these hours are higher than those considered ideal by PHM directors, and many are concerned about the sustainability of current work models. Notably, programs that are university-employed or have higher weekends worked per year are more likely to be perceived as unsustainable. Future studies should explore differences between programs with sustainable work models and those with high levels of attrition and burnout.
Disclosures
The authors have no other conflicts to report.
Funding
A grant from the American Academy of Pediatrics Section on Hospital Medicine funded this study through the Subcommittee on Division and Program Leaders.
1. Wachter RM, Goldman L. The emerging role of “hospitalists” in the American health care system. N Engl J Med. 1996;335(7):514-517. DOI: 10.1056/NEJM199608153350713 PubMed
2. Chang W. Record Attendance, Key Issues Highlight Pediatric Hospital Medicine’s 10th Anniversary.
3. Gosdin C, Simmons J, Yau C, Sucharew H, Carlson D, Paciorkowski N. Survey of academic pediatric hospitalist programs in the US: organizational, administrative, and financial factors. J Hosp Med. 2013;8(6):285-291. DOI: 10.1002/jhm.2020. PubMed
4. Hinami K, Whelan CT, Wolosin RJ, Miller JA, Wetterneck TB. Worklife and satisfaction of hospitalists: toward flourishing careers. J Gen Intern Med. 2011;27(1):28-36. DOI: 10.1007/s11606-011-1780-z. PubMed
5. Hinami K, Whelan CT, Miller JA, Wolosin RJ, Wetterneck TB. Job characteristics, satisfaction, and burnout across hospitalist practice models. J Hosp Med. 2012;7(5):402-410. DOI: 10.1002/jhm.1907. PubMed
6. Barrett DJ, McGuinness GA, Cunha CA, et al. Pediatric hospital medicine: a proposed new subspecialty. Pediatrics. 2017;139(3):1-9. DOI: 10.1542/peds.2016-1823. PubMed
7. Cawley P, Deitelzweig S, Flores L, et al. The key principles and characteristics of an effective hospital medicine group: an assessment guide for hospitals and hospitalists. J Hosp Med. 2014;9(2):123-128. DOI: 10.1002/jhm.2119. PubMed
8. Gorelick MH, Schremmer R, Ruch-Ross H, Radabaugh C, Selbst S. Current workforce characteristics and burnout in pediatric emergency medicine. Acad Emerg Med. 2016;23(1):48-54. DOI: 10.1111/acem.12845. PubMed
Pediatric hospital medicine (PHM) has grown tremendously since Wachter first described the specialty in 1996.1 Evidence of this growth is seen most markedly at the annual Pediatric Hospitalist Meeting, which has experienced an increase in attendance from 700 in 2013 to over 1,200 in 20172. Although the exact number of pediatric hospitalists in the United States is unknown, the American Academy of Pediatrics Section on Hospital Medicine (AAP SOHM) estimates that approximately 3,000-5,000 pediatric hospitalists currently practice in the country (personal communication).
As PHM programs have grown, variability has been reported in the roles, responsibilities, and workload among practitioners. Gosdin et al.3 reported large ranges and standard deviations in workload among full-time equivalents (FTEs) in academic PHM programs. However, this study’s ability to account for important nuances in program description was limited given that its data were obtained from an online survey.
Program variability, particularly regarding clinical hours and overall clinical burden (eg, in-house hours, census caps, and weekend coverage), is concerning given the well-reported increase in physician burn-out.4,5 Benchmarking data regarding the overall workload of pediatric hospitalists can offer nationally recognized guidance to assist program leaders in building successful programs. With this goal in mind, we sought to obtain data on university-based PHM programs to describe the current average workload for a 1.0 clinical FTE pediatric hospitalist and to assess the perceptions of program directors regarding the sustainability of the current workload.
METHODS
Study Design and Population
To obtain data with sufficient detail to compare programs, the authors, all of whom are practicing pediatric hospitalists at university-based programs, conducted structured interviews of PHM leaders in the United States. Given the absence of a single database for all PHM programs in the United States, the clinical division/program leaders of university-based programs were invited to participate through a post (with 2 reminders) to the AAP SOHM Listserv for PHM Division Leaders in May of 2017. To encourage participation, respondents were promised a summary of aggregate data. The study was exempted by the IRB of the University of Chicago.
Interview Content and Administration
The authors designed an 18-question structured interview regarding the current state of staffing in university-based PHM programs, with a focus on current descriptions of FTE, patient volume, and workload. Utilizing prior surveys3 as a basis, the authors iteratively determined the questions essential to understanding the programs’ current staffing models and ideal models. Considering the diversity of program models, interviews allowed for the clarification of questions and answers. A question regarding employment models was included to determine whether hospitalists were university-employed, hospital-employed, or a hybrid of the 2 modes of employment. The interview was also designed to establish a common language for work metrics (hours per year) for comparative purposes and to assess the perceived sustainability of the workload. Questions were provided in advance to provide respondents with sufficient time to collect data, thus increasing the accuracy of estimates. Respondents were asked, “Do you or your hospitalists have concerns about the sustainability of the model?” Sustainability was intentionally undefined to prevent limiting respondent perspective. For clarification, however, a follow-up comment that included examples was provided: “Faculty departures, reduction in total effort, and/or significant burn out.” The authors piloted the interview protocol by interviewing the division leaders of their own programs, and revisions were made based on feedback on feasibility and clarity. Finally, the AAP SOHM Subcommittee on Division Leaders provided feedback, which was incorporated.
Each author then interviewed 10-12 leaders (or designee) during May and June of 2017. Answers were recorded in REDCAP, an online survey and database tool that contains largely numeric data fields and has 1 field for narrative comments.
Data Analysis
Descriptive statistics were used to summarize interview responses, including median values with interquartile range. Data were compared between programs with models that were self-identified as either sustainable or unsustainable, with P-values in categorical variables from χ2-test or Fischer’s exact test and in continuous variables from Wilcoxon rank-sum test.
Spearman correlation coefficient was used to evaluate the association between average protected time (defined as the percent of funded time for nonclinical roles) and percentage working full-time clinical effort. It was also used to evaluate hours per year per 1.0 FTE and total weekends per year per 1.0 FTE and perceived sustainability. Linear regression was used to determine whether associations differed between groups identifying as sustainable versus unsustainable.
RESULTS
Participation and Program Characteristics
Administration
A wide variation was reported in the clinical time expected of a 1.0 FTE hospitalist. Clinical time for 1.0 FTE was defined as the amount of clinical service a full-time hospitalist is expected to complete in 12 months (Table 1). The median hours worked per year were 1800 (Interquartile range [IQR] 1620,1975; mean 1796). The median number of weekends worked per year was 15.0 (IQR 12.5, 21; mean 16.8). Only 30% of pediatric hospitalists were full-time clinicians, whereas the rest had protected time for nonclinical duties. The average amount of protected time was 20% per full-time hospitalist.
Sustainability and Ideal FTE
Half of the division leaders reported that they or their hospitalists have concerns about the sustainability of the current workload. Programs perceived as sustainable required significantly fewer weekends per year (13 vs. 16, P < .02; Table 2) than those perceived as unsustainable. University-employed programs were more likely to be perceived as unsustainable (64% unsustainable vs. 32% unsustainable, P < .048), whereas programs with other employment models were more likely to be perceived as sustainable (Table 2).
DISCUSSION
This study updates what has been previously reported about the structure and characteristics of university-based pediatric hospitalist programs.3 It also deepens our understanding of a relatively new field and the evolution of clinical coverage models. This evolution has been impacted by decreased resident work hours, increased patient complexity and acuity,6 and a broadened focus on care coordination and communication,7 while attempting to build and sustain a high-quality workforce.
This study is the first to use an interview-based method to determine the current PHM workload and to focus exclusively on university-based programs. Compared with the study by Gosdin et al,3 our study, which utilized interviews instead of surveys, was able to clarify questions and obtain workload data with a common language of hours per year. This approach allowed interviewees to incorporate subtleties, such as clinical vs. total FTE, in their responses. Our study found a slightly narrower range of clinical hours per year and extended the understanding of nonclinical duties by finding that university-based hospitalists have an average of 20% protected time from clinical duties.
In this study, we also explored the perceived sustainability of current clinical models and the ideal clinical model in hours per year. Half of respondents felt their current model was unsustainable. This result suggested that the field must continue to mitigate attrition and burnout.
Interestingly, the total number of clinical hours did not significantly differ in programs perceived to be unsustainable. Instead, a higher number of weekends worked and university employment were associated with lack of sustainability. We hypothesize that weekends have a disproportionate impact on work-life balance as compared with total hours, and that employment by a university may be a proxy for the increased academic and teaching demands of hospitalists without protected time. Future studies may better elucidate these findings and inform programmatic efforts to address sustainability.
Given that PHM is a relatively young field, considering the evolution of our clinical work model within the context of pediatric emergency medicine (PEM), a field that faces similar challenges in overnight and weekend staffing requirements, may be helpful. Gorelick et al.8 reported that total clinical work hours in PEM (combined academic and nonacademic programs) has decreased from 35.3 hours per week in 1998 to 26.7 in 2013. Extrapolating these numbers to an annual position with 5 weeks PTO/CME, the average PEM attending physician works 1254 clinical hours. These numbers demonstrate a marked difference compared with the average 1800 clinical work hours for PHM found in our study.
Although total hours trend lower in PEM, the authors noted continued challenges in sustainability with an estimated half of all PEM respondents indicating a plan to reduce hours or leave the field in the next 5 years and endorsing symptoms of burnout.6 These findings from PEM may motivate PHM leaders to be more aggressive in adjusting work models toward sustainability in the future.
Our study has several limitations. We utilized a convenience sampling approach that requires the voluntary participation of division directors. Although we had robust interest from respondents representing all major geographic areas, the respondent pool might conceivably over-represent those most interested in understanding and/or changing PHM clinical models. Overall, our sample size was smaller than that achieved by a survey approach. Nevertheless, this limitation was offset by controlling respondent type and clarifying questions, thus improving the quality of our obtained data.
CONCLUSION
This interview-based study of PHM directors describes the current state of clinical work models for university-based hospitalists. University-based PHM programs have similar mean and median total clinical hours per year. However, these hours are higher than those considered ideal by PHM directors, and many are concerned about the sustainability of current work models. Notably, programs that are university-employed or have higher weekends worked per year are more likely to be perceived as unsustainable. Future studies should explore differences between programs with sustainable work models and those with high levels of attrition and burnout.
Disclosures
The authors have no other conflicts to report.
Funding
A grant from the American Academy of Pediatrics Section on Hospital Medicine funded this study through the Subcommittee on Division and Program Leaders.
1. Wachter RM, Goldman L. The emerging role of “hospitalists” in the American health care system. N Engl J Med. 1996;335(7):514-517. DOI: 10.1056/NEJM199608153350713 PubMed
2. Chang W. Record Attendance, Key Issues Highlight Pediatric Hospital Medicine’s 10th Anniversary.
3. Gosdin C, Simmons J, Yau C, Sucharew H, Carlson D, Paciorkowski N. Survey of academic pediatric hospitalist programs in the US: organizational, administrative, and financial factors. J Hosp Med. 2013;8(6):285-291. DOI: 10.1002/jhm.2020. PubMed
4. Hinami K, Whelan CT, Wolosin RJ, Miller JA, Wetterneck TB. Worklife and satisfaction of hospitalists: toward flourishing careers. J Gen Intern Med. 2011;27(1):28-36. DOI: 10.1007/s11606-011-1780-z. PubMed
5. Hinami K, Whelan CT, Miller JA, Wolosin RJ, Wetterneck TB. Job characteristics, satisfaction, and burnout across hospitalist practice models. J Hosp Med. 2012;7(5):402-410. DOI: 10.1002/jhm.1907. PubMed
6. Barrett DJ, McGuinness GA, Cunha CA, et al. Pediatric hospital medicine: a proposed new subspecialty. Pediatrics. 2017;139(3):1-9. DOI: 10.1542/peds.2016-1823. PubMed
7. Cawley P, Deitelzweig S, Flores L, et al. The key principles and characteristics of an effective hospital medicine group: an assessment guide for hospitals and hospitalists. J Hosp Med. 2014;9(2):123-128. DOI: 10.1002/jhm.2119. PubMed
8. Gorelick MH, Schremmer R, Ruch-Ross H, Radabaugh C, Selbst S. Current workforce characteristics and burnout in pediatric emergency medicine. Acad Emerg Med. 2016;23(1):48-54. DOI: 10.1111/acem.12845. PubMed
© 2018 Society of Hospital Medicine
Choosing Wisely in Pediatric Medicine
Overuse in medicine is a significant and under‐recognized problem. Don Berwick estimated that waste accounts for at least 20% of healthcare expenditures in the United States, with overtreatment as one of the largest categories.[1] A commentary by Schroeder et al. challenged pediatricians to incorporate this knowledge into our own patient safety and quality movement.[2] Recently published data suggest that we are far from achieving the patient safety goals set forth in the Institute of Medicine's landmark To Err is Human[3] report, despite more than a decade of national, local, and regional efforts.[4] One way to reduce waste and improve patient safety is to eliminate practices of unproven benefit. Therapies or tests that may initially seem promising are often proven to be not only unhelpful but actually harmful. The recommendation of the US Preventive Services Task Force against routine screening for prostate specific antigen is an example of how a common test initially thought of as lifesaving actually increases harm.[5]
The American Board of Internal Medicine Foundation (ABIM‐F) recently announced the Choosing Wisely campaign. Through this campaign the Foundation encourages physicians, patients and other healthcare stakeholders to think and talk about medical tests and procedures that may be unnecessary.[6] The primary output of this challenge is the development of a list of 5 tests and or therapies that physicians and patients should question. The ABIM‐F approached different medical societies to develop these lists within their own specialties. The Society of Hospital Medicine (SHM) joined the Choosing Wisely campaign in April 2012, and agreed to develop a list of 5 therapies and tests for adult hospital medicine and pediatric hospital medicine. Here we present the contribution of the pediatric workgroup detailing the methodology and process for developing the list, as well as summarizing the evidence supporting each recommendation.
METHODS
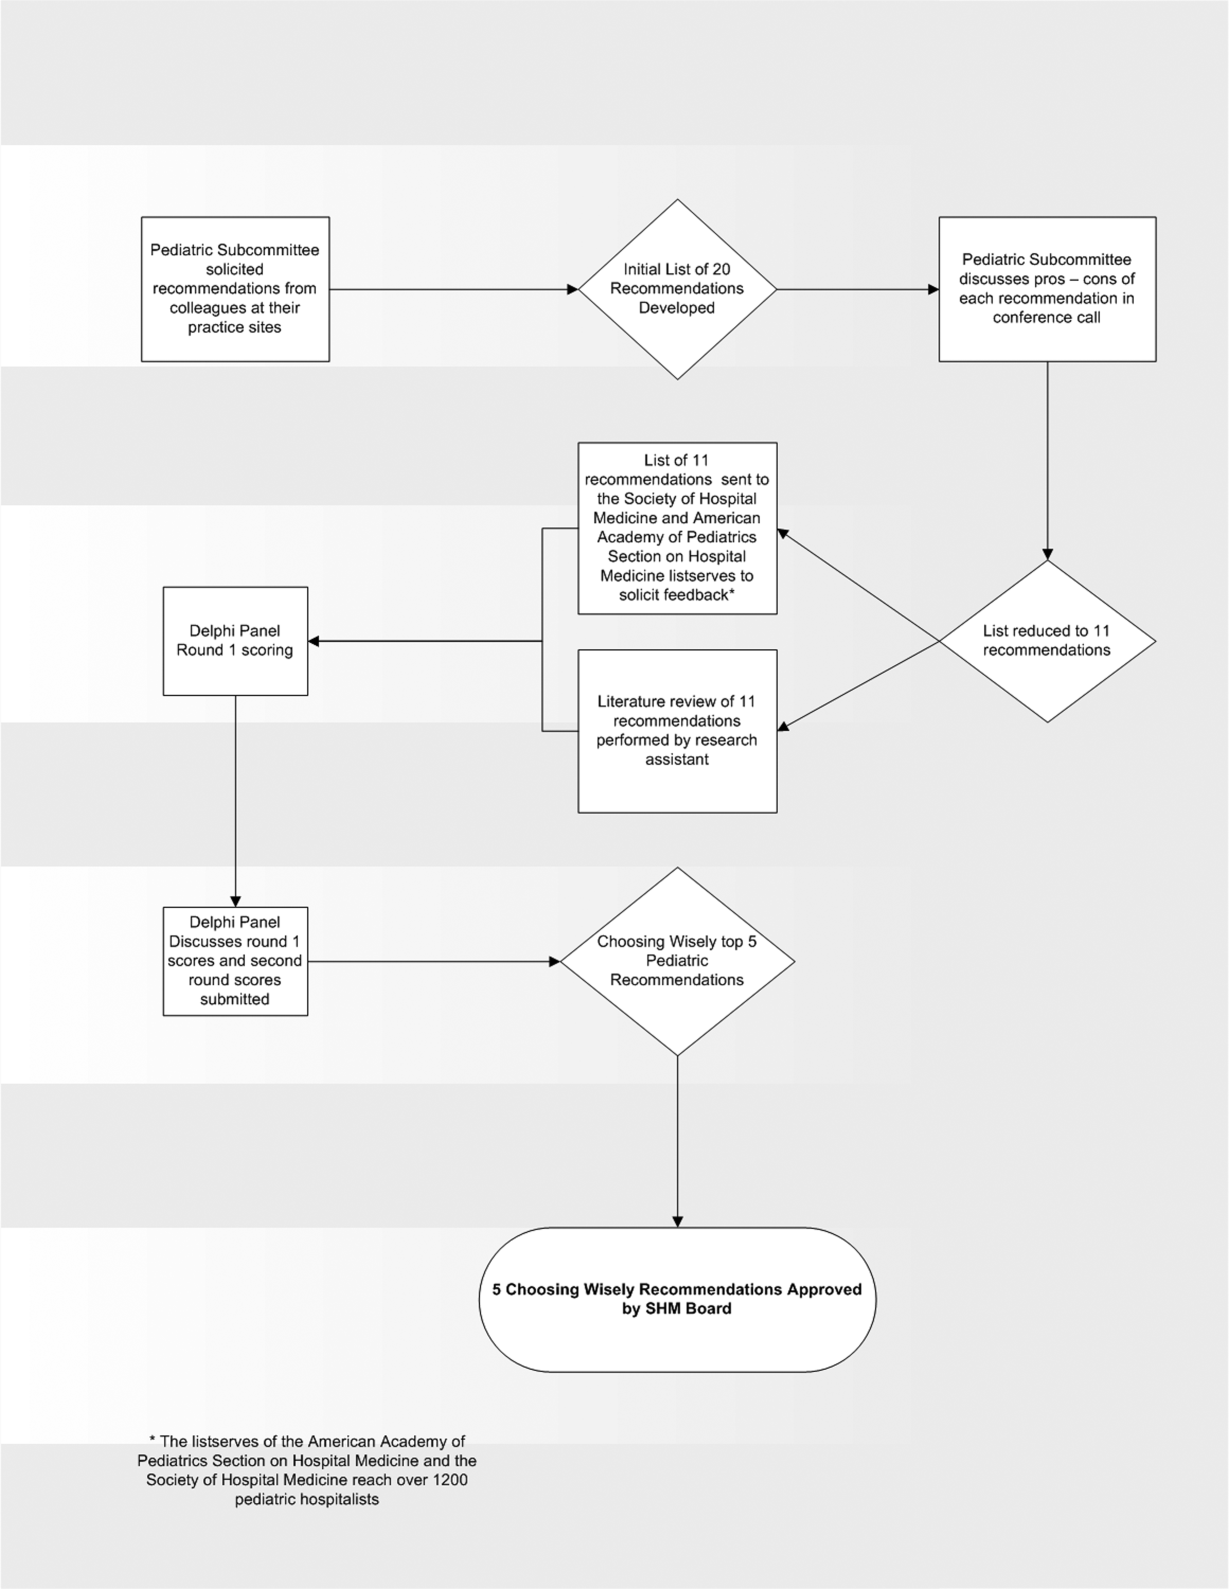
In the spring of 2012, the pediatric committee of the SHM convened a workgroup of pediatric hospitalists to develop a top 5 list for the field. This workgroup was composed of experienced pediatric hospitalists representing diverse geographic locations of the United States and a mix of academic and nonacademic practice settings. The group, consisting of 4 women and 9 men, began by proposing candidate recommendations after discussion with colleagues at their different practice sites. The group was charged to maintain a focus on overuse practices that had a strong basis in evidence, were frequently encountered at their practice sites, and achieved significant consensus among their colleagues. Figure 1 shows the process map describing the method for the development of the pediatric recommendations. All workgroup participants were queried as to conflict of interest relevant to this work and none were identified.
Literature Review
After the generation of the initial top 20 list, 2 reviewers conducted independent literature searches in PubMed, MEDLINE, and the Cochrane Library on the proposed topics. The reviewers also conducted generic Internet searches. Key search terms included pediatric asthma, bronchiolitis, chest radiograph, systemic corticosteroids, gastroesophageal reflux disease (GERD), infant, child, acid suppression therapy, continuous pulse oximetry, pneumonia, gastroenteritis, viral testing, blood culture, and soft tissue infections. To ensure that the reviewers included all studies relevant to the searches, they utilized broad terms. The search included all literature published through 2012, and nonEnglish language publications were included in the search. Studies selected and included in the review were based upon common criteria including whether the article discussed an evaluation of efficacy and/or utility of treatment, included a pediatric population in the guidelines or study, reviewed the harm associated with the administration of a particular test or treatment, and explored the cost associated with the test or treatment.
The Delphi Panel
Members of the workgroup formed a Delphi panel except for 1 member (R.Q.) who served as the nonvoting moderator. The members of the Delphi panel considered the results of the literature search for each recommendation along with the collated feedback from hospitalist listserves as described in Figure 1. Each panel member received a voting instrument with the candidate tests and treatments for the first round of Delphi voting. The panel utilized a modified Delphi method or the RAND Corporation (RAND)/University of California at Los Angeles (UCLA) appropriateness method as described in previous publications of quality indicator development in pediatrics.[7] Each panelist scored the candidate tests and treatments and forwarded the scores to the moderator. Subsequently, all the members of the Delphi panel met through a conference call to carry out the second round of voting. The deidentified collated results of the first round of Delphi voting were made available and discussed during the call. The moderator collated the final results, and the final 5 recommendations were those that had the highest score after the second round of Delphi voting.
Volume and Costs
During deliberations, the committee took into account the prevalence and cost rankings of our most common pediatric inpatient diagnoses. This was done using the Agency for Healthcare Research and Quality's (AHRQ) Healthcare Utilization Project (HCUP), specifically, the Kids' Inpatient Database (KID). HCUP includes the largest collection of longitudinal hospital care data in the United States, encompassing all‐payer discharge‐level information. We excluded normal newborn hospitalizations, and looked at the top 10 acute inpatient diagnoses in terms of both volume and aggregate costs.
RESULTS
The initial list of 20 candidate tests and treatments as well as the refined list of 11 recommendations can be found as electronic supplements to this publication (see Supporting Table 1 and Supporting Table 2 in the online version of this article). The format and language of the list of 11 recommendations were chosen to mesh with that typically used in the ABIM‐F Choosing Wisely campaign. During the Delphi panel, there was strong group consensus about combining items 1 and 2 (chest radiographs in asthma and bronchiolitis) into a single recommendation.
| Do not order chest radiographs in children with asthma or bronchiolitis. |
| Do not use bronchodilators in children with bronchiolitis. |
| Do not use systemic corticosteroids in children under 2 years of age with a lower respiratory tract infection. |
| Do not treat gastroesophageal reflux in infants routinely with acid suppression therapy. |
| Do not use continuous pulse oximetry routinely in children with acute respiratory illness unless they are on supplemental oxygen. |
The top 5 recommendations based on the result of the second round of Delphi scoring are shown in Table 1 and described below along with a detailed evidence summary.
Do not order chest radiographs in children with asthma or bronchiolitis.
The National Heart and Lung Institute's guidelines for the management of asthma, published in 1987, recommend against routinely obtaining chest radiographs in patients with asthma or asthma exacerbations.[8] Supporting this recommendation are several studies that show a low overall yield when obtaining chest radiographs for wheezing patients.[9, 10, 11] Most relevant, studies that evaluated the clinical utility of radiographs in patients with asthma have demonstrated that they influence clinical management in less than 2% of cases.[12] A quality improvement project aimed at decreasing the rate of chest radiographs obtained in patients with asthma demonstrated that close to 60% of patients admitted to the hospital had chest radiographs performed, and that significant overall reductions can be achieved (45.3%28.9%, P=0.0005) without impacting clinical outcomes negatively.[13]
Similarly, the Subcommittee on Diagnosis and Management of Bronchiolitis of the American Academy of Pediatrics recommends against routinely obtaining radiographs during the evaluation for bronchiolitis.[14] Studies assessing the utility of chest x‐rays in these children demonstrate an even lower incidence of abnormalities (0.75%) and indicate that, despite this low incidence, physicians are more likely to treat with antibiotics when radiographs are obtained.[15] There is also evidence that chest radiographs in patients with bronchiolitis are not useful in predicting severity of illness.[16] Furthermore, cost‐effective analyses have demonstrated that omitting chest radiographs in bronchiolitis is actually cost‐effective, without compromising diagnostic accuracy.[17] In a recently published national benchmarking inpatient collaborative, Ralston et al. demonstrated that the majority of patients admitted to the hospital with bronchiolitis have chest radiographs performed at a rate of 64% (interquartile range [IQR], 54%81%).[18]
In both bronchiolitis and asthma, the elimination of unnecessary radiographs has the potential to decrease costs, reduce radiation exposure, and minimize the overuse of antibiotics that often occurs secondary to false positive results.
Do not use bronchodilators in children with bronchiolitis.
Ralston showed that 70% (IQR, 59%83%) of admitted bronchiolitis patients received bronchodilators with an average of 7.9 doses per patient (IQR, 4.69.8). National guidelines for bronchiolitis suggest a very limited role of bronchodilators in patients with bronchiolitis.[14] The first meta‐analyses of studies related to the question of ‐agonist efficacy in bronchiolitis were published in the late 1990s, revealing minimal or no treatment effects.[19, 20] Since then, further research has solidified these findings, and fairly definitive statements can be made based on a recent comprehensive meta‐analysis.[21] The pooled data do not show any effect on hospitalization rates, hospital length of stay, or other inpatient outcomes in bronchiolitis. They do show a small change in clinical scores documented in the outpatient setting, though these scores have not correlated with any detectable difference in outcomes. Routine use of ‐agonists in the inpatient setting has no proven benefit, and given the large amount of consistent data, there is no compelling reason for further study of this therapy in the inpatient setting.
Epinephrine, a combined ‐ and ‐agonist, has been extensively evaluated in bronchiolitis as well. Like albuterol, epinephrine has been reported to have no effect on hospital length of stay in bronchiolitis.[22] The issue of admission rates after epinephrine is complicated by 1 very large study that combined epinephrine with dexamethasone and reported a decreased admission rate, though only at 7 days after therapy; however, this effect was nullified after adjustment for multiple comparisons.[23] When the end point is improvement of respiratory scores, epinephrine may perform better than albuterol in studies where they are directly compared; however, there is no evidence that repeated usage of epinephrine has any impact on any clinical outcome for inpatients.[24, 25]
Do not use systemic corticosteroids in children under 2 years of age with a lower respiratory tract infection
In their summary of evidence, the Subcommittee on Diagnosis and Management of Bronchiolitis of the American Academy of Pediatrics recommends against routinely using systemic corticosteroids for infants with bronchiolitis.[14] The previously reference bronchiolitis benchmarking study demonstrated that admitted patients received steroids at a rate of 21% (IQR, 14%26%). The poor efficacy of corticosteroids in children with bronchiolitis under 2 years of age is well demonstrated in the literature. A large, blinded, randomized, controlled study compared systemic oral corticosteroids to placebo in hospitalized children 10 months to 6 years of age with viral wheezing.[26] This study showed no benefit of corticosteroids over placebo in length of stay or parental report of symptoms 1 week later. In the study, a subanalysis of children with eczema and family history of asthma also demonstrated no benefit of systemic corticosteroids. Large systematic reviews further argue that there is no effect of corticosteroids on the likelihood of admission or length of stay in infants with bronchiolitis.[27, 28] One 4‐armed prospective study of children 6 weeks to 12 months of age found no efficacy of dexamethasone over placebo.[23] There was modest benefit of dexamethasone in conjunction with racemic epinephrine; however, this benefit disappeared after adjustment for multiple comparisons. Three smaller studies showing benefit of systemic corticosteroids, however, were highly problematic. They have included older children, were retrospective, or demonstrated inconsistent results.[29, 30] A smaller study showed benefit for children over 2 years of age, but none for children under 2 years of age.[31] Premature infants are at increased risk of asthma, which typically responds well to corticosteroids as these children get older. However, a retrospective study of premature infants under 2 years of age with bronchiolitis demonstrated no association between corticosteroid use and length of stay, even in the subset of premature infants responding to albuterol.[32]
Systemic corticosteroid use in children is not harmless. Children under 2 years of age are especially vulnerable to the decreased growth velocity seen as a side effect of systemic corticosteroids.[33] Corticosteroids may also negatively impact the course of infectious illness. For instance, in children hospitalized with pneumonia but not receiving ‐agonists (ie, patients who are unlikely to have asthma), length of stay is prolonged and readmission is higher in those who receive corticosteroids.[34]
Do not treat gastroesophageal reflux in infants routinely with acid suppression therapy.
From 2000 to 2005, the incidence of infants diagnosed with gastroeshopaheal reflux (GER) tripled (3.4%12.3%), and the use of proton pump inhibitors (PPIs) doubled (31.5%62.6%).[35] Patients diagnosed with GER and treated with antireflux medication incurred 1.8 times higher healthcare costs in 1 study compared to healthy controls.[36] Though common, the use of acid suppressive medications in infants lacks evidence for efficacy in the majority of the clinical scenarios in which they are prescribed.[37, 38] PPIs have failed to outperform placebo for typical infant reflux, which is generally developmental and not pathologic.[39, 40] Furthermore, prompted by findings in adults, multiple pediatric investigators have now catalogued the potential risks associated with acid blockade in children in multiple clinical settings. Specifically, increased risk of pneumonia has been documented in inpatients and outpatients, and increased risk of necrotizing enterocolitis and other serious infections have been documented in intensive care unit settings.[41] In the absence of data supporting efficacy and given the emerging data on risk, empiric acid suppression in infants with reflux is wasteful and potentially harmful.
Do not use continuous pulse oximetry routinely in children with acute respiratory illness unless they are on supplemental oxygen.
Pulse oximetry use has become widespread in the management of infants with bronchiolitis and likely accounts for the dramatic increase in bronchiolitis hospitalization rates in recent years.[14, 42, 43, 44, 45, 46, 47] Despite this increase in hospitalization rate, there was no change in mortality from bronchiolitis between 1979 and 1997.[48] The continuous monitoring of oxygen saturations in hospitalized infants with bronchiolitis may lead to overdiagnosis of hypoxemia and subsequent oxygen use that is of no apparent benefit to the child. Schroeder et al. demonstrated that 26% of a sample of infants hospitalized with bronchiolitis had a prolonged length of stay because of a perceived need for oxygen based on pulse oximetry readings.[43] Unger and Cunningham showed that the need for oxygen was the final determinant of length of stay in 58% of cases, and Cunningham and Murray suggested that using an oxygen saturation cutoff of 94% instead of 90% might increase the length of stay by 22 hours.[44, 49]
It has been previously shown that hypoxia is normative in infants. Healthy infants experience multiple episodes of SpO2 90% while sleeping.[50] This finding strengthens the notion that detection of low saturations in infants convalescing from bronchiolitis may simply reflect overdiagnosis. Among children with chronic severe asthma, who presumably have experienced episodes of hypoxia throughout childhood, there is no difference in school performance compared to healthy controls.[51]
The practice parameter on bronchiolitis from the American Academy of Pediatrics states: as the child's clinical course improves, continuous measurement of SpO2 is not routinely needed, which is a recommendation based on expert consensus.[14] There is at least one ongoing randomized trial comparing the use of continuous versus intermittent pulse oximetry in hospitalized infants with bronchiolitis who are weaned off oxygen (
DISCUSSION
Berwick and Hackbarth define overtreatment as: waste that comes from subjecting patients to care that, according to sound science and the patients' own preferences, cannot possibly help themcare rooted in outmoded habits, supply‐driven behaviors, and ignoring science.[1] With this project, we tried to capture common clinical sources of waste in the inpatient pediatric setting. This is an inherently difficult project because of the absence of solid evidence to inform every decision point in medicine. Although there is always room for improvement in our evidence base, our group intentionally gravitated to areas where the evidence was robust.
The primary strength of this work is the use of the RAND/UCLA appropriateness method or modified Delphi method. Several publications have validated this methodology as a sound strategy to assess quality indicators and issues related to overuse.[7, 53] To our knowledge, we are the first group to report the use of this methodology to develop a list such as the list reported here.
There were some challenges inherent to this project that can be considered limitations of the work. One perceived limitation of our list is the heavy concentration on respiratory diagnoses, especially bronchiolitis and asthma. We do not feel this is a genuine limitation, as the recommendations were partly driven by volume and costs as assessed by the KID database. Among the top 10 acute inpatient diagnoses in pediatrics, respiratory diagnoses are the most common, including bronchiolitis, pneumonia, and asthma. Pneumonia or bronchiolitis has been the most common medical diagnosis in inpatient pediatrics for the past decade, and both are always in the top 10 for costs as well.[54] Thus, the impact of decreasing overuse for these conditions will be highly significant from a simple volume standpoint.
The primary limitation of this work is the lack of implementation strategies. Although the Choosing Wisely campaign has plans for dissemination of the lists, compliance with the recommendations may be suboptimal. Although the development process followed an accepted methodology, shortcomings include the lack of wide, local, multidisciplinary (including parents or caretakers) consultation. Other barriers to compliance with these recommendations exist. Despite evidence that bronchiolitis is a benign self‐limited disease that does not respond to bronchodilators and steroids, the drive to identify and correct all abnormalities, such as wheezing or low oxygen saturation in a nontoxic infant with bronchiolitis, seems to trump the obligation to do no harm in daily practice.[55] This behavior may result from pressure by patients, families, nurses, or peers and is deeply embedded in our medical culture, where action is preferred to inaction without full knowledge or consideration of risks. Doctors and nurses have become attached to the pulse oximeter, believing somehow that the number displayed is less subjective and holds more predictive value than careful evaluation of the patient's respiratory status. Other pressures, such as direct to consumer marketing have made acid reflux a household term that is easily treated with over‐the‐counter medications. Considerations of the care continuum will also serve as barriers. Chest x‐rays, for example, are frequently obtained prior to admission to the hospital before the hospitalist is involved.
To overcome these limitations, the study of individual and organizational adoption of innovation might be relevant. Though it is complex and often more descriptive than proscriptive, a few salient features have emerged. Champions and opinion leaders make a difference, local culture is dominant, social networking is important, simple innovations that can be trialed on a small scale are adaptable by the user and have observable benefits, are more likely to be adopted.[56] Fortunately, the top 5 list meets many of these criteria, but also faces the daunting challenges of inertia, lack of financial incentive, inability to break with old habits, and fear of lawsuits and perceived patient/parent dissatisfaction. Ongoing evaluation, feedback, and audit will be necessary to detect and sustain change.
CONCLUSION
We have identified 5 tests or therapies overused in inpatient general pediatrics. One goal of the Choosing Wisely campaign is to begin to change social norms related to physician behavior. We hope by asking clinicians to consider doing less for common conditions in inpatient pediatrics, that they will increasingly consider the known and unanticipated risks of any medical interventions they choose to use. Finally, we would like to encourage all pediatricians to embrace the idea of good stewardship and join us in prioritizing and addressing waste and overuse as important patient safety issues as well as threats to the sustainability of our healthcare system.
Acknowledgments
The authors thank Drs. Doug Carlson, James O'Callaghan, and Karen Smith from the Society of Hospital Medicine's Pediatric and Quality and Safety Committees for their support of this effort.
Disclosure: Nothing to report.
- , . Eliminating waste in US health care. JAMA. 2012;307:1513–1516.
- , , . Safely doing less: a missing component of the patient safety dialogue. Pediatrics. 2011;128:e1596–e1597.
- , , . To Err Is Human: Building a Safer Health System. Washington, DC: National Academy Press; 2000.
- , , , , , . Temporal trends in rates of patient harm resulting from medical care. N Engl J Med. 2010;363:2124–2134.
- . Screening for prostate cancer: U.S. Preventive Services Task Force recommendation statement. Ann Intern Med. 2012;157:120–134.
- , . Choosing wisely: helping physicians and patients make smart decisions about their care. JAMA. 2012;307:1801–1802.
- , , , et al. The quality of ambulatory care delivered to children in the United States. N Engl J Med. 2007;357:1515–1523.
- National Asthma Education and Prevention Program. Expert panel report 3 (EPR‐3): guidelines for the diagnosis and management of asthma—summary report 2007. J Allergy Clin Immunol. 2007;120:S94–S138.
- , . The chest x‐ray and childhood acute asthma. Aust Clin Rev. 1993;13:153–156.
- , , , . Clinical factors associated with focal infiltrates in wheezing infants and toddlers. Clin Pediatr (Phila). 2000;39:387–393.
- , , , . Chest radiographs in the pediatric emergency department for children < or = 18 months of age with wheezing. Clin Pediatr (Phila). 1999;38:395–399.
- , , , , , . Clinical predictors of pneumonia among children with wheezing. Pediatrics. 2009;124:e29–e36.
- , . Reduce the rads: a quality assurance project on reducing unnecessary chest X‐rays in children with asthma. J Paediatr Child Health. 2005;41:107–111.
- American Academy of Pediatrics Subcommittee on Diagnosis and Management of Bronchiolitis. Diagnosis and management of bronchiolitis. Pediatrics. 2006;118:1774–1793.
- , , , et al. Evaluation of the utility of radiography in acute bronchiolitis. J Pediatr. 2007;150:429–433.
- , , , et al. Incidence and predisposing factors for severe disease in previously healthy term infants experiencing their first episode of bronchiolitis. Acta Paediatr. 2011;100:e17–e23.
- , , , et al. A cost effectiveness analysis of omitting radiography in diagnosis of acute bronchiolitis. Pediatr Pulmonol. 2009;44:122–127.
- , , , et al. Decreasing unnecessary utilization in acute bronchiolitis care: results from the value in inpatient pediatrics network. J Hosp Med. 2013;8:25–30.
- , , , . Efficacy of bronchodilator therapy in bronchiolitis. A meta‐analysis. Arch Pediatr Adolesc Med. 1996;150:1166–1172.
- , . Efficacy of beta2‐agonists in bronchiolitis: a reappraisal and meta‐analysis. Pediatrics. 1997;100:233–239.
- , . Bronchodilators for bronchiolitis. Cochrane Database Syst Rev. 2010;(12):CD001266.
- , , , et al. Epinephrine for bronchiolitis. Cochrane Database Syst Rev. 2011;(6):CD003123.
- , , , et al. Epinephrine and dexamethasone in children with bronchiolitis. N Engl J Med. 2009;360:2079–2089.
- , , , et al. A multicenter, randomized, double‐blind, controlled trial of nebulized epinephrine in infants with acute bronchiolitis. N Engl J Med. 2003;349:27–35.
- , , , . A randomized, controlled trial of the effectiveness of nebulized therapy with epinephrine compared with albuterol and saline in infants hospitalized for acute viral bronchiolitis. J Pediatr. 2002;141:818–824.
- , , , et al. Oral prednisolone for preschool children with acute virus‐induced wheezing. N Engl J Med. 2009;360:329–338.
- , , , et al. Glucocorticoids for acute viral bronchiolitis in infants and young children. Cochrane Database Syst Rev. 2010;(10):CD004878.
- , , , , . Systemic corticosteroids in infant bronchiolitis: a meta‐analysis. Pediatrics. 2000;105:E44.
- , , , . Controlled trial of oral prednisone in the emergency department treatment of children with acute asthma. Pediatrics. 1993;92:513–518.
- , , . Methylprednisolone therapy for acute asthma in infants and toddlers: a controlled clinical trial. Pediatrics. 1990;86:350–356.
- , , , , . Effect of a single oral dose of prednisolone in acute childhood asthma. Lancet. 1987;1:879–882.
- , , , , . The clinical management of preterm infants with bronchiolitis. Hosp Pediatr. 2013;3:244–250.
- , . Glucocorticoids and growth in asthmatic children. Pediatr Allergy Immunol. 1995;6:145–154.
- , , , , , . Adjunct corticosteroids in children hospitalized with community‐acquired pneumonia. Pediatrics. 2011;127:e255–e263.
- , , , , , . Pediatric gastroesophageal reflux disease and acid‐related conditions: trends in incidence of diagnosis and acid suppression therapy. J Med Econ. 2009;12:348–355.
- , , , , , . Healthcare costs of GERD and acid‐related conditions in pediatric patients, with comparison between histamine‐2 receptor antagonists and proton pump inhibitors. Curr Med Res Opin. 2009;25:2703–2709.
- , , , . Are we overprescribing antireflux medications for infants with regurgitation? Pediatrics. 2007;120:946–949.
- , , , , . Proton pump inhibitor utilization patterns in infants. J Pediatr Gastroenterol Nutr. 2007;45:421–427.
- , , , , , . Efficacy of proton‐pump inhibitors in children with gastroesophageal reflux disease: a systematic review. Pediatrics. 2011;127:925–935.
- . Effectiveness and safety of proton pump inhibitors in infantile gastroesophageal reflux disease. Ann Pharmacother. 2010;44:572–576.
- . Are there risks associated with empric acid suppression treatment of infants and children suspected of having gastroesophageal reflux disease? Hosp Pediatr. 2013;3:16–23.
- , , , . Bronchiolitis management preferences and the influence of pulse oximetry and respiratory rate on the decision to admit. Pediatrics. 2003;111:e45–e51.
- , , , . Impact of pulse oximetry and oxygen therapy on length of stay in bronchiolitis hospitalizations. Arch Pediatr Adolesc Med. 2004;158:527–530.
- , . Effect of oxygen supplementation on length of stay for infants hospitalized with acute viral bronchiolitis. Pediatrics. 2008;121:470–475.
- . Oxygen therapy for bronchiolitis. Pediatrics. 2007;120:686–687; author reply 687–688.
- , , , , , . Bronchiolitis‐associated hospitalizations among US children, 1980–1996. JAMA. 1999;282:1440–1446.
- , . Bronchiolitis: recent evidence on diagnosis and management. Pediatrics. 2010;125:342–349.
- , , , , . Bronchiolitis‐associated mortality and estimates of respiratory syncytial virus‐associated deaths among US children, 1979–1997. J Infect Dis. 2001;183:16–22.
- , . Observational study of two oxygen saturation targets for discharge in bronchiolitis. Arch Dis Child. 2012;97:361–363.
- , , , et al. Longitudinal assessment of hemoglobin oxygen saturation in preterm and term infants in the first six months of life. J Pediatr. 2011;159:377–383.e1.
- , . The impact of severe asthma on schoolchildren. J Asthma. 1999;36:409–417.
- , . Multi‐center, randomized trial of pulse oximetry monitoring strategies for children hospitalized for bronchiolitis. Abstract presented at: ID Week 2012; October 2012; San Diego, CA.
- , , , . The appropriateness method has acceptable reliability and validity for assessing overuse and underuse of surgical procedures. J Clin Epidemiol. 2012;65:1133–1143.
- Agency for Healthcare Research and Quality. HCUPnet. Kids inpatient database 2009. Available at: http://hcupnet.ahrq.gov. Accessed November 6, 2012.
- , , . Too little? Too much? Primary care physicians' views on US health care: a brief report. Arch Intern Med. 2011;171:1582–1585.
- . How to implement change in clinical practice. Paediatr Respir Rev. 2003;4:340–346.
Overuse in medicine is a significant and under‐recognized problem. Don Berwick estimated that waste accounts for at least 20% of healthcare expenditures in the United States, with overtreatment as one of the largest categories.[1] A commentary by Schroeder et al. challenged pediatricians to incorporate this knowledge into our own patient safety and quality movement.[2] Recently published data suggest that we are far from achieving the patient safety goals set forth in the Institute of Medicine's landmark To Err is Human[3] report, despite more than a decade of national, local, and regional efforts.[4] One way to reduce waste and improve patient safety is to eliminate practices of unproven benefit. Therapies or tests that may initially seem promising are often proven to be not only unhelpful but actually harmful. The recommendation of the US Preventive Services Task Force against routine screening for prostate specific antigen is an example of how a common test initially thought of as lifesaving actually increases harm.[5]
The American Board of Internal Medicine Foundation (ABIM‐F) recently announced the Choosing Wisely campaign. Through this campaign the Foundation encourages physicians, patients and other healthcare stakeholders to think and talk about medical tests and procedures that may be unnecessary.[6] The primary output of this challenge is the development of a list of 5 tests and or therapies that physicians and patients should question. The ABIM‐F approached different medical societies to develop these lists within their own specialties. The Society of Hospital Medicine (SHM) joined the Choosing Wisely campaign in April 2012, and agreed to develop a list of 5 therapies and tests for adult hospital medicine and pediatric hospital medicine. Here we present the contribution of the pediatric workgroup detailing the methodology and process for developing the list, as well as summarizing the evidence supporting each recommendation.
METHODS
In the spring of 2012, the pediatric committee of the SHM convened a workgroup of pediatric hospitalists to develop a top 5 list for the field. This workgroup was composed of experienced pediatric hospitalists representing diverse geographic locations of the United States and a mix of academic and nonacademic practice settings. The group, consisting of 4 women and 9 men, began by proposing candidate recommendations after discussion with colleagues at their different practice sites. The group was charged to maintain a focus on overuse practices that had a strong basis in evidence, were frequently encountered at their practice sites, and achieved significant consensus among their colleagues. Figure 1 shows the process map describing the method for the development of the pediatric recommendations. All workgroup participants were queried as to conflict of interest relevant to this work and none were identified.
Literature Review
After the generation of the initial top 20 list, 2 reviewers conducted independent literature searches in PubMed, MEDLINE, and the Cochrane Library on the proposed topics. The reviewers also conducted generic Internet searches. Key search terms included pediatric asthma, bronchiolitis, chest radiograph, systemic corticosteroids, gastroesophageal reflux disease (GERD), infant, child, acid suppression therapy, continuous pulse oximetry, pneumonia, gastroenteritis, viral testing, blood culture, and soft tissue infections. To ensure that the reviewers included all studies relevant to the searches, they utilized broad terms. The search included all literature published through 2012, and nonEnglish language publications were included in the search. Studies selected and included in the review were based upon common criteria including whether the article discussed an evaluation of efficacy and/or utility of treatment, included a pediatric population in the guidelines or study, reviewed the harm associated with the administration of a particular test or treatment, and explored the cost associated with the test or treatment.
The Delphi Panel
Members of the workgroup formed a Delphi panel except for 1 member (R.Q.) who served as the nonvoting moderator. The members of the Delphi panel considered the results of the literature search for each recommendation along with the collated feedback from hospitalist listserves as described in Figure 1. Each panel member received a voting instrument with the candidate tests and treatments for the first round of Delphi voting. The panel utilized a modified Delphi method or the RAND Corporation (RAND)/University of California at Los Angeles (UCLA) appropriateness method as described in previous publications of quality indicator development in pediatrics.[7] Each panelist scored the candidate tests and treatments and forwarded the scores to the moderator. Subsequently, all the members of the Delphi panel met through a conference call to carry out the second round of voting. The deidentified collated results of the first round of Delphi voting were made available and discussed during the call. The moderator collated the final results, and the final 5 recommendations were those that had the highest score after the second round of Delphi voting.
Volume and Costs
During deliberations, the committee took into account the prevalence and cost rankings of our most common pediatric inpatient diagnoses. This was done using the Agency for Healthcare Research and Quality's (AHRQ) Healthcare Utilization Project (HCUP), specifically, the Kids' Inpatient Database (KID). HCUP includes the largest collection of longitudinal hospital care data in the United States, encompassing all‐payer discharge‐level information. We excluded normal newborn hospitalizations, and looked at the top 10 acute inpatient diagnoses in terms of both volume and aggregate costs.
RESULTS
The initial list of 20 candidate tests and treatments as well as the refined list of 11 recommendations can be found as electronic supplements to this publication (see Supporting Table 1 and Supporting Table 2 in the online version of this article). The format and language of the list of 11 recommendations were chosen to mesh with that typically used in the ABIM‐F Choosing Wisely campaign. During the Delphi panel, there was strong group consensus about combining items 1 and 2 (chest radiographs in asthma and bronchiolitis) into a single recommendation.
| Do not order chest radiographs in children with asthma or bronchiolitis. |
| Do not use bronchodilators in children with bronchiolitis. |
| Do not use systemic corticosteroids in children under 2 years of age with a lower respiratory tract infection. |
| Do not treat gastroesophageal reflux in infants routinely with acid suppression therapy. |
| Do not use continuous pulse oximetry routinely in children with acute respiratory illness unless they are on supplemental oxygen. |
The top 5 recommendations based on the result of the second round of Delphi scoring are shown in Table 1 and described below along with a detailed evidence summary.
Do not order chest radiographs in children with asthma or bronchiolitis.
The National Heart and Lung Institute's guidelines for the management of asthma, published in 1987, recommend against routinely obtaining chest radiographs in patients with asthma or asthma exacerbations.[8] Supporting this recommendation are several studies that show a low overall yield when obtaining chest radiographs for wheezing patients.[9, 10, 11] Most relevant, studies that evaluated the clinical utility of radiographs in patients with asthma have demonstrated that they influence clinical management in less than 2% of cases.[12] A quality improvement project aimed at decreasing the rate of chest radiographs obtained in patients with asthma demonstrated that close to 60% of patients admitted to the hospital had chest radiographs performed, and that significant overall reductions can be achieved (45.3%28.9%, P=0.0005) without impacting clinical outcomes negatively.[13]
Similarly, the Subcommittee on Diagnosis and Management of Bronchiolitis of the American Academy of Pediatrics recommends against routinely obtaining radiographs during the evaluation for bronchiolitis.[14] Studies assessing the utility of chest x‐rays in these children demonstrate an even lower incidence of abnormalities (0.75%) and indicate that, despite this low incidence, physicians are more likely to treat with antibiotics when radiographs are obtained.[15] There is also evidence that chest radiographs in patients with bronchiolitis are not useful in predicting severity of illness.[16] Furthermore, cost‐effective analyses have demonstrated that omitting chest radiographs in bronchiolitis is actually cost‐effective, without compromising diagnostic accuracy.[17] In a recently published national benchmarking inpatient collaborative, Ralston et al. demonstrated that the majority of patients admitted to the hospital with bronchiolitis have chest radiographs performed at a rate of 64% (interquartile range [IQR], 54%81%).[18]
In both bronchiolitis and asthma, the elimination of unnecessary radiographs has the potential to decrease costs, reduce radiation exposure, and minimize the overuse of antibiotics that often occurs secondary to false positive results.
Do not use bronchodilators in children with bronchiolitis.
Ralston showed that 70% (IQR, 59%83%) of admitted bronchiolitis patients received bronchodilators with an average of 7.9 doses per patient (IQR, 4.69.8). National guidelines for bronchiolitis suggest a very limited role of bronchodilators in patients with bronchiolitis.[14] The first meta‐analyses of studies related to the question of ‐agonist efficacy in bronchiolitis were published in the late 1990s, revealing minimal or no treatment effects.[19, 20] Since then, further research has solidified these findings, and fairly definitive statements can be made based on a recent comprehensive meta‐analysis.[21] The pooled data do not show any effect on hospitalization rates, hospital length of stay, or other inpatient outcomes in bronchiolitis. They do show a small change in clinical scores documented in the outpatient setting, though these scores have not correlated with any detectable difference in outcomes. Routine use of ‐agonists in the inpatient setting has no proven benefit, and given the large amount of consistent data, there is no compelling reason for further study of this therapy in the inpatient setting.
Epinephrine, a combined ‐ and ‐agonist, has been extensively evaluated in bronchiolitis as well. Like albuterol, epinephrine has been reported to have no effect on hospital length of stay in bronchiolitis.[22] The issue of admission rates after epinephrine is complicated by 1 very large study that combined epinephrine with dexamethasone and reported a decreased admission rate, though only at 7 days after therapy; however, this effect was nullified after adjustment for multiple comparisons.[23] When the end point is improvement of respiratory scores, epinephrine may perform better than albuterol in studies where they are directly compared; however, there is no evidence that repeated usage of epinephrine has any impact on any clinical outcome for inpatients.[24, 25]
Do not use systemic corticosteroids in children under 2 years of age with a lower respiratory tract infection
In their summary of evidence, the Subcommittee on Diagnosis and Management of Bronchiolitis of the American Academy of Pediatrics recommends against routinely using systemic corticosteroids for infants with bronchiolitis.[14] The previously reference bronchiolitis benchmarking study demonstrated that admitted patients received steroids at a rate of 21% (IQR, 14%26%). The poor efficacy of corticosteroids in children with bronchiolitis under 2 years of age is well demonstrated in the literature. A large, blinded, randomized, controlled study compared systemic oral corticosteroids to placebo in hospitalized children 10 months to 6 years of age with viral wheezing.[26] This study showed no benefit of corticosteroids over placebo in length of stay or parental report of symptoms 1 week later. In the study, a subanalysis of children with eczema and family history of asthma also demonstrated no benefit of systemic corticosteroids. Large systematic reviews further argue that there is no effect of corticosteroids on the likelihood of admission or length of stay in infants with bronchiolitis.[27, 28] One 4‐armed prospective study of children 6 weeks to 12 months of age found no efficacy of dexamethasone over placebo.[23] There was modest benefit of dexamethasone in conjunction with racemic epinephrine; however, this benefit disappeared after adjustment for multiple comparisons. Three smaller studies showing benefit of systemic corticosteroids, however, were highly problematic. They have included older children, were retrospective, or demonstrated inconsistent results.[29, 30] A smaller study showed benefit for children over 2 years of age, but none for children under 2 years of age.[31] Premature infants are at increased risk of asthma, which typically responds well to corticosteroids as these children get older. However, a retrospective study of premature infants under 2 years of age with bronchiolitis demonstrated no association between corticosteroid use and length of stay, even in the subset of premature infants responding to albuterol.[32]
Systemic corticosteroid use in children is not harmless. Children under 2 years of age are especially vulnerable to the decreased growth velocity seen as a side effect of systemic corticosteroids.[33] Corticosteroids may also negatively impact the course of infectious illness. For instance, in children hospitalized with pneumonia but not receiving ‐agonists (ie, patients who are unlikely to have asthma), length of stay is prolonged and readmission is higher in those who receive corticosteroids.[34]
Do not treat gastroesophageal reflux in infants routinely with acid suppression therapy.
From 2000 to 2005, the incidence of infants diagnosed with gastroeshopaheal reflux (GER) tripled (3.4%12.3%), and the use of proton pump inhibitors (PPIs) doubled (31.5%62.6%).[35] Patients diagnosed with GER and treated with antireflux medication incurred 1.8 times higher healthcare costs in 1 study compared to healthy controls.[36] Though common, the use of acid suppressive medications in infants lacks evidence for efficacy in the majority of the clinical scenarios in which they are prescribed.[37, 38] PPIs have failed to outperform placebo for typical infant reflux, which is generally developmental and not pathologic.[39, 40] Furthermore, prompted by findings in adults, multiple pediatric investigators have now catalogued the potential risks associated with acid blockade in children in multiple clinical settings. Specifically, increased risk of pneumonia has been documented in inpatients and outpatients, and increased risk of necrotizing enterocolitis and other serious infections have been documented in intensive care unit settings.[41] In the absence of data supporting efficacy and given the emerging data on risk, empiric acid suppression in infants with reflux is wasteful and potentially harmful.
Do not use continuous pulse oximetry routinely in children with acute respiratory illness unless they are on supplemental oxygen.
Pulse oximetry use has become widespread in the management of infants with bronchiolitis and likely accounts for the dramatic increase in bronchiolitis hospitalization rates in recent years.[14, 42, 43, 44, 45, 46, 47] Despite this increase in hospitalization rate, there was no change in mortality from bronchiolitis between 1979 and 1997.[48] The continuous monitoring of oxygen saturations in hospitalized infants with bronchiolitis may lead to overdiagnosis of hypoxemia and subsequent oxygen use that is of no apparent benefit to the child. Schroeder et al. demonstrated that 26% of a sample of infants hospitalized with bronchiolitis had a prolonged length of stay because of a perceived need for oxygen based on pulse oximetry readings.[43] Unger and Cunningham showed that the need for oxygen was the final determinant of length of stay in 58% of cases, and Cunningham and Murray suggested that using an oxygen saturation cutoff of 94% instead of 90% might increase the length of stay by 22 hours.[44, 49]
It has been previously shown that hypoxia is normative in infants. Healthy infants experience multiple episodes of SpO2 90% while sleeping.[50] This finding strengthens the notion that detection of low saturations in infants convalescing from bronchiolitis may simply reflect overdiagnosis. Among children with chronic severe asthma, who presumably have experienced episodes of hypoxia throughout childhood, there is no difference in school performance compared to healthy controls.[51]
The practice parameter on bronchiolitis from the American Academy of Pediatrics states: as the child's clinical course improves, continuous measurement of SpO2 is not routinely needed, which is a recommendation based on expert consensus.[14] There is at least one ongoing randomized trial comparing the use of continuous versus intermittent pulse oximetry in hospitalized infants with bronchiolitis who are weaned off oxygen (
DISCUSSION
Berwick and Hackbarth define overtreatment as: waste that comes from subjecting patients to care that, according to sound science and the patients' own preferences, cannot possibly help themcare rooted in outmoded habits, supply‐driven behaviors, and ignoring science.[1] With this project, we tried to capture common clinical sources of waste in the inpatient pediatric setting. This is an inherently difficult project because of the absence of solid evidence to inform every decision point in medicine. Although there is always room for improvement in our evidence base, our group intentionally gravitated to areas where the evidence was robust.
The primary strength of this work is the use of the RAND/UCLA appropriateness method or modified Delphi method. Several publications have validated this methodology as a sound strategy to assess quality indicators and issues related to overuse.[7, 53] To our knowledge, we are the first group to report the use of this methodology to develop a list such as the list reported here.
There were some challenges inherent to this project that can be considered limitations of the work. One perceived limitation of our list is the heavy concentration on respiratory diagnoses, especially bronchiolitis and asthma. We do not feel this is a genuine limitation, as the recommendations were partly driven by volume and costs as assessed by the KID database. Among the top 10 acute inpatient diagnoses in pediatrics, respiratory diagnoses are the most common, including bronchiolitis, pneumonia, and asthma. Pneumonia or bronchiolitis has been the most common medical diagnosis in inpatient pediatrics for the past decade, and both are always in the top 10 for costs as well.[54] Thus, the impact of decreasing overuse for these conditions will be highly significant from a simple volume standpoint.
The primary limitation of this work is the lack of implementation strategies. Although the Choosing Wisely campaign has plans for dissemination of the lists, compliance with the recommendations may be suboptimal. Although the development process followed an accepted methodology, shortcomings include the lack of wide, local, multidisciplinary (including parents or caretakers) consultation. Other barriers to compliance with these recommendations exist. Despite evidence that bronchiolitis is a benign self‐limited disease that does not respond to bronchodilators and steroids, the drive to identify and correct all abnormalities, such as wheezing or low oxygen saturation in a nontoxic infant with bronchiolitis, seems to trump the obligation to do no harm in daily practice.[55] This behavior may result from pressure by patients, families, nurses, or peers and is deeply embedded in our medical culture, where action is preferred to inaction without full knowledge or consideration of risks. Doctors and nurses have become attached to the pulse oximeter, believing somehow that the number displayed is less subjective and holds more predictive value than careful evaluation of the patient's respiratory status. Other pressures, such as direct to consumer marketing have made acid reflux a household term that is easily treated with over‐the‐counter medications. Considerations of the care continuum will also serve as barriers. Chest x‐rays, for example, are frequently obtained prior to admission to the hospital before the hospitalist is involved.
To overcome these limitations, the study of individual and organizational adoption of innovation might be relevant. Though it is complex and often more descriptive than proscriptive, a few salient features have emerged. Champions and opinion leaders make a difference, local culture is dominant, social networking is important, simple innovations that can be trialed on a small scale are adaptable by the user and have observable benefits, are more likely to be adopted.[56] Fortunately, the top 5 list meets many of these criteria, but also faces the daunting challenges of inertia, lack of financial incentive, inability to break with old habits, and fear of lawsuits and perceived patient/parent dissatisfaction. Ongoing evaluation, feedback, and audit will be necessary to detect and sustain change.
CONCLUSION
We have identified 5 tests or therapies overused in inpatient general pediatrics. One goal of the Choosing Wisely campaign is to begin to change social norms related to physician behavior. We hope by asking clinicians to consider doing less for common conditions in inpatient pediatrics, that they will increasingly consider the known and unanticipated risks of any medical interventions they choose to use. Finally, we would like to encourage all pediatricians to embrace the idea of good stewardship and join us in prioritizing and addressing waste and overuse as important patient safety issues as well as threats to the sustainability of our healthcare system.
Acknowledgments
The authors thank Drs. Doug Carlson, James O'Callaghan, and Karen Smith from the Society of Hospital Medicine's Pediatric and Quality and Safety Committees for their support of this effort.
Disclosure: Nothing to report.
- , . Eliminating waste in US health care. JAMA. 2012;307:1513–1516.
- , , . Safely doing less: a missing component of the patient safety dialogue. Pediatrics. 2011;128:e1596–e1597.
- , , . To Err Is Human: Building a Safer Health System. Washington, DC: National Academy Press; 2000.
- , , , , , . Temporal trends in rates of patient harm resulting from medical care. N Engl J Med. 2010;363:2124–2134.
- . Screening for prostate cancer: U.S. Preventive Services Task Force recommendation statement. Ann Intern Med. 2012;157:120–134.
- , . Choosing wisely: helping physicians and patients make smart decisions about their care. JAMA. 2012;307:1801–1802.
- , , , et al. The quality of ambulatory care delivered to children in the United States. N Engl J Med. 2007;357:1515–1523.
- National Asthma Education and Prevention Program. Expert panel report 3 (EPR‐3): guidelines for the diagnosis and management of asthma—summary report 2007. J Allergy Clin Immunol. 2007;120:S94–S138.
- , . The chest x‐ray and childhood acute asthma. Aust Clin Rev. 1993;13:153–156.
- , , , . Clinical factors associated with focal infiltrates in wheezing infants and toddlers. Clin Pediatr (Phila). 2000;39:387–393.
- , , , . Chest radiographs in the pediatric emergency department for children < or = 18 months of age with wheezing. Clin Pediatr (Phila). 1999;38:395–399.
- , , , , , . Clinical predictors of pneumonia among children with wheezing. Pediatrics. 2009;124:e29–e36.
- , . Reduce the rads: a quality assurance project on reducing unnecessary chest X‐rays in children with asthma. J Paediatr Child Health. 2005;41:107–111.
- American Academy of Pediatrics Subcommittee on Diagnosis and Management of Bronchiolitis. Diagnosis and management of bronchiolitis. Pediatrics. 2006;118:1774–1793.
- , , , et al. Evaluation of the utility of radiography in acute bronchiolitis. J Pediatr. 2007;150:429–433.
- , , , et al. Incidence and predisposing factors for severe disease in previously healthy term infants experiencing their first episode of bronchiolitis. Acta Paediatr. 2011;100:e17–e23.
- , , , et al. A cost effectiveness analysis of omitting radiography in diagnosis of acute bronchiolitis. Pediatr Pulmonol. 2009;44:122–127.
- , , , et al. Decreasing unnecessary utilization in acute bronchiolitis care: results from the value in inpatient pediatrics network. J Hosp Med. 2013;8:25–30.
- , , , . Efficacy of bronchodilator therapy in bronchiolitis. A meta‐analysis. Arch Pediatr Adolesc Med. 1996;150:1166–1172.
- , . Efficacy of beta2‐agonists in bronchiolitis: a reappraisal and meta‐analysis. Pediatrics. 1997;100:233–239.
- , . Bronchodilators for bronchiolitis. Cochrane Database Syst Rev. 2010;(12):CD001266.
- , , , et al. Epinephrine for bronchiolitis. Cochrane Database Syst Rev. 2011;(6):CD003123.
- , , , et al. Epinephrine and dexamethasone in children with bronchiolitis. N Engl J Med. 2009;360:2079–2089.
- , , , et al. A multicenter, randomized, double‐blind, controlled trial of nebulized epinephrine in infants with acute bronchiolitis. N Engl J Med. 2003;349:27–35.
- , , , . A randomized, controlled trial of the effectiveness of nebulized therapy with epinephrine compared with albuterol and saline in infants hospitalized for acute viral bronchiolitis. J Pediatr. 2002;141:818–824.
- , , , et al. Oral prednisolone for preschool children with acute virus‐induced wheezing. N Engl J Med. 2009;360:329–338.
- , , , et al. Glucocorticoids for acute viral bronchiolitis in infants and young children. Cochrane Database Syst Rev. 2010;(10):CD004878.
- , , , , . Systemic corticosteroids in infant bronchiolitis: a meta‐analysis. Pediatrics. 2000;105:E44.
- , , , . Controlled trial of oral prednisone in the emergency department treatment of children with acute asthma. Pediatrics. 1993;92:513–518.
- , , . Methylprednisolone therapy for acute asthma in infants and toddlers: a controlled clinical trial. Pediatrics. 1990;86:350–356.
- , , , , . Effect of a single oral dose of prednisolone in acute childhood asthma. Lancet. 1987;1:879–882.
- , , , , . The clinical management of preterm infants with bronchiolitis. Hosp Pediatr. 2013;3:244–250.
- , . Glucocorticoids and growth in asthmatic children. Pediatr Allergy Immunol. 1995;6:145–154.
- , , , , , . Adjunct corticosteroids in children hospitalized with community‐acquired pneumonia. Pediatrics. 2011;127:e255–e263.
- , , , , , . Pediatric gastroesophageal reflux disease and acid‐related conditions: trends in incidence of diagnosis and acid suppression therapy. J Med Econ. 2009;12:348–355.
- , , , , , . Healthcare costs of GERD and acid‐related conditions in pediatric patients, with comparison between histamine‐2 receptor antagonists and proton pump inhibitors. Curr Med Res Opin. 2009;25:2703–2709.
- , , , . Are we overprescribing antireflux medications for infants with regurgitation? Pediatrics. 2007;120:946–949.
- , , , , . Proton pump inhibitor utilization patterns in infants. J Pediatr Gastroenterol Nutr. 2007;45:421–427.
- , , , , , . Efficacy of proton‐pump inhibitors in children with gastroesophageal reflux disease: a systematic review. Pediatrics. 2011;127:925–935.
- . Effectiveness and safety of proton pump inhibitors in infantile gastroesophageal reflux disease. Ann Pharmacother. 2010;44:572–576.
- . Are there risks associated with empric acid suppression treatment of infants and children suspected of having gastroesophageal reflux disease? Hosp Pediatr. 2013;3:16–23.
- , , , . Bronchiolitis management preferences and the influence of pulse oximetry and respiratory rate on the decision to admit. Pediatrics. 2003;111:e45–e51.
- , , , . Impact of pulse oximetry and oxygen therapy on length of stay in bronchiolitis hospitalizations. Arch Pediatr Adolesc Med. 2004;158:527–530.
- , . Effect of oxygen supplementation on length of stay for infants hospitalized with acute viral bronchiolitis. Pediatrics. 2008;121:470–475.
- . Oxygen therapy for bronchiolitis. Pediatrics. 2007;120:686–687; author reply 687–688.
- , , , , , . Bronchiolitis‐associated hospitalizations among US children, 1980–1996. JAMA. 1999;282:1440–1446.
- , . Bronchiolitis: recent evidence on diagnosis and management. Pediatrics. 2010;125:342–349.
- , , , , . Bronchiolitis‐associated mortality and estimates of respiratory syncytial virus‐associated deaths among US children, 1979–1997. J Infect Dis. 2001;183:16–22.
- , . Observational study of two oxygen saturation targets for discharge in bronchiolitis. Arch Dis Child. 2012;97:361–363.
- , , , et al. Longitudinal assessment of hemoglobin oxygen saturation in preterm and term infants in the first six months of life. J Pediatr. 2011;159:377–383.e1.
- , . The impact of severe asthma on schoolchildren. J Asthma. 1999;36:409–417.
- , . Multi‐center, randomized trial of pulse oximetry monitoring strategies for children hospitalized for bronchiolitis. Abstract presented at: ID Week 2012; October 2012; San Diego, CA.
- , , , . The appropriateness method has acceptable reliability and validity for assessing overuse and underuse of surgical procedures. J Clin Epidemiol. 2012;65:1133–1143.
- Agency for Healthcare Research and Quality. HCUPnet. Kids inpatient database 2009. Available at: http://hcupnet.ahrq.gov. Accessed November 6, 2012.
- , , . Too little? Too much? Primary care physicians' views on US health care: a brief report. Arch Intern Med. 2011;171:1582–1585.
- . How to implement change in clinical practice. Paediatr Respir Rev. 2003;4:340–346.
Copyright © 2013 Society of Hospital Medicine

VIP Quality Improvement Network
Currently, 3%5% of infants under a year of age will be admitted to a hospital for acute viral bronchiolitis each year, making it the leading cause of hospitalization in children.15 The American Academy of Pediatrics guideline on the diagnosis and management of bronchiolitis advocates primarily supportive care for this self‐limited disease.6 Specifically, the routine use of therapies such as bronchodilators and corticosteroids are not recommended, nor is routine evaluation with diagnostic testing.6 Numerous studies have established the presence of unwarranted variation in most aspects of bronchiolitis care,713 and the current evidence does not support the routine usage of specific interventions in inpatients.1418
Acute bronchiolitis accounts for direct inpatient medical costs of over $500 million per year.19 Based on estimates from the Healthcare Utilization Project Kids' Inpatient Database, acute bronchiolitis is second only to respiratory distress syndrome as the most expensive disease of hospitalized children.1 Although charges may not correlate directly with costs or even the actual intensity of resource utilization, the national bill, based on charges, is approximately 1.4 billion dollars per year.1 Either way, the leading cause of hospitalization in children is expensive and suffers from dramatic variation in care characterized by overutilization of ineffective interventions.
Evidence‐based guidelines for bronchiolitis are readily available and their successful adoption within larger, academic children's hospitals has been demonstrated.2028 However, upwards of 70% of all children in this country are cared for outside of freestanding children's hospitals,1 and very little has been published about wide dissemination of evidence‐based guidelines in these settings.29 In 2008, the Value in Inpatient Pediatrics (VIP) network was created, as an inclusive pediatric inpatient quality improvement collaborative with a focus on linking academic and community‐based hospitalist groups, to disseminate evidence‐based management strategies for bronchiolitis. We hypothesized that group norming, through benchmarking and public goal setting at the level of the hospitalist group, would decrease overall utilization of nonevidence‐based therapies. Specifically, we were trying to decrease the utilization of bronchodilators, steroids, chest physiotherapy, chest radiography, and viral testing in hospitalized children diagnosed with uncomplicated bronchiolitis.
METHODS
Beginning in early 2008, we recruited pediatric hospitalists into a voluntary bronchiolitis quality improvement collaborative from within the community of hospitalists created by the American Academy of Pediatrics Section on Hospital Medicine. Participants were recruited through open calls at national conferences and mass e‐mails to the section membership through the listserve. The guiding principle for the collaborative was the idea that institutional adoption of evidence‐based disease‐management strategies would result in higher value of care, and that this process could be facilitated by benchmarking local performance against norms created within the larger community. We used group consensus to identify the therapies and tests to benchmark, although the chosen measures meshed with those addressed in the American Academy of Pediatrics (AAP) clinical practice guideline. Use of bronchodilators, corticosteroids, chest physiotherapy, chest radiography, and viral testing were all felt to be significantly overutilized in participating clinical sites. We were unaware of any published national targets for utilization of these therapies or tests, and none of the participating hospitalist groups was actively benchmarking their utilization against any peer group at the start of the project. Length of stay, rates of readmission within 72 hours of discharge, and variable direct costs were chosen as balancing measures for the project.
We collected data on hospitalizations for bronchiolitis for 4 calendar years, from 2007 through 2010, based on the following inclusion criteria: children under 24 months of age, hospitalized for the primary diagnosis of acute viral bronchiolitis as defined by International Classification of Diseases, Ninth Revision (ICD‐9) codes 466.11 and 466.19. We specifically included patients who were in observation status as well as those in inpatient status, and excluded all intensive care unit admissions. Other exclusions were specific ICD‐9 codes for: chronic lung diseases, asthma, chromosomal abnormalities, heart disease, and neurological diseases. We then tracked overall utilization of any bronchodilator (albuterol, levalbuterol, epinephrine, or ipratropium) during the hospitalization, including the emergency department; total number of bronchodilator doses per patient; utilization of any corticosteroids (inhaled or systemic); chest radiography; respiratory syncytial virus (RSV) testing; and chest physiotherapy; as well as variable direct costs per hospitalization for each center. A standardized toolkit was provided to participating centers to facilitate data collection. Data was sought from administrative sources, collected in aggregate form and not at the patient level, and no protected health information was collected as part of the project. The project was categorized as exempt by the University of Texas Health Science Center San Antonio Institutional Review Board, the location of the data repository.
The project began in 2008, though we requested that centers provide 2007 data to supplement our baseline. We held the first group meeting in July 2009 and began the facilitated sharing of resources to promote evidence‐based care, such as guidelines, protocols, respiratory scores, and patient handouts, across sites using data from 2007 and 2008 as our baseline for benchmarking and later assessing any improvement. Centers adopted guidelines at their own pace and we did not require guideline adoption for continued participation. We provided summaries of the available literature by topic, in the event that site leaders wished to give institutional grand rounds or other presentations. All dissemination of guidelines or protocols was done based on the request of the center, and no specific resource was created or sanctioned by the group, though the AAP Guideline for the Diagnosis and Management of Bronchiolitis6 remained a guiding document. Some of our centers participated in more extensive collaborative projects which involved small‐group goal setting, adoption of similar protocols, and conference calls, though this never encompassed more than 25% of the network.
The main product of the project was a yearly report benchmarking each hospital against the network average on each of our chosen utilization measures. The first report was disseminated in July 2009 and included data on calendar year 2007 and 2008, which we considered our group baseline. Most institutions began local Plan‐Do‐Study‐Act (PDSA) cycles by mid‐2009 using the data we provided as they benchmarked their performance against other members of the collaborative, and these continued through 2010. Hospitals were coded and remained anonymous. However, we publicly honored the high performers within the network at a yearly meeting, and urged these centers to share their tools and strategies, which was facilitated through a project Web site.30 All participation was voluntary, and all costs were borne by individuals or their respective centers.
In order to assess data quality, we undertook a validation project for calendar year 2009. We requested local direct chart review of a 10% sample, or a minimum of 10 charts, to confirm reported utilization rates for the therapies and tests we tracked. Any center with less than 80% accuracy was then asked to review data collection methods and make adjustments accordingly. One center identified and resolved a significant data discrepancy and 2 centers refused to participate in the validation project, citing their participation in a large national database for which there was already a very rigorous data validation process (Child Health Corporation of America's Pediatric Health Information System database). Given that we did not uncover major discrepancies in data quality within our network, we did not request further data validation but rather promoted year‐to‐year consistency of collection methods, seeking to collect the same type/quality of data that hospitals use in their own internal performance assessments.
Statistical analyses were performed using GraphPad InStat, version 3.0 (GraphPad Software, San Diego, CA). Descriptive statistics (including interquartile range ([IQR], the range from 25th to 75th percentile of the data) are provided. Analysis of process measures over the series of years was performed using repeated measures analysis of variance (ANOVA), as were intra‐hospital comparisons for all measures. Hospitals were not weighted by volume of admissions, ie, the unit of analysis was the hospital and not individual hospitalizations. Data were analyzed for normality using the method of Kolmogorov and Smirnoff, and in cases where normality was not satisfied (steroids and chest physiotherapy), the data were transformed and nonparametric methods were used. Post‐test adjustment for multiple comparisons was done using the TukeyKramer test in cases where ANOVA P values were <0.05. Fisher's exact test was used to analyze contingency tables for categorical variables such as presence or absence of a protocol.
RESULTS
Data encompassing 11,568 bronchiolitis hospitalizations in 17 centers, for calendar years 2007 to 2010, were analyzed for this report. A total of 31 centers ever participated in the project; however, this report is restricted to centers who participated for the entirety of the project from 2008 through 2010, and who consented to have their data reported. Specifically, 18 centers met inclusion criteria and 1 center opted out of the project, leaving the 17 centers described in Table 1. The overall network makeup shifted each year, but was always more than 80% non‐freestanding children's hospitals and approximately 30% urban, as defined as located in a population center of more than 1 million. A large majority of the participants did not have a local bronchiolitis protocol or guideline at the start of the project, although 88% of participants adopted some form of protocolized care by 2010. Calendar years 2007 and 2008 served as our network baseline, with most interventions (in institutions where they occurred) begun by calendar year 2009. The level of intervention varied greatly among institutions, with a few institutions doing nothing more than benchmarking their performance.
| Participating Centers (Alphabetically by State) | Type of Facility | Average Yearly Bronchiolitis Admissions | Approximate Medicaid (%) | Guideline Prior to Joining Project? | Location |
|---|---|---|---|---|---|
| |||||
| Scottsdale Healthcare Scottsdale, AZ | PEDS | 133 | 26 | No | Suburban |
| Shands Hospital for Children at the University of Florida Gainesville, FL | CHWH | 107 | 59 | No | Suburban |
| Children's Hospital of Illinois Peoria, IL | CHWH | 97 | 15 | No | Suburban |
| Kentucky Children's Hospital Lexington, KY | CHWH | 135 | 60 | Yes | Suburban |
| Our Lady of the Lake Baton Rouge, LA | CHWH | 138 | 70 | No | Suburban |
| The Barbara Bush Children's Hospital Portland, ME | CHWH | 31 | 41 | Yes | Suburban |
| Franklin Square Hospital Center Baltimore, MD | PEDS | 66 | 40 | No | Suburban |
| Anne Arundel Medical Center Annapolis, MD | CHWH | 56 | 36 | No | Suburban |
| Children's Hospital at Montefiore Bronx, NY | CHWH | 220 | 65 | No | Urban |
| Mission Children's Hospital Asheville, NC | CHWH | 112 | 21 | Yes | Suburban |
| Cleveland Clinic Children's Hospital Cleveland, OH | CHWH | 58 | 24 | Yes | Urban |
| Palmetto Health Children's Hospital Columbia, SC | CHWH | 181 | 60 | No | Suburban |
| East Tennessee Children's Hospital Knoxville, TN | FSCH | 373 | 60 | No | Suburban |
| Texas Children's Hospital Houston, TX | FSCH | 619 | 60 | Yes | Urban |
| Christus Santa Rosa Children's Hospital San Antonio, TX | CHWH | 390 | 71 | No | Urban |
| Children's Hospital of The Kings' Daughters Norfolk, VA | FSCH | 303 | 60 | No | Suburban |
| Children's Hospital of Richmond Richmond, VA | CHWH | 40 | 60 | No | Urban |
Mean length of stay (LOS), readmission rates, and variable direct costs did not differ significantly during the project time period. Mean LOS for the network ranged from a low of 2.4 days (IQR, 2.22.8 days) to a high of 2.7 days (IQR, 2.43.1 days), and mean readmission rates ranged from 1.2% (IQR, 0.7%1.8%) to 1.7% (IQR, 0.7%2.5%) during the project. Mean variable direct costs ranged from $1639 (IQR, $1383$1864) to $1767 (IQR, $1365$2320).
Table 2 describes the mean overall utilization of bronchodilators, chest radiography, RSV testing, steroids, and chest physiotherapy among the group from 2007 to 2010. By 2010, we saw a 46% decline in the volume of bronchodilator used within the network, a 3.6 (95% confidence interval [CI] 1.45.8) dose per patient absolute decrease (P < 0.01). We also saw a 12% (95% CI 5%25%) absolute decline in the overall percentage of patients exposed to any bronchodilator (P < 0.01). Finally, there was a 10% (95% CI 3%18%) absolute decline in the overall utilization of any chest physiotherapy (P < 0.01). The project did not demonstrate a significant impact on utilization of corticosteroids, chest radiography, or viral testing, although several centers achieved significant decreases on a local level (data not shown).
| Utilization Measure | 2007 | 2008 | 2009 | 2010 |
|---|---|---|---|---|
| No. (IQR) | No. (IQR) | No. (IQR) | No. (IQR) | |
| ||||
| Bronchodilator doses per patient (P < 0.01) | 7.9 (4.69.8) | 6.4 (4.08.4) | 5.7 (3.67.6) | 4.3 (3.05.9) |
| Any bronchodilators (P < 0.01) | 70% (59%83%) | 67% (56%77%) | 68% (61%76%) | 58% (46%69%) |
| Chest physiotherapy (P < 0.01) | 14% (5%19%) | 10% (1%8%) | 7% (2%6%) | 4% (1%7%) |
| Chest radiography (P = NS) | 64% (54%81%) | 66% (55%79%) | 64% (60%73%) | 59% (50%73%) |
| Any steroids (P = NS) | 21% (14%26%) | 20% (15%28%) | 21% (14%22%) | 16% (13%25%) |
| RSV testing (P = NS) | 64% (52%84%) | 61% (49%78%) | 62% (50%78%) | 57% (44%75%) |
We analyzed within‐hospital trends as well. Figure 1 describes intra‐hospital change over the course of the project for overall bronchodilator usage. In this analysis, 15 of 17 hospitals (88%) achieved a significant decrease in overall bronchodilator utilization by 2010. (Hospitals 27 and 29 were unable to provide 2007 baseline data.) For doses per patient, 15 of 17 institutions provided data on this measure, and 12 of 15 (80%) achieved significant decreases (Figure 2). Of note, the institutions failing to achieve significant decreases in bronchodilator utilization entered the project with utilization rates that were already significantly below network mean at the start of the project. (Institutions failing to improve are denoted with an asterisk in Figures 1 and 2.) Since most institutions made significant improvements in bronchodilator utilization over time, we looked for correlates of failure to decrease utilization. The strongest association for failure to improve during the project period was use of a protocol prior to joining the network (odds ratio [OR] = 11, 95% CI 261).
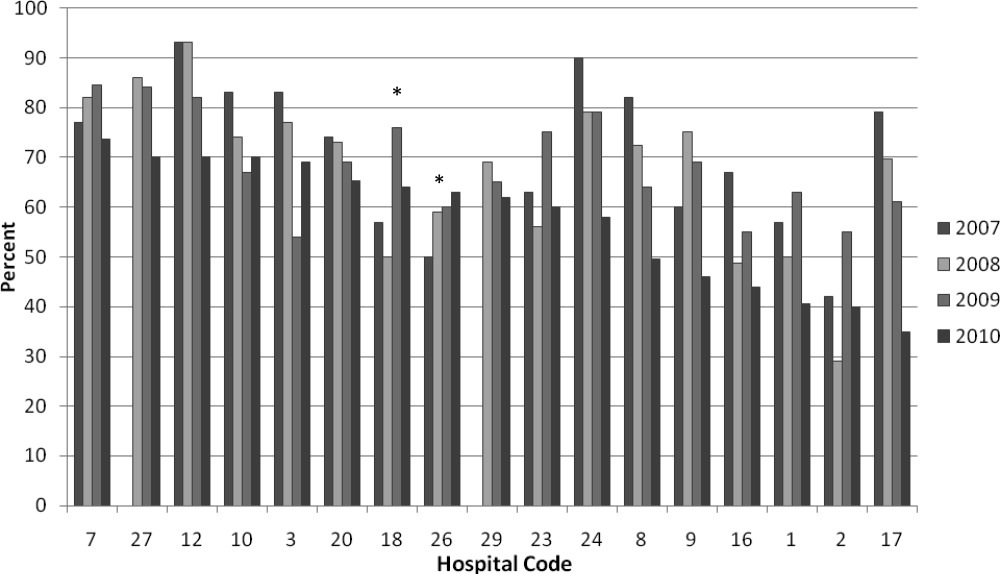
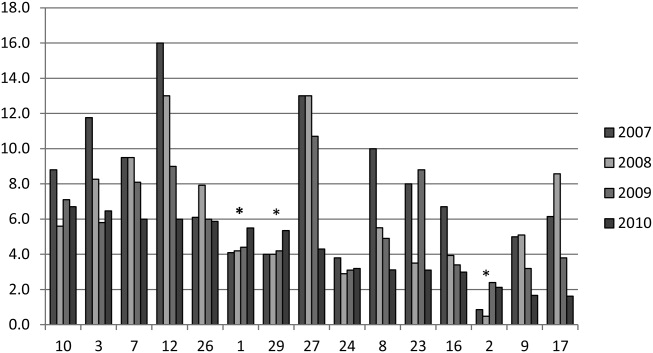
DISCUSSION
We demonstrated a significant decline in utilization of bronchodilators and chest physiotherapy in inpatient bronchiolitis within a voluntary quality collaborative focused on benchmarking without employing intensive interventions. This observation is important in that it demonstrates real‐world efficacy for our methods. Prior literature has clearly demonstrated that local bronchiolitis guidelines are effective; however, our data on over 11,000 hospitalizations from a broad array of inpatient settings continue to show a high rate of overutilization. We facilitated dissemination and sharing of guideline‐related tools primarily electronically, and capitalized on perceived peer‐group frustration with inefficient management of a high‐volume, high‐utilization disease. While the project leadership had varying degrees of advanced training in quality improvement methodology, the majority of the site leaders were self‐taught and trained while on the job. Our inclusive collaborative had some success using pragmatic and low‐resource methods which we believe is a novel approach to the issue of overutilization.
These considerations are highlighted given the pressing need to find more efficient and scalable means of bending the cost curve of healthcare in the United States. Learning collaboratives are a relatively new model for improvement, with some history in pediatrics,31, 32 and are attractive because of their potential to generate both widespread capacity for change as well as direct improvement. Both cystic fibrosis31 and neonatology collaboratives32 have been celebrated for their positive impacts on children's healthcare, and both are testaments to the power inherent in creating a community of like‐minded individuals. One of the most popular models for learning collaboratives remains the Institute for Healthcare Improvement's Breakthrough Series; however, this model is resource intensive in that it typically involves large teams and several yearly face‐to‐face meetings, with significant monetary investment on the part of hospitals. On the other hand, virtual collaboratives have produced mixed results with respect to quality improvement,33 so there is a continued need to maximize our learning about what works efficiently. Our collaborative was able to successfully disseminate tools developed in large academic institutions to be applied in smaller and more varied settings, where resources for quality improvement activities were limited.
One possible reason for any successes in this project was the existence of a well‐known guideline for the management of bronchiolitis published by the American Academy of Pediatrics in 2006. This guideline recommends primarily symptomatic care, and has a statement supporting the contention that routine use of our targeted therapies is unnecessary. It allows for a trial of bronchodilator, but specifically states that all trials should be accompanied by the use of an objective measure of improvement (typically interpreted to mean a respiratory distress score). A guideline sanctioned by an important national organization of pediatricians was invaluable, and we believe that it should serve as a basis for any nationally promoted inpatient quality measure for this very common pediatric illness. The existence of the AAP guideline also highlights the possibility that our results are merely representative of secular trends in utilization in bronchiolitis care, since we had no control group. The available literature on national guidelines has shown mixed and quite modest impacts in other countries.28, 34 Most of our group took active steps to operationalize the guidelines as part of their participation in this collaborative, though they might have done similar work anyway due to the increasing importance of quality improvement in hospitalist culture over the years of the project.
The project did not demonstrate any impact on steroid utilization, or on rates of obtaining chest radiography or viral testing, despite expressly targeting these widely overused interventions. These modalities are often employed in the emergency department and, as a collaborative of pediatric hospitalists, we did not have specific emergency department participation which we recognize as a major weakness and potential impediment to further progress. We hope to collaborate with our respective emergency departments in the future on these particular measures. We also noted that many institutions were inflexible about foregoing viral testing, due to infection control issues arising from the need to cohort patients in shared rooms based on RSV positivity during the busy winter months. A few institutions were able to alter their infection control policies using the strategy of assuming all children with bronchiolitis had RSV (ie, choosing to use both contact precautions and to wear a mask when entering rooms), though this was not universally popular. Finally, we recognize a missed opportunity in not collecting dose per patient level data for steroids, which might have allowed us to distinguish hospitals with ongoing inpatient utilization of steroids from those with only emergency department usage.
Another significant limitation of this project was the lack of annual assessments of data quality. However, we believe our findings are still useful and important, even with this obvious limitation. Most quality improvement work is done using hospital‐supplied data gleaned from administrative databases, exactly the sources used in this project. Key decisions are made in most hospitals in the country based on data of similar quality. Further limitations of the project relate to the issue of replicability. The disease process we addressed is a major source of frustration to pediatric hospitalists, and our sample likely consisted of the most highly motivated individuals, as they sought out and joined a group with the express purpose of decreasing unnecessary utilization in bronchiolitis. We believe this limitation highlights the likely need for quality measures to emerge organically out of a community of practice when resources are limited, ie, we do not believe we would have had significant success using our methods with an unpopular or externally imposed quality measure.
Although a detailed analysis of costs was beyond the scope of the current project, it is possible that decreased utilization resulted in overall cost savings, despite the fact that our data did not demonstrate a significant change in network‐level average variable direct costs related to bronchiolitis. It has been suggested that such savings may be particularly difficult to demonstrate objectively, especially when the principal costs targeted are labor‐based.35 LOS did not significantly vary during the project, whereas the use of labor‐intensive therapies like nebulized bronchodilators and chest physiotherapy declined. It is, however, quite possible that the decreased utilization we demonstrated was accompanied by a concomitant increase in utilization of other unmeasured therapies.
CONCLUSIONS
A volunteer, peer‐group collaborative focused on benchmarking decreased utilization of bronchodilators and chest physiotherapy in bronchiolitis, though had no impact on overuse of other unnecessary therapies and tests.
Acknowledgements
The following authors have participated in the production of this work by: Conception and design of project: Ralston, Garber, Narang, Shen, Pate; Acquisition of data: Ralston, Garber, Narang, Pope, Lossius, Croland, Bennett, Jewell, Krugman, Robbins, Nazif, Liewehr, Miller, Marks, Pappas, Pardue, Quinonez, Fine, Ryan; Analysis and interpretation of data: Ralston, Garber, Narang, Shen, Pate, Pope, Lossius, Croland, Bennett, Jewell, Krugman, Robbins, Nazif, Liewehr, Miller, Marks, Pappas, Pardue, Quinonez, Fine, Ryan; Drafting the article: Ralston, Garber, Shen; Revising it critically for important intellectual content, and final approval of the version to be published: Ralston, Garber, Narang, Shen, Pate, Pope, Lossius, Croland, Bennett, Jewell, Krugman, Robbins, Nazif, Liewehr, Miller, Marks, Pappas, Pardue, Quinonez, Fine, Ryan.
Disclosures: The VIP network receives financial/administrative support from the American Academy of Pediatrics through the Quality Improvement Innovations Network. Dr Ralston receives financial support from the American Academy of Pediatrics as editor of the AAP publication, Hospital Pediatrics. Drs Garber, Narang, Shen, Pate, Pope, Lossius, Croland, Bennett, Jewell, Krugman, Robbins, Nazif, Liewehr, Miller, Marks, Pappas, Pardue, Quinonez, Fine, and Ryan report no conflicts.
- HCUPnet. Kids Inpatient Database 2006. Available at: http://hcupnet.ahrq.gov/. Accessed February 6, 2011.
- , . Recent trends in severe respiratory syncytial virus (RSV) among US infants, 1997 to 2000. J Pediatr. 2003;143:S127–S132.
- , , , , . Infectious disease hospitalizations among infants in the United States. Pediatrics. 2008;121:244–252.
- , . Bronchiolitis. Lancet. 2006;368:312–322.
- , , , , . Rates of hospitalization for respiratory syncytial virus infection among children in Medicaid. J Pediatr. 2000;137:865–870.
- Subcommittee on the Diagnosis and Management of Bronchiolitis, 2004–2006. Clinical practice guideline: diagnosis and management of bronchiolitis. Pediatrics. 2006;118:1774–1793.
- , , . Bronchiolitis in US emergency departments 1992 to 2000: epidemiology and practice variation. Pediatr Emerg Care. 2005;21:242–247.
- , , , et al. Practice variation among pediatric emergency departments in the treatment of bronchiolitis. Acad Emerg Med. 2004;11:353–360.
- , , , . Bronchiolitis management preferences and the influence of pulse oximetry and respiratory rate on the decision to admit. Pediatrics. 2003;111:e45–e51.
- , , , , , . Variations in management of common inpatient pediatric illnesses: hospitalists and community pediatricians. Pediatrics. 2006;118:441–447.
- , , , , . Variation in pediatric hospitalists' use of proven and unproven therapies: a study from the Pediatric Research in Inpatient Settings (PRIS) network. J Hosp Med. 2008;3:292–298.
- , , , et al. Pediatric Investigators Collaborative Network on Infections in Canada (PICNIC) study of admission and management variation in patients hospitalized with respiratory syncytial viral lower respiratory tract infection. J Pediatr. 1996;129:390–395.
- , , , , . Effect of practice variation on resource utilization in infants hospitalized for viral lower respiratory illness. Pediatrics. 2001;108:851–855.
- , . Bronchodilators for bronchiolitis. Cochrane Database Syst Rev. 2010 Dec 8;(12):CD001266.
- , , . Chest physiotherapy for acute bronchiolitis in pediatric patients between 0 and 24 months old. Cochrane Database Syst Rev. 2007 Jan 24;(1):CD004873.
- , , , et al. Epinephrine for bronchiolitis. Cochrane Database Syst Rev. 2011 Jun 15;(6):CD003123.
- , , , et al. Glucocorticoids for acute bronchiolitis in infants and young children. Cochrane Database Syst Rev. 2010 Oct 6;(10):CD004878.
- , , , . Efficacy of interventions for bronchiolitis in critically ill infants: a systematic review and meta‐analysis. Pediatr Crit Care Med. 2004;5:482–489.
- , , . Direct medical costs of bronchiolitis hospitalizations in the United States. Pediatrics. 2006;118(6):2418–2423.
- , , , et al. Evaluation of an evidence‐based guideline for bronchiolitis. Pediatrics. 1999;104(6):1334–1341.
- , , . Standardizing the care of bronchiolitis. Arch Pediatr Adolesc Med. 1998;152(8):739–744.
- , , , , , . Decreasing overuse of therapies in the treatment of bronchiolitis by incorporating evidence at the point of care. J Pediatr. 2004;144:703–710.
- , , , , , . Effect of point of care information on inpatient management of bronchiolitis. BMC Pediatr. 2007;7:4.
- , , , et al. A clinical pathway for bronchiolitis is effective in reducing readmission rates. J Pediatr. 2005;147:622–626.
- , , , et al. Sustaining the implementation of an evidence‐based guideline for bronchiolitis. Arch Pediatr Adolesc Med. 2000;154:1001–1007.
- , , , , , . Assessment of the French Consensus Conference for Acute Viral Bronchiolitis on outpatient management: progress between 2003 and 2008 [in French]. Arch Pediatr. 2010;17:125–131.
- , , , , , . Impact of a bronchiolitis guideline: a multisite demonstration project. Chest. 2002;121:1789–1797.
- , , , . Management of acute bronchiolitis: can evidence based guidelines alter clinical practice? Thorax. 2008;63:1103–1109.
- , . The “3 T's” roadmap to transform US health care: the “how” of high quality care. JAMA. 2008;299(19):2319–2321.
- The VIP Network. Available at: http://www.vipnetwork.webs.com. Accessed October 5, 2010.
- , . A story of success: continuous quality improvement in cystic fibrosis in the USA. Thorax. 2011;66:1106–1168.
- , , , , , . NICU practices and outcomes associated with 9 years of quality improvement collaboratives. Pediatrics. 2010;125:437–446.
- , , , et al. Quality improvement projects target health care‐associated infections: comparing virtual collaborative and toolkit approaches. J Hosp Med. 2011;6:271–278.
- , , , , . Impact of consensus development conference guidelines on primary care of bronchiolitis: are national guidelines being followed? J Eval Clin Pract. 2007;13:651–656.
- , , , . The savings illusion—why clinical quality improvement fails to deliver bottom‐line results. N Engl J Med. 2011;365:e48.
Currently, 3%5% of infants under a year of age will be admitted to a hospital for acute viral bronchiolitis each year, making it the leading cause of hospitalization in children.15 The American Academy of Pediatrics guideline on the diagnosis and management of bronchiolitis advocates primarily supportive care for this self‐limited disease.6 Specifically, the routine use of therapies such as bronchodilators and corticosteroids are not recommended, nor is routine evaluation with diagnostic testing.6 Numerous studies have established the presence of unwarranted variation in most aspects of bronchiolitis care,713 and the current evidence does not support the routine usage of specific interventions in inpatients.1418
Acute bronchiolitis accounts for direct inpatient medical costs of over $500 million per year.19 Based on estimates from the Healthcare Utilization Project Kids' Inpatient Database, acute bronchiolitis is second only to respiratory distress syndrome as the most expensive disease of hospitalized children.1 Although charges may not correlate directly with costs or even the actual intensity of resource utilization, the national bill, based on charges, is approximately 1.4 billion dollars per year.1 Either way, the leading cause of hospitalization in children is expensive and suffers from dramatic variation in care characterized by overutilization of ineffective interventions.
Evidence‐based guidelines for bronchiolitis are readily available and their successful adoption within larger, academic children's hospitals has been demonstrated.2028 However, upwards of 70% of all children in this country are cared for outside of freestanding children's hospitals,1 and very little has been published about wide dissemination of evidence‐based guidelines in these settings.29 In 2008, the Value in Inpatient Pediatrics (VIP) network was created, as an inclusive pediatric inpatient quality improvement collaborative with a focus on linking academic and community‐based hospitalist groups, to disseminate evidence‐based management strategies for bronchiolitis. We hypothesized that group norming, through benchmarking and public goal setting at the level of the hospitalist group, would decrease overall utilization of nonevidence‐based therapies. Specifically, we were trying to decrease the utilization of bronchodilators, steroids, chest physiotherapy, chest radiography, and viral testing in hospitalized children diagnosed with uncomplicated bronchiolitis.
METHODS
Beginning in early 2008, we recruited pediatric hospitalists into a voluntary bronchiolitis quality improvement collaborative from within the community of hospitalists created by the American Academy of Pediatrics Section on Hospital Medicine. Participants were recruited through open calls at national conferences and mass e‐mails to the section membership through the listserve. The guiding principle for the collaborative was the idea that institutional adoption of evidence‐based disease‐management strategies would result in higher value of care, and that this process could be facilitated by benchmarking local performance against norms created within the larger community. We used group consensus to identify the therapies and tests to benchmark, although the chosen measures meshed with those addressed in the American Academy of Pediatrics (AAP) clinical practice guideline. Use of bronchodilators, corticosteroids, chest physiotherapy, chest radiography, and viral testing were all felt to be significantly overutilized in participating clinical sites. We were unaware of any published national targets for utilization of these therapies or tests, and none of the participating hospitalist groups was actively benchmarking their utilization against any peer group at the start of the project. Length of stay, rates of readmission within 72 hours of discharge, and variable direct costs were chosen as balancing measures for the project.
We collected data on hospitalizations for bronchiolitis for 4 calendar years, from 2007 through 2010, based on the following inclusion criteria: children under 24 months of age, hospitalized for the primary diagnosis of acute viral bronchiolitis as defined by International Classification of Diseases, Ninth Revision (ICD‐9) codes 466.11 and 466.19. We specifically included patients who were in observation status as well as those in inpatient status, and excluded all intensive care unit admissions. Other exclusions were specific ICD‐9 codes for: chronic lung diseases, asthma, chromosomal abnormalities, heart disease, and neurological diseases. We then tracked overall utilization of any bronchodilator (albuterol, levalbuterol, epinephrine, or ipratropium) during the hospitalization, including the emergency department; total number of bronchodilator doses per patient; utilization of any corticosteroids (inhaled or systemic); chest radiography; respiratory syncytial virus (RSV) testing; and chest physiotherapy; as well as variable direct costs per hospitalization for each center. A standardized toolkit was provided to participating centers to facilitate data collection. Data was sought from administrative sources, collected in aggregate form and not at the patient level, and no protected health information was collected as part of the project. The project was categorized as exempt by the University of Texas Health Science Center San Antonio Institutional Review Board, the location of the data repository.
The project began in 2008, though we requested that centers provide 2007 data to supplement our baseline. We held the first group meeting in July 2009 and began the facilitated sharing of resources to promote evidence‐based care, such as guidelines, protocols, respiratory scores, and patient handouts, across sites using data from 2007 and 2008 as our baseline for benchmarking and later assessing any improvement. Centers adopted guidelines at their own pace and we did not require guideline adoption for continued participation. We provided summaries of the available literature by topic, in the event that site leaders wished to give institutional grand rounds or other presentations. All dissemination of guidelines or protocols was done based on the request of the center, and no specific resource was created or sanctioned by the group, though the AAP Guideline for the Diagnosis and Management of Bronchiolitis6 remained a guiding document. Some of our centers participated in more extensive collaborative projects which involved small‐group goal setting, adoption of similar protocols, and conference calls, though this never encompassed more than 25% of the network.
The main product of the project was a yearly report benchmarking each hospital against the network average on each of our chosen utilization measures. The first report was disseminated in July 2009 and included data on calendar year 2007 and 2008, which we considered our group baseline. Most institutions began local Plan‐Do‐Study‐Act (PDSA) cycles by mid‐2009 using the data we provided as they benchmarked their performance against other members of the collaborative, and these continued through 2010. Hospitals were coded and remained anonymous. However, we publicly honored the high performers within the network at a yearly meeting, and urged these centers to share their tools and strategies, which was facilitated through a project Web site.30 All participation was voluntary, and all costs were borne by individuals or their respective centers.
In order to assess data quality, we undertook a validation project for calendar year 2009. We requested local direct chart review of a 10% sample, or a minimum of 10 charts, to confirm reported utilization rates for the therapies and tests we tracked. Any center with less than 80% accuracy was then asked to review data collection methods and make adjustments accordingly. One center identified and resolved a significant data discrepancy and 2 centers refused to participate in the validation project, citing their participation in a large national database for which there was already a very rigorous data validation process (Child Health Corporation of America's Pediatric Health Information System database). Given that we did not uncover major discrepancies in data quality within our network, we did not request further data validation but rather promoted year‐to‐year consistency of collection methods, seeking to collect the same type/quality of data that hospitals use in their own internal performance assessments.
Statistical analyses were performed using GraphPad InStat, version 3.0 (GraphPad Software, San Diego, CA). Descriptive statistics (including interquartile range ([IQR], the range from 25th to 75th percentile of the data) are provided. Analysis of process measures over the series of years was performed using repeated measures analysis of variance (ANOVA), as were intra‐hospital comparisons for all measures. Hospitals were not weighted by volume of admissions, ie, the unit of analysis was the hospital and not individual hospitalizations. Data were analyzed for normality using the method of Kolmogorov and Smirnoff, and in cases where normality was not satisfied (steroids and chest physiotherapy), the data were transformed and nonparametric methods were used. Post‐test adjustment for multiple comparisons was done using the TukeyKramer test in cases where ANOVA P values were <0.05. Fisher's exact test was used to analyze contingency tables for categorical variables such as presence or absence of a protocol.
RESULTS
Data encompassing 11,568 bronchiolitis hospitalizations in 17 centers, for calendar years 2007 to 2010, were analyzed for this report. A total of 31 centers ever participated in the project; however, this report is restricted to centers who participated for the entirety of the project from 2008 through 2010, and who consented to have their data reported. Specifically, 18 centers met inclusion criteria and 1 center opted out of the project, leaving the 17 centers described in Table 1. The overall network makeup shifted each year, but was always more than 80% non‐freestanding children's hospitals and approximately 30% urban, as defined as located in a population center of more than 1 million. A large majority of the participants did not have a local bronchiolitis protocol or guideline at the start of the project, although 88% of participants adopted some form of protocolized care by 2010. Calendar years 2007 and 2008 served as our network baseline, with most interventions (in institutions where they occurred) begun by calendar year 2009. The level of intervention varied greatly among institutions, with a few institutions doing nothing more than benchmarking their performance.
| Participating Centers (Alphabetically by State) | Type of Facility | Average Yearly Bronchiolitis Admissions | Approximate Medicaid (%) | Guideline Prior to Joining Project? | Location |
|---|---|---|---|---|---|
| |||||
| Scottsdale Healthcare Scottsdale, AZ | PEDS | 133 | 26 | No | Suburban |
| Shands Hospital for Children at the University of Florida Gainesville, FL | CHWH | 107 | 59 | No | Suburban |
| Children's Hospital of Illinois Peoria, IL | CHWH | 97 | 15 | No | Suburban |
| Kentucky Children's Hospital Lexington, KY | CHWH | 135 | 60 | Yes | Suburban |
| Our Lady of the Lake Baton Rouge, LA | CHWH | 138 | 70 | No | Suburban |
| The Barbara Bush Children's Hospital Portland, ME | CHWH | 31 | 41 | Yes | Suburban |
| Franklin Square Hospital Center Baltimore, MD | PEDS | 66 | 40 | No | Suburban |
| Anne Arundel Medical Center Annapolis, MD | CHWH | 56 | 36 | No | Suburban |
| Children's Hospital at Montefiore Bronx, NY | CHWH | 220 | 65 | No | Urban |
| Mission Children's Hospital Asheville, NC | CHWH | 112 | 21 | Yes | Suburban |
| Cleveland Clinic Children's Hospital Cleveland, OH | CHWH | 58 | 24 | Yes | Urban |
| Palmetto Health Children's Hospital Columbia, SC | CHWH | 181 | 60 | No | Suburban |
| East Tennessee Children's Hospital Knoxville, TN | FSCH | 373 | 60 | No | Suburban |
| Texas Children's Hospital Houston, TX | FSCH | 619 | 60 | Yes | Urban |
| Christus Santa Rosa Children's Hospital San Antonio, TX | CHWH | 390 | 71 | No | Urban |
| Children's Hospital of The Kings' Daughters Norfolk, VA | FSCH | 303 | 60 | No | Suburban |
| Children's Hospital of Richmond Richmond, VA | CHWH | 40 | 60 | No | Urban |
Mean length of stay (LOS), readmission rates, and variable direct costs did not differ significantly during the project time period. Mean LOS for the network ranged from a low of 2.4 days (IQR, 2.22.8 days) to a high of 2.7 days (IQR, 2.43.1 days), and mean readmission rates ranged from 1.2% (IQR, 0.7%1.8%) to 1.7% (IQR, 0.7%2.5%) during the project. Mean variable direct costs ranged from $1639 (IQR, $1383$1864) to $1767 (IQR, $1365$2320).
Table 2 describes the mean overall utilization of bronchodilators, chest radiography, RSV testing, steroids, and chest physiotherapy among the group from 2007 to 2010. By 2010, we saw a 46% decline in the volume of bronchodilator used within the network, a 3.6 (95% confidence interval [CI] 1.45.8) dose per patient absolute decrease (P < 0.01). We also saw a 12% (95% CI 5%25%) absolute decline in the overall percentage of patients exposed to any bronchodilator (P < 0.01). Finally, there was a 10% (95% CI 3%18%) absolute decline in the overall utilization of any chest physiotherapy (P < 0.01). The project did not demonstrate a significant impact on utilization of corticosteroids, chest radiography, or viral testing, although several centers achieved significant decreases on a local level (data not shown).
| Utilization Measure | 2007 | 2008 | 2009 | 2010 |
|---|---|---|---|---|
| No. (IQR) | No. (IQR) | No. (IQR) | No. (IQR) | |
| ||||
| Bronchodilator doses per patient (P < 0.01) | 7.9 (4.69.8) | 6.4 (4.08.4) | 5.7 (3.67.6) | 4.3 (3.05.9) |
| Any bronchodilators (P < 0.01) | 70% (59%83%) | 67% (56%77%) | 68% (61%76%) | 58% (46%69%) |
| Chest physiotherapy (P < 0.01) | 14% (5%19%) | 10% (1%8%) | 7% (2%6%) | 4% (1%7%) |
| Chest radiography (P = NS) | 64% (54%81%) | 66% (55%79%) | 64% (60%73%) | 59% (50%73%) |
| Any steroids (P = NS) | 21% (14%26%) | 20% (15%28%) | 21% (14%22%) | 16% (13%25%) |
| RSV testing (P = NS) | 64% (52%84%) | 61% (49%78%) | 62% (50%78%) | 57% (44%75%) |
We analyzed within‐hospital trends as well. Figure 1 describes intra‐hospital change over the course of the project for overall bronchodilator usage. In this analysis, 15 of 17 hospitals (88%) achieved a significant decrease in overall bronchodilator utilization by 2010. (Hospitals 27 and 29 were unable to provide 2007 baseline data.) For doses per patient, 15 of 17 institutions provided data on this measure, and 12 of 15 (80%) achieved significant decreases (Figure 2). Of note, the institutions failing to achieve significant decreases in bronchodilator utilization entered the project with utilization rates that were already significantly below network mean at the start of the project. (Institutions failing to improve are denoted with an asterisk in Figures 1 and 2.) Since most institutions made significant improvements in bronchodilator utilization over time, we looked for correlates of failure to decrease utilization. The strongest association for failure to improve during the project period was use of a protocol prior to joining the network (odds ratio [OR] = 11, 95% CI 261).
DISCUSSION
We demonstrated a significant decline in utilization of bronchodilators and chest physiotherapy in inpatient bronchiolitis within a voluntary quality collaborative focused on benchmarking without employing intensive interventions. This observation is important in that it demonstrates real‐world efficacy for our methods. Prior literature has clearly demonstrated that local bronchiolitis guidelines are effective; however, our data on over 11,000 hospitalizations from a broad array of inpatient settings continue to show a high rate of overutilization. We facilitated dissemination and sharing of guideline‐related tools primarily electronically, and capitalized on perceived peer‐group frustration with inefficient management of a high‐volume, high‐utilization disease. While the project leadership had varying degrees of advanced training in quality improvement methodology, the majority of the site leaders were self‐taught and trained while on the job. Our inclusive collaborative had some success using pragmatic and low‐resource methods which we believe is a novel approach to the issue of overutilization.
These considerations are highlighted given the pressing need to find more efficient and scalable means of bending the cost curve of healthcare in the United States. Learning collaboratives are a relatively new model for improvement, with some history in pediatrics,31, 32 and are attractive because of their potential to generate both widespread capacity for change as well as direct improvement. Both cystic fibrosis31 and neonatology collaboratives32 have been celebrated for their positive impacts on children's healthcare, and both are testaments to the power inherent in creating a community of like‐minded individuals. One of the most popular models for learning collaboratives remains the Institute for Healthcare Improvement's Breakthrough Series; however, this model is resource intensive in that it typically involves large teams and several yearly face‐to‐face meetings, with significant monetary investment on the part of hospitals. On the other hand, virtual collaboratives have produced mixed results with respect to quality improvement,33 so there is a continued need to maximize our learning about what works efficiently. Our collaborative was able to successfully disseminate tools developed in large academic institutions to be applied in smaller and more varied settings, where resources for quality improvement activities were limited.
One possible reason for any successes in this project was the existence of a well‐known guideline for the management of bronchiolitis published by the American Academy of Pediatrics in 2006. This guideline recommends primarily symptomatic care, and has a statement supporting the contention that routine use of our targeted therapies is unnecessary. It allows for a trial of bronchodilator, but specifically states that all trials should be accompanied by the use of an objective measure of improvement (typically interpreted to mean a respiratory distress score). A guideline sanctioned by an important national organization of pediatricians was invaluable, and we believe that it should serve as a basis for any nationally promoted inpatient quality measure for this very common pediatric illness. The existence of the AAP guideline also highlights the possibility that our results are merely representative of secular trends in utilization in bronchiolitis care, since we had no control group. The available literature on national guidelines has shown mixed and quite modest impacts in other countries.28, 34 Most of our group took active steps to operationalize the guidelines as part of their participation in this collaborative, though they might have done similar work anyway due to the increasing importance of quality improvement in hospitalist culture over the years of the project.
The project did not demonstrate any impact on steroid utilization, or on rates of obtaining chest radiography or viral testing, despite expressly targeting these widely overused interventions. These modalities are often employed in the emergency department and, as a collaborative of pediatric hospitalists, we did not have specific emergency department participation which we recognize as a major weakness and potential impediment to further progress. We hope to collaborate with our respective emergency departments in the future on these particular measures. We also noted that many institutions were inflexible about foregoing viral testing, due to infection control issues arising from the need to cohort patients in shared rooms based on RSV positivity during the busy winter months. A few institutions were able to alter their infection control policies using the strategy of assuming all children with bronchiolitis had RSV (ie, choosing to use both contact precautions and to wear a mask when entering rooms), though this was not universally popular. Finally, we recognize a missed opportunity in not collecting dose per patient level data for steroids, which might have allowed us to distinguish hospitals with ongoing inpatient utilization of steroids from those with only emergency department usage.
Another significant limitation of this project was the lack of annual assessments of data quality. However, we believe our findings are still useful and important, even with this obvious limitation. Most quality improvement work is done using hospital‐supplied data gleaned from administrative databases, exactly the sources used in this project. Key decisions are made in most hospitals in the country based on data of similar quality. Further limitations of the project relate to the issue of replicability. The disease process we addressed is a major source of frustration to pediatric hospitalists, and our sample likely consisted of the most highly motivated individuals, as they sought out and joined a group with the express purpose of decreasing unnecessary utilization in bronchiolitis. We believe this limitation highlights the likely need for quality measures to emerge organically out of a community of practice when resources are limited, ie, we do not believe we would have had significant success using our methods with an unpopular or externally imposed quality measure.
Although a detailed analysis of costs was beyond the scope of the current project, it is possible that decreased utilization resulted in overall cost savings, despite the fact that our data did not demonstrate a significant change in network‐level average variable direct costs related to bronchiolitis. It has been suggested that such savings may be particularly difficult to demonstrate objectively, especially when the principal costs targeted are labor‐based.35 LOS did not significantly vary during the project, whereas the use of labor‐intensive therapies like nebulized bronchodilators and chest physiotherapy declined. It is, however, quite possible that the decreased utilization we demonstrated was accompanied by a concomitant increase in utilization of other unmeasured therapies.
CONCLUSIONS
A volunteer, peer‐group collaborative focused on benchmarking decreased utilization of bronchodilators and chest physiotherapy in bronchiolitis, though had no impact on overuse of other unnecessary therapies and tests.
Acknowledgements
The following authors have participated in the production of this work by: Conception and design of project: Ralston, Garber, Narang, Shen, Pate; Acquisition of data: Ralston, Garber, Narang, Pope, Lossius, Croland, Bennett, Jewell, Krugman, Robbins, Nazif, Liewehr, Miller, Marks, Pappas, Pardue, Quinonez, Fine, Ryan; Analysis and interpretation of data: Ralston, Garber, Narang, Shen, Pate, Pope, Lossius, Croland, Bennett, Jewell, Krugman, Robbins, Nazif, Liewehr, Miller, Marks, Pappas, Pardue, Quinonez, Fine, Ryan; Drafting the article: Ralston, Garber, Shen; Revising it critically for important intellectual content, and final approval of the version to be published: Ralston, Garber, Narang, Shen, Pate, Pope, Lossius, Croland, Bennett, Jewell, Krugman, Robbins, Nazif, Liewehr, Miller, Marks, Pappas, Pardue, Quinonez, Fine, Ryan.
Disclosures: The VIP network receives financial/administrative support from the American Academy of Pediatrics through the Quality Improvement Innovations Network. Dr Ralston receives financial support from the American Academy of Pediatrics as editor of the AAP publication, Hospital Pediatrics. Drs Garber, Narang, Shen, Pate, Pope, Lossius, Croland, Bennett, Jewell, Krugman, Robbins, Nazif, Liewehr, Miller, Marks, Pappas, Pardue, Quinonez, Fine, and Ryan report no conflicts.
- HCUPnet. Kids Inpatient Database 2006. Available at: http://hcupnet.ahrq.gov/. Accessed February 6, 2011.
- , . Recent trends in severe respiratory syncytial virus (RSV) among US infants, 1997 to 2000. J Pediatr. 2003;143:S127–S132.
- , , , , . Infectious disease hospitalizations among infants in the United States. Pediatrics. 2008;121:244–252.
- , . Bronchiolitis. Lancet. 2006;368:312–322.
- , , , , . Rates of hospitalization for respiratory syncytial virus infection among children in Medicaid. J Pediatr. 2000;137:865–870.
- Subcommittee on the Diagnosis and Management of Bronchiolitis, 2004–2006. Clinical practice guideline: diagnosis and management of bronchiolitis. Pediatrics. 2006;118:1774–1793.
- , , . Bronchiolitis in US emergency departments 1992 to 2000: epidemiology and practice variation. Pediatr Emerg Care. 2005;21:242–247.
- , , , et al. Practice variation among pediatric emergency departments in the treatment of bronchiolitis. Acad Emerg Med. 2004;11:353–360.
- , , , . Bronchiolitis management preferences and the influence of pulse oximetry and respiratory rate on the decision to admit. Pediatrics. 2003;111:e45–e51.
- , , , , , . Variations in management of common inpatient pediatric illnesses: hospitalists and community pediatricians. Pediatrics. 2006;118:441–447.
- , , , , . Variation in pediatric hospitalists' use of proven and unproven therapies: a study from the Pediatric Research in Inpatient Settings (PRIS) network. J Hosp Med. 2008;3:292–298.
- , , , et al. Pediatric Investigators Collaborative Network on Infections in Canada (PICNIC) study of admission and management variation in patients hospitalized with respiratory syncytial viral lower respiratory tract infection. J Pediatr. 1996;129:390–395.
- , , , , . Effect of practice variation on resource utilization in infants hospitalized for viral lower respiratory illness. Pediatrics. 2001;108:851–855.
- , . Bronchodilators for bronchiolitis. Cochrane Database Syst Rev. 2010 Dec 8;(12):CD001266.
- , , . Chest physiotherapy for acute bronchiolitis in pediatric patients between 0 and 24 months old. Cochrane Database Syst Rev. 2007 Jan 24;(1):CD004873.
- , , , et al. Epinephrine for bronchiolitis. Cochrane Database Syst Rev. 2011 Jun 15;(6):CD003123.
- , , , et al. Glucocorticoids for acute bronchiolitis in infants and young children. Cochrane Database Syst Rev. 2010 Oct 6;(10):CD004878.
- , , , . Efficacy of interventions for bronchiolitis in critically ill infants: a systematic review and meta‐analysis. Pediatr Crit Care Med. 2004;5:482–489.
- , , . Direct medical costs of bronchiolitis hospitalizations in the United States. Pediatrics. 2006;118(6):2418–2423.
- , , , et al. Evaluation of an evidence‐based guideline for bronchiolitis. Pediatrics. 1999;104(6):1334–1341.
- , , . Standardizing the care of bronchiolitis. Arch Pediatr Adolesc Med. 1998;152(8):739–744.
- , , , , , . Decreasing overuse of therapies in the treatment of bronchiolitis by incorporating evidence at the point of care. J Pediatr. 2004;144:703–710.
- , , , , , . Effect of point of care information on inpatient management of bronchiolitis. BMC Pediatr. 2007;7:4.
- , , , et al. A clinical pathway for bronchiolitis is effective in reducing readmission rates. J Pediatr. 2005;147:622–626.
- , , , et al. Sustaining the implementation of an evidence‐based guideline for bronchiolitis. Arch Pediatr Adolesc Med. 2000;154:1001–1007.
- , , , , , . Assessment of the French Consensus Conference for Acute Viral Bronchiolitis on outpatient management: progress between 2003 and 2008 [in French]. Arch Pediatr. 2010;17:125–131.
- , , , , , . Impact of a bronchiolitis guideline: a multisite demonstration project. Chest. 2002;121:1789–1797.
- , , , . Management of acute bronchiolitis: can evidence based guidelines alter clinical practice? Thorax. 2008;63:1103–1109.
- , . The “3 T's” roadmap to transform US health care: the “how” of high quality care. JAMA. 2008;299(19):2319–2321.
- The VIP Network. Available at: http://www.vipnetwork.webs.com. Accessed October 5, 2010.
- , . A story of success: continuous quality improvement in cystic fibrosis in the USA. Thorax. 2011;66:1106–1168.
- , , , , , . NICU practices and outcomes associated with 9 years of quality improvement collaboratives. Pediatrics. 2010;125:437–446.
- , , , et al. Quality improvement projects target health care‐associated infections: comparing virtual collaborative and toolkit approaches. J Hosp Med. 2011;6:271–278.
- , , , , . Impact of consensus development conference guidelines on primary care of bronchiolitis: are national guidelines being followed? J Eval Clin Pract. 2007;13:651–656.
- , , , . The savings illusion—why clinical quality improvement fails to deliver bottom‐line results. N Engl J Med. 2011;365:e48.
Copyright © 2012 Society of Hospital Medicine

Treatment of Complicated Pneumonia
Community‐acquired pneumonia, the most common serious bacterial infection in childhood, may be complicated by parapneumonic effusion (ie, complicated pneumonia).1 Children with complicated pneumonia require prolonged hospitalization and frequently undergo multiple pleural fluid drainage procedures.2 Additionally, the incidence of complicated pneumonia has increased,37 making the need to define appropriate therapy even more pressing. Defining appropriate therapy is challenging for the individual physician as a result of inconsistent and insufficient evidence, and wide variation in treatment practices.2, 8
Historically, thoracotomy was performed only if initial chest tube placement did not lead to clinical improvement.9, 10 Several authors, noting the rapid resolution of symptoms in children undergoing earlier thoracotomy, advocated for the use of thoracotomy as initial therapy rather than as a procedure of last resort.114 The advent of less invasive techniques such as video‐assisted thoracoscopic surgery (VATS) has served as an additional impetus to consider surgical drainage as the initial treatment strategy.1518 Few well‐designed studies have examined the relative efficacy of these interventions.2, 1922 Published randomized trials were single center, enrolled few patients, and arrived at different conclusions.19, 21, 22 In addition, these trials did not examine other important outcomes such as requirement for additional pleural fluid drainage procedures and hospital readmission. Two large retrospective multicenter studies found modest reductions in length of stay (LOS) and substantial decreases in the requirement for additional pleural fluid drainage procedures in children undergoing initial VATS compared with initial chest tube placement.2, 20 However, Shah et al2 included relatively few patients undergoing VATS. Li et al20 combined patients undergoing initial thoracentesis, initial chest tube placement, late pleural fluid drainage (by any method), and no pleural fluid drainage into a single non‐operative management category, precluding conclusions about the relative benefits of chest tube placement compared with VATS. Neither study2, 20 examined the role of chemical fibrinolysis, a therapy which has been associated with outcomes comparable to VATS in two small randomized trials.21, 22
The objectives of this multicenter study were to describe the variation in the initial management strategy along with associated outcomes of complicated pneumonia in childhood and to determine the comparative effectiveness of different pleural fluid drainage procedures.
Methods
Data Source
The Pediatric Health Information System (PHIS), which contains resource utilization data from 40 freestanding children's hospitals, provided data for this multicenter retrospective cohort study. Participating hospitals are located in noncompeting markets of 27 states plus the District of Columbia. The PHIS database includes patient demographics, diagnoses, and procedures as well as data for all drugs, radiologic studies, laboratory tests, and supplies charged to each patient. Data are de‐identified, however encrypted medical record numbers allow for tracking individual patients across admissions. The Child Health Corporation of America (Shawnee Mission, KS) and participating hospitals jointly assure data quality and reliability as described previously.23, 24 The Children's Hospital of Philadelphia Institutional Review Board reviewed and approved this study.
Patients
Children 18 years of age receiving a pleural drainage procedure for complicated pneumonia were eligible if they were discharged from participating hospitals between January 1, 2004 and June 30, 2009. Study participants met the following criteria: 1) discharge diagnosis of pneumonia (International Classification of Diseases, 9th revision [ICD‐9] discharge diagnosis codes 480.x‐483.x, 485.x‐487.x), 2) discharge diagnosis of pleural effusion (ICD‐9 codes 510.0, 510.9, 511.0, 511.1, or 511.9), and 3) billing charge for antibiotics on the first day of hospitalization. Additionally, the primary discharge diagnosis had to be either pneumonia or pleural effusion. Patients were excluded if they did not undergo pleural fluid drainage or if their initial pleural fluid drainage procedure was thoracentesis.
Study Definitions
Pleural drainage procedures were identified using ICD‐9 procedure codes for thoracentesis (34.91), chest tube placement (34.04), VATS (34.21), and thoracotomy (34.02 or 34.09). Fibrinolysis was defined as receipt of urokinase, streptokinase, or alteplase within two days of initial chest tube placement.
Acute conditions or complications included influenza (487, 487.0, 487.1, 487.8, 488, or V04.81) and hemolytic‐uremic syndrome (283.11). Chronic comorbid conditions (CCCs) (eg, malignancy) were identified using a previously reported classification scheme.25 Billing data were used to classify receipt of mechanical ventilation and medications on the first day of hospitalization.
Measured Outcomes
The primary outcomes were hospital LOS (both overall and post‐initial procedure), requirement for additional pleural drainage procedures, total cost for index hospitalization, all‐cause readmission within 14 days after index hospital discharge, and total cost of the episode (accounting for the cost of readmissions).
Measured Exposures
The primary exposure of interest was the initial pleural fluid drainage procedure, classified as chest tube placement without fibrinolysis, chest tube placement with fibrinolysis, VATS, or thoracotomy.
Statistical Analysis
Variables were summarized using frequencies and percentages for categorical variables, and median, interquartile range (IQR), and range for continuous variables. Outcomes by initial pleural drainage procedure were compared using chi‐squared tests for categorical variables and Kruskal‐Wallis tests for continuous variables.
Multivariable analysis was performed to account for potential confounding by observed baseline variables. For dichotomous outcome variables, modeling consisted of logistic regression using generalized estimating equations to account for hospital clustering. For continuous variables, a mixed model approach was used, treating hospital as a random effect. Log transformation was applied to the right‐skewed outcome variables (LOS and cost). Cost outcomes remained skewed following log transformation, thus gamma mixed models were applied.2629 Odds ratios and 95% confidence intervals (CIs) were reported for comparison of dichotomous outcomes and the adjusted means and 95% CIs were reported for continuous outcomes after appropriate back transformation.
Additional analyses addressed the potential impact of confounding by indication inherent in any observational study. First, patients with an underlying CCC were excluded to ensure that our results would be generalizable to otherwise healthy children with community‐acquired pneumonia. Second, patients undergoing pleural drainage >2 days after hospitalization were excluded to minimize the effect of residual confounding related to differences in timing of the initial drainage procedure. Third, the analysis was repeated using a generalized propensity score as an additional method to account for confounding by indication for the initial drainage procedure.30 Propensity scores, constructed using a multivariable generalized logit model, included all variables listed in Table 1. The inverse of the propensity score was included as a weight in each multivariable model described previously. Only the primary multivariable analyses are presented as the results of the propensity score analysis were nearly identical to the primary analyses.
| Overall | Chest Tube Without Fibrinolysis | Chest Tube With Fibrinolysis | Thoracotomy | VATS | P Value | |
|---|---|---|---|---|---|---|
| ||||||
| N | 3500 | 1672 (47.8) | 623 (17.8) | 797 (22.8) | 408 (11.7) | |
| Age | ||||||
| <1 year | 335 (9.6) | 176 (10.5) | 56 (9.0) | 78 (9.8) | 25 (6.1) | |
| 1 year | 475 (13.6) | 238 (14.2) | 98 (15.7) | 92 (11.5) | 47 (11.5) | 0.003 |
| 24 years | 1230 (35.1) | 548 (32.8) | 203 (32.6) | 310 (38.9) | 169 (41.4) | |
| 59 years | 897 (25.6) | 412 (24.6) | 170 (27.3) | 199 (25.0) | 116 (28.4) | |
| 1014 years | 324 (9.3) | 167 (10.0) | 61 (9.8) | 65 (8.2) | 31 (7.6) | |
| 1518 years | 193 (5.5) | 106 (6.3) | 29 (4.6) | 40 (5.0) | 18 (4.4) | |
| >18 years | 46 (1.3) | 25 (1.5) | 6 (0.96) | 13 (1.6) | 2 (0.5) | |
| Comorbid Conditions | ||||||
| Cardiac | 69 (2.0) | 43 (2.6) | 14 (2.3) | 12 (1.5) | 0 (0.0) | 0.006 |
| Malignancy | 81 (2.3) | 31 (1.9) | 18 (2.9) | 21 (2.6) | 11 (2.7) | 0.375 |
| Neurological | 138 (3.9) | 73 (4.4) | 20 (3.2) | 34 (4.3) | 11 (2.7) | 0.313 |
| Any Other Condition | 202 (5.8) | 96 (5.7) | 40 (6.4) | 47 (5.9) | 19 (4.7) | 0.696 |
| Payer | ||||||
| Government | 1240 (35.6) | 630 (37.8) | 224 (36.0) | 259 (32.7) | 127 (31.3) | <0.001 |
| Private | 1383 (39.7) | 607 (36.4) | 283 (45.4) | 310 (39.2) | 183 (45.07) | |
| Other | 864 (24.8) | 430 (25.8) | 116 (18.6) | 222 (28.1) | 96 (23.65) | |
| Race | ||||||
| Non‐Hispanic White | 1746 (51.9) | 838 (51.6) | 358 (59.7) | 361 (47.8) | 189 (48.7) | <0.001 |
| Non‐Hispanic Black | 601 (17.9) | 318 (19.6) | 90 (15.0) | 128 (17.0) | 65 (16.8) | |
| Hispanic | 588 (17.5) | 280 (17.3) | 73 (12.2) | 155 (20.5) | 80 (20.6) | |
| Asian | 117 (3.5) | 47 (2.9) | 20 (3.3) | 37 (4.9) | 13 (3.4) | |
| Other | 314 (9.3) | 140 (8.6) | 59 (9.8) | 74 (9.8) | 41 (10.6) | |
| Male Sex | 1912 (54.6) | 923 (55.2) | 336 (53.9) | 439 (55.1) | 214 (52.5) | 0.755 |
| Radiology | ||||||
| CT, no US | 1200 (34.3) | 600 (35.9) | 184 (29.5) | 280 (35.1) | 136 (33.3) | <0.001 |
| CT and US | 221 (6.3) | 84 (5.0) | 53 (8.5) | 61 (7.7) | 23 (5.6) | |
| US, no CT | 799 (22.8) | 324 (19.4) | 178 (28.6) | 200 (25.1) | 97 (23.8) | |
| No US, no CT | 1280 (36.6) | 664 (39.7) | 208 (33.4) | 256 (32.1) | 152 (37.3) | |
| Empiric Antibiotic Regimen | ||||||
| Cephalosporins alone | 448 (12.8) | 181 (10.83) | 126 (20.2) | 73 (9.2) | 68 (16.7) | <0.001 |
| Cephalosporin and clindamycin | 797 (22.8) | 359 (21.5) | 145 (23.3) | 184 (23.1) | 109 (26.7) | |
| Other antibiotic combination | 167 (4.8) | 82 (4.9) | 30 (4.8) | 38 (4.8) | 17 (4.2) | |
| Cephalosporin and vancomycin | 2088 (59.7) | 1050 (62.8) | 322 (51.7) | 502 (63.0) | 214 (52.5) | |
| Mechanical ventilation | 494 (14.1) | 251 (15.0) | 75 (12.0) | 114 (14.3) | 54 (13.2) | 0.307 |
| Corticosteroids | 520 (14.9) | 291 (17.4) | 72 (11.6) | 114 (14.3) | 43 (10.5) | <0.001 |
| Blood product transfusionsb | 761 (21.7) | 387 (23.2) | 145 (23.3) | 161 (20.2) | 68 (16.7) | 0.018 |
| Vasoactive infusionsc | 381 (10.9) | 223 (13.3) | 63 (10.1) | 72 (9.0) | 23 (5.6) | <0.001 |
| Admission to intensive care | 1397 (39.9) | 731 (43.7) | 234 (37.6) | 296 (37.1) | 136 (33.3) | <0.001 |
| Extracorporeal membranous oxygenation | 18 (0.5) | 13 (0.8) | 2 (0.3) | 3 (0.4) | 0 (0.0) | 0.163 |
| Hemolytic‐uremic syndrome | 31 (0.9) | 15 (0.9) | 6 (1.0) | 7 (0.9) | 3 (0.7) | 0.985 |
| Influenza | 108 (3.1) | 53 (3.2) | 27 (4.3) | 23 (2.9) | 5 (1.2) | 0.044 |
| Arterial blood gas measurements | 0 (0,1) | 0 (0, 2) | 0 (0,1) | 0 (0, 1) | 0 (0, 1) | <0.001 |
| Days to first procedure | 1 (0, 3) | 1 (0, 2) | 1 (1, 3) | 1 (1, 3) | 1 (1, 3) | <0.001 |
Medical records of a randomly selected subset of subjects from 6 hospitals were reviewed to determine the accuracy of our algorithm in identifying patients with complicated pneumonia; these subjects represented 1% of the study population. For the purposes of medical record review, complicated pneumonia was defined by the following: 1) radiologically‐confirmed lung infiltrate; 2) moderate or large pleural effusion; and 3) signs and symptoms of lower respiratory tract infection. Complicated pneumonia was identified in 118 of 120 reviewed subjects for a positive predictive value of 98.3%.
All analyses were clustered by hospital. Analyses were performed using SAS version 9.2 (SAS Institute, Cary, NC). A two‐tailed P < 0.05 was considered statistically significant.
Results
Patient Characteristics
During the study period, 9,680 subjects had complicated pneumonia. Subjects were excluded if they did not have a pleural drainage procedure (n = 5798), or if thoracentesis was the first pleural fluid drainage procedure performed (n = 382). The remaining 3500 patients were included. Demographic characteristics are summarized in Table 1. The median patient age was 4.1 years (IQR: 2.17.2 years). An underlying CCC was present in 424 (12.1%) patients. There was no association between type of drainage procedure and mechanical ventilation. However, factors associated with more severe systemic illness, such as blood product transfusion, were more common among those undergoing initial chest tube placement with or without fibrinolysis (Table 1).
Initial Pleural Fluid Drainage Procedures
The primary procedures included chest tube without fibrinolysis (47.8%); chest tube with fibrinolysis (17.8%); thoracotomy (22.8%); and VATS (11.7%) (Table 1). The proportion of patients undergoing primary chest tube placement with fibrinolysis increased over time from 14.2% in 2004 to 30.0% in 2009 (P < 0.001; chi‐squared test for trend). The initial procedure varied by hospital with the greatest proportion of patients undergoing primary chest tube placement without fibrinolysis at 28 (70.0%) hospitals, chest tube placement with fibrinolysis at 5 (12.5%) hospitals, thoracotomy at 5 (12.5%) hospitals, and VATS at 2 (5.0%) hospitals (Figure 1). The median proportion of patients undergoing primary VATS across all hospitals was 11.5% (IQR: 3.9%‐26.5%) (Figure 1). The median time to first procedure was 1 day (IQR: 03 days).
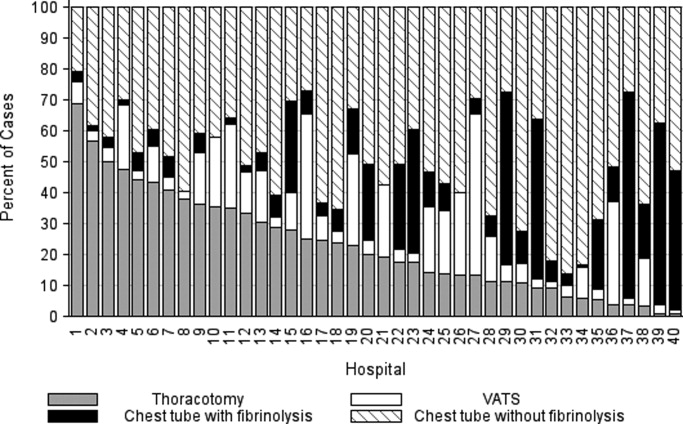
Outcome Measures
Variation in outcomes occurred across hospitals. Additional pleural drainage procedures were performed in a median of 20.9% of patients with a range of 6.8% to 44.8% (IQR: 14.5%‐25.3%) of patients across all hospitals. Median LOS was 10 days with a range of 714 days (IQR: 8.511 days) and the median LOS following the initial pleural fluid drainage procedure was 8 days with a range of 6 to 13 days (IQR: 78 days). Variation in timing of the initial pleural fluid drainage procedure explained 9.6% of the variability in LOS (Spearman rho, 0.31; P < 0.001).
Overall, 118 (3.4%) patients were readmitted within 14 days of index discharge; the median readmission rate was 3.8% with a range of 0.8% to 33.3% (IQR: 2.1%‐5.8%) across hospitals. The median total cost of the index hospitalization was $19,574 (IQR: $13,791‐$31,063). The total cost for the index hospitalization exceeded $54,215 for 10% of patients and the total cost of the episode exceeded $55,208 for 10% of patients. Unadjusted outcomes, stratified by primary pleural fluid drainage procedure, are summarized in Table 2.
| Overall | Chest Tube Without Fibrinolysis | Chest Tube With Fibrinolysis | Thoracotomy | VATS | P Valueb | |
|---|---|---|---|---|---|---|
| ||||||
| Additional Procedure | 716 (20.5) | 331 (19.8) | 144 (23.1) | 197 (24.7) | 44 (10.8) | <0.001 |
| Readmission within 14 days | 118 (3.4) | 54 (3.3) | 13 (2.1) | 32 (4.0) | 19 (4.7) | 0.096 |
| Total LOS (days) | 10 (7, 14) | 10 (7, 14) | 9 (7, 13) | 10 (7, 14) | 9 (7, 12) | <.001 |
| Post‐initial Procedure LOS (days) | 8 (5, 12) | 8 (6, 12) | 7 (5, 10) | 8 (5, 12) | 7 (5, 10) | <0.001 |
| Total Cost, Index Hospitalization ($)e | 19319 (13358, 30955) | 19951 (13576, 32018)c | 19565 (13209, 32778)d | 20352 (14351, 31343) | 17918 (13531, 25166) | 0.016 |
| Total Cost, Episode of Illness ($)e | 19831 (13927, 31749) | 20151 (13764, 32653) | 19593 (13210, 32861) | 20573 (14419, 31753) | 18344 (13835, 25462) | 0.029 |
In multivariable analysis, differences in total LOS and post‐procedure LOS were not significant (Table 3). The odds of additional drainage procedures were higher for all drainage procedures compared with initial VATS (Table 3). Patients undergoing initial chest tube placement with fibrinolysis were less likely to require readmission compared with patients undergoing initial VATS (Table 3). The total cost for the episode of illness (including the cost of readmission) was significantly less for those undergoing primary chest tube placement without fibrinolysis compared with primary VATS. The results of subanalyses excluding patients with an underlying CCC (Supporting Appendix online, Table 4) and restricting the cohort to patients undergoing pleural drainage within two days of admission (Supporting Appendix online, Table 5) were similar to the results of our primary analysis with one exception; in the latter subanalysis, children undergoing initial chest tube placement without fibrinolysis were also less likely to require readmission compared with patients undergoing initial VATS.
| Adjusted OR (95% CI)a | P Value | |
|---|---|---|
| ||
| Additional pleural drainage procedure | ||
| Chest tube without fibrinolysis | 1.82 (1.103.00) | .019 |
| Chest tube with fibrinolysis | 2.31 (1.443.72) | <0.001 |
| Thoracotomy | 2.59 (1.624.14) | <0.001 |
| VATS | Reference | |
| Readmission within 14 days | ||
| Chest tube without fibrinolysis | 0.61 (0.361.05) | .077 |
| Chest tube with fibrinolysis | 0.45 (0.230.86) | .015 |
| Thoracotomy | 0.85 (0.521.39) | .521 |
| VATS | Reference | |
| Adjusted Mean (95% CI)a | P Value | |
| Total LOS (days) | ||
| Chest tube without fibrinolysis | 8.0 (7.88.2) | .339 |
| Chest tube with fibrinolysis | 8.1 (7.98.3) | .812 |
| Thoracotomy | 8.1 (7.98.3) | .632 |
| VATS | 8.1 (7.98.3) | Ref |
| Post‐initial procedure LOS (days) | ||
| Chest tube without fibrinolysis | 7.3 (7.07.5) | .512 |
| Chest tube with fibrinolysis | 7.5 (7.27.8) | .239 |
| Thoracotomy | 7.3 (7.07.6) | .841 |
| VATS | 7.3 (7.17.6) | Reference |
| Total cost, index hospitalization ($) | ||
| Chest tube without fibrinolysis | 22928 (2200023895 | .012 |
| Chest tube with fibrinolysis | 23621 (2263124655) | .657 |
| Thoracotomy | 23386 (2241924395 | .262 |
| VATS | 23820 (2280824878) | Reference |
| Total cost, episode of illness ($) | ||
| Chest tube without fibrinolysis | 23218 (2227824199) | .004 |
| Chest tube with fibrinolysis | 23749 (2275224790) | .253 |
| Thoracotomy | 23673 (2269324696) | .131 |
| VATS | 24280 (2324425362) | Reference |
Discussion
This multicenter study is the largest to evaluate the management of children hospitalized with complicated pneumonia. We found considerable variation in initial management and outcomes across hospitals. Differences in timing of the initial drainage procedure explained only a small amount of the variability in outcomes. Children undergoing initial VATS less commonly required additional drainage procedures while children undergoing initial chest tube placement with fibrinolysis less commonly required readmission. Differences in total and post‐procedure LOS were not statistically significant. Differences in cost, while statistically significant, were of marginal relevance.
Previous studies have also shown significant variation in treatment and outcomes of children with complicated pneumonia across hospitals.2, 8 Our study provides data from additional hospitals, includes a substantially larger number of patients undergoing initial VATS, distinguishes between fibrinolysis recipients and nonrecipients, and is the first to compare outcomes between four different initial drainage strategies. The creation of national consensus guidelines might reduce variability in initial management strategies, although the variability in outcomes across hospitals in the current study could not be explained simply by differences in the type or timing of the initial drainage procedure. Thus, future studies examining hospital‐level factors may play an important role in improving quality of care for children with complicated pneumonia.
Patients with initial thoracotomy or chest tube placement with or without fibrinolysis more commonly received additional drainage procedures than patients with initial VATS. This difference remained when patients with CCCs were excluded from the analysis and when the analysis was limited to patients undergoing pleural fluid drainage within 2 days of hospitalization. Several small, randomized trials demonstrated conflicting results when comparing initial chest tube placement with fibrinolysis and VATS. St. Peter et al22 reported that 3 (17%) of 18 patients undergoing initial chest tube placement with fibrinolysis and none of the 18 patients undergoing initial VATS received additional pleural drainage procedures. Sonnappa et al21 found no differences between the two groups. Kurt et al19 did not state the proportion of patients receiving additional procedures. However, the mean number of drainage procedures was 2.25 among the 8 patients undergoing initial chest tube placement while none of the 10 patients with VATS received additional drainage.19
Thoracotomy is often perceived as a definitive procedure for treatment of complicated pneumonia. However, several possibilities exist to explain why additional procedures were performed less frequently in patients undergoing initial VATS compared with initial thoracotomy. The limited visual field in thoracotomy may lead to greater residual disease post‐operatively in those receiving thoracotomy compared with VATS.31 Additionally, thoracotomy substantially disrupts the integrity of the chest wall and is consequently associated with complications such as bleeding and air leak into the pleural cavity more often than VATS.31, 32 It is thus possible that some of the additional procedures in patients receiving initial thoracotomy were necessary for management of thoracotomy‐associated complications rather than for failure of the initial drainage procedure.
Similar to the randomized trials by Sonnappa et al21 and St. Peter et al,22 differences in the overall and post‐procedure LOS were not significant among patients undergoing initial VATS compared with initial chest tube placement with fibrinolysis. However, chest tube placement without fibrinolysis did not result in significant differences in LOS compared with initial VATS. In the only pediatric randomized trial, the 29 intrapleural urokinase recipients had a 2 day shorter LOS compared with the 29 intrapleural saline recipients.33 Several small, randomized controlled trials of adults with complicated pneumonia reported improved pleural fluid drainage among intrapleural fibrinolysis recipients compared with non‐recipients.3436 However, a large multicenter randomized trial in adults found no differences in mortality, requirement for surgical drainage, or LOS between intrapleural streptokinase and placebo recipients.37 Subsequent meta‐analyses of randomized trials in adults also demonstrated no benefit to fibrinolysis.38, 39 In the context of the increasing use of intrapleural fibrinolysis in children with complicated pneumonia, our results highlight the need for a large, multicenter randomized controlled trial to determine whether chest tube with fibrinolysis is superior to chest tube alone.
Two small randomized trials21, 22 and a decision analysis40 identified chest tube with fibrinolysis as the most economical approach to children with complicated pneumonia. However, the costs did not differ significantly between patients undergoing initial VATS or initial chest tube placement with fibrinolysis in our study. The least costly approach was initial chest tube placement without fibrinolysis. Unlike the randomized controlled trials, we considered costs associated with readmissions in determining the total costs. Shah et al41 found no difference in total charges for patients undergoing initial VATS compared with initial chest tube placement; however, patients undergoing initial VATS were concentrated in a few centers, making it difficult to determine the relative importance of procedural and hospital factors.
This multicenter observational study has several limitations. First, discharge diagnosis coding may be unreliable for specific diseases. However, our rigorous definition of complicated pneumonia, supported by the high positive predictive value as verified by medical record review, minimizes the likelihood of misclassification.
Second, unmeasured confounding or residual confounding by indication for the method of pleural drainage may occur, potentially influencing our results in two disparate ways. If patients with more severe systemic illness were too unstable for operative interventions, then our results would be biased towards worse outcomes for children undergoing initial chest tube placement. We adjusted for several variables associated with a greater systemic severity of illness, including intensive care unit admission, making this possibility less likely. We also could not account for some factors associated with more severe local disease such as the size and character of the effusion. We suspect that patients with more extensive local disease (ie, loculated effusions) would have worse outcomes than other patients, regardless of initial procedure, and that these patients would also be more likely to undergo primary surgical drainage. Thus, this study may have underestimated the benefit of initial surgical drainage (eg, VATS) compared with nonsurgical drainage (ie, chest tube placement).
Third, misclassification of the method of initial pleural drainage may have occurred. Patients transferred from another institution following chest tube placement could either be classified as not receiving pleural drainage and thus excluded from the study or classified as having initial VATS or thoracotomy if the reason for transfer was chest tube treatment failure. Additionally, we could not distinguish routine use of fibrinolysis from fibrinolysis to maintain chest tube patency. Whether such misclassification would falsely minimize or maximize differences in outcomes between the various groups remains uncertain. Fourth, because this study only included tertiary care children's hospitals, these data are not generalizable to community settings. VATS requires specialized surgical training that may be unavailable in some areas. Finally, this study demonstrates the relative efficacy of various pleural fluid drainage procedures on short‐term clinical outcomes and resource utilization. However, long‐term functional outcomes should be measured in future prospective studies.
Conclusions
In conclusion, emphasis on evidence driven treatment to optimize care has led to an increasing examination of unwarranted practice variation.42 The lack of evidence for best practice makes it difficult to define unwarranted variation in the treatment of complicated pneumonia. Our study demonstrates the large variability in practice and raises additional questions regarding the optimal drainage strategies. Published randomized trials have focused on comparisons between chest tube placement with fibrinolysis and VATS. However, our data suggest that future randomized trials should include chest tube placement without fibrinolysis as a treatment strategy. In determining the current best treatment for patients with complicated pneumonia, a clinician must weigh the impact of needing an additional procedure in approximately one‐quarter of patients undergoing initial chest tube placement (with or without fibrinolysis) with the risks of general anesthesia and readmission in patients undergoing initial VATS.
Acknowledgements
Dr. Hall had full access to all the data in the study and takes responsibility for the integrity of the data and accuracy of the analysis.
- ,.Parapneumonic pleural effusion and empyema in children. Review of a 19‐year experience, 1962–1980.Clin Pediatr (Phila).1983;22:414–419.
- ,,,,.Primary early thoracoscopy and reduction in length of hospital stay and additional procedures among children with complicated pneumonia: Results of a multicenter retrospective cohort study.Arch Pediatr Adolesc Med.2008;162:675–681.
- ,.Empyema hospitalizations increased in US children despite pneumococcal conjugate vaccine.Pediatrics.2010;125:26–33.
- ,,, et al.Impact of the pneumococcal conjugate vaccine on pneumococcal parapneumonic empyema.Pediatr Infect Dis J.2006;25:250–254.
- ,,,,.Five‐fold increase in pediatric parapneumonic empyema since introduction of pneumococcal conjugate vaccine.Pediatric Infect Dis J.2008;27:1030–1032.
- ,,,.Increasing incidence of empyema complicating childhood community‐acquired pneumonia in the United States.Clin Infect Dis.2010;50:805–813.
- ,,,,.National hospitalization trends for pediatric pneumonia and associated complications.Pediatrics.2010;126:204–213.
- ,,, et al.Empyema associated with community‐acquired pneumonia: A Pediatric Investigator's Collaborative Network on Infections in Canada (PICNIC) study.BMC Infect Dis.2008;8:129.
- ,,,,.Pleural empyema in children.Ann Thorac Surg.1970;10:37–44.
- ,,.Management of streptococcal empyema.Ann Thorac Surg.1966;2:658–664.
- ,.Thoracoscopy in the management of empyema in children.J Pediatr Surg.1993;28:1128–1132.
- ,,,.Surgical treatment of parapneumonic empyema.Pediatr Pulmonol.1996;22:348–356.
- ,.The controversial role of decortication in the management of pediatric empyema.J Thorac Cardiovasc Surg.1988;96:166–170.
- ,,,,,.Postpneumonic empyema in children treated by early decortication.Eur J Pediatr Surg.1997;7:135–137.
- ,.Video‐assisted thoracoscopic surgery in the management of pediatric empyema.JSLS.1997;1:251–3.
- ,,,.Early video‐assisted thoracic surgery in the management of empyema.Pediatrics.1999;103:e63.
- ,,,,.Early definitive intervention by thoracoscopy in pediatric empyema.J Pediatr Surg.1999;34:178–180; discussion80–81.
- ,,,,.Thoracoscopy in the management of pediatric empyema.J Pediatr Surg.1995;30:1211–1215.
- ,,,,.Therapy of parapneumonic effusions in children: Video‐assisted thoracoscopic surgery versus conventional thoracostomy drainage.Pediatrics.2006;118:e547–e553.
- ,.Primary operative management for pediatric empyema: Decreases in hospital length of stay and charges in a national sample.Arch Pediatr Adolesc Med.2008;162:44–48.
- ,,, et al.Comparison of urokinase and video‐assisted thoracoscopic surgery for treatment of childhood empyema.Am J Respir Crit Care Med.2006;174:221–227.
- ,,, et al.Thoracoscopic decortication vs tube thoracostomy with fibrinolysis for empyema in children: A prospective, randomized trial.J Pediatr Surg.2009;44:106–111; discussion11.
- ,,,.Corticosteroids and mortality in children with bacterial meningitis.JAMA.2008;299:2048–2055.
- ,,,,.Intravenous immunoglobulin in children with streptococcal toxic shock syndrome.Clin Infect Dis.2009;49:1369–1376.
- ,,, et al.Deaths attributed to pediatric complex chronic conditions: National trends and implications for supportive care services.Pediatrics.2001;107:e99.
- ,.Multiple regression of cost data: Use of generalised linear models.J Health Serv Res Policy.2004;9:197–204.
- ,,,.A robustified modeling approach to analyze pediatric length of stay.Ann Epidemiol.2005;15:673–677.
- ,,.Correlates of length of stay, cost of care, and mortality among patients hospitalized for necrotizing fasciitis.Epidemiol Infect.2007;135:868–876.
- ,,,,,.Health care costs of adults treated for attention‐deficit/hyperactivity disorder who received alternative drug therapies.J Manag Care Pharm.2007;13:561–569.
- .The role of the propensity score in estimating dose‐response functions.Biometrika.2000;87:706–710.
- ,,,,.Experience with video‐assisted thoracoscopic surgery in the management of complicated pneumonia in children.J Pediatr Surg.2001;36:316–319.
- ,,, et al.VATS debridement versus thoracotomy in the treatment of loculated postpneumonia empyema.Ann Thorac Surg.1996;61:1626–1630.
- ,,,,.Randomised trial of intrapleural urokinase in the treatment of childhood empyema.Thorax.2002;57:343–347.
- ,,,,,.Intrapleural urokinase versus normal saline in the treatment of complicated parapneumonic effusions and empyema. A randomized, double‐blind study.Am J Respir Crit Care Med.1999;159:37–42.
- ,,.Randomised controlled trial of intrapleural streptokinase in community acquired pleural infection.Thorax.1997;52:416–421.
- ,,,,.Intrapleural streptokinase for empyema and complicated parapneumonic effusions.Am J Respir Crit Care Med.2004;170:49–53.
- ,,, et al.U.K. Controlled trial of intrapleural streptokinase for pleural infection.N Engl J Med.2005;352:865–874.
- ,.Intra‐pleural fibrinolytic therapy versus conservative management in the treatment of adult parapneumonic effusions and empyema.Cochrane Database Syst Rev.2008:CD002312.
- ,,,.Intrapleural fibrinolytic agents for empyema and complicated parapneumonic effusions: A meta‐analysis.Chest.2006;129:783–790.
- ,,.Cost‐effectiveness of competing strategies for the treatment of pediatric empyema.Pediatrics.2008;121:e1250–e1257.
- ,,.Costs of treating children with complicated pneumonia: A comparison of primary video‐assisted thoracoscopic surgery and chest tube placement.Pediatr Pulmonol.2010;45:71–77.
- .Unwarranted variation in pediatric medical care.Pediatr Clin North Am.2009;56:745–755.
Community‐acquired pneumonia, the most common serious bacterial infection in childhood, may be complicated by parapneumonic effusion (ie, complicated pneumonia).1 Children with complicated pneumonia require prolonged hospitalization and frequently undergo multiple pleural fluid drainage procedures.2 Additionally, the incidence of complicated pneumonia has increased,37 making the need to define appropriate therapy even more pressing. Defining appropriate therapy is challenging for the individual physician as a result of inconsistent and insufficient evidence, and wide variation in treatment practices.2, 8
Historically, thoracotomy was performed only if initial chest tube placement did not lead to clinical improvement.9, 10 Several authors, noting the rapid resolution of symptoms in children undergoing earlier thoracotomy, advocated for the use of thoracotomy as initial therapy rather than as a procedure of last resort.114 The advent of less invasive techniques such as video‐assisted thoracoscopic surgery (VATS) has served as an additional impetus to consider surgical drainage as the initial treatment strategy.1518 Few well‐designed studies have examined the relative efficacy of these interventions.2, 1922 Published randomized trials were single center, enrolled few patients, and arrived at different conclusions.19, 21, 22 In addition, these trials did not examine other important outcomes such as requirement for additional pleural fluid drainage procedures and hospital readmission. Two large retrospective multicenter studies found modest reductions in length of stay (LOS) and substantial decreases in the requirement for additional pleural fluid drainage procedures in children undergoing initial VATS compared with initial chest tube placement.2, 20 However, Shah et al2 included relatively few patients undergoing VATS. Li et al20 combined patients undergoing initial thoracentesis, initial chest tube placement, late pleural fluid drainage (by any method), and no pleural fluid drainage into a single non‐operative management category, precluding conclusions about the relative benefits of chest tube placement compared with VATS. Neither study2, 20 examined the role of chemical fibrinolysis, a therapy which has been associated with outcomes comparable to VATS in two small randomized trials.21, 22
The objectives of this multicenter study were to describe the variation in the initial management strategy along with associated outcomes of complicated pneumonia in childhood and to determine the comparative effectiveness of different pleural fluid drainage procedures.
Methods
Data Source
The Pediatric Health Information System (PHIS), which contains resource utilization data from 40 freestanding children's hospitals, provided data for this multicenter retrospective cohort study. Participating hospitals are located in noncompeting markets of 27 states plus the District of Columbia. The PHIS database includes patient demographics, diagnoses, and procedures as well as data for all drugs, radiologic studies, laboratory tests, and supplies charged to each patient. Data are de‐identified, however encrypted medical record numbers allow for tracking individual patients across admissions. The Child Health Corporation of America (Shawnee Mission, KS) and participating hospitals jointly assure data quality and reliability as described previously.23, 24 The Children's Hospital of Philadelphia Institutional Review Board reviewed and approved this study.
Patients
Children 18 years of age receiving a pleural drainage procedure for complicated pneumonia were eligible if they were discharged from participating hospitals between January 1, 2004 and June 30, 2009. Study participants met the following criteria: 1) discharge diagnosis of pneumonia (International Classification of Diseases, 9th revision [ICD‐9] discharge diagnosis codes 480.x‐483.x, 485.x‐487.x), 2) discharge diagnosis of pleural effusion (ICD‐9 codes 510.0, 510.9, 511.0, 511.1, or 511.9), and 3) billing charge for antibiotics on the first day of hospitalization. Additionally, the primary discharge diagnosis had to be either pneumonia or pleural effusion. Patients were excluded if they did not undergo pleural fluid drainage or if their initial pleural fluid drainage procedure was thoracentesis.
Study Definitions
Pleural drainage procedures were identified using ICD‐9 procedure codes for thoracentesis (34.91), chest tube placement (34.04), VATS (34.21), and thoracotomy (34.02 or 34.09). Fibrinolysis was defined as receipt of urokinase, streptokinase, or alteplase within two days of initial chest tube placement.
Acute conditions or complications included influenza (487, 487.0, 487.1, 487.8, 488, or V04.81) and hemolytic‐uremic syndrome (283.11). Chronic comorbid conditions (CCCs) (eg, malignancy) were identified using a previously reported classification scheme.25 Billing data were used to classify receipt of mechanical ventilation and medications on the first day of hospitalization.
Measured Outcomes
The primary outcomes were hospital LOS (both overall and post‐initial procedure), requirement for additional pleural drainage procedures, total cost for index hospitalization, all‐cause readmission within 14 days after index hospital discharge, and total cost of the episode (accounting for the cost of readmissions).
Measured Exposures
The primary exposure of interest was the initial pleural fluid drainage procedure, classified as chest tube placement without fibrinolysis, chest tube placement with fibrinolysis, VATS, or thoracotomy.
Statistical Analysis
Variables were summarized using frequencies and percentages for categorical variables, and median, interquartile range (IQR), and range for continuous variables. Outcomes by initial pleural drainage procedure were compared using chi‐squared tests for categorical variables and Kruskal‐Wallis tests for continuous variables.
Multivariable analysis was performed to account for potential confounding by observed baseline variables. For dichotomous outcome variables, modeling consisted of logistic regression using generalized estimating equations to account for hospital clustering. For continuous variables, a mixed model approach was used, treating hospital as a random effect. Log transformation was applied to the right‐skewed outcome variables (LOS and cost). Cost outcomes remained skewed following log transformation, thus gamma mixed models were applied.2629 Odds ratios and 95% confidence intervals (CIs) were reported for comparison of dichotomous outcomes and the adjusted means and 95% CIs were reported for continuous outcomes after appropriate back transformation.
Additional analyses addressed the potential impact of confounding by indication inherent in any observational study. First, patients with an underlying CCC were excluded to ensure that our results would be generalizable to otherwise healthy children with community‐acquired pneumonia. Second, patients undergoing pleural drainage >2 days after hospitalization were excluded to minimize the effect of residual confounding related to differences in timing of the initial drainage procedure. Third, the analysis was repeated using a generalized propensity score as an additional method to account for confounding by indication for the initial drainage procedure.30 Propensity scores, constructed using a multivariable generalized logit model, included all variables listed in Table 1. The inverse of the propensity score was included as a weight in each multivariable model described previously. Only the primary multivariable analyses are presented as the results of the propensity score analysis were nearly identical to the primary analyses.
| Overall | Chest Tube Without Fibrinolysis | Chest Tube With Fibrinolysis | Thoracotomy | VATS | P Value | |
|---|---|---|---|---|---|---|
| ||||||
| N | 3500 | 1672 (47.8) | 623 (17.8) | 797 (22.8) | 408 (11.7) | |
| Age | ||||||
| <1 year | 335 (9.6) | 176 (10.5) | 56 (9.0) | 78 (9.8) | 25 (6.1) | |
| 1 year | 475 (13.6) | 238 (14.2) | 98 (15.7) | 92 (11.5) | 47 (11.5) | 0.003 |
| 24 years | 1230 (35.1) | 548 (32.8) | 203 (32.6) | 310 (38.9) | 169 (41.4) | |
| 59 years | 897 (25.6) | 412 (24.6) | 170 (27.3) | 199 (25.0) | 116 (28.4) | |
| 1014 years | 324 (9.3) | 167 (10.0) | 61 (9.8) | 65 (8.2) | 31 (7.6) | |
| 1518 years | 193 (5.5) | 106 (6.3) | 29 (4.6) | 40 (5.0) | 18 (4.4) | |
| >18 years | 46 (1.3) | 25 (1.5) | 6 (0.96) | 13 (1.6) | 2 (0.5) | |
| Comorbid Conditions | ||||||
| Cardiac | 69 (2.0) | 43 (2.6) | 14 (2.3) | 12 (1.5) | 0 (0.0) | 0.006 |
| Malignancy | 81 (2.3) | 31 (1.9) | 18 (2.9) | 21 (2.6) | 11 (2.7) | 0.375 |
| Neurological | 138 (3.9) | 73 (4.4) | 20 (3.2) | 34 (4.3) | 11 (2.7) | 0.313 |
| Any Other Condition | 202 (5.8) | 96 (5.7) | 40 (6.4) | 47 (5.9) | 19 (4.7) | 0.696 |
| Payer | ||||||
| Government | 1240 (35.6) | 630 (37.8) | 224 (36.0) | 259 (32.7) | 127 (31.3) | <0.001 |
| Private | 1383 (39.7) | 607 (36.4) | 283 (45.4) | 310 (39.2) | 183 (45.07) | |
| Other | 864 (24.8) | 430 (25.8) | 116 (18.6) | 222 (28.1) | 96 (23.65) | |
| Race | ||||||
| Non‐Hispanic White | 1746 (51.9) | 838 (51.6) | 358 (59.7) | 361 (47.8) | 189 (48.7) | <0.001 |
| Non‐Hispanic Black | 601 (17.9) | 318 (19.6) | 90 (15.0) | 128 (17.0) | 65 (16.8) | |
| Hispanic | 588 (17.5) | 280 (17.3) | 73 (12.2) | 155 (20.5) | 80 (20.6) | |
| Asian | 117 (3.5) | 47 (2.9) | 20 (3.3) | 37 (4.9) | 13 (3.4) | |
| Other | 314 (9.3) | 140 (8.6) | 59 (9.8) | 74 (9.8) | 41 (10.6) | |
| Male Sex | 1912 (54.6) | 923 (55.2) | 336 (53.9) | 439 (55.1) | 214 (52.5) | 0.755 |
| Radiology | ||||||
| CT, no US | 1200 (34.3) | 600 (35.9) | 184 (29.5) | 280 (35.1) | 136 (33.3) | <0.001 |
| CT and US | 221 (6.3) | 84 (5.0) | 53 (8.5) | 61 (7.7) | 23 (5.6) | |
| US, no CT | 799 (22.8) | 324 (19.4) | 178 (28.6) | 200 (25.1) | 97 (23.8) | |
| No US, no CT | 1280 (36.6) | 664 (39.7) | 208 (33.4) | 256 (32.1) | 152 (37.3) | |
| Empiric Antibiotic Regimen | ||||||
| Cephalosporins alone | 448 (12.8) | 181 (10.83) | 126 (20.2) | 73 (9.2) | 68 (16.7) | <0.001 |
| Cephalosporin and clindamycin | 797 (22.8) | 359 (21.5) | 145 (23.3) | 184 (23.1) | 109 (26.7) | |
| Other antibiotic combination | 167 (4.8) | 82 (4.9) | 30 (4.8) | 38 (4.8) | 17 (4.2) | |
| Cephalosporin and vancomycin | 2088 (59.7) | 1050 (62.8) | 322 (51.7) | 502 (63.0) | 214 (52.5) | |
| Mechanical ventilation | 494 (14.1) | 251 (15.0) | 75 (12.0) | 114 (14.3) | 54 (13.2) | 0.307 |
| Corticosteroids | 520 (14.9) | 291 (17.4) | 72 (11.6) | 114 (14.3) | 43 (10.5) | <0.001 |
| Blood product transfusionsb | 761 (21.7) | 387 (23.2) | 145 (23.3) | 161 (20.2) | 68 (16.7) | 0.018 |
| Vasoactive infusionsc | 381 (10.9) | 223 (13.3) | 63 (10.1) | 72 (9.0) | 23 (5.6) | <0.001 |
| Admission to intensive care | 1397 (39.9) | 731 (43.7) | 234 (37.6) | 296 (37.1) | 136 (33.3) | <0.001 |
| Extracorporeal membranous oxygenation | 18 (0.5) | 13 (0.8) | 2 (0.3) | 3 (0.4) | 0 (0.0) | 0.163 |
| Hemolytic‐uremic syndrome | 31 (0.9) | 15 (0.9) | 6 (1.0) | 7 (0.9) | 3 (0.7) | 0.985 |
| Influenza | 108 (3.1) | 53 (3.2) | 27 (4.3) | 23 (2.9) | 5 (1.2) | 0.044 |
| Arterial blood gas measurements | 0 (0,1) | 0 (0, 2) | 0 (0,1) | 0 (0, 1) | 0 (0, 1) | <0.001 |
| Days to first procedure | 1 (0, 3) | 1 (0, 2) | 1 (1, 3) | 1 (1, 3) | 1 (1, 3) | <0.001 |
Medical records of a randomly selected subset of subjects from 6 hospitals were reviewed to determine the accuracy of our algorithm in identifying patients with complicated pneumonia; these subjects represented 1% of the study population. For the purposes of medical record review, complicated pneumonia was defined by the following: 1) radiologically‐confirmed lung infiltrate; 2) moderate or large pleural effusion; and 3) signs and symptoms of lower respiratory tract infection. Complicated pneumonia was identified in 118 of 120 reviewed subjects for a positive predictive value of 98.3%.
All analyses were clustered by hospital. Analyses were performed using SAS version 9.2 (SAS Institute, Cary, NC). A two‐tailed P < 0.05 was considered statistically significant.
Results
Patient Characteristics
During the study period, 9,680 subjects had complicated pneumonia. Subjects were excluded if they did not have a pleural drainage procedure (n = 5798), or if thoracentesis was the first pleural fluid drainage procedure performed (n = 382). The remaining 3500 patients were included. Demographic characteristics are summarized in Table 1. The median patient age was 4.1 years (IQR: 2.17.2 years). An underlying CCC was present in 424 (12.1%) patients. There was no association between type of drainage procedure and mechanical ventilation. However, factors associated with more severe systemic illness, such as blood product transfusion, were more common among those undergoing initial chest tube placement with or without fibrinolysis (Table 1).
Initial Pleural Fluid Drainage Procedures
The primary procedures included chest tube without fibrinolysis (47.8%); chest tube with fibrinolysis (17.8%); thoracotomy (22.8%); and VATS (11.7%) (Table 1). The proportion of patients undergoing primary chest tube placement with fibrinolysis increased over time from 14.2% in 2004 to 30.0% in 2009 (P < 0.001; chi‐squared test for trend). The initial procedure varied by hospital with the greatest proportion of patients undergoing primary chest tube placement without fibrinolysis at 28 (70.0%) hospitals, chest tube placement with fibrinolysis at 5 (12.5%) hospitals, thoracotomy at 5 (12.5%) hospitals, and VATS at 2 (5.0%) hospitals (Figure 1). The median proportion of patients undergoing primary VATS across all hospitals was 11.5% (IQR: 3.9%‐26.5%) (Figure 1). The median time to first procedure was 1 day (IQR: 03 days).
Outcome Measures
Variation in outcomes occurred across hospitals. Additional pleural drainage procedures were performed in a median of 20.9% of patients with a range of 6.8% to 44.8% (IQR: 14.5%‐25.3%) of patients across all hospitals. Median LOS was 10 days with a range of 714 days (IQR: 8.511 days) and the median LOS following the initial pleural fluid drainage procedure was 8 days with a range of 6 to 13 days (IQR: 78 days). Variation in timing of the initial pleural fluid drainage procedure explained 9.6% of the variability in LOS (Spearman rho, 0.31; P < 0.001).
Overall, 118 (3.4%) patients were readmitted within 14 days of index discharge; the median readmission rate was 3.8% with a range of 0.8% to 33.3% (IQR: 2.1%‐5.8%) across hospitals. The median total cost of the index hospitalization was $19,574 (IQR: $13,791‐$31,063). The total cost for the index hospitalization exceeded $54,215 for 10% of patients and the total cost of the episode exceeded $55,208 for 10% of patients. Unadjusted outcomes, stratified by primary pleural fluid drainage procedure, are summarized in Table 2.
| Overall | Chest Tube Without Fibrinolysis | Chest Tube With Fibrinolysis | Thoracotomy | VATS | P Valueb | |
|---|---|---|---|---|---|---|
| ||||||
| Additional Procedure | 716 (20.5) | 331 (19.8) | 144 (23.1) | 197 (24.7) | 44 (10.8) | <0.001 |
| Readmission within 14 days | 118 (3.4) | 54 (3.3) | 13 (2.1) | 32 (4.0) | 19 (4.7) | 0.096 |
| Total LOS (days) | 10 (7, 14) | 10 (7, 14) | 9 (7, 13) | 10 (7, 14) | 9 (7, 12) | <.001 |
| Post‐initial Procedure LOS (days) | 8 (5, 12) | 8 (6, 12) | 7 (5, 10) | 8 (5, 12) | 7 (5, 10) | <0.001 |
| Total Cost, Index Hospitalization ($)e | 19319 (13358, 30955) | 19951 (13576, 32018)c | 19565 (13209, 32778)d | 20352 (14351, 31343) | 17918 (13531, 25166) | 0.016 |
| Total Cost, Episode of Illness ($)e | 19831 (13927, 31749) | 20151 (13764, 32653) | 19593 (13210, 32861) | 20573 (14419, 31753) | 18344 (13835, 25462) | 0.029 |
In multivariable analysis, differences in total LOS and post‐procedure LOS were not significant (Table 3). The odds of additional drainage procedures were higher for all drainage procedures compared with initial VATS (Table 3). Patients undergoing initial chest tube placement with fibrinolysis were less likely to require readmission compared with patients undergoing initial VATS (Table 3). The total cost for the episode of illness (including the cost of readmission) was significantly less for those undergoing primary chest tube placement without fibrinolysis compared with primary VATS. The results of subanalyses excluding patients with an underlying CCC (Supporting Appendix online, Table 4) and restricting the cohort to patients undergoing pleural drainage within two days of admission (Supporting Appendix online, Table 5) were similar to the results of our primary analysis with one exception; in the latter subanalysis, children undergoing initial chest tube placement without fibrinolysis were also less likely to require readmission compared with patients undergoing initial VATS.
| Adjusted OR (95% CI)a | P Value | |
|---|---|---|
| ||
| Additional pleural drainage procedure | ||
| Chest tube without fibrinolysis | 1.82 (1.103.00) | .019 |
| Chest tube with fibrinolysis | 2.31 (1.443.72) | <0.001 |
| Thoracotomy | 2.59 (1.624.14) | <0.001 |
| VATS | Reference | |
| Readmission within 14 days | ||
| Chest tube without fibrinolysis | 0.61 (0.361.05) | .077 |
| Chest tube with fibrinolysis | 0.45 (0.230.86) | .015 |
| Thoracotomy | 0.85 (0.521.39) | .521 |
| VATS | Reference | |
| Adjusted Mean (95% CI)a | P Value | |
| Total LOS (days) | ||
| Chest tube without fibrinolysis | 8.0 (7.88.2) | .339 |
| Chest tube with fibrinolysis | 8.1 (7.98.3) | .812 |
| Thoracotomy | 8.1 (7.98.3) | .632 |
| VATS | 8.1 (7.98.3) | Ref |
| Post‐initial procedure LOS (days) | ||
| Chest tube without fibrinolysis | 7.3 (7.07.5) | .512 |
| Chest tube with fibrinolysis | 7.5 (7.27.8) | .239 |
| Thoracotomy | 7.3 (7.07.6) | .841 |
| VATS | 7.3 (7.17.6) | Reference |
| Total cost, index hospitalization ($) | ||
| Chest tube without fibrinolysis | 22928 (2200023895 | .012 |
| Chest tube with fibrinolysis | 23621 (2263124655) | .657 |
| Thoracotomy | 23386 (2241924395 | .262 |
| VATS | 23820 (2280824878) | Reference |
| Total cost, episode of illness ($) | ||
| Chest tube without fibrinolysis | 23218 (2227824199) | .004 |
| Chest tube with fibrinolysis | 23749 (2275224790) | .253 |
| Thoracotomy | 23673 (2269324696) | .131 |
| VATS | 24280 (2324425362) | Reference |
Discussion
This multicenter study is the largest to evaluate the management of children hospitalized with complicated pneumonia. We found considerable variation in initial management and outcomes across hospitals. Differences in timing of the initial drainage procedure explained only a small amount of the variability in outcomes. Children undergoing initial VATS less commonly required additional drainage procedures while children undergoing initial chest tube placement with fibrinolysis less commonly required readmission. Differences in total and post‐procedure LOS were not statistically significant. Differences in cost, while statistically significant, were of marginal relevance.
Previous studies have also shown significant variation in treatment and outcomes of children with complicated pneumonia across hospitals.2, 8 Our study provides data from additional hospitals, includes a substantially larger number of patients undergoing initial VATS, distinguishes between fibrinolysis recipients and nonrecipients, and is the first to compare outcomes between four different initial drainage strategies. The creation of national consensus guidelines might reduce variability in initial management strategies, although the variability in outcomes across hospitals in the current study could not be explained simply by differences in the type or timing of the initial drainage procedure. Thus, future studies examining hospital‐level factors may play an important role in improving quality of care for children with complicated pneumonia.
Patients with initial thoracotomy or chest tube placement with or without fibrinolysis more commonly received additional drainage procedures than patients with initial VATS. This difference remained when patients with CCCs were excluded from the analysis and when the analysis was limited to patients undergoing pleural fluid drainage within 2 days of hospitalization. Several small, randomized trials demonstrated conflicting results when comparing initial chest tube placement with fibrinolysis and VATS. St. Peter et al22 reported that 3 (17%) of 18 patients undergoing initial chest tube placement with fibrinolysis and none of the 18 patients undergoing initial VATS received additional pleural drainage procedures. Sonnappa et al21 found no differences between the two groups. Kurt et al19 did not state the proportion of patients receiving additional procedures. However, the mean number of drainage procedures was 2.25 among the 8 patients undergoing initial chest tube placement while none of the 10 patients with VATS received additional drainage.19
Thoracotomy is often perceived as a definitive procedure for treatment of complicated pneumonia. However, several possibilities exist to explain why additional procedures were performed less frequently in patients undergoing initial VATS compared with initial thoracotomy. The limited visual field in thoracotomy may lead to greater residual disease post‐operatively in those receiving thoracotomy compared with VATS.31 Additionally, thoracotomy substantially disrupts the integrity of the chest wall and is consequently associated with complications such as bleeding and air leak into the pleural cavity more often than VATS.31, 32 It is thus possible that some of the additional procedures in patients receiving initial thoracotomy were necessary for management of thoracotomy‐associated complications rather than for failure of the initial drainage procedure.
Similar to the randomized trials by Sonnappa et al21 and St. Peter et al,22 differences in the overall and post‐procedure LOS were not significant among patients undergoing initial VATS compared with initial chest tube placement with fibrinolysis. However, chest tube placement without fibrinolysis did not result in significant differences in LOS compared with initial VATS. In the only pediatric randomized trial, the 29 intrapleural urokinase recipients had a 2 day shorter LOS compared with the 29 intrapleural saline recipients.33 Several small, randomized controlled trials of adults with complicated pneumonia reported improved pleural fluid drainage among intrapleural fibrinolysis recipients compared with non‐recipients.3436 However, a large multicenter randomized trial in adults found no differences in mortality, requirement for surgical drainage, or LOS between intrapleural streptokinase and placebo recipients.37 Subsequent meta‐analyses of randomized trials in adults also demonstrated no benefit to fibrinolysis.38, 39 In the context of the increasing use of intrapleural fibrinolysis in children with complicated pneumonia, our results highlight the need for a large, multicenter randomized controlled trial to determine whether chest tube with fibrinolysis is superior to chest tube alone.
Two small randomized trials21, 22 and a decision analysis40 identified chest tube with fibrinolysis as the most economical approach to children with complicated pneumonia. However, the costs did not differ significantly between patients undergoing initial VATS or initial chest tube placement with fibrinolysis in our study. The least costly approach was initial chest tube placement without fibrinolysis. Unlike the randomized controlled trials, we considered costs associated with readmissions in determining the total costs. Shah et al41 found no difference in total charges for patients undergoing initial VATS compared with initial chest tube placement; however, patients undergoing initial VATS were concentrated in a few centers, making it difficult to determine the relative importance of procedural and hospital factors.
This multicenter observational study has several limitations. First, discharge diagnosis coding may be unreliable for specific diseases. However, our rigorous definition of complicated pneumonia, supported by the high positive predictive value as verified by medical record review, minimizes the likelihood of misclassification.
Second, unmeasured confounding or residual confounding by indication for the method of pleural drainage may occur, potentially influencing our results in two disparate ways. If patients with more severe systemic illness were too unstable for operative interventions, then our results would be biased towards worse outcomes for children undergoing initial chest tube placement. We adjusted for several variables associated with a greater systemic severity of illness, including intensive care unit admission, making this possibility less likely. We also could not account for some factors associated with more severe local disease such as the size and character of the effusion. We suspect that patients with more extensive local disease (ie, loculated effusions) would have worse outcomes than other patients, regardless of initial procedure, and that these patients would also be more likely to undergo primary surgical drainage. Thus, this study may have underestimated the benefit of initial surgical drainage (eg, VATS) compared with nonsurgical drainage (ie, chest tube placement).
Third, misclassification of the method of initial pleural drainage may have occurred. Patients transferred from another institution following chest tube placement could either be classified as not receiving pleural drainage and thus excluded from the study or classified as having initial VATS or thoracotomy if the reason for transfer was chest tube treatment failure. Additionally, we could not distinguish routine use of fibrinolysis from fibrinolysis to maintain chest tube patency. Whether such misclassification would falsely minimize or maximize differences in outcomes between the various groups remains uncertain. Fourth, because this study only included tertiary care children's hospitals, these data are not generalizable to community settings. VATS requires specialized surgical training that may be unavailable in some areas. Finally, this study demonstrates the relative efficacy of various pleural fluid drainage procedures on short‐term clinical outcomes and resource utilization. However, long‐term functional outcomes should be measured in future prospective studies.
Conclusions
In conclusion, emphasis on evidence driven treatment to optimize care has led to an increasing examination of unwarranted practice variation.42 The lack of evidence for best practice makes it difficult to define unwarranted variation in the treatment of complicated pneumonia. Our study demonstrates the large variability in practice and raises additional questions regarding the optimal drainage strategies. Published randomized trials have focused on comparisons between chest tube placement with fibrinolysis and VATS. However, our data suggest that future randomized trials should include chest tube placement without fibrinolysis as a treatment strategy. In determining the current best treatment for patients with complicated pneumonia, a clinician must weigh the impact of needing an additional procedure in approximately one‐quarter of patients undergoing initial chest tube placement (with or without fibrinolysis) with the risks of general anesthesia and readmission in patients undergoing initial VATS.
Acknowledgements
Dr. Hall had full access to all the data in the study and takes responsibility for the integrity of the data and accuracy of the analysis.
- ,.Parapneumonic pleural effusion and empyema in children. Review of a 19‐year experience, 1962–1980.Clin Pediatr (Phila).1983;22:414–419.
- ,,,,.Primary early thoracoscopy and reduction in length of hospital stay and additional procedures among children with complicated pneumonia: Results of a multicenter retrospective cohort study.Arch Pediatr Adolesc Med.2008;162:675–681.
- ,.Empyema hospitalizations increased in US children despite pneumococcal conjugate vaccine.Pediatrics.2010;125:26–33.
- ,,, et al.Impact of the pneumococcal conjugate vaccine on pneumococcal parapneumonic empyema.Pediatr Infect Dis J.2006;25:250–254.
- ,,,,.Five‐fold increase in pediatric parapneumonic empyema since introduction of pneumococcal conjugate vaccine.Pediatric Infect Dis J.2008;27:1030–1032.
- ,,,.Increasing incidence of empyema complicating childhood community‐acquired pneumonia in the United States.Clin Infect Dis.2010;50:805–813.
- ,,,,.National hospitalization trends for pediatric pneumonia and associated complications.Pediatrics.2010;126:204–213.
- ,,, et al.Empyema associated with community‐acquired pneumonia: A Pediatric Investigator's Collaborative Network on Infections in Canada (PICNIC) study.BMC Infect Dis.2008;8:129.
- ,,,,.Pleural empyema in children.Ann Thorac Surg.1970;10:37–44.
- ,,.Management of streptococcal empyema.Ann Thorac Surg.1966;2:658–664.
- ,.Thoracoscopy in the management of empyema in children.J Pediatr Surg.1993;28:1128–1132.
- ,,,.Surgical treatment of parapneumonic empyema.Pediatr Pulmonol.1996;22:348–356.
- ,.The controversial role of decortication in the management of pediatric empyema.J Thorac Cardiovasc Surg.1988;96:166–170.
- ,,,,,.Postpneumonic empyema in children treated by early decortication.Eur J Pediatr Surg.1997;7:135–137.
- ,.Video‐assisted thoracoscopic surgery in the management of pediatric empyema.JSLS.1997;1:251–3.
- ,,,.Early video‐assisted thoracic surgery in the management of empyema.Pediatrics.1999;103:e63.
- ,,,,.Early definitive intervention by thoracoscopy in pediatric empyema.J Pediatr Surg.1999;34:178–180; discussion80–81.
- ,,,,.Thoracoscopy in the management of pediatric empyema.J Pediatr Surg.1995;30:1211–1215.
- ,,,,.Therapy of parapneumonic effusions in children: Video‐assisted thoracoscopic surgery versus conventional thoracostomy drainage.Pediatrics.2006;118:e547–e553.
- ,.Primary operative management for pediatric empyema: Decreases in hospital length of stay and charges in a national sample.Arch Pediatr Adolesc Med.2008;162:44–48.
- ,,, et al.Comparison of urokinase and video‐assisted thoracoscopic surgery for treatment of childhood empyema.Am J Respir Crit Care Med.2006;174:221–227.
- ,,, et al.Thoracoscopic decortication vs tube thoracostomy with fibrinolysis for empyema in children: A prospective, randomized trial.J Pediatr Surg.2009;44:106–111; discussion11.
- ,,,.Corticosteroids and mortality in children with bacterial meningitis.JAMA.2008;299:2048–2055.
- ,,,,.Intravenous immunoglobulin in children with streptococcal toxic shock syndrome.Clin Infect Dis.2009;49:1369–1376.
- ,,, et al.Deaths attributed to pediatric complex chronic conditions: National trends and implications for supportive care services.Pediatrics.2001;107:e99.
- ,.Multiple regression of cost data: Use of generalised linear models.J Health Serv Res Policy.2004;9:197–204.
- ,,,.A robustified modeling approach to analyze pediatric length of stay.Ann Epidemiol.2005;15:673–677.
- ,,.Correlates of length of stay, cost of care, and mortality among patients hospitalized for necrotizing fasciitis.Epidemiol Infect.2007;135:868–876.
- ,,,,,.Health care costs of adults treated for attention‐deficit/hyperactivity disorder who received alternative drug therapies.J Manag Care Pharm.2007;13:561–569.
- .The role of the propensity score in estimating dose‐response functions.Biometrika.2000;87:706–710.
- ,,,,.Experience with video‐assisted thoracoscopic surgery in the management of complicated pneumonia in children.J Pediatr Surg.2001;36:316–319.
- ,,, et al.VATS debridement versus thoracotomy in the treatment of loculated postpneumonia empyema.Ann Thorac Surg.1996;61:1626–1630.
- ,,,,.Randomised trial of intrapleural urokinase in the treatment of childhood empyema.Thorax.2002;57:343–347.
- ,,,,,.Intrapleural urokinase versus normal saline in the treatment of complicated parapneumonic effusions and empyema. A randomized, double‐blind study.Am J Respir Crit Care Med.1999;159:37–42.
- ,,.Randomised controlled trial of intrapleural streptokinase in community acquired pleural infection.Thorax.1997;52:416–421.
- ,,,,.Intrapleural streptokinase for empyema and complicated parapneumonic effusions.Am J Respir Crit Care Med.2004;170:49–53.
- ,,, et al.U.K. Controlled trial of intrapleural streptokinase for pleural infection.N Engl J Med.2005;352:865–874.
- ,.Intra‐pleural fibrinolytic therapy versus conservative management in the treatment of adult parapneumonic effusions and empyema.Cochrane Database Syst Rev.2008:CD002312.
- ,,,.Intrapleural fibrinolytic agents for empyema and complicated parapneumonic effusions: A meta‐analysis.Chest.2006;129:783–790.
- ,,.Cost‐effectiveness of competing strategies for the treatment of pediatric empyema.Pediatrics.2008;121:e1250–e1257.
- ,,.Costs of treating children with complicated pneumonia: A comparison of primary video‐assisted thoracoscopic surgery and chest tube placement.Pediatr Pulmonol.2010;45:71–77.
- .Unwarranted variation in pediatric medical care.Pediatr Clin North Am.2009;56:745–755.
Copyright © 2011 Society of Hospital Medicine
