User login
Community Pediatric Hospitalist Workload: Results from a National Survey
As a newly recognized specialty, pediatric hospital medicine (PHM) continues to expand and diversify.1 Pediatric hospitalists care for children in hospitals ranging from small, rural community hospitals to large, free-standing quaternary children’s hospitals.2-4 In addition, more than 10% of graduating pediatric residents are seeking future careers within PHM.5
In 2018, Fromme et al. published a study describing clinical workload for pediatric hospitalists within university-based settings.6 They characterized the diversity of work models and programmatic sustainability but limited the study to university-based programs. With over half of children receiving care within community hospitals,7 workforce patterns for community-based pediatric hospitalists should be characterized to maximize sustainability and minimize attrition across the field.
In this study, we describe programmatic variability in clinical work expectations of 70 community-based PHM programs. We aimed to describe existing work models and expectations of community-based program leaders as they relate to their unique clinical setting.
METHODS
We conducted a cross-sectional survey of community-based PHM site directors through structured interviews. Community hospital programs were self-defined by the study participants, although typically defined as general hospitals that admit pediatric patients and are not free-standing or children’s hospitals within a general hospital. Survey respondents were asked to answer questions only reflecting expectations at their community hospital.
Survey Design and Content
Building from a tool used by Fromme et al.6 we created a 12-question structured interview questionnaire focused on three areas: (1) full-time employment (FTE) metrics including definitions of a 1.0 FTE, “typical” shifts, and weekend responsibilities; (2) work volume including census parameters, service-line coverage expectations, back-up systems, and overnight call responsibilities; and (3) programmatic model including sense of sustainability (eg, minimizing burnout and attrition), support for activities such as administrative or research time, and employer model (Appendix).
We modified the survey through research team consensus. After pilot-testing by research team members at their own sites, the survey was refined for item clarity, structural design, and length. We chose to administer surveys through phone interviews over a traditional distribution due to anticipated variability in work models. The research team discussed how each question should be asked, and responses were clarified to maintain consistency.
Survey Administration
Given the absence of a national registry or database for community-based PHM programs, study participation was solicited through an invitation posted on the American Academy of Pediatrics Section on Hospital Medicine (AAP SOHM) Listserv and the AAP SOHM Community Hospitalist Listserv in May 2018. Invitations were posted twice at two weeks apart. Each research team member completed 6-19 interviews. Responses to survey questions were recorded in REDCap, a secure, web-based data capture instrument.8
Participating in the study was considered implied consent, and participants did not receive a monetary incentive, although respondents were offered deidentified survey data for participation. The study was exempted through the University of Chicago Institutional Review Board.
Data Analysis
Employers were dichotomized as community hospital employer (including primary community hospital employment/private organization) or noncommunity hospital employer (including children’s/university hospital employment or school of medicine). Descriptive statistics were reported to compare the demographics of two employer groups. P values were calculated using two-sample t-tests for the continuous variables and chi-square or Fisher-exact tests for the categorical variables. Mann–Whitney U-test was performed for continuous variables without normality. Analyses were performed using the R Statistical Programming Language (R Foundation for Statistical Computing, Vienna, Austria), version 3.4.3.
RESULTS
Participation and Program Characteristics
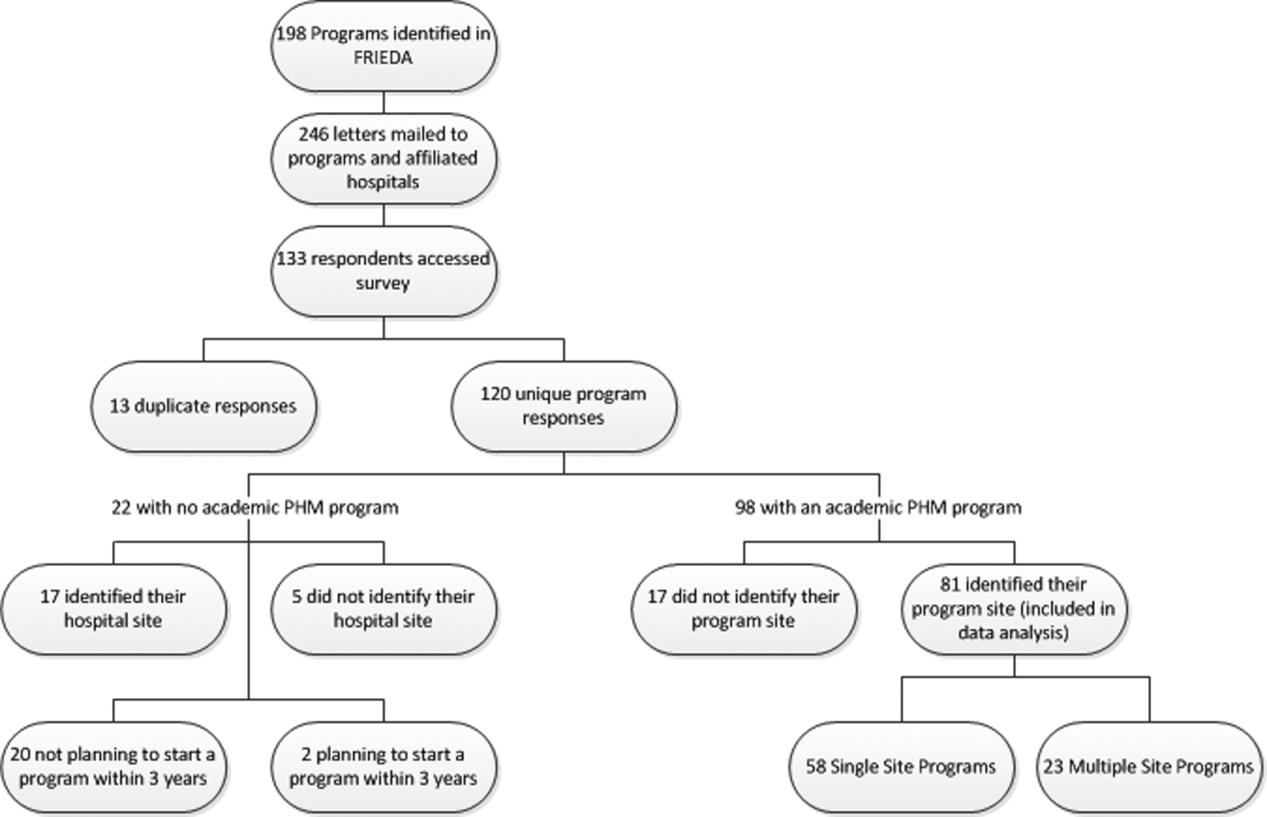
We interviewed 70 community-based PHM site directors representing programs across 29 states (Table 1) and five geographic regions: Midwest (34.3%), Northeast (11.4%), Southeast (15.7%), Southwest (4.3%), and West (34.3%). Employer models varied across groups, with more noncommunity hospital employers (57%) than community hospital employers (43%). The top three services covered by pediatric hospitalists were pediatric inpatient or observation bed admissions (97%), emergency department consults (89%), and general newborns (67%). PHM programs also provided coverage for other services, including newborn deliveries (43%), Special Care Nursery/Level II Neonatal Intensive Care Unit (41%), step-down unit (20%), and mental health units (13%). About 59% of programs provided education for family medicine residents, 36% were for pediatric residents, and 70% worked with advanced practice providers. The majority of programs (70%) provided in-house coverage overnight.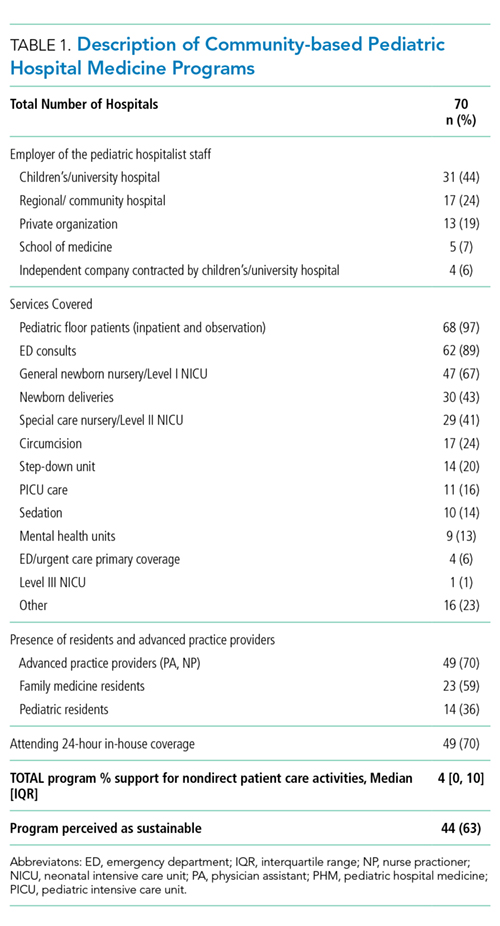
Clinical Work Expectations and Employer Model
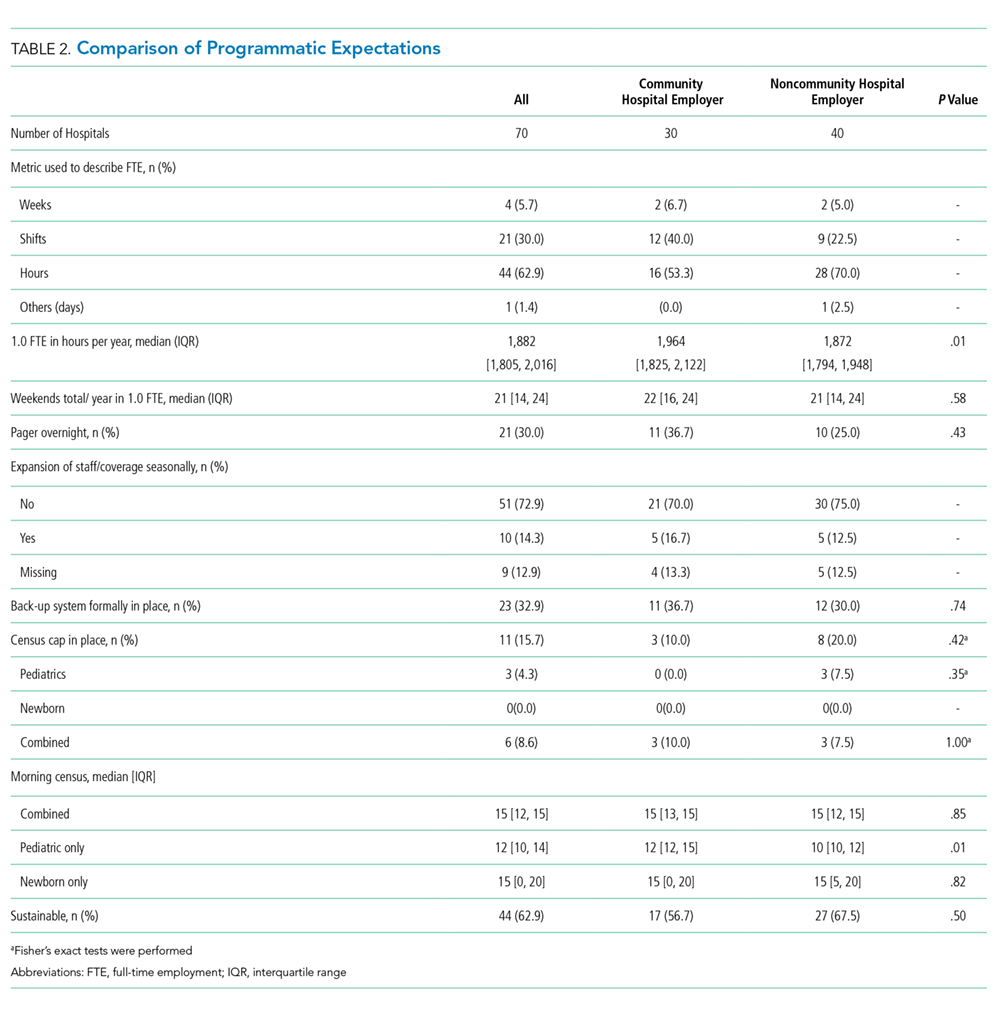
Clinical work expectations varied broadly across programs (Table 2). The median expected hours for a 1.0 FTE was 1,882 hours per year (interquartile range [IQR] 1,805, 2,016), and the median expected weekend coverage/year (defined as covering two days or two nights of the weekend) was 21 (IQR 14, 24). Most programs did not expand staff coverage based on seasonality (73%), and less than 20% of programs operated with a census cap. Median support for nondirect patient care activities was 4% (IQR 0,10) of a program’s total FTE (ie, a 5.0 FTE program would have 0.20 FTE support). Programs with community hospital employers had an 8% higher expectation of 1.0 FTE hours/year (P = .01) and viewed an appropriate pediatric morning census as 20% higher (P = .01; Table 2).
Program Sustainability
DISCUSSION
To our knowledge, this study is the first to describe clinical work models exclusively for pediatric community hospitalist programs. We found that expectations for clinical FTE hours, weekend coverage, appropriate morning census, support for nondirect patient care activities, and perception of sustainability varied broadly across programs. The only variable affecting some of these differences was employer model, with those employed by a community hospital employer having a higher expectation for hours/year and appropriate morning pediatric census than those employed by noncommunity hospital employers.
With a growing emphasis on physician burnout and career satisfaction,9-11 understanding the characteristics of community hospital work settings is critical for identifying and building sustainable employment models. Previous studies have identified that the balance of clinical and nonclinical responsibilities and the setting of community versus university-based programs are major contributors to burnout and career satisfaction.9,11 Interestingly, although community hospital-based programs have limited FTE for nondirect patient care activities, we found that a higher percentage of program site directors perceived their program models as sustainable when compared with university-based programs in prior research (63% versus 50%).6 Elucidating why community hospital PHM programs are perceived as more sustainable provides an opportunity for future research. Potential reasons may include fewer academic requirements for promotion or an increased connection to a local community.
We also found that the employer model had a statistically significant impact on expected FTE hours per year but not on perception of sustainability. Programs employed by community hospitals worked 8% more hours per year than those employed by noncommunity hospital employers and accepted a higher morning pediatric census. This variation in hours and census level appropriateness is likely multifactorial, potentially from higher nonclinical expectations for promotion (eg, academic or scholarly production) at school of medicine or children’s hospital employed programs versus limited reimbursement for administrative responsibilities within community hospital employment models.
There are several potential next steps for our findings. As our data are the first attempt (to our knowledge) at describing the current practice and expectations exclusively within community hospital programs, this study can be used as a starting point for the development of workload expectation standards. Increasing transparency nationally for individual community programs potentially promotes discussions around burnout and attrition. Having objective data to compare program models may assist in advocating with local hospital leadership for restructuring that better aligns with national norms.
Our study has several limitations. First, our sampling frame was based upon a self-selection of program directors. This may have led to a biased representation of programs with higher workloads motivated to develop a standard to compare with other programs, which may have potentially led to an overestimation of hours. Second, without a registry or database for community-based pediatric hospitalist programs, we do not know the percentage of community-based programs that our sample represents. Although our results cannot speak for all community PHM programs, we attempted to mitigate nonresponse bias through the breadth of programs represented, which spanned 29 states, five geographic regions, and teaching and nonteaching programs. The interview-based method for data collection allowed the research team to clarify questions and responses across sites, thereby improving the quality and consistency of the data for the represented study sample. Finally, other factors possibly contributed to sustainability that we did not address in this study, such as programs that are dependent on billable encounters as part of their salary support.
CONCLUSION
As a newly recognized subspecialty, creating a reference for community-based program leaders to determine and discuss individual models and expectations with hospital administrators may help address programmatic sustainability. It may also allow for the analysis of long-term career satisfaction and longevity within community PHM programs based on workload. Future studies should further explore root causes for workload discrepancies between community and university employed programs along with establishing potential standards for PHM program development.
Acknowledgments
We would like to thank the Stanford School of Medicine Quantitative Sciences Unit staff for their assistance in statistical analysis.
Disclosure
The authors have nothing to disclose.
1. Robert MW, Lee G. Zero to 50,000—The 20th anniversary of the hospitalist. N Engl J Med. 2016;375(11):1009-1011. https://doi.org/10.1056/NEJMp1607958.
2. Gosdin C, Simmons J, Yau C, Sucharew H, Carlson D, Paciorkowski N. Survey of academic pediatric hospitalist programs in the US: organizational, administrative, and financial factors. J Hosp Med. 2013;8(6):285-291. https://doi.org/10.1002/jhm.2020.
3. Paul DH, Jennifer D, Elizabeth R, et al. Proposed dashboard for pediatric hospital medicine groups. Hosp Pediatr. 2012;2(2):59-68. https://doi.org/10.1542/hpeds.2012-0004
4. Gary LF, Kathryn B, Kamilah N, Indu L. Characteristics of the pediatric hospitalist workforce: its roles and work environment. Pediatrics 2007;120(1):33-39. https://doi.org/10.1542/peds.2007-0304
5. Leyenaar JK, Frintner MP. Graduating pediatric residents entering the hospital medicine workforce. 2006-2015. Acad Pediatr. 2018;18(2):200-207. https://doi.org/10.1016/j.acap.2017.05.001.
6. Fromme HB, Chen CO, Fine BR, Gosdin C, Shaughnessy EE. Pediatric hospitalist workload and sustainability in university-based programs: results from a national interview-based survey. J Hosp Med. 2018;13(10):702-705. https://doi.org/10.12788/jhm.2977.
7. Leyenaar JK, Ralston SL, Shieh MS, Pekow PS, Mangione-Smith R, Lindenauer PK. Epidemiology of pediatric hospitalizations at general hospitals and freestanding children’s hospitals in the United States. J Hosp Med. 2016;11(11):743-749. https://doi.org/10.1002/jhm.2624.
8. Harris PA, Taylor R, Thielke R, Payne J, Gonzalez N, Conde JG. Research electronic data capture (REDCap)--a metadata-driven methodology and workflow process for providing translational research informatics support. J Biomed Inform. 2009;42(2):377-381. https://doi.org/10.1016/j.jbi.2008.08.010.
9. Laurie AP, Aisha BD, Mary CO. Association between practice setting and pediatric hospitalist career satisfaction. Hosp Pediatr. 2013;3(3):285-291. https://doi.org/10.1542/hpeds.2012-0085
10. Hinami K, Whelan CT, Wolosin RJ, Miller JA, Wetterneck TB. Worklife and satisfaction of hospitalists: toward flourishing careers. J Gen Intern Med. 2011;27(1):28-36. https://doi.org/10.1007/s11606-011-1780-z.
11. Hinami K, Whelan CT, Miller JA, Wolosin RJ, Wetterneck TB. Job characteristics, satisfaction, and burnout across hospitalist practice models. J Hosp Med. 2012;7(5):402-410. https://doi.org/10.1002/jhm.1907
As a newly recognized specialty, pediatric hospital medicine (PHM) continues to expand and diversify.1 Pediatric hospitalists care for children in hospitals ranging from small, rural community hospitals to large, free-standing quaternary children’s hospitals.2-4 In addition, more than 10% of graduating pediatric residents are seeking future careers within PHM.5
In 2018, Fromme et al. published a study describing clinical workload for pediatric hospitalists within university-based settings.6 They characterized the diversity of work models and programmatic sustainability but limited the study to university-based programs. With over half of children receiving care within community hospitals,7 workforce patterns for community-based pediatric hospitalists should be characterized to maximize sustainability and minimize attrition across the field.
In this study, we describe programmatic variability in clinical work expectations of 70 community-based PHM programs. We aimed to describe existing work models and expectations of community-based program leaders as they relate to their unique clinical setting.
METHODS
We conducted a cross-sectional survey of community-based PHM site directors through structured interviews. Community hospital programs were self-defined by the study participants, although typically defined as general hospitals that admit pediatric patients and are not free-standing or children’s hospitals within a general hospital. Survey respondents were asked to answer questions only reflecting expectations at their community hospital.
Survey Design and Content
Building from a tool used by Fromme et al.6 we created a 12-question structured interview questionnaire focused on three areas: (1) full-time employment (FTE) metrics including definitions of a 1.0 FTE, “typical” shifts, and weekend responsibilities; (2) work volume including census parameters, service-line coverage expectations, back-up systems, and overnight call responsibilities; and (3) programmatic model including sense of sustainability (eg, minimizing burnout and attrition), support for activities such as administrative or research time, and employer model (Appendix).
We modified the survey through research team consensus. After pilot-testing by research team members at their own sites, the survey was refined for item clarity, structural design, and length. We chose to administer surveys through phone interviews over a traditional distribution due to anticipated variability in work models. The research team discussed how each question should be asked, and responses were clarified to maintain consistency.
Survey Administration
Given the absence of a national registry or database for community-based PHM programs, study participation was solicited through an invitation posted on the American Academy of Pediatrics Section on Hospital Medicine (AAP SOHM) Listserv and the AAP SOHM Community Hospitalist Listserv in May 2018. Invitations were posted twice at two weeks apart. Each research team member completed 6-19 interviews. Responses to survey questions were recorded in REDCap, a secure, web-based data capture instrument.8
Participating in the study was considered implied consent, and participants did not receive a monetary incentive, although respondents were offered deidentified survey data for participation. The study was exempted through the University of Chicago Institutional Review Board.
Data Analysis
Employers were dichotomized as community hospital employer (including primary community hospital employment/private organization) or noncommunity hospital employer (including children’s/university hospital employment or school of medicine). Descriptive statistics were reported to compare the demographics of two employer groups. P values were calculated using two-sample t-tests for the continuous variables and chi-square or Fisher-exact tests for the categorical variables. Mann–Whitney U-test was performed for continuous variables without normality. Analyses were performed using the R Statistical Programming Language (R Foundation for Statistical Computing, Vienna, Austria), version 3.4.3.
RESULTS
Participation and Program Characteristics
We interviewed 70 community-based PHM site directors representing programs across 29 states (Table 1) and five geographic regions: Midwest (34.3%), Northeast (11.4%), Southeast (15.7%), Southwest (4.3%), and West (34.3%). Employer models varied across groups, with more noncommunity hospital employers (57%) than community hospital employers (43%). The top three services covered by pediatric hospitalists were pediatric inpatient or observation bed admissions (97%), emergency department consults (89%), and general newborns (67%). PHM programs also provided coverage for other services, including newborn deliveries (43%), Special Care Nursery/Level II Neonatal Intensive Care Unit (41%), step-down unit (20%), and mental health units (13%). About 59% of programs provided education for family medicine residents, 36% were for pediatric residents, and 70% worked with advanced practice providers. The majority of programs (70%) provided in-house coverage overnight.
Clinical Work Expectations and Employer Model
Clinical work expectations varied broadly across programs (Table 2). The median expected hours for a 1.0 FTE was 1,882 hours per year (interquartile range [IQR] 1,805, 2,016), and the median expected weekend coverage/year (defined as covering two days or two nights of the weekend) was 21 (IQR 14, 24). Most programs did not expand staff coverage based on seasonality (73%), and less than 20% of programs operated with a census cap. Median support for nondirect patient care activities was 4% (IQR 0,10) of a program’s total FTE (ie, a 5.0 FTE program would have 0.20 FTE support). Programs with community hospital employers had an 8% higher expectation of 1.0 FTE hours/year (P = .01) and viewed an appropriate pediatric morning census as 20% higher (P = .01; Table 2).
Program Sustainability
DISCUSSION
To our knowledge, this study is the first to describe clinical work models exclusively for pediatric community hospitalist programs. We found that expectations for clinical FTE hours, weekend coverage, appropriate morning census, support for nondirect patient care activities, and perception of sustainability varied broadly across programs. The only variable affecting some of these differences was employer model, with those employed by a community hospital employer having a higher expectation for hours/year and appropriate morning pediatric census than those employed by noncommunity hospital employers.
With a growing emphasis on physician burnout and career satisfaction,9-11 understanding the characteristics of community hospital work settings is critical for identifying and building sustainable employment models. Previous studies have identified that the balance of clinical and nonclinical responsibilities and the setting of community versus university-based programs are major contributors to burnout and career satisfaction.9,11 Interestingly, although community hospital-based programs have limited FTE for nondirect patient care activities, we found that a higher percentage of program site directors perceived their program models as sustainable when compared with university-based programs in prior research (63% versus 50%).6 Elucidating why community hospital PHM programs are perceived as more sustainable provides an opportunity for future research. Potential reasons may include fewer academic requirements for promotion or an increased connection to a local community.
We also found that the employer model had a statistically significant impact on expected FTE hours per year but not on perception of sustainability. Programs employed by community hospitals worked 8% more hours per year than those employed by noncommunity hospital employers and accepted a higher morning pediatric census. This variation in hours and census level appropriateness is likely multifactorial, potentially from higher nonclinical expectations for promotion (eg, academic or scholarly production) at school of medicine or children’s hospital employed programs versus limited reimbursement for administrative responsibilities within community hospital employment models.
There are several potential next steps for our findings. As our data are the first attempt (to our knowledge) at describing the current practice and expectations exclusively within community hospital programs, this study can be used as a starting point for the development of workload expectation standards. Increasing transparency nationally for individual community programs potentially promotes discussions around burnout and attrition. Having objective data to compare program models may assist in advocating with local hospital leadership for restructuring that better aligns with national norms.
Our study has several limitations. First, our sampling frame was based upon a self-selection of program directors. This may have led to a biased representation of programs with higher workloads motivated to develop a standard to compare with other programs, which may have potentially led to an overestimation of hours. Second, without a registry or database for community-based pediatric hospitalist programs, we do not know the percentage of community-based programs that our sample represents. Although our results cannot speak for all community PHM programs, we attempted to mitigate nonresponse bias through the breadth of programs represented, which spanned 29 states, five geographic regions, and teaching and nonteaching programs. The interview-based method for data collection allowed the research team to clarify questions and responses across sites, thereby improving the quality and consistency of the data for the represented study sample. Finally, other factors possibly contributed to sustainability that we did not address in this study, such as programs that are dependent on billable encounters as part of their salary support.
CONCLUSION
As a newly recognized subspecialty, creating a reference for community-based program leaders to determine and discuss individual models and expectations with hospital administrators may help address programmatic sustainability. It may also allow for the analysis of long-term career satisfaction and longevity within community PHM programs based on workload. Future studies should further explore root causes for workload discrepancies between community and university employed programs along with establishing potential standards for PHM program development.
Acknowledgments
We would like to thank the Stanford School of Medicine Quantitative Sciences Unit staff for their assistance in statistical analysis.
Disclosure
The authors have nothing to disclose.
1. Robert MW, Lee G. Zero to 50,000—The 20th anniversary of the hospitalist. N Engl J Med. 2016;375(11):1009-1011. https://doi.org/10.1056/NEJMp1607958.
2. Gosdin C, Simmons J, Yau C, Sucharew H, Carlson D, Paciorkowski N. Survey of academic pediatric hospitalist programs in the US: organizational, administrative, and financial factors. J Hosp Med. 2013;8(6):285-291. https://doi.org/10.1002/jhm.2020.
3. Paul DH, Jennifer D, Elizabeth R, et al. Proposed dashboard for pediatric hospital medicine groups. Hosp Pediatr. 2012;2(2):59-68. https://doi.org/10.1542/hpeds.2012-0004
4. Gary LF, Kathryn B, Kamilah N, Indu L. Characteristics of the pediatric hospitalist workforce: its roles and work environment. Pediatrics 2007;120(1):33-39. https://doi.org/10.1542/peds.2007-0304
5. Leyenaar JK, Frintner MP. Graduating pediatric residents entering the hospital medicine workforce. 2006-2015. Acad Pediatr. 2018;18(2):200-207. https://doi.org/10.1016/j.acap.2017.05.001.
6. Fromme HB, Chen CO, Fine BR, Gosdin C, Shaughnessy EE. Pediatric hospitalist workload and sustainability in university-based programs: results from a national interview-based survey. J Hosp Med. 2018;13(10):702-705. https://doi.org/10.12788/jhm.2977.
7. Leyenaar JK, Ralston SL, Shieh MS, Pekow PS, Mangione-Smith R, Lindenauer PK. Epidemiology of pediatric hospitalizations at general hospitals and freestanding children’s hospitals in the United States. J Hosp Med. 2016;11(11):743-749. https://doi.org/10.1002/jhm.2624.
8. Harris PA, Taylor R, Thielke R, Payne J, Gonzalez N, Conde JG. Research electronic data capture (REDCap)--a metadata-driven methodology and workflow process for providing translational research informatics support. J Biomed Inform. 2009;42(2):377-381. https://doi.org/10.1016/j.jbi.2008.08.010.
9. Laurie AP, Aisha BD, Mary CO. Association between practice setting and pediatric hospitalist career satisfaction. Hosp Pediatr. 2013;3(3):285-291. https://doi.org/10.1542/hpeds.2012-0085
10. Hinami K, Whelan CT, Wolosin RJ, Miller JA, Wetterneck TB. Worklife and satisfaction of hospitalists: toward flourishing careers. J Gen Intern Med. 2011;27(1):28-36. https://doi.org/10.1007/s11606-011-1780-z.
11. Hinami K, Whelan CT, Miller JA, Wolosin RJ, Wetterneck TB. Job characteristics, satisfaction, and burnout across hospitalist practice models. J Hosp Med. 2012;7(5):402-410. https://doi.org/10.1002/jhm.1907
© 2019 Society of Hospital Medicine
In Reply to: “Practical Application of Pediatric Hospital Medicine Workforce Data: In Reference to ‘Pediatric Hospitalist Workload and Sustainability in University-Based Programs: Results from a National Interview-Based Survey’”
We appreciate the query by Drs. Douglas and Wilson. We hereby supply additional information that is critical for creating and administering sustainable staffing models.
For programs with a census cap, the majority cited 16 or fewer patients as the trigger for that cap. Nearly all programs with back-up used a census of 16 or fewer. Over 80% of programs cited a “safe 7
Regarding clinical weighting of nights, nighttime shifts were often more heavily weighted than day shifts, but approaches to weighting varied and have not been validated. Alternate staffing models for overnight pager calls varied greatly by individual program.
This is a time of significant growth for pediatric hospital medicine, and national workforce data are essential to hospitalists, administrators, and most importantly, patients. Our study1 provides pediatric hospital medicine leaders with data for discussions regarding appropriate FTE and staffing model considerations. The insights generated by our study are particularly relevant in expanding programs and solving problems related to recruitment and retention.
Disclosures
The authors have nothing to disclose.
1. Fromme HB, Chen C, Fine B, Gosdin C, Shaughnessy E. Pediatric hospitalist workload and sustainability in university-based programs: Results from a national interview-based survey. J Hosp Med. 2018;13(10):702-705. PubMed
We appreciate the query by Drs. Douglas and Wilson. We hereby supply additional information that is critical for creating and administering sustainable staffing models.
For programs with a census cap, the majority cited 16 or fewer patients as the trigger for that cap. Nearly all programs with back-up used a census of 16 or fewer. Over 80% of programs cited a “safe 7
Regarding clinical weighting of nights, nighttime shifts were often more heavily weighted than day shifts, but approaches to weighting varied and have not been validated. Alternate staffing models for overnight pager calls varied greatly by individual program.
This is a time of significant growth for pediatric hospital medicine, and national workforce data are essential to hospitalists, administrators, and most importantly, patients. Our study1 provides pediatric hospital medicine leaders with data for discussions regarding appropriate FTE and staffing model considerations. The insights generated by our study are particularly relevant in expanding programs and solving problems related to recruitment and retention.
Disclosures
The authors have nothing to disclose.
1. Fromme HB, Chen C, Fine B, Gosdin C, Shaughnessy E. Pediatric hospitalist workload and sustainability in university-based programs: Results from a national interview-based survey. J Hosp Med. 2018;13(10):702-705. PubMed
1. Fromme HB, Chen C, Fine B, Gosdin C, Shaughnessy E. Pediatric hospitalist workload and sustainability in university-based programs: Results from a national interview-based survey. J Hosp Med. 2018;13(10):702-705. PubMed
© 2019 Society of Hospital Medicine
Pediatric Hospitalist Workload and Sustainability in University-Based Programs: Results from a National Interview-Based Survey
Pediatric hospital medicine (PHM) has grown tremendously since Wachter first described the specialty in 1996.1 Evidence of this growth is seen most markedly at the annual Pediatric Hospitalist Meeting, which has experienced an increase in attendance from 700 in 2013 to over 1,200 in 20172. Although the exact number of pediatric hospitalists in the United States is unknown, the American Academy of Pediatrics Section on Hospital Medicine (AAP SOHM) estimates that approximately 3,000-5,000 pediatric hospitalists currently practice in the country (personal communication).
As PHM programs have grown, variability has been reported in the roles, responsibilities, and workload among practitioners. Gosdin et al.3 reported large ranges and standard deviations in workload among full-time equivalents (FTEs) in academic PHM programs. However, this study’s ability to account for important nuances in program description was limited given that its data were obtained from an online survey.
Program variability, particularly regarding clinical hours and overall clinical burden (eg, in-house hours, census caps, and weekend coverage), is concerning given the well-reported increase in physician burn-out.4,5 Benchmarking data regarding the overall workload of pediatric hospitalists can offer nationally recognized guidance to assist program leaders in building successful programs. With this goal in mind, we sought to obtain data on university-based PHM programs to describe the current average workload for a 1.0 clinical FTE pediatric hospitalist and to assess the perceptions of program directors regarding the sustainability of the current workload.
METHODS
Study Design and Population
To obtain data with sufficient detail to compare programs, the authors, all of whom are practicing pediatric hospitalists at university-based programs, conducted structured interviews of PHM leaders in the United States. Given the absence of a single database for all PHM programs in the United States, the clinical division/program leaders of university-based programs were invited to participate through a post (with 2 reminders) to the AAP SOHM Listserv for PHM Division Leaders in May of 2017. To encourage participation, respondents were promised a summary of aggregate data. The study was exempted by the IRB of the University of Chicago.
Interview Content and Administration
The authors designed an 18-question structured interview regarding the current state of staffing in university-based PHM programs, with a focus on current descriptions of FTE, patient volume, and workload. Utilizing prior surveys3 as a basis, the authors iteratively determined the questions essential to understanding the programs’ current staffing models and ideal models. Considering the diversity of program models, interviews allowed for the clarification of questions and answers. A question regarding employment models was included to determine whether hospitalists were university-employed, hospital-employed, or a hybrid of the 2 modes of employment. The interview was also designed to establish a common language for work metrics (hours per year) for comparative purposes and to assess the perceived sustainability of the workload. Questions were provided in advance to provide respondents with sufficient time to collect data, thus increasing the accuracy of estimates. Respondents were asked, “Do you or your hospitalists have concerns about the sustainability of the model?” Sustainability was intentionally undefined to prevent limiting respondent perspective. For clarification, however, a follow-up comment that included examples was provided: “Faculty departures, reduction in total effort, and/or significant burn out.” The authors piloted the interview protocol by interviewing the division leaders of their own programs, and revisions were made based on feedback on feasibility and clarity. Finally, the AAP SOHM Subcommittee on Division Leaders provided feedback, which was incorporated.
Each author then interviewed 10-12 leaders (or designee) during May and June of 2017. Answers were recorded in REDCAP, an online survey and database tool that contains largely numeric data fields and has 1 field for narrative comments.
Data Analysis
Descriptive statistics were used to summarize interview responses, including median values with interquartile range. Data were compared between programs with models that were self-identified as either sustainable or unsustainable, with P-values in categorical variables from χ2-test or Fischer’s exact test and in continuous variables from Wilcoxon rank-sum test.
Spearman correlation coefficient was used to evaluate the association between average protected time (defined as the percent of funded time for nonclinical roles) and percentage working full-time clinical effort. It was also used to evaluate hours per year per 1.0 FTE and total weekends per year per 1.0 FTE and perceived sustainability. Linear regression was used to determine whether associations differed between groups identifying as sustainable versus unsustainable.
RESULTS
Participation and Program Characteristics
Administration
A wide variation was reported in the clinical time expected of a 1.0 FTE hospitalist. Clinical time for 1.0 FTE was defined as the amount of clinical service a full-time hospitalist is expected to complete in 12 months (Table 1). The median hours worked per year were 1800 (Interquartile range [IQR] 1620,1975; mean 1796). The median number of weekends worked per year was 15.0 (IQR 12.5, 21; mean 16.8). Only 30% of pediatric hospitalists were full-time clinicians, whereas the rest had protected time for nonclinical duties. The average amount of protected time was 20% per full-time hospitalist.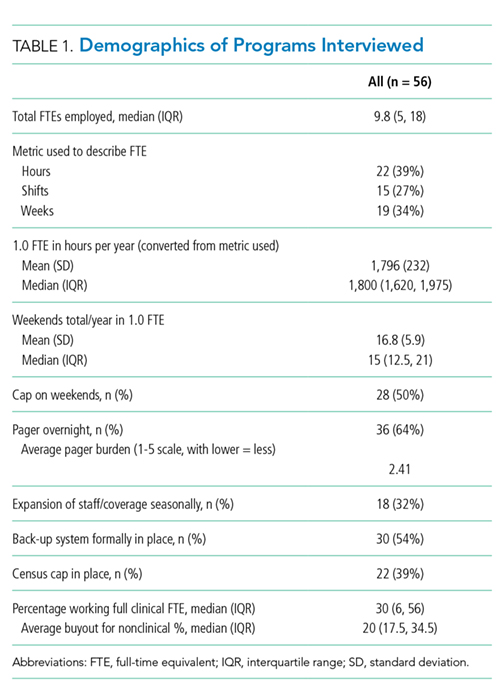
Sustainability and Ideal FTE
Half of the division leaders reported that they or their hospitalists have concerns about the sustainability of the current workload. Programs perceived as sustainable required significantly fewer weekends per year (13 vs. 16, P < .02; Table 2) than those perceived as unsustainable. University-employed programs were more likely to be perceived as unsustainable (64% unsustainable vs. 32% unsustainable, P < .048), whereas programs with other employment models were more likely to be perceived as sustainable (Table 2). 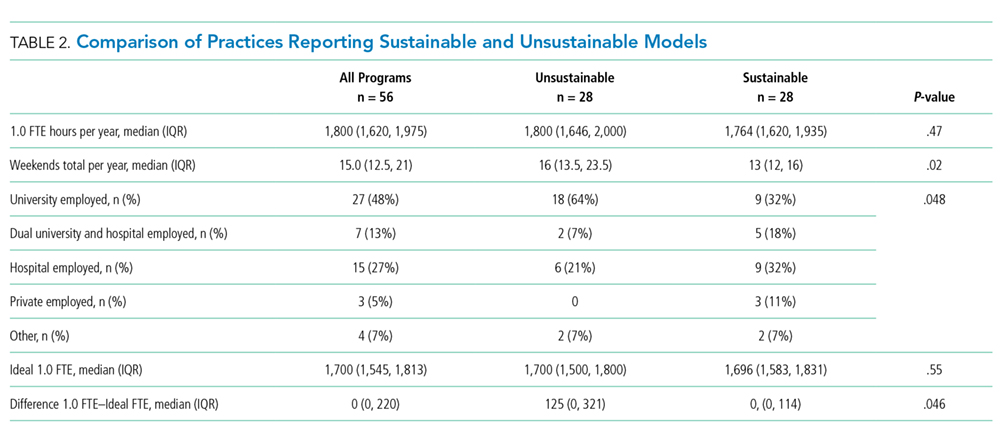
DISCUSSION
This study updates what has been previously reported about the structure and characteristics of university-based pediatric hospitalist programs.3 It also deepens our understanding of a relatively new field and the evolution of clinical coverage models. This evolution has been impacted by decreased resident work hours, increased patient complexity and acuity,6 and a broadened focus on care coordination and communication,7 while attempting to build and sustain a high-quality workforce.
This study is the first to use an interview-based method to determine the current PHM workload and to focus exclusively on university-based programs. Compared with the study by Gosdin et al,3 our study, which utilized interviews instead of surveys, was able to clarify questions and obtain workload data with a common language of hours per year. This approach allowed interviewees to incorporate subtleties, such as clinical vs. total FTE, in their responses. Our study found a slightly narrower range of clinical hours per year and extended the understanding of nonclinical duties by finding that university-based hospitalists have an average of 20% protected time from clinical duties.
In this study, we also explored the perceived sustainability of current clinical models and the ideal clinical model in hours per year. Half of respondents felt their current model was unsustainable. This result suggested that the field must continue to mitigate attrition and burnout.
Interestingly, the total number of clinical hours did not significantly differ in programs perceived to be unsustainable. Instead, a higher number of weekends worked and university employment were associated with lack of sustainability. We hypothesize that weekends have a disproportionate impact on work-life balance as compared with total hours, and that employment by a university may be a proxy for the increased academic and teaching demands of hospitalists without protected time. Future studies may better elucidate these findings and inform programmatic efforts to address sustainability.
Given that PHM is a relatively young field, considering the evolution of our clinical work model within the context of pediatric emergency medicine (PEM), a field that faces similar challenges in overnight and weekend staffing requirements, may be helpful. Gorelick et al.8 reported that total clinical work hours in PEM (combined academic and nonacademic programs) has decreased from 35.3 hours per week in 1998 to 26.7 in 2013. Extrapolating these numbers to an annual position with 5 weeks PTO/CME, the average PEM attending physician works 1254 clinical hours. These numbers demonstrate a marked difference compared with the average 1800 clinical work hours for PHM found in our study.
Although total hours trend lower in PEM, the authors noted continued challenges in sustainability with an estimated half of all PEM respondents indicating a plan to reduce hours or leave the field in the next 5 years and endorsing symptoms of burnout.6 These findings from PEM may motivate PHM leaders to be more aggressive in adjusting work models toward sustainability in the future.
Our study has several limitations. We utilized a convenience sampling approach that requires the voluntary participation of division directors. Although we had robust interest from respondents representing all major geographic areas, the respondent pool might conceivably over-represent those most interested in understanding and/or changing PHM clinical models. Overall, our sample size was smaller than that achieved by a survey approach. Nevertheless, this limitation was offset by controlling respondent type and clarifying questions, thus improving the quality of our obtained data.
CONCLUSION
This interview-based study of PHM directors describes the current state of clinical work models for university-based hospitalists. University-based PHM programs have similar mean and median total clinical hours per year. However, these hours are higher than those considered ideal by PHM directors, and many are concerned about the sustainability of current work models. Notably, programs that are university-employed or have higher weekends worked per year are more likely to be perceived as unsustainable. Future studies should explore differences between programs with sustainable work models and those with high levels of attrition and burnout.
Disclosures
The authors have no other conflicts to report.
Funding
A grant from the American Academy of Pediatrics Section on Hospital Medicine funded this study through the Subcommittee on Division and Program Leaders.
1. Wachter RM, Goldman L. The emerging role of “hospitalists” in the American health care system. N Engl J Med. 1996;335(7):514-517. DOI: 10.1056/NEJM199608153350713 PubMed
2. Chang W. Record Attendance, Key Issues Highlight Pediatric Hospital Medicine’s 10th Anniversary.
3. Gosdin C, Simmons J, Yau C, Sucharew H, Carlson D, Paciorkowski N. Survey of academic pediatric hospitalist programs in the US: organizational, administrative, and financial factors. J Hosp Med. 2013;8(6):285-291. DOI: 10.1002/jhm.2020. PubMed
4. Hinami K, Whelan CT, Wolosin RJ, Miller JA, Wetterneck TB. Worklife and satisfaction of hospitalists: toward flourishing careers. J Gen Intern Med. 2011;27(1):28-36. DOI: 10.1007/s11606-011-1780-z. PubMed
5. Hinami K, Whelan CT, Miller JA, Wolosin RJ, Wetterneck TB. Job characteristics, satisfaction, and burnout across hospitalist practice models. J Hosp Med. 2012;7(5):402-410. DOI: 10.1002/jhm.1907. PubMed
6. Barrett DJ, McGuinness GA, Cunha CA, et al. Pediatric hospital medicine: a proposed new subspecialty. Pediatrics. 2017;139(3):1-9. DOI: 10.1542/peds.2016-1823. PubMed
7. Cawley P, Deitelzweig S, Flores L, et al. The key principles and characteristics of an effective hospital medicine group: an assessment guide for hospitals and hospitalists. J Hosp Med. 2014;9(2):123-128. DOI: 10.1002/jhm.2119. PubMed
8. Gorelick MH, Schremmer R, Ruch-Ross H, Radabaugh C, Selbst S. Current workforce characteristics and burnout in pediatric emergency medicine. Acad Emerg Med. 2016;23(1):48-54. DOI: 10.1111/acem.12845. PubMed
Pediatric hospital medicine (PHM) has grown tremendously since Wachter first described the specialty in 1996.1 Evidence of this growth is seen most markedly at the annual Pediatric Hospitalist Meeting, which has experienced an increase in attendance from 700 in 2013 to over 1,200 in 20172. Although the exact number of pediatric hospitalists in the United States is unknown, the American Academy of Pediatrics Section on Hospital Medicine (AAP SOHM) estimates that approximately 3,000-5,000 pediatric hospitalists currently practice in the country (personal communication).
As PHM programs have grown, variability has been reported in the roles, responsibilities, and workload among practitioners. Gosdin et al.3 reported large ranges and standard deviations in workload among full-time equivalents (FTEs) in academic PHM programs. However, this study’s ability to account for important nuances in program description was limited given that its data were obtained from an online survey.
Program variability, particularly regarding clinical hours and overall clinical burden (eg, in-house hours, census caps, and weekend coverage), is concerning given the well-reported increase in physician burn-out.4,5 Benchmarking data regarding the overall workload of pediatric hospitalists can offer nationally recognized guidance to assist program leaders in building successful programs. With this goal in mind, we sought to obtain data on university-based PHM programs to describe the current average workload for a 1.0 clinical FTE pediatric hospitalist and to assess the perceptions of program directors regarding the sustainability of the current workload.
METHODS
Study Design and Population
To obtain data with sufficient detail to compare programs, the authors, all of whom are practicing pediatric hospitalists at university-based programs, conducted structured interviews of PHM leaders in the United States. Given the absence of a single database for all PHM programs in the United States, the clinical division/program leaders of university-based programs were invited to participate through a post (with 2 reminders) to the AAP SOHM Listserv for PHM Division Leaders in May of 2017. To encourage participation, respondents were promised a summary of aggregate data. The study was exempted by the IRB of the University of Chicago.
Interview Content and Administration
The authors designed an 18-question structured interview regarding the current state of staffing in university-based PHM programs, with a focus on current descriptions of FTE, patient volume, and workload. Utilizing prior surveys3 as a basis, the authors iteratively determined the questions essential to understanding the programs’ current staffing models and ideal models. Considering the diversity of program models, interviews allowed for the clarification of questions and answers. A question regarding employment models was included to determine whether hospitalists were university-employed, hospital-employed, or a hybrid of the 2 modes of employment. The interview was also designed to establish a common language for work metrics (hours per year) for comparative purposes and to assess the perceived sustainability of the workload. Questions were provided in advance to provide respondents with sufficient time to collect data, thus increasing the accuracy of estimates. Respondents were asked, “Do you or your hospitalists have concerns about the sustainability of the model?” Sustainability was intentionally undefined to prevent limiting respondent perspective. For clarification, however, a follow-up comment that included examples was provided: “Faculty departures, reduction in total effort, and/or significant burn out.” The authors piloted the interview protocol by interviewing the division leaders of their own programs, and revisions were made based on feedback on feasibility and clarity. Finally, the AAP SOHM Subcommittee on Division Leaders provided feedback, which was incorporated.
Each author then interviewed 10-12 leaders (or designee) during May and June of 2017. Answers were recorded in REDCAP, an online survey and database tool that contains largely numeric data fields and has 1 field for narrative comments.
Data Analysis
Descriptive statistics were used to summarize interview responses, including median values with interquartile range. Data were compared between programs with models that were self-identified as either sustainable or unsustainable, with P-values in categorical variables from χ2-test or Fischer’s exact test and in continuous variables from Wilcoxon rank-sum test.
Spearman correlation coefficient was used to evaluate the association between average protected time (defined as the percent of funded time for nonclinical roles) and percentage working full-time clinical effort. It was also used to evaluate hours per year per 1.0 FTE and total weekends per year per 1.0 FTE and perceived sustainability. Linear regression was used to determine whether associations differed between groups identifying as sustainable versus unsustainable.
RESULTS
Participation and Program Characteristics
Administration
A wide variation was reported in the clinical time expected of a 1.0 FTE hospitalist. Clinical time for 1.0 FTE was defined as the amount of clinical service a full-time hospitalist is expected to complete in 12 months (Table 1). The median hours worked per year were 1800 (Interquartile range [IQR] 1620,1975; mean 1796). The median number of weekends worked per year was 15.0 (IQR 12.5, 21; mean 16.8). Only 30% of pediatric hospitalists were full-time clinicians, whereas the rest had protected time for nonclinical duties. The average amount of protected time was 20% per full-time hospitalist.
Sustainability and Ideal FTE
Half of the division leaders reported that they or their hospitalists have concerns about the sustainability of the current workload. Programs perceived as sustainable required significantly fewer weekends per year (13 vs. 16, P < .02; Table 2) than those perceived as unsustainable. University-employed programs were more likely to be perceived as unsustainable (64% unsustainable vs. 32% unsustainable, P < .048), whereas programs with other employment models were more likely to be perceived as sustainable (Table 2).
DISCUSSION
This study updates what has been previously reported about the structure and characteristics of university-based pediatric hospitalist programs.3 It also deepens our understanding of a relatively new field and the evolution of clinical coverage models. This evolution has been impacted by decreased resident work hours, increased patient complexity and acuity,6 and a broadened focus on care coordination and communication,7 while attempting to build and sustain a high-quality workforce.
This study is the first to use an interview-based method to determine the current PHM workload and to focus exclusively on university-based programs. Compared with the study by Gosdin et al,3 our study, which utilized interviews instead of surveys, was able to clarify questions and obtain workload data with a common language of hours per year. This approach allowed interviewees to incorporate subtleties, such as clinical vs. total FTE, in their responses. Our study found a slightly narrower range of clinical hours per year and extended the understanding of nonclinical duties by finding that university-based hospitalists have an average of 20% protected time from clinical duties.
In this study, we also explored the perceived sustainability of current clinical models and the ideal clinical model in hours per year. Half of respondents felt their current model was unsustainable. This result suggested that the field must continue to mitigate attrition and burnout.
Interestingly, the total number of clinical hours did not significantly differ in programs perceived to be unsustainable. Instead, a higher number of weekends worked and university employment were associated with lack of sustainability. We hypothesize that weekends have a disproportionate impact on work-life balance as compared with total hours, and that employment by a university may be a proxy for the increased academic and teaching demands of hospitalists without protected time. Future studies may better elucidate these findings and inform programmatic efforts to address sustainability.
Given that PHM is a relatively young field, considering the evolution of our clinical work model within the context of pediatric emergency medicine (PEM), a field that faces similar challenges in overnight and weekend staffing requirements, may be helpful. Gorelick et al.8 reported that total clinical work hours in PEM (combined academic and nonacademic programs) has decreased from 35.3 hours per week in 1998 to 26.7 in 2013. Extrapolating these numbers to an annual position with 5 weeks PTO/CME, the average PEM attending physician works 1254 clinical hours. These numbers demonstrate a marked difference compared with the average 1800 clinical work hours for PHM found in our study.
Although total hours trend lower in PEM, the authors noted continued challenges in sustainability with an estimated half of all PEM respondents indicating a plan to reduce hours or leave the field in the next 5 years and endorsing symptoms of burnout.6 These findings from PEM may motivate PHM leaders to be more aggressive in adjusting work models toward sustainability in the future.
Our study has several limitations. We utilized a convenience sampling approach that requires the voluntary participation of division directors. Although we had robust interest from respondents representing all major geographic areas, the respondent pool might conceivably over-represent those most interested in understanding and/or changing PHM clinical models. Overall, our sample size was smaller than that achieved by a survey approach. Nevertheless, this limitation was offset by controlling respondent type and clarifying questions, thus improving the quality of our obtained data.
CONCLUSION
This interview-based study of PHM directors describes the current state of clinical work models for university-based hospitalists. University-based PHM programs have similar mean and median total clinical hours per year. However, these hours are higher than those considered ideal by PHM directors, and many are concerned about the sustainability of current work models. Notably, programs that are university-employed or have higher weekends worked per year are more likely to be perceived as unsustainable. Future studies should explore differences between programs with sustainable work models and those with high levels of attrition and burnout.
Disclosures
The authors have no other conflicts to report.
Funding
A grant from the American Academy of Pediatrics Section on Hospital Medicine funded this study through the Subcommittee on Division and Program Leaders.
1. Wachter RM, Goldman L. The emerging role of “hospitalists” in the American health care system. N Engl J Med. 1996;335(7):514-517. DOI: 10.1056/NEJM199608153350713 PubMed
2. Chang W. Record Attendance, Key Issues Highlight Pediatric Hospital Medicine’s 10th Anniversary.
3. Gosdin C, Simmons J, Yau C, Sucharew H, Carlson D, Paciorkowski N. Survey of academic pediatric hospitalist programs in the US: organizational, administrative, and financial factors. J Hosp Med. 2013;8(6):285-291. DOI: 10.1002/jhm.2020. PubMed
4. Hinami K, Whelan CT, Wolosin RJ, Miller JA, Wetterneck TB. Worklife and satisfaction of hospitalists: toward flourishing careers. J Gen Intern Med. 2011;27(1):28-36. DOI: 10.1007/s11606-011-1780-z. PubMed
5. Hinami K, Whelan CT, Miller JA, Wolosin RJ, Wetterneck TB. Job characteristics, satisfaction, and burnout across hospitalist practice models. J Hosp Med. 2012;7(5):402-410. DOI: 10.1002/jhm.1907. PubMed
6. Barrett DJ, McGuinness GA, Cunha CA, et al. Pediatric hospital medicine: a proposed new subspecialty. Pediatrics. 2017;139(3):1-9. DOI: 10.1542/peds.2016-1823. PubMed
7. Cawley P, Deitelzweig S, Flores L, et al. The key principles and characteristics of an effective hospital medicine group: an assessment guide for hospitals and hospitalists. J Hosp Med. 2014;9(2):123-128. DOI: 10.1002/jhm.2119. PubMed
8. Gorelick MH, Schremmer R, Ruch-Ross H, Radabaugh C, Selbst S. Current workforce characteristics and burnout in pediatric emergency medicine. Acad Emerg Med. 2016;23(1):48-54. DOI: 10.1111/acem.12845. PubMed
© 2018 Society of Hospital Medicine
Survey of Academic PHM Programs in the US
Pediatric hospital medicine (PHM) is a relatively new field that has been growing rapidly over the past 20 years.[1] The field has been increasingly recognized for its contributions to high‐quality patient care, patient safety, systems improvement, medical education, and research.[2, 3, 4, 5, 6, 7, 8, 9] However, there appears to be significant variation among programs, even in basic factors such as how clinical effort is defined, the extent of in‐house coverage provided, and the scope of clinical services provided, and there exists a paucity of data describing these variations.[8]
Most previously published work did not specifically focus on academic programs,[2, 3, 8, 9] and specifically targeted hospital leadership,[2] practicing hospitalists,[3] residents,[7] and pediatric residency or clerkship directors,[4, 7] rather than hospitalist directors.[9] Furthermore, previous work focused on specific aspects of PHM programs such as education,[4, 7] value,[2] work environment,[9] and clinical practice,[3] rather than a more comprehensive approach.
We conducted a survey of academic PHM programs to learn about the current state and variation among programs across multiple domains (organizational, administrative, and financial). We speculated that:
- Many institutions currently lacking an academic PHM program were planning on starting a program in the next 3 years.
- Variability exists in hospitalist workload among programs.
- In programs providing clinical coverage at more than 1 site, variability exists in the relationship between the main site and satellite site(s) in terms of decision making, scheduling, and reporting of performance.
METHODS
Sample
We used the online American Medical Association Fellowship and Residency Electronic Interactive Database (FREIDA) to identify all 198 accredited pediatric residency training programs in the United States. A total of 246 hospitals were affiliated with these programs, and all of these were targeted for the survey. In addition, academic PHM program leaders were targeted directly with email invitations through the American Academy of Pediatrics (AAP) Section on Hospital Medicine LISTSERV.
Survey Instrument
A 49‐question online survey on the administrative, organizational, and financial aspects of academic PHM programs was developed with the input of academic PHM hospital leaders from Cincinnati Children's Hospital Medical Center and St. Louis Children's Hospital. First, the survey questions were developed de novo by the researchers. Then, multiple hospitalist leaders from each institution took the survey and gave feedback on content and structure. Using this feedback, changes were made and then tested by the leaders taking the new version of the survey. This process was repeated for 3 cycles until consensus was reached by the researchers on the final version of the survey. The survey contained questions that asked if the program provided coverage at a single site or at multiple sites and utilized a combination of open‐ended and fixed‐choice questions. For some questions, more than 1 answer was permitted. For the purposes of this survey, we utilized the following definitions adapted from the Society of Hospital Medicine. A hospitalist was defined as a physician who specializes in the practice of hospital medicine.[10] An academic PHM program was defined as any hospitalist practice associated with a pediatric residency program.[11] A nocturnist was defined as a hospitalist who predominantly works a schedule providing night coverage.[12]
Survey Administration
SurveyMonkey, an online survey software, was used to administer the survey. In June 2011, letters were mailed to all 246 hospitals affiliated with an accredited pediatric residency program as described above. These were addressed to either the hospital medicine director (if identified using the institutions Web site) or pediatric residency director. The letter asked the recipient to either participate in the survey or forward the survey to the physician best able to answer the survey. The letters included a description of the study and a link to the online survey. Of note, there was no follow‐up on this process. We also distributed the direct link to the survey and a copy of the letter utilizing the AAP Section on Hospital Medicine LISTSERV. Two reminders were sent through the LISTSERV in the month after the initial request. All respondents were informed that they would receive the deidentified raw data as an incentive to participate in the survey. Respondents were defined as those answering the first question, Does your program have an academic hospitalist program?
Statistical Analysis
Completed survey responses were extracted to Microsoft Excel (Microsoft Corp., Redmond, WA) for data analysis. Basic statistics were utilized to determine response rates for each question. Data were stratified for program type (single site or at multiple sites). For some questions, data were further stratified for the main site of multiple‐site programs for comparison to single‐site programs. In a few instances, more than 1 physician from a particular program responded to the survey. For these, the most appropriate respondent (PHM director, residency director, senior hospitalist) was identified utilizing the programs' publicly available Web site; only that physician's answers were used in the analysis.
Human Subjects Protection
This study was determined to be exempt from review by the Cincinnati Children's Hospital Medical Center and Washington University in St. Louis institutional review boards. All potential responders received written information about the survey. Survey design allowed for anonymous responses with voluntary documentation of program name and responders' contact information. The willingness to respond was qualified as implied consent. Data were deidentified prior to analysis and prior to sharing with the survey participants.
RESULTS
Response Rates
A total of 133 responses were received. Duplicate responses from the same program (13/133) were eliminated from the analysis. This yielded an overall response rate of 48.8% (120/246). A total of 81.7% (98/120) of institutions reported having an academic PHM program. Of the 18.3% (22/120) of institutions reporting not having a program, 9.1% (2/22) reported planning on starting a program in the next 3 years. Of the 98 respondents with an academic PHM program, 17 answered only the first survey question, Does your program have an academic hospitalist program? The remaining 81 completed surveys were left for further analysis. All of these respondents identified their program, and therefore we are certain that there were no duplicate responses in the analytic dataset. Of these, 23 (28%) indicated that their programs provided clinical care at multiple sites, and 58 (72%) indicated that their program provided care at a single site (Figure 1).

Administrative
Respondents reported wide variation for the definition of a 1.0 full‐time employee (FTE) hospitalist in their group. This included the units used (hours/year, weeks/year, shifts/year) as well as actual physician workload (Table 1). Weeks/year was the most common unit utilized by programs to define workload (66% of single‐site programs, 48% of multiple‐site programs), followed by hours/year (19%, 22%) and shifts/year (14%, 22%). The mean and median workload per FTE is represented (Table 1). The large ranges and the standard deviations from the mean indicate variability in workload per FTE (Table 1).
| Single‐Site Program | Multiple‐Site Programs | |||||||||
|---|---|---|---|---|---|---|---|---|---|---|
| % Programs | Mean | Median | SD | Range | % Programs | Mean | Median | SD | Range | |
| ||||||||||
| Weeks on service | 66 | 27.14 | 26 | 8.1 | 1246 | 48 | 27.2 | 24 | 9.6 | 1736 |
| Hours/year | 19 | 1886.25 | 1880 | 231.2 | 16002300 | 22 | 1767.33 | 1738 | 109.0 | 16641944 |
| Shifts/year* | 14 | 183 | 191 | 52.2 | 182240 | 22 | 191 | 184 | 38.3 | 155214 |
Scheduled in‐house hospitalist coverage also varied. Daytime coverage was defined as until 3 to 5 pm, evening coverage was defined a until 10 pm to midnight, and 24‐hour coverage was defined a 24/7. Programs reported plans to increase in‐house coverage with the implementation of the 2011 Accreditation Council for Graduate Medical Education (ACGME) resident work hours restrictions.[13] Among single‐site programs, there was a planned 50% increase in day/evening coverage (14% to 21%), with a planned decrease in day‐only coverage, and no change in 24/7 coverage (Table 2). Among the main sites of multiple‐site programs, there was a planned 50% increase in 24/7 in‐house coverage (35% to 52%), with a planned decrease in day‐only coverage, and no change in day/evening coverage (Table 3). Among the satellite sites of multiple‐site programs, there was a planned 9% increase in 24/7 coverage (41% to 50%), with a planned decrease in day‐only coverage, and no change in day/evening coverage (Table 2). Most programs reported that all hospitalists share night coverage (87% single site, 89% multiple sites) (Table 2). Multiple‐site programs were more likely than single‐site programs to use nocturnists, moonlighters, and incentives for those providing evening or night coverage (Table 2).
| Single Site (n=58) | Main Site of Multiple‐Site Programs (n=23) | |||
|---|---|---|---|---|
| Proportion | Response Rate | Proportion | Response Rate | |
| ||||
| Organizational | ||||
| Night shifts | .79 (46/58) | .83 (19/23) | ||
| All share nights | .87 (40/46) | .89 (17/19) | ||
| Nocturnists | .09 (4/46) | .26 (5/19) | ||
| Moonlighters | .04 (2/46) | .12 (2/19) | ||
| Night shift incentives | .74 (43/58) | .78 (18/23) | ||
| Financial | .12 (5/43) | .28 (5/18) | ||
| Time | .12 (5/43) | .22 (4/18) | ||
| No incentives | .79 (34/43) | .61 (11/18) | ||
| In‐house hospitalist coverage pre July 2011a | 1.0 (58/58) | 1.0 (23/23) | ||
| 24/7 | .29 (17/58) | .35 (8/23) | ||
| Day and evening | .14 (8/58) | .17 (4/23) | ||
| Day only | .57 (33/58) | .48 (11/23) | ||
| In‐house hospitalist coverage post July 2011a | 1.0 (58/58) | 1.0 (23/23) | ||
| 24/7 | .29 (17/58) | .52 (12/23) | ||
| Day and evening | .21 (12/58) | .17 (4/23) | ||
| Day only | .50 (29/58) | .30 (7/23) | ||
| Administrative | ||||
| Own division | .32 (18/57) | .98 (57/58) | .74 (17/23) | 1.0 (23/23) |
| Part of another division | .68 (39/57) | .26 (6/23) | ||
| Financial | ||||
| Revenues>expenses | .26 (14/53) | .91 (53/58) | .04 (1/23) | .04 (19/23) |
| Incentives supplement base salary | .45 (25/55) | .95 (55/58) | .48 (10/21) | .91 (21/23) |
| Metrics used to determine incentivesb | .47 (27/58) | .52 (12/23) | ||
| RVUs/MD | .85 (23/27) | .83 (10/12) | ||
| Costs/discharge | .19 (5/27) | .08 (1/12) | ||
| Financial reportingb | .81 (47/58) | .04 (19/23) | ||
| Charges | .64 (30/47) | .68 (13/19) | ||
| Collections | .66 (31/47) | .68 (13/19) | ||
| RVUs | .77 (36/47) | .47 (9/19) | ||
| Main Site (n=23) | Satellite Sites (n=51) | |||
|---|---|---|---|---|
| Proportion | Response Rate | Proportion | Response Rate | |
| In‐house hospitalist coverage pre July 2011 | 1.0 (23/23) | .80 (41/51) | ||
| 24/7 | .35 (8/23) | .41 (17/41) | ||
| Day and evening | .17 (4/23) | .10 (4/41) | ||
| Day only | .48 (11/23) | .49 (20/41) | ||
| In‐house hospitalist coverage post July 2011 | 1.0 (23/23) | |||
| 24/7 | .52 (12/23) | .50 (19/38) | .75 (38/51) | |
| Day and evening | .17 (4/23) | .11 (4/38) | ||
| Day only | .30 (7/23) | .39 (15/38) | ||
| Night shift coverage | .83 (19/23) | .78 (18/23) | ||
| All share nights | .89 (17/19) | .94 (17/18) | ||
| Nocturnists | .26 (5/19) | .22 (4/18) | ||
| Moonlighters | .12 (2/19) | .17 (3/18) | ||
The vast majority of multiple‐site programs reported that their different clinical sites are considered parts of a single hospitalist program (96%), and that there is a designated medical director for each site (83%). However, only 70% of multiple‐site programs report that decisions concerning physician coverage are made as a group, and only 65% report that scheduling is done centrally. In addition, there is variability in how quality, safety, and patient satisfaction is reported (group vs site). The majority of programs report sharing revenues and expenses among the sites (Table 4).
| Proportion | Response Rate | |
|---|---|---|
| Sites regularly collaborate on: | 1.0 (23/23) | |
| Quality improvement projects | .74 (17/23) | |
| Safety initiatives | .74 (17/23) | |
| Research | .48 (11/23) | |
| Have a designated hospitalist medical director for each site | .83 (19/23) | 1.0 (23/23) |
| Different sites considered parts of a single hospitalist program | .96 (22/23) | 1.0 (23/23) |
| Make decisions on program/coverage/hour changes as a group | .70 (16/23) | 1.0 (23/23) |
| Scheduling done centrally | .65 (15/23) | 1.0 (23/23) |
| Report or track the following as individual sites: | ||
| Quality measures | .43 (9/21) | .91 (21/23) |
| Safety measures | .48 (10/21) | .91 (21/23) |
| Patient satisfaction | .50 (10/20) | .87 (20/23) |
| Report or track the following as a group: | ||
| Quality measures | .33 (7/21) | .91 (21/23) |
| Safety measures | .33 (7/21) | .91 (21/23) |
| Patient satisfaction | .30 (6/20) | .87 (20/23) |
| Report or track the following as both individual sites and as a group: | ||
| Quality measures | .24 (5/21) | .91 (21/23) |
| Safety measures | .19 (4/21) | .91 (21/23) |
| Patient satisfaction | .25 (4/20) | .87 (20/23) |
| Sites share revenues and expenses | .67 (14/21) | .91 (21/23) |
Organizational
Of the single‐site programs that answered the question Is your hospital medicine program considered its own division or a section within another division? 32% reported that their programs were considered its own division, and 68% reported that they were a part of another division, predominately (62%) general pediatrics, but also a few (6% combined) within emergency medicine, critical care, physical medicine and rehabilitation, and infectious diseases. Of the multiple‐site programs, a majority of 74% programs were their own division, and 26% were part of another division (Table 2). Respondents reported that their satellite sites included pediatric units in small community hospitals, small pediatric hospitals, large nonpediatric hospitals with pediatric units, rehabilitation facilities, and Shriner orthopedic hospitals.
Financial
Of the single‐site programs that answered the question Do patient revenues produced by your hospitalist group cover all expenses? only 26% reported that revenues exceeded expenses. Of the multiple‐site programs responding to this question, only 4% reported that the main site of their programs had revenues greater than expenses (Table 2). Programs used a combination of metrics to report revenue, and relative value unit (RVU)/medical doctor (MD) is the most commonly used metric to determine incentive pay (Table 2).
DISCUSSION
Our study demonstrates that academic PHM programs are common, which is consistent with previous data.[4, 7, 9, 14] The data support our belief that more institutions are planning on starting PHM programs. However, there exist much variability in a variety of program factors.[2, 3, 8, 9, 14] The fact that up to 35% of categorical pediatric residents are considering a career as a hospitalist further highlights the need for better data on PHM programs.[7]
We demonstrated that variability existed in hospitalist workload at academic PHM programs. We found considerable variation in the workload per hospitalist (large ranges and standard deviations), as well as variability in how an FTE is defined (hours/year, weeks/year, shifts/year) (Table 1). In addition, survey respondents might have interpreted certain questions differently, and this might have led to increased variability in the data. For example, the question concerning the definition of an FTE was worded as A clinical FTE is defined as. Some of the reported variation in workload might be partially explained by hospitalists having additional nonclinical responsibilities within hospital medicine or another field, including protected time for quality improvement, medical education, research, or administrative activities. Furthermore, some hospitalists might have clinical responsibilities outside of hospital medicine. Given that most PHM programs lack a formal internal definition of what it means to be a hospitalist,[7] it is not surprising to find such variation between programs. The variability in the extent of in‐house coverage provided by academic PHM programs, as well as institutional plans for increased coverage with the 2011 residency work‐hours restrictions is also described, and is consistent with other recently published data.[14] This is likely to continue, as 70% of academic PHM programs reported an anticipated increase in coverage in the near future,[14] suggesting that academic hospitalists are being used to help fill gaps in coverage left by changes in resident staffing.
Our data describe the percentage of academic programs that have a distinct division of hospital medicine. The fact that multisite programs were more likely to report being a distinct division might reflect the increased complexities of providing care at more than 1 site, requiring a greater infrastructure. This might be important in institutional planning as well as academic and financial expectations of academic pediatric hospitalists.
We also demonstrated that programs with multiple sites differ as far as the degree of integration of the various sites, with variation reported in decision making, scheduling, and how quality, safety, and patient satisfaction are reported (Table 4). Whether or not increased integration between the various clinical sites of a multiple‐site program is associated with better performance and/or physician satisfaction are questions that need to be answered. However, academic PHM directors would likely agree that there are great challenges inherent in managing these programs. These challenges include professional integration (do hospitalists based at satellite sites feel that they are academically supported?), clinical work/expectations (fewer resources and fewer learners at satellite sites likely affects workload), and administrative issues (physician scheduling likely becomes more complex as the number of sites increases). As programs continue to grow and provide clinical services in multiple geographic sites, it will become more important to understand how the different sites are coordinated to identify and develop best practices.
Older studies have described that the majority of PHM programs (70%78%) reported that professional revenues do not cover expenses, unfortunately these results were not stratified for program type (academic vs community).[2, 9]
Our study describes that few academic PHM programs (26% of single site, 4% of multiple‐site programs) report revenues (defined in our survey as only the collections from professional billing) in excess of expenses. This is consistent with prior studies that have included both academic and community PHM programs.[2] Therefore, it appears to be common for PHM programs to require institutional funding to cover all program expenses, as collections from professional billing are not generally adequate for this purpose. We believe that this is a critical point for both hospitalists and administrators to understand. However, it is equally important that they be transparent about the importance and value of the nonrevenue‐generating work performed by PHM programs. It has been reported that the vast majority of pediatric hospitalists are highly involved in education, quality improvement work, practice guideline development, and other work that is vitally important to institutions.[3] Furthermore, although one might expect PHM leaders to believe that their programs add value beyond the professional revenue collected,[9] even hospital leadership has been reported to perceive that PHM programs add value in several ways, including increased patient satisfaction (94%), increased referring MD satisfaction (90%), decreased length of stay (81%), and decreased costs (62%).[2] Pediatric residency and clerkship directors report that pediatric hospitalists are more accessible than other faculty (84% vs 64%) and are associated with an increase in the practice of evidence‐based medicine (76% vs 61%).[4] Therefore, there is strong evidence supporting that pediatric hospitalist programs provide important value that is not evident on a balance sheet.
In addition, our data also indicate that programs currently use a variety of metrics in combination to report productivity, and there is no accepted gold standard for measuring the performance of a hospitalist or hospitalist program (Table 2). Given that hospitalists generally cannot control how many patients they see, and given the fact that hospitalists are strongly perceived to provide value to their institutions beyond generating clinical revenue, metrics such as RVUs and charges likely do not accurately represent actual productivity.[2] Furthermore, it is likely that the metrics currently used underestimate actual productivity as they are not designed to take into account confounding factors that might affect hospitalist productivity. For example, consider an academic hospitalist who has clinical responsibilities divided between direct patient care and supervisory patient care (such as a team with some combination of residents, medical students, and physician extenders). When providing direct patient care, the hospitalist is likely responsible or all of the tasks usually performed by residents, including writing all patient notes and prescriptions, all communication with families, nurses, specialists, and primary care providers; and discharge planning. Conversely, when providing supervisory care, it is likely that the tasks are divided among the team members, and the hospitalist has the additional responsibility for providing teaching. However, the hospitalist might be responsible for more complex and acute patients. These factors are not adequately measured by RVUs or professional billing. Furthermore, these metrics do not capture the differences in providing in‐house daytime versus evening/night coverage, and do not measure the work performed while being on call when outside of the hospital. It is important for PHM programs and leaders to develop a better representation of the value provided by hospitalists, and for institutional leaders to understand this value, because previous work has suggested that the majority of hospital leaders do not plan to phase out the subsidy of hospitalists over time, as they do not anticipate the program(s) will be able to covercosts.[2] Given the realities of decreasing reimbursement and healthcare reform, it is unlikely to become more common for PHM programs to generate enough professional revenue to cover expenses.
The main strength of this descriptive study is the comprehensive nature of the survey, including many previously unreported data. In addition, the data are consistent with previously published work, which validates the quality of the data.
This study has several limitations including a low response rate and the exclusion of some hospitals or programs because they provided insufficient data for analysis. However, a post hoc analysis demonstrated that the majority of the institutions reporting that they did not have an academic PHM program (18/22), and those that were excluded due to insufficient data (12/17) were either smaller residency programs (<60 residents) or hospitals that were not the main site of a residency program. Therefore, our data likely are a good representation of academic PHM programs at larger academic institutions. Another potential weakness is that, although PHM program directors and pediatric residency directors were targeted, the respondent might not have been the person with the best knowledge of the program, which could have produced inaccurate data, particularly in terms of finances. However, the general consistency of our findings with previous work, particularly the high percentage of institutions with academic PHM programs,[4, 7, 9, 14] the low percentage of programs with revenues greater than expenses,[2, 9] and the trend toward increased in‐house coverage associated with the 2011 ACGME work‐hour restrictions,[14] supports the validity of our other results. In addition, survey respondents might have interpreted certain questions differently, specifically the questions concerning the definition of an FTE, and this might have led to increased variability in the data.
CONCLUSIONS
Academic PHM programs exist in the vast majority of academic centers, and more institutions are planning on starting programs in the next few years. There appears to be variability in a number of program factors, including hospitalist workload, in‐house coverage, and whether the program is a separate division or a section within another academic division. Many programs are currently providing care at more than 1 site. Programs uncommonly reported that their revenues exceeded their expenses. These data are the most comprehensive data existing for academic PHM programs.
Acknowledgment
Disclosure: Nothing to report.
- . Pediatric hospital medicine: historical perspectives, inspired future. Curr Probl Pediatr Adolesc Health Care. 2012;42(5):107–112.
- , , . Assessing the value of pediatric hospitalist programs: the perspective of hospital leaders. Acad Pediatr. 2009;9(3):192–196.
- , . Pediatric hospitalists: training, current practice, and career goals. J Hosp Med. 2009;4(3):179–186.
- , , . Hospitalists' involvement in pediatrics training: perspectives from pediatric residency program and clerkship directors. Acad Med. 2009;84(11):1617–1621.
- , . Research in pediatric hospital medicine: how research will impact clinical care. Curr Probl Pediatr Adolesc Health Care. 2012;42(5):127–130.
- , . Pediatric hospitalists in medical education: current roles and future directions. Curr Probl Pediatr Adolesc Health Care. 2012;42(5):120–126.
- , , , , . Pediatric hospitalists' influences on education and career plans. J Hosp Med. 2012;7(4):282–286.
- , . Pediatric hospitalist systems versus traditional models of care: effect on quality and cost outcomes. J Hosp Med. 2012;7(4):350–357.
- , , , . Characteristics of the pediatric hospitalist workforce: its roles and work environment. Pediatrics. 2007;120(33):33–39.
- Society of Hospital Medicine. Definition of a hospitalist and hospital medicine. Available at: http://www.hospitalmedicine.org/AM/Template.cfm?Section=Hospitalist_Definition7(4):299–303.
Pediatric hospital medicine (PHM) is a relatively new field that has been growing rapidly over the past 20 years.[1] The field has been increasingly recognized for its contributions to high‐quality patient care, patient safety, systems improvement, medical education, and research.[2, 3, 4, 5, 6, 7, 8, 9] However, there appears to be significant variation among programs, even in basic factors such as how clinical effort is defined, the extent of in‐house coverage provided, and the scope of clinical services provided, and there exists a paucity of data describing these variations.[8]
Most previously published work did not specifically focus on academic programs,[2, 3, 8, 9] and specifically targeted hospital leadership,[2] practicing hospitalists,[3] residents,[7] and pediatric residency or clerkship directors,[4, 7] rather than hospitalist directors.[9] Furthermore, previous work focused on specific aspects of PHM programs such as education,[4, 7] value,[2] work environment,[9] and clinical practice,[3] rather than a more comprehensive approach.
We conducted a survey of academic PHM programs to learn about the current state and variation among programs across multiple domains (organizational, administrative, and financial). We speculated that:
- Many institutions currently lacking an academic PHM program were planning on starting a program in the next 3 years.
- Variability exists in hospitalist workload among programs.
- In programs providing clinical coverage at more than 1 site, variability exists in the relationship between the main site and satellite site(s) in terms of decision making, scheduling, and reporting of performance.
METHODS
Sample
We used the online American Medical Association Fellowship and Residency Electronic Interactive Database (FREIDA) to identify all 198 accredited pediatric residency training programs in the United States. A total of 246 hospitals were affiliated with these programs, and all of these were targeted for the survey. In addition, academic PHM program leaders were targeted directly with email invitations through the American Academy of Pediatrics (AAP) Section on Hospital Medicine LISTSERV.
Survey Instrument
A 49‐question online survey on the administrative, organizational, and financial aspects of academic PHM programs was developed with the input of academic PHM hospital leaders from Cincinnati Children's Hospital Medical Center and St. Louis Children's Hospital. First, the survey questions were developed de novo by the researchers. Then, multiple hospitalist leaders from each institution took the survey and gave feedback on content and structure. Using this feedback, changes were made and then tested by the leaders taking the new version of the survey. This process was repeated for 3 cycles until consensus was reached by the researchers on the final version of the survey. The survey contained questions that asked if the program provided coverage at a single site or at multiple sites and utilized a combination of open‐ended and fixed‐choice questions. For some questions, more than 1 answer was permitted. For the purposes of this survey, we utilized the following definitions adapted from the Society of Hospital Medicine. A hospitalist was defined as a physician who specializes in the practice of hospital medicine.[10] An academic PHM program was defined as any hospitalist practice associated with a pediatric residency program.[11] A nocturnist was defined as a hospitalist who predominantly works a schedule providing night coverage.[12]
Survey Administration
SurveyMonkey, an online survey software, was used to administer the survey. In June 2011, letters were mailed to all 246 hospitals affiliated with an accredited pediatric residency program as described above. These were addressed to either the hospital medicine director (if identified using the institutions Web site) or pediatric residency director. The letter asked the recipient to either participate in the survey or forward the survey to the physician best able to answer the survey. The letters included a description of the study and a link to the online survey. Of note, there was no follow‐up on this process. We also distributed the direct link to the survey and a copy of the letter utilizing the AAP Section on Hospital Medicine LISTSERV. Two reminders were sent through the LISTSERV in the month after the initial request. All respondents were informed that they would receive the deidentified raw data as an incentive to participate in the survey. Respondents were defined as those answering the first question, Does your program have an academic hospitalist program?
Statistical Analysis
Completed survey responses were extracted to Microsoft Excel (Microsoft Corp., Redmond, WA) for data analysis. Basic statistics were utilized to determine response rates for each question. Data were stratified for program type (single site or at multiple sites). For some questions, data were further stratified for the main site of multiple‐site programs for comparison to single‐site programs. In a few instances, more than 1 physician from a particular program responded to the survey. For these, the most appropriate respondent (PHM director, residency director, senior hospitalist) was identified utilizing the programs' publicly available Web site; only that physician's answers were used in the analysis.
Human Subjects Protection
This study was determined to be exempt from review by the Cincinnati Children's Hospital Medical Center and Washington University in St. Louis institutional review boards. All potential responders received written information about the survey. Survey design allowed for anonymous responses with voluntary documentation of program name and responders' contact information. The willingness to respond was qualified as implied consent. Data were deidentified prior to analysis and prior to sharing with the survey participants.
RESULTS
Response Rates
A total of 133 responses were received. Duplicate responses from the same program (13/133) were eliminated from the analysis. This yielded an overall response rate of 48.8% (120/246). A total of 81.7% (98/120) of institutions reported having an academic PHM program. Of the 18.3% (22/120) of institutions reporting not having a program, 9.1% (2/22) reported planning on starting a program in the next 3 years. Of the 98 respondents with an academic PHM program, 17 answered only the first survey question, Does your program have an academic hospitalist program? The remaining 81 completed surveys were left for further analysis. All of these respondents identified their program, and therefore we are certain that there were no duplicate responses in the analytic dataset. Of these, 23 (28%) indicated that their programs provided clinical care at multiple sites, and 58 (72%) indicated that their program provided care at a single site (Figure 1).
Administrative
Respondents reported wide variation for the definition of a 1.0 full‐time employee (FTE) hospitalist in their group. This included the units used (hours/year, weeks/year, shifts/year) as well as actual physician workload (Table 1). Weeks/year was the most common unit utilized by programs to define workload (66% of single‐site programs, 48% of multiple‐site programs), followed by hours/year (19%, 22%) and shifts/year (14%, 22%). The mean and median workload per FTE is represented (Table 1). The large ranges and the standard deviations from the mean indicate variability in workload per FTE (Table 1).
| Single‐Site Program | Multiple‐Site Programs | |||||||||
|---|---|---|---|---|---|---|---|---|---|---|
| % Programs | Mean | Median | SD | Range | % Programs | Mean | Median | SD | Range | |
| ||||||||||
| Weeks on service | 66 | 27.14 | 26 | 8.1 | 1246 | 48 | 27.2 | 24 | 9.6 | 1736 |
| Hours/year | 19 | 1886.25 | 1880 | 231.2 | 16002300 | 22 | 1767.33 | 1738 | 109.0 | 16641944 |
| Shifts/year* | 14 | 183 | 191 | 52.2 | 182240 | 22 | 191 | 184 | 38.3 | 155214 |
Scheduled in‐house hospitalist coverage also varied. Daytime coverage was defined as until 3 to 5 pm, evening coverage was defined a until 10 pm to midnight, and 24‐hour coverage was defined a 24/7. Programs reported plans to increase in‐house coverage with the implementation of the 2011 Accreditation Council for Graduate Medical Education (ACGME) resident work hours restrictions.[13] Among single‐site programs, there was a planned 50% increase in day/evening coverage (14% to 21%), with a planned decrease in day‐only coverage, and no change in 24/7 coverage (Table 2). Among the main sites of multiple‐site programs, there was a planned 50% increase in 24/7 in‐house coverage (35% to 52%), with a planned decrease in day‐only coverage, and no change in day/evening coverage (Table 3). Among the satellite sites of multiple‐site programs, there was a planned 9% increase in 24/7 coverage (41% to 50%), with a planned decrease in day‐only coverage, and no change in day/evening coverage (Table 2). Most programs reported that all hospitalists share night coverage (87% single site, 89% multiple sites) (Table 2). Multiple‐site programs were more likely than single‐site programs to use nocturnists, moonlighters, and incentives for those providing evening or night coverage (Table 2).
| Single Site (n=58) | Main Site of Multiple‐Site Programs (n=23) | |||
|---|---|---|---|---|
| Proportion | Response Rate | Proportion | Response Rate | |
| ||||
| Organizational | ||||
| Night shifts | .79 (46/58) | .83 (19/23) | ||
| All share nights | .87 (40/46) | .89 (17/19) | ||
| Nocturnists | .09 (4/46) | .26 (5/19) | ||
| Moonlighters | .04 (2/46) | .12 (2/19) | ||
| Night shift incentives | .74 (43/58) | .78 (18/23) | ||
| Financial | .12 (5/43) | .28 (5/18) | ||
| Time | .12 (5/43) | .22 (4/18) | ||
| No incentives | .79 (34/43) | .61 (11/18) | ||
| In‐house hospitalist coverage pre July 2011a | 1.0 (58/58) | 1.0 (23/23) | ||
| 24/7 | .29 (17/58) | .35 (8/23) | ||
| Day and evening | .14 (8/58) | .17 (4/23) | ||
| Day only | .57 (33/58) | .48 (11/23) | ||
| In‐house hospitalist coverage post July 2011a | 1.0 (58/58) | 1.0 (23/23) | ||
| 24/7 | .29 (17/58) | .52 (12/23) | ||
| Day and evening | .21 (12/58) | .17 (4/23) | ||
| Day only | .50 (29/58) | .30 (7/23) | ||
| Administrative | ||||
| Own division | .32 (18/57) | .98 (57/58) | .74 (17/23) | 1.0 (23/23) |
| Part of another division | .68 (39/57) | .26 (6/23) | ||
| Financial | ||||
| Revenues>expenses | .26 (14/53) | .91 (53/58) | .04 (1/23) | .04 (19/23) |
| Incentives supplement base salary | .45 (25/55) | .95 (55/58) | .48 (10/21) | .91 (21/23) |
| Metrics used to determine incentivesb | .47 (27/58) | .52 (12/23) | ||
| RVUs/MD | .85 (23/27) | .83 (10/12) | ||
| Costs/discharge | .19 (5/27) | .08 (1/12) | ||
| Financial reportingb | .81 (47/58) | .04 (19/23) | ||
| Charges | .64 (30/47) | .68 (13/19) | ||
| Collections | .66 (31/47) | .68 (13/19) | ||
| RVUs | .77 (36/47) | .47 (9/19) | ||
| Main Site (n=23) | Satellite Sites (n=51) | |||
|---|---|---|---|---|
| Proportion | Response Rate | Proportion | Response Rate | |
| In‐house hospitalist coverage pre July 2011 | 1.0 (23/23) | .80 (41/51) | ||
| 24/7 | .35 (8/23) | .41 (17/41) | ||
| Day and evening | .17 (4/23) | .10 (4/41) | ||
| Day only | .48 (11/23) | .49 (20/41) | ||
| In‐house hospitalist coverage post July 2011 | 1.0 (23/23) | |||
| 24/7 | .52 (12/23) | .50 (19/38) | .75 (38/51) | |
| Day and evening | .17 (4/23) | .11 (4/38) | ||
| Day only | .30 (7/23) | .39 (15/38) | ||
| Night shift coverage | .83 (19/23) | .78 (18/23) | ||
| All share nights | .89 (17/19) | .94 (17/18) | ||
| Nocturnists | .26 (5/19) | .22 (4/18) | ||
| Moonlighters | .12 (2/19) | .17 (3/18) | ||
The vast majority of multiple‐site programs reported that their different clinical sites are considered parts of a single hospitalist program (96%), and that there is a designated medical director for each site (83%). However, only 70% of multiple‐site programs report that decisions concerning physician coverage are made as a group, and only 65% report that scheduling is done centrally. In addition, there is variability in how quality, safety, and patient satisfaction is reported (group vs site). The majority of programs report sharing revenues and expenses among the sites (Table 4).
| Proportion | Response Rate | |
|---|---|---|
| Sites regularly collaborate on: | 1.0 (23/23) | |
| Quality improvement projects | .74 (17/23) | |
| Safety initiatives | .74 (17/23) | |
| Research | .48 (11/23) | |
| Have a designated hospitalist medical director for each site | .83 (19/23) | 1.0 (23/23) |
| Different sites considered parts of a single hospitalist program | .96 (22/23) | 1.0 (23/23) |
| Make decisions on program/coverage/hour changes as a group | .70 (16/23) | 1.0 (23/23) |
| Scheduling done centrally | .65 (15/23) | 1.0 (23/23) |
| Report or track the following as individual sites: | ||
| Quality measures | .43 (9/21) | .91 (21/23) |
| Safety measures | .48 (10/21) | .91 (21/23) |
| Patient satisfaction | .50 (10/20) | .87 (20/23) |
| Report or track the following as a group: | ||
| Quality measures | .33 (7/21) | .91 (21/23) |
| Safety measures | .33 (7/21) | .91 (21/23) |
| Patient satisfaction | .30 (6/20) | .87 (20/23) |
| Report or track the following as both individual sites and as a group: | ||
| Quality measures | .24 (5/21) | .91 (21/23) |
| Safety measures | .19 (4/21) | .91 (21/23) |
| Patient satisfaction | .25 (4/20) | .87 (20/23) |
| Sites share revenues and expenses | .67 (14/21) | .91 (21/23) |
Organizational
Of the single‐site programs that answered the question Is your hospital medicine program considered its own division or a section within another division? 32% reported that their programs were considered its own division, and 68% reported that they were a part of another division, predominately (62%) general pediatrics, but also a few (6% combined) within emergency medicine, critical care, physical medicine and rehabilitation, and infectious diseases. Of the multiple‐site programs, a majority of 74% programs were their own division, and 26% were part of another division (Table 2). Respondents reported that their satellite sites included pediatric units in small community hospitals, small pediatric hospitals, large nonpediatric hospitals with pediatric units, rehabilitation facilities, and Shriner orthopedic hospitals.
Financial
Of the single‐site programs that answered the question Do patient revenues produced by your hospitalist group cover all expenses? only 26% reported that revenues exceeded expenses. Of the multiple‐site programs responding to this question, only 4% reported that the main site of their programs had revenues greater than expenses (Table 2). Programs used a combination of metrics to report revenue, and relative value unit (RVU)/medical doctor (MD) is the most commonly used metric to determine incentive pay (Table 2).
DISCUSSION
Our study demonstrates that academic PHM programs are common, which is consistent with previous data.[4, 7, 9, 14] The data support our belief that more institutions are planning on starting PHM programs. However, there exist much variability in a variety of program factors.[2, 3, 8, 9, 14] The fact that up to 35% of categorical pediatric residents are considering a career as a hospitalist further highlights the need for better data on PHM programs.[7]
We demonstrated that variability existed in hospitalist workload at academic PHM programs. We found considerable variation in the workload per hospitalist (large ranges and standard deviations), as well as variability in how an FTE is defined (hours/year, weeks/year, shifts/year) (Table 1). In addition, survey respondents might have interpreted certain questions differently, and this might have led to increased variability in the data. For example, the question concerning the definition of an FTE was worded as A clinical FTE is defined as. Some of the reported variation in workload might be partially explained by hospitalists having additional nonclinical responsibilities within hospital medicine or another field, including protected time for quality improvement, medical education, research, or administrative activities. Furthermore, some hospitalists might have clinical responsibilities outside of hospital medicine. Given that most PHM programs lack a formal internal definition of what it means to be a hospitalist,[7] it is not surprising to find such variation between programs. The variability in the extent of in‐house coverage provided by academic PHM programs, as well as institutional plans for increased coverage with the 2011 residency work‐hours restrictions is also described, and is consistent with other recently published data.[14] This is likely to continue, as 70% of academic PHM programs reported an anticipated increase in coverage in the near future,[14] suggesting that academic hospitalists are being used to help fill gaps in coverage left by changes in resident staffing.
Our data describe the percentage of academic programs that have a distinct division of hospital medicine. The fact that multisite programs were more likely to report being a distinct division might reflect the increased complexities of providing care at more than 1 site, requiring a greater infrastructure. This might be important in institutional planning as well as academic and financial expectations of academic pediatric hospitalists.
We also demonstrated that programs with multiple sites differ as far as the degree of integration of the various sites, with variation reported in decision making, scheduling, and how quality, safety, and patient satisfaction are reported (Table 4). Whether or not increased integration between the various clinical sites of a multiple‐site program is associated with better performance and/or physician satisfaction are questions that need to be answered. However, academic PHM directors would likely agree that there are great challenges inherent in managing these programs. These challenges include professional integration (do hospitalists based at satellite sites feel that they are academically supported?), clinical work/expectations (fewer resources and fewer learners at satellite sites likely affects workload), and administrative issues (physician scheduling likely becomes more complex as the number of sites increases). As programs continue to grow and provide clinical services in multiple geographic sites, it will become more important to understand how the different sites are coordinated to identify and develop best practices.
Older studies have described that the majority of PHM programs (70%78%) reported that professional revenues do not cover expenses, unfortunately these results were not stratified for program type (academic vs community).[2, 9]
Our study describes that few academic PHM programs (26% of single site, 4% of multiple‐site programs) report revenues (defined in our survey as only the collections from professional billing) in excess of expenses. This is consistent with prior studies that have included both academic and community PHM programs.[2] Therefore, it appears to be common for PHM programs to require institutional funding to cover all program expenses, as collections from professional billing are not generally adequate for this purpose. We believe that this is a critical point for both hospitalists and administrators to understand. However, it is equally important that they be transparent about the importance and value of the nonrevenue‐generating work performed by PHM programs. It has been reported that the vast majority of pediatric hospitalists are highly involved in education, quality improvement work, practice guideline development, and other work that is vitally important to institutions.[3] Furthermore, although one might expect PHM leaders to believe that their programs add value beyond the professional revenue collected,[9] even hospital leadership has been reported to perceive that PHM programs add value in several ways, including increased patient satisfaction (94%), increased referring MD satisfaction (90%), decreased length of stay (81%), and decreased costs (62%).[2] Pediatric residency and clerkship directors report that pediatric hospitalists are more accessible than other faculty (84% vs 64%) and are associated with an increase in the practice of evidence‐based medicine (76% vs 61%).[4] Therefore, there is strong evidence supporting that pediatric hospitalist programs provide important value that is not evident on a balance sheet.
In addition, our data also indicate that programs currently use a variety of metrics in combination to report productivity, and there is no accepted gold standard for measuring the performance of a hospitalist or hospitalist program (Table 2). Given that hospitalists generally cannot control how many patients they see, and given the fact that hospitalists are strongly perceived to provide value to their institutions beyond generating clinical revenue, metrics such as RVUs and charges likely do not accurately represent actual productivity.[2] Furthermore, it is likely that the metrics currently used underestimate actual productivity as they are not designed to take into account confounding factors that might affect hospitalist productivity. For example, consider an academic hospitalist who has clinical responsibilities divided between direct patient care and supervisory patient care (such as a team with some combination of residents, medical students, and physician extenders). When providing direct patient care, the hospitalist is likely responsible or all of the tasks usually performed by residents, including writing all patient notes and prescriptions, all communication with families, nurses, specialists, and primary care providers; and discharge planning. Conversely, when providing supervisory care, it is likely that the tasks are divided among the team members, and the hospitalist has the additional responsibility for providing teaching. However, the hospitalist might be responsible for more complex and acute patients. These factors are not adequately measured by RVUs or professional billing. Furthermore, these metrics do not capture the differences in providing in‐house daytime versus evening/night coverage, and do not measure the work performed while being on call when outside of the hospital. It is important for PHM programs and leaders to develop a better representation of the value provided by hospitalists, and for institutional leaders to understand this value, because previous work has suggested that the majority of hospital leaders do not plan to phase out the subsidy of hospitalists over time, as they do not anticipate the program(s) will be able to covercosts.[2] Given the realities of decreasing reimbursement and healthcare reform, it is unlikely to become more common for PHM programs to generate enough professional revenue to cover expenses.
The main strength of this descriptive study is the comprehensive nature of the survey, including many previously unreported data. In addition, the data are consistent with previously published work, which validates the quality of the data.
This study has several limitations including a low response rate and the exclusion of some hospitals or programs because they provided insufficient data for analysis. However, a post hoc analysis demonstrated that the majority of the institutions reporting that they did not have an academic PHM program (18/22), and those that were excluded due to insufficient data (12/17) were either smaller residency programs (<60 residents) or hospitals that were not the main site of a residency program. Therefore, our data likely are a good representation of academic PHM programs at larger academic institutions. Another potential weakness is that, although PHM program directors and pediatric residency directors were targeted, the respondent might not have been the person with the best knowledge of the program, which could have produced inaccurate data, particularly in terms of finances. However, the general consistency of our findings with previous work, particularly the high percentage of institutions with academic PHM programs,[4, 7, 9, 14] the low percentage of programs with revenues greater than expenses,[2, 9] and the trend toward increased in‐house coverage associated with the 2011 ACGME work‐hour restrictions,[14] supports the validity of our other results. In addition, survey respondents might have interpreted certain questions differently, specifically the questions concerning the definition of an FTE, and this might have led to increased variability in the data.
CONCLUSIONS
Academic PHM programs exist in the vast majority of academic centers, and more institutions are planning on starting programs in the next few years. There appears to be variability in a number of program factors, including hospitalist workload, in‐house coverage, and whether the program is a separate division or a section within another academic division. Many programs are currently providing care at more than 1 site. Programs uncommonly reported that their revenues exceeded their expenses. These data are the most comprehensive data existing for academic PHM programs.
Acknowledgment
Disclosure: Nothing to report.
- . Pediatric hospital medicine: historical perspectives, inspired future. Curr Probl Pediatr Adolesc Health Care. 2012;42(5):107–112.
- , , . Assessing the value of pediatric hospitalist programs: the perspective of hospital leaders. Acad Pediatr. 2009;9(3):192–196.
- , . Pediatric hospitalists: training, current practice, and career goals. J Hosp Med. 2009;4(3):179–186.
- , , . Hospitalists' involvement in pediatrics training: perspectives from pediatric residency program and clerkship directors. Acad Med. 2009;84(11):1617–1621.
- , . Research in pediatric hospital medicine: how research will impact clinical care. Curr Probl Pediatr Adolesc Health Care. 2012;42(5):127–130.
- , . Pediatric hospitalists in medical education: current roles and future directions. Curr Probl Pediatr Adolesc Health Care. 2012;42(5):120–126.
- , , , , . Pediatric hospitalists' influences on education and career plans. J Hosp Med. 2012;7(4):282–286.
- , . Pediatric hospitalist systems versus traditional models of care: effect on quality and cost outcomes. J Hosp Med. 2012;7(4):350–357.
- , , , . Characteristics of the pediatric hospitalist workforce: its roles and work environment. Pediatrics. 2007;120(33):33–39.
- Society of Hospital Medicine. Definition of a hospitalist and hospital medicine. Available at: http://www.hospitalmedicine.org/AM/Template.cfm?Section=Hospitalist_Definition7(4):299–303.
Copyright © 2013 Society of Hospital Medicine