User login
Leveraging the Outpatient Pharmacy to Reduce Medication Waste in Pediatric Asthma Hospitalizations
Asthma results in approximately 125,000 hospitalizations for children annually in the United States.1,2 The National Heart, Lung, and Blood Institute guidelines recommend that children with persistent asthma be treated with a daily controller medication, ie, an inhaled corticosteroid (ICS).3 Hospitalization for an asthma exacerbation provides an opportunity to optimize daily controller medications and improve disease self-management by providing access to medications and teaching appropriate use of complicated inhalation devices.
To reduce readmission4 by mitigating low rates of postdischarge filling of ICS prescriptions,5,6 a strategy of “meds-in-hand” was implemented at discharge. “Meds-in-hand” mitigates medication access as a barrier to adherence by ensuring that patients are discharged from the hospital with all required medications in hand, removing any barriers to filling their initial prescriptions.7 The Asthma Improvement Collaborative at Cincinnati Children’s Hospital Medical Center (CCHMC) previously applied quality improvement methodology to implement “meds-in-hand” as a key intervention in a broad strategy that successfully reduced asthma-specific utilization for the 30-day period following an asthma-related hospitalization of publicly insured children from 12% to 7%.8,9
At the onset of the work described in this manuscript, children hospitalized with an acute exacerbation of persistent asthma were most often treated with an ICS while inpatients in addition to a standard short course of oral systemic corticosteroids. Conceptually, inpatient administration of ICS provided the opportunity to teach effective device usage with each inpatient administration and to reinforce daily use of the ICS as part of the patient’s daily home medication regimen. However, a proportion of patients admitted for an asthma exacerbation were noted to receive more than one ICS inhaler during their admission, most commonly due to a change in dose or type of ICS. When this occurred, the initially dispensed inhaler was discarded despite weeks of potential doses remaining. While some hospitals preferentially dispense ICS devices marketed to institutions with fewer doses per device, our pharmacy primarily dispensed ICS devices identical to retail locations containing at least a one-month supply of medication. In addition to the wasted medication, this practice resulted in additional work by healthcare staff, unnecessary patient charges, and potentially contributed to confusion about the discharge medication regimen.
Our specific aim for this quality improvement study was to reduce the monthly percentage of admissions for an acute asthma exacerbation treated with >1 ICS from 7% to 4% over a six-month period.
METHODS
Context
CCHMC is a quaternary care pediatric health system with more than 600 inpatient beds and 800-900 inpatient admissions per year for acute asthma exacerbation. The Hospital Medicine service cares for patients with asthma on five clinical teams across two different campuses. Care teams are supervised by an attending physician and may include residents, fellows, or nurse practitioners. Patients hospitalized for an acute asthma exacerbation may receive a consult from the Asthma Center consult team, staffed by faculty from either the Pediatric Pulmonology or Allergy/Immunology divisions. Respiratory therapists (RTs) administer inhaled medications and provide asthma education.
Planning the Intervention
Our improvement team included physicians from Hospital Medicine and Pulmonary Medicine, an Asthma Education Coordinator, a Clinical Pharmacist, a Pediatric Chief Resident, and a clinical research coordinator. Initial interventions targeted a single resident team at the main campus before spreading improvement activities to all resident teams at the main campus and then the satellite campus by February 2017.
Development of our process map (Figure 1) revealed that the decision for ordering inpatient ICS treatment frequently occurred at admission. Subsequently, the care team or consulting team might make a change in the ICS to fine-tune the outpatient medication regimen given that admission for asthma often results from suboptimal chronic symptom control. Baseline analysis of changes in ICS orders revealed that 81% of ICS changes were associated with a step-up in therapy, defined as an increase in the daily dose of the ICS or the addition of a long-acting beta-agonist. The other common ICS adjustment, accounting for 17%, was a change in corticosteroid without a step-up in therapy, (ie, beclomethasone to fluticasone) that typically occurred near the end of the hospitalization to accommodate outpatient insurance formularies, independent of patient factors related to illness severity.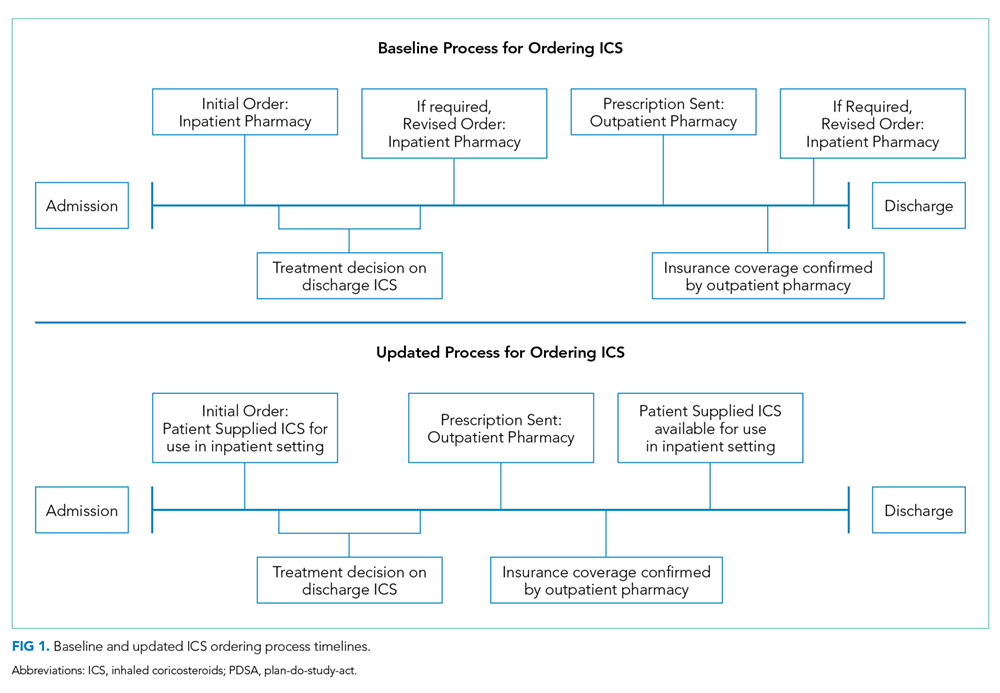
We utilized the model for improvement and sought to decrease the number of patients administered more than one ICS during an admission through a step-wise quality improvement approach, utilizing plan-do-study-act (PDSA) cycles.10 This study was reviewed and designated as not human subjects research by the CCHMC institutional review board.
Improvement Activities
We conceived key drivers or domains that would be necessary to address to effect change. Key drivers included a standardized process for delayed initiation of ICS and confirmation of outpatient insurance prescription drug coverage, prescriber education, and real-time failure notification.
PDSA Interventions
PDSA 1 & 2: Standardized Process for Initiation of ICS
Our initial tests of change targeted the timing of when an ICS was ordered during hospitalization for an asthma exacerbation. Providers were instructed to delay ordering an ICS until the patient’s albuterol treatments were spaced to every three hours and to include a standardized communication prompt within the albuterol order. The prompt instructed the RT to contact the provider once the patient’s albuterol treatments were spaced to every three hours and ask for an ICS order, if appropriate. This intervention was abandoned because it did not reliably occur.
The subsequent intervention delayed the start of ICS treatment by using a PRN indication advising that the ICS was to be administered once the patient’s albuterol treatments were spaced to every three hours. However, after an error resulted in the PRN indication being included on a discharge prescription for an ICS, the PRN indication was abandoned. Subsequent work to develop a standardized process for delayed initiation of ICS occurred as part of the workflow to address the confirmation of outpatient formulary coverage as described next.
PDSA 3: Prioritize the Use of the Institution’s Outpatient Pharmacy
Medication changes that occurred because of outpatient insurance formulary denials were a unique challenge; they required a medication change after the discharge treatment plan had been finalized, and a prescription was already submitted to the outpatient pharmacy. In addition, neither our inpatient electronic medical record nor our inpatient hospital pharmacy has access to decision support tools that incorporate outpatient prescription formulary coverage. Alternatively, outpatient pharmacies have a standard workflow that routinely confirms insurance coverage before dispensing medication. The institutional policy was modified to allow for the inpatient administration of patient-supplied medications, pursuant to an inpatient order. Patient-supplied medications include those brought from home or those supplied by the outpatient pharmacy.
Subsequently, we developed a standardized process to confirm outpatient prescription drug coverage by using our hospital-based outpatient pharmacy to dispense ICS for inpatient treatment and asthma education. This new workflow included placing an order for an ICS at admission as a patient-supplied medication with an administration comment to “please administer once available from the outpatient pharmacy” (Figure 1). Then, once the discharge medication plan is finalized, the prescription is submitted to the outpatient pharmacy. Following verification of insurance coverage, the outpatient pharmacy dispenses the ICS, allowing it to be used for patient education and inpatient administration. If the patient is ineligible to have their prescription filled by the outpatient pharmacy for reasons other than formulary coverage, the ICS is dispensed from the hospital inpatient pharmacy as per the previous standard workflow. Inpatient ICS inhalers are then relabeled for home use per the existing practice to support medications-in-hand.
Further workflow improvements occurred following the development of an algorithm to help the outpatient pharmacy contact the correct inpatient team, and augmentation of the medication delivery process included notification of the RT when the ICS was delivered to the inpatient unit.
PDSA 4: Prescriber Education
Prescribers received education regarding PDSA interventions before testing and throughout the improvement cycle. Education sessions included informal coaching by the Asthma Education Coordinator, e-mail reminders containing screenshots of the ordering process, and formal didactic sessions for ordering providers. The Asthma Education Coordinator also provided education to the nursing and respiratory therapy staff regarding the implemented process and workflow changes.
PDSA 5: Real-Time Failure Notification
To supplement education for the complicated process change, the improvement team utilized a decision support tool (Vigilanz Corp., Chicago, IL) linked to EMR data to provide notification of real-time process failures. When a patient with an admission diagnosis of asthma had a prescription for an ICS verified and dispensed by the inpatient pharmacy, an automated message with relevant patient information would be sent to a member of the improvement team. Following a brief chart review, directed feedback could be offered to the ordering provider, allowing the prescription to be redirected to the outpatient pharmacy.
Study of the Improvement
Patients of all ages, with the International Classification of Diseases, Ninth Revision, and Tenth Revision codes for asthma (493.xx or J45.xx) were included in data collection and analysis if they were treated by the Hospital Medicine service, as the first inpatient service or after transfer from the ICU, and prescribed an ICS with or without a long-acting beta-agonist. Data were collected retrospectively and aggregated monthly. The baseline period was from January 2015 through October 2016. The intervention period was from November 2016 through March 2018. The prolonged baseline and study periods were utilized to understand the seasonal nature of asthma exacerbations.
Measures
Our primary outcome measure was defined as the monthly number of patients admitted to Hospital Medicine for an acute asthma exacerbation administered more than one ICS divided by the total number of asthma patients administered at least one dose of an ICS (patient-supplied or dispensed from the inpatient pharmacy). A full list of ICS is included in the appendix Table.
A secondary process measure approximated our adherence to obtaining ICS from the outpatient pharmacy for inpatient use. All medications administered during hospitalization are documented in the medication administration report. However, only medications dispensed from the inpatient pharmacy are associated with a patient charge. Patient-supplied medications, including those dispensed from the hospital outpatient pharmacy, are not associated with an inpatient charge. Therefore, the secondary process measure was defined as the monthly number of asthma patients administered an ICS not associated with an inpatient charge divided by the total number of asthma patients administered an ICS.
A cost outcome measure was developed to track changes in the average cost of an ICS included on inpatient bills during hospitalization for an asthma exacerbation. This outcome measure was defined as the total monthly cost, using the average wholesale price, of the ICS included on the inpatient bill for an asthma exacerbation, divided by the total number of asthma patients administered at least one dose of an ICS (patient supplied or dispensed from the inpatient pharmacy).
Our a priori intent was to reduce ICS medication waste while maintaining a highly reliable system that included inpatient administration and education with ICS devices and maintain our medications-in-hand practice. A balancing measure was developed to monitor the reliability of inpatient administration of ICS. It was defined as the monthly number of patients who received a discharge prescription for an ICS and were administered an ICS while an inpatient divided by the total number of asthma patients with a discharge prescription for an ICS.
Analysis
Measures were evaluated using statistical process control charts and special cause variation was determined by previously established rules. Our primary, secondary, and balancing measures were all evaluated using a p-chart with variable subgroup size. The cost outcome measure was evaluated using an X-bar S control chart.11-13
RESULTS
Primary Outcome Measure
During the baseline period, 7.4% of patients admitted to Hospital Medicine for an acute asthma exacerbation were administered more than one ICS, ranging from 0%-20% of patients per month (Figure 2). Following the start of our interventions, we met criteria for special cause allowing adjustment of the centerline.13 The mean percentage of patients receiving more than one ICS decreased from 7.4% to 0.7%. Figure 2 includes the n-value displayed each month and represents all patients admitted to the Hospital Medicine service with an asthma exacerbation who were administered at least one ICS.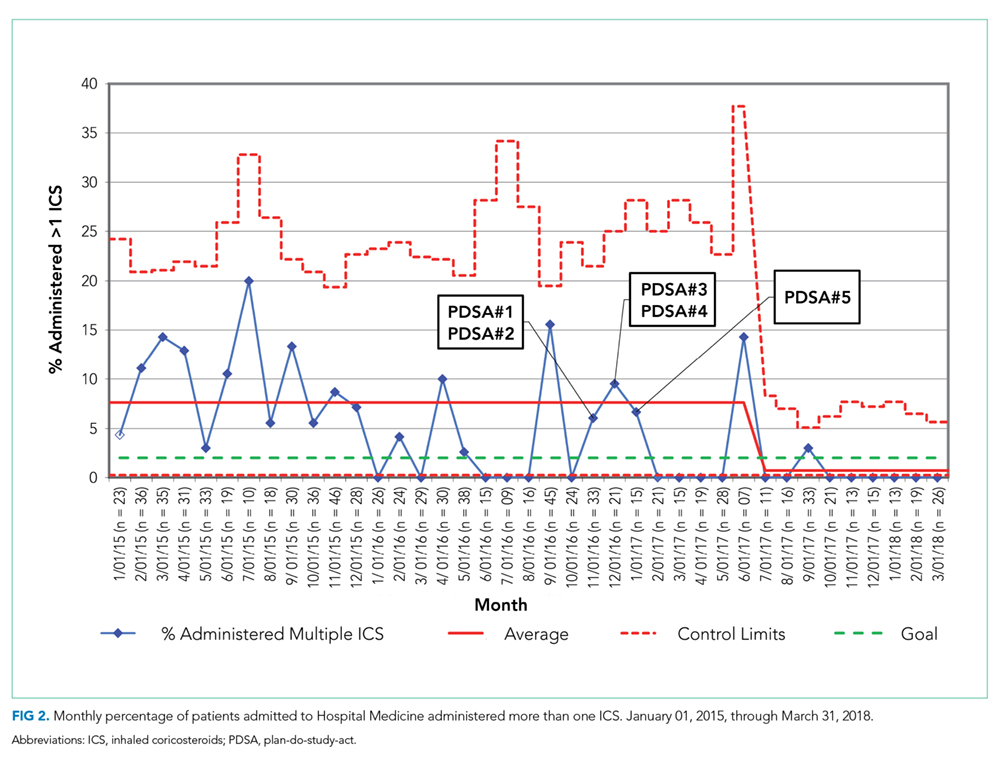
Secondary Process Measure
During the baseline period, there were only rare occurrences (less than 1%) of a patient-supplied ICS being administered during an asthma admission. Following the start of our intervention period, the frequency of inpatient administration of patient-supplied ICS showed a rapid increase and met rules for special cause with an increase in the mean percent from 0.7% to 50% (Figure 3). The n-value displayed each month represents all patients admitted to the Hospital Medicine service for an asthma exacerbation administered at least one ICS.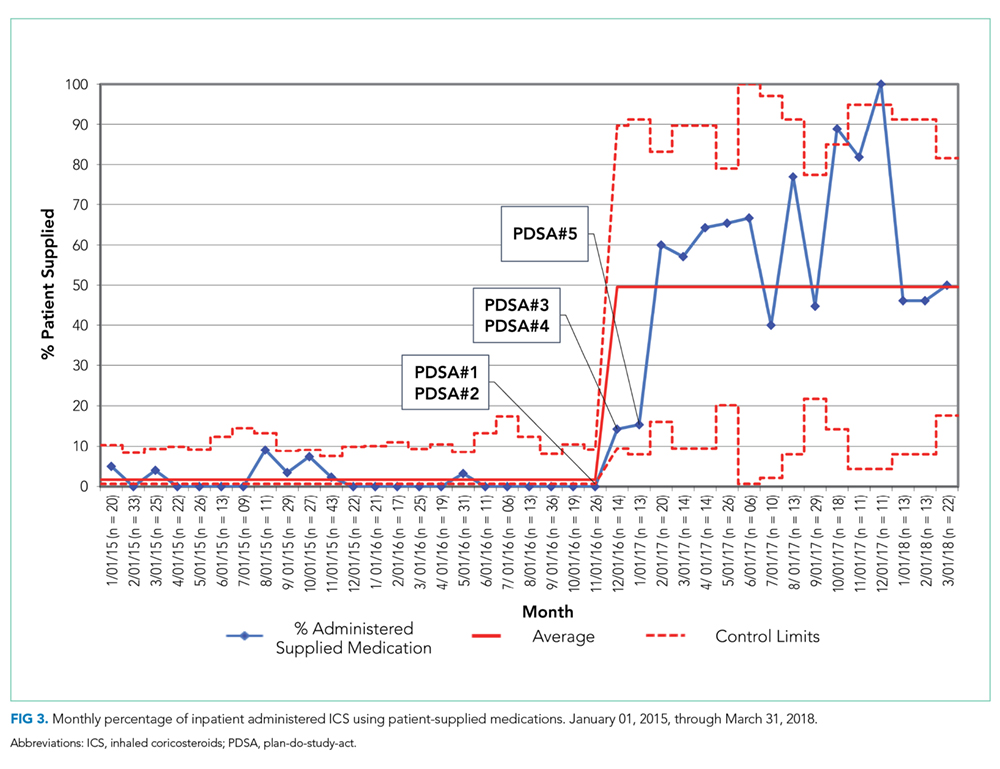
Cost Outcome Measure
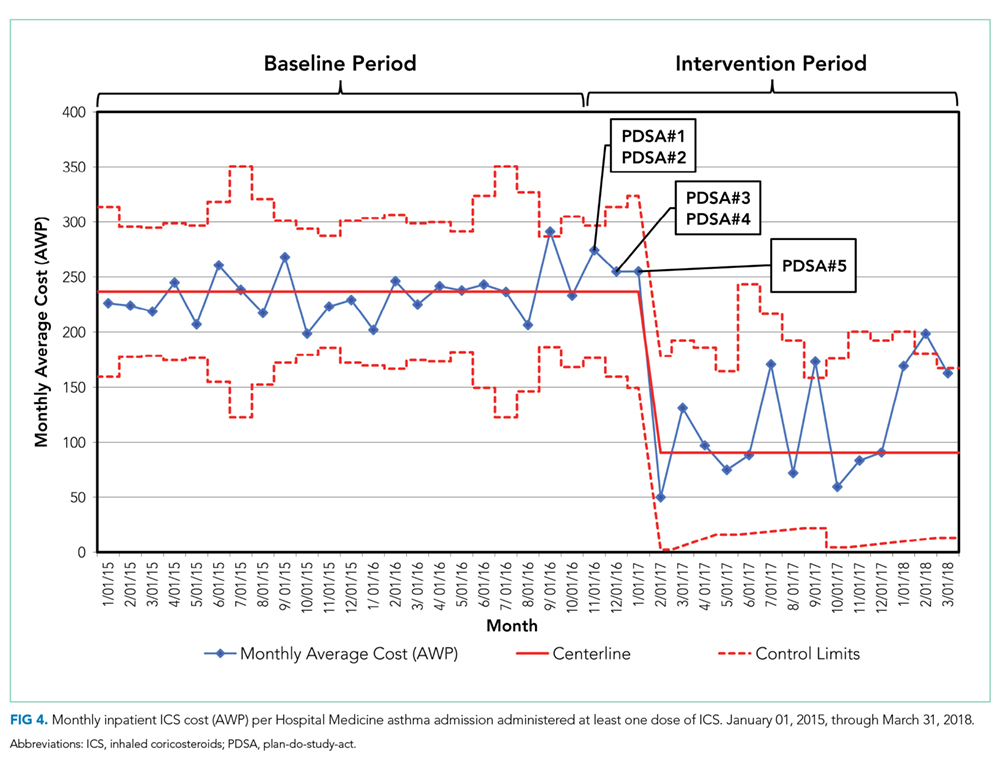
The average cost of an ICS billed during hospitalization for an acute asthma exacerbation was $236.57 per ICS during the baseline period. After the intervention period, the average inpatient cost for ICS decreased by 62% to $90.25 per ICS (Figure 4).
Balancing Measure
DISCUSSION
Our team reduced the monthly percent of children hospitalized with an acute asthma exacerbation administered more than one ICS from 7.4% to 0.7% after implementation of a new workflow process for ordering ICS utilizing the hospital-based outpatient pharmacy. The new workflow delayed ordering and administration of the initial inpatient ICS treatment, allowing time to consider a step-up in therapy. The brief delay in initiating ICS is not expected to have clinical consequence given the concomitant treatment with systemic corticosteroids. In addition, the outpatient pharmacy was utilized to verify insurance coverage reliably prior to dispensing ICS, reducing medication waste, and discharge delays due to outpatient medication formulary conflicts.
Our hospital’s previous approach to inpatient asthma care resulted in a highly reliable process to ensure patients were discharged with medications-in-hand as part of a broader system that effectively decreased reutilization. However, the previous process inadvertently resulted in medication waste. This waste included nearly full inhalers being discarded, additional work by the healthcare team (ordering providers, pharmacists, and RTs), and unnecessary patient charges.
While the primary driver of our decision to use the outpatient pharmacy was to adjudicate insurance prescription coverage reliably to prevent waste, this change likely resulted in a financial benefit to patients. The average cost per asthma admission of an inpatient billed for ICS using the average wholesale price, decreased by 62% following our interventions. The decrease in cost was primarily driven by using patient-supplied medications, including prescriptions newly filled by the on-site outpatient pharmacy, whose costs were not captured in this measure. While our secondary measure may underestimate the total expense incurred by families for an ICS, families likely receive their medications at a lower cost from the outpatient pharmacy than if the ICS was provided by an inpatient pharmacy. The average wholesale price is not what families are charged or pay for medications, partly due to differences in overhead costs that result in inpatient pharmacies having significantly higher charges than outpatient pharmacies. In addition, the 6.7% absolute reduction of our primary measure resulted in direct savings by reducing inpatient medication waste. Our process results in 67 fewer wasted ICS devices ($15,960) per 1,000 admissions for asthma exacerbation, extrapolated using the average cost ($238.20, average wholesale price) of each ICS during the baseline period.
Our quality improvement study had several limitations. (1) The interventions occurred at a single center with an established culture that embraces quality improvement, which may limit the generalizability of the work. (2) Our process verified insurance coverage with a hospital-based outpatient pharmacy. Some ICS prescriptions continued to be dispensed from the inpatient pharmacy, limiting our ability to verify insurance coverage. Local factors, including regulatory restrictions and delivery requirements, may limit the generalizability of using an outpatient pharmacy in this manner. (3) We achieved our goal of decreasing medication waste, but our a priori goal was to maintain our commitment to our established practice of interactive patient education with an ICS device as well as medications-in-hand at time of discharge. Our balancing measure showed a decrease in the percent of patients with a discharge prescription for an ICS who also received an inpatient dose of that ICS. This implies a decreased fidelity in our previously established education protocols. We had postulated that this occurred when the patient-supplied medication arrived on the day of discharge, but not close to when the medication was scheduled on the medication administration report, preventing administration. However, this is not a direct measure of patients receiving medications-in-hand or interactive medication education. Both may have occurred without administration of the ICS. (4) Despite a hospital culture that embraces quality improvement, this project required a significant change in the workflow that required considerable education at the time of implementation to integrate the new process reliably. However, once the process was in place, we have been able to sustain our improvement with limited educational investment.
CONCLUSIONS
Implementation of a new process for ordering ICS that emphasized delaying treatment until all necessary information was available and using an outpatient pharmacy to confirm insurance formulary coverage reduced the waste associated with more than one ICS being prescribed during a single admission.
Acknowledgments
The authors thank Sally Pope, MPH and Dr. Michael Carlisle, MD for their contribution to the quality improvement project. Thank you to Drs. Karen McDowell, MD and Carolyn Kercsmar, MD for advisement of our quality improvement project.
The authors appreciate the following individuals for their invaluable contributions. Dr. Hoefgen conceptualized and designed the study, was a member of the primary improvement team, carried out initial analysis, drafted the initial manuscript, and reviewed and revised the manuscript. Drs. Jones and Torres Garcia, and Mr. Hare were members of the primary improvement team who contributed to the design of the quality improvement study and interventions, ongoing data interpretation, and critically reviewed the manuscript. Dr. Courter contributed to the conceptualization and designed the study, was a member of the primary improvement team, designed data collection instruments, and critically reviewed and revised the manuscript. Dr. Simmons conceptualized and designed the study, critically reviewed the manuscript for important intellectual content, and reviewed and revised the manuscript. All authors approved the final manuscript as submitted and agree to be accountable for all aspects of the work.
Disclaimer
The information or content and conclusions are those of the author and should not be construed as the official position or policy of, nor should any endorsements be inferred by the BHPR, HRSA, DHHS, or the U.S. Government.
1. Akinbami LJ, Simon AE, Rossen LM. Changing trends in asthma prevalence among children. Pediatrics. 2016;137(1):e20152354. https://doi.org/10.1542/peds.2015-2354.
2. HCUP Databases. Healthcare Cost and Utilization Project (HCUP). www.hcup.us.ahrq.gov/kidoverview.jsp. Published 2016. Accessed September 14, 2016.
3. NHLBI. Expert Panel Report 3 (EPR-3): Guidelines for the diagnosis and management of asthma–summary report 2007. J Allergy Clin Immunol. 2007;120(5):S94-S138. https://doi.org/10.1016/j.jaci.2007.09.029.
4. Kenyon CC, Rubin DM, Zorc JJ, Mohamad Z, Faerber JA, Feudtner C. Childhood asthma hospital discharge medication fills and risk of subsequent readmission. J Pediatr. 2015;166(5):1121-1127. https://doi.org/10.1016/j.jpeds.2014.12.019.
5. Bollinger ME, Mudd KE, Boldt A, Hsu VD, Tsoukleris MG, Butz AM. Prescription fill patterns in underserved children with asthma receiving subspecialty care. Ann Allergy Asthma Immunol. 2013;111(3):185-189. https://doi.org/10.1016/j.anai.2013.06.009.
6. Cooper WO, Hickson GB. Corticosteroid prescription filling for children covered by Medicaid following an emergency department visit or a hospitalization for asthma. Arch Pediatr Adolesc Med. 2001;155(10):1111-1115. https://doi.org/10.1001/archpedi.155.10.1111.
7. Hatoun J, Bair-Merritt M, Cabral H, Moses J. Increasing medication possession at discharge for patients with asthma: the Meds-in-Hand Project. Pediatrics. 2016;137(3):e20150461-e20150461. https://doi.org/10.1542/peds.2015-0461.
8. Kercsmar CM, Beck AF, Sauers-Ford H, et al. Association of an asthma improvement collaborative with health care utilization in medicaid-insured pediatric patients in an urban community. JAMA Pediatr. 2017;171(11):1072-1080. https://doi.org/10.1001/jamapediatrics.2017.2600.
9. Sauers HS, Beck AF, Kahn RS, Simmons JM. Increasing recruitment rates in an inpatient clinical research study using quality improvement methods. Hosp Pediatr. 2014;4(6):335-341. https://doi.org/10.1542/hpeds.2014-0072.
10. Langley GJ, Moen R, Nolan KM, Nolan TW, Norman CL, Provost LP. The Improvement Guide: A Practical Approach to Enhancing Organizational Performance. Hoboken: John Wiley & Sons, Inc.; 2009.
11. Benneyan JC, Lloyd RC, Plsek PE. Statistical process control as a tool for research and healthcare improvement. Qual Saf Health Care. 2003;12(6):458-464. https://doi.org/10.1136/qhc.12.6.458.
12. Mohammed MA, Panesar JS, Laney DB, Wilson R. Statistical process control charts for attribute data involving very large sample sizes: a review of problems and solutions. BMJ Qual Saf. 2013;22(4):362-368. https://doi.org/10.1136/bmjqs-2012-001373.
13. Moen R, Nolan T, Provost L. Quality Improvement through Planned Experimentation. 2nd ed. New York City: McGraw-Hill Professional; 1998.
Asthma results in approximately 125,000 hospitalizations for children annually in the United States.1,2 The National Heart, Lung, and Blood Institute guidelines recommend that children with persistent asthma be treated with a daily controller medication, ie, an inhaled corticosteroid (ICS).3 Hospitalization for an asthma exacerbation provides an opportunity to optimize daily controller medications and improve disease self-management by providing access to medications and teaching appropriate use of complicated inhalation devices.
To reduce readmission4 by mitigating low rates of postdischarge filling of ICS prescriptions,5,6 a strategy of “meds-in-hand” was implemented at discharge. “Meds-in-hand” mitigates medication access as a barrier to adherence by ensuring that patients are discharged from the hospital with all required medications in hand, removing any barriers to filling their initial prescriptions.7 The Asthma Improvement Collaborative at Cincinnati Children’s Hospital Medical Center (CCHMC) previously applied quality improvement methodology to implement “meds-in-hand” as a key intervention in a broad strategy that successfully reduced asthma-specific utilization for the 30-day period following an asthma-related hospitalization of publicly insured children from 12% to 7%.8,9
At the onset of the work described in this manuscript, children hospitalized with an acute exacerbation of persistent asthma were most often treated with an ICS while inpatients in addition to a standard short course of oral systemic corticosteroids. Conceptually, inpatient administration of ICS provided the opportunity to teach effective device usage with each inpatient administration and to reinforce daily use of the ICS as part of the patient’s daily home medication regimen. However, a proportion of patients admitted for an asthma exacerbation were noted to receive more than one ICS inhaler during their admission, most commonly due to a change in dose or type of ICS. When this occurred, the initially dispensed inhaler was discarded despite weeks of potential doses remaining. While some hospitals preferentially dispense ICS devices marketed to institutions with fewer doses per device, our pharmacy primarily dispensed ICS devices identical to retail locations containing at least a one-month supply of medication. In addition to the wasted medication, this practice resulted in additional work by healthcare staff, unnecessary patient charges, and potentially contributed to confusion about the discharge medication regimen.
Our specific aim for this quality improvement study was to reduce the monthly percentage of admissions for an acute asthma exacerbation treated with >1 ICS from 7% to 4% over a six-month period.
METHODS
Context
CCHMC is a quaternary care pediatric health system with more than 600 inpatient beds and 800-900 inpatient admissions per year for acute asthma exacerbation. The Hospital Medicine service cares for patients with asthma on five clinical teams across two different campuses. Care teams are supervised by an attending physician and may include residents, fellows, or nurse practitioners. Patients hospitalized for an acute asthma exacerbation may receive a consult from the Asthma Center consult team, staffed by faculty from either the Pediatric Pulmonology or Allergy/Immunology divisions. Respiratory therapists (RTs) administer inhaled medications and provide asthma education.
Planning the Intervention
Our improvement team included physicians from Hospital Medicine and Pulmonary Medicine, an Asthma Education Coordinator, a Clinical Pharmacist, a Pediatric Chief Resident, and a clinical research coordinator. Initial interventions targeted a single resident team at the main campus before spreading improvement activities to all resident teams at the main campus and then the satellite campus by February 2017.
Development of our process map (Figure 1) revealed that the decision for ordering inpatient ICS treatment frequently occurred at admission. Subsequently, the care team or consulting team might make a change in the ICS to fine-tune the outpatient medication regimen given that admission for asthma often results from suboptimal chronic symptom control. Baseline analysis of changes in ICS orders revealed that 81% of ICS changes were associated with a step-up in therapy, defined as an increase in the daily dose of the ICS or the addition of a long-acting beta-agonist. The other common ICS adjustment, accounting for 17%, was a change in corticosteroid without a step-up in therapy, (ie, beclomethasone to fluticasone) that typically occurred near the end of the hospitalization to accommodate outpatient insurance formularies, independent of patient factors related to illness severity.
We utilized the model for improvement and sought to decrease the number of patients administered more than one ICS during an admission through a step-wise quality improvement approach, utilizing plan-do-study-act (PDSA) cycles.10 This study was reviewed and designated as not human subjects research by the CCHMC institutional review board.
Improvement Activities
We conceived key drivers or domains that would be necessary to address to effect change. Key drivers included a standardized process for delayed initiation of ICS and confirmation of outpatient insurance prescription drug coverage, prescriber education, and real-time failure notification.
PDSA Interventions
PDSA 1 & 2: Standardized Process for Initiation of ICS
Our initial tests of change targeted the timing of when an ICS was ordered during hospitalization for an asthma exacerbation. Providers were instructed to delay ordering an ICS until the patient’s albuterol treatments were spaced to every three hours and to include a standardized communication prompt within the albuterol order. The prompt instructed the RT to contact the provider once the patient’s albuterol treatments were spaced to every three hours and ask for an ICS order, if appropriate. This intervention was abandoned because it did not reliably occur.
The subsequent intervention delayed the start of ICS treatment by using a PRN indication advising that the ICS was to be administered once the patient’s albuterol treatments were spaced to every three hours. However, after an error resulted in the PRN indication being included on a discharge prescription for an ICS, the PRN indication was abandoned. Subsequent work to develop a standardized process for delayed initiation of ICS occurred as part of the workflow to address the confirmation of outpatient formulary coverage as described next.
PDSA 3: Prioritize the Use of the Institution’s Outpatient Pharmacy
Medication changes that occurred because of outpatient insurance formulary denials were a unique challenge; they required a medication change after the discharge treatment plan had been finalized, and a prescription was already submitted to the outpatient pharmacy. In addition, neither our inpatient electronic medical record nor our inpatient hospital pharmacy has access to decision support tools that incorporate outpatient prescription formulary coverage. Alternatively, outpatient pharmacies have a standard workflow that routinely confirms insurance coverage before dispensing medication. The institutional policy was modified to allow for the inpatient administration of patient-supplied medications, pursuant to an inpatient order. Patient-supplied medications include those brought from home or those supplied by the outpatient pharmacy.
Subsequently, we developed a standardized process to confirm outpatient prescription drug coverage by using our hospital-based outpatient pharmacy to dispense ICS for inpatient treatment and asthma education. This new workflow included placing an order for an ICS at admission as a patient-supplied medication with an administration comment to “please administer once available from the outpatient pharmacy” (Figure 1). Then, once the discharge medication plan is finalized, the prescription is submitted to the outpatient pharmacy. Following verification of insurance coverage, the outpatient pharmacy dispenses the ICS, allowing it to be used for patient education and inpatient administration. If the patient is ineligible to have their prescription filled by the outpatient pharmacy for reasons other than formulary coverage, the ICS is dispensed from the hospital inpatient pharmacy as per the previous standard workflow. Inpatient ICS inhalers are then relabeled for home use per the existing practice to support medications-in-hand.
Further workflow improvements occurred following the development of an algorithm to help the outpatient pharmacy contact the correct inpatient team, and augmentation of the medication delivery process included notification of the RT when the ICS was delivered to the inpatient unit.
PDSA 4: Prescriber Education
Prescribers received education regarding PDSA interventions before testing and throughout the improvement cycle. Education sessions included informal coaching by the Asthma Education Coordinator, e-mail reminders containing screenshots of the ordering process, and formal didactic sessions for ordering providers. The Asthma Education Coordinator also provided education to the nursing and respiratory therapy staff regarding the implemented process and workflow changes.
PDSA 5: Real-Time Failure Notification
To supplement education for the complicated process change, the improvement team utilized a decision support tool (Vigilanz Corp., Chicago, IL) linked to EMR data to provide notification of real-time process failures. When a patient with an admission diagnosis of asthma had a prescription for an ICS verified and dispensed by the inpatient pharmacy, an automated message with relevant patient information would be sent to a member of the improvement team. Following a brief chart review, directed feedback could be offered to the ordering provider, allowing the prescription to be redirected to the outpatient pharmacy.
Study of the Improvement
Patients of all ages, with the International Classification of Diseases, Ninth Revision, and Tenth Revision codes for asthma (493.xx or J45.xx) were included in data collection and analysis if they were treated by the Hospital Medicine service, as the first inpatient service or after transfer from the ICU, and prescribed an ICS with or without a long-acting beta-agonist. Data were collected retrospectively and aggregated monthly. The baseline period was from January 2015 through October 2016. The intervention period was from November 2016 through March 2018. The prolonged baseline and study periods were utilized to understand the seasonal nature of asthma exacerbations.
Measures
Our primary outcome measure was defined as the monthly number of patients admitted to Hospital Medicine for an acute asthma exacerbation administered more than one ICS divided by the total number of asthma patients administered at least one dose of an ICS (patient-supplied or dispensed from the inpatient pharmacy). A full list of ICS is included in the appendix Table.
A secondary process measure approximated our adherence to obtaining ICS from the outpatient pharmacy for inpatient use. All medications administered during hospitalization are documented in the medication administration report. However, only medications dispensed from the inpatient pharmacy are associated with a patient charge. Patient-supplied medications, including those dispensed from the hospital outpatient pharmacy, are not associated with an inpatient charge. Therefore, the secondary process measure was defined as the monthly number of asthma patients administered an ICS not associated with an inpatient charge divided by the total number of asthma patients administered an ICS.
A cost outcome measure was developed to track changes in the average cost of an ICS included on inpatient bills during hospitalization for an asthma exacerbation. This outcome measure was defined as the total monthly cost, using the average wholesale price, of the ICS included on the inpatient bill for an asthma exacerbation, divided by the total number of asthma patients administered at least one dose of an ICS (patient supplied or dispensed from the inpatient pharmacy).
Our a priori intent was to reduce ICS medication waste while maintaining a highly reliable system that included inpatient administration and education with ICS devices and maintain our medications-in-hand practice. A balancing measure was developed to monitor the reliability of inpatient administration of ICS. It was defined as the monthly number of patients who received a discharge prescription for an ICS and were administered an ICS while an inpatient divided by the total number of asthma patients with a discharge prescription for an ICS.
Analysis
Measures were evaluated using statistical process control charts and special cause variation was determined by previously established rules. Our primary, secondary, and balancing measures were all evaluated using a p-chart with variable subgroup size. The cost outcome measure was evaluated using an X-bar S control chart.11-13
RESULTS
Primary Outcome Measure
During the baseline period, 7.4% of patients admitted to Hospital Medicine for an acute asthma exacerbation were administered more than one ICS, ranging from 0%-20% of patients per month (Figure 2). Following the start of our interventions, we met criteria for special cause allowing adjustment of the centerline.13 The mean percentage of patients receiving more than one ICS decreased from 7.4% to 0.7%. Figure 2 includes the n-value displayed each month and represents all patients admitted to the Hospital Medicine service with an asthma exacerbation who were administered at least one ICS.
Secondary Process Measure
During the baseline period, there were only rare occurrences (less than 1%) of a patient-supplied ICS being administered during an asthma admission. Following the start of our intervention period, the frequency of inpatient administration of patient-supplied ICS showed a rapid increase and met rules for special cause with an increase in the mean percent from 0.7% to 50% (Figure 3). The n-value displayed each month represents all patients admitted to the Hospital Medicine service for an asthma exacerbation administered at least one ICS.
Cost Outcome Measure
The average cost of an ICS billed during hospitalization for an acute asthma exacerbation was $236.57 per ICS during the baseline period. After the intervention period, the average inpatient cost for ICS decreased by 62% to $90.25 per ICS (Figure 4).
Balancing Measure
DISCUSSION
Our team reduced the monthly percent of children hospitalized with an acute asthma exacerbation administered more than one ICS from 7.4% to 0.7% after implementation of a new workflow process for ordering ICS utilizing the hospital-based outpatient pharmacy. The new workflow delayed ordering and administration of the initial inpatient ICS treatment, allowing time to consider a step-up in therapy. The brief delay in initiating ICS is not expected to have clinical consequence given the concomitant treatment with systemic corticosteroids. In addition, the outpatient pharmacy was utilized to verify insurance coverage reliably prior to dispensing ICS, reducing medication waste, and discharge delays due to outpatient medication formulary conflicts.
Our hospital’s previous approach to inpatient asthma care resulted in a highly reliable process to ensure patients were discharged with medications-in-hand as part of a broader system that effectively decreased reutilization. However, the previous process inadvertently resulted in medication waste. This waste included nearly full inhalers being discarded, additional work by the healthcare team (ordering providers, pharmacists, and RTs), and unnecessary patient charges.
While the primary driver of our decision to use the outpatient pharmacy was to adjudicate insurance prescription coverage reliably to prevent waste, this change likely resulted in a financial benefit to patients. The average cost per asthma admission of an inpatient billed for ICS using the average wholesale price, decreased by 62% following our interventions. The decrease in cost was primarily driven by using patient-supplied medications, including prescriptions newly filled by the on-site outpatient pharmacy, whose costs were not captured in this measure. While our secondary measure may underestimate the total expense incurred by families for an ICS, families likely receive their medications at a lower cost from the outpatient pharmacy than if the ICS was provided by an inpatient pharmacy. The average wholesale price is not what families are charged or pay for medications, partly due to differences in overhead costs that result in inpatient pharmacies having significantly higher charges than outpatient pharmacies. In addition, the 6.7% absolute reduction of our primary measure resulted in direct savings by reducing inpatient medication waste. Our process results in 67 fewer wasted ICS devices ($15,960) per 1,000 admissions for asthma exacerbation, extrapolated using the average cost ($238.20, average wholesale price) of each ICS during the baseline period.
Our quality improvement study had several limitations. (1) The interventions occurred at a single center with an established culture that embraces quality improvement, which may limit the generalizability of the work. (2) Our process verified insurance coverage with a hospital-based outpatient pharmacy. Some ICS prescriptions continued to be dispensed from the inpatient pharmacy, limiting our ability to verify insurance coverage. Local factors, including regulatory restrictions and delivery requirements, may limit the generalizability of using an outpatient pharmacy in this manner. (3) We achieved our goal of decreasing medication waste, but our a priori goal was to maintain our commitment to our established practice of interactive patient education with an ICS device as well as medications-in-hand at time of discharge. Our balancing measure showed a decrease in the percent of patients with a discharge prescription for an ICS who also received an inpatient dose of that ICS. This implies a decreased fidelity in our previously established education protocols. We had postulated that this occurred when the patient-supplied medication arrived on the day of discharge, but not close to when the medication was scheduled on the medication administration report, preventing administration. However, this is not a direct measure of patients receiving medications-in-hand or interactive medication education. Both may have occurred without administration of the ICS. (4) Despite a hospital culture that embraces quality improvement, this project required a significant change in the workflow that required considerable education at the time of implementation to integrate the new process reliably. However, once the process was in place, we have been able to sustain our improvement with limited educational investment.
CONCLUSIONS
Implementation of a new process for ordering ICS that emphasized delaying treatment until all necessary information was available and using an outpatient pharmacy to confirm insurance formulary coverage reduced the waste associated with more than one ICS being prescribed during a single admission.
Acknowledgments
The authors thank Sally Pope, MPH and Dr. Michael Carlisle, MD for their contribution to the quality improvement project. Thank you to Drs. Karen McDowell, MD and Carolyn Kercsmar, MD for advisement of our quality improvement project.
The authors appreciate the following individuals for their invaluable contributions. Dr. Hoefgen conceptualized and designed the study, was a member of the primary improvement team, carried out initial analysis, drafted the initial manuscript, and reviewed and revised the manuscript. Drs. Jones and Torres Garcia, and Mr. Hare were members of the primary improvement team who contributed to the design of the quality improvement study and interventions, ongoing data interpretation, and critically reviewed the manuscript. Dr. Courter contributed to the conceptualization and designed the study, was a member of the primary improvement team, designed data collection instruments, and critically reviewed and revised the manuscript. Dr. Simmons conceptualized and designed the study, critically reviewed the manuscript for important intellectual content, and reviewed and revised the manuscript. All authors approved the final manuscript as submitted and agree to be accountable for all aspects of the work.
Disclaimer
The information or content and conclusions are those of the author and should not be construed as the official position or policy of, nor should any endorsements be inferred by the BHPR, HRSA, DHHS, or the U.S. Government.
1. Akinbami LJ, Simon AE, Rossen LM. Changing trends in asthma prevalence among children. Pediatrics. 2016;137(1):e20152354. https://doi.org/10.1542/peds.2015-2354.
2. HCUP Databases. Healthcare Cost and Utilization Project (HCUP). www.hcup.us.ahrq.gov/kidoverview.jsp. Published 2016. Accessed September 14, 2016.
3. NHLBI. Expert Panel Report 3 (EPR-3): Guidelines for the diagnosis and management of asthma–summary report 2007. J Allergy Clin Immunol. 2007;120(5):S94-S138. https://doi.org/10.1016/j.jaci.2007.09.029.
4. Kenyon CC, Rubin DM, Zorc JJ, Mohamad Z, Faerber JA, Feudtner C. Childhood asthma hospital discharge medication fills and risk of subsequent readmission. J Pediatr. 2015;166(5):1121-1127. https://doi.org/10.1016/j.jpeds.2014.12.019.
5. Bollinger ME, Mudd KE, Boldt A, Hsu VD, Tsoukleris MG, Butz AM. Prescription fill patterns in underserved children with asthma receiving subspecialty care. Ann Allergy Asthma Immunol. 2013;111(3):185-189. https://doi.org/10.1016/j.anai.2013.06.009.
6. Cooper WO, Hickson GB. Corticosteroid prescription filling for children covered by Medicaid following an emergency department visit or a hospitalization for asthma. Arch Pediatr Adolesc Med. 2001;155(10):1111-1115. https://doi.org/10.1001/archpedi.155.10.1111.
7. Hatoun J, Bair-Merritt M, Cabral H, Moses J. Increasing medication possession at discharge for patients with asthma: the Meds-in-Hand Project. Pediatrics. 2016;137(3):e20150461-e20150461. https://doi.org/10.1542/peds.2015-0461.
8. Kercsmar CM, Beck AF, Sauers-Ford H, et al. Association of an asthma improvement collaborative with health care utilization in medicaid-insured pediatric patients in an urban community. JAMA Pediatr. 2017;171(11):1072-1080. https://doi.org/10.1001/jamapediatrics.2017.2600.
9. Sauers HS, Beck AF, Kahn RS, Simmons JM. Increasing recruitment rates in an inpatient clinical research study using quality improvement methods. Hosp Pediatr. 2014;4(6):335-341. https://doi.org/10.1542/hpeds.2014-0072.
10. Langley GJ, Moen R, Nolan KM, Nolan TW, Norman CL, Provost LP. The Improvement Guide: A Practical Approach to Enhancing Organizational Performance. Hoboken: John Wiley & Sons, Inc.; 2009.
11. Benneyan JC, Lloyd RC, Plsek PE. Statistical process control as a tool for research and healthcare improvement. Qual Saf Health Care. 2003;12(6):458-464. https://doi.org/10.1136/qhc.12.6.458.
12. Mohammed MA, Panesar JS, Laney DB, Wilson R. Statistical process control charts for attribute data involving very large sample sizes: a review of problems and solutions. BMJ Qual Saf. 2013;22(4):362-368. https://doi.org/10.1136/bmjqs-2012-001373.
13. Moen R, Nolan T, Provost L. Quality Improvement through Planned Experimentation. 2nd ed. New York City: McGraw-Hill Professional; 1998.
© 2020 Society of Hospital Medicine
Survey of Academic PHM Programs in the US
Pediatric hospital medicine (PHM) is a relatively new field that has been growing rapidly over the past 20 years.[1] The field has been increasingly recognized for its contributions to high‐quality patient care, patient safety, systems improvement, medical education, and research.[2, 3, 4, 5, 6, 7, 8, 9] However, there appears to be significant variation among programs, even in basic factors such as how clinical effort is defined, the extent of in‐house coverage provided, and the scope of clinical services provided, and there exists a paucity of data describing these variations.[8]
Most previously published work did not specifically focus on academic programs,[2, 3, 8, 9] and specifically targeted hospital leadership,[2] practicing hospitalists,[3] residents,[7] and pediatric residency or clerkship directors,[4, 7] rather than hospitalist directors.[9] Furthermore, previous work focused on specific aspects of PHM programs such as education,[4, 7] value,[2] work environment,[9] and clinical practice,[3] rather than a more comprehensive approach.
We conducted a survey of academic PHM programs to learn about the current state and variation among programs across multiple domains (organizational, administrative, and financial). We speculated that:
- Many institutions currently lacking an academic PHM program were planning on starting a program in the next 3 years.
- Variability exists in hospitalist workload among programs.
- In programs providing clinical coverage at more than 1 site, variability exists in the relationship between the main site and satellite site(s) in terms of decision making, scheduling, and reporting of performance.
METHODS
Sample
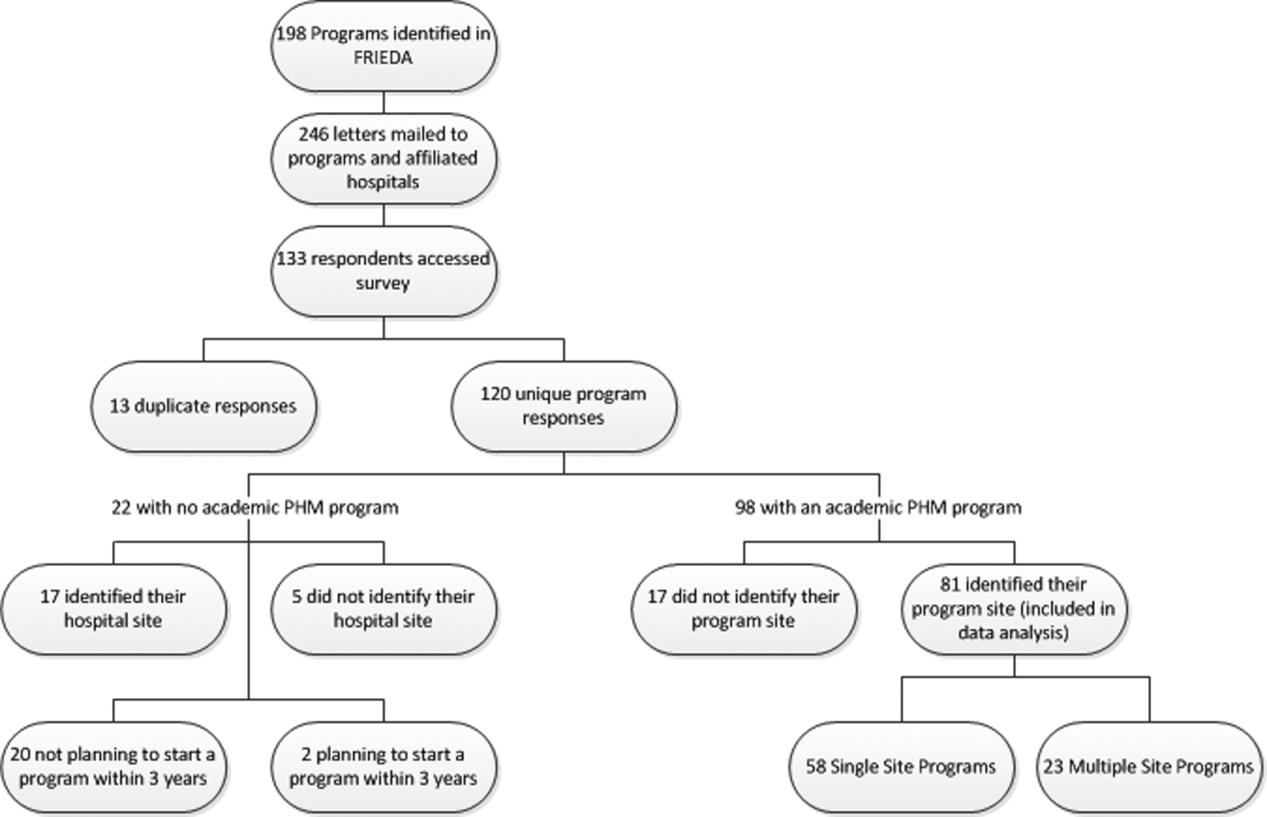
We used the online American Medical Association Fellowship and Residency Electronic Interactive Database (FREIDA) to identify all 198 accredited pediatric residency training programs in the United States. A total of 246 hospitals were affiliated with these programs, and all of these were targeted for the survey. In addition, academic PHM program leaders were targeted directly with email invitations through the American Academy of Pediatrics (AAP) Section on Hospital Medicine LISTSERV.
Survey Instrument
A 49‐question online survey on the administrative, organizational, and financial aspects of academic PHM programs was developed with the input of academic PHM hospital leaders from Cincinnati Children's Hospital Medical Center and St. Louis Children's Hospital. First, the survey questions were developed de novo by the researchers. Then, multiple hospitalist leaders from each institution took the survey and gave feedback on content and structure. Using this feedback, changes were made and then tested by the leaders taking the new version of the survey. This process was repeated for 3 cycles until consensus was reached by the researchers on the final version of the survey. The survey contained questions that asked if the program provided coverage at a single site or at multiple sites and utilized a combination of open‐ended and fixed‐choice questions. For some questions, more than 1 answer was permitted. For the purposes of this survey, we utilized the following definitions adapted from the Society of Hospital Medicine. A hospitalist was defined as a physician who specializes in the practice of hospital medicine.[10] An academic PHM program was defined as any hospitalist practice associated with a pediatric residency program.[11] A nocturnist was defined as a hospitalist who predominantly works a schedule providing night coverage.[12]
Survey Administration
SurveyMonkey, an online survey software, was used to administer the survey. In June 2011, letters were mailed to all 246 hospitals affiliated with an accredited pediatric residency program as described above. These were addressed to either the hospital medicine director (if identified using the institutions Web site) or pediatric residency director. The letter asked the recipient to either participate in the survey or forward the survey to the physician best able to answer the survey. The letters included a description of the study and a link to the online survey. Of note, there was no follow‐up on this process. We also distributed the direct link to the survey and a copy of the letter utilizing the AAP Section on Hospital Medicine LISTSERV. Two reminders were sent through the LISTSERV in the month after the initial request. All respondents were informed that they would receive the deidentified raw data as an incentive to participate in the survey. Respondents were defined as those answering the first question, Does your program have an academic hospitalist program?
Statistical Analysis
Completed survey responses were extracted to Microsoft Excel (Microsoft Corp., Redmond, WA) for data analysis. Basic statistics were utilized to determine response rates for each question. Data were stratified for program type (single site or at multiple sites). For some questions, data were further stratified for the main site of multiple‐site programs for comparison to single‐site programs. In a few instances, more than 1 physician from a particular program responded to the survey. For these, the most appropriate respondent (PHM director, residency director, senior hospitalist) was identified utilizing the programs' publicly available Web site; only that physician's answers were used in the analysis.
Human Subjects Protection
This study was determined to be exempt from review by the Cincinnati Children's Hospital Medical Center and Washington University in St. Louis institutional review boards. All potential responders received written information about the survey. Survey design allowed for anonymous responses with voluntary documentation of program name and responders' contact information. The willingness to respond was qualified as implied consent. Data were deidentified prior to analysis and prior to sharing with the survey participants.
RESULTS
Response Rates
A total of 133 responses were received. Duplicate responses from the same program (13/133) were eliminated from the analysis. This yielded an overall response rate of 48.8% (120/246). A total of 81.7% (98/120) of institutions reported having an academic PHM program. Of the 18.3% (22/120) of institutions reporting not having a program, 9.1% (2/22) reported planning on starting a program in the next 3 years. Of the 98 respondents with an academic PHM program, 17 answered only the first survey question, Does your program have an academic hospitalist program? The remaining 81 completed surveys were left for further analysis. All of these respondents identified their program, and therefore we are certain that there were no duplicate responses in the analytic dataset. Of these, 23 (28%) indicated that their programs provided clinical care at multiple sites, and 58 (72%) indicated that their program provided care at a single site (Figure 1).

Administrative
Respondents reported wide variation for the definition of a 1.0 full‐time employee (FTE) hospitalist in their group. This included the units used (hours/year, weeks/year, shifts/year) as well as actual physician workload (Table 1). Weeks/year was the most common unit utilized by programs to define workload (66% of single‐site programs, 48% of multiple‐site programs), followed by hours/year (19%, 22%) and shifts/year (14%, 22%). The mean and median workload per FTE is represented (Table 1). The large ranges and the standard deviations from the mean indicate variability in workload per FTE (Table 1).
| Single‐Site Program | Multiple‐Site Programs | |||||||||
|---|---|---|---|---|---|---|---|---|---|---|
| % Programs | Mean | Median | SD | Range | % Programs | Mean | Median | SD | Range | |
| ||||||||||
| Weeks on service | 66 | 27.14 | 26 | 8.1 | 1246 | 48 | 27.2 | 24 | 9.6 | 1736 |
| Hours/year | 19 | 1886.25 | 1880 | 231.2 | 16002300 | 22 | 1767.33 | 1738 | 109.0 | 16641944 |
| Shifts/year* | 14 | 183 | 191 | 52.2 | 182240 | 22 | 191 | 184 | 38.3 | 155214 |
Scheduled in‐house hospitalist coverage also varied. Daytime coverage was defined as until 3 to 5 pm, evening coverage was defined a until 10 pm to midnight, and 24‐hour coverage was defined a 24/7. Programs reported plans to increase in‐house coverage with the implementation of the 2011 Accreditation Council for Graduate Medical Education (ACGME) resident work hours restrictions.[13] Among single‐site programs, there was a planned 50% increase in day/evening coverage (14% to 21%), with a planned decrease in day‐only coverage, and no change in 24/7 coverage (Table 2). Among the main sites of multiple‐site programs, there was a planned 50% increase in 24/7 in‐house coverage (35% to 52%), with a planned decrease in day‐only coverage, and no change in day/evening coverage (Table 3). Among the satellite sites of multiple‐site programs, there was a planned 9% increase in 24/7 coverage (41% to 50%), with a planned decrease in day‐only coverage, and no change in day/evening coverage (Table 2). Most programs reported that all hospitalists share night coverage (87% single site, 89% multiple sites) (Table 2). Multiple‐site programs were more likely than single‐site programs to use nocturnists, moonlighters, and incentives for those providing evening or night coverage (Table 2).
| Single Site (n=58) | Main Site of Multiple‐Site Programs (n=23) | |||
|---|---|---|---|---|
| Proportion | Response Rate | Proportion | Response Rate | |
| ||||
| Organizational | ||||
| Night shifts | .79 (46/58) | .83 (19/23) | ||
| All share nights | .87 (40/46) | .89 (17/19) | ||
| Nocturnists | .09 (4/46) | .26 (5/19) | ||
| Moonlighters | .04 (2/46) | .12 (2/19) | ||
| Night shift incentives | .74 (43/58) | .78 (18/23) | ||
| Financial | .12 (5/43) | .28 (5/18) | ||
| Time | .12 (5/43) | .22 (4/18) | ||
| No incentives | .79 (34/43) | .61 (11/18) | ||
| In‐house hospitalist coverage pre July 2011a | 1.0 (58/58) | 1.0 (23/23) | ||
| 24/7 | .29 (17/58) | .35 (8/23) | ||
| Day and evening | .14 (8/58) | .17 (4/23) | ||
| Day only | .57 (33/58) | .48 (11/23) | ||
| In‐house hospitalist coverage post July 2011a | 1.0 (58/58) | 1.0 (23/23) | ||
| 24/7 | .29 (17/58) | .52 (12/23) | ||
| Day and evening | .21 (12/58) | .17 (4/23) | ||
| Day only | .50 (29/58) | .30 (7/23) | ||
| Administrative | ||||
| Own division | .32 (18/57) | .98 (57/58) | .74 (17/23) | 1.0 (23/23) |
| Part of another division | .68 (39/57) | .26 (6/23) | ||
| Financial | ||||
| Revenues>expenses | .26 (14/53) | .91 (53/58) | .04 (1/23) | .04 (19/23) |
| Incentives supplement base salary | .45 (25/55) | .95 (55/58) | .48 (10/21) | .91 (21/23) |
| Metrics used to determine incentivesb | .47 (27/58) | .52 (12/23) | ||
| RVUs/MD | .85 (23/27) | .83 (10/12) | ||
| Costs/discharge | .19 (5/27) | .08 (1/12) | ||
| Financial reportingb | .81 (47/58) | .04 (19/23) | ||
| Charges | .64 (30/47) | .68 (13/19) | ||
| Collections | .66 (31/47) | .68 (13/19) | ||
| RVUs | .77 (36/47) | .47 (9/19) | ||
| Main Site (n=23) | Satellite Sites (n=51) | |||
|---|---|---|---|---|
| Proportion | Response Rate | Proportion | Response Rate | |
| In‐house hospitalist coverage pre July 2011 | 1.0 (23/23) | .80 (41/51) | ||
| 24/7 | .35 (8/23) | .41 (17/41) | ||
| Day and evening | .17 (4/23) | .10 (4/41) | ||
| Day only | .48 (11/23) | .49 (20/41) | ||
| In‐house hospitalist coverage post July 2011 | 1.0 (23/23) | |||
| 24/7 | .52 (12/23) | .50 (19/38) | .75 (38/51) | |
| Day and evening | .17 (4/23) | .11 (4/38) | ||
| Day only | .30 (7/23) | .39 (15/38) | ||
| Night shift coverage | .83 (19/23) | .78 (18/23) | ||
| All share nights | .89 (17/19) | .94 (17/18) | ||
| Nocturnists | .26 (5/19) | .22 (4/18) | ||
| Moonlighters | .12 (2/19) | .17 (3/18) | ||
The vast majority of multiple‐site programs reported that their different clinical sites are considered parts of a single hospitalist program (96%), and that there is a designated medical director for each site (83%). However, only 70% of multiple‐site programs report that decisions concerning physician coverage are made as a group, and only 65% report that scheduling is done centrally. In addition, there is variability in how quality, safety, and patient satisfaction is reported (group vs site). The majority of programs report sharing revenues and expenses among the sites (Table 4).
| Proportion | Response Rate | |
|---|---|---|
| Sites regularly collaborate on: | 1.0 (23/23) | |
| Quality improvement projects | .74 (17/23) | |
| Safety initiatives | .74 (17/23) | |
| Research | .48 (11/23) | |
| Have a designated hospitalist medical director for each site | .83 (19/23) | 1.0 (23/23) |
| Different sites considered parts of a single hospitalist program | .96 (22/23) | 1.0 (23/23) |
| Make decisions on program/coverage/hour changes as a group | .70 (16/23) | 1.0 (23/23) |
| Scheduling done centrally | .65 (15/23) | 1.0 (23/23) |
| Report or track the following as individual sites: | ||
| Quality measures | .43 (9/21) | .91 (21/23) |
| Safety measures | .48 (10/21) | .91 (21/23) |
| Patient satisfaction | .50 (10/20) | .87 (20/23) |
| Report or track the following as a group: | ||
| Quality measures | .33 (7/21) | .91 (21/23) |
| Safety measures | .33 (7/21) | .91 (21/23) |
| Patient satisfaction | .30 (6/20) | .87 (20/23) |
| Report or track the following as both individual sites and as a group: | ||
| Quality measures | .24 (5/21) | .91 (21/23) |
| Safety measures | .19 (4/21) | .91 (21/23) |
| Patient satisfaction | .25 (4/20) | .87 (20/23) |
| Sites share revenues and expenses | .67 (14/21) | .91 (21/23) |
Organizational
Of the single‐site programs that answered the question Is your hospital medicine program considered its own division or a section within another division? 32% reported that their programs were considered its own division, and 68% reported that they were a part of another division, predominately (62%) general pediatrics, but also a few (6% combined) within emergency medicine, critical care, physical medicine and rehabilitation, and infectious diseases. Of the multiple‐site programs, a majority of 74% programs were their own division, and 26% were part of another division (Table 2). Respondents reported that their satellite sites included pediatric units in small community hospitals, small pediatric hospitals, large nonpediatric hospitals with pediatric units, rehabilitation facilities, and Shriner orthopedic hospitals.
Financial
Of the single‐site programs that answered the question Do patient revenues produced by your hospitalist group cover all expenses? only 26% reported that revenues exceeded expenses. Of the multiple‐site programs responding to this question, only 4% reported that the main site of their programs had revenues greater than expenses (Table 2). Programs used a combination of metrics to report revenue, and relative value unit (RVU)/medical doctor (MD) is the most commonly used metric to determine incentive pay (Table 2).
DISCUSSION
Our study demonstrates that academic PHM programs are common, which is consistent with previous data.[4, 7, 9, 14] The data support our belief that more institutions are planning on starting PHM programs. However, there exist much variability in a variety of program factors.[2, 3, 8, 9, 14] The fact that up to 35% of categorical pediatric residents are considering a career as a hospitalist further highlights the need for better data on PHM programs.[7]
We demonstrated that variability existed in hospitalist workload at academic PHM programs. We found considerable variation in the workload per hospitalist (large ranges and standard deviations), as well as variability in how an FTE is defined (hours/year, weeks/year, shifts/year) (Table 1). In addition, survey respondents might have interpreted certain questions differently, and this might have led to increased variability in the data. For example, the question concerning the definition of an FTE was worded as A clinical FTE is defined as. Some of the reported variation in workload might be partially explained by hospitalists having additional nonclinical responsibilities within hospital medicine or another field, including protected time for quality improvement, medical education, research, or administrative activities. Furthermore, some hospitalists might have clinical responsibilities outside of hospital medicine. Given that most PHM programs lack a formal internal definition of what it means to be a hospitalist,[7] it is not surprising to find such variation between programs. The variability in the extent of in‐house coverage provided by academic PHM programs, as well as institutional plans for increased coverage with the 2011 residency work‐hours restrictions is also described, and is consistent with other recently published data.[14] This is likely to continue, as 70% of academic PHM programs reported an anticipated increase in coverage in the near future,[14] suggesting that academic hospitalists are being used to help fill gaps in coverage left by changes in resident staffing.
Our data describe the percentage of academic programs that have a distinct division of hospital medicine. The fact that multisite programs were more likely to report being a distinct division might reflect the increased complexities of providing care at more than 1 site, requiring a greater infrastructure. This might be important in institutional planning as well as academic and financial expectations of academic pediatric hospitalists.
We also demonstrated that programs with multiple sites differ as far as the degree of integration of the various sites, with variation reported in decision making, scheduling, and how quality, safety, and patient satisfaction are reported (Table 4). Whether or not increased integration between the various clinical sites of a multiple‐site program is associated with better performance and/or physician satisfaction are questions that need to be answered. However, academic PHM directors would likely agree that there are great challenges inherent in managing these programs. These challenges include professional integration (do hospitalists based at satellite sites feel that they are academically supported?), clinical work/expectations (fewer resources and fewer learners at satellite sites likely affects workload), and administrative issues (physician scheduling likely becomes more complex as the number of sites increases). As programs continue to grow and provide clinical services in multiple geographic sites, it will become more important to understand how the different sites are coordinated to identify and develop best practices.
Older studies have described that the majority of PHM programs (70%78%) reported that professional revenues do not cover expenses, unfortunately these results were not stratified for program type (academic vs community).[2, 9]
Our study describes that few academic PHM programs (26% of single site, 4% of multiple‐site programs) report revenues (defined in our survey as only the collections from professional billing) in excess of expenses. This is consistent with prior studies that have included both academic and community PHM programs.[2] Therefore, it appears to be common for PHM programs to require institutional funding to cover all program expenses, as collections from professional billing are not generally adequate for this purpose. We believe that this is a critical point for both hospitalists and administrators to understand. However, it is equally important that they be transparent about the importance and value of the nonrevenue‐generating work performed by PHM programs. It has been reported that the vast majority of pediatric hospitalists are highly involved in education, quality improvement work, practice guideline development, and other work that is vitally important to institutions.[3] Furthermore, although one might expect PHM leaders to believe that their programs add value beyond the professional revenue collected,[9] even hospital leadership has been reported to perceive that PHM programs add value in several ways, including increased patient satisfaction (94%), increased referring MD satisfaction (90%), decreased length of stay (81%), and decreased costs (62%).[2] Pediatric residency and clerkship directors report that pediatric hospitalists are more accessible than other faculty (84% vs 64%) and are associated with an increase in the practice of evidence‐based medicine (76% vs 61%).[4] Therefore, there is strong evidence supporting that pediatric hospitalist programs provide important value that is not evident on a balance sheet.
In addition, our data also indicate that programs currently use a variety of metrics in combination to report productivity, and there is no accepted gold standard for measuring the performance of a hospitalist or hospitalist program (Table 2). Given that hospitalists generally cannot control how many patients they see, and given the fact that hospitalists are strongly perceived to provide value to their institutions beyond generating clinical revenue, metrics such as RVUs and charges likely do not accurately represent actual productivity.[2] Furthermore, it is likely that the metrics currently used underestimate actual productivity as they are not designed to take into account confounding factors that might affect hospitalist productivity. For example, consider an academic hospitalist who has clinical responsibilities divided between direct patient care and supervisory patient care (such as a team with some combination of residents, medical students, and physician extenders). When providing direct patient care, the hospitalist is likely responsible or all of the tasks usually performed by residents, including writing all patient notes and prescriptions, all communication with families, nurses, specialists, and primary care providers; and discharge planning. Conversely, when providing supervisory care, it is likely that the tasks are divided among the team members, and the hospitalist has the additional responsibility for providing teaching. However, the hospitalist might be responsible for more complex and acute patients. These factors are not adequately measured by RVUs or professional billing. Furthermore, these metrics do not capture the differences in providing in‐house daytime versus evening/night coverage, and do not measure the work performed while being on call when outside of the hospital. It is important for PHM programs and leaders to develop a better representation of the value provided by hospitalists, and for institutional leaders to understand this value, because previous work has suggested that the majority of hospital leaders do not plan to phase out the subsidy of hospitalists over time, as they do not anticipate the program(s) will be able to covercosts.[2] Given the realities of decreasing reimbursement and healthcare reform, it is unlikely to become more common for PHM programs to generate enough professional revenue to cover expenses.
The main strength of this descriptive study is the comprehensive nature of the survey, including many previously unreported data. In addition, the data are consistent with previously published work, which validates the quality of the data.
This study has several limitations including a low response rate and the exclusion of some hospitals or programs because they provided insufficient data for analysis. However, a post hoc analysis demonstrated that the majority of the institutions reporting that they did not have an academic PHM program (18/22), and those that were excluded due to insufficient data (12/17) were either smaller residency programs (<60 residents) or hospitals that were not the main site of a residency program. Therefore, our data likely are a good representation of academic PHM programs at larger academic institutions. Another potential weakness is that, although PHM program directors and pediatric residency directors were targeted, the respondent might not have been the person with the best knowledge of the program, which could have produced inaccurate data, particularly in terms of finances. However, the general consistency of our findings with previous work, particularly the high percentage of institutions with academic PHM programs,[4, 7, 9, 14] the low percentage of programs with revenues greater than expenses,[2, 9] and the trend toward increased in‐house coverage associated with the 2011 ACGME work‐hour restrictions,[14] supports the validity of our other results. In addition, survey respondents might have interpreted certain questions differently, specifically the questions concerning the definition of an FTE, and this might have led to increased variability in the data.
CONCLUSIONS
Academic PHM programs exist in the vast majority of academic centers, and more institutions are planning on starting programs in the next few years. There appears to be variability in a number of program factors, including hospitalist workload, in‐house coverage, and whether the program is a separate division or a section within another academic division. Many programs are currently providing care at more than 1 site. Programs uncommonly reported that their revenues exceeded their expenses. These data are the most comprehensive data existing for academic PHM programs.
Acknowledgment
Disclosure: Nothing to report.
- . Pediatric hospital medicine: historical perspectives, inspired future. Curr Probl Pediatr Adolesc Health Care. 2012;42(5):107–112.
- , , . Assessing the value of pediatric hospitalist programs: the perspective of hospital leaders. Acad Pediatr. 2009;9(3):192–196.
- , . Pediatric hospitalists: training, current practice, and career goals. J Hosp Med. 2009;4(3):179–186.
- , , . Hospitalists' involvement in pediatrics training: perspectives from pediatric residency program and clerkship directors. Acad Med. 2009;84(11):1617–1621.
- , . Research in pediatric hospital medicine: how research will impact clinical care. Curr Probl Pediatr Adolesc Health Care. 2012;42(5):127–130.
- , . Pediatric hospitalists in medical education: current roles and future directions. Curr Probl Pediatr Adolesc Health Care. 2012;42(5):120–126.
- , , , , . Pediatric hospitalists' influences on education and career plans. J Hosp Med. 2012;7(4):282–286.
- , . Pediatric hospitalist systems versus traditional models of care: effect on quality and cost outcomes. J Hosp Med. 2012;7(4):350–357.
- , , , . Characteristics of the pediatric hospitalist workforce: its roles and work environment. Pediatrics. 2007;120(33):33–39.
- Society of Hospital Medicine. Definition of a hospitalist and hospital medicine. Available at: http://www.hospitalmedicine.org/AM/Template.cfm?Section=Hospitalist_Definition7(4):299–303.
Pediatric hospital medicine (PHM) is a relatively new field that has been growing rapidly over the past 20 years.[1] The field has been increasingly recognized for its contributions to high‐quality patient care, patient safety, systems improvement, medical education, and research.[2, 3, 4, 5, 6, 7, 8, 9] However, there appears to be significant variation among programs, even in basic factors such as how clinical effort is defined, the extent of in‐house coverage provided, and the scope of clinical services provided, and there exists a paucity of data describing these variations.[8]
Most previously published work did not specifically focus on academic programs,[2, 3, 8, 9] and specifically targeted hospital leadership,[2] practicing hospitalists,[3] residents,[7] and pediatric residency or clerkship directors,[4, 7] rather than hospitalist directors.[9] Furthermore, previous work focused on specific aspects of PHM programs such as education,[4, 7] value,[2] work environment,[9] and clinical practice,[3] rather than a more comprehensive approach.
We conducted a survey of academic PHM programs to learn about the current state and variation among programs across multiple domains (organizational, administrative, and financial). We speculated that:
- Many institutions currently lacking an academic PHM program were planning on starting a program in the next 3 years.
- Variability exists in hospitalist workload among programs.
- In programs providing clinical coverage at more than 1 site, variability exists in the relationship between the main site and satellite site(s) in terms of decision making, scheduling, and reporting of performance.
METHODS
Sample
We used the online American Medical Association Fellowship and Residency Electronic Interactive Database (FREIDA) to identify all 198 accredited pediatric residency training programs in the United States. A total of 246 hospitals were affiliated with these programs, and all of these were targeted for the survey. In addition, academic PHM program leaders were targeted directly with email invitations through the American Academy of Pediatrics (AAP) Section on Hospital Medicine LISTSERV.
Survey Instrument
A 49‐question online survey on the administrative, organizational, and financial aspects of academic PHM programs was developed with the input of academic PHM hospital leaders from Cincinnati Children's Hospital Medical Center and St. Louis Children's Hospital. First, the survey questions were developed de novo by the researchers. Then, multiple hospitalist leaders from each institution took the survey and gave feedback on content and structure. Using this feedback, changes were made and then tested by the leaders taking the new version of the survey. This process was repeated for 3 cycles until consensus was reached by the researchers on the final version of the survey. The survey contained questions that asked if the program provided coverage at a single site or at multiple sites and utilized a combination of open‐ended and fixed‐choice questions. For some questions, more than 1 answer was permitted. For the purposes of this survey, we utilized the following definitions adapted from the Society of Hospital Medicine. A hospitalist was defined as a physician who specializes in the practice of hospital medicine.[10] An academic PHM program was defined as any hospitalist practice associated with a pediatric residency program.[11] A nocturnist was defined as a hospitalist who predominantly works a schedule providing night coverage.[12]
Survey Administration
SurveyMonkey, an online survey software, was used to administer the survey. In June 2011, letters were mailed to all 246 hospitals affiliated with an accredited pediatric residency program as described above. These were addressed to either the hospital medicine director (if identified using the institutions Web site) or pediatric residency director. The letter asked the recipient to either participate in the survey or forward the survey to the physician best able to answer the survey. The letters included a description of the study and a link to the online survey. Of note, there was no follow‐up on this process. We also distributed the direct link to the survey and a copy of the letter utilizing the AAP Section on Hospital Medicine LISTSERV. Two reminders were sent through the LISTSERV in the month after the initial request. All respondents were informed that they would receive the deidentified raw data as an incentive to participate in the survey. Respondents were defined as those answering the first question, Does your program have an academic hospitalist program?
Statistical Analysis
Completed survey responses were extracted to Microsoft Excel (Microsoft Corp., Redmond, WA) for data analysis. Basic statistics were utilized to determine response rates for each question. Data were stratified for program type (single site or at multiple sites). For some questions, data were further stratified for the main site of multiple‐site programs for comparison to single‐site programs. In a few instances, more than 1 physician from a particular program responded to the survey. For these, the most appropriate respondent (PHM director, residency director, senior hospitalist) was identified utilizing the programs' publicly available Web site; only that physician's answers were used in the analysis.
Human Subjects Protection
This study was determined to be exempt from review by the Cincinnati Children's Hospital Medical Center and Washington University in St. Louis institutional review boards. All potential responders received written information about the survey. Survey design allowed for anonymous responses with voluntary documentation of program name and responders' contact information. The willingness to respond was qualified as implied consent. Data were deidentified prior to analysis and prior to sharing with the survey participants.
RESULTS
Response Rates
A total of 133 responses were received. Duplicate responses from the same program (13/133) were eliminated from the analysis. This yielded an overall response rate of 48.8% (120/246). A total of 81.7% (98/120) of institutions reported having an academic PHM program. Of the 18.3% (22/120) of institutions reporting not having a program, 9.1% (2/22) reported planning on starting a program in the next 3 years. Of the 98 respondents with an academic PHM program, 17 answered only the first survey question, Does your program have an academic hospitalist program? The remaining 81 completed surveys were left for further analysis. All of these respondents identified their program, and therefore we are certain that there were no duplicate responses in the analytic dataset. Of these, 23 (28%) indicated that their programs provided clinical care at multiple sites, and 58 (72%) indicated that their program provided care at a single site (Figure 1).
Administrative
Respondents reported wide variation for the definition of a 1.0 full‐time employee (FTE) hospitalist in their group. This included the units used (hours/year, weeks/year, shifts/year) as well as actual physician workload (Table 1). Weeks/year was the most common unit utilized by programs to define workload (66% of single‐site programs, 48% of multiple‐site programs), followed by hours/year (19%, 22%) and shifts/year (14%, 22%). The mean and median workload per FTE is represented (Table 1). The large ranges and the standard deviations from the mean indicate variability in workload per FTE (Table 1).
| Single‐Site Program | Multiple‐Site Programs | |||||||||
|---|---|---|---|---|---|---|---|---|---|---|
| % Programs | Mean | Median | SD | Range | % Programs | Mean | Median | SD | Range | |
| ||||||||||
| Weeks on service | 66 | 27.14 | 26 | 8.1 | 1246 | 48 | 27.2 | 24 | 9.6 | 1736 |
| Hours/year | 19 | 1886.25 | 1880 | 231.2 | 16002300 | 22 | 1767.33 | 1738 | 109.0 | 16641944 |
| Shifts/year* | 14 | 183 | 191 | 52.2 | 182240 | 22 | 191 | 184 | 38.3 | 155214 |
Scheduled in‐house hospitalist coverage also varied. Daytime coverage was defined as until 3 to 5 pm, evening coverage was defined a until 10 pm to midnight, and 24‐hour coverage was defined a 24/7. Programs reported plans to increase in‐house coverage with the implementation of the 2011 Accreditation Council for Graduate Medical Education (ACGME) resident work hours restrictions.[13] Among single‐site programs, there was a planned 50% increase in day/evening coverage (14% to 21%), with a planned decrease in day‐only coverage, and no change in 24/7 coverage (Table 2). Among the main sites of multiple‐site programs, there was a planned 50% increase in 24/7 in‐house coverage (35% to 52%), with a planned decrease in day‐only coverage, and no change in day/evening coverage (Table 3). Among the satellite sites of multiple‐site programs, there was a planned 9% increase in 24/7 coverage (41% to 50%), with a planned decrease in day‐only coverage, and no change in day/evening coverage (Table 2). Most programs reported that all hospitalists share night coverage (87% single site, 89% multiple sites) (Table 2). Multiple‐site programs were more likely than single‐site programs to use nocturnists, moonlighters, and incentives for those providing evening or night coverage (Table 2).
| Single Site (n=58) | Main Site of Multiple‐Site Programs (n=23) | |||
|---|---|---|---|---|
| Proportion | Response Rate | Proportion | Response Rate | |
| ||||
| Organizational | ||||
| Night shifts | .79 (46/58) | .83 (19/23) | ||
| All share nights | .87 (40/46) | .89 (17/19) | ||
| Nocturnists | .09 (4/46) | .26 (5/19) | ||
| Moonlighters | .04 (2/46) | .12 (2/19) | ||
| Night shift incentives | .74 (43/58) | .78 (18/23) | ||
| Financial | .12 (5/43) | .28 (5/18) | ||
| Time | .12 (5/43) | .22 (4/18) | ||
| No incentives | .79 (34/43) | .61 (11/18) | ||
| In‐house hospitalist coverage pre July 2011a | 1.0 (58/58) | 1.0 (23/23) | ||
| 24/7 | .29 (17/58) | .35 (8/23) | ||
| Day and evening | .14 (8/58) | .17 (4/23) | ||
| Day only | .57 (33/58) | .48 (11/23) | ||
| In‐house hospitalist coverage post July 2011a | 1.0 (58/58) | 1.0 (23/23) | ||
| 24/7 | .29 (17/58) | .52 (12/23) | ||
| Day and evening | .21 (12/58) | .17 (4/23) | ||
| Day only | .50 (29/58) | .30 (7/23) | ||
| Administrative | ||||
| Own division | .32 (18/57) | .98 (57/58) | .74 (17/23) | 1.0 (23/23) |
| Part of another division | .68 (39/57) | .26 (6/23) | ||
| Financial | ||||
| Revenues>expenses | .26 (14/53) | .91 (53/58) | .04 (1/23) | .04 (19/23) |
| Incentives supplement base salary | .45 (25/55) | .95 (55/58) | .48 (10/21) | .91 (21/23) |
| Metrics used to determine incentivesb | .47 (27/58) | .52 (12/23) | ||
| RVUs/MD | .85 (23/27) | .83 (10/12) | ||
| Costs/discharge | .19 (5/27) | .08 (1/12) | ||
| Financial reportingb | .81 (47/58) | .04 (19/23) | ||
| Charges | .64 (30/47) | .68 (13/19) | ||
| Collections | .66 (31/47) | .68 (13/19) | ||
| RVUs | .77 (36/47) | .47 (9/19) | ||
| Main Site (n=23) | Satellite Sites (n=51) | |||
|---|---|---|---|---|
| Proportion | Response Rate | Proportion | Response Rate | |
| In‐house hospitalist coverage pre July 2011 | 1.0 (23/23) | .80 (41/51) | ||
| 24/7 | .35 (8/23) | .41 (17/41) | ||
| Day and evening | .17 (4/23) | .10 (4/41) | ||
| Day only | .48 (11/23) | .49 (20/41) | ||
| In‐house hospitalist coverage post July 2011 | 1.0 (23/23) | |||
| 24/7 | .52 (12/23) | .50 (19/38) | .75 (38/51) | |
| Day and evening | .17 (4/23) | .11 (4/38) | ||
| Day only | .30 (7/23) | .39 (15/38) | ||
| Night shift coverage | .83 (19/23) | .78 (18/23) | ||
| All share nights | .89 (17/19) | .94 (17/18) | ||
| Nocturnists | .26 (5/19) | .22 (4/18) | ||
| Moonlighters | .12 (2/19) | .17 (3/18) | ||
The vast majority of multiple‐site programs reported that their different clinical sites are considered parts of a single hospitalist program (96%), and that there is a designated medical director for each site (83%). However, only 70% of multiple‐site programs report that decisions concerning physician coverage are made as a group, and only 65% report that scheduling is done centrally. In addition, there is variability in how quality, safety, and patient satisfaction is reported (group vs site). The majority of programs report sharing revenues and expenses among the sites (Table 4).
| Proportion | Response Rate | |
|---|---|---|
| Sites regularly collaborate on: | 1.0 (23/23) | |
| Quality improvement projects | .74 (17/23) | |
| Safety initiatives | .74 (17/23) | |
| Research | .48 (11/23) | |
| Have a designated hospitalist medical director for each site | .83 (19/23) | 1.0 (23/23) |
| Different sites considered parts of a single hospitalist program | .96 (22/23) | 1.0 (23/23) |
| Make decisions on program/coverage/hour changes as a group | .70 (16/23) | 1.0 (23/23) |
| Scheduling done centrally | .65 (15/23) | 1.0 (23/23) |
| Report or track the following as individual sites: | ||
| Quality measures | .43 (9/21) | .91 (21/23) |
| Safety measures | .48 (10/21) | .91 (21/23) |
| Patient satisfaction | .50 (10/20) | .87 (20/23) |
| Report or track the following as a group: | ||
| Quality measures | .33 (7/21) | .91 (21/23) |
| Safety measures | .33 (7/21) | .91 (21/23) |
| Patient satisfaction | .30 (6/20) | .87 (20/23) |
| Report or track the following as both individual sites and as a group: | ||
| Quality measures | .24 (5/21) | .91 (21/23) |
| Safety measures | .19 (4/21) | .91 (21/23) |
| Patient satisfaction | .25 (4/20) | .87 (20/23) |
| Sites share revenues and expenses | .67 (14/21) | .91 (21/23) |
Organizational
Of the single‐site programs that answered the question Is your hospital medicine program considered its own division or a section within another division? 32% reported that their programs were considered its own division, and 68% reported that they were a part of another division, predominately (62%) general pediatrics, but also a few (6% combined) within emergency medicine, critical care, physical medicine and rehabilitation, and infectious diseases. Of the multiple‐site programs, a majority of 74% programs were their own division, and 26% were part of another division (Table 2). Respondents reported that their satellite sites included pediatric units in small community hospitals, small pediatric hospitals, large nonpediatric hospitals with pediatric units, rehabilitation facilities, and Shriner orthopedic hospitals.
Financial
Of the single‐site programs that answered the question Do patient revenues produced by your hospitalist group cover all expenses? only 26% reported that revenues exceeded expenses. Of the multiple‐site programs responding to this question, only 4% reported that the main site of their programs had revenues greater than expenses (Table 2). Programs used a combination of metrics to report revenue, and relative value unit (RVU)/medical doctor (MD) is the most commonly used metric to determine incentive pay (Table 2).
DISCUSSION
Our study demonstrates that academic PHM programs are common, which is consistent with previous data.[4, 7, 9, 14] The data support our belief that more institutions are planning on starting PHM programs. However, there exist much variability in a variety of program factors.[2, 3, 8, 9, 14] The fact that up to 35% of categorical pediatric residents are considering a career as a hospitalist further highlights the need for better data on PHM programs.[7]
We demonstrated that variability existed in hospitalist workload at academic PHM programs. We found considerable variation in the workload per hospitalist (large ranges and standard deviations), as well as variability in how an FTE is defined (hours/year, weeks/year, shifts/year) (Table 1). In addition, survey respondents might have interpreted certain questions differently, and this might have led to increased variability in the data. For example, the question concerning the definition of an FTE was worded as A clinical FTE is defined as. Some of the reported variation in workload might be partially explained by hospitalists having additional nonclinical responsibilities within hospital medicine or another field, including protected time for quality improvement, medical education, research, or administrative activities. Furthermore, some hospitalists might have clinical responsibilities outside of hospital medicine. Given that most PHM programs lack a formal internal definition of what it means to be a hospitalist,[7] it is not surprising to find such variation between programs. The variability in the extent of in‐house coverage provided by academic PHM programs, as well as institutional plans for increased coverage with the 2011 residency work‐hours restrictions is also described, and is consistent with other recently published data.[14] This is likely to continue, as 70% of academic PHM programs reported an anticipated increase in coverage in the near future,[14] suggesting that academic hospitalists are being used to help fill gaps in coverage left by changes in resident staffing.
Our data describe the percentage of academic programs that have a distinct division of hospital medicine. The fact that multisite programs were more likely to report being a distinct division might reflect the increased complexities of providing care at more than 1 site, requiring a greater infrastructure. This might be important in institutional planning as well as academic and financial expectations of academic pediatric hospitalists.
We also demonstrated that programs with multiple sites differ as far as the degree of integration of the various sites, with variation reported in decision making, scheduling, and how quality, safety, and patient satisfaction are reported (Table 4). Whether or not increased integration between the various clinical sites of a multiple‐site program is associated with better performance and/or physician satisfaction are questions that need to be answered. However, academic PHM directors would likely agree that there are great challenges inherent in managing these programs. These challenges include professional integration (do hospitalists based at satellite sites feel that they are academically supported?), clinical work/expectations (fewer resources and fewer learners at satellite sites likely affects workload), and administrative issues (physician scheduling likely becomes more complex as the number of sites increases). As programs continue to grow and provide clinical services in multiple geographic sites, it will become more important to understand how the different sites are coordinated to identify and develop best practices.
Older studies have described that the majority of PHM programs (70%78%) reported that professional revenues do not cover expenses, unfortunately these results were not stratified for program type (academic vs community).[2, 9]
Our study describes that few academic PHM programs (26% of single site, 4% of multiple‐site programs) report revenues (defined in our survey as only the collections from professional billing) in excess of expenses. This is consistent with prior studies that have included both academic and community PHM programs.[2] Therefore, it appears to be common for PHM programs to require institutional funding to cover all program expenses, as collections from professional billing are not generally adequate for this purpose. We believe that this is a critical point for both hospitalists and administrators to understand. However, it is equally important that they be transparent about the importance and value of the nonrevenue‐generating work performed by PHM programs. It has been reported that the vast majority of pediatric hospitalists are highly involved in education, quality improvement work, practice guideline development, and other work that is vitally important to institutions.[3] Furthermore, although one might expect PHM leaders to believe that their programs add value beyond the professional revenue collected,[9] even hospital leadership has been reported to perceive that PHM programs add value in several ways, including increased patient satisfaction (94%), increased referring MD satisfaction (90%), decreased length of stay (81%), and decreased costs (62%).[2] Pediatric residency and clerkship directors report that pediatric hospitalists are more accessible than other faculty (84% vs 64%) and are associated with an increase in the practice of evidence‐based medicine (76% vs 61%).[4] Therefore, there is strong evidence supporting that pediatric hospitalist programs provide important value that is not evident on a balance sheet.
In addition, our data also indicate that programs currently use a variety of metrics in combination to report productivity, and there is no accepted gold standard for measuring the performance of a hospitalist or hospitalist program (Table 2). Given that hospitalists generally cannot control how many patients they see, and given the fact that hospitalists are strongly perceived to provide value to their institutions beyond generating clinical revenue, metrics such as RVUs and charges likely do not accurately represent actual productivity.[2] Furthermore, it is likely that the metrics currently used underestimate actual productivity as they are not designed to take into account confounding factors that might affect hospitalist productivity. For example, consider an academic hospitalist who has clinical responsibilities divided between direct patient care and supervisory patient care (such as a team with some combination of residents, medical students, and physician extenders). When providing direct patient care, the hospitalist is likely responsible or all of the tasks usually performed by residents, including writing all patient notes and prescriptions, all communication with families, nurses, specialists, and primary care providers; and discharge planning. Conversely, when providing supervisory care, it is likely that the tasks are divided among the team members, and the hospitalist has the additional responsibility for providing teaching. However, the hospitalist might be responsible for more complex and acute patients. These factors are not adequately measured by RVUs or professional billing. Furthermore, these metrics do not capture the differences in providing in‐house daytime versus evening/night coverage, and do not measure the work performed while being on call when outside of the hospital. It is important for PHM programs and leaders to develop a better representation of the value provided by hospitalists, and for institutional leaders to understand this value, because previous work has suggested that the majority of hospital leaders do not plan to phase out the subsidy of hospitalists over time, as they do not anticipate the program(s) will be able to covercosts.[2] Given the realities of decreasing reimbursement and healthcare reform, it is unlikely to become more common for PHM programs to generate enough professional revenue to cover expenses.
The main strength of this descriptive study is the comprehensive nature of the survey, including many previously unreported data. In addition, the data are consistent with previously published work, which validates the quality of the data.
This study has several limitations including a low response rate and the exclusion of some hospitals or programs because they provided insufficient data for analysis. However, a post hoc analysis demonstrated that the majority of the institutions reporting that they did not have an academic PHM program (18/22), and those that were excluded due to insufficient data (12/17) were either smaller residency programs (<60 residents) or hospitals that were not the main site of a residency program. Therefore, our data likely are a good representation of academic PHM programs at larger academic institutions. Another potential weakness is that, although PHM program directors and pediatric residency directors were targeted, the respondent might not have been the person with the best knowledge of the program, which could have produced inaccurate data, particularly in terms of finances. However, the general consistency of our findings with previous work, particularly the high percentage of institutions with academic PHM programs,[4, 7, 9, 14] the low percentage of programs with revenues greater than expenses,[2, 9] and the trend toward increased in‐house coverage associated with the 2011 ACGME work‐hour restrictions,[14] supports the validity of our other results. In addition, survey respondents might have interpreted certain questions differently, specifically the questions concerning the definition of an FTE, and this might have led to increased variability in the data.
CONCLUSIONS
Academic PHM programs exist in the vast majority of academic centers, and more institutions are planning on starting programs in the next few years. There appears to be variability in a number of program factors, including hospitalist workload, in‐house coverage, and whether the program is a separate division or a section within another academic division. Many programs are currently providing care at more than 1 site. Programs uncommonly reported that their revenues exceeded their expenses. These data are the most comprehensive data existing for academic PHM programs.
Acknowledgment
Disclosure: Nothing to report.
- . Pediatric hospital medicine: historical perspectives, inspired future. Curr Probl Pediatr Adolesc Health Care. 2012;42(5):107–112.
- , , . Assessing the value of pediatric hospitalist programs: the perspective of hospital leaders. Acad Pediatr. 2009;9(3):192–196.
- , . Pediatric hospitalists: training, current practice, and career goals. J Hosp Med. 2009;4(3):179–186.
- , , . Hospitalists' involvement in pediatrics training: perspectives from pediatric residency program and clerkship directors. Acad Med. 2009;84(11):1617–1621.
- , . Research in pediatric hospital medicine: how research will impact clinical care. Curr Probl Pediatr Adolesc Health Care. 2012;42(5):127–130.
- , . Pediatric hospitalists in medical education: current roles and future directions. Curr Probl Pediatr Adolesc Health Care. 2012;42(5):120–126.
- , , , , . Pediatric hospitalists' influences on education and career plans. J Hosp Med. 2012;7(4):282–286.
- , . Pediatric hospitalist systems versus traditional models of care: effect on quality and cost outcomes. J Hosp Med. 2012;7(4):350–357.
- , , , . Characteristics of the pediatric hospitalist workforce: its roles and work environment. Pediatrics. 2007;120(33):33–39.
- Society of Hospital Medicine. Definition of a hospitalist and hospital medicine. Available at: http://www.hospitalmedicine.org/AM/Template.cfm?Section=Hospitalist_Definition7(4):299–303.
Copyright © 2013 Society of Hospital Medicine