User login
Methods for Research Evidence Synthesis: The Scoping Review Approach
Research evidence synthesis involves the aggregation of available information using well-defined and transparent methods to search, summarize, and interpret a body of literature, frequently following a systematic review approach. A scoping review is a relatively new approach to evidence synthesis and differs from systematic reviews in its purpose and aims.1 The purpose of a scoping review is to provide an overview of the available research evidence without producing a summary answer to a discrete research question.2 Scoping reviews can be useful for answering broad questions, such as “What information has been presented on this topic in the literature?” and for gathering and assessing information prior to conducting a systematic review.1
In this issue of the Journal of Hospital Medicine, Fan et al. used a scoping review to identify information available in the literature on contributors to loss and theft of controlled drugs in hospitals and the safeguards that have been suggested to address these diversions.3 The authors followed Arksey and O’Malley’s framework for scoping reviews and the PRISMA-ScR (Preferred Reporting Items for Systematic reviews and Meta-Analyses extension for Scoping Reviews) checklist in reporting findings.2,4
PURPOSE OF A SCOPING REVIEW
Scoping reviews describe existing literature and other sources of information commonly include findings from a range of different study designs and methods.5 The broad scope of the collected information makes using formal meta-analytic methods difficult, if not impossible. Results of a scoping review often focus on the range of content identified, and quantitative assessment is often limited to a tally of the number of sources reporting a particular issue or recommendation. In contrast, systematic reviews commonly select the information sources by requiring specific study types, such as randomized controlled trials, and imposing quality standards, such as adequate allocation concealment, and place their emphasis on synthesizing data to address a specific research question. (Table) By focusing on specific studies, the synthesis component in a systematic review often takes the form of a meta-analysis in which the results of multiple scientific studies are combined to develop a summary conclusion, such as a common effect estimate, along with an evaluation of its heterogeneity across studies.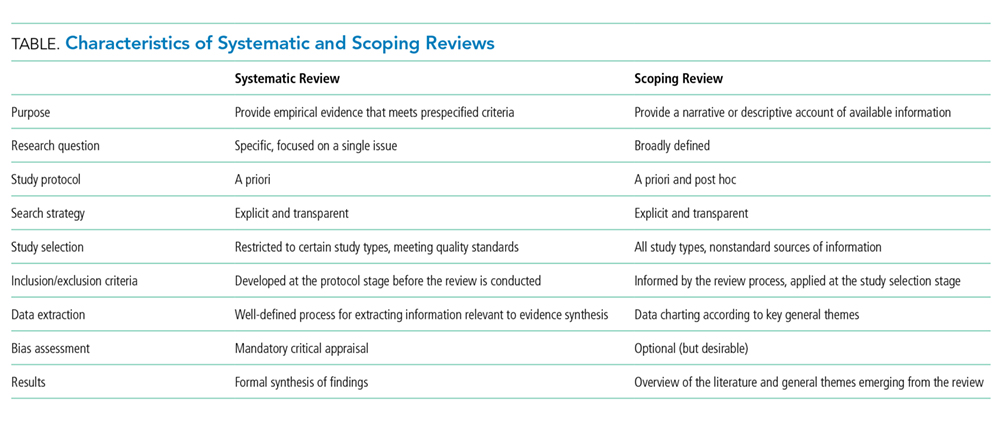
A scoping review can be a particularly useful approach when the information on a topic has not been comprehensively reviewed or is complex and diverse.6 Munn et al. proposed several objectives that can be achieved utilizing the scoping review framework, including identifying types of existing evidence in a given field, clarifying key concepts or definitions in the literature, surveying how research is conducted on a certain topic, identifying key characteristics related to a certain topic, and identifying knowledge gaps.1 When choosing to use a scoping review approach, it is important that the objective of the review align with the review’s indication or purpose.
METHODOLOGICAL FRAMEWORK OF SCOPING REVIEWS
Scoping reviews, like systematic reviews, require comprehensive and structured searches of the literature to maximize the capture of relevant information, provide reproducible results, and decrease potential bias from flawed implementations. The methodological framework for scoping reviews was developed by Arksey and O’Malley1 and further refined by Levac et al.7 and the Joanna Briggs Institute.6,8 Arksey and O’Malley’s framework for scoping reviews consists of the following six steps:
- Step 1: Identify the research question—the research question should be clearly defined and usually broad in scope to provide extensive coverage.
- Step 2: Identify relevant studies—the search strategy should be thorough and broad in scope and typically include electronic databases, reference lists, hand searches, and gray literature (ie, substantive or scholarly information that has not been formally published and often is not peer-reviewed), including conference abstracts, presentations, regulatory data, working papers, and patents.
- Step 3: Study selection—the study selection process can include post hoc, or modified, inclusion and exclusion criteria as new ideas emerge during the process of gathering and reviewing information.
- Step 4: Chart the data—the data extraction process in a scoping review is called data charting and involves the use of a data charting form to extract the relevant information from the reviewed literature.
- Step 5: Collate, summarize, and report the results—the description of the scope of the literature is commonly presented in tables and charts according to key themes.
- Optional Step 6: Consultation exercise—in this optional step, stakeholders outside the study review team are invited to provide their insights to inform and validate findings from the scoping review.
Since the number of studies included in a scoping review can be substantial, several study team members may participate in the review process. When multiple reviewers are employed, the team ought to conduct a calibration exercise at each step of the review process to ensure adequate interrater agreement. In addition, the PRISMA-ScR guidelines should be followed when reporting findings from scoping reviews to facilitate complete, transparent, and consistent reporting in the literature.4
LIMITATIONS OF THE SCOPING REVIEW APPROACH
The scoping review approach has several limitations. Scoping reviews do not formally evaluate the quality of evidence and often gather information from a wide range of study designs and methods. By design, the number of studies included in the review process can be sizable. Thus, a large study team is typically needed to screen the large number of studies and other sources for potential inclusion in the scoping review. Because scoping reviews provide a descriptive account of available information, this often leads to broad, less defined searches that require multiple structured strategies focused on alternative sets of themes. Hand searching the literature is therefore necessary to ensure the validity of this process. Scoping reviews do not provide a synthesized result or answer to a specific question, but rather provide an overview of the available literature. Even though statements regarding the quality of evidence and formal synthesis are avoided, the scoping review approach is not necessarily easier or faster than the systematic review approach. Scoping reviews require a substantial amount of time to complete due to the wide coverage of the search implicit in the approach.
Like other studies, scoping reviews are at risk for bias from different sources. Critical appraisal of the risk of bias in scoping reviews is not considered mandatory, but some scoping reviews may include a bias assessment. Even if bias is not formally assessed, that does not mean that bias does not exist. For example, selection bias may occur if the scoping review does not identify all available data on a topic and the resulting descriptive account of available information is flawed.
WHY DID THE AUTHORS USE THE SCOPING REVIEW METHOD?
Fan et al. used the scoping review approach to examine the available information on contributors to and safeguards against controlled-drug losses and theft (drug diversion) in the hospital setting.3 The authors addressed the following questions: (1) “What clinical units, health professions, or stages of the medication-use process are commonly discussed?” (2) “What are the identified contributors to diversion in hospitals?” and (3) “What safeguards to prevent or detect diversion in hospitals have been described?” Part of the rationale for using a scoping review approach was to permit the inclusion of a wide range of sources falling outside the typical peer-reviewed article. The authors comment that the stigmatized topic of drug diversion frequently falls outside the peer-reviewed literature and emphasize the importance of including such sources as conferences, news articles, and legal reports. The search strategy included electronic research databases, such as Web of Science, as well as an extensive gray literature search. Multiple reviewers were included in the process and a calibration exercise was conducted to ensure consistency in the selection of articles and to improve interrater agreement. The scoping review identified contributors to controlled-drug diversion and suggested safeguards to address them in the hospital setting.
OTHER CONSIDERATIONS
Methodological approaches to evidence synthesis vary, and new methods continue to emerge to meet different research objectives, including evidence mapping,9 concept analysis,10 rapid reviews,11 and others.12 Choosing the right approach may not be straightforward. Researchers may need to seek guidance from methodologists, including epidemiologists, statisticians, and information specialists, when choosing an appropriate review approach to ensure that the review methods are suitable for the objectives of the review.
Disclosures
The authors have no conflicts of interest to disclose.
Financial Disclosures
The authors have no financial relationships relevant to this article to disclose.
1. Munn Z, Peters M, Stern C, Tufanaru C, McArthur A, Aromataris E. Systematic review or scoping review? Guidance for authors when choosing between a systematic or scoping review approach. BMC Med Res Methodol. 2018;18:143. doi: 10.1186/s12874-018-0611-x PubMed
2. Arksey H, O’Malley L. Scoping Studies: towards a methodological framework. Int J Soc Res Methodol. 2005;8(1):19-32. doi: 10.1080/1364557032000119616
3. Fan M, Tscheng D, Hamilton M, Hyland B, Reding R, Trbovich P. Diversion of controlled drugs in hospitals: a scoping review of contributors and safeguards [published online ahead of print June 12, 2019]. J Hosp Med. 2019. doi: 10.12788/jhm.3228 PubMed
4. Tricco AC, Lillie E, Zarin W, et al. PRISMA Extension for Scoping Reviews (PRISMA-ScR): Checklist and Explanation. Ann Intern Med. 2018;169(7):467-473. doi: 10.7326/M18-0850 PubMed
5. Davis K, Drey N, Gould D. What are scoping studies? A review of the nursing literature. Int J Nurs Stud. 2009;46(10):1386-1400. doi: 10.1016/j.ijnurstu.2009.02.010. PubMed
6. Peters MD, Godfrey CM, Khalil H, McInerney P, Parker D, Soares CB. Guidance for conducting systematic scoping reviews. Int J Evid Based Healthc. 2015;13(3):141-146. doi: 10.1097/XEB.0000000000000050. PubMed
7. Levac D, Colquhoun H, O’Brien KK. Scoping studies: advancing the methodology. Implement Sci. 2010;5(1):69. doi: 10.1186/1748-5908-5-69. PubMed
8. Peters MDJ, Godfrey C, McInerney P, Baldini Soares C, Khalil H, Parker D. Scoping reviews. In: Aromataris E, Munn Z, eds. Joanna Briggs Institute Reviewer’s Manual. Adelaide, Australia: Joanna Briggs Inst; 2017. Available from https://reviewersmanual.joannabriggs.org/
9. Hetrick SE, Parker AG, Callahan P, Purcell R. Evidence mapping: illustrating an emerging methodology to improve evidence-based practice in youth mental health. J Eval Clin Pract. 2010;16(6):1025-1030. doi: 10.1111/j.1365-2753.2008.01112.x. PubMed
10. Ream E, Richardson A. Fatigue: a concept analysis. Int J Nurs Stud. 1996;33(5):519-529. doi: 10.1016/0020-7489(96)00004-1. PubMed
11. Tricco AC, Antony J, Zarin W, et al. A scoping review of rapid review methods. BMC Med. 2015;13(1):224. doi: 10.1186/s12916-015-0465-6. PubMed
12. Grant MJ, Booth A. A typology of reviews: an analysis of 14 review types and associated methodologies. Health Info Libr J. 2009;26(2):91-108. doi: 10.1111/j.1471-1842.2009.00848.x. PubMed
Research evidence synthesis involves the aggregation of available information using well-defined and transparent methods to search, summarize, and interpret a body of literature, frequently following a systematic review approach. A scoping review is a relatively new approach to evidence synthesis and differs from systematic reviews in its purpose and aims.1 The purpose of a scoping review is to provide an overview of the available research evidence without producing a summary answer to a discrete research question.2 Scoping reviews can be useful for answering broad questions, such as “What information has been presented on this topic in the literature?” and for gathering and assessing information prior to conducting a systematic review.1
In this issue of the Journal of Hospital Medicine, Fan et al. used a scoping review to identify information available in the literature on contributors to loss and theft of controlled drugs in hospitals and the safeguards that have been suggested to address these diversions.3 The authors followed Arksey and O’Malley’s framework for scoping reviews and the PRISMA-ScR (Preferred Reporting Items for Systematic reviews and Meta-Analyses extension for Scoping Reviews) checklist in reporting findings.2,4
PURPOSE OF A SCOPING REVIEW
Scoping reviews describe existing literature and other sources of information commonly include findings from a range of different study designs and methods.5 The broad scope of the collected information makes using formal meta-analytic methods difficult, if not impossible. Results of a scoping review often focus on the range of content identified, and quantitative assessment is often limited to a tally of the number of sources reporting a particular issue or recommendation. In contrast, systematic reviews commonly select the information sources by requiring specific study types, such as randomized controlled trials, and imposing quality standards, such as adequate allocation concealment, and place their emphasis on synthesizing data to address a specific research question. (Table) By focusing on specific studies, the synthesis component in a systematic review often takes the form of a meta-analysis in which the results of multiple scientific studies are combined to develop a summary conclusion, such as a common effect estimate, along with an evaluation of its heterogeneity across studies.
A scoping review can be a particularly useful approach when the information on a topic has not been comprehensively reviewed or is complex and diverse.6 Munn et al. proposed several objectives that can be achieved utilizing the scoping review framework, including identifying types of existing evidence in a given field, clarifying key concepts or definitions in the literature, surveying how research is conducted on a certain topic, identifying key characteristics related to a certain topic, and identifying knowledge gaps.1 When choosing to use a scoping review approach, it is important that the objective of the review align with the review’s indication or purpose.
METHODOLOGICAL FRAMEWORK OF SCOPING REVIEWS
Scoping reviews, like systematic reviews, require comprehensive and structured searches of the literature to maximize the capture of relevant information, provide reproducible results, and decrease potential bias from flawed implementations. The methodological framework for scoping reviews was developed by Arksey and O’Malley1 and further refined by Levac et al.7 and the Joanna Briggs Institute.6,8 Arksey and O’Malley’s framework for scoping reviews consists of the following six steps:
- Step 1: Identify the research question—the research question should be clearly defined and usually broad in scope to provide extensive coverage.
- Step 2: Identify relevant studies—the search strategy should be thorough and broad in scope and typically include electronic databases, reference lists, hand searches, and gray literature (ie, substantive or scholarly information that has not been formally published and often is not peer-reviewed), including conference abstracts, presentations, regulatory data, working papers, and patents.
- Step 3: Study selection—the study selection process can include post hoc, or modified, inclusion and exclusion criteria as new ideas emerge during the process of gathering and reviewing information.
- Step 4: Chart the data—the data extraction process in a scoping review is called data charting and involves the use of a data charting form to extract the relevant information from the reviewed literature.
- Step 5: Collate, summarize, and report the results—the description of the scope of the literature is commonly presented in tables and charts according to key themes.
- Optional Step 6: Consultation exercise—in this optional step, stakeholders outside the study review team are invited to provide their insights to inform and validate findings from the scoping review.
Since the number of studies included in a scoping review can be substantial, several study team members may participate in the review process. When multiple reviewers are employed, the team ought to conduct a calibration exercise at each step of the review process to ensure adequate interrater agreement. In addition, the PRISMA-ScR guidelines should be followed when reporting findings from scoping reviews to facilitate complete, transparent, and consistent reporting in the literature.4
LIMITATIONS OF THE SCOPING REVIEW APPROACH
The scoping review approach has several limitations. Scoping reviews do not formally evaluate the quality of evidence and often gather information from a wide range of study designs and methods. By design, the number of studies included in the review process can be sizable. Thus, a large study team is typically needed to screen the large number of studies and other sources for potential inclusion in the scoping review. Because scoping reviews provide a descriptive account of available information, this often leads to broad, less defined searches that require multiple structured strategies focused on alternative sets of themes. Hand searching the literature is therefore necessary to ensure the validity of this process. Scoping reviews do not provide a synthesized result or answer to a specific question, but rather provide an overview of the available literature. Even though statements regarding the quality of evidence and formal synthesis are avoided, the scoping review approach is not necessarily easier or faster than the systematic review approach. Scoping reviews require a substantial amount of time to complete due to the wide coverage of the search implicit in the approach.
Like other studies, scoping reviews are at risk for bias from different sources. Critical appraisal of the risk of bias in scoping reviews is not considered mandatory, but some scoping reviews may include a bias assessment. Even if bias is not formally assessed, that does not mean that bias does not exist. For example, selection bias may occur if the scoping review does not identify all available data on a topic and the resulting descriptive account of available information is flawed.
WHY DID THE AUTHORS USE THE SCOPING REVIEW METHOD?
Fan et al. used the scoping review approach to examine the available information on contributors to and safeguards against controlled-drug losses and theft (drug diversion) in the hospital setting.3 The authors addressed the following questions: (1) “What clinical units, health professions, or stages of the medication-use process are commonly discussed?” (2) “What are the identified contributors to diversion in hospitals?” and (3) “What safeguards to prevent or detect diversion in hospitals have been described?” Part of the rationale for using a scoping review approach was to permit the inclusion of a wide range of sources falling outside the typical peer-reviewed article. The authors comment that the stigmatized topic of drug diversion frequently falls outside the peer-reviewed literature and emphasize the importance of including such sources as conferences, news articles, and legal reports. The search strategy included electronic research databases, such as Web of Science, as well as an extensive gray literature search. Multiple reviewers were included in the process and a calibration exercise was conducted to ensure consistency in the selection of articles and to improve interrater agreement. The scoping review identified contributors to controlled-drug diversion and suggested safeguards to address them in the hospital setting.
OTHER CONSIDERATIONS
Methodological approaches to evidence synthesis vary, and new methods continue to emerge to meet different research objectives, including evidence mapping,9 concept analysis,10 rapid reviews,11 and others.12 Choosing the right approach may not be straightforward. Researchers may need to seek guidance from methodologists, including epidemiologists, statisticians, and information specialists, when choosing an appropriate review approach to ensure that the review methods are suitable for the objectives of the review.
Disclosures
The authors have no conflicts of interest to disclose.
Financial Disclosures
The authors have no financial relationships relevant to this article to disclose.
1. Munn Z, Peters M, Stern C, Tufanaru C, McArthur A, Aromataris E. Systematic review or scoping review? Guidance for authors when choosing between a systematic or scoping review approach. BMC Med Res Methodol. 2018;18:143. doi: 10.1186/s12874-018-0611-x PubMed
2. Arksey H, O’Malley L. Scoping Studies: towards a methodological framework. Int J Soc Res Methodol. 2005;8(1):19-32. doi: 10.1080/1364557032000119616
3. Fan M, Tscheng D, Hamilton M, Hyland B, Reding R, Trbovich P. Diversion of controlled drugs in hospitals: a scoping review of contributors and safeguards [published online ahead of print June 12, 2019]. J Hosp Med. 2019. doi: 10.12788/jhm.3228 PubMed
4. Tricco AC, Lillie E, Zarin W, et al. PRISMA Extension for Scoping Reviews (PRISMA-ScR): Checklist and Explanation. Ann Intern Med. 2018;169(7):467-473. doi: 10.7326/M18-0850 PubMed
5. Davis K, Drey N, Gould D. What are scoping studies? A review of the nursing literature. Int J Nurs Stud. 2009;46(10):1386-1400. doi: 10.1016/j.ijnurstu.2009.02.010. PubMed
6. Peters MD, Godfrey CM, Khalil H, McInerney P, Parker D, Soares CB. Guidance for conducting systematic scoping reviews. Int J Evid Based Healthc. 2015;13(3):141-146. doi: 10.1097/XEB.0000000000000050. PubMed
7. Levac D, Colquhoun H, O’Brien KK. Scoping studies: advancing the methodology. Implement Sci. 2010;5(1):69. doi: 10.1186/1748-5908-5-69. PubMed
8. Peters MDJ, Godfrey C, McInerney P, Baldini Soares C, Khalil H, Parker D. Scoping reviews. In: Aromataris E, Munn Z, eds. Joanna Briggs Institute Reviewer’s Manual. Adelaide, Australia: Joanna Briggs Inst; 2017. Available from https://reviewersmanual.joannabriggs.org/
9. Hetrick SE, Parker AG, Callahan P, Purcell R. Evidence mapping: illustrating an emerging methodology to improve evidence-based practice in youth mental health. J Eval Clin Pract. 2010;16(6):1025-1030. doi: 10.1111/j.1365-2753.2008.01112.x. PubMed
10. Ream E, Richardson A. Fatigue: a concept analysis. Int J Nurs Stud. 1996;33(5):519-529. doi: 10.1016/0020-7489(96)00004-1. PubMed
11. Tricco AC, Antony J, Zarin W, et al. A scoping review of rapid review methods. BMC Med. 2015;13(1):224. doi: 10.1186/s12916-015-0465-6. PubMed
12. Grant MJ, Booth A. A typology of reviews: an analysis of 14 review types and associated methodologies. Health Info Libr J. 2009;26(2):91-108. doi: 10.1111/j.1471-1842.2009.00848.x. PubMed
© 2019 Society of Hospital Medicine
Monitor Alarms in a Children's Hospital
Physiologic monitor alarms are an inescapable part of the soundtrack for hospitals. Data from primarily adult hospitals have shown that alarms occur at high rates, and most alarms are not actionable.[1] Small studies have suggested that high alarm rates can lead to alarm fatigue.[2, 3] To prioritize alarm types to target in future intervention studies, in this study we aimed to investigate the alarm rates on all inpatient units and the most common causes of alarms at a children's hospital.
METHODS
This was a cross‐sectional study of audible physiologic monitor alarms at Cincinnati Children's Hospital Medical Center (CCHMC) over 7 consecutive days during August 2014. CCHMC is a 522‐bed free‐standing children's hospital. Inpatient beds are equipped with GE Healthcare (Little Chalfont, United Kingdom) bedside monitors (models Dash 3000, 4000, and 5000, and Solar 8000). Age‐specific vital sign parameters were employed for monitors on all units.
We obtained date, time, and type of alarm from bedside physiologic monitors using Connexall middleware (GlobeStar Systems, Toronto, Ontario, Canada).
We determined unit census using the electronic health records for the time period concurrent with the alarm data collection. Given previously described variation in hospital census over the day,[4] we used 4 daily census measurements (6:00 am, 12:00 pm, 6:00 pm, and 11:00 pm) rather than 1 single measurement to more accurately reflect the hospital census.
The CCHMC Institutional Review Board determined this work to be not human subjects research.
Statistical Analysis
For each unit and each census time interval, we generated a rate based on the number of occupied beds (alarms per patient‐day) resulting in a total of 28 rates (4 census measurement periods per/day 7 days) for each unit over the study period. We used descriptive statistics to summarize alarms per patient‐day by unit. Analysis of variance was used to compare alarm rates between units. For significant main effects, we used Tukey's multiple comparisons tests for all pairwise comparisons to control the type I experiment‐wise error rate. Alarms were then classified by alarm cause (eg, high heart rate). We summarized the cause for all alarms using counts and percentages.
RESULTS
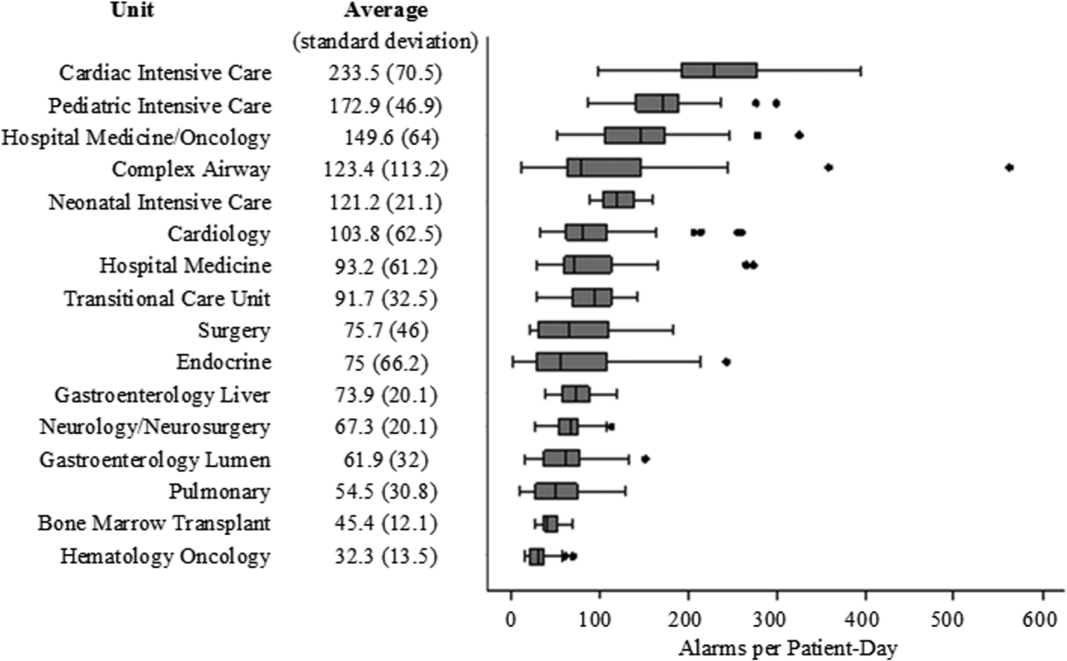
There were a total of 220,813 audible alarms over 1 week. Median alarm rate per patient‐day by unit ranged from 30.4 to 228.5; the highest alarm rates occurred in the cardiac intensive care unit, with a median of 228.5 (interquartile range [IQR], 193275) followed by the pediatric intensive care unit (172.4; IQR, 141188) (Figure 1). The average alarm rate was significantly different among the units (P < 0.01).
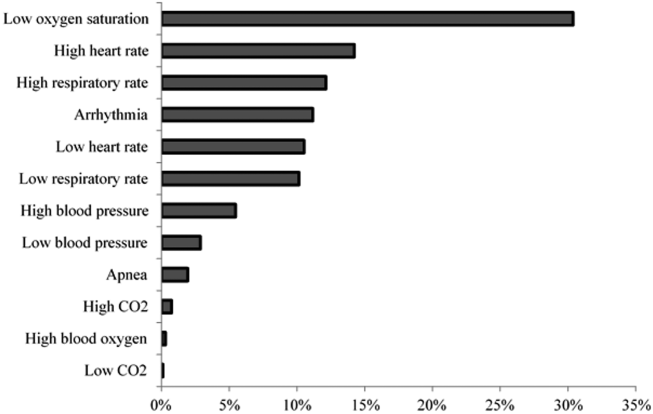
Technical alarms (eg, alarms for artifact, lead failure), comprised 33% of the total number of alarms. The remaining 67% of alarms were for clinical conditions, the most common of which was low oxygen saturation (30% of clinical alarms) (Figure 2).
DISCUSSION
We described alarm rates and causes over multiple units at a large children's hospital. To our knowledge, this is the first description of alarm rates across multiple pediatric inpatient units. Alarm counts were high even for the general units, indicating that a nurse taking care of 4 monitored patients would need to process a physiologic monitor alarm every 4 minutes on average, in addition to other sources of alarms such as infusion pumps.
Alarm rates were highest in the intensive care unit areas, which may be attributable to both higher rates of monitoring and sicker patients. Importantly, however, alarms were quite high and variable on the acute care units. This suggests that factors other than patient acuity may have substantial influence on alarm rates.
Technical alarms, alarms that do not indicate a change in patient condition, accounted for the largest percentage of alarms during the study period. This is consistent with prior literature that has suggested that regular electrode replacement, which decreases technical alarms, can be effective in reducing alarm rates.[5, 6] The most common vital sign change to cause alarms was low oxygen saturation, followed by elevated heart rate and elevated respiratory rate. Whereas in most healthy patients, certain low oxygen levels would prompt initiation of supplemental oxygen, there are many conditions in which elevated heart rate and respiratory rate may not require titration of any particular therapy. These may be potential intervention targets for hospitals trying to improve alarm rates.
Limitations
There are several limitations to our study. First, our results are not necessarily generalizable to other types of hospitals or those utilizing monitors from other vendors. Second, we were unable to include other sources of alarms such as infusion pumps and ventilators. However, given the high alarm rates from physiologic monitors alone, these data add urgency to the need for further investigation in the pediatric setting.
CONCLUSION
Alarm rates at a single children's hospital varied depending on the unit. Strategies targeted at reducing technical alarms and reducing nonactionable clinical alarms for low oxygen saturation, high heart rate, and high respiratory rate may offer the greatest opportunity to reduce alarm rates.
Acknowledgements
The authors acknowledge Melinda Egan for her assistance in obtaining data for this study and Ting Sa for her assistance with data management.
Disclosures: Dr. Bonafide is supported by the National Heart, Lung, and Blood Institute of the National Institutes of Health under award number K23HL116427. Dr. Bonafide also holds a Young Investigator Award grant from the Academic Pediatric Association evaluating the impact of a data‐driven monitor alarm reduction strategy implemented in safety huddles. Dr. Brady is supported by the Agency for Healthcare Research and Quality under award number K08HS23827. The content is solely the responsibility of the authors and does not necessarily represent the official views of the National Institutes of Health or the Agency for Healthcare Research and Quality. This study was funded by the Arnold W. Strauss Fellow Grant, Cincinnati Children's Hospital Medical Center. The authors have no conflicts of interest to disclose.
- , , , et al. Systematic review of physiologic monitor alarm characteristics and pragmatic interventions to reduce alarm frequency. J Hosp Med. 2016;11(2):136–144.
- , , , et al. Association between exposure to nonactionable physiologic monitor alarms and response time in a children's hospital. J Hosp Med. 2015;10(6):345–351.
- , , , et al. Pulse oximetry desaturation alarms on a general postoperative adult unit: a prospective observational study of nurse response time. Int J Nurs Stud. 2013;50(10):1351–1358.
- , , , , . Traditional measures of hospital utilization may not accurately reflect dynamic patient demand: findings from a children's hospital. Hosp Pediatr. 2012;2(1):10–18.
- , , , et al. A team‐based approach to reducing cardiac monitor alarms. Pediatrics. 2014;134(6):e1686–e1694.
- , , , . Daily electrode change and effect on cardiac monitor alarms: an evidence‐based practice approach. J Nurs Care Qual. 2013;28(3):265–271.
Physiologic monitor alarms are an inescapable part of the soundtrack for hospitals. Data from primarily adult hospitals have shown that alarms occur at high rates, and most alarms are not actionable.[1] Small studies have suggested that high alarm rates can lead to alarm fatigue.[2, 3] To prioritize alarm types to target in future intervention studies, in this study we aimed to investigate the alarm rates on all inpatient units and the most common causes of alarms at a children's hospital.
METHODS
This was a cross‐sectional study of audible physiologic monitor alarms at Cincinnati Children's Hospital Medical Center (CCHMC) over 7 consecutive days during August 2014. CCHMC is a 522‐bed free‐standing children's hospital. Inpatient beds are equipped with GE Healthcare (Little Chalfont, United Kingdom) bedside monitors (models Dash 3000, 4000, and 5000, and Solar 8000). Age‐specific vital sign parameters were employed for monitors on all units.
We obtained date, time, and type of alarm from bedside physiologic monitors using Connexall middleware (GlobeStar Systems, Toronto, Ontario, Canada).
We determined unit census using the electronic health records for the time period concurrent with the alarm data collection. Given previously described variation in hospital census over the day,[4] we used 4 daily census measurements (6:00 am, 12:00 pm, 6:00 pm, and 11:00 pm) rather than 1 single measurement to more accurately reflect the hospital census.
The CCHMC Institutional Review Board determined this work to be not human subjects research.
Statistical Analysis
For each unit and each census time interval, we generated a rate based on the number of occupied beds (alarms per patient‐day) resulting in a total of 28 rates (4 census measurement periods per/day 7 days) for each unit over the study period. We used descriptive statistics to summarize alarms per patient‐day by unit. Analysis of variance was used to compare alarm rates between units. For significant main effects, we used Tukey's multiple comparisons tests for all pairwise comparisons to control the type I experiment‐wise error rate. Alarms were then classified by alarm cause (eg, high heart rate). We summarized the cause for all alarms using counts and percentages.
RESULTS
There were a total of 220,813 audible alarms over 1 week. Median alarm rate per patient‐day by unit ranged from 30.4 to 228.5; the highest alarm rates occurred in the cardiac intensive care unit, with a median of 228.5 (interquartile range [IQR], 193275) followed by the pediatric intensive care unit (172.4; IQR, 141188) (Figure 1). The average alarm rate was significantly different among the units (P < 0.01).
Technical alarms (eg, alarms for artifact, lead failure), comprised 33% of the total number of alarms. The remaining 67% of alarms were for clinical conditions, the most common of which was low oxygen saturation (30% of clinical alarms) (Figure 2).
DISCUSSION
We described alarm rates and causes over multiple units at a large children's hospital. To our knowledge, this is the first description of alarm rates across multiple pediatric inpatient units. Alarm counts were high even for the general units, indicating that a nurse taking care of 4 monitored patients would need to process a physiologic monitor alarm every 4 minutes on average, in addition to other sources of alarms such as infusion pumps.
Alarm rates were highest in the intensive care unit areas, which may be attributable to both higher rates of monitoring and sicker patients. Importantly, however, alarms were quite high and variable on the acute care units. This suggests that factors other than patient acuity may have substantial influence on alarm rates.
Technical alarms, alarms that do not indicate a change in patient condition, accounted for the largest percentage of alarms during the study period. This is consistent with prior literature that has suggested that regular electrode replacement, which decreases technical alarms, can be effective in reducing alarm rates.[5, 6] The most common vital sign change to cause alarms was low oxygen saturation, followed by elevated heart rate and elevated respiratory rate. Whereas in most healthy patients, certain low oxygen levels would prompt initiation of supplemental oxygen, there are many conditions in which elevated heart rate and respiratory rate may not require titration of any particular therapy. These may be potential intervention targets for hospitals trying to improve alarm rates.
Limitations
There are several limitations to our study. First, our results are not necessarily generalizable to other types of hospitals or those utilizing monitors from other vendors. Second, we were unable to include other sources of alarms such as infusion pumps and ventilators. However, given the high alarm rates from physiologic monitors alone, these data add urgency to the need for further investigation in the pediatric setting.
CONCLUSION
Alarm rates at a single children's hospital varied depending on the unit. Strategies targeted at reducing technical alarms and reducing nonactionable clinical alarms for low oxygen saturation, high heart rate, and high respiratory rate may offer the greatest opportunity to reduce alarm rates.
Acknowledgements
The authors acknowledge Melinda Egan for her assistance in obtaining data for this study and Ting Sa for her assistance with data management.
Disclosures: Dr. Bonafide is supported by the National Heart, Lung, and Blood Institute of the National Institutes of Health under award number K23HL116427. Dr. Bonafide also holds a Young Investigator Award grant from the Academic Pediatric Association evaluating the impact of a data‐driven monitor alarm reduction strategy implemented in safety huddles. Dr. Brady is supported by the Agency for Healthcare Research and Quality under award number K08HS23827. The content is solely the responsibility of the authors and does not necessarily represent the official views of the National Institutes of Health or the Agency for Healthcare Research and Quality. This study was funded by the Arnold W. Strauss Fellow Grant, Cincinnati Children's Hospital Medical Center. The authors have no conflicts of interest to disclose.
- , , , et al. Systematic review of physiologic monitor alarm characteristics and pragmatic interventions to reduce alarm frequency. J Hosp Med. 2016;11(2):136–144.
- , , , et al. Association between exposure to nonactionable physiologic monitor alarms and response time in a children's hospital. J Hosp Med. 2015;10(6):345–351.
- , , , et al. Pulse oximetry desaturation alarms on a general postoperative adult unit: a prospective observational study of nurse response time. Int J Nurs Stud. 2013;50(10):1351–1358.
- , , , , . Traditional measures of hospital utilization may not accurately reflect dynamic patient demand: findings from a children's hospital. Hosp Pediatr. 2012;2(1):10–18.
- , , , et al. A team‐based approach to reducing cardiac monitor alarms. Pediatrics. 2014;134(6):e1686–e1694.
- , , , . Daily electrode change and effect on cardiac monitor alarms: an evidence‐based practice approach. J Nurs Care Qual. 2013;28(3):265–271.

Survey of Academic PHM Programs in the US
Pediatric hospital medicine (PHM) is a relatively new field that has been growing rapidly over the past 20 years.[1] The field has been increasingly recognized for its contributions to high‐quality patient care, patient safety, systems improvement, medical education, and research.[2, 3, 4, 5, 6, 7, 8, 9] However, there appears to be significant variation among programs, even in basic factors such as how clinical effort is defined, the extent of in‐house coverage provided, and the scope of clinical services provided, and there exists a paucity of data describing these variations.[8]
Most previously published work did not specifically focus on academic programs,[2, 3, 8, 9] and specifically targeted hospital leadership,[2] practicing hospitalists,[3] residents,[7] and pediatric residency or clerkship directors,[4, 7] rather than hospitalist directors.[9] Furthermore, previous work focused on specific aspects of PHM programs such as education,[4, 7] value,[2] work environment,[9] and clinical practice,[3] rather than a more comprehensive approach.
We conducted a survey of academic PHM programs to learn about the current state and variation among programs across multiple domains (organizational, administrative, and financial). We speculated that:
- Many institutions currently lacking an academic PHM program were planning on starting a program in the next 3 years.
- Variability exists in hospitalist workload among programs.
- In programs providing clinical coverage at more than 1 site, variability exists in the relationship between the main site and satellite site(s) in terms of decision making, scheduling, and reporting of performance.
METHODS
Sample
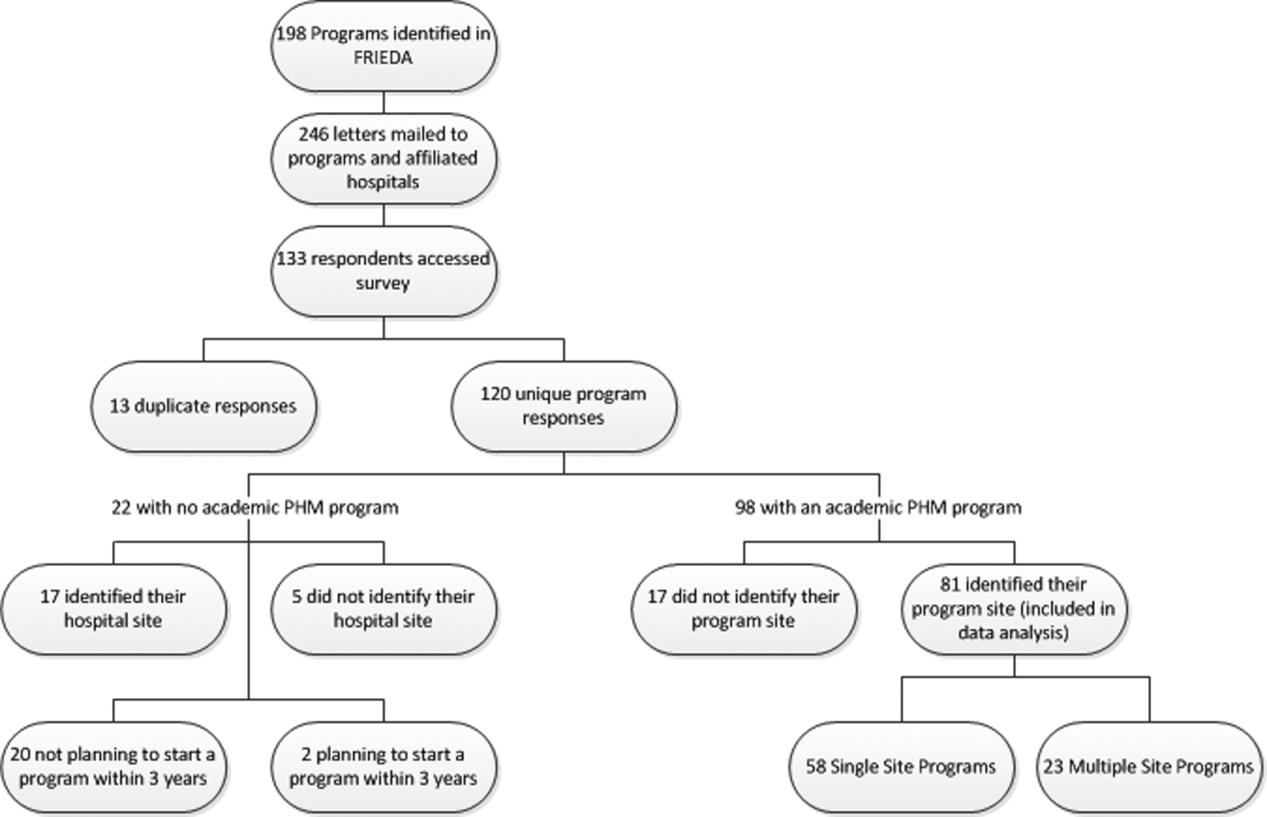
We used the online American Medical Association Fellowship and Residency Electronic Interactive Database (FREIDA) to identify all 198 accredited pediatric residency training programs in the United States. A total of 246 hospitals were affiliated with these programs, and all of these were targeted for the survey. In addition, academic PHM program leaders were targeted directly with email invitations through the American Academy of Pediatrics (AAP) Section on Hospital Medicine LISTSERV.
Survey Instrument
A 49‐question online survey on the administrative, organizational, and financial aspects of academic PHM programs was developed with the input of academic PHM hospital leaders from Cincinnati Children's Hospital Medical Center and St. Louis Children's Hospital. First, the survey questions were developed de novo by the researchers. Then, multiple hospitalist leaders from each institution took the survey and gave feedback on content and structure. Using this feedback, changes were made and then tested by the leaders taking the new version of the survey. This process was repeated for 3 cycles until consensus was reached by the researchers on the final version of the survey. The survey contained questions that asked if the program provided coverage at a single site or at multiple sites and utilized a combination of open‐ended and fixed‐choice questions. For some questions, more than 1 answer was permitted. For the purposes of this survey, we utilized the following definitions adapted from the Society of Hospital Medicine. A hospitalist was defined as a physician who specializes in the practice of hospital medicine.[10] An academic PHM program was defined as any hospitalist practice associated with a pediatric residency program.[11] A nocturnist was defined as a hospitalist who predominantly works a schedule providing night coverage.[12]
Survey Administration
SurveyMonkey, an online survey software, was used to administer the survey. In June 2011, letters were mailed to all 246 hospitals affiliated with an accredited pediatric residency program as described above. These were addressed to either the hospital medicine director (if identified using the institutions Web site) or pediatric residency director. The letter asked the recipient to either participate in the survey or forward the survey to the physician best able to answer the survey. The letters included a description of the study and a link to the online survey. Of note, there was no follow‐up on this process. We also distributed the direct link to the survey and a copy of the letter utilizing the AAP Section on Hospital Medicine LISTSERV. Two reminders were sent through the LISTSERV in the month after the initial request. All respondents were informed that they would receive the deidentified raw data as an incentive to participate in the survey. Respondents were defined as those answering the first question, Does your program have an academic hospitalist program?
Statistical Analysis
Completed survey responses were extracted to Microsoft Excel (Microsoft Corp., Redmond, WA) for data analysis. Basic statistics were utilized to determine response rates for each question. Data were stratified for program type (single site or at multiple sites). For some questions, data were further stratified for the main site of multiple‐site programs for comparison to single‐site programs. In a few instances, more than 1 physician from a particular program responded to the survey. For these, the most appropriate respondent (PHM director, residency director, senior hospitalist) was identified utilizing the programs' publicly available Web site; only that physician's answers were used in the analysis.
Human Subjects Protection
This study was determined to be exempt from review by the Cincinnati Children's Hospital Medical Center and Washington University in St. Louis institutional review boards. All potential responders received written information about the survey. Survey design allowed for anonymous responses with voluntary documentation of program name and responders' contact information. The willingness to respond was qualified as implied consent. Data were deidentified prior to analysis and prior to sharing with the survey participants.
RESULTS
Response Rates
A total of 133 responses were received. Duplicate responses from the same program (13/133) were eliminated from the analysis. This yielded an overall response rate of 48.8% (120/246). A total of 81.7% (98/120) of institutions reported having an academic PHM program. Of the 18.3% (22/120) of institutions reporting not having a program, 9.1% (2/22) reported planning on starting a program in the next 3 years. Of the 98 respondents with an academic PHM program, 17 answered only the first survey question, Does your program have an academic hospitalist program? The remaining 81 completed surveys were left for further analysis. All of these respondents identified their program, and therefore we are certain that there were no duplicate responses in the analytic dataset. Of these, 23 (28%) indicated that their programs provided clinical care at multiple sites, and 58 (72%) indicated that their program provided care at a single site (Figure 1).

Administrative
Respondents reported wide variation for the definition of a 1.0 full‐time employee (FTE) hospitalist in their group. This included the units used (hours/year, weeks/year, shifts/year) as well as actual physician workload (Table 1). Weeks/year was the most common unit utilized by programs to define workload (66% of single‐site programs, 48% of multiple‐site programs), followed by hours/year (19%, 22%) and shifts/year (14%, 22%). The mean and median workload per FTE is represented (Table 1). The large ranges and the standard deviations from the mean indicate variability in workload per FTE (Table 1).
| Single‐Site Program | Multiple‐Site Programs | |||||||||
|---|---|---|---|---|---|---|---|---|---|---|
| % Programs | Mean | Median | SD | Range | % Programs | Mean | Median | SD | Range | |
| ||||||||||
| Weeks on service | 66 | 27.14 | 26 | 8.1 | 1246 | 48 | 27.2 | 24 | 9.6 | 1736 |
| Hours/year | 19 | 1886.25 | 1880 | 231.2 | 16002300 | 22 | 1767.33 | 1738 | 109.0 | 16641944 |
| Shifts/year* | 14 | 183 | 191 | 52.2 | 182240 | 22 | 191 | 184 | 38.3 | 155214 |
Scheduled in‐house hospitalist coverage also varied. Daytime coverage was defined as until 3 to 5 pm, evening coverage was defined a until 10 pm to midnight, and 24‐hour coverage was defined a 24/7. Programs reported plans to increase in‐house coverage with the implementation of the 2011 Accreditation Council for Graduate Medical Education (ACGME) resident work hours restrictions.[13] Among single‐site programs, there was a planned 50% increase in day/evening coverage (14% to 21%), with a planned decrease in day‐only coverage, and no change in 24/7 coverage (Table 2). Among the main sites of multiple‐site programs, there was a planned 50% increase in 24/7 in‐house coverage (35% to 52%), with a planned decrease in day‐only coverage, and no change in day/evening coverage (Table 3). Among the satellite sites of multiple‐site programs, there was a planned 9% increase in 24/7 coverage (41% to 50%), with a planned decrease in day‐only coverage, and no change in day/evening coverage (Table 2). Most programs reported that all hospitalists share night coverage (87% single site, 89% multiple sites) (Table 2). Multiple‐site programs were more likely than single‐site programs to use nocturnists, moonlighters, and incentives for those providing evening or night coverage (Table 2).
| Single Site (n=58) | Main Site of Multiple‐Site Programs (n=23) | |||
|---|---|---|---|---|
| Proportion | Response Rate | Proportion | Response Rate | |
| ||||
| Organizational | ||||
| Night shifts | .79 (46/58) | .83 (19/23) | ||
| All share nights | .87 (40/46) | .89 (17/19) | ||
| Nocturnists | .09 (4/46) | .26 (5/19) | ||
| Moonlighters | .04 (2/46) | .12 (2/19) | ||
| Night shift incentives | .74 (43/58) | .78 (18/23) | ||
| Financial | .12 (5/43) | .28 (5/18) | ||
| Time | .12 (5/43) | .22 (4/18) | ||
| No incentives | .79 (34/43) | .61 (11/18) | ||
| In‐house hospitalist coverage pre July 2011a | 1.0 (58/58) | 1.0 (23/23) | ||
| 24/7 | .29 (17/58) | .35 (8/23) | ||
| Day and evening | .14 (8/58) | .17 (4/23) | ||
| Day only | .57 (33/58) | .48 (11/23) | ||
| In‐house hospitalist coverage post July 2011a | 1.0 (58/58) | 1.0 (23/23) | ||
| 24/7 | .29 (17/58) | .52 (12/23) | ||
| Day and evening | .21 (12/58) | .17 (4/23) | ||
| Day only | .50 (29/58) | .30 (7/23) | ||
| Administrative | ||||
| Own division | .32 (18/57) | .98 (57/58) | .74 (17/23) | 1.0 (23/23) |
| Part of another division | .68 (39/57) | .26 (6/23) | ||
| Financial | ||||
| Revenues>expenses | .26 (14/53) | .91 (53/58) | .04 (1/23) | .04 (19/23) |
| Incentives supplement base salary | .45 (25/55) | .95 (55/58) | .48 (10/21) | .91 (21/23) |
| Metrics used to determine incentivesb | .47 (27/58) | .52 (12/23) | ||
| RVUs/MD | .85 (23/27) | .83 (10/12) | ||
| Costs/discharge | .19 (5/27) | .08 (1/12) | ||
| Financial reportingb | .81 (47/58) | .04 (19/23) | ||
| Charges | .64 (30/47) | .68 (13/19) | ||
| Collections | .66 (31/47) | .68 (13/19) | ||
| RVUs | .77 (36/47) | .47 (9/19) | ||
| Main Site (n=23) | Satellite Sites (n=51) | |||
|---|---|---|---|---|
| Proportion | Response Rate | Proportion | Response Rate | |
| In‐house hospitalist coverage pre July 2011 | 1.0 (23/23) | .80 (41/51) | ||
| 24/7 | .35 (8/23) | .41 (17/41) | ||
| Day and evening | .17 (4/23) | .10 (4/41) | ||
| Day only | .48 (11/23) | .49 (20/41) | ||
| In‐house hospitalist coverage post July 2011 | 1.0 (23/23) | |||
| 24/7 | .52 (12/23) | .50 (19/38) | .75 (38/51) | |
| Day and evening | .17 (4/23) | .11 (4/38) | ||
| Day only | .30 (7/23) | .39 (15/38) | ||
| Night shift coverage | .83 (19/23) | .78 (18/23) | ||
| All share nights | .89 (17/19) | .94 (17/18) | ||
| Nocturnists | .26 (5/19) | .22 (4/18) | ||
| Moonlighters | .12 (2/19) | .17 (3/18) | ||
The vast majority of multiple‐site programs reported that their different clinical sites are considered parts of a single hospitalist program (96%), and that there is a designated medical director for each site (83%). However, only 70% of multiple‐site programs report that decisions concerning physician coverage are made as a group, and only 65% report that scheduling is done centrally. In addition, there is variability in how quality, safety, and patient satisfaction is reported (group vs site). The majority of programs report sharing revenues and expenses among the sites (Table 4).
| Proportion | Response Rate | |
|---|---|---|
| Sites regularly collaborate on: | 1.0 (23/23) | |
| Quality improvement projects | .74 (17/23) | |
| Safety initiatives | .74 (17/23) | |
| Research | .48 (11/23) | |
| Have a designated hospitalist medical director for each site | .83 (19/23) | 1.0 (23/23) |
| Different sites considered parts of a single hospitalist program | .96 (22/23) | 1.0 (23/23) |
| Make decisions on program/coverage/hour changes as a group | .70 (16/23) | 1.0 (23/23) |
| Scheduling done centrally | .65 (15/23) | 1.0 (23/23) |
| Report or track the following as individual sites: | ||
| Quality measures | .43 (9/21) | .91 (21/23) |
| Safety measures | .48 (10/21) | .91 (21/23) |
| Patient satisfaction | .50 (10/20) | .87 (20/23) |
| Report or track the following as a group: | ||
| Quality measures | .33 (7/21) | .91 (21/23) |
| Safety measures | .33 (7/21) | .91 (21/23) |
| Patient satisfaction | .30 (6/20) | .87 (20/23) |
| Report or track the following as both individual sites and as a group: | ||
| Quality measures | .24 (5/21) | .91 (21/23) |
| Safety measures | .19 (4/21) | .91 (21/23) |
| Patient satisfaction | .25 (4/20) | .87 (20/23) |
| Sites share revenues and expenses | .67 (14/21) | .91 (21/23) |
Organizational
Of the single‐site programs that answered the question Is your hospital medicine program considered its own division or a section within another division? 32% reported that their programs were considered its own division, and 68% reported that they were a part of another division, predominately (62%) general pediatrics, but also a few (6% combined) within emergency medicine, critical care, physical medicine and rehabilitation, and infectious diseases. Of the multiple‐site programs, a majority of 74% programs were their own division, and 26% were part of another division (Table 2). Respondents reported that their satellite sites included pediatric units in small community hospitals, small pediatric hospitals, large nonpediatric hospitals with pediatric units, rehabilitation facilities, and Shriner orthopedic hospitals.
Financial
Of the single‐site programs that answered the question Do patient revenues produced by your hospitalist group cover all expenses? only 26% reported that revenues exceeded expenses. Of the multiple‐site programs responding to this question, only 4% reported that the main site of their programs had revenues greater than expenses (Table 2). Programs used a combination of metrics to report revenue, and relative value unit (RVU)/medical doctor (MD) is the most commonly used metric to determine incentive pay (Table 2).
DISCUSSION
Our study demonstrates that academic PHM programs are common, which is consistent with previous data.[4, 7, 9, 14] The data support our belief that more institutions are planning on starting PHM programs. However, there exist much variability in a variety of program factors.[2, 3, 8, 9, 14] The fact that up to 35% of categorical pediatric residents are considering a career as a hospitalist further highlights the need for better data on PHM programs.[7]
We demonstrated that variability existed in hospitalist workload at academic PHM programs. We found considerable variation in the workload per hospitalist (large ranges and standard deviations), as well as variability in how an FTE is defined (hours/year, weeks/year, shifts/year) (Table 1). In addition, survey respondents might have interpreted certain questions differently, and this might have led to increased variability in the data. For example, the question concerning the definition of an FTE was worded as A clinical FTE is defined as. Some of the reported variation in workload might be partially explained by hospitalists having additional nonclinical responsibilities within hospital medicine or another field, including protected time for quality improvement, medical education, research, or administrative activities. Furthermore, some hospitalists might have clinical responsibilities outside of hospital medicine. Given that most PHM programs lack a formal internal definition of what it means to be a hospitalist,[7] it is not surprising to find such variation between programs. The variability in the extent of in‐house coverage provided by academic PHM programs, as well as institutional plans for increased coverage with the 2011 residency work‐hours restrictions is also described, and is consistent with other recently published data.[14] This is likely to continue, as 70% of academic PHM programs reported an anticipated increase in coverage in the near future,[14] suggesting that academic hospitalists are being used to help fill gaps in coverage left by changes in resident staffing.
Our data describe the percentage of academic programs that have a distinct division of hospital medicine. The fact that multisite programs were more likely to report being a distinct division might reflect the increased complexities of providing care at more than 1 site, requiring a greater infrastructure. This might be important in institutional planning as well as academic and financial expectations of academic pediatric hospitalists.
We also demonstrated that programs with multiple sites differ as far as the degree of integration of the various sites, with variation reported in decision making, scheduling, and how quality, safety, and patient satisfaction are reported (Table 4). Whether or not increased integration between the various clinical sites of a multiple‐site program is associated with better performance and/or physician satisfaction are questions that need to be answered. However, academic PHM directors would likely agree that there are great challenges inherent in managing these programs. These challenges include professional integration (do hospitalists based at satellite sites feel that they are academically supported?), clinical work/expectations (fewer resources and fewer learners at satellite sites likely affects workload), and administrative issues (physician scheduling likely becomes more complex as the number of sites increases). As programs continue to grow and provide clinical services in multiple geographic sites, it will become more important to understand how the different sites are coordinated to identify and develop best practices.
Older studies have described that the majority of PHM programs (70%78%) reported that professional revenues do not cover expenses, unfortunately these results were not stratified for program type (academic vs community).[2, 9]
Our study describes that few academic PHM programs (26% of single site, 4% of multiple‐site programs) report revenues (defined in our survey as only the collections from professional billing) in excess of expenses. This is consistent with prior studies that have included both academic and community PHM programs.[2] Therefore, it appears to be common for PHM programs to require institutional funding to cover all program expenses, as collections from professional billing are not generally adequate for this purpose. We believe that this is a critical point for both hospitalists and administrators to understand. However, it is equally important that they be transparent about the importance and value of the nonrevenue‐generating work performed by PHM programs. It has been reported that the vast majority of pediatric hospitalists are highly involved in education, quality improvement work, practice guideline development, and other work that is vitally important to institutions.[3] Furthermore, although one might expect PHM leaders to believe that their programs add value beyond the professional revenue collected,[9] even hospital leadership has been reported to perceive that PHM programs add value in several ways, including increased patient satisfaction (94%), increased referring MD satisfaction (90%), decreased length of stay (81%), and decreased costs (62%).[2] Pediatric residency and clerkship directors report that pediatric hospitalists are more accessible than other faculty (84% vs 64%) and are associated with an increase in the practice of evidence‐based medicine (76% vs 61%).[4] Therefore, there is strong evidence supporting that pediatric hospitalist programs provide important value that is not evident on a balance sheet.
In addition, our data also indicate that programs currently use a variety of metrics in combination to report productivity, and there is no accepted gold standard for measuring the performance of a hospitalist or hospitalist program (Table 2). Given that hospitalists generally cannot control how many patients they see, and given the fact that hospitalists are strongly perceived to provide value to their institutions beyond generating clinical revenue, metrics such as RVUs and charges likely do not accurately represent actual productivity.[2] Furthermore, it is likely that the metrics currently used underestimate actual productivity as they are not designed to take into account confounding factors that might affect hospitalist productivity. For example, consider an academic hospitalist who has clinical responsibilities divided between direct patient care and supervisory patient care (such as a team with some combination of residents, medical students, and physician extenders). When providing direct patient care, the hospitalist is likely responsible or all of the tasks usually performed by residents, including writing all patient notes and prescriptions, all communication with families, nurses, specialists, and primary care providers; and discharge planning. Conversely, when providing supervisory care, it is likely that the tasks are divided among the team members, and the hospitalist has the additional responsibility for providing teaching. However, the hospitalist might be responsible for more complex and acute patients. These factors are not adequately measured by RVUs or professional billing. Furthermore, these metrics do not capture the differences in providing in‐house daytime versus evening/night coverage, and do not measure the work performed while being on call when outside of the hospital. It is important for PHM programs and leaders to develop a better representation of the value provided by hospitalists, and for institutional leaders to understand this value, because previous work has suggested that the majority of hospital leaders do not plan to phase out the subsidy of hospitalists over time, as they do not anticipate the program(s) will be able to covercosts.[2] Given the realities of decreasing reimbursement and healthcare reform, it is unlikely to become more common for PHM programs to generate enough professional revenue to cover expenses.
The main strength of this descriptive study is the comprehensive nature of the survey, including many previously unreported data. In addition, the data are consistent with previously published work, which validates the quality of the data.
This study has several limitations including a low response rate and the exclusion of some hospitals or programs because they provided insufficient data for analysis. However, a post hoc analysis demonstrated that the majority of the institutions reporting that they did not have an academic PHM program (18/22), and those that were excluded due to insufficient data (12/17) were either smaller residency programs (<60 residents) or hospitals that were not the main site of a residency program. Therefore, our data likely are a good representation of academic PHM programs at larger academic institutions. Another potential weakness is that, although PHM program directors and pediatric residency directors were targeted, the respondent might not have been the person with the best knowledge of the program, which could have produced inaccurate data, particularly in terms of finances. However, the general consistency of our findings with previous work, particularly the high percentage of institutions with academic PHM programs,[4, 7, 9, 14] the low percentage of programs with revenues greater than expenses,[2, 9] and the trend toward increased in‐house coverage associated with the 2011 ACGME work‐hour restrictions,[14] supports the validity of our other results. In addition, survey respondents might have interpreted certain questions differently, specifically the questions concerning the definition of an FTE, and this might have led to increased variability in the data.
CONCLUSIONS
Academic PHM programs exist in the vast majority of academic centers, and more institutions are planning on starting programs in the next few years. There appears to be variability in a number of program factors, including hospitalist workload, in‐house coverage, and whether the program is a separate division or a section within another academic division. Many programs are currently providing care at more than 1 site. Programs uncommonly reported that their revenues exceeded their expenses. These data are the most comprehensive data existing for academic PHM programs.
Acknowledgment
Disclosure: Nothing to report.
- . Pediatric hospital medicine: historical perspectives, inspired future. Curr Probl Pediatr Adolesc Health Care. 2012;42(5):107–112.
- , , . Assessing the value of pediatric hospitalist programs: the perspective of hospital leaders. Acad Pediatr. 2009;9(3):192–196.
- , . Pediatric hospitalists: training, current practice, and career goals. J Hosp Med. 2009;4(3):179–186.
- , , . Hospitalists' involvement in pediatrics training: perspectives from pediatric residency program and clerkship directors. Acad Med. 2009;84(11):1617–1621.
- , . Research in pediatric hospital medicine: how research will impact clinical care. Curr Probl Pediatr Adolesc Health Care. 2012;42(5):127–130.
- , . Pediatric hospitalists in medical education: current roles and future directions. Curr Probl Pediatr Adolesc Health Care. 2012;42(5):120–126.
- , , , , . Pediatric hospitalists' influences on education and career plans. J Hosp Med. 2012;7(4):282–286.
- , . Pediatric hospitalist systems versus traditional models of care: effect on quality and cost outcomes. J Hosp Med. 2012;7(4):350–357.
- , , , . Characteristics of the pediatric hospitalist workforce: its roles and work environment. Pediatrics. 2007;120(33):33–39.
- Society of Hospital Medicine. Definition of a hospitalist and hospital medicine. Available at: http://www.hospitalmedicine.org/AM/Template.cfm?Section=Hospitalist_Definition7(4):299–303.
Pediatric hospital medicine (PHM) is a relatively new field that has been growing rapidly over the past 20 years.[1] The field has been increasingly recognized for its contributions to high‐quality patient care, patient safety, systems improvement, medical education, and research.[2, 3, 4, 5, 6, 7, 8, 9] However, there appears to be significant variation among programs, even in basic factors such as how clinical effort is defined, the extent of in‐house coverage provided, and the scope of clinical services provided, and there exists a paucity of data describing these variations.[8]
Most previously published work did not specifically focus on academic programs,[2, 3, 8, 9] and specifically targeted hospital leadership,[2] practicing hospitalists,[3] residents,[7] and pediatric residency or clerkship directors,[4, 7] rather than hospitalist directors.[9] Furthermore, previous work focused on specific aspects of PHM programs such as education,[4, 7] value,[2] work environment,[9] and clinical practice,[3] rather than a more comprehensive approach.
We conducted a survey of academic PHM programs to learn about the current state and variation among programs across multiple domains (organizational, administrative, and financial). We speculated that:
- Many institutions currently lacking an academic PHM program were planning on starting a program in the next 3 years.
- Variability exists in hospitalist workload among programs.
- In programs providing clinical coverage at more than 1 site, variability exists in the relationship between the main site and satellite site(s) in terms of decision making, scheduling, and reporting of performance.
METHODS
Sample
We used the online American Medical Association Fellowship and Residency Electronic Interactive Database (FREIDA) to identify all 198 accredited pediatric residency training programs in the United States. A total of 246 hospitals were affiliated with these programs, and all of these were targeted for the survey. In addition, academic PHM program leaders were targeted directly with email invitations through the American Academy of Pediatrics (AAP) Section on Hospital Medicine LISTSERV.
Survey Instrument
A 49‐question online survey on the administrative, organizational, and financial aspects of academic PHM programs was developed with the input of academic PHM hospital leaders from Cincinnati Children's Hospital Medical Center and St. Louis Children's Hospital. First, the survey questions were developed de novo by the researchers. Then, multiple hospitalist leaders from each institution took the survey and gave feedback on content and structure. Using this feedback, changes were made and then tested by the leaders taking the new version of the survey. This process was repeated for 3 cycles until consensus was reached by the researchers on the final version of the survey. The survey contained questions that asked if the program provided coverage at a single site or at multiple sites and utilized a combination of open‐ended and fixed‐choice questions. For some questions, more than 1 answer was permitted. For the purposes of this survey, we utilized the following definitions adapted from the Society of Hospital Medicine. A hospitalist was defined as a physician who specializes in the practice of hospital medicine.[10] An academic PHM program was defined as any hospitalist practice associated with a pediatric residency program.[11] A nocturnist was defined as a hospitalist who predominantly works a schedule providing night coverage.[12]
Survey Administration
SurveyMonkey, an online survey software, was used to administer the survey. In June 2011, letters were mailed to all 246 hospitals affiliated with an accredited pediatric residency program as described above. These were addressed to either the hospital medicine director (if identified using the institutions Web site) or pediatric residency director. The letter asked the recipient to either participate in the survey or forward the survey to the physician best able to answer the survey. The letters included a description of the study and a link to the online survey. Of note, there was no follow‐up on this process. We also distributed the direct link to the survey and a copy of the letter utilizing the AAP Section on Hospital Medicine LISTSERV. Two reminders were sent through the LISTSERV in the month after the initial request. All respondents were informed that they would receive the deidentified raw data as an incentive to participate in the survey. Respondents were defined as those answering the first question, Does your program have an academic hospitalist program?
Statistical Analysis
Completed survey responses were extracted to Microsoft Excel (Microsoft Corp., Redmond, WA) for data analysis. Basic statistics were utilized to determine response rates for each question. Data were stratified for program type (single site or at multiple sites). For some questions, data were further stratified for the main site of multiple‐site programs for comparison to single‐site programs. In a few instances, more than 1 physician from a particular program responded to the survey. For these, the most appropriate respondent (PHM director, residency director, senior hospitalist) was identified utilizing the programs' publicly available Web site; only that physician's answers were used in the analysis.
Human Subjects Protection
This study was determined to be exempt from review by the Cincinnati Children's Hospital Medical Center and Washington University in St. Louis institutional review boards. All potential responders received written information about the survey. Survey design allowed for anonymous responses with voluntary documentation of program name and responders' contact information. The willingness to respond was qualified as implied consent. Data were deidentified prior to analysis and prior to sharing with the survey participants.
RESULTS
Response Rates
A total of 133 responses were received. Duplicate responses from the same program (13/133) were eliminated from the analysis. This yielded an overall response rate of 48.8% (120/246). A total of 81.7% (98/120) of institutions reported having an academic PHM program. Of the 18.3% (22/120) of institutions reporting not having a program, 9.1% (2/22) reported planning on starting a program in the next 3 years. Of the 98 respondents with an academic PHM program, 17 answered only the first survey question, Does your program have an academic hospitalist program? The remaining 81 completed surveys were left for further analysis. All of these respondents identified their program, and therefore we are certain that there were no duplicate responses in the analytic dataset. Of these, 23 (28%) indicated that their programs provided clinical care at multiple sites, and 58 (72%) indicated that their program provided care at a single site (Figure 1).
Administrative
Respondents reported wide variation for the definition of a 1.0 full‐time employee (FTE) hospitalist in their group. This included the units used (hours/year, weeks/year, shifts/year) as well as actual physician workload (Table 1). Weeks/year was the most common unit utilized by programs to define workload (66% of single‐site programs, 48% of multiple‐site programs), followed by hours/year (19%, 22%) and shifts/year (14%, 22%). The mean and median workload per FTE is represented (Table 1). The large ranges and the standard deviations from the mean indicate variability in workload per FTE (Table 1).
| Single‐Site Program | Multiple‐Site Programs | |||||||||
|---|---|---|---|---|---|---|---|---|---|---|
| % Programs | Mean | Median | SD | Range | % Programs | Mean | Median | SD | Range | |
| ||||||||||
| Weeks on service | 66 | 27.14 | 26 | 8.1 | 1246 | 48 | 27.2 | 24 | 9.6 | 1736 |
| Hours/year | 19 | 1886.25 | 1880 | 231.2 | 16002300 | 22 | 1767.33 | 1738 | 109.0 | 16641944 |
| Shifts/year* | 14 | 183 | 191 | 52.2 | 182240 | 22 | 191 | 184 | 38.3 | 155214 |
Scheduled in‐house hospitalist coverage also varied. Daytime coverage was defined as until 3 to 5 pm, evening coverage was defined a until 10 pm to midnight, and 24‐hour coverage was defined a 24/7. Programs reported plans to increase in‐house coverage with the implementation of the 2011 Accreditation Council for Graduate Medical Education (ACGME) resident work hours restrictions.[13] Among single‐site programs, there was a planned 50% increase in day/evening coverage (14% to 21%), with a planned decrease in day‐only coverage, and no change in 24/7 coverage (Table 2). Among the main sites of multiple‐site programs, there was a planned 50% increase in 24/7 in‐house coverage (35% to 52%), with a planned decrease in day‐only coverage, and no change in day/evening coverage (Table 3). Among the satellite sites of multiple‐site programs, there was a planned 9% increase in 24/7 coverage (41% to 50%), with a planned decrease in day‐only coverage, and no change in day/evening coverage (Table 2). Most programs reported that all hospitalists share night coverage (87% single site, 89% multiple sites) (Table 2). Multiple‐site programs were more likely than single‐site programs to use nocturnists, moonlighters, and incentives for those providing evening or night coverage (Table 2).
| Single Site (n=58) | Main Site of Multiple‐Site Programs (n=23) | |||
|---|---|---|---|---|
| Proportion | Response Rate | Proportion | Response Rate | |
| ||||
| Organizational | ||||
| Night shifts | .79 (46/58) | .83 (19/23) | ||
| All share nights | .87 (40/46) | .89 (17/19) | ||
| Nocturnists | .09 (4/46) | .26 (5/19) | ||
| Moonlighters | .04 (2/46) | .12 (2/19) | ||
| Night shift incentives | .74 (43/58) | .78 (18/23) | ||
| Financial | .12 (5/43) | .28 (5/18) | ||
| Time | .12 (5/43) | .22 (4/18) | ||
| No incentives | .79 (34/43) | .61 (11/18) | ||
| In‐house hospitalist coverage pre July 2011a | 1.0 (58/58) | 1.0 (23/23) | ||
| 24/7 | .29 (17/58) | .35 (8/23) | ||
| Day and evening | .14 (8/58) | .17 (4/23) | ||
| Day only | .57 (33/58) | .48 (11/23) | ||
| In‐house hospitalist coverage post July 2011a | 1.0 (58/58) | 1.0 (23/23) | ||
| 24/7 | .29 (17/58) | .52 (12/23) | ||
| Day and evening | .21 (12/58) | .17 (4/23) | ||
| Day only | .50 (29/58) | .30 (7/23) | ||
| Administrative | ||||
| Own division | .32 (18/57) | .98 (57/58) | .74 (17/23) | 1.0 (23/23) |
| Part of another division | .68 (39/57) | .26 (6/23) | ||
| Financial | ||||
| Revenues>expenses | .26 (14/53) | .91 (53/58) | .04 (1/23) | .04 (19/23) |
| Incentives supplement base salary | .45 (25/55) | .95 (55/58) | .48 (10/21) | .91 (21/23) |
| Metrics used to determine incentivesb | .47 (27/58) | .52 (12/23) | ||
| RVUs/MD | .85 (23/27) | .83 (10/12) | ||
| Costs/discharge | .19 (5/27) | .08 (1/12) | ||
| Financial reportingb | .81 (47/58) | .04 (19/23) | ||
| Charges | .64 (30/47) | .68 (13/19) | ||
| Collections | .66 (31/47) | .68 (13/19) | ||
| RVUs | .77 (36/47) | .47 (9/19) | ||
| Main Site (n=23) | Satellite Sites (n=51) | |||
|---|---|---|---|---|
| Proportion | Response Rate | Proportion | Response Rate | |
| In‐house hospitalist coverage pre July 2011 | 1.0 (23/23) | .80 (41/51) | ||
| 24/7 | .35 (8/23) | .41 (17/41) | ||
| Day and evening | .17 (4/23) | .10 (4/41) | ||
| Day only | .48 (11/23) | .49 (20/41) | ||
| In‐house hospitalist coverage post July 2011 | 1.0 (23/23) | |||
| 24/7 | .52 (12/23) | .50 (19/38) | .75 (38/51) | |
| Day and evening | .17 (4/23) | .11 (4/38) | ||
| Day only | .30 (7/23) | .39 (15/38) | ||
| Night shift coverage | .83 (19/23) | .78 (18/23) | ||
| All share nights | .89 (17/19) | .94 (17/18) | ||
| Nocturnists | .26 (5/19) | .22 (4/18) | ||
| Moonlighters | .12 (2/19) | .17 (3/18) | ||
The vast majority of multiple‐site programs reported that their different clinical sites are considered parts of a single hospitalist program (96%), and that there is a designated medical director for each site (83%). However, only 70% of multiple‐site programs report that decisions concerning physician coverage are made as a group, and only 65% report that scheduling is done centrally. In addition, there is variability in how quality, safety, and patient satisfaction is reported (group vs site). The majority of programs report sharing revenues and expenses among the sites (Table 4).
| Proportion | Response Rate | |
|---|---|---|
| Sites regularly collaborate on: | 1.0 (23/23) | |
| Quality improvement projects | .74 (17/23) | |
| Safety initiatives | .74 (17/23) | |
| Research | .48 (11/23) | |
| Have a designated hospitalist medical director for each site | .83 (19/23) | 1.0 (23/23) |
| Different sites considered parts of a single hospitalist program | .96 (22/23) | 1.0 (23/23) |
| Make decisions on program/coverage/hour changes as a group | .70 (16/23) | 1.0 (23/23) |
| Scheduling done centrally | .65 (15/23) | 1.0 (23/23) |
| Report or track the following as individual sites: | ||
| Quality measures | .43 (9/21) | .91 (21/23) |
| Safety measures | .48 (10/21) | .91 (21/23) |
| Patient satisfaction | .50 (10/20) | .87 (20/23) |
| Report or track the following as a group: | ||
| Quality measures | .33 (7/21) | .91 (21/23) |
| Safety measures | .33 (7/21) | .91 (21/23) |
| Patient satisfaction | .30 (6/20) | .87 (20/23) |
| Report or track the following as both individual sites and as a group: | ||
| Quality measures | .24 (5/21) | .91 (21/23) |
| Safety measures | .19 (4/21) | .91 (21/23) |
| Patient satisfaction | .25 (4/20) | .87 (20/23) |
| Sites share revenues and expenses | .67 (14/21) | .91 (21/23) |
Organizational
Of the single‐site programs that answered the question Is your hospital medicine program considered its own division or a section within another division? 32% reported that their programs were considered its own division, and 68% reported that they were a part of another division, predominately (62%) general pediatrics, but also a few (6% combined) within emergency medicine, critical care, physical medicine and rehabilitation, and infectious diseases. Of the multiple‐site programs, a majority of 74% programs were their own division, and 26% were part of another division (Table 2). Respondents reported that their satellite sites included pediatric units in small community hospitals, small pediatric hospitals, large nonpediatric hospitals with pediatric units, rehabilitation facilities, and Shriner orthopedic hospitals.
Financial
Of the single‐site programs that answered the question Do patient revenues produced by your hospitalist group cover all expenses? only 26% reported that revenues exceeded expenses. Of the multiple‐site programs responding to this question, only 4% reported that the main site of their programs had revenues greater than expenses (Table 2). Programs used a combination of metrics to report revenue, and relative value unit (RVU)/medical doctor (MD) is the most commonly used metric to determine incentive pay (Table 2).
DISCUSSION
Our study demonstrates that academic PHM programs are common, which is consistent with previous data.[4, 7, 9, 14] The data support our belief that more institutions are planning on starting PHM programs. However, there exist much variability in a variety of program factors.[2, 3, 8, 9, 14] The fact that up to 35% of categorical pediatric residents are considering a career as a hospitalist further highlights the need for better data on PHM programs.[7]
We demonstrated that variability existed in hospitalist workload at academic PHM programs. We found considerable variation in the workload per hospitalist (large ranges and standard deviations), as well as variability in how an FTE is defined (hours/year, weeks/year, shifts/year) (Table 1). In addition, survey respondents might have interpreted certain questions differently, and this might have led to increased variability in the data. For example, the question concerning the definition of an FTE was worded as A clinical FTE is defined as. Some of the reported variation in workload might be partially explained by hospitalists having additional nonclinical responsibilities within hospital medicine or another field, including protected time for quality improvement, medical education, research, or administrative activities. Furthermore, some hospitalists might have clinical responsibilities outside of hospital medicine. Given that most PHM programs lack a formal internal definition of what it means to be a hospitalist,[7] it is not surprising to find such variation between programs. The variability in the extent of in‐house coverage provided by academic PHM programs, as well as institutional plans for increased coverage with the 2011 residency work‐hours restrictions is also described, and is consistent with other recently published data.[14] This is likely to continue, as 70% of academic PHM programs reported an anticipated increase in coverage in the near future,[14] suggesting that academic hospitalists are being used to help fill gaps in coverage left by changes in resident staffing.
Our data describe the percentage of academic programs that have a distinct division of hospital medicine. The fact that multisite programs were more likely to report being a distinct division might reflect the increased complexities of providing care at more than 1 site, requiring a greater infrastructure. This might be important in institutional planning as well as academic and financial expectations of academic pediatric hospitalists.
We also demonstrated that programs with multiple sites differ as far as the degree of integration of the various sites, with variation reported in decision making, scheduling, and how quality, safety, and patient satisfaction are reported (Table 4). Whether or not increased integration between the various clinical sites of a multiple‐site program is associated with better performance and/or physician satisfaction are questions that need to be answered. However, academic PHM directors would likely agree that there are great challenges inherent in managing these programs. These challenges include professional integration (do hospitalists based at satellite sites feel that they are academically supported?), clinical work/expectations (fewer resources and fewer learners at satellite sites likely affects workload), and administrative issues (physician scheduling likely becomes more complex as the number of sites increases). As programs continue to grow and provide clinical services in multiple geographic sites, it will become more important to understand how the different sites are coordinated to identify and develop best practices.
Older studies have described that the majority of PHM programs (70%78%) reported that professional revenues do not cover expenses, unfortunately these results were not stratified for program type (academic vs community).[2, 9]
Our study describes that few academic PHM programs (26% of single site, 4% of multiple‐site programs) report revenues (defined in our survey as only the collections from professional billing) in excess of expenses. This is consistent with prior studies that have included both academic and community PHM programs.[2] Therefore, it appears to be common for PHM programs to require institutional funding to cover all program expenses, as collections from professional billing are not generally adequate for this purpose. We believe that this is a critical point for both hospitalists and administrators to understand. However, it is equally important that they be transparent about the importance and value of the nonrevenue‐generating work performed by PHM programs. It has been reported that the vast majority of pediatric hospitalists are highly involved in education, quality improvement work, practice guideline development, and other work that is vitally important to institutions.[3] Furthermore, although one might expect PHM leaders to believe that their programs add value beyond the professional revenue collected,[9] even hospital leadership has been reported to perceive that PHM programs add value in several ways, including increased patient satisfaction (94%), increased referring MD satisfaction (90%), decreased length of stay (81%), and decreased costs (62%).[2] Pediatric residency and clerkship directors report that pediatric hospitalists are more accessible than other faculty (84% vs 64%) and are associated with an increase in the practice of evidence‐based medicine (76% vs 61%).[4] Therefore, there is strong evidence supporting that pediatric hospitalist programs provide important value that is not evident on a balance sheet.
In addition, our data also indicate that programs currently use a variety of metrics in combination to report productivity, and there is no accepted gold standard for measuring the performance of a hospitalist or hospitalist program (Table 2). Given that hospitalists generally cannot control how many patients they see, and given the fact that hospitalists are strongly perceived to provide value to their institutions beyond generating clinical revenue, metrics such as RVUs and charges likely do not accurately represent actual productivity.[2] Furthermore, it is likely that the metrics currently used underestimate actual productivity as they are not designed to take into account confounding factors that might affect hospitalist productivity. For example, consider an academic hospitalist who has clinical responsibilities divided between direct patient care and supervisory patient care (such as a team with some combination of residents, medical students, and physician extenders). When providing direct patient care, the hospitalist is likely responsible or all of the tasks usually performed by residents, including writing all patient notes and prescriptions, all communication with families, nurses, specialists, and primary care providers; and discharge planning. Conversely, when providing supervisory care, it is likely that the tasks are divided among the team members, and the hospitalist has the additional responsibility for providing teaching. However, the hospitalist might be responsible for more complex and acute patients. These factors are not adequately measured by RVUs or professional billing. Furthermore, these metrics do not capture the differences in providing in‐house daytime versus evening/night coverage, and do not measure the work performed while being on call when outside of the hospital. It is important for PHM programs and leaders to develop a better representation of the value provided by hospitalists, and for institutional leaders to understand this value, because previous work has suggested that the majority of hospital leaders do not plan to phase out the subsidy of hospitalists over time, as they do not anticipate the program(s) will be able to covercosts.[2] Given the realities of decreasing reimbursement and healthcare reform, it is unlikely to become more common for PHM programs to generate enough professional revenue to cover expenses.
The main strength of this descriptive study is the comprehensive nature of the survey, including many previously unreported data. In addition, the data are consistent with previously published work, which validates the quality of the data.
This study has several limitations including a low response rate and the exclusion of some hospitals or programs because they provided insufficient data for analysis. However, a post hoc analysis demonstrated that the majority of the institutions reporting that they did not have an academic PHM program (18/22), and those that were excluded due to insufficient data (12/17) were either smaller residency programs (<60 residents) or hospitals that were not the main site of a residency program. Therefore, our data likely are a good representation of academic PHM programs at larger academic institutions. Another potential weakness is that, although PHM program directors and pediatric residency directors were targeted, the respondent might not have been the person with the best knowledge of the program, which could have produced inaccurate data, particularly in terms of finances. However, the general consistency of our findings with previous work, particularly the high percentage of institutions with academic PHM programs,[4, 7, 9, 14] the low percentage of programs with revenues greater than expenses,[2, 9] and the trend toward increased in‐house coverage associated with the 2011 ACGME work‐hour restrictions,[14] supports the validity of our other results. In addition, survey respondents might have interpreted certain questions differently, specifically the questions concerning the definition of an FTE, and this might have led to increased variability in the data.
CONCLUSIONS
Academic PHM programs exist in the vast majority of academic centers, and more institutions are planning on starting programs in the next few years. There appears to be variability in a number of program factors, including hospitalist workload, in‐house coverage, and whether the program is a separate division or a section within another academic division. Many programs are currently providing care at more than 1 site. Programs uncommonly reported that their revenues exceeded their expenses. These data are the most comprehensive data existing for academic PHM programs.
Acknowledgment
Disclosure: Nothing to report.
- . Pediatric hospital medicine: historical perspectives, inspired future. Curr Probl Pediatr Adolesc Health Care. 2012;42(5):107–112.
- , , . Assessing the value of pediatric hospitalist programs: the perspective of hospital leaders. Acad Pediatr. 2009;9(3):192–196.
- , . Pediatric hospitalists: training, current practice, and career goals. J Hosp Med. 2009;4(3):179–186.
- , , . Hospitalists' involvement in pediatrics training: perspectives from pediatric residency program and clerkship directors. Acad Med. 2009;84(11):1617–1621.
- , . Research in pediatric hospital medicine: how research will impact clinical care. Curr Probl Pediatr Adolesc Health Care. 2012;42(5):127–130.
- , . Pediatric hospitalists in medical education: current roles and future directions. Curr Probl Pediatr Adolesc Health Care. 2012;42(5):120–126.
- , , , , . Pediatric hospitalists' influences on education and career plans. J Hosp Med. 2012;7(4):282–286.
- , . Pediatric hospitalist systems versus traditional models of care: effect on quality and cost outcomes. J Hosp Med. 2012;7(4):350–357.
- , , , . Characteristics of the pediatric hospitalist workforce: its roles and work environment. Pediatrics. 2007;120(33):33–39.
- Society of Hospital Medicine. Definition of a hospitalist and hospital medicine. Available at: http://www.hospitalmedicine.org/AM/Template.cfm?Section=Hospitalist_Definition7(4):299–303.
Copyright © 2013 Society of Hospital Medicine