User login
Bronchiolitis and Discharge Criteria
Although bronchiolitis is the leading cause of hospitalization for US infants,[1] there is a lack of basic prospective data about the expected inpatient clinical course and ongoing uncertainty about when a hospitalized child is ready for discharge to home.[2] This lack of data about children's readiness for discharge may result in variable hospital length‐of‐stay (LOS).[3, 4, 5]
One specific source of variability in discharge readiness and LOS variability may be the lack of consensus about safe threshold oxygen saturation values for discharge in children hospitalized with bronchiolitis.[6, 7] In 2006, the Scottish Intercollegiate Guidelines Network recommended a discharge room air oxygen (RAO2) saturation threshold of 95%.[8] The same year, the American Academy of Pediatrics (AAP) bronchiolitis clinical practice guideline stated that oxygen is not needed for children with RAO2 saturations 90% who are feeding well and have minimal respiratory distress.[9] There is a need for prospective studies to help clinicians make evidenced‐based discharge decisions for this common condition.
We performed a prospective, multicenter, multiyear study[10, 11, 12] to examine the typical inpatient clinical course of and to develop hospital discharge guidelines for children age <2 years hospitalized with bronchiolitis. We hypothesized that children would not worsen clinically and would be safe to discharge home once their respiratory status improved and they were able to remain hydrated.
METHODS
Study Design and Population
We conducted a prospective, multicenter cohort study for 3 consecutive years during the 2007 to 2010 winter seasons, as part of the Multicenter Airway Research Collaboration (MARC), a program of the Emergency Medicine Network (
All patients were treated at the discretion of the treating physician. Inclusion criteria were an attending physician's diagnosis of bronchiolitis, age <2 years, and the ability of the parent/guardian to give informed consent. The exclusion criteria were previous enrollment and transfer to a participating hospital >48 hours after the original admission time. Therefore, children with comorbid conditions were included in this study. All consent and data forms were translated into Spanish. The institutional review board at each of the 16 participating hospitals approved the study.
Of the 2207 enrolled children, we excluded 109 (5%) children with a hospital LOS <1 day due to inadequate time to capture the required data for the present analysis. Among the 2098 remaining children, 1916 (91%) had daily inpatient data on all factors used to define clinical improvement and clinical worsening. Thus, the analytic cohort was comprised of 1916 children hospitalized for bronchiolitis.
Data Collection
Investigators conducted detailed structured interviews. Chart reviews were conducted to obtain preadmission and daily hospital clinical data including respiratory rates, daily respiratory rate trends, degree of retractions, oxygen saturation, daily oxygen saturation trends, medical management, and disposition. These data were manually reviewed, and site investigators were queried about missing data and discrepancies. A follow‐up telephone interview was conducted with families 1 week after discharge to examine relapse events at both 24 hours and 7 days.
We used the question: How long ago did the following symptoms [eg, difficulty breathing] begin [for the] current illness? to estimate the onset of the current illness. Pulse was categorized as low, normal, or high based on age‐related heart rate values.[13] Presence of apnea was recorded daily by site investigators.[14]
Nasopharyngeal Aspirate Collection and Virology Testing
As described previously, site teams used a standardized protocol to collect nasopharyngeal aspirates,[11] which were tested for respiratory syncytial virus (RSV) types A and B; rhinovirus (RV); parainfluenza virus types 1, 2, and 3; influenza virus types A and B; 2009 novel H1N1; human metapneumovirus; coronaviruses NL‐63, HKU1, OC43, and 229E; enterovirus, and adenovirus using polymerase chain reaction.[11, 15, 16, 17]
Defining Clinical Improvement and Worsening
Clinical improvement criteria were based on the 2006 AAP guidelines.[9] For respiratory rate and oxygen saturation, clinicians estimated average daily respiratory rate and oxygen saturation based on the recorded readings from the previous 24 hours. This estimation reflects the process clinicians use when rounding on their hospitalized patients, and thus may be more similar to standard clinical practice than a calculated mean. The respiratory rate criteria are adjusted for age.[18, 19] For daily estimated average oxygen saturation we used the AAP criteria of RAO2 saturation of 90%. Considering that oxygen saturation is the main determinant of LOS,[20] healthy infants age <6 months may have transient oxygen saturations of around 80%,[21] and that errors in estimation may occur, we included a lowest RAO2 of 88% in our improvement criteria. By combining the dichotomized estimated oxygen saturation (90% or not) with the lower limit of 88%, there was little room for erroneous conclusions. A child was considered clinically improved on the earliest date he/she met all of the following criteria: (1) none or mild retractions and improved or stable retractions compared with the previous inpatient day; (2) daily estimated average respiratory rate (RR) <60 breaths per minute for age <6 months, <55 breaths/minute for age 6 to 11 months, and <45 breaths/minute for age 12 months with a decreasing or stable trend over the course of the current day; (3) daily estimated average RAO2 saturation 90%, lowest RAO2 saturation 88%[21]; and (4) not receiving intravenous (IV) fluids or for children receiving IV fluids a clinician report of the child maintaining oral hydration. Children who reached the clinical improvement criteria were considered clinically worse if they required intensive care or had the inverse of 1 of the improvement criteria: moderate/severe retractions that were worse compared with the previous inpatient day, daily average RR 60 with an increasing trend over the current day, need for oxygen, or need for IV fluids.
Statistical Analyses
All analyses were performed using Stata 12.0 (StataCorp, College Station, TX). Data are presented as proportions with 95% confidence intervals (95% CIs), means with standard deviations, and medians with interquartile ranges (IQR). To examine potential factors associated with clinical worsening after reaching clinical improvement, we used 2, Fisher exact, Student t test, and Kruskall‐Wallis tests, as appropriate.
Adjusted analyses used generalized linear mixed models with a logit link to identify independent risk factors for worsening after reaching clinical improvement. Fixed effects for patient‐level factors and a random site effect were used. Factors were tested for inclusion in the multivariable model if they were found to be associated with worsening in unadjusted analyses (P<0.20) or were considered clinically important. Results are reported as odds ratios with 95% CIs.
We performed several sensitivity analyses to evaluate these improvement criteria: (1) we excluded the lowest RAO2 saturation requirement of 88%, (2) we examined a 94% daily estimated average RAO2 saturation threshold,[22] (3) we examined a 95% daily estimated average RAO2 saturation threshold,[8] and (4) we examined children age <12 months with no history of wheeze.
RESULTS
There were 1916 children hospitalized with bronchiolitis with data on all factors used to define clinical improvement and clinical worsening. The median number of days from the beginning of difficulty breathing until admission was 2 days (IQR, 15.5 days; range, 18 days) and from the beginning of difficulty breathing until clinical improvement was 4 days (IQR, 37.5 days; range, 133 days) (Figure 1). The variance for days to admission was significantly less than the variance for days to clinical improvement (P<0.001).

In this observational study, clinicians discharged 214 (11%) of the 1916 children before meeting the definition of clinical improvement. Thus, 1702 (89%; 95% CI: 87%‐90%) children reached the clinical improvement criteria, had a LOS >1 day, and had data on all factors (Figure 2).
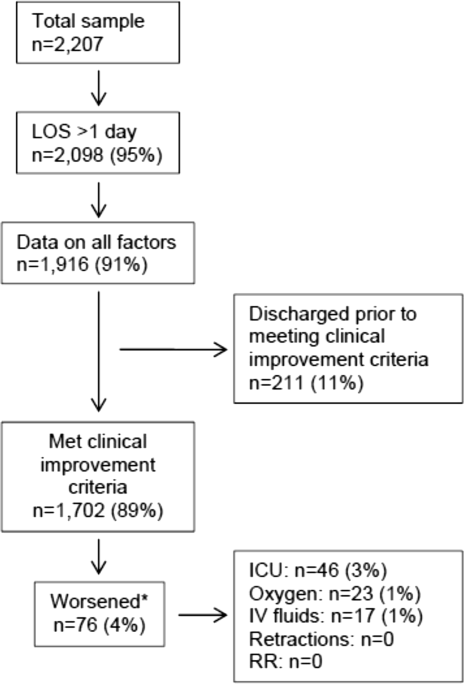
Of the 1702 children who met the clinical improvement criteria, there were 76 children (4%; 95% CI: 3%5%) who worsened (Figure 2). The worsening occurred within a median of 1 day (IQR, 13 days) of clinical improvement. Forty‐six (3%) of the children required transfer to the ICU (1 required intubation, 1 required continuous positive airway pressure, and 4 had apnea), 23 (1%) required oxygen, and 17 (1%) required IV fluids. Eight percent of children met multiple criteria for worsening. A comparison between children who did and did not worsen is shown in Table 1. In general, children who worsened after improvement were younger and born earlier. These children also presented in more severe respiratory distress, had moderate or severe retractions, oxygen saturation <85% at hospitalization, inadequate oral intake, and apnea documented during the hospitalization. Neither viral etiology nor site of care influenced whether the children worsened after improving. However, stratified analysis of children based on initial location of admission (ie, ICU or ward) showed that among the children admitted to the ICU from the emergency department (ED), 89% met the improvement criteria and 19% clinically worsened. In contrast, among children admitted to the ward from the ED, 89% met the improvement criteria, and only 2% clinically worsened. Stratified multivariable models based on the initial location of admission from the ED (ie, ICU or ward) were not possible due to small sample sizes after stratification. None of these children had relapse events requiring rehospitalization within either 24 hours or 7 days of discharge.
| Did Not Worsen, n=1,626 | Worsened, n=76 | P Value | |
|---|---|---|---|
| |||
| Demographic characteristics | |||
| Age <2 months, % | 29 | 57 | <0.001 |
| Month of birth, % | 0.02 | ||
| OctoberMarch | 61 | 75 | |
| AprilSeptember | 39 | 25 | |
| Sex, % | 0.51 | ||
| Male | 59 | 55 | |
| Female | 41 | 45 | |
| Race, % | 0.050 | ||
| White | 63 | 58 | |
| Black | 23 | 34 | |
| Other or missing | 14 | 8 | |
| Hispanic ethnicity, % | 37 | 22 | 0.01 |
| Insurance, % | 0.87 | ||
| Nonprivate | 68 | 67 | |
| Private | 32 | 33 | |
| Medical history | |||
| Gestational age <37 weeks, % | 23 | 39 | 0.002 |
| Birth weight, % | 0.52 | ||
| <5 lbs | 13 | 12 | |
| 5 lbs | 34 | 41 | |
| 7 lbs | 53 | 47 | |
| Mother's age, median (IQR) | 27 (2333) | 27 (2233) | 0.54 |
| Is or was breastfed, % | 61 | 51 | 0.10 |
| Smoked during pregnancy, % | 15 | 20 | 0.22 |
| Exposure to smoke, % | 13 | 20 | 0.11 |
| Family history of asthma, % | 0.89 | ||
| Neither parent | 68 | 64 | |
| Either mother or father | 27 | 30 | |
| Both parents | 4 | 4 | |
| Do not know/missing | 2 | 1 | |
| History of wheezing, % | 23 | 17 | 0.24 |
| History of eczema, % | 16 | 7 | 0.04 |
| History of intubation, % | 9 | 12 | 0.50 |
| Major, relevant, comorbid medical disorder, % | 20 | 24 | 0.46 |
| Current illness | |||
| When difficulty breathing began, preadmission, % | 0.63 | ||
| 1 day | 70 | 75 | |
| <1 day | 28 | 23 | |
| No difficulty preadmission | 2 | 3 | |
| Weight, lbs, median (IQR) | 12.3 (8.817.4) | 9.0 (6.613.2) | 0.001 |
| Temperature, F, median (IQR) | 99.5 (98.6100.6) | 99.4 (98.1100.4) | 0.06 |
| Pulse, beats per minute by age | 0.82 | ||
| Low | 0.3 | 0 | |
| Normal | 48 | 46 | |
| High | 51 | 54 | |
| Respiratory rate, breaths per minute, median (IQR) | 48 (4060) | 48 (3864) | 0.28 |
| Retractions, % | 0.001 | ||
| None | 22 | 25 | |
| Mild | 43 | 24 | |
| Moderate | 26 | 33 | |
| Severe | 4 | 12 | |
| Missing | 5 | 7 | |
| Oxygen saturation by pulse oximetry or ABG, % | 0.001 | ||
| <85 | 4 | 12 | |
| 8587.9 | 3 | 4 | |
| 8889.9 | 5 | 0 | |
| 9093.9 | 18 | 11 | |
| 94 | 72 | 73 | |
| Oral intake, % | <0.001 | ||
| Adequate | 45 | 22 | |
| Inadequate | 42 | 63 | |
| Missing | 13 | 14 | |
| Presence of apnea, % | 7 | 24 | <0.001 |
| RSV‐A, % | 44 | 41 | 0.54 |
| RSV‐B, % | 30 | 25 | 0.36 |
| HRV, % | 24 | 24 | 0.88 |
| Chest x‐ray results during ED/preadmission visit | |||
| Atelectasis | 12 | 13 | 0.77 |
| Infiltrate | 13 | 11 | 0.50 |
| Hyperinflated | 18 | 21 | 0.47 |
| Peribronchial cuffing/thickening | 23 | 17 | 0.32 |
| Normal | 14 | 16 | 0.75 |
| White blood count, median (IQR) | 11.2 (8.714.4) | 11.9 (9.214.4) | 0.60 |
| Platelet count, median (IQR) | 395 (317490) | 430 (299537) | 0.56 |
| Sodium, median (IQR) | 138 (136140) | 137 (135138) | 0.19 |
| Hospital length of stay, median (IQR) | 2 (14) | 4.5 (28) | <0.001 |
| One‐week follow‐up | |||
| Relapse within 24 hours of hospital discharge requiring hospital admission, % | 0.5 | 0 | 0.56 |
| Relapse within 7 days of hospital discharge requiring hospital admission, % | 1 | 0 | 0.35 |
On multivariable analysis (Table 2), independent risk factors for worsening after reaching the clinical improvement criteria were young age, preterm birth, and presenting to care with more severe bronchiolitis represented by severe retractions, inadequate oral intake, or apnea. To further evaluate the improvement criteria in the current analysis, multiple sensitivity analyses were conducted. The frequency of clinical worsening after reaching the improvement criteria was stable when we examined different RA02 criteria in sensitivity analyses: (1) excluding RA02 as a criterion for improvement: 90% met improvement criteria and 4% experienced clinical worsening, (2) changing the average RA02 threshold for clinical improvement to 94%: 62% met improvement criteria and 6% experienced clinical worsening, and (3) changing the average RA02 threshold for clinical improvement to 95%: 47% met improvement criteria and 5% experienced clinical worsening. Furthermore, stratifying by age <2 months and restricting to more stringent definitions of bronchiolitis (ie, age <1 year or age <1 year+no history of wheezing) also did not materially change the results (see Supporting Figure 1 in the online version of this article).
| Odds Ratio | 95% CI | P Value | |
|---|---|---|---|
| |||
| Age <2 months | 3.51 | 2.07‐5.94 | <0.001 |
| Gestational age <37 weeks | 1.94 | 1.13‐3.32 | 0.02 |
| Retractions | |||
| None | 1.30 | 0.80‐3.23 | 0.19 |
| Mild | 1.0 | Reference | |
| Moderate | 1.91 | 0.99‐3.71 | 0.06 |
| Severe | 5.55 | 2.1214.50 | <0.001 |
| Missing | 1.70 | 0.53‐5.42 | 0.37 |
| Oral intake | |||
| Adequate | 1.00 | Reference | |
| Inadequate | 2.54 | 1.39‐4.62 | 0.002 |
| Unknown/missing | 1.88 | 0.79‐4.44 | 0.15 |
| Presence of apnea | 2.87 | 1.45‐5.68 | 0.003 |
We compared the 214 children who were discharged prior to reaching clinical improvement with the 1702 children who reached the clinical improvement criteria. The 214 children were less likely to be age <2 months (22% vs 30%; P=0.02). These 2 groups (214 vs 1702) were similar with respect to severe retractions (2% vs 4%; P=0.13), median respiratory rate (48 vs 48; P=0.42), oxygen saturation <90% (15% vs 11%; P=0.07), inadequate oral intake (50% vs 43%; P=0.13), and rates of relapse events requiring rehospitalization within both 24 hours (0.6% vs 0.6%; P=0.88) and 7 days (1% vs 1%; P=0.90) of discharge.
DISCUSSION
In this large, multicenter, multiyear study of children hospitalized with bronchiolitis, we found that children present to a hospital in a relatively narrow time frame, but their time to recovery in the hospital is highly variable. Nonetheless, 96% of children continued to improve once they had: (1) improving or stable retractions rated as none/mild, (2) a decreasing or stable RR by age, (3) estimated average RAO2 saturation 90% and lowest RAO2 saturation of 88%, and (4) were hydrated. The 4% of children who worsened after clinically improving were more likely to be age <2 months, born <37 weeks, and present with more severe distress (ie, severe retractions, inadequate oral intake, or apnea). Based on the low risk of worsening after clinical improvement, especially among children admitted to the regular ward (2%), we believe these 4 clinical criteria could be used as discharge criteria for this common pediatric illness with a predominantly monophasic clinical course.
Variability in hospital LOS for children with bronchiolitis exists in the United States[3] and internationally.[4, 5] Cheung and colleagues analyzed administrative data from over 75,000 children admitted for bronchiolitis in England between April 2007 and March 2010 and found sixfold variation in LOS between sites. They concluded that this LOS variability was due in part to providers' clinical decision making.[5] Srivastava and colleagues[23] addressed variable clinician decision making in bronchiolitis and 10 other common pediatric conditions by embedding discharge criteria developed by expert consensus into admission order sets. They found that for children with bronchiolitis, the embedded discharge criteria reduced the median LOS from 1.91 to 1.87 days. In contrast to the single‐center data presented by White and colleagues,[24] the prospective, multicenter MARC‐30 data provide a clear understanding of the normal clinical course for children hospitalized with bronchiolitis, determine if children clinically worsen after clinical improvement, and provide data about discharge criteria for children hospitalized with bronchiolitis. Although there is a lack of rigorous published data, the lower tract symptoms of bronchiolitis (eg, cough, retractions) are said to peak on days 5 to 7 of illness and then gradually resolve.[25] In the present study, we found that the time from the onset of difficulty breathing until hospital admission is less variable than the time from the onset of difficulty breathing until either clinical improvement or discharge. Although 75% of children have clinically improved within 7.5 days of difficulty breathing based on the IQR results, the remaining 25% may have a more prolonged recovery in the hospital of up to 3 weeks. Interestingly, prolonged recovery times from bronchiolitis have also been noted in children presenting to the ED[26] and in an outpatient population.[27] It is unclear why 20% to 25% of children at different levels of severity of illness have prolonged recovery from bronchiolitis, but this group of children requires further investigation.
Given the variability of recovery times, clinicians may have difficulty knowing when a child is ready for hospital discharge. One of the main stumbling blocks for discharge readiness in children with bronchiolitis is the interpretation of the oxygen saturation value.[6, 8, 9, 20, 28] However, it should be considered that interpreting the oxygen saturation in a child who is clinically improving in the hospital setting is different than interpreting the oxygen saturation of a child in the ED or the clinic whose clinical course is less certain.[22] In the hospital setting, using the oxygen saturation value in in the AAP guideline,[9] 4% of children clinically worsened after they met the improvement criteria, a clinical pattern observed previously with supplemental oxygen.[28] This unpredictability may explain some of the variation in providers' clinical decision making.[5] The children who worsened, and therefore deserve more cautious discharge planning, were young (<2 months), premature (<37 weeks gestational age), and presented in more severe distress. Those children admitted to the ICU from the ED worsened more commonly than children admitted to the ward (19% vs 2%). Interestingly, the viral etiology of the child's bronchiolitis did not influence whether a child worsened after reaching the improvement criteria. Therefore, although children with RV bronchiolitis have a shorter hospital LOS than children with RSV bronchiolitis,[11] the pattern of recovery did not differ by viral etiology.
In addition to unsafe discharges, clinicians may be concerned about the possibility of readmissions. Although somewhat controversial, hospital readmission is being used as a quality of care metric.[29, 30, 31] One response to minimize readmissions would be for clinicians to observe children for longer than clinically indicated.[32] However, shorter LOS is not necessarily associated with increased readmission rates.[33] Given that the geometric mean of hospital charges per child with bronchiolitis increased from $6380 in 2000 to $8530 in 2009,[34] the potential for safely reducing hospital LOS by using the discharge criteria proposed in the current study instead of other criteria[8] may net substantial cost savings. Furthermore, reducing LOS would decrease the time children expose others to these respiratory viruses and possibly reduce medical errors.[35]
Our study has some potential limitations. Because the study participants were all hospitalized, these data do not inform admission or discharge decisions from either the ED or the clinic; but other data address those clinical scenarios.[22] Also, the 16 sites that participated in this study were large, urban teaching hospitals. Consequently, these results are not necessarily generalizable to smaller community hospitals. Although numerous data points were required to enter the analytic cohort, only 9% of the sample was excluded for missing data. There were 214 children who did not meet our improvement criteria by the time of discharge. Although the inability to include these children in the analysis may be seen as a limitation, this practice variability underscores the need for more data about discharging hospitalized children with bronchiolitis. Last, site teams reviewed medical records daily. More frequent recording of the clinical course would have yielded more granular data, but the current methodology replicates how data are generally presented during patient care rounds, when decisions about suitability for discharge are often considered.
CONCLUSION
We documented in this large multicenter study that most children hospitalized with bronchiolitis had a wide range of time to recovery, but the vast majority continued to improve once they reached the identified clinical criteria that predict a safe discharge to home. The children who worsened after clinical improvement were more likely to be younger, premature infants presenting in more severe distress. Although additional prospective validation of these hospital discharge criteria is warranted, these data may help clinicians make more evidence‐based discharge decisions for a common pediatric illness with high practice variation, both in the United States[3] and in other countries.[4, 5]
Acknowledgements
Collaborators in the MARC‐30 Study: Besh Barcega, MD, Loma Linda University Children's Hospital, Loma Linda, CA; John Cheng, MD, Children's Healthcare of Atlanta at Egleston, Atlanta, GA; Dorothy Damore, MD, New York Presbyterian Hospital‐Cornell, New York, NY; Carlos Delgado, MD, Children's Healthcare of Atlanta at Egleston, Atlanta, GA; Haitham Haddad, MD, Rainbow Babies & Children's Hospital, Cleveland, OH; Paul Hain, MD, Monroe Carell Jr. Children's Hospital at Vanderbilt, Nashville, TN; Frank LoVecchio, DO, Maricopa Medical Center, Phoenix, AZ; Charles Macias, MD MPH, Texas Children's Hospital, Houston, TX; Jonathan Mansbach, MD, MPH, Boston Children's Hospital, Boston, MA; Eugene Mowad, MD, Akron Children's Hospital, Akron, OH; Brian Pate, MD, Children's Mercy Hospital, Kansas City, MO; Mark Riederer, MD, Monroe Carell Jr. Children's Hospital at Vanderbilt, Nashville, TN; M. Jason Sanders, MD, Children's Memorial Hermann Hospital, Houston, TX; Alan R. Schroeder, MD, Santa Clara Valley Medical Center, San Jose, CA; Nikhil Shah, MD, New York Presbyterian Hospital‐Cornell, New York, NY; Michelle Stevenson, MD, MS, Kosair Children's Hospital, Louisville, KY; Erin Stucky Fisher, MD, Rady Children's Hospital, San Diego, CA; Stephen Teach, MD, MPH, Children's National Medical Center, Washington, DC; Lisa Zaoutis, MD, Children's Hospital of Philadelphia, Philadelphia, PA.
Disclosures: This study was supported by grants U01 AI‐67693 and K23 AI‐77801 from the National Institutes of Health (Bethesda, MD). The content of this manuscript is solely the responsibility of the authors and does not necessarily represent the official views of the National Institute of Allergy and Infectious Diseases or the National Institutes of Health. Drs. Mansbach and Piedra have provided consultation to Regeneron Pharmaceuticals. Otherwise, no authors report any potential conflicts of interest, including relevant financial interests, activities, relationships, and affiliations.
- , , , , . Infectious disease hospitalizations among infants in the United States. Pediatrics. 2008;121(2):244–252.
- . “A hospital is no place to be sick” Samuel Goldwyn (1882–1974). Arch Dis Child. 2009;94(8):565–566.
- , , , , , Variation in inpatient diagnostic testing and management of bronchiolitis. Pediatrics. 2005;115(4):878–884.
- , , , International variation in the management of infants hospitalized with respiratory syncytial virus. International RSV Study Group. Eur J Pediatr. 1998;157(3):215–220.
- , , , , . Population variation in admission rates and duration of inpatient stay for bronchiolitis in England. Arch Dis Child. 2013;98(1):57–59.
- , , , . Impact of pulse oximetry and oxygen therapy on length of stay in bronchiolitis hospitalizations. Arch Pediatr Adolesc Med. 2004;158(6):527–530.
- , , . Pulse oximetry in pediatric practice. Pediatrics. 2011;128(4):740–752.
- Scottish Intercollegiate Guidelines Network. Bronchiolitis in children (SIGN 91). In: NHS Quality Improvement Scotland. Edinburgh, Scotland: Scottish Intercollegiate Guidelines Network; 2006.
- , , , et al. Diagnosis and management of bronchiolitis. Pediatrics. 2006;118(4):1774–1793.
- , , , et al. Prospective multicenter study of children with bronchiolitis requiring mechanical ventilation. Pediatrics. 2012;130(3):e492–e500.
- , , , et al. Prospective multicenter study of viral etiology and hospital length of stay in children with severe bronchiolitis. Arch Pediatr Adolesc Med. 2012;166(8):700–706.
- , , , et al. Apnea in children hospitalized with bronchiolitis. Pediatrics. 2013;132(5):e1194–e1201.
- . Evaluation of the cardiovascular system: history and physical evaluation. In: Kliegman RM, Stanton BF, St. Geme JW III, Schor NF, Behrman RF, eds. Nelson Textbook of Pediatrics. Philadelphia, PA: Elsevier Saunders; 2011:1529–1536.
- , , , et al. Apnea in children hospitalized with bronchiolitis. Pediatrics. 2013;132(5):e1194–e1201.
- , , , et al. Respiratory viral infections in patients with chronic, obstructive pulmonary disease. J Infect. 2005;50(4):322–330.
- , , , . Evaluation of real‐time PCR for diagnosis of Bordetella pertussis infection. BMC Infect Dis. 2006;6:62.
- , , , , . Evaluation of three real‐time PCR assays for detection of Mycoplasma pneumoniae in an outbreak investigation. J Clin Microbiol. 2008;46(9):3116–3118.
- , , , et al. Normal ranges of heart rate and respiratory rate in children from birth to 18 years of age: a systematic review of observational studies. Lancet. 2011;377(9770):1011–1018.
- , , , , , . Development of heart and respiratory rate percentile curves for hospitalized children. Pediatrics. 2013;131(4):e1150–e1157.
- , . Effect of oxygen supplementation on length of stay for infants hospitalized with acute viral bronchiolitis. Pediatrics. 2008;121(3):470–475.
- , , , et al. Longitudinal assessment of hemoglobin oxygen saturation in healthy infants during the first 6 months of age. Collaborative Home Infant Monitoring Evaluation (CHIME) Study Group. J Pediatr. 1999;135(5):580–586.
- , , , et al. Prospective multicenter study of bronchiolitis: predicting safe discharges from the emergency department. Pediatrics. 2008;121(4):680–688.
- , , , et al. Delays in discharge in a tertiary care pediatric hospital. J Hosp Med. 2009;4(8):481–485.
- , , , et al. Using quality improvement to optimise paediatric discharge efficiency. BMJ Qual Saf. 2014;23(5):428–436.
- , . Bronchiolitis in infants and children: treatment; outcome; and prevention. In: Torchia M, ed. UpToDate. Alphen aan den Rijn, the Netherlands; Wolters Kluwer Health; 2013.
- , . Duration of illness in infants with bronchiolitis evaluated in the emergency department. Pediatrics. 2010;126(2):285–290.
- , , . Duration of illness in ambulatory children diagnosed with bronchiolitis. Arch Pediatr Adolesc Med. 2000;154(10):997–1000.
- , , , et al. A clinical pathway for bronchiolitis is effective in reducing readmission rates. J Pediatr. 2005;147(5):622–626.
- , , , et al. Measuring hospital quality using pediatric readmission and revisit rates. Pediatrics. 2013;132(3):429–436.
- , , , et al. Pediatric readmission prevalence and variability across hospitals. JAMA. 2013;309(4):372–380.
- , , , , , . Preventability of early readmissions at a children's hospital. Pediatrics. 2013;131(1):e171–e181.
- , . Hospital readmission: quality indicator or statistical inevitability? Pediatrics. 2013;132(3):569–570.
- , , , et al. Children's hospitals with shorter lengths of stay do not have higher readmission rates. J Pediatr. 2013;163(4):1034–1038.e1.
- , , , , . Trends in bronchiolitis hospitalizations in the United States, 2000–2009. Pediatrics. 2013;132(1):28–36.
- , , , . Preventable adverse events in infants hospitalized with bronchiolitis. Pediatrics. 2005;116(3):603–608.
Although bronchiolitis is the leading cause of hospitalization for US infants,[1] there is a lack of basic prospective data about the expected inpatient clinical course and ongoing uncertainty about when a hospitalized child is ready for discharge to home.[2] This lack of data about children's readiness for discharge may result in variable hospital length‐of‐stay (LOS).[3, 4, 5]
One specific source of variability in discharge readiness and LOS variability may be the lack of consensus about safe threshold oxygen saturation values for discharge in children hospitalized with bronchiolitis.[6, 7] In 2006, the Scottish Intercollegiate Guidelines Network recommended a discharge room air oxygen (RAO2) saturation threshold of 95%.[8] The same year, the American Academy of Pediatrics (AAP) bronchiolitis clinical practice guideline stated that oxygen is not needed for children with RAO2 saturations 90% who are feeding well and have minimal respiratory distress.[9] There is a need for prospective studies to help clinicians make evidenced‐based discharge decisions for this common condition.
We performed a prospective, multicenter, multiyear study[10, 11, 12] to examine the typical inpatient clinical course of and to develop hospital discharge guidelines for children age <2 years hospitalized with bronchiolitis. We hypothesized that children would not worsen clinically and would be safe to discharge home once their respiratory status improved and they were able to remain hydrated.
METHODS
Study Design and Population
We conducted a prospective, multicenter cohort study for 3 consecutive years during the 2007 to 2010 winter seasons, as part of the Multicenter Airway Research Collaboration (MARC), a program of the Emergency Medicine Network (
All patients were treated at the discretion of the treating physician. Inclusion criteria were an attending physician's diagnosis of bronchiolitis, age <2 years, and the ability of the parent/guardian to give informed consent. The exclusion criteria were previous enrollment and transfer to a participating hospital >48 hours after the original admission time. Therefore, children with comorbid conditions were included in this study. All consent and data forms were translated into Spanish. The institutional review board at each of the 16 participating hospitals approved the study.
Of the 2207 enrolled children, we excluded 109 (5%) children with a hospital LOS <1 day due to inadequate time to capture the required data for the present analysis. Among the 2098 remaining children, 1916 (91%) had daily inpatient data on all factors used to define clinical improvement and clinical worsening. Thus, the analytic cohort was comprised of 1916 children hospitalized for bronchiolitis.
Data Collection
Investigators conducted detailed structured interviews. Chart reviews were conducted to obtain preadmission and daily hospital clinical data including respiratory rates, daily respiratory rate trends, degree of retractions, oxygen saturation, daily oxygen saturation trends, medical management, and disposition. These data were manually reviewed, and site investigators were queried about missing data and discrepancies. A follow‐up telephone interview was conducted with families 1 week after discharge to examine relapse events at both 24 hours and 7 days.
We used the question: How long ago did the following symptoms [eg, difficulty breathing] begin [for the] current illness? to estimate the onset of the current illness. Pulse was categorized as low, normal, or high based on age‐related heart rate values.[13] Presence of apnea was recorded daily by site investigators.[14]
Nasopharyngeal Aspirate Collection and Virology Testing
As described previously, site teams used a standardized protocol to collect nasopharyngeal aspirates,[11] which were tested for respiratory syncytial virus (RSV) types A and B; rhinovirus (RV); parainfluenza virus types 1, 2, and 3; influenza virus types A and B; 2009 novel H1N1; human metapneumovirus; coronaviruses NL‐63, HKU1, OC43, and 229E; enterovirus, and adenovirus using polymerase chain reaction.[11, 15, 16, 17]
Defining Clinical Improvement and Worsening
Clinical improvement criteria were based on the 2006 AAP guidelines.[9] For respiratory rate and oxygen saturation, clinicians estimated average daily respiratory rate and oxygen saturation based on the recorded readings from the previous 24 hours. This estimation reflects the process clinicians use when rounding on their hospitalized patients, and thus may be more similar to standard clinical practice than a calculated mean. The respiratory rate criteria are adjusted for age.[18, 19] For daily estimated average oxygen saturation we used the AAP criteria of RAO2 saturation of 90%. Considering that oxygen saturation is the main determinant of LOS,[20] healthy infants age <6 months may have transient oxygen saturations of around 80%,[21] and that errors in estimation may occur, we included a lowest RAO2 of 88% in our improvement criteria. By combining the dichotomized estimated oxygen saturation (90% or not) with the lower limit of 88%, there was little room for erroneous conclusions. A child was considered clinically improved on the earliest date he/she met all of the following criteria: (1) none or mild retractions and improved or stable retractions compared with the previous inpatient day; (2) daily estimated average respiratory rate (RR) <60 breaths per minute for age <6 months, <55 breaths/minute for age 6 to 11 months, and <45 breaths/minute for age 12 months with a decreasing or stable trend over the course of the current day; (3) daily estimated average RAO2 saturation 90%, lowest RAO2 saturation 88%[21]; and (4) not receiving intravenous (IV) fluids or for children receiving IV fluids a clinician report of the child maintaining oral hydration. Children who reached the clinical improvement criteria were considered clinically worse if they required intensive care or had the inverse of 1 of the improvement criteria: moderate/severe retractions that were worse compared with the previous inpatient day, daily average RR 60 with an increasing trend over the current day, need for oxygen, or need for IV fluids.
Statistical Analyses
All analyses were performed using Stata 12.0 (StataCorp, College Station, TX). Data are presented as proportions with 95% confidence intervals (95% CIs), means with standard deviations, and medians with interquartile ranges (IQR). To examine potential factors associated with clinical worsening after reaching clinical improvement, we used 2, Fisher exact, Student t test, and Kruskall‐Wallis tests, as appropriate.
Adjusted analyses used generalized linear mixed models with a logit link to identify independent risk factors for worsening after reaching clinical improvement. Fixed effects for patient‐level factors and a random site effect were used. Factors were tested for inclusion in the multivariable model if they were found to be associated with worsening in unadjusted analyses (P<0.20) or were considered clinically important. Results are reported as odds ratios with 95% CIs.
We performed several sensitivity analyses to evaluate these improvement criteria: (1) we excluded the lowest RAO2 saturation requirement of 88%, (2) we examined a 94% daily estimated average RAO2 saturation threshold,[22] (3) we examined a 95% daily estimated average RAO2 saturation threshold,[8] and (4) we examined children age <12 months with no history of wheeze.
RESULTS
There were 1916 children hospitalized with bronchiolitis with data on all factors used to define clinical improvement and clinical worsening. The median number of days from the beginning of difficulty breathing until admission was 2 days (IQR, 15.5 days; range, 18 days) and from the beginning of difficulty breathing until clinical improvement was 4 days (IQR, 37.5 days; range, 133 days) (Figure 1). The variance for days to admission was significantly less than the variance for days to clinical improvement (P<0.001).
In this observational study, clinicians discharged 214 (11%) of the 1916 children before meeting the definition of clinical improvement. Thus, 1702 (89%; 95% CI: 87%‐90%) children reached the clinical improvement criteria, had a LOS >1 day, and had data on all factors (Figure 2).
Of the 1702 children who met the clinical improvement criteria, there were 76 children (4%; 95% CI: 3%5%) who worsened (Figure 2). The worsening occurred within a median of 1 day (IQR, 13 days) of clinical improvement. Forty‐six (3%) of the children required transfer to the ICU (1 required intubation, 1 required continuous positive airway pressure, and 4 had apnea), 23 (1%) required oxygen, and 17 (1%) required IV fluids. Eight percent of children met multiple criteria for worsening. A comparison between children who did and did not worsen is shown in Table 1. In general, children who worsened after improvement were younger and born earlier. These children also presented in more severe respiratory distress, had moderate or severe retractions, oxygen saturation <85% at hospitalization, inadequate oral intake, and apnea documented during the hospitalization. Neither viral etiology nor site of care influenced whether the children worsened after improving. However, stratified analysis of children based on initial location of admission (ie, ICU or ward) showed that among the children admitted to the ICU from the emergency department (ED), 89% met the improvement criteria and 19% clinically worsened. In contrast, among children admitted to the ward from the ED, 89% met the improvement criteria, and only 2% clinically worsened. Stratified multivariable models based on the initial location of admission from the ED (ie, ICU or ward) were not possible due to small sample sizes after stratification. None of these children had relapse events requiring rehospitalization within either 24 hours or 7 days of discharge.
| Did Not Worsen, n=1,626 | Worsened, n=76 | P Value | |
|---|---|---|---|
| |||
| Demographic characteristics | |||
| Age <2 months, % | 29 | 57 | <0.001 |
| Month of birth, % | 0.02 | ||
| OctoberMarch | 61 | 75 | |
| AprilSeptember | 39 | 25 | |
| Sex, % | 0.51 | ||
| Male | 59 | 55 | |
| Female | 41 | 45 | |
| Race, % | 0.050 | ||
| White | 63 | 58 | |
| Black | 23 | 34 | |
| Other or missing | 14 | 8 | |
| Hispanic ethnicity, % | 37 | 22 | 0.01 |
| Insurance, % | 0.87 | ||
| Nonprivate | 68 | 67 | |
| Private | 32 | 33 | |
| Medical history | |||
| Gestational age <37 weeks, % | 23 | 39 | 0.002 |
| Birth weight, % | 0.52 | ||
| <5 lbs | 13 | 12 | |
| 5 lbs | 34 | 41 | |
| 7 lbs | 53 | 47 | |
| Mother's age, median (IQR) | 27 (2333) | 27 (2233) | 0.54 |
| Is or was breastfed, % | 61 | 51 | 0.10 |
| Smoked during pregnancy, % | 15 | 20 | 0.22 |
| Exposure to smoke, % | 13 | 20 | 0.11 |
| Family history of asthma, % | 0.89 | ||
| Neither parent | 68 | 64 | |
| Either mother or father | 27 | 30 | |
| Both parents | 4 | 4 | |
| Do not know/missing | 2 | 1 | |
| History of wheezing, % | 23 | 17 | 0.24 |
| History of eczema, % | 16 | 7 | 0.04 |
| History of intubation, % | 9 | 12 | 0.50 |
| Major, relevant, comorbid medical disorder, % | 20 | 24 | 0.46 |
| Current illness | |||
| When difficulty breathing began, preadmission, % | 0.63 | ||
| 1 day | 70 | 75 | |
| <1 day | 28 | 23 | |
| No difficulty preadmission | 2 | 3 | |
| Weight, lbs, median (IQR) | 12.3 (8.817.4) | 9.0 (6.613.2) | 0.001 |
| Temperature, F, median (IQR) | 99.5 (98.6100.6) | 99.4 (98.1100.4) | 0.06 |
| Pulse, beats per minute by age | 0.82 | ||
| Low | 0.3 | 0 | |
| Normal | 48 | 46 | |
| High | 51 | 54 | |
| Respiratory rate, breaths per minute, median (IQR) | 48 (4060) | 48 (3864) | 0.28 |
| Retractions, % | 0.001 | ||
| None | 22 | 25 | |
| Mild | 43 | 24 | |
| Moderate | 26 | 33 | |
| Severe | 4 | 12 | |
| Missing | 5 | 7 | |
| Oxygen saturation by pulse oximetry or ABG, % | 0.001 | ||
| <85 | 4 | 12 | |
| 8587.9 | 3 | 4 | |
| 8889.9 | 5 | 0 | |
| 9093.9 | 18 | 11 | |
| 94 | 72 | 73 | |
| Oral intake, % | <0.001 | ||
| Adequate | 45 | 22 | |
| Inadequate | 42 | 63 | |
| Missing | 13 | 14 | |
| Presence of apnea, % | 7 | 24 | <0.001 |
| RSV‐A, % | 44 | 41 | 0.54 |
| RSV‐B, % | 30 | 25 | 0.36 |
| HRV, % | 24 | 24 | 0.88 |
| Chest x‐ray results during ED/preadmission visit | |||
| Atelectasis | 12 | 13 | 0.77 |
| Infiltrate | 13 | 11 | 0.50 |
| Hyperinflated | 18 | 21 | 0.47 |
| Peribronchial cuffing/thickening | 23 | 17 | 0.32 |
| Normal | 14 | 16 | 0.75 |
| White blood count, median (IQR) | 11.2 (8.714.4) | 11.9 (9.214.4) | 0.60 |
| Platelet count, median (IQR) | 395 (317490) | 430 (299537) | 0.56 |
| Sodium, median (IQR) | 138 (136140) | 137 (135138) | 0.19 |
| Hospital length of stay, median (IQR) | 2 (14) | 4.5 (28) | <0.001 |
| One‐week follow‐up | |||
| Relapse within 24 hours of hospital discharge requiring hospital admission, % | 0.5 | 0 | 0.56 |
| Relapse within 7 days of hospital discharge requiring hospital admission, % | 1 | 0 | 0.35 |
On multivariable analysis (Table 2), independent risk factors for worsening after reaching the clinical improvement criteria were young age, preterm birth, and presenting to care with more severe bronchiolitis represented by severe retractions, inadequate oral intake, or apnea. To further evaluate the improvement criteria in the current analysis, multiple sensitivity analyses were conducted. The frequency of clinical worsening after reaching the improvement criteria was stable when we examined different RA02 criteria in sensitivity analyses: (1) excluding RA02 as a criterion for improvement: 90% met improvement criteria and 4% experienced clinical worsening, (2) changing the average RA02 threshold for clinical improvement to 94%: 62% met improvement criteria and 6% experienced clinical worsening, and (3) changing the average RA02 threshold for clinical improvement to 95%: 47% met improvement criteria and 5% experienced clinical worsening. Furthermore, stratifying by age <2 months and restricting to more stringent definitions of bronchiolitis (ie, age <1 year or age <1 year+no history of wheezing) also did not materially change the results (see Supporting Figure 1 in the online version of this article).
| Odds Ratio | 95% CI | P Value | |
|---|---|---|---|
| |||
| Age <2 months | 3.51 | 2.07‐5.94 | <0.001 |
| Gestational age <37 weeks | 1.94 | 1.13‐3.32 | 0.02 |
| Retractions | |||
| None | 1.30 | 0.80‐3.23 | 0.19 |
| Mild | 1.0 | Reference | |
| Moderate | 1.91 | 0.99‐3.71 | 0.06 |
| Severe | 5.55 | 2.1214.50 | <0.001 |
| Missing | 1.70 | 0.53‐5.42 | 0.37 |
| Oral intake | |||
| Adequate | 1.00 | Reference | |
| Inadequate | 2.54 | 1.39‐4.62 | 0.002 |
| Unknown/missing | 1.88 | 0.79‐4.44 | 0.15 |
| Presence of apnea | 2.87 | 1.45‐5.68 | 0.003 |
We compared the 214 children who were discharged prior to reaching clinical improvement with the 1702 children who reached the clinical improvement criteria. The 214 children were less likely to be age <2 months (22% vs 30%; P=0.02). These 2 groups (214 vs 1702) were similar with respect to severe retractions (2% vs 4%; P=0.13), median respiratory rate (48 vs 48; P=0.42), oxygen saturation <90% (15% vs 11%; P=0.07), inadequate oral intake (50% vs 43%; P=0.13), and rates of relapse events requiring rehospitalization within both 24 hours (0.6% vs 0.6%; P=0.88) and 7 days (1% vs 1%; P=0.90) of discharge.
DISCUSSION
In this large, multicenter, multiyear study of children hospitalized with bronchiolitis, we found that children present to a hospital in a relatively narrow time frame, but their time to recovery in the hospital is highly variable. Nonetheless, 96% of children continued to improve once they had: (1) improving or stable retractions rated as none/mild, (2) a decreasing or stable RR by age, (3) estimated average RAO2 saturation 90% and lowest RAO2 saturation of 88%, and (4) were hydrated. The 4% of children who worsened after clinically improving were more likely to be age <2 months, born <37 weeks, and present with more severe distress (ie, severe retractions, inadequate oral intake, or apnea). Based on the low risk of worsening after clinical improvement, especially among children admitted to the regular ward (2%), we believe these 4 clinical criteria could be used as discharge criteria for this common pediatric illness with a predominantly monophasic clinical course.
Variability in hospital LOS for children with bronchiolitis exists in the United States[3] and internationally.[4, 5] Cheung and colleagues analyzed administrative data from over 75,000 children admitted for bronchiolitis in England between April 2007 and March 2010 and found sixfold variation in LOS between sites. They concluded that this LOS variability was due in part to providers' clinical decision making.[5] Srivastava and colleagues[23] addressed variable clinician decision making in bronchiolitis and 10 other common pediatric conditions by embedding discharge criteria developed by expert consensus into admission order sets. They found that for children with bronchiolitis, the embedded discharge criteria reduced the median LOS from 1.91 to 1.87 days. In contrast to the single‐center data presented by White and colleagues,[24] the prospective, multicenter MARC‐30 data provide a clear understanding of the normal clinical course for children hospitalized with bronchiolitis, determine if children clinically worsen after clinical improvement, and provide data about discharge criteria for children hospitalized with bronchiolitis. Although there is a lack of rigorous published data, the lower tract symptoms of bronchiolitis (eg, cough, retractions) are said to peak on days 5 to 7 of illness and then gradually resolve.[25] In the present study, we found that the time from the onset of difficulty breathing until hospital admission is less variable than the time from the onset of difficulty breathing until either clinical improvement or discharge. Although 75% of children have clinically improved within 7.5 days of difficulty breathing based on the IQR results, the remaining 25% may have a more prolonged recovery in the hospital of up to 3 weeks. Interestingly, prolonged recovery times from bronchiolitis have also been noted in children presenting to the ED[26] and in an outpatient population.[27] It is unclear why 20% to 25% of children at different levels of severity of illness have prolonged recovery from bronchiolitis, but this group of children requires further investigation.
Given the variability of recovery times, clinicians may have difficulty knowing when a child is ready for hospital discharge. One of the main stumbling blocks for discharge readiness in children with bronchiolitis is the interpretation of the oxygen saturation value.[6, 8, 9, 20, 28] However, it should be considered that interpreting the oxygen saturation in a child who is clinically improving in the hospital setting is different than interpreting the oxygen saturation of a child in the ED or the clinic whose clinical course is less certain.[22] In the hospital setting, using the oxygen saturation value in in the AAP guideline,[9] 4% of children clinically worsened after they met the improvement criteria, a clinical pattern observed previously with supplemental oxygen.[28] This unpredictability may explain some of the variation in providers' clinical decision making.[5] The children who worsened, and therefore deserve more cautious discharge planning, were young (<2 months), premature (<37 weeks gestational age), and presented in more severe distress. Those children admitted to the ICU from the ED worsened more commonly than children admitted to the ward (19% vs 2%). Interestingly, the viral etiology of the child's bronchiolitis did not influence whether a child worsened after reaching the improvement criteria. Therefore, although children with RV bronchiolitis have a shorter hospital LOS than children with RSV bronchiolitis,[11] the pattern of recovery did not differ by viral etiology.
In addition to unsafe discharges, clinicians may be concerned about the possibility of readmissions. Although somewhat controversial, hospital readmission is being used as a quality of care metric.[29, 30, 31] One response to minimize readmissions would be for clinicians to observe children for longer than clinically indicated.[32] However, shorter LOS is not necessarily associated with increased readmission rates.[33] Given that the geometric mean of hospital charges per child with bronchiolitis increased from $6380 in 2000 to $8530 in 2009,[34] the potential for safely reducing hospital LOS by using the discharge criteria proposed in the current study instead of other criteria[8] may net substantial cost savings. Furthermore, reducing LOS would decrease the time children expose others to these respiratory viruses and possibly reduce medical errors.[35]
Our study has some potential limitations. Because the study participants were all hospitalized, these data do not inform admission or discharge decisions from either the ED or the clinic; but other data address those clinical scenarios.[22] Also, the 16 sites that participated in this study were large, urban teaching hospitals. Consequently, these results are not necessarily generalizable to smaller community hospitals. Although numerous data points were required to enter the analytic cohort, only 9% of the sample was excluded for missing data. There were 214 children who did not meet our improvement criteria by the time of discharge. Although the inability to include these children in the analysis may be seen as a limitation, this practice variability underscores the need for more data about discharging hospitalized children with bronchiolitis. Last, site teams reviewed medical records daily. More frequent recording of the clinical course would have yielded more granular data, but the current methodology replicates how data are generally presented during patient care rounds, when decisions about suitability for discharge are often considered.
CONCLUSION
We documented in this large multicenter study that most children hospitalized with bronchiolitis had a wide range of time to recovery, but the vast majority continued to improve once they reached the identified clinical criteria that predict a safe discharge to home. The children who worsened after clinical improvement were more likely to be younger, premature infants presenting in more severe distress. Although additional prospective validation of these hospital discharge criteria is warranted, these data may help clinicians make more evidence‐based discharge decisions for a common pediatric illness with high practice variation, both in the United States[3] and in other countries.[4, 5]
Acknowledgements
Collaborators in the MARC‐30 Study: Besh Barcega, MD, Loma Linda University Children's Hospital, Loma Linda, CA; John Cheng, MD, Children's Healthcare of Atlanta at Egleston, Atlanta, GA; Dorothy Damore, MD, New York Presbyterian Hospital‐Cornell, New York, NY; Carlos Delgado, MD, Children's Healthcare of Atlanta at Egleston, Atlanta, GA; Haitham Haddad, MD, Rainbow Babies & Children's Hospital, Cleveland, OH; Paul Hain, MD, Monroe Carell Jr. Children's Hospital at Vanderbilt, Nashville, TN; Frank LoVecchio, DO, Maricopa Medical Center, Phoenix, AZ; Charles Macias, MD MPH, Texas Children's Hospital, Houston, TX; Jonathan Mansbach, MD, MPH, Boston Children's Hospital, Boston, MA; Eugene Mowad, MD, Akron Children's Hospital, Akron, OH; Brian Pate, MD, Children's Mercy Hospital, Kansas City, MO; Mark Riederer, MD, Monroe Carell Jr. Children's Hospital at Vanderbilt, Nashville, TN; M. Jason Sanders, MD, Children's Memorial Hermann Hospital, Houston, TX; Alan R. Schroeder, MD, Santa Clara Valley Medical Center, San Jose, CA; Nikhil Shah, MD, New York Presbyterian Hospital‐Cornell, New York, NY; Michelle Stevenson, MD, MS, Kosair Children's Hospital, Louisville, KY; Erin Stucky Fisher, MD, Rady Children's Hospital, San Diego, CA; Stephen Teach, MD, MPH, Children's National Medical Center, Washington, DC; Lisa Zaoutis, MD, Children's Hospital of Philadelphia, Philadelphia, PA.
Disclosures: This study was supported by grants U01 AI‐67693 and K23 AI‐77801 from the National Institutes of Health (Bethesda, MD). The content of this manuscript is solely the responsibility of the authors and does not necessarily represent the official views of the National Institute of Allergy and Infectious Diseases or the National Institutes of Health. Drs. Mansbach and Piedra have provided consultation to Regeneron Pharmaceuticals. Otherwise, no authors report any potential conflicts of interest, including relevant financial interests, activities, relationships, and affiliations.
- , , , , . Infectious disease hospitalizations among infants in the United States. Pediatrics. 2008;121(2):244–252.
- . “A hospital is no place to be sick” Samuel Goldwyn (1882–1974). Arch Dis Child. 2009;94(8):565–566.
- , , , , , Variation in inpatient diagnostic testing and management of bronchiolitis. Pediatrics. 2005;115(4):878–884.
- , , , International variation in the management of infants hospitalized with respiratory syncytial virus. International RSV Study Group. Eur J Pediatr. 1998;157(3):215–220.
- , , , , . Population variation in admission rates and duration of inpatient stay for bronchiolitis in England. Arch Dis Child. 2013;98(1):57–59.
- , , , . Impact of pulse oximetry and oxygen therapy on length of stay in bronchiolitis hospitalizations. Arch Pediatr Adolesc Med. 2004;158(6):527–530.
- , , . Pulse oximetry in pediatric practice. Pediatrics. 2011;128(4):740–752.
- Scottish Intercollegiate Guidelines Network. Bronchiolitis in children (SIGN 91). In: NHS Quality Improvement Scotland. Edinburgh, Scotland: Scottish Intercollegiate Guidelines Network; 2006.
- , , , et al. Diagnosis and management of bronchiolitis. Pediatrics. 2006;118(4):1774–1793.
- , , , et al. Prospective multicenter study of children with bronchiolitis requiring mechanical ventilation. Pediatrics. 2012;130(3):e492–e500.
- , , , et al. Prospective multicenter study of viral etiology and hospital length of stay in children with severe bronchiolitis. Arch Pediatr Adolesc Med. 2012;166(8):700–706.
- , , , et al. Apnea in children hospitalized with bronchiolitis. Pediatrics. 2013;132(5):e1194–e1201.
- . Evaluation of the cardiovascular system: history and physical evaluation. In: Kliegman RM, Stanton BF, St. Geme JW III, Schor NF, Behrman RF, eds. Nelson Textbook of Pediatrics. Philadelphia, PA: Elsevier Saunders; 2011:1529–1536.
- , , , et al. Apnea in children hospitalized with bronchiolitis. Pediatrics. 2013;132(5):e1194–e1201.
- , , , et al. Respiratory viral infections in patients with chronic, obstructive pulmonary disease. J Infect. 2005;50(4):322–330.
- , , , . Evaluation of real‐time PCR for diagnosis of Bordetella pertussis infection. BMC Infect Dis. 2006;6:62.
- , , , , . Evaluation of three real‐time PCR assays for detection of Mycoplasma pneumoniae in an outbreak investigation. J Clin Microbiol. 2008;46(9):3116–3118.
- , , , et al. Normal ranges of heart rate and respiratory rate in children from birth to 18 years of age: a systematic review of observational studies. Lancet. 2011;377(9770):1011–1018.
- , , , , , . Development of heart and respiratory rate percentile curves for hospitalized children. Pediatrics. 2013;131(4):e1150–e1157.
- , . Effect of oxygen supplementation on length of stay for infants hospitalized with acute viral bronchiolitis. Pediatrics. 2008;121(3):470–475.
- , , , et al. Longitudinal assessment of hemoglobin oxygen saturation in healthy infants during the first 6 months of age. Collaborative Home Infant Monitoring Evaluation (CHIME) Study Group. J Pediatr. 1999;135(5):580–586.
- , , , et al. Prospective multicenter study of bronchiolitis: predicting safe discharges from the emergency department. Pediatrics. 2008;121(4):680–688.
- , , , et al. Delays in discharge in a tertiary care pediatric hospital. J Hosp Med. 2009;4(8):481–485.
- , , , et al. Using quality improvement to optimise paediatric discharge efficiency. BMJ Qual Saf. 2014;23(5):428–436.
- , . Bronchiolitis in infants and children: treatment; outcome; and prevention. In: Torchia M, ed. UpToDate. Alphen aan den Rijn, the Netherlands; Wolters Kluwer Health; 2013.
- , . Duration of illness in infants with bronchiolitis evaluated in the emergency department. Pediatrics. 2010;126(2):285–290.
- , , . Duration of illness in ambulatory children diagnosed with bronchiolitis. Arch Pediatr Adolesc Med. 2000;154(10):997–1000.
- , , , et al. A clinical pathway for bronchiolitis is effective in reducing readmission rates. J Pediatr. 2005;147(5):622–626.
- , , , et al. Measuring hospital quality using pediatric readmission and revisit rates. Pediatrics. 2013;132(3):429–436.
- , , , et al. Pediatric readmission prevalence and variability across hospitals. JAMA. 2013;309(4):372–380.
- , , , , , . Preventability of early readmissions at a children's hospital. Pediatrics. 2013;131(1):e171–e181.
- , . Hospital readmission: quality indicator or statistical inevitability? Pediatrics. 2013;132(3):569–570.
- , , , et al. Children's hospitals with shorter lengths of stay do not have higher readmission rates. J Pediatr. 2013;163(4):1034–1038.e1.
- , , , , . Trends in bronchiolitis hospitalizations in the United States, 2000–2009. Pediatrics. 2013;132(1):28–36.
- , , , . Preventable adverse events in infants hospitalized with bronchiolitis. Pediatrics. 2005;116(3):603–608.
© 2015 Society of Hospital Medicine
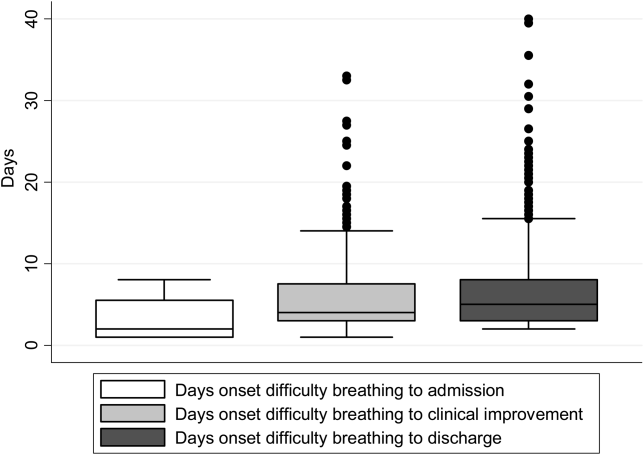
VIP Quality Improvement Network
Currently, 3%5% of infants under a year of age will be admitted to a hospital for acute viral bronchiolitis each year, making it the leading cause of hospitalization in children.15 The American Academy of Pediatrics guideline on the diagnosis and management of bronchiolitis advocates primarily supportive care for this self‐limited disease.6 Specifically, the routine use of therapies such as bronchodilators and corticosteroids are not recommended, nor is routine evaluation with diagnostic testing.6 Numerous studies have established the presence of unwarranted variation in most aspects of bronchiolitis care,713 and the current evidence does not support the routine usage of specific interventions in inpatients.1418
Acute bronchiolitis accounts for direct inpatient medical costs of over $500 million per year.19 Based on estimates from the Healthcare Utilization Project Kids' Inpatient Database, acute bronchiolitis is second only to respiratory distress syndrome as the most expensive disease of hospitalized children.1 Although charges may not correlate directly with costs or even the actual intensity of resource utilization, the national bill, based on charges, is approximately 1.4 billion dollars per year.1 Either way, the leading cause of hospitalization in children is expensive and suffers from dramatic variation in care characterized by overutilization of ineffective interventions.
Evidence‐based guidelines for bronchiolitis are readily available and their successful adoption within larger, academic children's hospitals has been demonstrated.2028 However, upwards of 70% of all children in this country are cared for outside of freestanding children's hospitals,1 and very little has been published about wide dissemination of evidence‐based guidelines in these settings.29 In 2008, the Value in Inpatient Pediatrics (VIP) network was created, as an inclusive pediatric inpatient quality improvement collaborative with a focus on linking academic and community‐based hospitalist groups, to disseminate evidence‐based management strategies for bronchiolitis. We hypothesized that group norming, through benchmarking and public goal setting at the level of the hospitalist group, would decrease overall utilization of nonevidence‐based therapies. Specifically, we were trying to decrease the utilization of bronchodilators, steroids, chest physiotherapy, chest radiography, and viral testing in hospitalized children diagnosed with uncomplicated bronchiolitis.
METHODS
Beginning in early 2008, we recruited pediatric hospitalists into a voluntary bronchiolitis quality improvement collaborative from within the community of hospitalists created by the American Academy of Pediatrics Section on Hospital Medicine. Participants were recruited through open calls at national conferences and mass e‐mails to the section membership through the listserve. The guiding principle for the collaborative was the idea that institutional adoption of evidence‐based disease‐management strategies would result in higher value of care, and that this process could be facilitated by benchmarking local performance against norms created within the larger community. We used group consensus to identify the therapies and tests to benchmark, although the chosen measures meshed with those addressed in the American Academy of Pediatrics (AAP) clinical practice guideline. Use of bronchodilators, corticosteroids, chest physiotherapy, chest radiography, and viral testing were all felt to be significantly overutilized in participating clinical sites. We were unaware of any published national targets for utilization of these therapies or tests, and none of the participating hospitalist groups was actively benchmarking their utilization against any peer group at the start of the project. Length of stay, rates of readmission within 72 hours of discharge, and variable direct costs were chosen as balancing measures for the project.
We collected data on hospitalizations for bronchiolitis for 4 calendar years, from 2007 through 2010, based on the following inclusion criteria: children under 24 months of age, hospitalized for the primary diagnosis of acute viral bronchiolitis as defined by International Classification of Diseases, Ninth Revision (ICD‐9) codes 466.11 and 466.19. We specifically included patients who were in observation status as well as those in inpatient status, and excluded all intensive care unit admissions. Other exclusions were specific ICD‐9 codes for: chronic lung diseases, asthma, chromosomal abnormalities, heart disease, and neurological diseases. We then tracked overall utilization of any bronchodilator (albuterol, levalbuterol, epinephrine, or ipratropium) during the hospitalization, including the emergency department; total number of bronchodilator doses per patient; utilization of any corticosteroids (inhaled or systemic); chest radiography; respiratory syncytial virus (RSV) testing; and chest physiotherapy; as well as variable direct costs per hospitalization for each center. A standardized toolkit was provided to participating centers to facilitate data collection. Data was sought from administrative sources, collected in aggregate form and not at the patient level, and no protected health information was collected as part of the project. The project was categorized as exempt by the University of Texas Health Science Center San Antonio Institutional Review Board, the location of the data repository.
The project began in 2008, though we requested that centers provide 2007 data to supplement our baseline. We held the first group meeting in July 2009 and began the facilitated sharing of resources to promote evidence‐based care, such as guidelines, protocols, respiratory scores, and patient handouts, across sites using data from 2007 and 2008 as our baseline for benchmarking and later assessing any improvement. Centers adopted guidelines at their own pace and we did not require guideline adoption for continued participation. We provided summaries of the available literature by topic, in the event that site leaders wished to give institutional grand rounds or other presentations. All dissemination of guidelines or protocols was done based on the request of the center, and no specific resource was created or sanctioned by the group, though the AAP Guideline for the Diagnosis and Management of Bronchiolitis6 remained a guiding document. Some of our centers participated in more extensive collaborative projects which involved small‐group goal setting, adoption of similar protocols, and conference calls, though this never encompassed more than 25% of the network.
The main product of the project was a yearly report benchmarking each hospital against the network average on each of our chosen utilization measures. The first report was disseminated in July 2009 and included data on calendar year 2007 and 2008, which we considered our group baseline. Most institutions began local Plan‐Do‐Study‐Act (PDSA) cycles by mid‐2009 using the data we provided as they benchmarked their performance against other members of the collaborative, and these continued through 2010. Hospitals were coded and remained anonymous. However, we publicly honored the high performers within the network at a yearly meeting, and urged these centers to share their tools and strategies, which was facilitated through a project Web site.30 All participation was voluntary, and all costs were borne by individuals or their respective centers.
In order to assess data quality, we undertook a validation project for calendar year 2009. We requested local direct chart review of a 10% sample, or a minimum of 10 charts, to confirm reported utilization rates for the therapies and tests we tracked. Any center with less than 80% accuracy was then asked to review data collection methods and make adjustments accordingly. One center identified and resolved a significant data discrepancy and 2 centers refused to participate in the validation project, citing their participation in a large national database for which there was already a very rigorous data validation process (Child Health Corporation of America's Pediatric Health Information System database). Given that we did not uncover major discrepancies in data quality within our network, we did not request further data validation but rather promoted year‐to‐year consistency of collection methods, seeking to collect the same type/quality of data that hospitals use in their own internal performance assessments.
Statistical analyses were performed using GraphPad InStat, version 3.0 (GraphPad Software, San Diego, CA). Descriptive statistics (including interquartile range ([IQR], the range from 25th to 75th percentile of the data) are provided. Analysis of process measures over the series of years was performed using repeated measures analysis of variance (ANOVA), as were intra‐hospital comparisons for all measures. Hospitals were not weighted by volume of admissions, ie, the unit of analysis was the hospital and not individual hospitalizations. Data were analyzed for normality using the method of Kolmogorov and Smirnoff, and in cases where normality was not satisfied (steroids and chest physiotherapy), the data were transformed and nonparametric methods were used. Post‐test adjustment for multiple comparisons was done using the TukeyKramer test in cases where ANOVA P values were <0.05. Fisher's exact test was used to analyze contingency tables for categorical variables such as presence or absence of a protocol.
RESULTS
Data encompassing 11,568 bronchiolitis hospitalizations in 17 centers, for calendar years 2007 to 2010, were analyzed for this report. A total of 31 centers ever participated in the project; however, this report is restricted to centers who participated for the entirety of the project from 2008 through 2010, and who consented to have their data reported. Specifically, 18 centers met inclusion criteria and 1 center opted out of the project, leaving the 17 centers described in Table 1. The overall network makeup shifted each year, but was always more than 80% non‐freestanding children's hospitals and approximately 30% urban, as defined as located in a population center of more than 1 million. A large majority of the participants did not have a local bronchiolitis protocol or guideline at the start of the project, although 88% of participants adopted some form of protocolized care by 2010. Calendar years 2007 and 2008 served as our network baseline, with most interventions (in institutions where they occurred) begun by calendar year 2009. The level of intervention varied greatly among institutions, with a few institutions doing nothing more than benchmarking their performance.
| Participating Centers (Alphabetically by State) | Type of Facility | Average Yearly Bronchiolitis Admissions | Approximate Medicaid (%) | Guideline Prior to Joining Project? | Location |
|---|---|---|---|---|---|
| |||||
| Scottsdale Healthcare Scottsdale, AZ | PEDS | 133 | 26 | No | Suburban |
| Shands Hospital for Children at the University of Florida Gainesville, FL | CHWH | 107 | 59 | No | Suburban |
| Children's Hospital of Illinois Peoria, IL | CHWH | 97 | 15 | No | Suburban |
| Kentucky Children's Hospital Lexington, KY | CHWH | 135 | 60 | Yes | Suburban |
| Our Lady of the Lake Baton Rouge, LA | CHWH | 138 | 70 | No | Suburban |
| The Barbara Bush Children's Hospital Portland, ME | CHWH | 31 | 41 | Yes | Suburban |
| Franklin Square Hospital Center Baltimore, MD | PEDS | 66 | 40 | No | Suburban |
| Anne Arundel Medical Center Annapolis, MD | CHWH | 56 | 36 | No | Suburban |
| Children's Hospital at Montefiore Bronx, NY | CHWH | 220 | 65 | No | Urban |
| Mission Children's Hospital Asheville, NC | CHWH | 112 | 21 | Yes | Suburban |
| Cleveland Clinic Children's Hospital Cleveland, OH | CHWH | 58 | 24 | Yes | Urban |
| Palmetto Health Children's Hospital Columbia, SC | CHWH | 181 | 60 | No | Suburban |
| East Tennessee Children's Hospital Knoxville, TN | FSCH | 373 | 60 | No | Suburban |
| Texas Children's Hospital Houston, TX | FSCH | 619 | 60 | Yes | Urban |
| Christus Santa Rosa Children's Hospital San Antonio, TX | CHWH | 390 | 71 | No | Urban |
| Children's Hospital of The Kings' Daughters Norfolk, VA | FSCH | 303 | 60 | No | Suburban |
| Children's Hospital of Richmond Richmond, VA | CHWH | 40 | 60 | No | Urban |
Mean length of stay (LOS), readmission rates, and variable direct costs did not differ significantly during the project time period. Mean LOS for the network ranged from a low of 2.4 days (IQR, 2.22.8 days) to a high of 2.7 days (IQR, 2.43.1 days), and mean readmission rates ranged from 1.2% (IQR, 0.7%1.8%) to 1.7% (IQR, 0.7%2.5%) during the project. Mean variable direct costs ranged from $1639 (IQR, $1383$1864) to $1767 (IQR, $1365$2320).
Table 2 describes the mean overall utilization of bronchodilators, chest radiography, RSV testing, steroids, and chest physiotherapy among the group from 2007 to 2010. By 2010, we saw a 46% decline in the volume of bronchodilator used within the network, a 3.6 (95% confidence interval [CI] 1.45.8) dose per patient absolute decrease (P < 0.01). We also saw a 12% (95% CI 5%25%) absolute decline in the overall percentage of patients exposed to any bronchodilator (P < 0.01). Finally, there was a 10% (95% CI 3%18%) absolute decline in the overall utilization of any chest physiotherapy (P < 0.01). The project did not demonstrate a significant impact on utilization of corticosteroids, chest radiography, or viral testing, although several centers achieved significant decreases on a local level (data not shown).
| Utilization Measure | 2007 | 2008 | 2009 | 2010 |
|---|---|---|---|---|
| No. (IQR) | No. (IQR) | No. (IQR) | No. (IQR) | |
| ||||
| Bronchodilator doses per patient (P < 0.01) | 7.9 (4.69.8) | 6.4 (4.08.4) | 5.7 (3.67.6) | 4.3 (3.05.9) |
| Any bronchodilators (P < 0.01) | 70% (59%83%) | 67% (56%77%) | 68% (61%76%) | 58% (46%69%) |
| Chest physiotherapy (P < 0.01) | 14% (5%19%) | 10% (1%8%) | 7% (2%6%) | 4% (1%7%) |
| Chest radiography (P = NS) | 64% (54%81%) | 66% (55%79%) | 64% (60%73%) | 59% (50%73%) |
| Any steroids (P = NS) | 21% (14%26%) | 20% (15%28%) | 21% (14%22%) | 16% (13%25%) |
| RSV testing (P = NS) | 64% (52%84%) | 61% (49%78%) | 62% (50%78%) | 57% (44%75%) |
We analyzed within‐hospital trends as well. Figure 1 describes intra‐hospital change over the course of the project for overall bronchodilator usage. In this analysis, 15 of 17 hospitals (88%) achieved a significant decrease in overall bronchodilator utilization by 2010. (Hospitals 27 and 29 were unable to provide 2007 baseline data.) For doses per patient, 15 of 17 institutions provided data on this measure, and 12 of 15 (80%) achieved significant decreases (Figure 2). Of note, the institutions failing to achieve significant decreases in bronchodilator utilization entered the project with utilization rates that were already significantly below network mean at the start of the project. (Institutions failing to improve are denoted with an asterisk in Figures 1 and 2.) Since most institutions made significant improvements in bronchodilator utilization over time, we looked for correlates of failure to decrease utilization. The strongest association for failure to improve during the project period was use of a protocol prior to joining the network (odds ratio [OR] = 11, 95% CI 261).
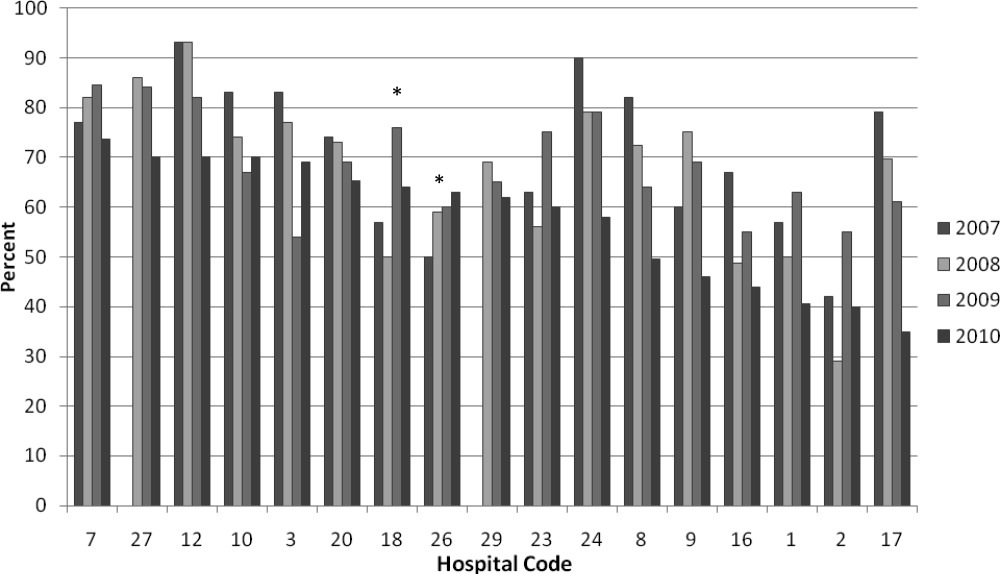
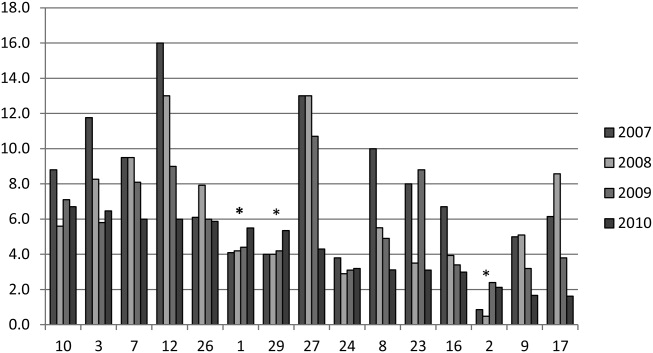
DISCUSSION
We demonstrated a significant decline in utilization of bronchodilators and chest physiotherapy in inpatient bronchiolitis within a voluntary quality collaborative focused on benchmarking without employing intensive interventions. This observation is important in that it demonstrates real‐world efficacy for our methods. Prior literature has clearly demonstrated that local bronchiolitis guidelines are effective; however, our data on over 11,000 hospitalizations from a broad array of inpatient settings continue to show a high rate of overutilization. We facilitated dissemination and sharing of guideline‐related tools primarily electronically, and capitalized on perceived peer‐group frustration with inefficient management of a high‐volume, high‐utilization disease. While the project leadership had varying degrees of advanced training in quality improvement methodology, the majority of the site leaders were self‐taught and trained while on the job. Our inclusive collaborative had some success using pragmatic and low‐resource methods which we believe is a novel approach to the issue of overutilization.
These considerations are highlighted given the pressing need to find more efficient and scalable means of bending the cost curve of healthcare in the United States. Learning collaboratives are a relatively new model for improvement, with some history in pediatrics,31, 32 and are attractive because of their potential to generate both widespread capacity for change as well as direct improvement. Both cystic fibrosis31 and neonatology collaboratives32 have been celebrated for their positive impacts on children's healthcare, and both are testaments to the power inherent in creating a community of like‐minded individuals. One of the most popular models for learning collaboratives remains the Institute for Healthcare Improvement's Breakthrough Series; however, this model is resource intensive in that it typically involves large teams and several yearly face‐to‐face meetings, with significant monetary investment on the part of hospitals. On the other hand, virtual collaboratives have produced mixed results with respect to quality improvement,33 so there is a continued need to maximize our learning about what works efficiently. Our collaborative was able to successfully disseminate tools developed in large academic institutions to be applied in smaller and more varied settings, where resources for quality improvement activities were limited.
One possible reason for any successes in this project was the existence of a well‐known guideline for the management of bronchiolitis published by the American Academy of Pediatrics in 2006. This guideline recommends primarily symptomatic care, and has a statement supporting the contention that routine use of our targeted therapies is unnecessary. It allows for a trial of bronchodilator, but specifically states that all trials should be accompanied by the use of an objective measure of improvement (typically interpreted to mean a respiratory distress score). A guideline sanctioned by an important national organization of pediatricians was invaluable, and we believe that it should serve as a basis for any nationally promoted inpatient quality measure for this very common pediatric illness. The existence of the AAP guideline also highlights the possibility that our results are merely representative of secular trends in utilization in bronchiolitis care, since we had no control group. The available literature on national guidelines has shown mixed and quite modest impacts in other countries.28, 34 Most of our group took active steps to operationalize the guidelines as part of their participation in this collaborative, though they might have done similar work anyway due to the increasing importance of quality improvement in hospitalist culture over the years of the project.
The project did not demonstrate any impact on steroid utilization, or on rates of obtaining chest radiography or viral testing, despite expressly targeting these widely overused interventions. These modalities are often employed in the emergency department and, as a collaborative of pediatric hospitalists, we did not have specific emergency department participation which we recognize as a major weakness and potential impediment to further progress. We hope to collaborate with our respective emergency departments in the future on these particular measures. We also noted that many institutions were inflexible about foregoing viral testing, due to infection control issues arising from the need to cohort patients in shared rooms based on RSV positivity during the busy winter months. A few institutions were able to alter their infection control policies using the strategy of assuming all children with bronchiolitis had RSV (ie, choosing to use both contact precautions and to wear a mask when entering rooms), though this was not universally popular. Finally, we recognize a missed opportunity in not collecting dose per patient level data for steroids, which might have allowed us to distinguish hospitals with ongoing inpatient utilization of steroids from those with only emergency department usage.
Another significant limitation of this project was the lack of annual assessments of data quality. However, we believe our findings are still useful and important, even with this obvious limitation. Most quality improvement work is done using hospital‐supplied data gleaned from administrative databases, exactly the sources used in this project. Key decisions are made in most hospitals in the country based on data of similar quality. Further limitations of the project relate to the issue of replicability. The disease process we addressed is a major source of frustration to pediatric hospitalists, and our sample likely consisted of the most highly motivated individuals, as they sought out and joined a group with the express purpose of decreasing unnecessary utilization in bronchiolitis. We believe this limitation highlights the likely need for quality measures to emerge organically out of a community of practice when resources are limited, ie, we do not believe we would have had significant success using our methods with an unpopular or externally imposed quality measure.
Although a detailed analysis of costs was beyond the scope of the current project, it is possible that decreased utilization resulted in overall cost savings, despite the fact that our data did not demonstrate a significant change in network‐level average variable direct costs related to bronchiolitis. It has been suggested that such savings may be particularly difficult to demonstrate objectively, especially when the principal costs targeted are labor‐based.35 LOS did not significantly vary during the project, whereas the use of labor‐intensive therapies like nebulized bronchodilators and chest physiotherapy declined. It is, however, quite possible that the decreased utilization we demonstrated was accompanied by a concomitant increase in utilization of other unmeasured therapies.
CONCLUSIONS
A volunteer, peer‐group collaborative focused on benchmarking decreased utilization of bronchodilators and chest physiotherapy in bronchiolitis, though had no impact on overuse of other unnecessary therapies and tests.
Acknowledgements
The following authors have participated in the production of this work by: Conception and design of project: Ralston, Garber, Narang, Shen, Pate; Acquisition of data: Ralston, Garber, Narang, Pope, Lossius, Croland, Bennett, Jewell, Krugman, Robbins, Nazif, Liewehr, Miller, Marks, Pappas, Pardue, Quinonez, Fine, Ryan; Analysis and interpretation of data: Ralston, Garber, Narang, Shen, Pate, Pope, Lossius, Croland, Bennett, Jewell, Krugman, Robbins, Nazif, Liewehr, Miller, Marks, Pappas, Pardue, Quinonez, Fine, Ryan; Drafting the article: Ralston, Garber, Shen; Revising it critically for important intellectual content, and final approval of the version to be published: Ralston, Garber, Narang, Shen, Pate, Pope, Lossius, Croland, Bennett, Jewell, Krugman, Robbins, Nazif, Liewehr, Miller, Marks, Pappas, Pardue, Quinonez, Fine, Ryan.
Disclosures: The VIP network receives financial/administrative support from the American Academy of Pediatrics through the Quality Improvement Innovations Network. Dr Ralston receives financial support from the American Academy of Pediatrics as editor of the AAP publication, Hospital Pediatrics. Drs Garber, Narang, Shen, Pate, Pope, Lossius, Croland, Bennett, Jewell, Krugman, Robbins, Nazif, Liewehr, Miller, Marks, Pappas, Pardue, Quinonez, Fine, and Ryan report no conflicts.
- HCUPnet. Kids Inpatient Database 2006. Available at: http://hcupnet.ahrq.gov/. Accessed February 6, 2011.
- , . Recent trends in severe respiratory syncytial virus (RSV) among US infants, 1997 to 2000. J Pediatr. 2003;143:S127–S132.
- , , , , . Infectious disease hospitalizations among infants in the United States. Pediatrics. 2008;121:244–252.
- , . Bronchiolitis. Lancet. 2006;368:312–322.
- , , , , . Rates of hospitalization for respiratory syncytial virus infection among children in Medicaid. J Pediatr. 2000;137:865–870.
- Subcommittee on the Diagnosis and Management of Bronchiolitis, 2004–2006. Clinical practice guideline: diagnosis and management of bronchiolitis. Pediatrics. 2006;118:1774–1793.
- , , . Bronchiolitis in US emergency departments 1992 to 2000: epidemiology and practice variation. Pediatr Emerg Care. 2005;21:242–247.
- , , , et al. Practice variation among pediatric emergency departments in the treatment of bronchiolitis. Acad Emerg Med. 2004;11:353–360.
- , , , . Bronchiolitis management preferences and the influence of pulse oximetry and respiratory rate on the decision to admit. Pediatrics. 2003;111:e45–e51.
- , , , , , . Variations in management of common inpatient pediatric illnesses: hospitalists and community pediatricians. Pediatrics. 2006;118:441–447.
- , , , , . Variation in pediatric hospitalists' use of proven and unproven therapies: a study from the Pediatric Research in Inpatient Settings (PRIS) network. J Hosp Med. 2008;3:292–298.
- , , , et al. Pediatric Investigators Collaborative Network on Infections in Canada (PICNIC) study of admission and management variation in patients hospitalized with respiratory syncytial viral lower respiratory tract infection. J Pediatr. 1996;129:390–395.
- , , , , . Effect of practice variation on resource utilization in infants hospitalized for viral lower respiratory illness. Pediatrics. 2001;108:851–855.
- , . Bronchodilators for bronchiolitis. Cochrane Database Syst Rev. 2010 Dec 8;(12):CD001266.
- , , . Chest physiotherapy for acute bronchiolitis in pediatric patients between 0 and 24 months old. Cochrane Database Syst Rev. 2007 Jan 24;(1):CD004873.
- , , , et al. Epinephrine for bronchiolitis. Cochrane Database Syst Rev. 2011 Jun 15;(6):CD003123.
- , , , et al. Glucocorticoids for acute bronchiolitis in infants and young children. Cochrane Database Syst Rev. 2010 Oct 6;(10):CD004878.
- , , , . Efficacy of interventions for bronchiolitis in critically ill infants: a systematic review and meta‐analysis. Pediatr Crit Care Med. 2004;5:482–489.
- , , . Direct medical costs of bronchiolitis hospitalizations in the United States. Pediatrics. 2006;118(6):2418–2423.
- , , , et al. Evaluation of an evidence‐based guideline for bronchiolitis. Pediatrics. 1999;104(6):1334–1341.
- , , . Standardizing the care of bronchiolitis. Arch Pediatr Adolesc Med. 1998;152(8):739–744.
- , , , , , . Decreasing overuse of therapies in the treatment of bronchiolitis by incorporating evidence at the point of care. J Pediatr. 2004;144:703–710.
- , , , , , . Effect of point of care information on inpatient management of bronchiolitis. BMC Pediatr. 2007;7:4.
- , , , et al. A clinical pathway for bronchiolitis is effective in reducing readmission rates. J Pediatr. 2005;147:622–626.
- , , , et al. Sustaining the implementation of an evidence‐based guideline for bronchiolitis. Arch Pediatr Adolesc Med. 2000;154:1001–1007.
- , , , , , . Assessment of the French Consensus Conference for Acute Viral Bronchiolitis on outpatient management: progress between 2003 and 2008 [in French]. Arch Pediatr. 2010;17:125–131.
- , , , , , . Impact of a bronchiolitis guideline: a multisite demonstration project. Chest. 2002;121:1789–1797.
- , , , . Management of acute bronchiolitis: can evidence based guidelines alter clinical practice? Thorax. 2008;63:1103–1109.
- , . The “3 T's” roadmap to transform US health care: the “how” of high quality care. JAMA. 2008;299(19):2319–2321.
- The VIP Network. Available at: http://www.vipnetwork.webs.com. Accessed October 5, 2010.
- , . A story of success: continuous quality improvement in cystic fibrosis in the USA. Thorax. 2011;66:1106–1168.
- , , , , , . NICU practices and outcomes associated with 9 years of quality improvement collaboratives. Pediatrics. 2010;125:437–446.
- , , , et al. Quality improvement projects target health care‐associated infections: comparing virtual collaborative and toolkit approaches. J Hosp Med. 2011;6:271–278.
- , , , , . Impact of consensus development conference guidelines on primary care of bronchiolitis: are national guidelines being followed? J Eval Clin Pract. 2007;13:651–656.
- , , , . The savings illusion—why clinical quality improvement fails to deliver bottom‐line results. N Engl J Med. 2011;365:e48.
Currently, 3%5% of infants under a year of age will be admitted to a hospital for acute viral bronchiolitis each year, making it the leading cause of hospitalization in children.15 The American Academy of Pediatrics guideline on the diagnosis and management of bronchiolitis advocates primarily supportive care for this self‐limited disease.6 Specifically, the routine use of therapies such as bronchodilators and corticosteroids are not recommended, nor is routine evaluation with diagnostic testing.6 Numerous studies have established the presence of unwarranted variation in most aspects of bronchiolitis care,713 and the current evidence does not support the routine usage of specific interventions in inpatients.1418
Acute bronchiolitis accounts for direct inpatient medical costs of over $500 million per year.19 Based on estimates from the Healthcare Utilization Project Kids' Inpatient Database, acute bronchiolitis is second only to respiratory distress syndrome as the most expensive disease of hospitalized children.1 Although charges may not correlate directly with costs or even the actual intensity of resource utilization, the national bill, based on charges, is approximately 1.4 billion dollars per year.1 Either way, the leading cause of hospitalization in children is expensive and suffers from dramatic variation in care characterized by overutilization of ineffective interventions.
Evidence‐based guidelines for bronchiolitis are readily available and their successful adoption within larger, academic children's hospitals has been demonstrated.2028 However, upwards of 70% of all children in this country are cared for outside of freestanding children's hospitals,1 and very little has been published about wide dissemination of evidence‐based guidelines in these settings.29 In 2008, the Value in Inpatient Pediatrics (VIP) network was created, as an inclusive pediatric inpatient quality improvement collaborative with a focus on linking academic and community‐based hospitalist groups, to disseminate evidence‐based management strategies for bronchiolitis. We hypothesized that group norming, through benchmarking and public goal setting at the level of the hospitalist group, would decrease overall utilization of nonevidence‐based therapies. Specifically, we were trying to decrease the utilization of bronchodilators, steroids, chest physiotherapy, chest radiography, and viral testing in hospitalized children diagnosed with uncomplicated bronchiolitis.
METHODS
Beginning in early 2008, we recruited pediatric hospitalists into a voluntary bronchiolitis quality improvement collaborative from within the community of hospitalists created by the American Academy of Pediatrics Section on Hospital Medicine. Participants were recruited through open calls at national conferences and mass e‐mails to the section membership through the listserve. The guiding principle for the collaborative was the idea that institutional adoption of evidence‐based disease‐management strategies would result in higher value of care, and that this process could be facilitated by benchmarking local performance against norms created within the larger community. We used group consensus to identify the therapies and tests to benchmark, although the chosen measures meshed with those addressed in the American Academy of Pediatrics (AAP) clinical practice guideline. Use of bronchodilators, corticosteroids, chest physiotherapy, chest radiography, and viral testing were all felt to be significantly overutilized in participating clinical sites. We were unaware of any published national targets for utilization of these therapies or tests, and none of the participating hospitalist groups was actively benchmarking their utilization against any peer group at the start of the project. Length of stay, rates of readmission within 72 hours of discharge, and variable direct costs were chosen as balancing measures for the project.
We collected data on hospitalizations for bronchiolitis for 4 calendar years, from 2007 through 2010, based on the following inclusion criteria: children under 24 months of age, hospitalized for the primary diagnosis of acute viral bronchiolitis as defined by International Classification of Diseases, Ninth Revision (ICD‐9) codes 466.11 and 466.19. We specifically included patients who were in observation status as well as those in inpatient status, and excluded all intensive care unit admissions. Other exclusions were specific ICD‐9 codes for: chronic lung diseases, asthma, chromosomal abnormalities, heart disease, and neurological diseases. We then tracked overall utilization of any bronchodilator (albuterol, levalbuterol, epinephrine, or ipratropium) during the hospitalization, including the emergency department; total number of bronchodilator doses per patient; utilization of any corticosteroids (inhaled or systemic); chest radiography; respiratory syncytial virus (RSV) testing; and chest physiotherapy; as well as variable direct costs per hospitalization for each center. A standardized toolkit was provided to participating centers to facilitate data collection. Data was sought from administrative sources, collected in aggregate form and not at the patient level, and no protected health information was collected as part of the project. The project was categorized as exempt by the University of Texas Health Science Center San Antonio Institutional Review Board, the location of the data repository.
The project began in 2008, though we requested that centers provide 2007 data to supplement our baseline. We held the first group meeting in July 2009 and began the facilitated sharing of resources to promote evidence‐based care, such as guidelines, protocols, respiratory scores, and patient handouts, across sites using data from 2007 and 2008 as our baseline for benchmarking and later assessing any improvement. Centers adopted guidelines at their own pace and we did not require guideline adoption for continued participation. We provided summaries of the available literature by topic, in the event that site leaders wished to give institutional grand rounds or other presentations. All dissemination of guidelines or protocols was done based on the request of the center, and no specific resource was created or sanctioned by the group, though the AAP Guideline for the Diagnosis and Management of Bronchiolitis6 remained a guiding document. Some of our centers participated in more extensive collaborative projects which involved small‐group goal setting, adoption of similar protocols, and conference calls, though this never encompassed more than 25% of the network.
The main product of the project was a yearly report benchmarking each hospital against the network average on each of our chosen utilization measures. The first report was disseminated in July 2009 and included data on calendar year 2007 and 2008, which we considered our group baseline. Most institutions began local Plan‐Do‐Study‐Act (PDSA) cycles by mid‐2009 using the data we provided as they benchmarked their performance against other members of the collaborative, and these continued through 2010. Hospitals were coded and remained anonymous. However, we publicly honored the high performers within the network at a yearly meeting, and urged these centers to share their tools and strategies, which was facilitated through a project Web site.30 All participation was voluntary, and all costs were borne by individuals or their respective centers.
In order to assess data quality, we undertook a validation project for calendar year 2009. We requested local direct chart review of a 10% sample, or a minimum of 10 charts, to confirm reported utilization rates for the therapies and tests we tracked. Any center with less than 80% accuracy was then asked to review data collection methods and make adjustments accordingly. One center identified and resolved a significant data discrepancy and 2 centers refused to participate in the validation project, citing their participation in a large national database for which there was already a very rigorous data validation process (Child Health Corporation of America's Pediatric Health Information System database). Given that we did not uncover major discrepancies in data quality within our network, we did not request further data validation but rather promoted year‐to‐year consistency of collection methods, seeking to collect the same type/quality of data that hospitals use in their own internal performance assessments.
Statistical analyses were performed using GraphPad InStat, version 3.0 (GraphPad Software, San Diego, CA). Descriptive statistics (including interquartile range ([IQR], the range from 25th to 75th percentile of the data) are provided. Analysis of process measures over the series of years was performed using repeated measures analysis of variance (ANOVA), as were intra‐hospital comparisons for all measures. Hospitals were not weighted by volume of admissions, ie, the unit of analysis was the hospital and not individual hospitalizations. Data were analyzed for normality using the method of Kolmogorov and Smirnoff, and in cases where normality was not satisfied (steroids and chest physiotherapy), the data were transformed and nonparametric methods were used. Post‐test adjustment for multiple comparisons was done using the TukeyKramer test in cases where ANOVA P values were <0.05. Fisher's exact test was used to analyze contingency tables for categorical variables such as presence or absence of a protocol.
RESULTS
Data encompassing 11,568 bronchiolitis hospitalizations in 17 centers, for calendar years 2007 to 2010, were analyzed for this report. A total of 31 centers ever participated in the project; however, this report is restricted to centers who participated for the entirety of the project from 2008 through 2010, and who consented to have their data reported. Specifically, 18 centers met inclusion criteria and 1 center opted out of the project, leaving the 17 centers described in Table 1. The overall network makeup shifted each year, but was always more than 80% non‐freestanding children's hospitals and approximately 30% urban, as defined as located in a population center of more than 1 million. A large majority of the participants did not have a local bronchiolitis protocol or guideline at the start of the project, although 88% of participants adopted some form of protocolized care by 2010. Calendar years 2007 and 2008 served as our network baseline, with most interventions (in institutions where they occurred) begun by calendar year 2009. The level of intervention varied greatly among institutions, with a few institutions doing nothing more than benchmarking their performance.
| Participating Centers (Alphabetically by State) | Type of Facility | Average Yearly Bronchiolitis Admissions | Approximate Medicaid (%) | Guideline Prior to Joining Project? | Location |
|---|---|---|---|---|---|
| |||||
| Scottsdale Healthcare Scottsdale, AZ | PEDS | 133 | 26 | No | Suburban |
| Shands Hospital for Children at the University of Florida Gainesville, FL | CHWH | 107 | 59 | No | Suburban |
| Children's Hospital of Illinois Peoria, IL | CHWH | 97 | 15 | No | Suburban |
| Kentucky Children's Hospital Lexington, KY | CHWH | 135 | 60 | Yes | Suburban |
| Our Lady of the Lake Baton Rouge, LA | CHWH | 138 | 70 | No | Suburban |
| The Barbara Bush Children's Hospital Portland, ME | CHWH | 31 | 41 | Yes | Suburban |
| Franklin Square Hospital Center Baltimore, MD | PEDS | 66 | 40 | No | Suburban |
| Anne Arundel Medical Center Annapolis, MD | CHWH | 56 | 36 | No | Suburban |
| Children's Hospital at Montefiore Bronx, NY | CHWH | 220 | 65 | No | Urban |
| Mission Children's Hospital Asheville, NC | CHWH | 112 | 21 | Yes | Suburban |
| Cleveland Clinic Children's Hospital Cleveland, OH | CHWH | 58 | 24 | Yes | Urban |
| Palmetto Health Children's Hospital Columbia, SC | CHWH | 181 | 60 | No | Suburban |
| East Tennessee Children's Hospital Knoxville, TN | FSCH | 373 | 60 | No | Suburban |
| Texas Children's Hospital Houston, TX | FSCH | 619 | 60 | Yes | Urban |
| Christus Santa Rosa Children's Hospital San Antonio, TX | CHWH | 390 | 71 | No | Urban |
| Children's Hospital of The Kings' Daughters Norfolk, VA | FSCH | 303 | 60 | No | Suburban |
| Children's Hospital of Richmond Richmond, VA | CHWH | 40 | 60 | No | Urban |
Mean length of stay (LOS), readmission rates, and variable direct costs did not differ significantly during the project time period. Mean LOS for the network ranged from a low of 2.4 days (IQR, 2.22.8 days) to a high of 2.7 days (IQR, 2.43.1 days), and mean readmission rates ranged from 1.2% (IQR, 0.7%1.8%) to 1.7% (IQR, 0.7%2.5%) during the project. Mean variable direct costs ranged from $1639 (IQR, $1383$1864) to $1767 (IQR, $1365$2320).
Table 2 describes the mean overall utilization of bronchodilators, chest radiography, RSV testing, steroids, and chest physiotherapy among the group from 2007 to 2010. By 2010, we saw a 46% decline in the volume of bronchodilator used within the network, a 3.6 (95% confidence interval [CI] 1.45.8) dose per patient absolute decrease (P < 0.01). We also saw a 12% (95% CI 5%25%) absolute decline in the overall percentage of patients exposed to any bronchodilator (P < 0.01). Finally, there was a 10% (95% CI 3%18%) absolute decline in the overall utilization of any chest physiotherapy (P < 0.01). The project did not demonstrate a significant impact on utilization of corticosteroids, chest radiography, or viral testing, although several centers achieved significant decreases on a local level (data not shown).
| Utilization Measure | 2007 | 2008 | 2009 | 2010 |
|---|---|---|---|---|
| No. (IQR) | No. (IQR) | No. (IQR) | No. (IQR) | |
| ||||
| Bronchodilator doses per patient (P < 0.01) | 7.9 (4.69.8) | 6.4 (4.08.4) | 5.7 (3.67.6) | 4.3 (3.05.9) |
| Any bronchodilators (P < 0.01) | 70% (59%83%) | 67% (56%77%) | 68% (61%76%) | 58% (46%69%) |
| Chest physiotherapy (P < 0.01) | 14% (5%19%) | 10% (1%8%) | 7% (2%6%) | 4% (1%7%) |
| Chest radiography (P = NS) | 64% (54%81%) | 66% (55%79%) | 64% (60%73%) | 59% (50%73%) |
| Any steroids (P = NS) | 21% (14%26%) | 20% (15%28%) | 21% (14%22%) | 16% (13%25%) |
| RSV testing (P = NS) | 64% (52%84%) | 61% (49%78%) | 62% (50%78%) | 57% (44%75%) |
We analyzed within‐hospital trends as well. Figure 1 describes intra‐hospital change over the course of the project for overall bronchodilator usage. In this analysis, 15 of 17 hospitals (88%) achieved a significant decrease in overall bronchodilator utilization by 2010. (Hospitals 27 and 29 were unable to provide 2007 baseline data.) For doses per patient, 15 of 17 institutions provided data on this measure, and 12 of 15 (80%) achieved significant decreases (Figure 2). Of note, the institutions failing to achieve significant decreases in bronchodilator utilization entered the project with utilization rates that were already significantly below network mean at the start of the project. (Institutions failing to improve are denoted with an asterisk in Figures 1 and 2.) Since most institutions made significant improvements in bronchodilator utilization over time, we looked for correlates of failure to decrease utilization. The strongest association for failure to improve during the project period was use of a protocol prior to joining the network (odds ratio [OR] = 11, 95% CI 261).
DISCUSSION
We demonstrated a significant decline in utilization of bronchodilators and chest physiotherapy in inpatient bronchiolitis within a voluntary quality collaborative focused on benchmarking without employing intensive interventions. This observation is important in that it demonstrates real‐world efficacy for our methods. Prior literature has clearly demonstrated that local bronchiolitis guidelines are effective; however, our data on over 11,000 hospitalizations from a broad array of inpatient settings continue to show a high rate of overutilization. We facilitated dissemination and sharing of guideline‐related tools primarily electronically, and capitalized on perceived peer‐group frustration with inefficient management of a high‐volume, high‐utilization disease. While the project leadership had varying degrees of advanced training in quality improvement methodology, the majority of the site leaders were self‐taught and trained while on the job. Our inclusive collaborative had some success using pragmatic and low‐resource methods which we believe is a novel approach to the issue of overutilization.
These considerations are highlighted given the pressing need to find more efficient and scalable means of bending the cost curve of healthcare in the United States. Learning collaboratives are a relatively new model for improvement, with some history in pediatrics,31, 32 and are attractive because of their potential to generate both widespread capacity for change as well as direct improvement. Both cystic fibrosis31 and neonatology collaboratives32 have been celebrated for their positive impacts on children's healthcare, and both are testaments to the power inherent in creating a community of like‐minded individuals. One of the most popular models for learning collaboratives remains the Institute for Healthcare Improvement's Breakthrough Series; however, this model is resource intensive in that it typically involves large teams and several yearly face‐to‐face meetings, with significant monetary investment on the part of hospitals. On the other hand, virtual collaboratives have produced mixed results with respect to quality improvement,33 so there is a continued need to maximize our learning about what works efficiently. Our collaborative was able to successfully disseminate tools developed in large academic institutions to be applied in smaller and more varied settings, where resources for quality improvement activities were limited.
One possible reason for any successes in this project was the existence of a well‐known guideline for the management of bronchiolitis published by the American Academy of Pediatrics in 2006. This guideline recommends primarily symptomatic care, and has a statement supporting the contention that routine use of our targeted therapies is unnecessary. It allows for a trial of bronchodilator, but specifically states that all trials should be accompanied by the use of an objective measure of improvement (typically interpreted to mean a respiratory distress score). A guideline sanctioned by an important national organization of pediatricians was invaluable, and we believe that it should serve as a basis for any nationally promoted inpatient quality measure for this very common pediatric illness. The existence of the AAP guideline also highlights the possibility that our results are merely representative of secular trends in utilization in bronchiolitis care, since we had no control group. The available literature on national guidelines has shown mixed and quite modest impacts in other countries.28, 34 Most of our group took active steps to operationalize the guidelines as part of their participation in this collaborative, though they might have done similar work anyway due to the increasing importance of quality improvement in hospitalist culture over the years of the project.
The project did not demonstrate any impact on steroid utilization, or on rates of obtaining chest radiography or viral testing, despite expressly targeting these widely overused interventions. These modalities are often employed in the emergency department and, as a collaborative of pediatric hospitalists, we did not have specific emergency department participation which we recognize as a major weakness and potential impediment to further progress. We hope to collaborate with our respective emergency departments in the future on these particular measures. We also noted that many institutions were inflexible about foregoing viral testing, due to infection control issues arising from the need to cohort patients in shared rooms based on RSV positivity during the busy winter months. A few institutions were able to alter their infection control policies using the strategy of assuming all children with bronchiolitis had RSV (ie, choosing to use both contact precautions and to wear a mask when entering rooms), though this was not universally popular. Finally, we recognize a missed opportunity in not collecting dose per patient level data for steroids, which might have allowed us to distinguish hospitals with ongoing inpatient utilization of steroids from those with only emergency department usage.
Another significant limitation of this project was the lack of annual assessments of data quality. However, we believe our findings are still useful and important, even with this obvious limitation. Most quality improvement work is done using hospital‐supplied data gleaned from administrative databases, exactly the sources used in this project. Key decisions are made in most hospitals in the country based on data of similar quality. Further limitations of the project relate to the issue of replicability. The disease process we addressed is a major source of frustration to pediatric hospitalists, and our sample likely consisted of the most highly motivated individuals, as they sought out and joined a group with the express purpose of decreasing unnecessary utilization in bronchiolitis. We believe this limitation highlights the likely need for quality measures to emerge organically out of a community of practice when resources are limited, ie, we do not believe we would have had significant success using our methods with an unpopular or externally imposed quality measure.
Although a detailed analysis of costs was beyond the scope of the current project, it is possible that decreased utilization resulted in overall cost savings, despite the fact that our data did not demonstrate a significant change in network‐level average variable direct costs related to bronchiolitis. It has been suggested that such savings may be particularly difficult to demonstrate objectively, especially when the principal costs targeted are labor‐based.35 LOS did not significantly vary during the project, whereas the use of labor‐intensive therapies like nebulized bronchodilators and chest physiotherapy declined. It is, however, quite possible that the decreased utilization we demonstrated was accompanied by a concomitant increase in utilization of other unmeasured therapies.
CONCLUSIONS
A volunteer, peer‐group collaborative focused on benchmarking decreased utilization of bronchodilators and chest physiotherapy in bronchiolitis, though had no impact on overuse of other unnecessary therapies and tests.
Acknowledgements
The following authors have participated in the production of this work by: Conception and design of project: Ralston, Garber, Narang, Shen, Pate; Acquisition of data: Ralston, Garber, Narang, Pope, Lossius, Croland, Bennett, Jewell, Krugman, Robbins, Nazif, Liewehr, Miller, Marks, Pappas, Pardue, Quinonez, Fine, Ryan; Analysis and interpretation of data: Ralston, Garber, Narang, Shen, Pate, Pope, Lossius, Croland, Bennett, Jewell, Krugman, Robbins, Nazif, Liewehr, Miller, Marks, Pappas, Pardue, Quinonez, Fine, Ryan; Drafting the article: Ralston, Garber, Shen; Revising it critically for important intellectual content, and final approval of the version to be published: Ralston, Garber, Narang, Shen, Pate, Pope, Lossius, Croland, Bennett, Jewell, Krugman, Robbins, Nazif, Liewehr, Miller, Marks, Pappas, Pardue, Quinonez, Fine, Ryan.
Disclosures: The VIP network receives financial/administrative support from the American Academy of Pediatrics through the Quality Improvement Innovations Network. Dr Ralston receives financial support from the American Academy of Pediatrics as editor of the AAP publication, Hospital Pediatrics. Drs Garber, Narang, Shen, Pate, Pope, Lossius, Croland, Bennett, Jewell, Krugman, Robbins, Nazif, Liewehr, Miller, Marks, Pappas, Pardue, Quinonez, Fine, and Ryan report no conflicts.
- HCUPnet. Kids Inpatient Database 2006. Available at: http://hcupnet.ahrq.gov/. Accessed February 6, 2011.
- , . Recent trends in severe respiratory syncytial virus (RSV) among US infants, 1997 to 2000. J Pediatr. 2003;143:S127–S132.
- , , , , . Infectious disease hospitalizations among infants in the United States. Pediatrics. 2008;121:244–252.
- , . Bronchiolitis. Lancet. 2006;368:312–322.
- , , , , . Rates of hospitalization for respiratory syncytial virus infection among children in Medicaid. J Pediatr. 2000;137:865–870.
- Subcommittee on the Diagnosis and Management of Bronchiolitis, 2004–2006. Clinical practice guideline: diagnosis and management of bronchiolitis. Pediatrics. 2006;118:1774–1793.
- , , . Bronchiolitis in US emergency departments 1992 to 2000: epidemiology and practice variation. Pediatr Emerg Care. 2005;21:242–247.
- , , , et al. Practice variation among pediatric emergency departments in the treatment of bronchiolitis. Acad Emerg Med. 2004;11:353–360.
- , , , . Bronchiolitis management preferences and the influence of pulse oximetry and respiratory rate on the decision to admit. Pediatrics. 2003;111:e45–e51.
- , , , , , . Variations in management of common inpatient pediatric illnesses: hospitalists and community pediatricians. Pediatrics. 2006;118:441–447.
- , , , , . Variation in pediatric hospitalists' use of proven and unproven therapies: a study from the Pediatric Research in Inpatient Settings (PRIS) network. J Hosp Med. 2008;3:292–298.
- , , , et al. Pediatric Investigators Collaborative Network on Infections in Canada (PICNIC) study of admission and management variation in patients hospitalized with respiratory syncytial viral lower respiratory tract infection. J Pediatr. 1996;129:390–395.
- , , , , . Effect of practice variation on resource utilization in infants hospitalized for viral lower respiratory illness. Pediatrics. 2001;108:851–855.
- , . Bronchodilators for bronchiolitis. Cochrane Database Syst Rev. 2010 Dec 8;(12):CD001266.
- , , . Chest physiotherapy for acute bronchiolitis in pediatric patients between 0 and 24 months old. Cochrane Database Syst Rev. 2007 Jan 24;(1):CD004873.
- , , , et al. Epinephrine for bronchiolitis. Cochrane Database Syst Rev. 2011 Jun 15;(6):CD003123.
- , , , et al. Glucocorticoids for acute bronchiolitis in infants and young children. Cochrane Database Syst Rev. 2010 Oct 6;(10):CD004878.
- , , , . Efficacy of interventions for bronchiolitis in critically ill infants: a systematic review and meta‐analysis. Pediatr Crit Care Med. 2004;5:482–489.
- , , . Direct medical costs of bronchiolitis hospitalizations in the United States. Pediatrics. 2006;118(6):2418–2423.
- , , , et al. Evaluation of an evidence‐based guideline for bronchiolitis. Pediatrics. 1999;104(6):1334–1341.
- , , . Standardizing the care of bronchiolitis. Arch Pediatr Adolesc Med. 1998;152(8):739–744.
- , , , , , . Decreasing overuse of therapies in the treatment of bronchiolitis by incorporating evidence at the point of care. J Pediatr. 2004;144:703–710.
- , , , , , . Effect of point of care information on inpatient management of bronchiolitis. BMC Pediatr. 2007;7:4.
- , , , et al. A clinical pathway for bronchiolitis is effective in reducing readmission rates. J Pediatr. 2005;147:622–626.
- , , , et al. Sustaining the implementation of an evidence‐based guideline for bronchiolitis. Arch Pediatr Adolesc Med. 2000;154:1001–1007.
- , , , , , . Assessment of the French Consensus Conference for Acute Viral Bronchiolitis on outpatient management: progress between 2003 and 2008 [in French]. Arch Pediatr. 2010;17:125–131.
- , , , , , . Impact of a bronchiolitis guideline: a multisite demonstration project. Chest. 2002;121:1789–1797.
- , , , . Management of acute bronchiolitis: can evidence based guidelines alter clinical practice? Thorax. 2008;63:1103–1109.
- , . The “3 T's” roadmap to transform US health care: the “how” of high quality care. JAMA. 2008;299(19):2319–2321.
- The VIP Network. Available at: http://www.vipnetwork.webs.com. Accessed October 5, 2010.
- , . A story of success: continuous quality improvement in cystic fibrosis in the USA. Thorax. 2011;66:1106–1168.
- , , , , , . NICU practices and outcomes associated with 9 years of quality improvement collaboratives. Pediatrics. 2010;125:437–446.
- , , , et al. Quality improvement projects target health care‐associated infections: comparing virtual collaborative and toolkit approaches. J Hosp Med. 2011;6:271–278.
- , , , , . Impact of consensus development conference guidelines on primary care of bronchiolitis: are national guidelines being followed? J Eval Clin Pract. 2007;13:651–656.
- , , , . The savings illusion—why clinical quality improvement fails to deliver bottom‐line results. N Engl J Med. 2011;365:e48.
Copyright © 2012 Society of Hospital Medicine
