User login
Bronchiolitis and Discharge Criteria
Although bronchiolitis is the leading cause of hospitalization for US infants,[1] there is a lack of basic prospective data about the expected inpatient clinical course and ongoing uncertainty about when a hospitalized child is ready for discharge to home.[2] This lack of data about children's readiness for discharge may result in variable hospital length‐of‐stay (LOS).[3, 4, 5]
One specific source of variability in discharge readiness and LOS variability may be the lack of consensus about safe threshold oxygen saturation values for discharge in children hospitalized with bronchiolitis.[6, 7] In 2006, the Scottish Intercollegiate Guidelines Network recommended a discharge room air oxygen (RAO2) saturation threshold of 95%.[8] The same year, the American Academy of Pediatrics (AAP) bronchiolitis clinical practice guideline stated that oxygen is not needed for children with RAO2 saturations 90% who are feeding well and have minimal respiratory distress.[9] There is a need for prospective studies to help clinicians make evidenced‐based discharge decisions for this common condition.
We performed a prospective, multicenter, multiyear study[10, 11, 12] to examine the typical inpatient clinical course of and to develop hospital discharge guidelines for children age <2 years hospitalized with bronchiolitis. We hypothesized that children would not worsen clinically and would be safe to discharge home once their respiratory status improved and they were able to remain hydrated.
METHODS
Study Design and Population
We conducted a prospective, multicenter cohort study for 3 consecutive years during the 2007 to 2010 winter seasons, as part of the Multicenter Airway Research Collaboration (MARC), a program of the Emergency Medicine Network (
All patients were treated at the discretion of the treating physician. Inclusion criteria were an attending physician's diagnosis of bronchiolitis, age <2 years, and the ability of the parent/guardian to give informed consent. The exclusion criteria were previous enrollment and transfer to a participating hospital >48 hours after the original admission time. Therefore, children with comorbid conditions were included in this study. All consent and data forms were translated into Spanish. The institutional review board at each of the 16 participating hospitals approved the study.
Of the 2207 enrolled children, we excluded 109 (5%) children with a hospital LOS <1 day due to inadequate time to capture the required data for the present analysis. Among the 2098 remaining children, 1916 (91%) had daily inpatient data on all factors used to define clinical improvement and clinical worsening. Thus, the analytic cohort was comprised of 1916 children hospitalized for bronchiolitis.
Data Collection
Investigators conducted detailed structured interviews. Chart reviews were conducted to obtain preadmission and daily hospital clinical data including respiratory rates, daily respiratory rate trends, degree of retractions, oxygen saturation, daily oxygen saturation trends, medical management, and disposition. These data were manually reviewed, and site investigators were queried about missing data and discrepancies. A follow‐up telephone interview was conducted with families 1 week after discharge to examine relapse events at both 24 hours and 7 days.
We used the question: How long ago did the following symptoms [eg, difficulty breathing] begin [for the] current illness? to estimate the onset of the current illness. Pulse was categorized as low, normal, or high based on age‐related heart rate values.[13] Presence of apnea was recorded daily by site investigators.[14]
Nasopharyngeal Aspirate Collection and Virology Testing
As described previously, site teams used a standardized protocol to collect nasopharyngeal aspirates,[11] which were tested for respiratory syncytial virus (RSV) types A and B; rhinovirus (RV); parainfluenza virus types 1, 2, and 3; influenza virus types A and B; 2009 novel H1N1; human metapneumovirus; coronaviruses NL‐63, HKU1, OC43, and 229E; enterovirus, and adenovirus using polymerase chain reaction.[11, 15, 16, 17]
Defining Clinical Improvement and Worsening
Clinical improvement criteria were based on the 2006 AAP guidelines.[9] For respiratory rate and oxygen saturation, clinicians estimated average daily respiratory rate and oxygen saturation based on the recorded readings from the previous 24 hours. This estimation reflects the process clinicians use when rounding on their hospitalized patients, and thus may be more similar to standard clinical practice than a calculated mean. The respiratory rate criteria are adjusted for age.[18, 19] For daily estimated average oxygen saturation we used the AAP criteria of RAO2 saturation of 90%. Considering that oxygen saturation is the main determinant of LOS,[20] healthy infants age <6 months may have transient oxygen saturations of around 80%,[21] and that errors in estimation may occur, we included a lowest RAO2 of 88% in our improvement criteria. By combining the dichotomized estimated oxygen saturation (90% or not) with the lower limit of 88%, there was little room for erroneous conclusions. A child was considered clinically improved on the earliest date he/she met all of the following criteria: (1) none or mild retractions and improved or stable retractions compared with the previous inpatient day; (2) daily estimated average respiratory rate (RR) <60 breaths per minute for age <6 months, <55 breaths/minute for age 6 to 11 months, and <45 breaths/minute for age 12 months with a decreasing or stable trend over the course of the current day; (3) daily estimated average RAO2 saturation 90%, lowest RAO2 saturation 88%[21]; and (4) not receiving intravenous (IV) fluids or for children receiving IV fluids a clinician report of the child maintaining oral hydration. Children who reached the clinical improvement criteria were considered clinically worse if they required intensive care or had the inverse of 1 of the improvement criteria: moderate/severe retractions that were worse compared with the previous inpatient day, daily average RR 60 with an increasing trend over the current day, need for oxygen, or need for IV fluids.
Statistical Analyses
All analyses were performed using Stata 12.0 (StataCorp, College Station, TX). Data are presented as proportions with 95% confidence intervals (95% CIs), means with standard deviations, and medians with interquartile ranges (IQR). To examine potential factors associated with clinical worsening after reaching clinical improvement, we used 2, Fisher exact, Student t test, and Kruskall‐Wallis tests, as appropriate.
Adjusted analyses used generalized linear mixed models with a logit link to identify independent risk factors for worsening after reaching clinical improvement. Fixed effects for patient‐level factors and a random site effect were used. Factors were tested for inclusion in the multivariable model if they were found to be associated with worsening in unadjusted analyses (P<0.20) or were considered clinically important. Results are reported as odds ratios with 95% CIs.
We performed several sensitivity analyses to evaluate these improvement criteria: (1) we excluded the lowest RAO2 saturation requirement of 88%, (2) we examined a 94% daily estimated average RAO2 saturation threshold,[22] (3) we examined a 95% daily estimated average RAO2 saturation threshold,[8] and (4) we examined children age <12 months with no history of wheeze.
RESULTS
There were 1916 children hospitalized with bronchiolitis with data on all factors used to define clinical improvement and clinical worsening. The median number of days from the beginning of difficulty breathing until admission was 2 days (IQR, 15.5 days; range, 18 days) and from the beginning of difficulty breathing until clinical improvement was 4 days (IQR, 37.5 days; range, 133 days) (Figure 1). The variance for days to admission was significantly less than the variance for days to clinical improvement (P<0.001).

In this observational study, clinicians discharged 214 (11%) of the 1916 children before meeting the definition of clinical improvement. Thus, 1702 (89%; 95% CI: 87%‐90%) children reached the clinical improvement criteria, had a LOS >1 day, and had data on all factors (Figure 2).
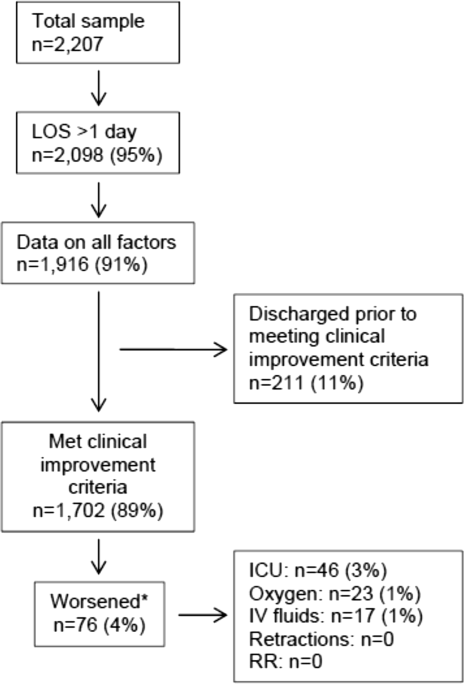
Of the 1702 children who met the clinical improvement criteria, there were 76 children (4%; 95% CI: 3%5%) who worsened (Figure 2). The worsening occurred within a median of 1 day (IQR, 13 days) of clinical improvement. Forty‐six (3%) of the children required transfer to the ICU (1 required intubation, 1 required continuous positive airway pressure, and 4 had apnea), 23 (1%) required oxygen, and 17 (1%) required IV fluids. Eight percent of children met multiple criteria for worsening. A comparison between children who did and did not worsen is shown in Table 1. In general, children who worsened after improvement were younger and born earlier. These children also presented in more severe respiratory distress, had moderate or severe retractions, oxygen saturation <85% at hospitalization, inadequate oral intake, and apnea documented during the hospitalization. Neither viral etiology nor site of care influenced whether the children worsened after improving. However, stratified analysis of children based on initial location of admission (ie, ICU or ward) showed that among the children admitted to the ICU from the emergency department (ED), 89% met the improvement criteria and 19% clinically worsened. In contrast, among children admitted to the ward from the ED, 89% met the improvement criteria, and only 2% clinically worsened. Stratified multivariable models based on the initial location of admission from the ED (ie, ICU or ward) were not possible due to small sample sizes after stratification. None of these children had relapse events requiring rehospitalization within either 24 hours or 7 days of discharge.
| Did Not Worsen, n=1,626 | Worsened, n=76 | P Value | |
|---|---|---|---|
| |||
| Demographic characteristics | |||
| Age <2 months, % | 29 | 57 | <0.001 |
| Month of birth, % | 0.02 | ||
| OctoberMarch | 61 | 75 | |
| AprilSeptember | 39 | 25 | |
| Sex, % | 0.51 | ||
| Male | 59 | 55 | |
| Female | 41 | 45 | |
| Race, % | 0.050 | ||
| White | 63 | 58 | |
| Black | 23 | 34 | |
| Other or missing | 14 | 8 | |
| Hispanic ethnicity, % | 37 | 22 | 0.01 |
| Insurance, % | 0.87 | ||
| Nonprivate | 68 | 67 | |
| Private | 32 | 33 | |
| Medical history | |||
| Gestational age <37 weeks, % | 23 | 39 | 0.002 |
| Birth weight, % | 0.52 | ||
| <5 lbs | 13 | 12 | |
| 5 lbs | 34 | 41 | |
| 7 lbs | 53 | 47 | |
| Mother's age, median (IQR) | 27 (2333) | 27 (2233) | 0.54 |
| Is or was breastfed, % | 61 | 51 | 0.10 |
| Smoked during pregnancy, % | 15 | 20 | 0.22 |
| Exposure to smoke, % | 13 | 20 | 0.11 |
| Family history of asthma, % | 0.89 | ||
| Neither parent | 68 | 64 | |
| Either mother or father | 27 | 30 | |
| Both parents | 4 | 4 | |
| Do not know/missing | 2 | 1 | |
| History of wheezing, % | 23 | 17 | 0.24 |
| History of eczema, % | 16 | 7 | 0.04 |
| History of intubation, % | 9 | 12 | 0.50 |
| Major, relevant, comorbid medical disorder, % | 20 | 24 | 0.46 |
| Current illness | |||
| When difficulty breathing began, preadmission, % | 0.63 | ||
| 1 day | 70 | 75 | |
| <1 day | 28 | 23 | |
| No difficulty preadmission | 2 | 3 | |
| Weight, lbs, median (IQR) | 12.3 (8.817.4) | 9.0 (6.613.2) | 0.001 |
| Temperature, F, median (IQR) | 99.5 (98.6100.6) | 99.4 (98.1100.4) | 0.06 |
| Pulse, beats per minute by age | 0.82 | ||
| Low | 0.3 | 0 | |
| Normal | 48 | 46 | |
| High | 51 | 54 | |
| Respiratory rate, breaths per minute, median (IQR) | 48 (4060) | 48 (3864) | 0.28 |
| Retractions, % | 0.001 | ||
| None | 22 | 25 | |
| Mild | 43 | 24 | |
| Moderate | 26 | 33 | |
| Severe | 4 | 12 | |
| Missing | 5 | 7 | |
| Oxygen saturation by pulse oximetry or ABG, % | 0.001 | ||
| <85 | 4 | 12 | |
| 8587.9 | 3 | 4 | |
| 8889.9 | 5 | 0 | |
| 9093.9 | 18 | 11 | |
| 94 | 72 | 73 | |
| Oral intake, % | <0.001 | ||
| Adequate | 45 | 22 | |
| Inadequate | 42 | 63 | |
| Missing | 13 | 14 | |
| Presence of apnea, % | 7 | 24 | <0.001 |
| RSV‐A, % | 44 | 41 | 0.54 |
| RSV‐B, % | 30 | 25 | 0.36 |
| HRV, % | 24 | 24 | 0.88 |
| Chest x‐ray results during ED/preadmission visit | |||
| Atelectasis | 12 | 13 | 0.77 |
| Infiltrate | 13 | 11 | 0.50 |
| Hyperinflated | 18 | 21 | 0.47 |
| Peribronchial cuffing/thickening | 23 | 17 | 0.32 |
| Normal | 14 | 16 | 0.75 |
| White blood count, median (IQR) | 11.2 (8.714.4) | 11.9 (9.214.4) | 0.60 |
| Platelet count, median (IQR) | 395 (317490) | 430 (299537) | 0.56 |
| Sodium, median (IQR) | 138 (136140) | 137 (135138) | 0.19 |
| Hospital length of stay, median (IQR) | 2 (14) | 4.5 (28) | <0.001 |
| One‐week follow‐up | |||
| Relapse within 24 hours of hospital discharge requiring hospital admission, % | 0.5 | 0 | 0.56 |
| Relapse within 7 days of hospital discharge requiring hospital admission, % | 1 | 0 | 0.35 |
On multivariable analysis (Table 2), independent risk factors for worsening after reaching the clinical improvement criteria were young age, preterm birth, and presenting to care with more severe bronchiolitis represented by severe retractions, inadequate oral intake, or apnea. To further evaluate the improvement criteria in the current analysis, multiple sensitivity analyses were conducted. The frequency of clinical worsening after reaching the improvement criteria was stable when we examined different RA02 criteria in sensitivity analyses: (1) excluding RA02 as a criterion for improvement: 90% met improvement criteria and 4% experienced clinical worsening, (2) changing the average RA02 threshold for clinical improvement to 94%: 62% met improvement criteria and 6% experienced clinical worsening, and (3) changing the average RA02 threshold for clinical improvement to 95%: 47% met improvement criteria and 5% experienced clinical worsening. Furthermore, stratifying by age <2 months and restricting to more stringent definitions of bronchiolitis (ie, age <1 year or age <1 year+no history of wheezing) also did not materially change the results (see Supporting Figure 1 in the online version of this article).
| Odds Ratio | 95% CI | P Value | |
|---|---|---|---|
| |||
| Age <2 months | 3.51 | 2.07‐5.94 | <0.001 |
| Gestational age <37 weeks | 1.94 | 1.13‐3.32 | 0.02 |
| Retractions | |||
| None | 1.30 | 0.80‐3.23 | 0.19 |
| Mild | 1.0 | Reference | |
| Moderate | 1.91 | 0.99‐3.71 | 0.06 |
| Severe | 5.55 | 2.1214.50 | <0.001 |
| Missing | 1.70 | 0.53‐5.42 | 0.37 |
| Oral intake | |||
| Adequate | 1.00 | Reference | |
| Inadequate | 2.54 | 1.39‐4.62 | 0.002 |
| Unknown/missing | 1.88 | 0.79‐4.44 | 0.15 |
| Presence of apnea | 2.87 | 1.45‐5.68 | 0.003 |
We compared the 214 children who were discharged prior to reaching clinical improvement with the 1702 children who reached the clinical improvement criteria. The 214 children were less likely to be age <2 months (22% vs 30%; P=0.02). These 2 groups (214 vs 1702) were similar with respect to severe retractions (2% vs 4%; P=0.13), median respiratory rate (48 vs 48; P=0.42), oxygen saturation <90% (15% vs 11%; P=0.07), inadequate oral intake (50% vs 43%; P=0.13), and rates of relapse events requiring rehospitalization within both 24 hours (0.6% vs 0.6%; P=0.88) and 7 days (1% vs 1%; P=0.90) of discharge.
DISCUSSION
In this large, multicenter, multiyear study of children hospitalized with bronchiolitis, we found that children present to a hospital in a relatively narrow time frame, but their time to recovery in the hospital is highly variable. Nonetheless, 96% of children continued to improve once they had: (1) improving or stable retractions rated as none/mild, (2) a decreasing or stable RR by age, (3) estimated average RAO2 saturation 90% and lowest RAO2 saturation of 88%, and (4) were hydrated. The 4% of children who worsened after clinically improving were more likely to be age <2 months, born <37 weeks, and present with more severe distress (ie, severe retractions, inadequate oral intake, or apnea). Based on the low risk of worsening after clinical improvement, especially among children admitted to the regular ward (2%), we believe these 4 clinical criteria could be used as discharge criteria for this common pediatric illness with a predominantly monophasic clinical course.
Variability in hospital LOS for children with bronchiolitis exists in the United States[3] and internationally.[4, 5] Cheung and colleagues analyzed administrative data from over 75,000 children admitted for bronchiolitis in England between April 2007 and March 2010 and found sixfold variation in LOS between sites. They concluded that this LOS variability was due in part to providers' clinical decision making.[5] Srivastava and colleagues[23] addressed variable clinician decision making in bronchiolitis and 10 other common pediatric conditions by embedding discharge criteria developed by expert consensus into admission order sets. They found that for children with bronchiolitis, the embedded discharge criteria reduced the median LOS from 1.91 to 1.87 days. In contrast to the single‐center data presented by White and colleagues,[24] the prospective, multicenter MARC‐30 data provide a clear understanding of the normal clinical course for children hospitalized with bronchiolitis, determine if children clinically worsen after clinical improvement, and provide data about discharge criteria for children hospitalized with bronchiolitis. Although there is a lack of rigorous published data, the lower tract symptoms of bronchiolitis (eg, cough, retractions) are said to peak on days 5 to 7 of illness and then gradually resolve.[25] In the present study, we found that the time from the onset of difficulty breathing until hospital admission is less variable than the time from the onset of difficulty breathing until either clinical improvement or discharge. Although 75% of children have clinically improved within 7.5 days of difficulty breathing based on the IQR results, the remaining 25% may have a more prolonged recovery in the hospital of up to 3 weeks. Interestingly, prolonged recovery times from bronchiolitis have also been noted in children presenting to the ED[26] and in an outpatient population.[27] It is unclear why 20% to 25% of children at different levels of severity of illness have prolonged recovery from bronchiolitis, but this group of children requires further investigation.
Given the variability of recovery times, clinicians may have difficulty knowing when a child is ready for hospital discharge. One of the main stumbling blocks for discharge readiness in children with bronchiolitis is the interpretation of the oxygen saturation value.[6, 8, 9, 20, 28] However, it should be considered that interpreting the oxygen saturation in a child who is clinically improving in the hospital setting is different than interpreting the oxygen saturation of a child in the ED or the clinic whose clinical course is less certain.[22] In the hospital setting, using the oxygen saturation value in in the AAP guideline,[9] 4% of children clinically worsened after they met the improvement criteria, a clinical pattern observed previously with supplemental oxygen.[28] This unpredictability may explain some of the variation in providers' clinical decision making.[5] The children who worsened, and therefore deserve more cautious discharge planning, were young (<2 months), premature (<37 weeks gestational age), and presented in more severe distress. Those children admitted to the ICU from the ED worsened more commonly than children admitted to the ward (19% vs 2%). Interestingly, the viral etiology of the child's bronchiolitis did not influence whether a child worsened after reaching the improvement criteria. Therefore, although children with RV bronchiolitis have a shorter hospital LOS than children with RSV bronchiolitis,[11] the pattern of recovery did not differ by viral etiology.
In addition to unsafe discharges, clinicians may be concerned about the possibility of readmissions. Although somewhat controversial, hospital readmission is being used as a quality of care metric.[29, 30, 31] One response to minimize readmissions would be for clinicians to observe children for longer than clinically indicated.[32] However, shorter LOS is not necessarily associated with increased readmission rates.[33] Given that the geometric mean of hospital charges per child with bronchiolitis increased from $6380 in 2000 to $8530 in 2009,[34] the potential for safely reducing hospital LOS by using the discharge criteria proposed in the current study instead of other criteria[8] may net substantial cost savings. Furthermore, reducing LOS would decrease the time children expose others to these respiratory viruses and possibly reduce medical errors.[35]
Our study has some potential limitations. Because the study participants were all hospitalized, these data do not inform admission or discharge decisions from either the ED or the clinic; but other data address those clinical scenarios.[22] Also, the 16 sites that participated in this study were large, urban teaching hospitals. Consequently, these results are not necessarily generalizable to smaller community hospitals. Although numerous data points were required to enter the analytic cohort, only 9% of the sample was excluded for missing data. There were 214 children who did not meet our improvement criteria by the time of discharge. Although the inability to include these children in the analysis may be seen as a limitation, this practice variability underscores the need for more data about discharging hospitalized children with bronchiolitis. Last, site teams reviewed medical records daily. More frequent recording of the clinical course would have yielded more granular data, but the current methodology replicates how data are generally presented during patient care rounds, when decisions about suitability for discharge are often considered.
CONCLUSION
We documented in this large multicenter study that most children hospitalized with bronchiolitis had a wide range of time to recovery, but the vast majority continued to improve once they reached the identified clinical criteria that predict a safe discharge to home. The children who worsened after clinical improvement were more likely to be younger, premature infants presenting in more severe distress. Although additional prospective validation of these hospital discharge criteria is warranted, these data may help clinicians make more evidence‐based discharge decisions for a common pediatric illness with high practice variation, both in the United States[3] and in other countries.[4, 5]
Acknowledgements
Collaborators in the MARC‐30 Study: Besh Barcega, MD, Loma Linda University Children's Hospital, Loma Linda, CA; John Cheng, MD, Children's Healthcare of Atlanta at Egleston, Atlanta, GA; Dorothy Damore, MD, New York Presbyterian Hospital‐Cornell, New York, NY; Carlos Delgado, MD, Children's Healthcare of Atlanta at Egleston, Atlanta, GA; Haitham Haddad, MD, Rainbow Babies & Children's Hospital, Cleveland, OH; Paul Hain, MD, Monroe Carell Jr. Children's Hospital at Vanderbilt, Nashville, TN; Frank LoVecchio, DO, Maricopa Medical Center, Phoenix, AZ; Charles Macias, MD MPH, Texas Children's Hospital, Houston, TX; Jonathan Mansbach, MD, MPH, Boston Children's Hospital, Boston, MA; Eugene Mowad, MD, Akron Children's Hospital, Akron, OH; Brian Pate, MD, Children's Mercy Hospital, Kansas City, MO; Mark Riederer, MD, Monroe Carell Jr. Children's Hospital at Vanderbilt, Nashville, TN; M. Jason Sanders, MD, Children's Memorial Hermann Hospital, Houston, TX; Alan R. Schroeder, MD, Santa Clara Valley Medical Center, San Jose, CA; Nikhil Shah, MD, New York Presbyterian Hospital‐Cornell, New York, NY; Michelle Stevenson, MD, MS, Kosair Children's Hospital, Louisville, KY; Erin Stucky Fisher, MD, Rady Children's Hospital, San Diego, CA; Stephen Teach, MD, MPH, Children's National Medical Center, Washington, DC; Lisa Zaoutis, MD, Children's Hospital of Philadelphia, Philadelphia, PA.
Disclosures: This study was supported by grants U01 AI‐67693 and K23 AI‐77801 from the National Institutes of Health (Bethesda, MD). The content of this manuscript is solely the responsibility of the authors and does not necessarily represent the official views of the National Institute of Allergy and Infectious Diseases or the National Institutes of Health. Drs. Mansbach and Piedra have provided consultation to Regeneron Pharmaceuticals. Otherwise, no authors report any potential conflicts of interest, including relevant financial interests, activities, relationships, and affiliations.
- , , , , . Infectious disease hospitalizations among infants in the United States. Pediatrics. 2008;121(2):244–252.
- . “A hospital is no place to be sick” Samuel Goldwyn (1882–1974). Arch Dis Child. 2009;94(8):565–566.
- , , , , , Variation in inpatient diagnostic testing and management of bronchiolitis. Pediatrics. 2005;115(4):878–884.
- , , , International variation in the management of infants hospitalized with respiratory syncytial virus. International RSV Study Group. Eur J Pediatr. 1998;157(3):215–220.
- , , , , . Population variation in admission rates and duration of inpatient stay for bronchiolitis in England. Arch Dis Child. 2013;98(1):57–59.
- , , , . Impact of pulse oximetry and oxygen therapy on length of stay in bronchiolitis hospitalizations. Arch Pediatr Adolesc Med. 2004;158(6):527–530.
- , , . Pulse oximetry in pediatric practice. Pediatrics. 2011;128(4):740–752.
- Scottish Intercollegiate Guidelines Network. Bronchiolitis in children (SIGN 91). In: NHS Quality Improvement Scotland. Edinburgh, Scotland: Scottish Intercollegiate Guidelines Network; 2006.
- , , , et al. Diagnosis and management of bronchiolitis. Pediatrics. 2006;118(4):1774–1793.
- , , , et al. Prospective multicenter study of children with bronchiolitis requiring mechanical ventilation. Pediatrics. 2012;130(3):e492–e500.
- , , , et al. Prospective multicenter study of viral etiology and hospital length of stay in children with severe bronchiolitis. Arch Pediatr Adolesc Med. 2012;166(8):700–706.
- , , , et al. Apnea in children hospitalized with bronchiolitis. Pediatrics. 2013;132(5):e1194–e1201.
- . Evaluation of the cardiovascular system: history and physical evaluation. In: Kliegman RM, Stanton BF, St. Geme JW III, Schor NF, Behrman RF, eds. Nelson Textbook of Pediatrics. Philadelphia, PA: Elsevier Saunders; 2011:1529–1536.
- , , , et al. Apnea in children hospitalized with bronchiolitis. Pediatrics. 2013;132(5):e1194–e1201.
- , , , et al. Respiratory viral infections in patients with chronic, obstructive pulmonary disease. J Infect. 2005;50(4):322–330.
- , , , . Evaluation of real‐time PCR for diagnosis of Bordetella pertussis infection. BMC Infect Dis. 2006;6:62.
- , , , , . Evaluation of three real‐time PCR assays for detection of Mycoplasma pneumoniae in an outbreak investigation. J Clin Microbiol. 2008;46(9):3116–3118.
- , , , et al. Normal ranges of heart rate and respiratory rate in children from birth to 18 years of age: a systematic review of observational studies. Lancet. 2011;377(9770):1011–1018.
- , , , , , . Development of heart and respiratory rate percentile curves for hospitalized children. Pediatrics. 2013;131(4):e1150–e1157.
- , . Effect of oxygen supplementation on length of stay for infants hospitalized with acute viral bronchiolitis. Pediatrics. 2008;121(3):470–475.
- , , , et al. Longitudinal assessment of hemoglobin oxygen saturation in healthy infants during the first 6 months of age. Collaborative Home Infant Monitoring Evaluation (CHIME) Study Group. J Pediatr. 1999;135(5):580–586.
- , , , et al. Prospective multicenter study of bronchiolitis: predicting safe discharges from the emergency department. Pediatrics. 2008;121(4):680–688.
- , , , et al. Delays in discharge in a tertiary care pediatric hospital. J Hosp Med. 2009;4(8):481–485.
- , , , et al. Using quality improvement to optimise paediatric discharge efficiency. BMJ Qual Saf. 2014;23(5):428–436.
- , . Bronchiolitis in infants and children: treatment; outcome; and prevention. In: Torchia M, ed. UpToDate. Alphen aan den Rijn, the Netherlands; Wolters Kluwer Health; 2013.
- , . Duration of illness in infants with bronchiolitis evaluated in the emergency department. Pediatrics. 2010;126(2):285–290.
- , , . Duration of illness in ambulatory children diagnosed with bronchiolitis. Arch Pediatr Adolesc Med. 2000;154(10):997–1000.
- , , , et al. A clinical pathway for bronchiolitis is effective in reducing readmission rates. J Pediatr. 2005;147(5):622–626.
- , , , et al. Measuring hospital quality using pediatric readmission and revisit rates. Pediatrics. 2013;132(3):429–436.
- , , , et al. Pediatric readmission prevalence and variability across hospitals. JAMA. 2013;309(4):372–380.
- , , , , , . Preventability of early readmissions at a children's hospital. Pediatrics. 2013;131(1):e171–e181.
- , . Hospital readmission: quality indicator or statistical inevitability? Pediatrics. 2013;132(3):569–570.
- , , , et al. Children's hospitals with shorter lengths of stay do not have higher readmission rates. J Pediatr. 2013;163(4):1034–1038.e1.
- , , , , . Trends in bronchiolitis hospitalizations in the United States, 2000–2009. Pediatrics. 2013;132(1):28–36.
- , , , . Preventable adverse events in infants hospitalized with bronchiolitis. Pediatrics. 2005;116(3):603–608.
Although bronchiolitis is the leading cause of hospitalization for US infants,[1] there is a lack of basic prospective data about the expected inpatient clinical course and ongoing uncertainty about when a hospitalized child is ready for discharge to home.[2] This lack of data about children's readiness for discharge may result in variable hospital length‐of‐stay (LOS).[3, 4, 5]
One specific source of variability in discharge readiness and LOS variability may be the lack of consensus about safe threshold oxygen saturation values for discharge in children hospitalized with bronchiolitis.[6, 7] In 2006, the Scottish Intercollegiate Guidelines Network recommended a discharge room air oxygen (RAO2) saturation threshold of 95%.[8] The same year, the American Academy of Pediatrics (AAP) bronchiolitis clinical practice guideline stated that oxygen is not needed for children with RAO2 saturations 90% who are feeding well and have minimal respiratory distress.[9] There is a need for prospective studies to help clinicians make evidenced‐based discharge decisions for this common condition.
We performed a prospective, multicenter, multiyear study[10, 11, 12] to examine the typical inpatient clinical course of and to develop hospital discharge guidelines for children age <2 years hospitalized with bronchiolitis. We hypothesized that children would not worsen clinically and would be safe to discharge home once their respiratory status improved and they were able to remain hydrated.
METHODS
Study Design and Population
We conducted a prospective, multicenter cohort study for 3 consecutive years during the 2007 to 2010 winter seasons, as part of the Multicenter Airway Research Collaboration (MARC), a program of the Emergency Medicine Network (
All patients were treated at the discretion of the treating physician. Inclusion criteria were an attending physician's diagnosis of bronchiolitis, age <2 years, and the ability of the parent/guardian to give informed consent. The exclusion criteria were previous enrollment and transfer to a participating hospital >48 hours after the original admission time. Therefore, children with comorbid conditions were included in this study. All consent and data forms were translated into Spanish. The institutional review board at each of the 16 participating hospitals approved the study.
Of the 2207 enrolled children, we excluded 109 (5%) children with a hospital LOS <1 day due to inadequate time to capture the required data for the present analysis. Among the 2098 remaining children, 1916 (91%) had daily inpatient data on all factors used to define clinical improvement and clinical worsening. Thus, the analytic cohort was comprised of 1916 children hospitalized for bronchiolitis.
Data Collection
Investigators conducted detailed structured interviews. Chart reviews were conducted to obtain preadmission and daily hospital clinical data including respiratory rates, daily respiratory rate trends, degree of retractions, oxygen saturation, daily oxygen saturation trends, medical management, and disposition. These data were manually reviewed, and site investigators were queried about missing data and discrepancies. A follow‐up telephone interview was conducted with families 1 week after discharge to examine relapse events at both 24 hours and 7 days.
We used the question: How long ago did the following symptoms [eg, difficulty breathing] begin [for the] current illness? to estimate the onset of the current illness. Pulse was categorized as low, normal, or high based on age‐related heart rate values.[13] Presence of apnea was recorded daily by site investigators.[14]
Nasopharyngeal Aspirate Collection and Virology Testing
As described previously, site teams used a standardized protocol to collect nasopharyngeal aspirates,[11] which were tested for respiratory syncytial virus (RSV) types A and B; rhinovirus (RV); parainfluenza virus types 1, 2, and 3; influenza virus types A and B; 2009 novel H1N1; human metapneumovirus; coronaviruses NL‐63, HKU1, OC43, and 229E; enterovirus, and adenovirus using polymerase chain reaction.[11, 15, 16, 17]
Defining Clinical Improvement and Worsening
Clinical improvement criteria were based on the 2006 AAP guidelines.[9] For respiratory rate and oxygen saturation, clinicians estimated average daily respiratory rate and oxygen saturation based on the recorded readings from the previous 24 hours. This estimation reflects the process clinicians use when rounding on their hospitalized patients, and thus may be more similar to standard clinical practice than a calculated mean. The respiratory rate criteria are adjusted for age.[18, 19] For daily estimated average oxygen saturation we used the AAP criteria of RAO2 saturation of 90%. Considering that oxygen saturation is the main determinant of LOS,[20] healthy infants age <6 months may have transient oxygen saturations of around 80%,[21] and that errors in estimation may occur, we included a lowest RAO2 of 88% in our improvement criteria. By combining the dichotomized estimated oxygen saturation (90% or not) with the lower limit of 88%, there was little room for erroneous conclusions. A child was considered clinically improved on the earliest date he/she met all of the following criteria: (1) none or mild retractions and improved or stable retractions compared with the previous inpatient day; (2) daily estimated average respiratory rate (RR) <60 breaths per minute for age <6 months, <55 breaths/minute for age 6 to 11 months, and <45 breaths/minute for age 12 months with a decreasing or stable trend over the course of the current day; (3) daily estimated average RAO2 saturation 90%, lowest RAO2 saturation 88%[21]; and (4) not receiving intravenous (IV) fluids or for children receiving IV fluids a clinician report of the child maintaining oral hydration. Children who reached the clinical improvement criteria were considered clinically worse if they required intensive care or had the inverse of 1 of the improvement criteria: moderate/severe retractions that were worse compared with the previous inpatient day, daily average RR 60 with an increasing trend over the current day, need for oxygen, or need for IV fluids.
Statistical Analyses
All analyses were performed using Stata 12.0 (StataCorp, College Station, TX). Data are presented as proportions with 95% confidence intervals (95% CIs), means with standard deviations, and medians with interquartile ranges (IQR). To examine potential factors associated with clinical worsening after reaching clinical improvement, we used 2, Fisher exact, Student t test, and Kruskall‐Wallis tests, as appropriate.
Adjusted analyses used generalized linear mixed models with a logit link to identify independent risk factors for worsening after reaching clinical improvement. Fixed effects for patient‐level factors and a random site effect were used. Factors were tested for inclusion in the multivariable model if they were found to be associated with worsening in unadjusted analyses (P<0.20) or were considered clinically important. Results are reported as odds ratios with 95% CIs.
We performed several sensitivity analyses to evaluate these improvement criteria: (1) we excluded the lowest RAO2 saturation requirement of 88%, (2) we examined a 94% daily estimated average RAO2 saturation threshold,[22] (3) we examined a 95% daily estimated average RAO2 saturation threshold,[8] and (4) we examined children age <12 months with no history of wheeze.
RESULTS
There were 1916 children hospitalized with bronchiolitis with data on all factors used to define clinical improvement and clinical worsening. The median number of days from the beginning of difficulty breathing until admission was 2 days (IQR, 15.5 days; range, 18 days) and from the beginning of difficulty breathing until clinical improvement was 4 days (IQR, 37.5 days; range, 133 days) (Figure 1). The variance for days to admission was significantly less than the variance for days to clinical improvement (P<0.001).
In this observational study, clinicians discharged 214 (11%) of the 1916 children before meeting the definition of clinical improvement. Thus, 1702 (89%; 95% CI: 87%‐90%) children reached the clinical improvement criteria, had a LOS >1 day, and had data on all factors (Figure 2).
Of the 1702 children who met the clinical improvement criteria, there were 76 children (4%; 95% CI: 3%5%) who worsened (Figure 2). The worsening occurred within a median of 1 day (IQR, 13 days) of clinical improvement. Forty‐six (3%) of the children required transfer to the ICU (1 required intubation, 1 required continuous positive airway pressure, and 4 had apnea), 23 (1%) required oxygen, and 17 (1%) required IV fluids. Eight percent of children met multiple criteria for worsening. A comparison between children who did and did not worsen is shown in Table 1. In general, children who worsened after improvement were younger and born earlier. These children also presented in more severe respiratory distress, had moderate or severe retractions, oxygen saturation <85% at hospitalization, inadequate oral intake, and apnea documented during the hospitalization. Neither viral etiology nor site of care influenced whether the children worsened after improving. However, stratified analysis of children based on initial location of admission (ie, ICU or ward) showed that among the children admitted to the ICU from the emergency department (ED), 89% met the improvement criteria and 19% clinically worsened. In contrast, among children admitted to the ward from the ED, 89% met the improvement criteria, and only 2% clinically worsened. Stratified multivariable models based on the initial location of admission from the ED (ie, ICU or ward) were not possible due to small sample sizes after stratification. None of these children had relapse events requiring rehospitalization within either 24 hours or 7 days of discharge.
| Did Not Worsen, n=1,626 | Worsened, n=76 | P Value | |
|---|---|---|---|
| |||
| Demographic characteristics | |||
| Age <2 months, % | 29 | 57 | <0.001 |
| Month of birth, % | 0.02 | ||
| OctoberMarch | 61 | 75 | |
| AprilSeptember | 39 | 25 | |
| Sex, % | 0.51 | ||
| Male | 59 | 55 | |
| Female | 41 | 45 | |
| Race, % | 0.050 | ||
| White | 63 | 58 | |
| Black | 23 | 34 | |
| Other or missing | 14 | 8 | |
| Hispanic ethnicity, % | 37 | 22 | 0.01 |
| Insurance, % | 0.87 | ||
| Nonprivate | 68 | 67 | |
| Private | 32 | 33 | |
| Medical history | |||
| Gestational age <37 weeks, % | 23 | 39 | 0.002 |
| Birth weight, % | 0.52 | ||
| <5 lbs | 13 | 12 | |
| 5 lbs | 34 | 41 | |
| 7 lbs | 53 | 47 | |
| Mother's age, median (IQR) | 27 (2333) | 27 (2233) | 0.54 |
| Is or was breastfed, % | 61 | 51 | 0.10 |
| Smoked during pregnancy, % | 15 | 20 | 0.22 |
| Exposure to smoke, % | 13 | 20 | 0.11 |
| Family history of asthma, % | 0.89 | ||
| Neither parent | 68 | 64 | |
| Either mother or father | 27 | 30 | |
| Both parents | 4 | 4 | |
| Do not know/missing | 2 | 1 | |
| History of wheezing, % | 23 | 17 | 0.24 |
| History of eczema, % | 16 | 7 | 0.04 |
| History of intubation, % | 9 | 12 | 0.50 |
| Major, relevant, comorbid medical disorder, % | 20 | 24 | 0.46 |
| Current illness | |||
| When difficulty breathing began, preadmission, % | 0.63 | ||
| 1 day | 70 | 75 | |
| <1 day | 28 | 23 | |
| No difficulty preadmission | 2 | 3 | |
| Weight, lbs, median (IQR) | 12.3 (8.817.4) | 9.0 (6.613.2) | 0.001 |
| Temperature, F, median (IQR) | 99.5 (98.6100.6) | 99.4 (98.1100.4) | 0.06 |
| Pulse, beats per minute by age | 0.82 | ||
| Low | 0.3 | 0 | |
| Normal | 48 | 46 | |
| High | 51 | 54 | |
| Respiratory rate, breaths per minute, median (IQR) | 48 (4060) | 48 (3864) | 0.28 |
| Retractions, % | 0.001 | ||
| None | 22 | 25 | |
| Mild | 43 | 24 | |
| Moderate | 26 | 33 | |
| Severe | 4 | 12 | |
| Missing | 5 | 7 | |
| Oxygen saturation by pulse oximetry or ABG, % | 0.001 | ||
| <85 | 4 | 12 | |
| 8587.9 | 3 | 4 | |
| 8889.9 | 5 | 0 | |
| 9093.9 | 18 | 11 | |
| 94 | 72 | 73 | |
| Oral intake, % | <0.001 | ||
| Adequate | 45 | 22 | |
| Inadequate | 42 | 63 | |
| Missing | 13 | 14 | |
| Presence of apnea, % | 7 | 24 | <0.001 |
| RSV‐A, % | 44 | 41 | 0.54 |
| RSV‐B, % | 30 | 25 | 0.36 |
| HRV, % | 24 | 24 | 0.88 |
| Chest x‐ray results during ED/preadmission visit | |||
| Atelectasis | 12 | 13 | 0.77 |
| Infiltrate | 13 | 11 | 0.50 |
| Hyperinflated | 18 | 21 | 0.47 |
| Peribronchial cuffing/thickening | 23 | 17 | 0.32 |
| Normal | 14 | 16 | 0.75 |
| White blood count, median (IQR) | 11.2 (8.714.4) | 11.9 (9.214.4) | 0.60 |
| Platelet count, median (IQR) | 395 (317490) | 430 (299537) | 0.56 |
| Sodium, median (IQR) | 138 (136140) | 137 (135138) | 0.19 |
| Hospital length of stay, median (IQR) | 2 (14) | 4.5 (28) | <0.001 |
| One‐week follow‐up | |||
| Relapse within 24 hours of hospital discharge requiring hospital admission, % | 0.5 | 0 | 0.56 |
| Relapse within 7 days of hospital discharge requiring hospital admission, % | 1 | 0 | 0.35 |
On multivariable analysis (Table 2), independent risk factors for worsening after reaching the clinical improvement criteria were young age, preterm birth, and presenting to care with more severe bronchiolitis represented by severe retractions, inadequate oral intake, or apnea. To further evaluate the improvement criteria in the current analysis, multiple sensitivity analyses were conducted. The frequency of clinical worsening after reaching the improvement criteria was stable when we examined different RA02 criteria in sensitivity analyses: (1) excluding RA02 as a criterion for improvement: 90% met improvement criteria and 4% experienced clinical worsening, (2) changing the average RA02 threshold for clinical improvement to 94%: 62% met improvement criteria and 6% experienced clinical worsening, and (3) changing the average RA02 threshold for clinical improvement to 95%: 47% met improvement criteria and 5% experienced clinical worsening. Furthermore, stratifying by age <2 months and restricting to more stringent definitions of bronchiolitis (ie, age <1 year or age <1 year+no history of wheezing) also did not materially change the results (see Supporting Figure 1 in the online version of this article).
| Odds Ratio | 95% CI | P Value | |
|---|---|---|---|
| |||
| Age <2 months | 3.51 | 2.07‐5.94 | <0.001 |
| Gestational age <37 weeks | 1.94 | 1.13‐3.32 | 0.02 |
| Retractions | |||
| None | 1.30 | 0.80‐3.23 | 0.19 |
| Mild | 1.0 | Reference | |
| Moderate | 1.91 | 0.99‐3.71 | 0.06 |
| Severe | 5.55 | 2.1214.50 | <0.001 |
| Missing | 1.70 | 0.53‐5.42 | 0.37 |
| Oral intake | |||
| Adequate | 1.00 | Reference | |
| Inadequate | 2.54 | 1.39‐4.62 | 0.002 |
| Unknown/missing | 1.88 | 0.79‐4.44 | 0.15 |
| Presence of apnea | 2.87 | 1.45‐5.68 | 0.003 |
We compared the 214 children who were discharged prior to reaching clinical improvement with the 1702 children who reached the clinical improvement criteria. The 214 children were less likely to be age <2 months (22% vs 30%; P=0.02). These 2 groups (214 vs 1702) were similar with respect to severe retractions (2% vs 4%; P=0.13), median respiratory rate (48 vs 48; P=0.42), oxygen saturation <90% (15% vs 11%; P=0.07), inadequate oral intake (50% vs 43%; P=0.13), and rates of relapse events requiring rehospitalization within both 24 hours (0.6% vs 0.6%; P=0.88) and 7 days (1% vs 1%; P=0.90) of discharge.
DISCUSSION
In this large, multicenter, multiyear study of children hospitalized with bronchiolitis, we found that children present to a hospital in a relatively narrow time frame, but their time to recovery in the hospital is highly variable. Nonetheless, 96% of children continued to improve once they had: (1) improving or stable retractions rated as none/mild, (2) a decreasing or stable RR by age, (3) estimated average RAO2 saturation 90% and lowest RAO2 saturation of 88%, and (4) were hydrated. The 4% of children who worsened after clinically improving were more likely to be age <2 months, born <37 weeks, and present with more severe distress (ie, severe retractions, inadequate oral intake, or apnea). Based on the low risk of worsening after clinical improvement, especially among children admitted to the regular ward (2%), we believe these 4 clinical criteria could be used as discharge criteria for this common pediatric illness with a predominantly monophasic clinical course.
Variability in hospital LOS for children with bronchiolitis exists in the United States[3] and internationally.[4, 5] Cheung and colleagues analyzed administrative data from over 75,000 children admitted for bronchiolitis in England between April 2007 and March 2010 and found sixfold variation in LOS between sites. They concluded that this LOS variability was due in part to providers' clinical decision making.[5] Srivastava and colleagues[23] addressed variable clinician decision making in bronchiolitis and 10 other common pediatric conditions by embedding discharge criteria developed by expert consensus into admission order sets. They found that for children with bronchiolitis, the embedded discharge criteria reduced the median LOS from 1.91 to 1.87 days. In contrast to the single‐center data presented by White and colleagues,[24] the prospective, multicenter MARC‐30 data provide a clear understanding of the normal clinical course for children hospitalized with bronchiolitis, determine if children clinically worsen after clinical improvement, and provide data about discharge criteria for children hospitalized with bronchiolitis. Although there is a lack of rigorous published data, the lower tract symptoms of bronchiolitis (eg, cough, retractions) are said to peak on days 5 to 7 of illness and then gradually resolve.[25] In the present study, we found that the time from the onset of difficulty breathing until hospital admission is less variable than the time from the onset of difficulty breathing until either clinical improvement or discharge. Although 75% of children have clinically improved within 7.5 days of difficulty breathing based on the IQR results, the remaining 25% may have a more prolonged recovery in the hospital of up to 3 weeks. Interestingly, prolonged recovery times from bronchiolitis have also been noted in children presenting to the ED[26] and in an outpatient population.[27] It is unclear why 20% to 25% of children at different levels of severity of illness have prolonged recovery from bronchiolitis, but this group of children requires further investigation.
Given the variability of recovery times, clinicians may have difficulty knowing when a child is ready for hospital discharge. One of the main stumbling blocks for discharge readiness in children with bronchiolitis is the interpretation of the oxygen saturation value.[6, 8, 9, 20, 28] However, it should be considered that interpreting the oxygen saturation in a child who is clinically improving in the hospital setting is different than interpreting the oxygen saturation of a child in the ED or the clinic whose clinical course is less certain.[22] In the hospital setting, using the oxygen saturation value in in the AAP guideline,[9] 4% of children clinically worsened after they met the improvement criteria, a clinical pattern observed previously with supplemental oxygen.[28] This unpredictability may explain some of the variation in providers' clinical decision making.[5] The children who worsened, and therefore deserve more cautious discharge planning, were young (<2 months), premature (<37 weeks gestational age), and presented in more severe distress. Those children admitted to the ICU from the ED worsened more commonly than children admitted to the ward (19% vs 2%). Interestingly, the viral etiology of the child's bronchiolitis did not influence whether a child worsened after reaching the improvement criteria. Therefore, although children with RV bronchiolitis have a shorter hospital LOS than children with RSV bronchiolitis,[11] the pattern of recovery did not differ by viral etiology.
In addition to unsafe discharges, clinicians may be concerned about the possibility of readmissions. Although somewhat controversial, hospital readmission is being used as a quality of care metric.[29, 30, 31] One response to minimize readmissions would be for clinicians to observe children for longer than clinically indicated.[32] However, shorter LOS is not necessarily associated with increased readmission rates.[33] Given that the geometric mean of hospital charges per child with bronchiolitis increased from $6380 in 2000 to $8530 in 2009,[34] the potential for safely reducing hospital LOS by using the discharge criteria proposed in the current study instead of other criteria[8] may net substantial cost savings. Furthermore, reducing LOS would decrease the time children expose others to these respiratory viruses and possibly reduce medical errors.[35]
Our study has some potential limitations. Because the study participants were all hospitalized, these data do not inform admission or discharge decisions from either the ED or the clinic; but other data address those clinical scenarios.[22] Also, the 16 sites that participated in this study were large, urban teaching hospitals. Consequently, these results are not necessarily generalizable to smaller community hospitals. Although numerous data points were required to enter the analytic cohort, only 9% of the sample was excluded for missing data. There were 214 children who did not meet our improvement criteria by the time of discharge. Although the inability to include these children in the analysis may be seen as a limitation, this practice variability underscores the need for more data about discharging hospitalized children with bronchiolitis. Last, site teams reviewed medical records daily. More frequent recording of the clinical course would have yielded more granular data, but the current methodology replicates how data are generally presented during patient care rounds, when decisions about suitability for discharge are often considered.
CONCLUSION
We documented in this large multicenter study that most children hospitalized with bronchiolitis had a wide range of time to recovery, but the vast majority continued to improve once they reached the identified clinical criteria that predict a safe discharge to home. The children who worsened after clinical improvement were more likely to be younger, premature infants presenting in more severe distress. Although additional prospective validation of these hospital discharge criteria is warranted, these data may help clinicians make more evidence‐based discharge decisions for a common pediatric illness with high practice variation, both in the United States[3] and in other countries.[4, 5]
Acknowledgements
Collaborators in the MARC‐30 Study: Besh Barcega, MD, Loma Linda University Children's Hospital, Loma Linda, CA; John Cheng, MD, Children's Healthcare of Atlanta at Egleston, Atlanta, GA; Dorothy Damore, MD, New York Presbyterian Hospital‐Cornell, New York, NY; Carlos Delgado, MD, Children's Healthcare of Atlanta at Egleston, Atlanta, GA; Haitham Haddad, MD, Rainbow Babies & Children's Hospital, Cleveland, OH; Paul Hain, MD, Monroe Carell Jr. Children's Hospital at Vanderbilt, Nashville, TN; Frank LoVecchio, DO, Maricopa Medical Center, Phoenix, AZ; Charles Macias, MD MPH, Texas Children's Hospital, Houston, TX; Jonathan Mansbach, MD, MPH, Boston Children's Hospital, Boston, MA; Eugene Mowad, MD, Akron Children's Hospital, Akron, OH; Brian Pate, MD, Children's Mercy Hospital, Kansas City, MO; Mark Riederer, MD, Monroe Carell Jr. Children's Hospital at Vanderbilt, Nashville, TN; M. Jason Sanders, MD, Children's Memorial Hermann Hospital, Houston, TX; Alan R. Schroeder, MD, Santa Clara Valley Medical Center, San Jose, CA; Nikhil Shah, MD, New York Presbyterian Hospital‐Cornell, New York, NY; Michelle Stevenson, MD, MS, Kosair Children's Hospital, Louisville, KY; Erin Stucky Fisher, MD, Rady Children's Hospital, San Diego, CA; Stephen Teach, MD, MPH, Children's National Medical Center, Washington, DC; Lisa Zaoutis, MD, Children's Hospital of Philadelphia, Philadelphia, PA.
Disclosures: This study was supported by grants U01 AI‐67693 and K23 AI‐77801 from the National Institutes of Health (Bethesda, MD). The content of this manuscript is solely the responsibility of the authors and does not necessarily represent the official views of the National Institute of Allergy and Infectious Diseases or the National Institutes of Health. Drs. Mansbach and Piedra have provided consultation to Regeneron Pharmaceuticals. Otherwise, no authors report any potential conflicts of interest, including relevant financial interests, activities, relationships, and affiliations.
- , , , , . Infectious disease hospitalizations among infants in the United States. Pediatrics. 2008;121(2):244–252.
- . “A hospital is no place to be sick” Samuel Goldwyn (1882–1974). Arch Dis Child. 2009;94(8):565–566.
- , , , , , Variation in inpatient diagnostic testing and management of bronchiolitis. Pediatrics. 2005;115(4):878–884.
- , , , International variation in the management of infants hospitalized with respiratory syncytial virus. International RSV Study Group. Eur J Pediatr. 1998;157(3):215–220.
- , , , , . Population variation in admission rates and duration of inpatient stay for bronchiolitis in England. Arch Dis Child. 2013;98(1):57–59.
- , , , . Impact of pulse oximetry and oxygen therapy on length of stay in bronchiolitis hospitalizations. Arch Pediatr Adolesc Med. 2004;158(6):527–530.
- , , . Pulse oximetry in pediatric practice. Pediatrics. 2011;128(4):740–752.
- Scottish Intercollegiate Guidelines Network. Bronchiolitis in children (SIGN 91). In: NHS Quality Improvement Scotland. Edinburgh, Scotland: Scottish Intercollegiate Guidelines Network; 2006.
- , , , et al. Diagnosis and management of bronchiolitis. Pediatrics. 2006;118(4):1774–1793.
- , , , et al. Prospective multicenter study of children with bronchiolitis requiring mechanical ventilation. Pediatrics. 2012;130(3):e492–e500.
- , , , et al. Prospective multicenter study of viral etiology and hospital length of stay in children with severe bronchiolitis. Arch Pediatr Adolesc Med. 2012;166(8):700–706.
- , , , et al. Apnea in children hospitalized with bronchiolitis. Pediatrics. 2013;132(5):e1194–e1201.
- . Evaluation of the cardiovascular system: history and physical evaluation. In: Kliegman RM, Stanton BF, St. Geme JW III, Schor NF, Behrman RF, eds. Nelson Textbook of Pediatrics. Philadelphia, PA: Elsevier Saunders; 2011:1529–1536.
- , , , et al. Apnea in children hospitalized with bronchiolitis. Pediatrics. 2013;132(5):e1194–e1201.
- , , , et al. Respiratory viral infections in patients with chronic, obstructive pulmonary disease. J Infect. 2005;50(4):322–330.
- , , , . Evaluation of real‐time PCR for diagnosis of Bordetella pertussis infection. BMC Infect Dis. 2006;6:62.
- , , , , . Evaluation of three real‐time PCR assays for detection of Mycoplasma pneumoniae in an outbreak investigation. J Clin Microbiol. 2008;46(9):3116–3118.
- , , , et al. Normal ranges of heart rate and respiratory rate in children from birth to 18 years of age: a systematic review of observational studies. Lancet. 2011;377(9770):1011–1018.
- , , , , , . Development of heart and respiratory rate percentile curves for hospitalized children. Pediatrics. 2013;131(4):e1150–e1157.
- , . Effect of oxygen supplementation on length of stay for infants hospitalized with acute viral bronchiolitis. Pediatrics. 2008;121(3):470–475.
- , , , et al. Longitudinal assessment of hemoglobin oxygen saturation in healthy infants during the first 6 months of age. Collaborative Home Infant Monitoring Evaluation (CHIME) Study Group. J Pediatr. 1999;135(5):580–586.
- , , , et al. Prospective multicenter study of bronchiolitis: predicting safe discharges from the emergency department. Pediatrics. 2008;121(4):680–688.
- , , , et al. Delays in discharge in a tertiary care pediatric hospital. J Hosp Med. 2009;4(8):481–485.
- , , , et al. Using quality improvement to optimise paediatric discharge efficiency. BMJ Qual Saf. 2014;23(5):428–436.
- , . Bronchiolitis in infants and children: treatment; outcome; and prevention. In: Torchia M, ed. UpToDate. Alphen aan den Rijn, the Netherlands; Wolters Kluwer Health; 2013.
- , . Duration of illness in infants with bronchiolitis evaluated in the emergency department. Pediatrics. 2010;126(2):285–290.
- , , . Duration of illness in ambulatory children diagnosed with bronchiolitis. Arch Pediatr Adolesc Med. 2000;154(10):997–1000.
- , , , et al. A clinical pathway for bronchiolitis is effective in reducing readmission rates. J Pediatr. 2005;147(5):622–626.
- , , , et al. Measuring hospital quality using pediatric readmission and revisit rates. Pediatrics. 2013;132(3):429–436.
- , , , et al. Pediatric readmission prevalence and variability across hospitals. JAMA. 2013;309(4):372–380.
- , , , , , . Preventability of early readmissions at a children's hospital. Pediatrics. 2013;131(1):e171–e181.
- , . Hospital readmission: quality indicator or statistical inevitability? Pediatrics. 2013;132(3):569–570.
- , , , et al. Children's hospitals with shorter lengths of stay do not have higher readmission rates. J Pediatr. 2013;163(4):1034–1038.e1.
- , , , , . Trends in bronchiolitis hospitalizations in the United States, 2000–2009. Pediatrics. 2013;132(1):28–36.
- , , , . Preventable adverse events in infants hospitalized with bronchiolitis. Pediatrics. 2005;116(3):603–608.
© 2015 Society of Hospital Medicine
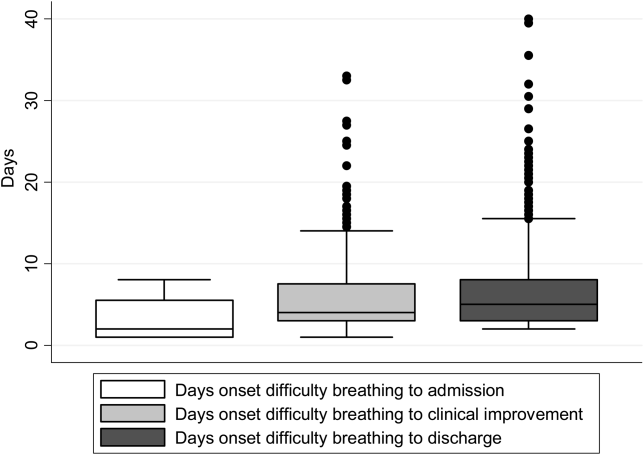
in Hospitalized Children
Clostridium difficile is the single most common cause of nosocomial diarrhea in both adults and children.[1, 2] C difficile infections (CDIs) can range from self‐limited diarrhea to severe pseudomembranous colitis. Though widely distributed in the environment, hospitals and child care facilities are major reservoirs for C difficile. Traditionally, hospitalization and antibiotic use have been the 2 major risk factors for acquiring CDI.
Recent studies suggest C difficile epidemiology is shifting. In 2005, the Centers for Disease Control and Prevention (CDC) reported CDIs in 33 otherwise low‐risk patients, 6 of whom were children.[3] Other studies have noted increasing incidence of pediatric CDIs,[4, 5, 6, 7] 1 identifying 43% with no prior antibiotic use.[4] This emerging data led to the recent American Academy of Pediatrics policy statement on pediatric CDIs.[8] Data regarding associated clinical risk factors of CDIs in pediatric patients in light of the changing epidemiology are limited. Only 1 recent study looked at 6 clinical factors and found that antibiotic use, history of solid organ transplantation, gastrointestinal (GI) devices, and acid suppressing medications increased risk for CDIs.[9]
Data regarding the source of these infections are also limited. Three pediatric studies evaluating source found a significant amount of community‐acquired disease (59%, 25%, and 19% of the study population, respectively).[4, 9, 10] However, only 1 of these studies provided clinical comparisons between community and hospital‐acquired cases.[10] To date, no study has examined a comprehensive list of potential risk factors that might differentiate hospitalized pediatric patients with CDIs from those with acute gastroenteritis (AGE).
PATIENTS AND METHODS
We conducted an investigator‐initiated, retrospective, case‐control study examining risk factors associated with CDIs in a hospitalized pediatric population at Rady Children's Hospital San Diego (RCHSD). Rady Children's is a tertiary‐care pediatric healthcare system and the sole pediatric referral center for San Diego, with a catchment of 850,000 children. RCHSD posts over 71,000 emergency department (ED) and 30,000 urgent care (UC) visits at 4 sites and over 15,000 admissions yearly. All system information is archived in 1 electronic database. We reviewed patient records for a 2‐year period from June 1, 2008 through May 31, 2010. The study protocol was reviewed and approved by the institutional review board at the University of California San Diego.
Cases of C difficile (CDs) included pediatric patients 18 years of age with all of the following: International Classification of Diseases, 9th Revision (ICD‐9) code for C difficile infection (08.45), a positive C difficile toxin A or B by enzyme immunoassay (EIA) (Meridian Bioscience, Inc., Cincinnati, OH), and the presence of diarrhea and/or abdominal pain. Randomly selected age‐matched controls from the same time period with a discharge diagnosis of AGE (APR‐DRG 249) and the presence of diarrhea served as controls (CTLs). In the 1 year age group, any patient with a positive C difficile toxin assay but no diagnosis of CDI was excluded from the CTL group to avoid potential confounding.
Records were reviewed for multiple potential risk factors based on limited past studies and other factors associated with CDI pathogenesis including age, race, ethnicity, antibiotic use within the previous 90 days (type, route, and duration), diarrhea type, abdominal pain, fever, proton pump inhibitor (PPI) use, sick contacts (diarrheal illness), recent travel, and hospitalization within the last 6 months. Diarrhea was defined as increase in stool frequency or volume. Past medical/surgical history abstracted included GI disease, past CDIs, abdominal surgery, immunodeficiency, renal disease, cardiac disease, nutritional deficiencies, and number of past hospitalizations (all cause). In addition, multiple factors during the hospital course were reviewed: length of stay (LOS), antibiotic therapy, diarrhea type, abdominal pain, fever, electrolyte levels, need for stool replacement fluid, and altered diet recommendations. Thirty‐day return to ED/UC or readmission and cause for the return were also retrieved on all patients. An objective data collection form was used, and all records were reviewed by 1 researcher (W.S.) with a second reviewer (E.F.) reviewing 20% of the charts, with 90% initial concordance. Consensus was reached on all elements abstracted.
Three additional subanalyses were completed. The first subanalysis compared antibiotic prophylaxis (defined as daily use of an antibiotic for >28 days) in CDs versus CTLs. We reviewed charts to ensure extended antibiotic use was for prophylaxis and not treatment. The second subanalysis compared CDs to those CTLs with a negative C difficile toxin assay. This was done to evaluate whether using this control group would highlight a different set of risk factors. The third subanalysis separated CDs into community‐acquired CD (CA‐CD) and hospital‐acquired CD (HA‐CD). We defined CA‐CD as any patient with symptoms either prior to or within the first 48 hours of the index admission and no past hospitalizations or with the last hospitalization >4 weeks prior to the index admission. Patients who developed symptoms at home or within 48 hours of the index admission, but had been hospitalized within the past 4 weeks, were defined as community‐onset HA‐CD. Patients who developed CDIs after 48 hours of the index admission were defined as hospital‐onset HA‐CD. These groupings are consistent with the CDI surveillance recommendations.[11]
All statistical analyses were performed with SPSS statistical software version 21.0 (SPSS Inc., Chicago, IL). Initial comparisons between CDs and CTLs were conducted using t tests for continuous variables and [2] tests for categorical variables. As CDI in infants is controversial, we analyzed our data with and without this cohort to eliminate extraneous, age‐related differences. After confirming that there were no issues with tolerance among possibly related factors, a saturated multiple logistic regression model was used to determine which of the independent variables identified in the initial comparison were predictors of having C difficile when controlling for factors associated with chronic disease.
RESULTS
Descriptive characteristics of the 134 CDs and the 274 CTLs are provided in Table 1. CDs and CTLs were similar in gender and race. More CDs had recent hospitalization and antibiotic exposure, with 24% of CDs versus 3% of CTLs treated with 2 or more antibiotics. Watery stools were the most common type of diarrhea in both CDs and CTLs, and bloody stools did not differ significantly between the 2 groups. However, abdominal pain on admission was more common in CTLs. CDs were more likely to have a history of GI disease, abdominal surgery, and specifically GI surgery. Immunodeficiency and PPI use were far more frequent in CDs, whereas exposure to sick contacts was more common in CTLs. Although CDs had an overall higher rate of ED/UC return visits and readmissions, the rate of return due to GI symptoms was similar in both groups. Reanalysis of the data with the <1‐year cohort removed showed persistent statistically significant findings in these variables. Hospital course, including electrolyte levels, need for intravenous fluids, or modified diets, did not significantly differ between CDs and CTLs (data not shown).
| Characteristics | Cases, N=134 (%) | Controls, N=274 (%) | P Value |
|---|---|---|---|
| |||
| Age, y | |||
| <1 | 28 (21) | 58 (21) | |
| 14 | 50 (37) | 100 (37) | |
| 59 | 21 (17) | 44 (16) | |
| 10 | 35 (26) | 72 (26) | |
| Sex, male | 68 (51) | 141 (52) | |
| Race | |||
| White | 63 (46) | 110 (40) | |
| Black | 6 (4) | 18 (7) | |
| Asian | 11 (8) | 15(6) | |
| Other | 50 (37) | 123 (45) | |
| Ethnicity, Hispanic | 70 (52) | 85 (31) | <0.001 |
| Diarrheaa | |||
| Admission | 50 (37) | 229 (83) | <0.001 |
| Bloody | 13/50 (26) | 29/229 (13) | |
| Watery | 37/50 (74) | 200/229 (87) | |
| Hospitalization | 128 (95) | 185 (68) | <0.001 |
| Bloody | 16/128 (13) | 10/185 (5) | |
| Watery | 112/128 (88) | 175/185 (95) | |
| Abdominal pain, admission | 30 (23) | 111 (41) | <0.001 |
| PPI use | 29 (22) | 18 (7) | <0.001 |
| Antibiotic use | |||
| Past 90 days | 88 (66) | 55 (20) | <0.001 |
| >2 antibiotics | 32 (24) | 9 (3) | <0.001 |
| Antibiotic type | |||
| Penicillin | 10 (11) | 19 (7) | 0.84 |
| Cephalosporins | 29 (21) | 19 (7) | <0.001 |
| Sulfa | 50 (37) | 12 (4) | <0.001 |
| Prophylaxis | 51 (37) | 10 (4) | <0.001 |
| Sick contacts | 4 (3) | 52 (19) | <0.001 |
| Hospitalization past 6 months | 88 (66) | 52 (19) | <0.001 |
| Past CDI | 12 (9) | 8 (4) | 0.013 |
| GI diseaseb | 41 (31) | 50 (18) | 0.005 |
| Immunodeficiencyc | 61 (46) | 17 (6) | <0.001 |
| Abdominal surgeryd | 41 (31) | 43 (16) | 0.001 |
| GI surgeryd | 32 (24) | 36 (13) | 0.01 |
| Returne | 41 (31) | 37 (14) | <0.001 |
| Due to GI symptoms | 12 (9) | 22 (8) | 0.85 |
Analysis of CDs without traditional risk factors was performed. To identify patients, we first selected the 46 (34%) without prior antibiotic exposure, then eliminated 19 who had been hospitalized within the past 6 months. Of the remaining 27 patients, 16 had a prolonged hospitalization (>5 days) at the time of CDI diagnosis. This left us with 11 patients (8% of CDs) without any common risk factors of antibiotic use, recent hospitalization, or prolonged hospitalization. None of these patients had a history of CDIs; 6 had significant medical histories. A detailed description of these 11 patients if provided in Table 2.
| Case No. | Age, y | Sex | Symptom Developmenta | Bloody Diarrhea | Past Medical History |
|---|---|---|---|---|---|
| |||||
| 37 | 10 | Female | 0 | Present | None |
| 49 | 14 | Female | 0 | None | History of bowel perforation, prior bowel resection, GT |
| 63 | 10 | Female | 0 | None | Status post‐renal transplant on antivirals only |
| 97 | 14 | Male | 0 | None | Polycystic kidney disease, on nasogastric feeds |
| 98 | <1 | Male | 25 days | None | Congenital heart disease |
| 101 | <1 | Male | 25 days | None | None |
| 102 | 10 | Male | 25 days | None | Neurofibromatosis type 2, GT |
| 107 | 59 | Female | 0 | Present | None |
| 108 | 10 | Male | 0 | None | Cerebral palsy, GT |
| 116 | 14 | Female | 25 days | None | None |
| 126 | 10 | Female | 12 days | None | None |
The first subanalysis evaluated antibiotic prophylaxis and found 51 (37%) in CDs versus 10 (4%) in CTLs. However, after controlling for immunodeficiency found in 40 of these CDs, we found no statistically significant difference. There were insufficient numbers of those on prophylaxis for other reasons (eg, vesicoureteral reflux) to analyze prophylaxis independently.
The second subanalysis compared controls with a negative C difficile toxin assay (21% of CTLs) to CDs on a number of clinical factors. Results were compared to the primary analysis. Many factors remained significant: antibiotic use in the past 90 days was still more frequent in CDs (66% vs 35%, P<0.001) as was immunodeficiency in CDs (46% vs 14%, P<0.001). However, immunodeficiency in this subset of the controls was represented over twice as often as that of the baseline CTLs (14% vs 6%), whereas GI disease was similar between the 2 groups (37% vs 31%, P<0.40). PPI use demonstrated a suggestive relationship (22% vs 11%, P<0.07).
Data for the third subanalysis between CA‐CD and HA‐CD are shown on Table 3. We initially compared CA‐CD, community‐onset HA‐CD, and hospital‐onset HA‐CD. However, when stratification was found to not be significant, we combined both categories of HA‐CD into 1 group. CA‐CD and HA‐CD did not demonstrate significant difference in antibiotic use, type, prophylaxis, history of abdominal surgery, immunodeficiency, or GI disease. Bloody stools were more common in CA‐CD.
| Characteristics | Community‐Acquired Cases, N=40, No. (%) | Hospital‐Acquired Cases, N=94, No. (%) | P Value |
|---|---|---|---|
| |||
| Age, y | |||
| <1 | 4 (10) | 24 (26) | |
| 14 | 17 (43) | 33 (35) | |
| 59 | 4 (10) | 18 (19) | |
| 10 | 15 (38) | 20 (21) | |
| Sex, male | 19 (48) | 49 (52) | 0.71 |
| Race, white | 19 (48) | 44 (47) | 0.99 |
| Ethnicity, Hispanic | 21 (53) | 49 (52) | 0.99 |
| Bloody diarrhea | 11 (28) | 4 (4) | <0.001 |
| Abdominal pain | 17 (43) | 24 (26) | 0.07 |
| PPI use | 12 (30) | 17 (18) | 0.17 |
| Antibiotic use | 27 (68) | 61 (65) | 0.84 |
| 2 antibiotics | 9 (23) | 23 (24) | 0.99 |
| Antibiotic type | |||
| Penicillin | 4 (10) | 6 (6) | 0.49 |
| Cephalosporin | 8 (20) | 21 (22) | 0.82 |
| Sulfa | 12 (30) | 38 (40) | 0.33 |
| Prophylaxis | 12 (30) | 39 (41) | 0.14 |
| Hospitalization, past 6 months | 17(43) | 71 (76) | <0.001 |
| Past CDI | 5 (13) | 7 (7) | 0.34 |
| GI diseasea | 16 (40) | 25 (26) | 0.15 |
| Immunodeficiencyb | 14 (35) | 47 (51) | 0.13 |
| Past abdominal surgery | 15 (38) | 26 (27) | 0.31 |
Odds ratio (OR) was calculated for association of individual risk factors for disease between CDs and CTLs (Table 4). Our model controlled for antibiotics use in the past 90 days, PPI use, treatment with 2 or more antibiotics, recent hospitalization, past history of CDIs, history of GI disease, history of abdominal surgery, and being immunodeficient. Antibiotic use within the past 90 days (OR: 2.80, P=0.001), recent hospitalization (OR: 2.33, P=0.007), and immunodeficiency (OR: 6.02, P<0.001) were associated with having C difficile. A similar logistic regression was conducted using a model comparing community‐ and hospital‐acquired cases, but no difference was found among risk factors.
| Odds Ratio | P Value | |
|---|---|---|
| ||
| Variable | ||
| Antibiotic use (90 days) | 7.69 | <0.001 |
| Proton pump inhibitors | 4.17 | <0.001 |
| >2 antibiotics | 9.26 | <0.001 |
| Hospitalization, past 6 months | 8.20 | <0.001 |
| History CDI | 3.27 | 0.012 |
| Gastrointestinal diseasea | 1.98 | 0.005 |
| Immunodeficiencyb | 12.66 | <0.001 |
| History abdominal surgery | 2.37 | 0.001 |
| Saturated logistic regression model | ||
| Antibiotics (90 days) | 2.80 | 0.001 |
| Proton pump inhibitors | 2.06 | 0.068 |
| >2 antibiotics | 2.23 | 0.092 |
| Hospitalization, past 6 months | 2.33 | 0.007 |
| History CDI | 1.03 | 0.956 |
| Gastrointestinal diseasea | 1.31 | 0.432 |
| Immunodeficiencyb | 6.02 | <0.001 |
| History abdominal surgery | 1.16 | 0.675 |
DISCUSSION/CONCLUSION
Our study shows that in addition to traditional risk factors of antibiotic use and recent hospitalization, immunodeficiency is a significant key factor associated with the diagnosis of CD. We found that traditional risk factors are not present in all hospitalized pediatric patients with CD. Our study does not support routine testing for C difficile in patients with diarrhea; however, it does suggest testing children with persistent or severe diarrheal symptoms even if traditional risk factors are absent, especially in the presence of immunodeficiency. The intervals we used for antibiotic exposure (past 90 days) and recent hospitalization (past 6 months) were longer compared to other studies,[9, 12] making our findings even more meaningful. Although some of the 11 patients without traditional risk factors had the presence of clinical factors shown in previous studies to be more common in patients with CDIs (GI disease, GI surgery, gastric tube/nasogastric feeding),[12, 13] we still find 4 patients >1 year of age with CDIs and no risk factors. This echoes the CDCs concerns of CDIs in low‐risk patients.[3]
Unlike clinical history, we found clinical symptoms and basic electrolyte testing may not help to distinguish CD from AGE patients. Although abdominal pain and diarrhea on admission were significantly more common in CTLs, when including abdominal pain and diarrhea during hospitalization, this finding was no longer valid. Additionally, although overall return rate was higher for CDs, the return rate for GI symptoms specifically was not different. The former was instead most often due to complications associated with comorbid conditions (GI disease, immunodeficiency). We did assess LOS for both CDs and CTLs; however, due to the high percentage of CDs with malignancy and other severe illnesses, it was difficult to ascertain the effect of CDIs on LOS. Severe CD is described as admission to the intensive care unit due to C difficile complications, colectomy, and death secondary to C difficile.[11] Although our study did not look at severe CDI as a direct outcome, we did not have any cases of colectomy or death secondary to CDI.
Two recent studies[9, 14] showed a high percentage of acid suppression medication use in patients with CDIs, with 1 study reporting 60% using PPIs and 21% using histamine blockers. Our study initially found similar high levels of PPI use among patients with CDIs; however, no significance was found when controlling for chronic disease. Prescriptions of PPIs for pediatric patients have risen dramatically recently,[15] as have reported all‐cause complications.[16] Further studies are needed to evaluate the independent risks of PPI use and CDIs in children. We were unable to analyze the influence of antibiotic use at prophylactic levels on CD rates, as the majority our CDs were on prophylaxis due to immunodeficiency.
Our study is unique in many ways. It is the first study to evaluate hospitalized pediatric patients with a comprehensive list of potential risk factors for CDIs, looking at clinical data on admission and during hospitalization. Additionally, as our site archives all clinical information in 1 database, we were able to identify ED/UC return and hospital readmissions. Although it is possible patients may have been evaluated outside of our healthcare system, this would be uncommon due to our referral patterns and UC sites. Our study used age‐matched patients with diarrheal symptoms and AGE discharge diagnosis as the control group. This differs from the 1 previous study looking at risk factors for CDIs in children.[9] In that study, researchers used patients with negative C difficile toxin testing as controls. Our subanalysis of CTLs with a negative toxin assay found much higher rates of underlying GI disease and immunodeficiency. Whereas previous studies compared patients already at high risk for CDI and assessed the differences between those with and without the infection, our study looked at what clinical factors distinguish CDI from AGE in a hospitalized population.
Similar to other pediatric studies, our study found a significant number of CA‐CD. However our study is 1 of the first to compare pediatric CA‐CD with HA‐CD based on clinical factors. Of the 9 demographic and clinical variables assessed, the only significant difference found was presence of bloody diarrhea. It may be that bloody diarrhea prompted the patients to be admitted as opposed to evaluated in the ambulatory setting.
Our study had some limitations. We used ICD‐9 discharge diagnosis codes to identify our patients; however, thorough chart review found clinical indices (diarrhea and abdominal pain) that correlated well with CDI diagnosis in addition to positive laboratory test. The EIA C difficile toxin assay was the standard of care during our study period. However, a recent study has shown false positives using EIA testing in pediatric populations.[17] In our primary analysis, we did not exclude patients with a past history of CDIs. Recurrent CDI is defined as having symptoms within 8 weeks after the primary infection. Of our patients with a history of CDIs, only 2 met this definition. Due to the small number, excluding these patients would not have changed our results significantly. Last, as with any retrospective study, we relied on caregiver reports regarding clinical history, especially in the CA‐CD cohort.
Based on our comprehensive analysis of pediatric patients, there should be increased suspicion for CDI in children with baseline immunodeficiency. Our study also supports testing children with persistent or severe GI symptoms even in the absence of traditional risk factors. These elements, coupled with history of antibiotic use, recent hospitalization, GI disease, and abdominal surgery could be used to create an assessment tool to assist clinicians in the diagnosis of CDIs in pediatric patients. A significant percentage of CDIs continues to be CA‐CD. HA‐CD and CA‐CD patients have similar clinical features. Further studies are needed to determine the effect of PPI use and prophylactic antibiotics on CDIs in children.
Disclosure
Nothing to report.
- , , , et al. Strategies to prevent clostridium difficile infections in acute care hospitals. Infect Control Hosp Epidemiol. 2008;29(suppl 1):S81–S92.
- , , , . The role of Clostridium difficile and viruses as causes of nosocomial diarrhea in children. Infect Control Hosp Epidemiol. 2002;23(11):660–664.
- Centers for Disease Control and Prevention. Severe Clostridium difficile‐associated disease in populations previously at low risk—four states, 2005. MMWR Morb Mortal Wkly Rep. 2005;54(47):1201–1205.
- , , , . Changing epidemiology of Clostridium difficile‐associated disease in children. Infect Control Hosp Epidemiol. 2007;28(11):1233–1235.
- , , . Clostridium difficile infections among hospitalized children, United States, 1997–2006. Emerg Infect Dis. 2010;16(4):604–609.
- , , , , , . Epidemiological features of Clostridium difficile‐associated disease among inpatients at children's hospitals in the United States, 2001–2006. Pediatrics. 2008;122(6):1266–1270.
- , , . Clostridium difficile infection in children. JAMA Pediatr. 2013;167(6):567–573.
- , ; Committee on Infectious Diseases; American Academy of Pediatrics. Clostridium difficile infection in infants and children. Pediatrics. 2013;131(1):196–200.
- , , , et al. Epidemiology and risk factors for Clostridium difficile infection in children. Pediatr Infect Dis J. 2011;30(7):580–584.
- , , , , , . Distinguishing community‐associated from hospital‐associated Clostridium difficile infections in children: implications for public health surveillance. Clin Infect Dis. 2013;57(12):1665–1672.
- , , , et al. Recommendations for surveillance of Clostridium difficile‐associated disease. Infect Control Hosp Epidemiol. 2007;28(2):140–145.
- , , , et al. Risk factors and outcomes associated with severe clostridium difficile infection in children. Pediatr Infect Dis J. 2012;31(2):134–138.
- , , , et al. Recurrence rate of clostridium difficile infection in hospitalized pediatric patients with inflammatory bowel disease. Inflamm Bowel Dis. 2011;17(1):50–55.
- , , . Proton pump inhibitor use and recurrent Clostridium difficile‐associated disease: a case‐control analysis matched by propensity score. J Clin Gastroenterol. 2012;46(5):397–400.
- , , , , . Proton pump inhibitor utilization patterns in infants. J Pediatr Gastroenterol Nutr. 2007;45(4):421–427.
- , . Long‐term proton pump inhibitor use in children: a retrospective review of safety. Dig Dis Sci. 2008;53(2):385–393.
- , , , et al. High proportion of false‐positive Clostridium difficile enzyme immunoassays for toxin A and B in pediatric patients. Infect Control Hosp Epidemiol. 2012;33(2):175–179.
Clostridium difficile is the single most common cause of nosocomial diarrhea in both adults and children.[1, 2] C difficile infections (CDIs) can range from self‐limited diarrhea to severe pseudomembranous colitis. Though widely distributed in the environment, hospitals and child care facilities are major reservoirs for C difficile. Traditionally, hospitalization and antibiotic use have been the 2 major risk factors for acquiring CDI.
Recent studies suggest C difficile epidemiology is shifting. In 2005, the Centers for Disease Control and Prevention (CDC) reported CDIs in 33 otherwise low‐risk patients, 6 of whom were children.[3] Other studies have noted increasing incidence of pediatric CDIs,[4, 5, 6, 7] 1 identifying 43% with no prior antibiotic use.[4] This emerging data led to the recent American Academy of Pediatrics policy statement on pediatric CDIs.[8] Data regarding associated clinical risk factors of CDIs in pediatric patients in light of the changing epidemiology are limited. Only 1 recent study looked at 6 clinical factors and found that antibiotic use, history of solid organ transplantation, gastrointestinal (GI) devices, and acid suppressing medications increased risk for CDIs.[9]
Data regarding the source of these infections are also limited. Three pediatric studies evaluating source found a significant amount of community‐acquired disease (59%, 25%, and 19% of the study population, respectively).[4, 9, 10] However, only 1 of these studies provided clinical comparisons between community and hospital‐acquired cases.[10] To date, no study has examined a comprehensive list of potential risk factors that might differentiate hospitalized pediatric patients with CDIs from those with acute gastroenteritis (AGE).
PATIENTS AND METHODS
We conducted an investigator‐initiated, retrospective, case‐control study examining risk factors associated with CDIs in a hospitalized pediatric population at Rady Children's Hospital San Diego (RCHSD). Rady Children's is a tertiary‐care pediatric healthcare system and the sole pediatric referral center for San Diego, with a catchment of 850,000 children. RCHSD posts over 71,000 emergency department (ED) and 30,000 urgent care (UC) visits at 4 sites and over 15,000 admissions yearly. All system information is archived in 1 electronic database. We reviewed patient records for a 2‐year period from June 1, 2008 through May 31, 2010. The study protocol was reviewed and approved by the institutional review board at the University of California San Diego.
Cases of C difficile (CDs) included pediatric patients 18 years of age with all of the following: International Classification of Diseases, 9th Revision (ICD‐9) code for C difficile infection (08.45), a positive C difficile toxin A or B by enzyme immunoassay (EIA) (Meridian Bioscience, Inc., Cincinnati, OH), and the presence of diarrhea and/or abdominal pain. Randomly selected age‐matched controls from the same time period with a discharge diagnosis of AGE (APR‐DRG 249) and the presence of diarrhea served as controls (CTLs). In the 1 year age group, any patient with a positive C difficile toxin assay but no diagnosis of CDI was excluded from the CTL group to avoid potential confounding.
Records were reviewed for multiple potential risk factors based on limited past studies and other factors associated with CDI pathogenesis including age, race, ethnicity, antibiotic use within the previous 90 days (type, route, and duration), diarrhea type, abdominal pain, fever, proton pump inhibitor (PPI) use, sick contacts (diarrheal illness), recent travel, and hospitalization within the last 6 months. Diarrhea was defined as increase in stool frequency or volume. Past medical/surgical history abstracted included GI disease, past CDIs, abdominal surgery, immunodeficiency, renal disease, cardiac disease, nutritional deficiencies, and number of past hospitalizations (all cause). In addition, multiple factors during the hospital course were reviewed: length of stay (LOS), antibiotic therapy, diarrhea type, abdominal pain, fever, electrolyte levels, need for stool replacement fluid, and altered diet recommendations. Thirty‐day return to ED/UC or readmission and cause for the return were also retrieved on all patients. An objective data collection form was used, and all records were reviewed by 1 researcher (W.S.) with a second reviewer (E.F.) reviewing 20% of the charts, with 90% initial concordance. Consensus was reached on all elements abstracted.
Three additional subanalyses were completed. The first subanalysis compared antibiotic prophylaxis (defined as daily use of an antibiotic for >28 days) in CDs versus CTLs. We reviewed charts to ensure extended antibiotic use was for prophylaxis and not treatment. The second subanalysis compared CDs to those CTLs with a negative C difficile toxin assay. This was done to evaluate whether using this control group would highlight a different set of risk factors. The third subanalysis separated CDs into community‐acquired CD (CA‐CD) and hospital‐acquired CD (HA‐CD). We defined CA‐CD as any patient with symptoms either prior to or within the first 48 hours of the index admission and no past hospitalizations or with the last hospitalization >4 weeks prior to the index admission. Patients who developed symptoms at home or within 48 hours of the index admission, but had been hospitalized within the past 4 weeks, were defined as community‐onset HA‐CD. Patients who developed CDIs after 48 hours of the index admission were defined as hospital‐onset HA‐CD. These groupings are consistent with the CDI surveillance recommendations.[11]
All statistical analyses were performed with SPSS statistical software version 21.0 (SPSS Inc., Chicago, IL). Initial comparisons between CDs and CTLs were conducted using t tests for continuous variables and [2] tests for categorical variables. As CDI in infants is controversial, we analyzed our data with and without this cohort to eliminate extraneous, age‐related differences. After confirming that there were no issues with tolerance among possibly related factors, a saturated multiple logistic regression model was used to determine which of the independent variables identified in the initial comparison were predictors of having C difficile when controlling for factors associated with chronic disease.
RESULTS
Descriptive characteristics of the 134 CDs and the 274 CTLs are provided in Table 1. CDs and CTLs were similar in gender and race. More CDs had recent hospitalization and antibiotic exposure, with 24% of CDs versus 3% of CTLs treated with 2 or more antibiotics. Watery stools were the most common type of diarrhea in both CDs and CTLs, and bloody stools did not differ significantly between the 2 groups. However, abdominal pain on admission was more common in CTLs. CDs were more likely to have a history of GI disease, abdominal surgery, and specifically GI surgery. Immunodeficiency and PPI use were far more frequent in CDs, whereas exposure to sick contacts was more common in CTLs. Although CDs had an overall higher rate of ED/UC return visits and readmissions, the rate of return due to GI symptoms was similar in both groups. Reanalysis of the data with the <1‐year cohort removed showed persistent statistically significant findings in these variables. Hospital course, including electrolyte levels, need for intravenous fluids, or modified diets, did not significantly differ between CDs and CTLs (data not shown).
| Characteristics | Cases, N=134 (%) | Controls, N=274 (%) | P Value |
|---|---|---|---|
| |||
| Age, y | |||
| <1 | 28 (21) | 58 (21) | |
| 14 | 50 (37) | 100 (37) | |
| 59 | 21 (17) | 44 (16) | |
| 10 | 35 (26) | 72 (26) | |
| Sex, male | 68 (51) | 141 (52) | |
| Race | |||
| White | 63 (46) | 110 (40) | |
| Black | 6 (4) | 18 (7) | |
| Asian | 11 (8) | 15(6) | |
| Other | 50 (37) | 123 (45) | |
| Ethnicity, Hispanic | 70 (52) | 85 (31) | <0.001 |
| Diarrheaa | |||
| Admission | 50 (37) | 229 (83) | <0.001 |
| Bloody | 13/50 (26) | 29/229 (13) | |
| Watery | 37/50 (74) | 200/229 (87) | |
| Hospitalization | 128 (95) | 185 (68) | <0.001 |
| Bloody | 16/128 (13) | 10/185 (5) | |
| Watery | 112/128 (88) | 175/185 (95) | |
| Abdominal pain, admission | 30 (23) | 111 (41) | <0.001 |
| PPI use | 29 (22) | 18 (7) | <0.001 |
| Antibiotic use | |||
| Past 90 days | 88 (66) | 55 (20) | <0.001 |
| >2 antibiotics | 32 (24) | 9 (3) | <0.001 |
| Antibiotic type | |||
| Penicillin | 10 (11) | 19 (7) | 0.84 |
| Cephalosporins | 29 (21) | 19 (7) | <0.001 |
| Sulfa | 50 (37) | 12 (4) | <0.001 |
| Prophylaxis | 51 (37) | 10 (4) | <0.001 |
| Sick contacts | 4 (3) | 52 (19) | <0.001 |
| Hospitalization past 6 months | 88 (66) | 52 (19) | <0.001 |
| Past CDI | 12 (9) | 8 (4) | 0.013 |
| GI diseaseb | 41 (31) | 50 (18) | 0.005 |
| Immunodeficiencyc | 61 (46) | 17 (6) | <0.001 |
| Abdominal surgeryd | 41 (31) | 43 (16) | 0.001 |
| GI surgeryd | 32 (24) | 36 (13) | 0.01 |
| Returne | 41 (31) | 37 (14) | <0.001 |
| Due to GI symptoms | 12 (9) | 22 (8) | 0.85 |
Analysis of CDs without traditional risk factors was performed. To identify patients, we first selected the 46 (34%) without prior antibiotic exposure, then eliminated 19 who had been hospitalized within the past 6 months. Of the remaining 27 patients, 16 had a prolonged hospitalization (>5 days) at the time of CDI diagnosis. This left us with 11 patients (8% of CDs) without any common risk factors of antibiotic use, recent hospitalization, or prolonged hospitalization. None of these patients had a history of CDIs; 6 had significant medical histories. A detailed description of these 11 patients if provided in Table 2.
| Case No. | Age, y | Sex | Symptom Developmenta | Bloody Diarrhea | Past Medical History |
|---|---|---|---|---|---|
| |||||
| 37 | 10 | Female | 0 | Present | None |
| 49 | 14 | Female | 0 | None | History of bowel perforation, prior bowel resection, GT |
| 63 | 10 | Female | 0 | None | Status post‐renal transplant on antivirals only |
| 97 | 14 | Male | 0 | None | Polycystic kidney disease, on nasogastric feeds |
| 98 | <1 | Male | 25 days | None | Congenital heart disease |
| 101 | <1 | Male | 25 days | None | None |
| 102 | 10 | Male | 25 days | None | Neurofibromatosis type 2, GT |
| 107 | 59 | Female | 0 | Present | None |
| 108 | 10 | Male | 0 | None | Cerebral palsy, GT |
| 116 | 14 | Female | 25 days | None | None |
| 126 | 10 | Female | 12 days | None | None |
The first subanalysis evaluated antibiotic prophylaxis and found 51 (37%) in CDs versus 10 (4%) in CTLs. However, after controlling for immunodeficiency found in 40 of these CDs, we found no statistically significant difference. There were insufficient numbers of those on prophylaxis for other reasons (eg, vesicoureteral reflux) to analyze prophylaxis independently.
The second subanalysis compared controls with a negative C difficile toxin assay (21% of CTLs) to CDs on a number of clinical factors. Results were compared to the primary analysis. Many factors remained significant: antibiotic use in the past 90 days was still more frequent in CDs (66% vs 35%, P<0.001) as was immunodeficiency in CDs (46% vs 14%, P<0.001). However, immunodeficiency in this subset of the controls was represented over twice as often as that of the baseline CTLs (14% vs 6%), whereas GI disease was similar between the 2 groups (37% vs 31%, P<0.40). PPI use demonstrated a suggestive relationship (22% vs 11%, P<0.07).
Data for the third subanalysis between CA‐CD and HA‐CD are shown on Table 3. We initially compared CA‐CD, community‐onset HA‐CD, and hospital‐onset HA‐CD. However, when stratification was found to not be significant, we combined both categories of HA‐CD into 1 group. CA‐CD and HA‐CD did not demonstrate significant difference in antibiotic use, type, prophylaxis, history of abdominal surgery, immunodeficiency, or GI disease. Bloody stools were more common in CA‐CD.
| Characteristics | Community‐Acquired Cases, N=40, No. (%) | Hospital‐Acquired Cases, N=94, No. (%) | P Value |
|---|---|---|---|
| |||
| Age, y | |||
| <1 | 4 (10) | 24 (26) | |
| 14 | 17 (43) | 33 (35) | |
| 59 | 4 (10) | 18 (19) | |
| 10 | 15 (38) | 20 (21) | |
| Sex, male | 19 (48) | 49 (52) | 0.71 |
| Race, white | 19 (48) | 44 (47) | 0.99 |
| Ethnicity, Hispanic | 21 (53) | 49 (52) | 0.99 |
| Bloody diarrhea | 11 (28) | 4 (4) | <0.001 |
| Abdominal pain | 17 (43) | 24 (26) | 0.07 |
| PPI use | 12 (30) | 17 (18) | 0.17 |
| Antibiotic use | 27 (68) | 61 (65) | 0.84 |
| 2 antibiotics | 9 (23) | 23 (24) | 0.99 |
| Antibiotic type | |||
| Penicillin | 4 (10) | 6 (6) | 0.49 |
| Cephalosporin | 8 (20) | 21 (22) | 0.82 |
| Sulfa | 12 (30) | 38 (40) | 0.33 |
| Prophylaxis | 12 (30) | 39 (41) | 0.14 |
| Hospitalization, past 6 months | 17(43) | 71 (76) | <0.001 |
| Past CDI | 5 (13) | 7 (7) | 0.34 |
| GI diseasea | 16 (40) | 25 (26) | 0.15 |
| Immunodeficiencyb | 14 (35) | 47 (51) | 0.13 |
| Past abdominal surgery | 15 (38) | 26 (27) | 0.31 |
Odds ratio (OR) was calculated for association of individual risk factors for disease between CDs and CTLs (Table 4). Our model controlled for antibiotics use in the past 90 days, PPI use, treatment with 2 or more antibiotics, recent hospitalization, past history of CDIs, history of GI disease, history of abdominal surgery, and being immunodeficient. Antibiotic use within the past 90 days (OR: 2.80, P=0.001), recent hospitalization (OR: 2.33, P=0.007), and immunodeficiency (OR: 6.02, P<0.001) were associated with having C difficile. A similar logistic regression was conducted using a model comparing community‐ and hospital‐acquired cases, but no difference was found among risk factors.
| Odds Ratio | P Value | |
|---|---|---|
| ||
| Variable | ||
| Antibiotic use (90 days) | 7.69 | <0.001 |
| Proton pump inhibitors | 4.17 | <0.001 |
| >2 antibiotics | 9.26 | <0.001 |
| Hospitalization, past 6 months | 8.20 | <0.001 |
| History CDI | 3.27 | 0.012 |
| Gastrointestinal diseasea | 1.98 | 0.005 |
| Immunodeficiencyb | 12.66 | <0.001 |
| History abdominal surgery | 2.37 | 0.001 |
| Saturated logistic regression model | ||
| Antibiotics (90 days) | 2.80 | 0.001 |
| Proton pump inhibitors | 2.06 | 0.068 |
| >2 antibiotics | 2.23 | 0.092 |
| Hospitalization, past 6 months | 2.33 | 0.007 |
| History CDI | 1.03 | 0.956 |
| Gastrointestinal diseasea | 1.31 | 0.432 |
| Immunodeficiencyb | 6.02 | <0.001 |
| History abdominal surgery | 1.16 | 0.675 |
DISCUSSION/CONCLUSION
Our study shows that in addition to traditional risk factors of antibiotic use and recent hospitalization, immunodeficiency is a significant key factor associated with the diagnosis of CD. We found that traditional risk factors are not present in all hospitalized pediatric patients with CD. Our study does not support routine testing for C difficile in patients with diarrhea; however, it does suggest testing children with persistent or severe diarrheal symptoms even if traditional risk factors are absent, especially in the presence of immunodeficiency. The intervals we used for antibiotic exposure (past 90 days) and recent hospitalization (past 6 months) were longer compared to other studies,[9, 12] making our findings even more meaningful. Although some of the 11 patients without traditional risk factors had the presence of clinical factors shown in previous studies to be more common in patients with CDIs (GI disease, GI surgery, gastric tube/nasogastric feeding),[12, 13] we still find 4 patients >1 year of age with CDIs and no risk factors. This echoes the CDCs concerns of CDIs in low‐risk patients.[3]
Unlike clinical history, we found clinical symptoms and basic electrolyte testing may not help to distinguish CD from AGE patients. Although abdominal pain and diarrhea on admission were significantly more common in CTLs, when including abdominal pain and diarrhea during hospitalization, this finding was no longer valid. Additionally, although overall return rate was higher for CDs, the return rate for GI symptoms specifically was not different. The former was instead most often due to complications associated with comorbid conditions (GI disease, immunodeficiency). We did assess LOS for both CDs and CTLs; however, due to the high percentage of CDs with malignancy and other severe illnesses, it was difficult to ascertain the effect of CDIs on LOS. Severe CD is described as admission to the intensive care unit due to C difficile complications, colectomy, and death secondary to C difficile.[11] Although our study did not look at severe CDI as a direct outcome, we did not have any cases of colectomy or death secondary to CDI.
Two recent studies[9, 14] showed a high percentage of acid suppression medication use in patients with CDIs, with 1 study reporting 60% using PPIs and 21% using histamine blockers. Our study initially found similar high levels of PPI use among patients with CDIs; however, no significance was found when controlling for chronic disease. Prescriptions of PPIs for pediatric patients have risen dramatically recently,[15] as have reported all‐cause complications.[16] Further studies are needed to evaluate the independent risks of PPI use and CDIs in children. We were unable to analyze the influence of antibiotic use at prophylactic levels on CD rates, as the majority our CDs were on prophylaxis due to immunodeficiency.
Our study is unique in many ways. It is the first study to evaluate hospitalized pediatric patients with a comprehensive list of potential risk factors for CDIs, looking at clinical data on admission and during hospitalization. Additionally, as our site archives all clinical information in 1 database, we were able to identify ED/UC return and hospital readmissions. Although it is possible patients may have been evaluated outside of our healthcare system, this would be uncommon due to our referral patterns and UC sites. Our study used age‐matched patients with diarrheal symptoms and AGE discharge diagnosis as the control group. This differs from the 1 previous study looking at risk factors for CDIs in children.[9] In that study, researchers used patients with negative C difficile toxin testing as controls. Our subanalysis of CTLs with a negative toxin assay found much higher rates of underlying GI disease and immunodeficiency. Whereas previous studies compared patients already at high risk for CDI and assessed the differences between those with and without the infection, our study looked at what clinical factors distinguish CDI from AGE in a hospitalized population.
Similar to other pediatric studies, our study found a significant number of CA‐CD. However our study is 1 of the first to compare pediatric CA‐CD with HA‐CD based on clinical factors. Of the 9 demographic and clinical variables assessed, the only significant difference found was presence of bloody diarrhea. It may be that bloody diarrhea prompted the patients to be admitted as opposed to evaluated in the ambulatory setting.
Our study had some limitations. We used ICD‐9 discharge diagnosis codes to identify our patients; however, thorough chart review found clinical indices (diarrhea and abdominal pain) that correlated well with CDI diagnosis in addition to positive laboratory test. The EIA C difficile toxin assay was the standard of care during our study period. However, a recent study has shown false positives using EIA testing in pediatric populations.[17] In our primary analysis, we did not exclude patients with a past history of CDIs. Recurrent CDI is defined as having symptoms within 8 weeks after the primary infection. Of our patients with a history of CDIs, only 2 met this definition. Due to the small number, excluding these patients would not have changed our results significantly. Last, as with any retrospective study, we relied on caregiver reports regarding clinical history, especially in the CA‐CD cohort.
Based on our comprehensive analysis of pediatric patients, there should be increased suspicion for CDI in children with baseline immunodeficiency. Our study also supports testing children with persistent or severe GI symptoms even in the absence of traditional risk factors. These elements, coupled with history of antibiotic use, recent hospitalization, GI disease, and abdominal surgery could be used to create an assessment tool to assist clinicians in the diagnosis of CDIs in pediatric patients. A significant percentage of CDIs continues to be CA‐CD. HA‐CD and CA‐CD patients have similar clinical features. Further studies are needed to determine the effect of PPI use and prophylactic antibiotics on CDIs in children.
Disclosure
Nothing to report.
- , , , et al. Strategies to prevent clostridium difficile infections in acute care hospitals. Infect Control Hosp Epidemiol. 2008;29(suppl 1):S81–S92.
- , , , . The role of Clostridium difficile and viruses as causes of nosocomial diarrhea in children. Infect Control Hosp Epidemiol. 2002;23(11):660–664.
- Centers for Disease Control and Prevention. Severe Clostridium difficile‐associated disease in populations previously at low risk—four states, 2005. MMWR Morb Mortal Wkly Rep. 2005;54(47):1201–1205.
- , , , . Changing epidemiology of Clostridium difficile‐associated disease in children. Infect Control Hosp Epidemiol. 2007;28(11):1233–1235.
- , , . Clostridium difficile infections among hospitalized children, United States, 1997–2006. Emerg Infect Dis. 2010;16(4):604–609.
- , , , , , . Epidemiological features of Clostridium difficile‐associated disease among inpatients at children's hospitals in the United States, 2001–2006. Pediatrics. 2008;122(6):1266–1270.
- , , . Clostridium difficile infection in children. JAMA Pediatr. 2013;167(6):567–573.
- , ; Committee on Infectious Diseases; American Academy of Pediatrics. Clostridium difficile infection in infants and children. Pediatrics. 2013;131(1):196–200.
- , , , et al. Epidemiology and risk factors for Clostridium difficile infection in children. Pediatr Infect Dis J. 2011;30(7):580–584.
- , , , , , . Distinguishing community‐associated from hospital‐associated Clostridium difficile infections in children: implications for public health surveillance. Clin Infect Dis. 2013;57(12):1665–1672.
- , , , et al. Recommendations for surveillance of Clostridium difficile‐associated disease. Infect Control Hosp Epidemiol. 2007;28(2):140–145.
- , , , et al. Risk factors and outcomes associated with severe clostridium difficile infection in children. Pediatr Infect Dis J. 2012;31(2):134–138.
- , , , et al. Recurrence rate of clostridium difficile infection in hospitalized pediatric patients with inflammatory bowel disease. Inflamm Bowel Dis. 2011;17(1):50–55.
- , , . Proton pump inhibitor use and recurrent Clostridium difficile‐associated disease: a case‐control analysis matched by propensity score. J Clin Gastroenterol. 2012;46(5):397–400.
- , , , , . Proton pump inhibitor utilization patterns in infants. J Pediatr Gastroenterol Nutr. 2007;45(4):421–427.
- , . Long‐term proton pump inhibitor use in children: a retrospective review of safety. Dig Dis Sci. 2008;53(2):385–393.
- , , , et al. High proportion of false‐positive Clostridium difficile enzyme immunoassays for toxin A and B in pediatric patients. Infect Control Hosp Epidemiol. 2012;33(2):175–179.
© 2013 Society of Hospital Medicine