User login
Bronchiolitis and Discharge Criteria
Although bronchiolitis is the leading cause of hospitalization for US infants,[1] there is a lack of basic prospective data about the expected inpatient clinical course and ongoing uncertainty about when a hospitalized child is ready for discharge to home.[2] This lack of data about children's readiness for discharge may result in variable hospital length‐of‐stay (LOS).[3, 4, 5]
One specific source of variability in discharge readiness and LOS variability may be the lack of consensus about safe threshold oxygen saturation values for discharge in children hospitalized with bronchiolitis.[6, 7] In 2006, the Scottish Intercollegiate Guidelines Network recommended a discharge room air oxygen (RAO2) saturation threshold of 95%.[8] The same year, the American Academy of Pediatrics (AAP) bronchiolitis clinical practice guideline stated that oxygen is not needed for children with RAO2 saturations 90% who are feeding well and have minimal respiratory distress.[9] There is a need for prospective studies to help clinicians make evidenced‐based discharge decisions for this common condition.
We performed a prospective, multicenter, multiyear study[10, 11, 12] to examine the typical inpatient clinical course of and to develop hospital discharge guidelines for children age <2 years hospitalized with bronchiolitis. We hypothesized that children would not worsen clinically and would be safe to discharge home once their respiratory status improved and they were able to remain hydrated.
METHODS
Study Design and Population
We conducted a prospective, multicenter cohort study for 3 consecutive years during the 2007 to 2010 winter seasons, as part of the Multicenter Airway Research Collaboration (MARC), a program of the Emergency Medicine Network (
All patients were treated at the discretion of the treating physician. Inclusion criteria were an attending physician's diagnosis of bronchiolitis, age <2 years, and the ability of the parent/guardian to give informed consent. The exclusion criteria were previous enrollment and transfer to a participating hospital >48 hours after the original admission time. Therefore, children with comorbid conditions were included in this study. All consent and data forms were translated into Spanish. The institutional review board at each of the 16 participating hospitals approved the study.
Of the 2207 enrolled children, we excluded 109 (5%) children with a hospital LOS <1 day due to inadequate time to capture the required data for the present analysis. Among the 2098 remaining children, 1916 (91%) had daily inpatient data on all factors used to define clinical improvement and clinical worsening. Thus, the analytic cohort was comprised of 1916 children hospitalized for bronchiolitis.
Data Collection
Investigators conducted detailed structured interviews. Chart reviews were conducted to obtain preadmission and daily hospital clinical data including respiratory rates, daily respiratory rate trends, degree of retractions, oxygen saturation, daily oxygen saturation trends, medical management, and disposition. These data were manually reviewed, and site investigators were queried about missing data and discrepancies. A follow‐up telephone interview was conducted with families 1 week after discharge to examine relapse events at both 24 hours and 7 days.
We used the question: How long ago did the following symptoms [eg, difficulty breathing] begin [for the] current illness? to estimate the onset of the current illness. Pulse was categorized as low, normal, or high based on age‐related heart rate values.[13] Presence of apnea was recorded daily by site investigators.[14]
Nasopharyngeal Aspirate Collection and Virology Testing
As described previously, site teams used a standardized protocol to collect nasopharyngeal aspirates,[11] which were tested for respiratory syncytial virus (RSV) types A and B; rhinovirus (RV); parainfluenza virus types 1, 2, and 3; influenza virus types A and B; 2009 novel H1N1; human metapneumovirus; coronaviruses NL‐63, HKU1, OC43, and 229E; enterovirus, and adenovirus using polymerase chain reaction.[11, 15, 16, 17]
Defining Clinical Improvement and Worsening
Clinical improvement criteria were based on the 2006 AAP guidelines.[9] For respiratory rate and oxygen saturation, clinicians estimated average daily respiratory rate and oxygen saturation based on the recorded readings from the previous 24 hours. This estimation reflects the process clinicians use when rounding on their hospitalized patients, and thus may be more similar to standard clinical practice than a calculated mean. The respiratory rate criteria are adjusted for age.[18, 19] For daily estimated average oxygen saturation we used the AAP criteria of RAO2 saturation of 90%. Considering that oxygen saturation is the main determinant of LOS,[20] healthy infants age <6 months may have transient oxygen saturations of around 80%,[21] and that errors in estimation may occur, we included a lowest RAO2 of 88% in our improvement criteria. By combining the dichotomized estimated oxygen saturation (90% or not) with the lower limit of 88%, there was little room for erroneous conclusions. A child was considered clinically improved on the earliest date he/she met all of the following criteria: (1) none or mild retractions and improved or stable retractions compared with the previous inpatient day; (2) daily estimated average respiratory rate (RR) <60 breaths per minute for age <6 months, <55 breaths/minute for age 6 to 11 months, and <45 breaths/minute for age 12 months with a decreasing or stable trend over the course of the current day; (3) daily estimated average RAO2 saturation 90%, lowest RAO2 saturation 88%[21]; and (4) not receiving intravenous (IV) fluids or for children receiving IV fluids a clinician report of the child maintaining oral hydration. Children who reached the clinical improvement criteria were considered clinically worse if they required intensive care or had the inverse of 1 of the improvement criteria: moderate/severe retractions that were worse compared with the previous inpatient day, daily average RR 60 with an increasing trend over the current day, need for oxygen, or need for IV fluids.
Statistical Analyses
All analyses were performed using Stata 12.0 (StataCorp, College Station, TX). Data are presented as proportions with 95% confidence intervals (95% CIs), means with standard deviations, and medians with interquartile ranges (IQR). To examine potential factors associated with clinical worsening after reaching clinical improvement, we used 2, Fisher exact, Student t test, and Kruskall‐Wallis tests, as appropriate.
Adjusted analyses used generalized linear mixed models with a logit link to identify independent risk factors for worsening after reaching clinical improvement. Fixed effects for patient‐level factors and a random site effect were used. Factors were tested for inclusion in the multivariable model if they were found to be associated with worsening in unadjusted analyses (P<0.20) or were considered clinically important. Results are reported as odds ratios with 95% CIs.
We performed several sensitivity analyses to evaluate these improvement criteria: (1) we excluded the lowest RAO2 saturation requirement of 88%, (2) we examined a 94% daily estimated average RAO2 saturation threshold,[22] (3) we examined a 95% daily estimated average RAO2 saturation threshold,[8] and (4) we examined children age <12 months with no history of wheeze.
RESULTS
There were 1916 children hospitalized with bronchiolitis with data on all factors used to define clinical improvement and clinical worsening. The median number of days from the beginning of difficulty breathing until admission was 2 days (IQR, 15.5 days; range, 18 days) and from the beginning of difficulty breathing until clinical improvement was 4 days (IQR, 37.5 days; range, 133 days) (Figure 1). The variance for days to admission was significantly less than the variance for days to clinical improvement (P<0.001).

In this observational study, clinicians discharged 214 (11%) of the 1916 children before meeting the definition of clinical improvement. Thus, 1702 (89%; 95% CI: 87%‐90%) children reached the clinical improvement criteria, had a LOS >1 day, and had data on all factors (Figure 2).
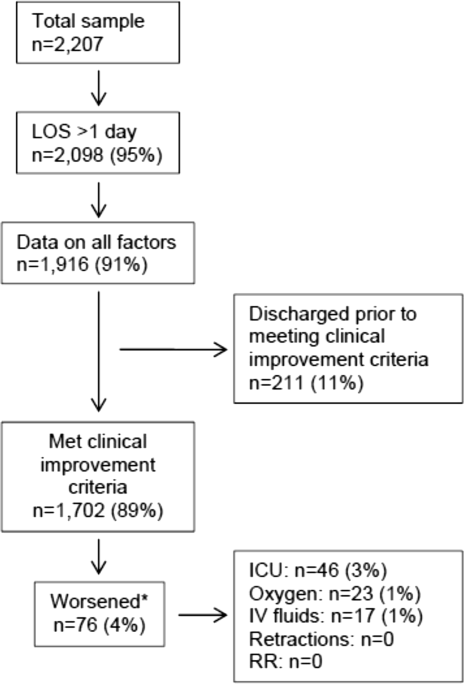
Of the 1702 children who met the clinical improvement criteria, there were 76 children (4%; 95% CI: 3%5%) who worsened (Figure 2). The worsening occurred within a median of 1 day (IQR, 13 days) of clinical improvement. Forty‐six (3%) of the children required transfer to the ICU (1 required intubation, 1 required continuous positive airway pressure, and 4 had apnea), 23 (1%) required oxygen, and 17 (1%) required IV fluids. Eight percent of children met multiple criteria for worsening. A comparison between children who did and did not worsen is shown in Table 1. In general, children who worsened after improvement were younger and born earlier. These children also presented in more severe respiratory distress, had moderate or severe retractions, oxygen saturation <85% at hospitalization, inadequate oral intake, and apnea documented during the hospitalization. Neither viral etiology nor site of care influenced whether the children worsened after improving. However, stratified analysis of children based on initial location of admission (ie, ICU or ward) showed that among the children admitted to the ICU from the emergency department (ED), 89% met the improvement criteria and 19% clinically worsened. In contrast, among children admitted to the ward from the ED, 89% met the improvement criteria, and only 2% clinically worsened. Stratified multivariable models based on the initial location of admission from the ED (ie, ICU or ward) were not possible due to small sample sizes after stratification. None of these children had relapse events requiring rehospitalization within either 24 hours or 7 days of discharge.
| Did Not Worsen, n=1,626 | Worsened, n=76 | P Value | |
|---|---|---|---|
| |||
| Demographic characteristics | |||
| Age <2 months, % | 29 | 57 | <0.001 |
| Month of birth, % | 0.02 | ||
| OctoberMarch | 61 | 75 | |
| AprilSeptember | 39 | 25 | |
| Sex, % | 0.51 | ||
| Male | 59 | 55 | |
| Female | 41 | 45 | |
| Race, % | 0.050 | ||
| White | 63 | 58 | |
| Black | 23 | 34 | |
| Other or missing | 14 | 8 | |
| Hispanic ethnicity, % | 37 | 22 | 0.01 |
| Insurance, % | 0.87 | ||
| Nonprivate | 68 | 67 | |
| Private | 32 | 33 | |
| Medical history | |||
| Gestational age <37 weeks, % | 23 | 39 | 0.002 |
| Birth weight, % | 0.52 | ||
| <5 lbs | 13 | 12 | |
| 5 lbs | 34 | 41 | |
| 7 lbs | 53 | 47 | |
| Mother's age, median (IQR) | 27 (2333) | 27 (2233) | 0.54 |
| Is or was breastfed, % | 61 | 51 | 0.10 |
| Smoked during pregnancy, % | 15 | 20 | 0.22 |
| Exposure to smoke, % | 13 | 20 | 0.11 |
| Family history of asthma, % | 0.89 | ||
| Neither parent | 68 | 64 | |
| Either mother or father | 27 | 30 | |
| Both parents | 4 | 4 | |
| Do not know/missing | 2 | 1 | |
| History of wheezing, % | 23 | 17 | 0.24 |
| History of eczema, % | 16 | 7 | 0.04 |
| History of intubation, % | 9 | 12 | 0.50 |
| Major, relevant, comorbid medical disorder, % | 20 | 24 | 0.46 |
| Current illness | |||
| When difficulty breathing began, preadmission, % | 0.63 | ||
| 1 day | 70 | 75 | |
| <1 day | 28 | 23 | |
| No difficulty preadmission | 2 | 3 | |
| Weight, lbs, median (IQR) | 12.3 (8.817.4) | 9.0 (6.613.2) | 0.001 |
| Temperature, F, median (IQR) | 99.5 (98.6100.6) | 99.4 (98.1100.4) | 0.06 |
| Pulse, beats per minute by age | 0.82 | ||
| Low | 0.3 | 0 | |
| Normal | 48 | 46 | |
| High | 51 | 54 | |
| Respiratory rate, breaths per minute, median (IQR) | 48 (4060) | 48 (3864) | 0.28 |
| Retractions, % | 0.001 | ||
| None | 22 | 25 | |
| Mild | 43 | 24 | |
| Moderate | 26 | 33 | |
| Severe | 4 | 12 | |
| Missing | 5 | 7 | |
| Oxygen saturation by pulse oximetry or ABG, % | 0.001 | ||
| <85 | 4 | 12 | |
| 8587.9 | 3 | 4 | |
| 8889.9 | 5 | 0 | |
| 9093.9 | 18 | 11 | |
| 94 | 72 | 73 | |
| Oral intake, % | <0.001 | ||
| Adequate | 45 | 22 | |
| Inadequate | 42 | 63 | |
| Missing | 13 | 14 | |
| Presence of apnea, % | 7 | 24 | <0.001 |
| RSV‐A, % | 44 | 41 | 0.54 |
| RSV‐B, % | 30 | 25 | 0.36 |
| HRV, % | 24 | 24 | 0.88 |
| Chest x‐ray results during ED/preadmission visit | |||
| Atelectasis | 12 | 13 | 0.77 |
| Infiltrate | 13 | 11 | 0.50 |
| Hyperinflated | 18 | 21 | 0.47 |
| Peribronchial cuffing/thickening | 23 | 17 | 0.32 |
| Normal | 14 | 16 | 0.75 |
| White blood count, median (IQR) | 11.2 (8.714.4) | 11.9 (9.214.4) | 0.60 |
| Platelet count, median (IQR) | 395 (317490) | 430 (299537) | 0.56 |
| Sodium, median (IQR) | 138 (136140) | 137 (135138) | 0.19 |
| Hospital length of stay, median (IQR) | 2 (14) | 4.5 (28) | <0.001 |
| One‐week follow‐up | |||
| Relapse within 24 hours of hospital discharge requiring hospital admission, % | 0.5 | 0 | 0.56 |
| Relapse within 7 days of hospital discharge requiring hospital admission, % | 1 | 0 | 0.35 |
On multivariable analysis (Table 2), independent risk factors for worsening after reaching the clinical improvement criteria were young age, preterm birth, and presenting to care with more severe bronchiolitis represented by severe retractions, inadequate oral intake, or apnea. To further evaluate the improvement criteria in the current analysis, multiple sensitivity analyses were conducted. The frequency of clinical worsening after reaching the improvement criteria was stable when we examined different RA02 criteria in sensitivity analyses: (1) excluding RA02 as a criterion for improvement: 90% met improvement criteria and 4% experienced clinical worsening, (2) changing the average RA02 threshold for clinical improvement to 94%: 62% met improvement criteria and 6% experienced clinical worsening, and (3) changing the average RA02 threshold for clinical improvement to 95%: 47% met improvement criteria and 5% experienced clinical worsening. Furthermore, stratifying by age <2 months and restricting to more stringent definitions of bronchiolitis (ie, age <1 year or age <1 year+no history of wheezing) also did not materially change the results (see Supporting Figure 1 in the online version of this article).
| Odds Ratio | 95% CI | P Value | |
|---|---|---|---|
| |||
| Age <2 months | 3.51 | 2.07‐5.94 | <0.001 |
| Gestational age <37 weeks | 1.94 | 1.13‐3.32 | 0.02 |
| Retractions | |||
| None | 1.30 | 0.80‐3.23 | 0.19 |
| Mild | 1.0 | Reference | |
| Moderate | 1.91 | 0.99‐3.71 | 0.06 |
| Severe | 5.55 | 2.1214.50 | <0.001 |
| Missing | 1.70 | 0.53‐5.42 | 0.37 |
| Oral intake | |||
| Adequate | 1.00 | Reference | |
| Inadequate | 2.54 | 1.39‐4.62 | 0.002 |
| Unknown/missing | 1.88 | 0.79‐4.44 | 0.15 |
| Presence of apnea | 2.87 | 1.45‐5.68 | 0.003 |
We compared the 214 children who were discharged prior to reaching clinical improvement with the 1702 children who reached the clinical improvement criteria. The 214 children were less likely to be age <2 months (22% vs 30%; P=0.02). These 2 groups (214 vs 1702) were similar with respect to severe retractions (2% vs 4%; P=0.13), median respiratory rate (48 vs 48; P=0.42), oxygen saturation <90% (15% vs 11%; P=0.07), inadequate oral intake (50% vs 43%; P=0.13), and rates of relapse events requiring rehospitalization within both 24 hours (0.6% vs 0.6%; P=0.88) and 7 days (1% vs 1%; P=0.90) of discharge.
DISCUSSION
In this large, multicenter, multiyear study of children hospitalized with bronchiolitis, we found that children present to a hospital in a relatively narrow time frame, but their time to recovery in the hospital is highly variable. Nonetheless, 96% of children continued to improve once they had: (1) improving or stable retractions rated as none/mild, (2) a decreasing or stable RR by age, (3) estimated average RAO2 saturation 90% and lowest RAO2 saturation of 88%, and (4) were hydrated. The 4% of children who worsened after clinically improving were more likely to be age <2 months, born <37 weeks, and present with more severe distress (ie, severe retractions, inadequate oral intake, or apnea). Based on the low risk of worsening after clinical improvement, especially among children admitted to the regular ward (2%), we believe these 4 clinical criteria could be used as discharge criteria for this common pediatric illness with a predominantly monophasic clinical course.
Variability in hospital LOS for children with bronchiolitis exists in the United States[3] and internationally.[4, 5] Cheung and colleagues analyzed administrative data from over 75,000 children admitted for bronchiolitis in England between April 2007 and March 2010 and found sixfold variation in LOS between sites. They concluded that this LOS variability was due in part to providers' clinical decision making.[5] Srivastava and colleagues[23] addressed variable clinician decision making in bronchiolitis and 10 other common pediatric conditions by embedding discharge criteria developed by expert consensus into admission order sets. They found that for children with bronchiolitis, the embedded discharge criteria reduced the median LOS from 1.91 to 1.87 days. In contrast to the single‐center data presented by White and colleagues,[24] the prospective, multicenter MARC‐30 data provide a clear understanding of the normal clinical course for children hospitalized with bronchiolitis, determine if children clinically worsen after clinical improvement, and provide data about discharge criteria for children hospitalized with bronchiolitis. Although there is a lack of rigorous published data, the lower tract symptoms of bronchiolitis (eg, cough, retractions) are said to peak on days 5 to 7 of illness and then gradually resolve.[25] In the present study, we found that the time from the onset of difficulty breathing until hospital admission is less variable than the time from the onset of difficulty breathing until either clinical improvement or discharge. Although 75% of children have clinically improved within 7.5 days of difficulty breathing based on the IQR results, the remaining 25% may have a more prolonged recovery in the hospital of up to 3 weeks. Interestingly, prolonged recovery times from bronchiolitis have also been noted in children presenting to the ED[26] and in an outpatient population.[27] It is unclear why 20% to 25% of children at different levels of severity of illness have prolonged recovery from bronchiolitis, but this group of children requires further investigation.
Given the variability of recovery times, clinicians may have difficulty knowing when a child is ready for hospital discharge. One of the main stumbling blocks for discharge readiness in children with bronchiolitis is the interpretation of the oxygen saturation value.[6, 8, 9, 20, 28] However, it should be considered that interpreting the oxygen saturation in a child who is clinically improving in the hospital setting is different than interpreting the oxygen saturation of a child in the ED or the clinic whose clinical course is less certain.[22] In the hospital setting, using the oxygen saturation value in in the AAP guideline,[9] 4% of children clinically worsened after they met the improvement criteria, a clinical pattern observed previously with supplemental oxygen.[28] This unpredictability may explain some of the variation in providers' clinical decision making.[5] The children who worsened, and therefore deserve more cautious discharge planning, were young (<2 months), premature (<37 weeks gestational age), and presented in more severe distress. Those children admitted to the ICU from the ED worsened more commonly than children admitted to the ward (19% vs 2%). Interestingly, the viral etiology of the child's bronchiolitis did not influence whether a child worsened after reaching the improvement criteria. Therefore, although children with RV bronchiolitis have a shorter hospital LOS than children with RSV bronchiolitis,[11] the pattern of recovery did not differ by viral etiology.
In addition to unsafe discharges, clinicians may be concerned about the possibility of readmissions. Although somewhat controversial, hospital readmission is being used as a quality of care metric.[29, 30, 31] One response to minimize readmissions would be for clinicians to observe children for longer than clinically indicated.[32] However, shorter LOS is not necessarily associated with increased readmission rates.[33] Given that the geometric mean of hospital charges per child with bronchiolitis increased from $6380 in 2000 to $8530 in 2009,[34] the potential for safely reducing hospital LOS by using the discharge criteria proposed in the current study instead of other criteria[8] may net substantial cost savings. Furthermore, reducing LOS would decrease the time children expose others to these respiratory viruses and possibly reduce medical errors.[35]
Our study has some potential limitations. Because the study participants were all hospitalized, these data do not inform admission or discharge decisions from either the ED or the clinic; but other data address those clinical scenarios.[22] Also, the 16 sites that participated in this study were large, urban teaching hospitals. Consequently, these results are not necessarily generalizable to smaller community hospitals. Although numerous data points were required to enter the analytic cohort, only 9% of the sample was excluded for missing data. There were 214 children who did not meet our improvement criteria by the time of discharge. Although the inability to include these children in the analysis may be seen as a limitation, this practice variability underscores the need for more data about discharging hospitalized children with bronchiolitis. Last, site teams reviewed medical records daily. More frequent recording of the clinical course would have yielded more granular data, but the current methodology replicates how data are generally presented during patient care rounds, when decisions about suitability for discharge are often considered.
CONCLUSION
We documented in this large multicenter study that most children hospitalized with bronchiolitis had a wide range of time to recovery, but the vast majority continued to improve once they reached the identified clinical criteria that predict a safe discharge to home. The children who worsened after clinical improvement were more likely to be younger, premature infants presenting in more severe distress. Although additional prospective validation of these hospital discharge criteria is warranted, these data may help clinicians make more evidence‐based discharge decisions for a common pediatric illness with high practice variation, both in the United States[3] and in other countries.[4, 5]
Acknowledgements
Collaborators in the MARC‐30 Study: Besh Barcega, MD, Loma Linda University Children's Hospital, Loma Linda, CA; John Cheng, MD, Children's Healthcare of Atlanta at Egleston, Atlanta, GA; Dorothy Damore, MD, New York Presbyterian Hospital‐Cornell, New York, NY; Carlos Delgado, MD, Children's Healthcare of Atlanta at Egleston, Atlanta, GA; Haitham Haddad, MD, Rainbow Babies & Children's Hospital, Cleveland, OH; Paul Hain, MD, Monroe Carell Jr. Children's Hospital at Vanderbilt, Nashville, TN; Frank LoVecchio, DO, Maricopa Medical Center, Phoenix, AZ; Charles Macias, MD MPH, Texas Children's Hospital, Houston, TX; Jonathan Mansbach, MD, MPH, Boston Children's Hospital, Boston, MA; Eugene Mowad, MD, Akron Children's Hospital, Akron, OH; Brian Pate, MD, Children's Mercy Hospital, Kansas City, MO; Mark Riederer, MD, Monroe Carell Jr. Children's Hospital at Vanderbilt, Nashville, TN; M. Jason Sanders, MD, Children's Memorial Hermann Hospital, Houston, TX; Alan R. Schroeder, MD, Santa Clara Valley Medical Center, San Jose, CA; Nikhil Shah, MD, New York Presbyterian Hospital‐Cornell, New York, NY; Michelle Stevenson, MD, MS, Kosair Children's Hospital, Louisville, KY; Erin Stucky Fisher, MD, Rady Children's Hospital, San Diego, CA; Stephen Teach, MD, MPH, Children's National Medical Center, Washington, DC; Lisa Zaoutis, MD, Children's Hospital of Philadelphia, Philadelphia, PA.
Disclosures: This study was supported by grants U01 AI‐67693 and K23 AI‐77801 from the National Institutes of Health (Bethesda, MD). The content of this manuscript is solely the responsibility of the authors and does not necessarily represent the official views of the National Institute of Allergy and Infectious Diseases or the National Institutes of Health. Drs. Mansbach and Piedra have provided consultation to Regeneron Pharmaceuticals. Otherwise, no authors report any potential conflicts of interest, including relevant financial interests, activities, relationships, and affiliations.
- , , , , . Infectious disease hospitalizations among infants in the United States. Pediatrics. 2008;121(2):244–252.
- . “A hospital is no place to be sick” Samuel Goldwyn (1882–1974). Arch Dis Child. 2009;94(8):565–566.
- , , , , , Variation in inpatient diagnostic testing and management of bronchiolitis. Pediatrics. 2005;115(4):878–884.
- , , , International variation in the management of infants hospitalized with respiratory syncytial virus. International RSV Study Group. Eur J Pediatr. 1998;157(3):215–220.
- , , , , . Population variation in admission rates and duration of inpatient stay for bronchiolitis in England. Arch Dis Child. 2013;98(1):57–59.
- , , , . Impact of pulse oximetry and oxygen therapy on length of stay in bronchiolitis hospitalizations. Arch Pediatr Adolesc Med. 2004;158(6):527–530.
- , , . Pulse oximetry in pediatric practice. Pediatrics. 2011;128(4):740–752.
- Scottish Intercollegiate Guidelines Network. Bronchiolitis in children (SIGN 91). In: NHS Quality Improvement Scotland. Edinburgh, Scotland: Scottish Intercollegiate Guidelines Network; 2006.
- , , , et al. Diagnosis and management of bronchiolitis. Pediatrics. 2006;118(4):1774–1793.
- , , , et al. Prospective multicenter study of children with bronchiolitis requiring mechanical ventilation. Pediatrics. 2012;130(3):e492–e500.
- , , , et al. Prospective multicenter study of viral etiology and hospital length of stay in children with severe bronchiolitis. Arch Pediatr Adolesc Med. 2012;166(8):700–706.
- , , , et al. Apnea in children hospitalized with bronchiolitis. Pediatrics. 2013;132(5):e1194–e1201.
- . Evaluation of the cardiovascular system: history and physical evaluation. In: Kliegman RM, Stanton BF, St. Geme JW III, Schor NF, Behrman RF, eds. Nelson Textbook of Pediatrics. Philadelphia, PA: Elsevier Saunders; 2011:1529–1536.
- , , , et al. Apnea in children hospitalized with bronchiolitis. Pediatrics. 2013;132(5):e1194–e1201.
- , , , et al. Respiratory viral infections in patients with chronic, obstructive pulmonary disease. J Infect. 2005;50(4):322–330.
- , , , . Evaluation of real‐time PCR for diagnosis of Bordetella pertussis infection. BMC Infect Dis. 2006;6:62.
- , , , , . Evaluation of three real‐time PCR assays for detection of Mycoplasma pneumoniae in an outbreak investigation. J Clin Microbiol. 2008;46(9):3116–3118.
- , , , et al. Normal ranges of heart rate and respiratory rate in children from birth to 18 years of age: a systematic review of observational studies. Lancet. 2011;377(9770):1011–1018.
- , , , , , . Development of heart and respiratory rate percentile curves for hospitalized children. Pediatrics. 2013;131(4):e1150–e1157.
- , . Effect of oxygen supplementation on length of stay for infants hospitalized with acute viral bronchiolitis. Pediatrics. 2008;121(3):470–475.
- , , , et al. Longitudinal assessment of hemoglobin oxygen saturation in healthy infants during the first 6 months of age. Collaborative Home Infant Monitoring Evaluation (CHIME) Study Group. J Pediatr. 1999;135(5):580–586.
- , , , et al. Prospective multicenter study of bronchiolitis: predicting safe discharges from the emergency department. Pediatrics. 2008;121(4):680–688.
- , , , et al. Delays in discharge in a tertiary care pediatric hospital. J Hosp Med. 2009;4(8):481–485.
- , , , et al. Using quality improvement to optimise paediatric discharge efficiency. BMJ Qual Saf. 2014;23(5):428–436.
- , . Bronchiolitis in infants and children: treatment; outcome; and prevention. In: Torchia M, ed. UpToDate. Alphen aan den Rijn, the Netherlands; Wolters Kluwer Health; 2013.
- , . Duration of illness in infants with bronchiolitis evaluated in the emergency department. Pediatrics. 2010;126(2):285–290.
- , , . Duration of illness in ambulatory children diagnosed with bronchiolitis. Arch Pediatr Adolesc Med. 2000;154(10):997–1000.
- , , , et al. A clinical pathway for bronchiolitis is effective in reducing readmission rates. J Pediatr. 2005;147(5):622–626.
- , , , et al. Measuring hospital quality using pediatric readmission and revisit rates. Pediatrics. 2013;132(3):429–436.
- , , , et al. Pediatric readmission prevalence and variability across hospitals. JAMA. 2013;309(4):372–380.
- , , , , , . Preventability of early readmissions at a children's hospital. Pediatrics. 2013;131(1):e171–e181.
- , . Hospital readmission: quality indicator or statistical inevitability? Pediatrics. 2013;132(3):569–570.
- , , , et al. Children's hospitals with shorter lengths of stay do not have higher readmission rates. J Pediatr. 2013;163(4):1034–1038.e1.
- , , , , . Trends in bronchiolitis hospitalizations in the United States, 2000–2009. Pediatrics. 2013;132(1):28–36.
- , , , . Preventable adverse events in infants hospitalized with bronchiolitis. Pediatrics. 2005;116(3):603–608.
Although bronchiolitis is the leading cause of hospitalization for US infants,[1] there is a lack of basic prospective data about the expected inpatient clinical course and ongoing uncertainty about when a hospitalized child is ready for discharge to home.[2] This lack of data about children's readiness for discharge may result in variable hospital length‐of‐stay (LOS).[3, 4, 5]
One specific source of variability in discharge readiness and LOS variability may be the lack of consensus about safe threshold oxygen saturation values for discharge in children hospitalized with bronchiolitis.[6, 7] In 2006, the Scottish Intercollegiate Guidelines Network recommended a discharge room air oxygen (RAO2) saturation threshold of 95%.[8] The same year, the American Academy of Pediatrics (AAP) bronchiolitis clinical practice guideline stated that oxygen is not needed for children with RAO2 saturations 90% who are feeding well and have minimal respiratory distress.[9] There is a need for prospective studies to help clinicians make evidenced‐based discharge decisions for this common condition.
We performed a prospective, multicenter, multiyear study[10, 11, 12] to examine the typical inpatient clinical course of and to develop hospital discharge guidelines for children age <2 years hospitalized with bronchiolitis. We hypothesized that children would not worsen clinically and would be safe to discharge home once their respiratory status improved and they were able to remain hydrated.
METHODS
Study Design and Population
We conducted a prospective, multicenter cohort study for 3 consecutive years during the 2007 to 2010 winter seasons, as part of the Multicenter Airway Research Collaboration (MARC), a program of the Emergency Medicine Network (
All patients were treated at the discretion of the treating physician. Inclusion criteria were an attending physician's diagnosis of bronchiolitis, age <2 years, and the ability of the parent/guardian to give informed consent. The exclusion criteria were previous enrollment and transfer to a participating hospital >48 hours after the original admission time. Therefore, children with comorbid conditions were included in this study. All consent and data forms were translated into Spanish. The institutional review board at each of the 16 participating hospitals approved the study.
Of the 2207 enrolled children, we excluded 109 (5%) children with a hospital LOS <1 day due to inadequate time to capture the required data for the present analysis. Among the 2098 remaining children, 1916 (91%) had daily inpatient data on all factors used to define clinical improvement and clinical worsening. Thus, the analytic cohort was comprised of 1916 children hospitalized for bronchiolitis.
Data Collection
Investigators conducted detailed structured interviews. Chart reviews were conducted to obtain preadmission and daily hospital clinical data including respiratory rates, daily respiratory rate trends, degree of retractions, oxygen saturation, daily oxygen saturation trends, medical management, and disposition. These data were manually reviewed, and site investigators were queried about missing data and discrepancies. A follow‐up telephone interview was conducted with families 1 week after discharge to examine relapse events at both 24 hours and 7 days.
We used the question: How long ago did the following symptoms [eg, difficulty breathing] begin [for the] current illness? to estimate the onset of the current illness. Pulse was categorized as low, normal, or high based on age‐related heart rate values.[13] Presence of apnea was recorded daily by site investigators.[14]
Nasopharyngeal Aspirate Collection and Virology Testing
As described previously, site teams used a standardized protocol to collect nasopharyngeal aspirates,[11] which were tested for respiratory syncytial virus (RSV) types A and B; rhinovirus (RV); parainfluenza virus types 1, 2, and 3; influenza virus types A and B; 2009 novel H1N1; human metapneumovirus; coronaviruses NL‐63, HKU1, OC43, and 229E; enterovirus, and adenovirus using polymerase chain reaction.[11, 15, 16, 17]
Defining Clinical Improvement and Worsening
Clinical improvement criteria were based on the 2006 AAP guidelines.[9] For respiratory rate and oxygen saturation, clinicians estimated average daily respiratory rate and oxygen saturation based on the recorded readings from the previous 24 hours. This estimation reflects the process clinicians use when rounding on their hospitalized patients, and thus may be more similar to standard clinical practice than a calculated mean. The respiratory rate criteria are adjusted for age.[18, 19] For daily estimated average oxygen saturation we used the AAP criteria of RAO2 saturation of 90%. Considering that oxygen saturation is the main determinant of LOS,[20] healthy infants age <6 months may have transient oxygen saturations of around 80%,[21] and that errors in estimation may occur, we included a lowest RAO2 of 88% in our improvement criteria. By combining the dichotomized estimated oxygen saturation (90% or not) with the lower limit of 88%, there was little room for erroneous conclusions. A child was considered clinically improved on the earliest date he/she met all of the following criteria: (1) none or mild retractions and improved or stable retractions compared with the previous inpatient day; (2) daily estimated average respiratory rate (RR) <60 breaths per minute for age <6 months, <55 breaths/minute for age 6 to 11 months, and <45 breaths/minute for age 12 months with a decreasing or stable trend over the course of the current day; (3) daily estimated average RAO2 saturation 90%, lowest RAO2 saturation 88%[21]; and (4) not receiving intravenous (IV) fluids or for children receiving IV fluids a clinician report of the child maintaining oral hydration. Children who reached the clinical improvement criteria were considered clinically worse if they required intensive care or had the inverse of 1 of the improvement criteria: moderate/severe retractions that were worse compared with the previous inpatient day, daily average RR 60 with an increasing trend over the current day, need for oxygen, or need for IV fluids.
Statistical Analyses
All analyses were performed using Stata 12.0 (StataCorp, College Station, TX). Data are presented as proportions with 95% confidence intervals (95% CIs), means with standard deviations, and medians with interquartile ranges (IQR). To examine potential factors associated with clinical worsening after reaching clinical improvement, we used 2, Fisher exact, Student t test, and Kruskall‐Wallis tests, as appropriate.
Adjusted analyses used generalized linear mixed models with a logit link to identify independent risk factors for worsening after reaching clinical improvement. Fixed effects for patient‐level factors and a random site effect were used. Factors were tested for inclusion in the multivariable model if they were found to be associated with worsening in unadjusted analyses (P<0.20) or were considered clinically important. Results are reported as odds ratios with 95% CIs.
We performed several sensitivity analyses to evaluate these improvement criteria: (1) we excluded the lowest RAO2 saturation requirement of 88%, (2) we examined a 94% daily estimated average RAO2 saturation threshold,[22] (3) we examined a 95% daily estimated average RAO2 saturation threshold,[8] and (4) we examined children age <12 months with no history of wheeze.
RESULTS
There were 1916 children hospitalized with bronchiolitis with data on all factors used to define clinical improvement and clinical worsening. The median number of days from the beginning of difficulty breathing until admission was 2 days (IQR, 15.5 days; range, 18 days) and from the beginning of difficulty breathing until clinical improvement was 4 days (IQR, 37.5 days; range, 133 days) (Figure 1). The variance for days to admission was significantly less than the variance for days to clinical improvement (P<0.001).
In this observational study, clinicians discharged 214 (11%) of the 1916 children before meeting the definition of clinical improvement. Thus, 1702 (89%; 95% CI: 87%‐90%) children reached the clinical improvement criteria, had a LOS >1 day, and had data on all factors (Figure 2).
Of the 1702 children who met the clinical improvement criteria, there were 76 children (4%; 95% CI: 3%5%) who worsened (Figure 2). The worsening occurred within a median of 1 day (IQR, 13 days) of clinical improvement. Forty‐six (3%) of the children required transfer to the ICU (1 required intubation, 1 required continuous positive airway pressure, and 4 had apnea), 23 (1%) required oxygen, and 17 (1%) required IV fluids. Eight percent of children met multiple criteria for worsening. A comparison between children who did and did not worsen is shown in Table 1. In general, children who worsened after improvement were younger and born earlier. These children also presented in more severe respiratory distress, had moderate or severe retractions, oxygen saturation <85% at hospitalization, inadequate oral intake, and apnea documented during the hospitalization. Neither viral etiology nor site of care influenced whether the children worsened after improving. However, stratified analysis of children based on initial location of admission (ie, ICU or ward) showed that among the children admitted to the ICU from the emergency department (ED), 89% met the improvement criteria and 19% clinically worsened. In contrast, among children admitted to the ward from the ED, 89% met the improvement criteria, and only 2% clinically worsened. Stratified multivariable models based on the initial location of admission from the ED (ie, ICU or ward) were not possible due to small sample sizes after stratification. None of these children had relapse events requiring rehospitalization within either 24 hours or 7 days of discharge.
| Did Not Worsen, n=1,626 | Worsened, n=76 | P Value | |
|---|---|---|---|
| |||
| Demographic characteristics | |||
| Age <2 months, % | 29 | 57 | <0.001 |
| Month of birth, % | 0.02 | ||
| OctoberMarch | 61 | 75 | |
| AprilSeptember | 39 | 25 | |
| Sex, % | 0.51 | ||
| Male | 59 | 55 | |
| Female | 41 | 45 | |
| Race, % | 0.050 | ||
| White | 63 | 58 | |
| Black | 23 | 34 | |
| Other or missing | 14 | 8 | |
| Hispanic ethnicity, % | 37 | 22 | 0.01 |
| Insurance, % | 0.87 | ||
| Nonprivate | 68 | 67 | |
| Private | 32 | 33 | |
| Medical history | |||
| Gestational age <37 weeks, % | 23 | 39 | 0.002 |
| Birth weight, % | 0.52 | ||
| <5 lbs | 13 | 12 | |
| 5 lbs | 34 | 41 | |
| 7 lbs | 53 | 47 | |
| Mother's age, median (IQR) | 27 (2333) | 27 (2233) | 0.54 |
| Is or was breastfed, % | 61 | 51 | 0.10 |
| Smoked during pregnancy, % | 15 | 20 | 0.22 |
| Exposure to smoke, % | 13 | 20 | 0.11 |
| Family history of asthma, % | 0.89 | ||
| Neither parent | 68 | 64 | |
| Either mother or father | 27 | 30 | |
| Both parents | 4 | 4 | |
| Do not know/missing | 2 | 1 | |
| History of wheezing, % | 23 | 17 | 0.24 |
| History of eczema, % | 16 | 7 | 0.04 |
| History of intubation, % | 9 | 12 | 0.50 |
| Major, relevant, comorbid medical disorder, % | 20 | 24 | 0.46 |
| Current illness | |||
| When difficulty breathing began, preadmission, % | 0.63 | ||
| 1 day | 70 | 75 | |
| <1 day | 28 | 23 | |
| No difficulty preadmission | 2 | 3 | |
| Weight, lbs, median (IQR) | 12.3 (8.817.4) | 9.0 (6.613.2) | 0.001 |
| Temperature, F, median (IQR) | 99.5 (98.6100.6) | 99.4 (98.1100.4) | 0.06 |
| Pulse, beats per minute by age | 0.82 | ||
| Low | 0.3 | 0 | |
| Normal | 48 | 46 | |
| High | 51 | 54 | |
| Respiratory rate, breaths per minute, median (IQR) | 48 (4060) | 48 (3864) | 0.28 |
| Retractions, % | 0.001 | ||
| None | 22 | 25 | |
| Mild | 43 | 24 | |
| Moderate | 26 | 33 | |
| Severe | 4 | 12 | |
| Missing | 5 | 7 | |
| Oxygen saturation by pulse oximetry or ABG, % | 0.001 | ||
| <85 | 4 | 12 | |
| 8587.9 | 3 | 4 | |
| 8889.9 | 5 | 0 | |
| 9093.9 | 18 | 11 | |
| 94 | 72 | 73 | |
| Oral intake, % | <0.001 | ||
| Adequate | 45 | 22 | |
| Inadequate | 42 | 63 | |
| Missing | 13 | 14 | |
| Presence of apnea, % | 7 | 24 | <0.001 |
| RSV‐A, % | 44 | 41 | 0.54 |
| RSV‐B, % | 30 | 25 | 0.36 |
| HRV, % | 24 | 24 | 0.88 |
| Chest x‐ray results during ED/preadmission visit | |||
| Atelectasis | 12 | 13 | 0.77 |
| Infiltrate | 13 | 11 | 0.50 |
| Hyperinflated | 18 | 21 | 0.47 |
| Peribronchial cuffing/thickening | 23 | 17 | 0.32 |
| Normal | 14 | 16 | 0.75 |
| White blood count, median (IQR) | 11.2 (8.714.4) | 11.9 (9.214.4) | 0.60 |
| Platelet count, median (IQR) | 395 (317490) | 430 (299537) | 0.56 |
| Sodium, median (IQR) | 138 (136140) | 137 (135138) | 0.19 |
| Hospital length of stay, median (IQR) | 2 (14) | 4.5 (28) | <0.001 |
| One‐week follow‐up | |||
| Relapse within 24 hours of hospital discharge requiring hospital admission, % | 0.5 | 0 | 0.56 |
| Relapse within 7 days of hospital discharge requiring hospital admission, % | 1 | 0 | 0.35 |
On multivariable analysis (Table 2), independent risk factors for worsening after reaching the clinical improvement criteria were young age, preterm birth, and presenting to care with more severe bronchiolitis represented by severe retractions, inadequate oral intake, or apnea. To further evaluate the improvement criteria in the current analysis, multiple sensitivity analyses were conducted. The frequency of clinical worsening after reaching the improvement criteria was stable when we examined different RA02 criteria in sensitivity analyses: (1) excluding RA02 as a criterion for improvement: 90% met improvement criteria and 4% experienced clinical worsening, (2) changing the average RA02 threshold for clinical improvement to 94%: 62% met improvement criteria and 6% experienced clinical worsening, and (3) changing the average RA02 threshold for clinical improvement to 95%: 47% met improvement criteria and 5% experienced clinical worsening. Furthermore, stratifying by age <2 months and restricting to more stringent definitions of bronchiolitis (ie, age <1 year or age <1 year+no history of wheezing) also did not materially change the results (see Supporting Figure 1 in the online version of this article).
| Odds Ratio | 95% CI | P Value | |
|---|---|---|---|
| |||
| Age <2 months | 3.51 | 2.07‐5.94 | <0.001 |
| Gestational age <37 weeks | 1.94 | 1.13‐3.32 | 0.02 |
| Retractions | |||
| None | 1.30 | 0.80‐3.23 | 0.19 |
| Mild | 1.0 | Reference | |
| Moderate | 1.91 | 0.99‐3.71 | 0.06 |
| Severe | 5.55 | 2.1214.50 | <0.001 |
| Missing | 1.70 | 0.53‐5.42 | 0.37 |
| Oral intake | |||
| Adequate | 1.00 | Reference | |
| Inadequate | 2.54 | 1.39‐4.62 | 0.002 |
| Unknown/missing | 1.88 | 0.79‐4.44 | 0.15 |
| Presence of apnea | 2.87 | 1.45‐5.68 | 0.003 |
We compared the 214 children who were discharged prior to reaching clinical improvement with the 1702 children who reached the clinical improvement criteria. The 214 children were less likely to be age <2 months (22% vs 30%; P=0.02). These 2 groups (214 vs 1702) were similar with respect to severe retractions (2% vs 4%; P=0.13), median respiratory rate (48 vs 48; P=0.42), oxygen saturation <90% (15% vs 11%; P=0.07), inadequate oral intake (50% vs 43%; P=0.13), and rates of relapse events requiring rehospitalization within both 24 hours (0.6% vs 0.6%; P=0.88) and 7 days (1% vs 1%; P=0.90) of discharge.
DISCUSSION
In this large, multicenter, multiyear study of children hospitalized with bronchiolitis, we found that children present to a hospital in a relatively narrow time frame, but their time to recovery in the hospital is highly variable. Nonetheless, 96% of children continued to improve once they had: (1) improving or stable retractions rated as none/mild, (2) a decreasing or stable RR by age, (3) estimated average RAO2 saturation 90% and lowest RAO2 saturation of 88%, and (4) were hydrated. The 4% of children who worsened after clinically improving were more likely to be age <2 months, born <37 weeks, and present with more severe distress (ie, severe retractions, inadequate oral intake, or apnea). Based on the low risk of worsening after clinical improvement, especially among children admitted to the regular ward (2%), we believe these 4 clinical criteria could be used as discharge criteria for this common pediatric illness with a predominantly monophasic clinical course.
Variability in hospital LOS for children with bronchiolitis exists in the United States[3] and internationally.[4, 5] Cheung and colleagues analyzed administrative data from over 75,000 children admitted for bronchiolitis in England between April 2007 and March 2010 and found sixfold variation in LOS between sites. They concluded that this LOS variability was due in part to providers' clinical decision making.[5] Srivastava and colleagues[23] addressed variable clinician decision making in bronchiolitis and 10 other common pediatric conditions by embedding discharge criteria developed by expert consensus into admission order sets. They found that for children with bronchiolitis, the embedded discharge criteria reduced the median LOS from 1.91 to 1.87 days. In contrast to the single‐center data presented by White and colleagues,[24] the prospective, multicenter MARC‐30 data provide a clear understanding of the normal clinical course for children hospitalized with bronchiolitis, determine if children clinically worsen after clinical improvement, and provide data about discharge criteria for children hospitalized with bronchiolitis. Although there is a lack of rigorous published data, the lower tract symptoms of bronchiolitis (eg, cough, retractions) are said to peak on days 5 to 7 of illness and then gradually resolve.[25] In the present study, we found that the time from the onset of difficulty breathing until hospital admission is less variable than the time from the onset of difficulty breathing until either clinical improvement or discharge. Although 75% of children have clinically improved within 7.5 days of difficulty breathing based on the IQR results, the remaining 25% may have a more prolonged recovery in the hospital of up to 3 weeks. Interestingly, prolonged recovery times from bronchiolitis have also been noted in children presenting to the ED[26] and in an outpatient population.[27] It is unclear why 20% to 25% of children at different levels of severity of illness have prolonged recovery from bronchiolitis, but this group of children requires further investigation.
Given the variability of recovery times, clinicians may have difficulty knowing when a child is ready for hospital discharge. One of the main stumbling blocks for discharge readiness in children with bronchiolitis is the interpretation of the oxygen saturation value.[6, 8, 9, 20, 28] However, it should be considered that interpreting the oxygen saturation in a child who is clinically improving in the hospital setting is different than interpreting the oxygen saturation of a child in the ED or the clinic whose clinical course is less certain.[22] In the hospital setting, using the oxygen saturation value in in the AAP guideline,[9] 4% of children clinically worsened after they met the improvement criteria, a clinical pattern observed previously with supplemental oxygen.[28] This unpredictability may explain some of the variation in providers' clinical decision making.[5] The children who worsened, and therefore deserve more cautious discharge planning, were young (<2 months), premature (<37 weeks gestational age), and presented in more severe distress. Those children admitted to the ICU from the ED worsened more commonly than children admitted to the ward (19% vs 2%). Interestingly, the viral etiology of the child's bronchiolitis did not influence whether a child worsened after reaching the improvement criteria. Therefore, although children with RV bronchiolitis have a shorter hospital LOS than children with RSV bronchiolitis,[11] the pattern of recovery did not differ by viral etiology.
In addition to unsafe discharges, clinicians may be concerned about the possibility of readmissions. Although somewhat controversial, hospital readmission is being used as a quality of care metric.[29, 30, 31] One response to minimize readmissions would be for clinicians to observe children for longer than clinically indicated.[32] However, shorter LOS is not necessarily associated with increased readmission rates.[33] Given that the geometric mean of hospital charges per child with bronchiolitis increased from $6380 in 2000 to $8530 in 2009,[34] the potential for safely reducing hospital LOS by using the discharge criteria proposed in the current study instead of other criteria[8] may net substantial cost savings. Furthermore, reducing LOS would decrease the time children expose others to these respiratory viruses and possibly reduce medical errors.[35]
Our study has some potential limitations. Because the study participants were all hospitalized, these data do not inform admission or discharge decisions from either the ED or the clinic; but other data address those clinical scenarios.[22] Also, the 16 sites that participated in this study were large, urban teaching hospitals. Consequently, these results are not necessarily generalizable to smaller community hospitals. Although numerous data points were required to enter the analytic cohort, only 9% of the sample was excluded for missing data. There were 214 children who did not meet our improvement criteria by the time of discharge. Although the inability to include these children in the analysis may be seen as a limitation, this practice variability underscores the need for more data about discharging hospitalized children with bronchiolitis. Last, site teams reviewed medical records daily. More frequent recording of the clinical course would have yielded more granular data, but the current methodology replicates how data are generally presented during patient care rounds, when decisions about suitability for discharge are often considered.
CONCLUSION
We documented in this large multicenter study that most children hospitalized with bronchiolitis had a wide range of time to recovery, but the vast majority continued to improve once they reached the identified clinical criteria that predict a safe discharge to home. The children who worsened after clinical improvement were more likely to be younger, premature infants presenting in more severe distress. Although additional prospective validation of these hospital discharge criteria is warranted, these data may help clinicians make more evidence‐based discharge decisions for a common pediatric illness with high practice variation, both in the United States[3] and in other countries.[4, 5]
Acknowledgements
Collaborators in the MARC‐30 Study: Besh Barcega, MD, Loma Linda University Children's Hospital, Loma Linda, CA; John Cheng, MD, Children's Healthcare of Atlanta at Egleston, Atlanta, GA; Dorothy Damore, MD, New York Presbyterian Hospital‐Cornell, New York, NY; Carlos Delgado, MD, Children's Healthcare of Atlanta at Egleston, Atlanta, GA; Haitham Haddad, MD, Rainbow Babies & Children's Hospital, Cleveland, OH; Paul Hain, MD, Monroe Carell Jr. Children's Hospital at Vanderbilt, Nashville, TN; Frank LoVecchio, DO, Maricopa Medical Center, Phoenix, AZ; Charles Macias, MD MPH, Texas Children's Hospital, Houston, TX; Jonathan Mansbach, MD, MPH, Boston Children's Hospital, Boston, MA; Eugene Mowad, MD, Akron Children's Hospital, Akron, OH; Brian Pate, MD, Children's Mercy Hospital, Kansas City, MO; Mark Riederer, MD, Monroe Carell Jr. Children's Hospital at Vanderbilt, Nashville, TN; M. Jason Sanders, MD, Children's Memorial Hermann Hospital, Houston, TX; Alan R. Schroeder, MD, Santa Clara Valley Medical Center, San Jose, CA; Nikhil Shah, MD, New York Presbyterian Hospital‐Cornell, New York, NY; Michelle Stevenson, MD, MS, Kosair Children's Hospital, Louisville, KY; Erin Stucky Fisher, MD, Rady Children's Hospital, San Diego, CA; Stephen Teach, MD, MPH, Children's National Medical Center, Washington, DC; Lisa Zaoutis, MD, Children's Hospital of Philadelphia, Philadelphia, PA.
Disclosures: This study was supported by grants U01 AI‐67693 and K23 AI‐77801 from the National Institutes of Health (Bethesda, MD). The content of this manuscript is solely the responsibility of the authors and does not necessarily represent the official views of the National Institute of Allergy and Infectious Diseases or the National Institutes of Health. Drs. Mansbach and Piedra have provided consultation to Regeneron Pharmaceuticals. Otherwise, no authors report any potential conflicts of interest, including relevant financial interests, activities, relationships, and affiliations.
- , , , , . Infectious disease hospitalizations among infants in the United States. Pediatrics. 2008;121(2):244–252.
- . “A hospital is no place to be sick” Samuel Goldwyn (1882–1974). Arch Dis Child. 2009;94(8):565–566.
- , , , , , Variation in inpatient diagnostic testing and management of bronchiolitis. Pediatrics. 2005;115(4):878–884.
- , , , International variation in the management of infants hospitalized with respiratory syncytial virus. International RSV Study Group. Eur J Pediatr. 1998;157(3):215–220.
- , , , , . Population variation in admission rates and duration of inpatient stay for bronchiolitis in England. Arch Dis Child. 2013;98(1):57–59.
- , , , . Impact of pulse oximetry and oxygen therapy on length of stay in bronchiolitis hospitalizations. Arch Pediatr Adolesc Med. 2004;158(6):527–530.
- , , . Pulse oximetry in pediatric practice. Pediatrics. 2011;128(4):740–752.
- Scottish Intercollegiate Guidelines Network. Bronchiolitis in children (SIGN 91). In: NHS Quality Improvement Scotland. Edinburgh, Scotland: Scottish Intercollegiate Guidelines Network; 2006.
- , , , et al. Diagnosis and management of bronchiolitis. Pediatrics. 2006;118(4):1774–1793.
- , , , et al. Prospective multicenter study of children with bronchiolitis requiring mechanical ventilation. Pediatrics. 2012;130(3):e492–e500.
- , , , et al. Prospective multicenter study of viral etiology and hospital length of stay in children with severe bronchiolitis. Arch Pediatr Adolesc Med. 2012;166(8):700–706.
- , , , et al. Apnea in children hospitalized with bronchiolitis. Pediatrics. 2013;132(5):e1194–e1201.
- . Evaluation of the cardiovascular system: history and physical evaluation. In: Kliegman RM, Stanton BF, St. Geme JW III, Schor NF, Behrman RF, eds. Nelson Textbook of Pediatrics. Philadelphia, PA: Elsevier Saunders; 2011:1529–1536.
- , , , et al. Apnea in children hospitalized with bronchiolitis. Pediatrics. 2013;132(5):e1194–e1201.
- , , , et al. Respiratory viral infections in patients with chronic, obstructive pulmonary disease. J Infect. 2005;50(4):322–330.
- , , , . Evaluation of real‐time PCR for diagnosis of Bordetella pertussis infection. BMC Infect Dis. 2006;6:62.
- , , , , . Evaluation of three real‐time PCR assays for detection of Mycoplasma pneumoniae in an outbreak investigation. J Clin Microbiol. 2008;46(9):3116–3118.
- , , , et al. Normal ranges of heart rate and respiratory rate in children from birth to 18 years of age: a systematic review of observational studies. Lancet. 2011;377(9770):1011–1018.
- , , , , , . Development of heart and respiratory rate percentile curves for hospitalized children. Pediatrics. 2013;131(4):e1150–e1157.
- , . Effect of oxygen supplementation on length of stay for infants hospitalized with acute viral bronchiolitis. Pediatrics. 2008;121(3):470–475.
- , , , et al. Longitudinal assessment of hemoglobin oxygen saturation in healthy infants during the first 6 months of age. Collaborative Home Infant Monitoring Evaluation (CHIME) Study Group. J Pediatr. 1999;135(5):580–586.
- , , , et al. Prospective multicenter study of bronchiolitis: predicting safe discharges from the emergency department. Pediatrics. 2008;121(4):680–688.
- , , , et al. Delays in discharge in a tertiary care pediatric hospital. J Hosp Med. 2009;4(8):481–485.
- , , , et al. Using quality improvement to optimise paediatric discharge efficiency. BMJ Qual Saf. 2014;23(5):428–436.
- , . Bronchiolitis in infants and children: treatment; outcome; and prevention. In: Torchia M, ed. UpToDate. Alphen aan den Rijn, the Netherlands; Wolters Kluwer Health; 2013.
- , . Duration of illness in infants with bronchiolitis evaluated in the emergency department. Pediatrics. 2010;126(2):285–290.
- , , . Duration of illness in ambulatory children diagnosed with bronchiolitis. Arch Pediatr Adolesc Med. 2000;154(10):997–1000.
- , , , et al. A clinical pathway for bronchiolitis is effective in reducing readmission rates. J Pediatr. 2005;147(5):622–626.
- , , , et al. Measuring hospital quality using pediatric readmission and revisit rates. Pediatrics. 2013;132(3):429–436.
- , , , et al. Pediatric readmission prevalence and variability across hospitals. JAMA. 2013;309(4):372–380.
- , , , , , . Preventability of early readmissions at a children's hospital. Pediatrics. 2013;131(1):e171–e181.
- , . Hospital readmission: quality indicator or statistical inevitability? Pediatrics. 2013;132(3):569–570.
- , , , et al. Children's hospitals with shorter lengths of stay do not have higher readmission rates. J Pediatr. 2013;163(4):1034–1038.e1.
- , , , , . Trends in bronchiolitis hospitalizations in the United States, 2000–2009. Pediatrics. 2013;132(1):28–36.
- , , , . Preventable adverse events in infants hospitalized with bronchiolitis. Pediatrics. 2005;116(3):603–608.
© 2015 Society of Hospital Medicine
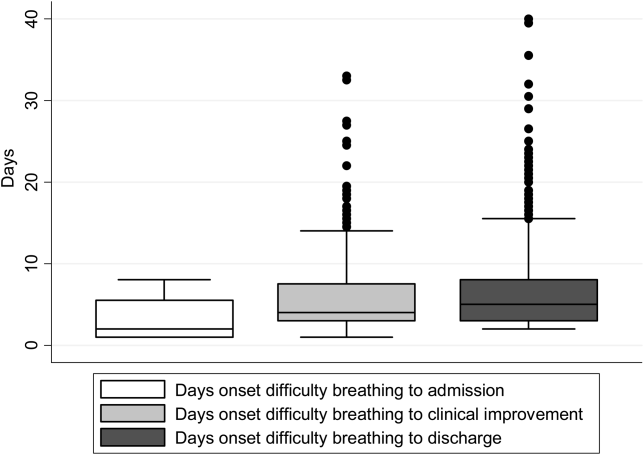
Race and Ethnicity in Bronchiolitis
Bronchiolitis is the leading cause of hospitalization for infants in the United States, costs more than $500 million annually, and has seen a 30% increase ($1.34 billion to $1.73 billion) in related hospital charges from 2000 to 2009.13 Almost all children <2 years old are infected with respiratory syncytial virus, the most common cause of bronchiolitis, with 40% developing clinically recognizable bronchiolitis and 2% becoming hospitalized with severe bronchiolitis.[4, 5] Current American Academy of Pediatrics (AAP) guidelines state that routine use of bronchodilators, corticosteroids, and chest x‐rays is not recommended, and supportive care is strongly encouraged.[6] However, a lack of consensus among clinicians persists regarding bronchiolitis management.[7, 8, 9, 10] Although minority children and those with a lower socioeconomic status (SES) in the United States are more likely to present with bronchiolitis to the emergency department (ED) and be subsequently admitted when compared to the general population,[11, 12, 13] to our knowledge, no study has yet examined if race/ethnicity is independently associated with differences in the presentation and management of severe bronchiolitis (ie, bronchiolitis causing hospitalization). Although a prior bronchiolitis‐related study reported that Hispanic children had a longer ED length of stay (LOS) than non‐Hispanic white (NHW) and non‐Hispanic black (NHB) children,[14] other studies concluded that race/ethnicity were not predictors of intensive care unit (ICU) admission or unscheduled healthcare visits post‐ED discharge.[15, 16]
Determining if race/ethnicity is independently associated with certain bronchiolitis management tendencies has implications from both a health disparities standpoint (ie, unequal care based on race/ethnicity) and from a clinical perspective (ie, the potential of certain practices, such as clinical pathways, to increase the likelihood of equitable treatment). To address this knowledge gap, we examined prospective data from a multicenter study designed to evaluate multiple factors related to bronchiolitis hospitalization.
METHODS
Study Design
We conducted a multicenter prospective cohort for 3 consecutive years (20072010) as part of the Multicenter Airway Research Collaboration (MARC), a division of the Emergency Medicine Network (EMNet) (
All patients were treated at the discretion of their physician. Inclusion criteria were hospital admission with physician diagnosis of bronchiolitis, age <2 years, and ability of the child's guardian (eg, parent) to give informed consent. Patients were enrolled within 18 hours of admission. Physician diagnosis of bronchiolitis followed the AAP definition of a child with an acute respiratory illness with some combination of rhinitis, cough, tachypnea, wheezing, crackles, and/or retractions.[6] The exclusion criteria were previous enrollment and if a patient was transferred to a participating site hospital>48 hours after the initial admission. All consent and data forms were translated into Spanish. The institutional review board at each participating site approved the study.
Data Collection
Site investigators used a standardized protocol to enroll 2207 patients admitted with bronchiolitis. Investigators conducted a structured interview that assessed patients' demographic characteristics, medical and environmental history, duration of symptoms, and details of the acute illness. Race/ethnicity was assigned by report of the child's guardian to standard US Census groups. For the purpose of this analysis, mutually exclusive race/ethnicity categories were determined: NHW, NHB, or Hispanic. Non‐Hispanic patients who identified as being both white and black were categorized as NHB. Patients were excluded from analysis if neither white or black race nor Hispanic ethnicity were reported (eg, if only Asian race was reported) because of small numbers (n=67), as were patients missing all race/ethnicity data (n=10). This resulted in a total of 2130 (97%) patients in our analytical dataset. SES was assessed with 2 variables: insurance status (public, private, none) and family income, estimated by matching patients' home ZIP codes and year of enrollment to ZIP code‐based median household annual incomes obtained from Esri Business Analyst Desktop (Esri, Redlands, CA).[17]
ED and daily clinical data, including laboratory tests (eg, complete blood count, basic metabolic panel, urine analysis, blood culture), respiratory rates, oxygen saturation, medical management, and disposition were obtained by medical chart review. Additionally, in an attempt to evaluate bronchiolitis severity at presentation, a modified respiratory distress severity score (RDSS) was calculated based on 4 assessments made during the preadmission visit (ie, ED or office visit before hospital admission): respiratory rate by age, presence of wheezing (yes or no), air entry (normal, mild difficulty, or moderate/severe), and retractions (none, mild, or moderate/severe).[18] Each component was assigned a score of 0, 1, or 2, with the exception of wheeze, which was assigned either a 0 (no wheeze) or a 2 (wheeze), and then summed for a possible total score of 0 to 8.
Last, a follow‐up telephone interview was conducted 1 week after hospital discharge for each enrolled patient. Interviews assessed acute relapse, recent symptoms, and provided additional end points for longitudinal analysis of specific symptoms. All data were manually reviewed at the EMNet Coordinating Center, and site investigators were queried about missing data and discrepancies identified.
Outcome Measures
The major outcomes of this analysis were: albuterol and corticosteroid (inhaled or systemic) use during preadmission visit and hospitalization, chest x‐rays performed at preadmission visit and hospitalization, need for intensive respiratory support (ie, receiving continuous positive airway pressure [CPAP], intubation, or ICU admission), hospital LOS 3 days, discharge on inhaled corticosteroids, and relapse of bronchiolitis requiring medical attention and a change of medication within 1 week of discharge.
Statistical Analysis
Stata 11.2 (StataCorp, College Station, TX) was used for all analyses. We examined unadjusted differences between racial/ethnic groups and clinical presentation, patient management, and outcomes using 2, Fisher exact, or Kruskal‐Wallis test, as appropriate, with results reported as proportions with 95% confidence interval (CI) or median with interquartile range (IQR). Imputed values, calculated with the Stata impute command, were used to calculate the RDSS when 1 of the 4 components was missing; patients missing more than 1 component were not assigned an RDSS value. Multivariable logistic regression was conducted to evaluate the adjusted association between race/ethnicity and the outcomes listed above. Besides race/ethnicity, all multivariable models included the demographic variables of age, sex, insurance, and median household income. Other factors were considered for inclusion if they were associated with the outcome in unadjusted analyses (P<0.20) or deemed clinically relevant. All models were adjusted for the possibility of clustering by site. Results are reported for the race/ethnicity factor as odds ratios with 95% CI.
RESULTS
Of the 2130 subjects included in this analysis, 818 (38%) were NHW, 511 (24%) were NHB, and 801 (38%) were Hispanic. The median age for children was 4.0 months (IQR, 1.88.5 months), and 60% were male. Most children were publicly insured (65%), 31% had private insurance, and approximately 4% had no insurance. The median household income defined by patient ZIP code was $51,810 (IQR, $39,916$66,272), and nearly all children (97%) had a primary care provider (PCP). Approximately 21% of all children had relevant comorbidities and 17% of children were enrolled from the ICU. Overall, the median LOS was 2 days (IQR, 14 days).
The unadjusted associations between race/ethnicity and other demographic and historical characteristics are shown in Table 1. NHB and Hispanic children were more likely to have public insurance and less likely to have relevant major comorbidities when compared to NHW children. With regard to care received the week before hospitalization, NHW children were more likely to have visited their PCP, taken corticosteroids and/or antibiotics, and were least likely to have visited an ED when compared to NHB and Hispanic children.
| White, Non‐Hispanic, n=818, % | Black, Non‐Hispanic, n=511, % | Hispanic, n=801, % | P | |
|---|---|---|---|---|
| ||||
| Demographic characteristics | ||||
| Age, months, median (IQR) | 3.2 (1.57.4) | 5.0 (1.99.2) | 4.4 (2.09.1) | <0.001 |
| Female | 39.7 | 40.9 | 40.4 | 0.91 |
| Insurance | <0.001 | |||
| Private | 56.7 | 17.0 | 13.1 | |
| Medicaid | 32.8 | 70.9 | 77.5 | |
| Other public | 6.8 | 7.6 | 4.2 | |
| None | 3.7 | 4.6 | 5.3 | |
| Median household income by ZIP code, US$, median (IQR) | $60,406 ($48,086$75,077) | $44,191 ($32,922$55,640) | $50,394 ($39,242$62,148) | <0.001 |
| Has primary care provider | 98.5 | 97.3 | 95.4 | 0.001 |
| History | ||||
| Gestational age at birth | 0.002 | |||
| <32 weeks | 4.5 | 9.2 | 6.6 | |
| 3235 weeks | 5.7 | 8.8 | 6.0 | |
| 3537 weeks | 13.3 | 10.0 | 9.7 | |
| 37 weeks | 76.0 | 71.4 | 76.9 | |
| Missing | 0.4 | 0.6 | 0.7 | |
| Weight when born | <0.001 | |||
| <3 pounds | 3.3 | 6.9 | 5.8 | |
| 34.9 pounds | 6.8 | 11.9 | 6.2 | |
| 56.9 pounds | 33.4 | 39.7 | 33.2 | |
| >7 pounds | 55.8 | 40.3 | 53.6 | |
| Missing | 0.7 | 1.4 | 1.4 | |
| Kept in an ICU, premature nursery, or any type of special‐care facility when born | 24.5 | 29.7 | 24.9 | 0.07 |
| Breast fed | 62.3 | 49.1 | 65.5 | <0.001 |
| Attends daycare | 20.7 | 25.2 | 13.3 | <0.001 |
| Number of other children (<18 years old) living in home | <0.001 | |||
| 1 | 24.2 | 25.6 | 17.0 | |
| 2 | 42.7 | 29.2 | 28.3 | |
| 3 | 33.1 | 45.2 | 54.7 | |
| Neither parent has asthma | 66.1 | 56.6 | 77.7 | <0.001 |
| Maternal smoking during pregnancy | 21.8 | 21.3 | 6.0 | <0.001 |
| Secondhand smoke exposure | 12.9 | 20.2 | 8.7 | <0.001 |
| History of wheezing | 21.1 | 25.9 | 21.8 | 0.12 |
| Ever intubated | 9.5 | 13.2 | 9.2 | 0.05 |
| Major relevant comorbidities | 23.6 | 21.1 | 18.2 | 0.03 |
| Received palivizumab (respiratory syncytial virus vaccine) | 8.7 | 12.7 | 8.9 | 0.04 |
| Received influenza vaccine this year | 20.2 | 24.7 | 21.2 | 0.15 |
| In past 12 months, admitted overnight to hospital for bronchiolitis/wheezing/reactive airway disease | 45.0 | 57.9 | 55.9 | 0.06 |
| In past 12 months, admitted overnight to hospital for pneumonia | 16.1 | 14.9 | 25.0 | 0.049 |
| Current illness (before index visit) | ||||
| Any primary care provider or clinic visits during past week | 75.0 | 44.1 | 58.3 | <0.001 |
| Any ED visits during past week | 29.1 | 30.3 | 34.6 | 0.049 |
| Over the past week used inhaled bronchodilator | 40.6 | 36.2 | 37.0 | 0.18 |
| Over the past week used inhaled/nebulized corticosteroids | 8.7 | 8.1 | 7.7 | 0.76 |
| Over the past week taken any steroid liquids or pills or shots for bronchiolitis | 12.8 | 11.7 | 8.3 | 0.012 |
| Over the past week taken antibiotics | 21.9 | 17.0 | 17.9 | 0.045 |
| Onset of difficulty breathing before admission | 0.03 | |||
| None | 2.0 | 2.2 | 2.4 | |
| <24 hours | 28.8 | 27.2 | 25.1 | |
| 13 days | 41.1 | 41.6 | 45.9 | |
| 47 days | 22.1 | 19.1 | 21.2 | |
| >7 days | 6.0 | 9.9 | 5.3 | |
| Over the past 24 hours, the level of discomfort or distress felt by the child because of symptoms | <0.001 | |||
| Mild | 15.5 | 21.3 | 18.5 | |
| Moderate | 47.8 | 39.3 | 37.2 | |
| Severe | 36.1 | 37.6 | 42.6 | |
The unadjusted associations between race/ethnicity and clinical characteristics at preadmission visit and hospital admission are shown in Table 2. RDSS values were calculated for 2130 children; 1,752 (82%) RDSS values contained all 4 components. Of those requiring imputed values, 234 (11%) were missing 1 component, and 139 (7%) were missing more than 1 component. Per RDSS scores, NHB children presented with a more severe case of bronchiolitis when compared to NHW and Hispanic children. During admission, minority children were more likely to receive nebulized albuterol and less likely to visit the ICU. NHB children received the least inpatient laboratory testing and were least likely to receive chest x‐rays during hospital admission among all groups.
| White, Non‐Hispanic, n=818, % | Black, Non‐Hispanic, n=511, % | Hispanic, n=801, % | P | |
|---|---|---|---|---|
| ||||
| Preadmission clinical findings and treatments | ||||
| Reason brought to the hospital | ||||
| Fever | 29.7 | 30.2 | 40.7 | <0.001 |
| Fussy | 32.6 | 31.6 | 28.4 | 0.18 |
| Ear Infection | 6.0 | 4.3 | 4.4 | 0.23 |
| Not drinking well | 35.0 | 27.5 | 27.2 | 0.001 |
| Cough | 54.1 | 55.5 | 61.3 | 0.009 |
| Other reasons | 29.0 | 27.6 | 23.5 | 0.04 |
| Apnea | 8.5 | 6.2 | 6.1 | 0.11 |
| Respiratory rate (breaths/minute) | 0.001 | |||
| <40 | 23.8 | 18.2 | 28.1 | |
| 4049 | 30.8 | 30.7 | 29.3 | |
| 5059 | 17.6 | 15.5 | 16.0 | |
| 60 | 27.8 | 35.6 | 26.6 | |
| Presence of cough | 83.0 | 88.0 | 87.0 | 0.045 |
| Presence of wheezing | 63.0 | 69.0 | 63.0 | 0.42 |
| Fever (temperature 100.4F) | 22.7 | 28.5 | 35.4 | <0.001 |
| Retractions | 0.002 | |||
| None | 22.9 | 19.0 | 23.0 | |
| Mild | 39.4 | 41.7 | 44.4 | |
| Moderate/severe | 28.4 | 31.1 | 28.1 | |
| Missing | 9.4 | 8.2 | 4.5 | |
| Air entry on auscultation | 0.01 | |||
| Normal | 39.6 | 31.7 | 33.6 | |
| Mild difficulty | 31.4 | 33.5 | 36.3 | |
| Moderate difficulty | 11.0 | 14.3 | 14.1 | |
| Severe difficulty | 2.0 | 2.3 | 2.6 | |
| Missing | 16.0 | 18.2 | 13.4 | |
| Oxygen saturation on room air <90 | 12.2 | 9.8 | 11.8 | 0.37 |
| Given nebulized albuterol | 53.0 | 65.0 | 63.0 | <0.001 |
| Given nebulized epinephrine | 15.4 | 20.4 | 18.4 | 0.06 |
| Given steroids, inhaled or systemic | 16.0 | 20.5 | 19.4 | 0.08 |
| Given antibiotics | 25.5 | 22.6 | 27.8 | 0.12 |
| Oral Intake | <0.001 | |||
| Adequate | 41.3 | 50.7 | 40.8 | |
| Inadequate | 43.5 | 32.5 | 47.7 | |
| Missing | 15.2 | 16.8 | 11.5 | |
| IV placed | 56.9 | 51.5 | 61.9 | 0.001 |
| Any laboratory tests | 86.3 | 91.3 | 88.0 | 0.02 |
| Chest x‐ray | 59.0 | 64.0 | 65.0 | 0.03 |
| RDSS, tertiles | <0.001 | |||
| 1 (3.00) | 36.0 | 24.0 | 34.0 | |
| 2 (3.0115.00) | 30.0 | 33.0 | 34.0 | |
| 3 (>5) | 25.0 | 36.0 | 27.0 | |
| Not calculated | 9.0 | 6.0 | 4.0 | |
| Virology results | ||||
| Respiratory syncytial virus | 75.9 | 67.5 | 71.0 | 0.003 |
| Human rhinovirus | 23.8 | 30.1 | 25.0 | 0.03 |
| Human metapneumovirus | 6.1 | 6.8 | 8.4 | 0.20 |
| Inpatient clinical findings and treatments | ||||
| Length of stay 3 days | 46.5 | 39.3 | 45.4 | 0.03 |
| Ever in observation unit | 8.6 | 7.8 | 4.0 | 0.001 |
| Ever in regular ward | 89.4 | 93.0 | 94.5 | 0.001 |
| Ever in step‐down unit | 5.0 | 3.2 | 7.8 | 0.002 |
| Ever in ICU | 20.3 | 15.0 | 15.9 | 0.02 |
| Required CPAP or intubation | 7.7 | 4.6 | 8.8 | 0.02 |
| Given nebulized albuterol | 37.6 | 48.0 | 46.7 | <0.001 |
| Given nebulized epinephrine | 10.7 | 14.9 | 13.0 | 0.07 |
| Given steroids, inhaled or systemic | 21.3 | 27.3 | 23.5 | 0.047 |
| Given antibiotics | 38.9 | 34.3 | 38.6 | 0.19 |
| Received IV fluids | 53.1 | 45.6 | 57.1 | <0.001 |
| Any laboratory tests | 52.2 | 41.6 | 51.7 | <0.001 |
| Chest x‐ray | 27.1 | 18.6 | 22.9 | 0.002 |
Discharge treatment and outcomes at 1‐week follow‐up are shown in Table 3. A total of 1771 patients (83%) were reached by telephone. No statistically significant differences between racial/ethnic groups were found regarding hospital discharge on corticosteroids and likelihood of bronchiolitis‐related relapse.
| White, Non‐Hispanic, n=818, % | Black, Non‐Hispanic, n=511, % | Hispanic, n=801, % | P | |
|---|---|---|---|---|
| Discharged on inhaled corticosteroids | 9.5 | 11.1 | 13.3 | 0.08 |
| Discharged on oral corticosteroids | 9.8 | 12.4 | 8.5 | 0.11 |
| Child's condition at 1‐week follow‐up compared to on discharge | 0.001 | |||
| Much worse/worse | 1.8 | 0.7 | 0.4 | |
| About the same | 3.4 | 6.4 | 2.5 | |
| Better | 38.2 | 39.1 | 34.2 | |
| All better | 56.6 | 53.7 | 62.9 | |
| Child's cough at 1‐week follow‐up compared to on discharge | 0.10 | |||
| Much worse/worse | 2.1 | 1.2 | 1.0 | |
| About the same | 5.0 | 8.4 | 5.2 | |
| Better | 29.4 | 31.2 | 28.6 | |
| All better | 63.5 | 59.2 | 65.2 | |
| Bronchiolitis relapse | 10.7 | 11.9 | 10.3 | 0.81 |
Given the large potential for confounding regarding our initial findings, we examined multivariable‐adjusted associations of race/ethnicity and bronchiolitis management (Table 4). Receiving albuterol during the preadmission visit and chest x‐rays during hospitalization remained significantly associated with race/ethnicity in adjusted analyses, as NHB children were most likely to receive albuterol during the preadmission visit but least likely to receive chest x‐rays during hospitalization. Several outcomes with statistically significant differences found during unadjusted analyses (eg, chest x‐rays at preadmission visit, albuterol during hospitalization, CPAP/emntubation use, ICU admission, and LOS) were not independently associated with race/ethnicity in multivariable models. By contrast, adjusted analyses revealed Hispanic children as significantly more likely to be discharged on inhaled corticosteroids when compared to NHW and NHB children; this association had borderline statistical significance (P=0.08) in the unadjusted analysis. Last, we observed no significant racial/ethnic differences with respect to corticosteroids given at preadmission visit or hospitalization as well as no differences regarding bronchiolitis‐related relapse in either unadjusted or adjusted analyses.
| White, Non‐Hispanic | Black, Non‐Hispanic | Hispanic | ||||
|---|---|---|---|---|---|---|
| OR | 95%CI | OR | 95%CI | OR | 95%CI | |
| ||||||
| Preadmission visit | ||||||
| Chest x‐ray* | 1.00 | (Reference) | 1.06 | (0.831.36) | 1.09 | (0.741.60) |
| Albuterol use | 1.00 | (Reference) | 1.58 | (1.202.07) | 1.42 | (0.892.26) |
| Steroid use, inhaled or systemic | 1.00 | (Reference) | 1.05 | (0.721.54) | 1.11 | (0.751.65) |
| During hospitalization | ||||||
| Chest x‐ray‖ | 1.00 | (Reference) | 0.66 | (0.490.90) | 0.95 | (0.601.50) |
| Albuterol use | 1.00 | (Reference) | 1.21 | (0.821.79) | 1.23 | (0.632.38) |
| Steroid use, inhaled or systemic# | 1.00 | (Reference) | 1.13 | (0.721.80) | 1.19 | (0.791.79) |
| ICU care** | 1.00 | (Reference) | 0.74 | (0.421.29) | 0.87 | (0.631.21) |
| Required CPAP/emntubation | 1.00 | (Reference) | 0.72 | (0.361.41) | 1.84 | (0.933.64) |
| Length of stay >3 days | 1.00 | (Reference) | 0.77 | (0.581.03) | 1.05 | (0.761.47) |
| Discharge | ||||||
| Discharged on inhaled steroids | 1.00 | (Reference) | 1.31 | (0.862.00) | 1.92 | (1.193.10) |
| Bronchiolitis relapse‖‖ | 1.00 | (Reference) | 1.08 | (0.621.87) | 0.96 | (0.551.65) |
DISCUSSION
It is unclear if management and treatment differences found in children with severe bronchiolitis are associated with race/ethnicity. We sought to determine if such differences exist by analyzing data from a prospective multicenter cohort study. Differences in management and treatment are discussed in the context of AAP guidelines, as they are widely used in clinical practice.
The RDSS was used to help assess severity of illness across race/ethnicity. NHB children had the highest RDSS score (ie, most severe bronchiolitis presentation) compared to NHW and Hispanic children. The reason for this difference in severity is unclear, but a potential explanation may be that minority communities lack access to care and as a result delay care and treatment for respiratory disease until care seems absolutely necessary.[19] Indeed, in our sample, minority children were less likely to visit their PCP and take corticosteroids the week before hospitalization when compared with NHW children. Our finding runs counter to a similar study by Boudreaux et al. that found no association between race/ethnicity and the clinical presentation of children with acute asthma during the preadmission setting.[20] The more severe bronchiolitis presentation among NHB children may have suggested that these children would require a longer hospital LOS (3 days). However, our multivariable analysis found no difference in LOS across racial/ethnic groups. This LOS finding is intriguing given previous studies suggesting that minorities, of diverse ages and with diverse diagnoses, were more likely to have a shorter LOS (as well as less likely to be admitted to the ICU with a similar diagnosis) when compared to nonminorities.[21, 22] Additionally, because our study sampled 16 sites, variation in clinical judgment and pediatric ICU protocol may have also played a role.[23]
Our findings also shed light on how differences in bronchiolitis management relate to AAP guidelines. According to the AAP, corticosteroid medications should not be used routinely in the management of bronchiolitis. Despite this recommendation, previous reports indicate that up to 60% of infants with severe bronchiolitis receive corticosteroid therapy.[24, 25] Our finding that Hispanic children with severe bronchiolitis were most likely to be discharged on inhaled corticosteroids is potentially concerning, as it exposes a subset of children to treatment that is not recommended. On the other hand, given the increased risk of future asthma in Hispanic communities, a higher use of inhaled corticosteroids might be seen as appropriate. Either way, our findings are inconsistent with related studies concluding that racial minority pediatric patients with asthma were less likely to receive inhaled corticosteroids.[26, 27, 28, 29] Similarly, NHB children were most likely to receive albuterol during the preadmission visit on multivariable analysis. Although a trial dose of albuterol may be common practice in treating severe bronchiolitis, AAP recommendations do not support its routine application. Increased albuterol during preadmission may have been related to an elevated bronchiolitis severity at presentation among NHB children (as indicated by the RDSS). Potential reasons for these 2 differences in treatment remain unclear. They may represent medical management efforts by discharging physicians to prescribe: (1) corticosteroids to racial/ethnic communities with a higher risk of childhood asthma; (2) albuterol to children presenting with a more severe case of bronchiolitis. These possibilities merit further study.
The AAP also recommends diagnosis of bronchiolitis on the basis of history and physical examination; laboratory and radiologic studies should not be routinely used for diagnostic purposes. Although it is possible for chest radiograph abnormalities to be consistent with bronchiolitis, there is little evidence that an abnormal finding is associated with disease severity.[30] The clinical value of diagnostic testing in children with bronchiolitis is not well supported by evidence, and limiting exposure to radiation should be a priority.[31, 32] Our analysis found that NHW and Hispanic children were more likely to receive chest x‐rays while hospitalized when compared with NHB children. Unnecessary and increased radiation exposure in children is potentially harmful and warrants intervention to minimize risk.
Establishing systematic clinical pathways in bronchiolitis management may address the practice variation found nationwide and across race/ethnicity in this study. Although clinical guidelines provide general recommendations, clinical pathways are defined treatment protocols aiming to standardize and optimize patient outcomes and clinical efficiency. The incorporation of clinical pathways into healthcare systems has increased recently as a result of their favorable association with medical complications, healthcare costs, and LOS.[33] With respect to bronchiolitis, implementation of clinical pathways has proven to reduce use of inappropriate therapies, decrease risk of bronchiolitis‐related hospital readmission, and help with discharge planning.[30, 34, 35]
Notwithstanding the differences found in this study, management of children with bronchiolitis was, in many respects, comparable across racial/ethnic groups. For example, our multivariable analysis found no significant differences across racial/ethnic groups with respect to chest x‐rays and corticosteroid use during the preadmission visit, administration of albuterol or corticosteroids during hospitalization, use of CPAP/emntubation, ICU admission, hospital LOS, or likelihood of a bronchiolitis‐related relapse. The general lack of race/ethnic differences is consistent with similar research on inpatient management of acute asthma.[36]
This study has potential limitations. The hospitals participating in the study are predominantly urban, academically affiliated hospitals. This may result in findings that are less generalizable to rural and community hospitals. Second, the race/ethnicity classification used does not take into consideration the diversity and complexity of defining race/ethnicity in the United States. Third, bronchiolitis is defined as a clinical diagnosis that can encapsulate multiple lower respiratory infection diagnoses. As a result, there may have been variability in clinical and institutional practice. An additional limitation was utilizing RDSS to assess bronchiolitis severity. Although there is currently no validated, universally accepted score to assess bronchiolitis severity, several scores are available in the literature with varying performance. Last, the ZIP code‐based median household incomes used to assess SES are higher than federal data in similar geographic locations, potentially resulting in findings that are less generalizable.
CONCLUSION
This multicenter prospective cohort study found several differences in bronchiolitis presentation and management among children stratified by race/ethnicity in 16 geographically dispersed sites after controlling for multiple factors including SES. Our analysis showed that, when compared to NHW children, NHB children were more likely to be given albuterol during the preadmission visit and less likely to receive chest x‐rays as inpatients; Hispanic children were more likely to be discharged on inhaled corticosteroids. These differences are concerning for 2 reasons: (1) based on current evidence, race/ethnicity should not affect care in children with severe bronchiolitis; and (2) the observed differences in diagnostic testing and treatment are not recommended by the evidence‐based AAP guidelines. It is also important to note that these differences do not demonstrate that a specific race/ethnicity received better or worse clinical care. The goal of this analysis was not to determine the effectiveness of certain management tendencies in children with severe bronchiolitis, but rather to examine differences in the presentation and management of children from different racial/ethnic groups. The causes for the observed findings require further study. In the meantime, we suggest increasing the number of hospitals that incorporate clinical care pathways for severe bronchiolitis to control variation in practice and limit the impact that race/ethnicity may have in the provision of services.
Acknowledgements
The authors thank the MARC‐30 investigators for their ongoing dedication to bronchiolitis research.
Disclosures: This study was supported by the grant U01 AI‐67693 (Camargo) from the National Institutes of Health (Bethesda, MD). The content of this manuscript is solely the responsibility of the authors and does not necessarily represent the official views of the National Institute of Allergy and Infectious Diseases or the National Institutes of Health. The authors have no financial relationships relevant to this article or conflicts of interest to disclose. Mr. Santiago conceptualized the analysis, interpreted the data, drafted the initial manuscript, and approved the final manuscript as submitted. Dr. Mansbach conceptualized and designed the initial study, coordinated data collection at 1 of the sites, critically reviewed the manuscript, and approved the final manuscript as submitted. Dr. Chou was responsible for analysis and interpretation of data, critically reviewed the manuscript, and approved the final manuscript as submitted. Dr. Delgado coordinated data collection at 1 of the sites, critically reviewed the manuscript, and approved the final manuscript as submitted. Dr. Piedra conceptualized and designed the initial study, coordinated virology testing, critically reviewed the manuscript, and approved the final manuscript as submitted. Ms. Sullivan coordinated data collection at all sites, critically reviewed the manuscript, and approved the final manuscript as submitted. Ms. Espinola was responsible for data management, analysis and interpretation of data, drafting of the initial manuscript, and approved the final manuscript as submitted. Dr. Camargo conceptualized and designed the initial study, assisted with data analysis and interpretation of data, critically reviewed the manuscript, and approved the final manuscript as submitted.
APPENDIX
| Principal Investigators at the 16 Participating Sites in MARC‐30 | |
| Besh Barcega, MD | Loma Linda University Children's Hospital, Loma Linda, CA |
| John Cheng, MD and Carlos Delgado, MD | Children's Healthcare of Atlanta at Egleston, Atlanta, GA |
| Dorothy Damore, MD and Nikhil Shah, MD | New York Presbyterian Hospital, New York, NY |
| Haitham Haddad, MD | Rainbow Babies & Children's Hospital, Cleveland, OH |
| Paul Hain, MD and Mark Riederer, MD | Monroe Carell Jr. Children's Hospital at Vanderbilt, Nashville, TN |
| Frank LoVecchio, DO | Maricopa Medical Center, Phoenix, AZ |
| Charles Macias, MD, MPH | Texas Children's Hospital, Houston, TX |
| Jonathan Mansbach, MD, MPH | Boston Children's Hospital, Boston, MA |
| Eugene Mowad, MD | Akron Children's Hospital, Akron, OH |
| Brian Pate, MD | Children's Mercy Hospital & Clinics, Kansas City, MO |
| M. Jason Sanders, MD | Children's Memorial Hermann Hospital, Houston, TX |
| Alan Schroeder, MD | Santa Clara Valley Medical Center, San Jose, CA |
| Michelle Stevenson, MD, MS | Kosair Children's Hospital, Louisville, KY |
| Erin Stucky Fisher, MD | Rady Children's Hospital, San Diego, CA |
| Stephen Teach, MD, MPH | Children's National Medical Center, Washington, DC |
| Lisa Zaoutis, MD | Children's Hospital of Philadelphia, Philadelphia, PA |
- , , . Direct medical costs of bronchiolitis‐related hospitalizations in the United States. Pediatrics. 2006;118(6):2418–2423.
- , , , , . Trends in bronchiolitis hospitalizations in the United States, 2000–2009. Pediatrics. 2013;132(1):28–36.
- , , , , . Infectious disease hospitalizations among infants in the United States. Pediatrics. 2008;121(2):244–252.
- , . Respiratory syncytial virus. Curr Probl Pediatr. 1993;23(2):50–79.
- , , , , . Rates of hospitalization for respiratory syncytial virus infection among children in Medicaid. J Pediatr. 2000;137(6):865–870.
- American Academy of Pediatrics Subcommittee on Diagnosis and Management of Bronchiolitis. Diagnosis and management of bronchiolitis. Pediatrics. 2006;118(4):1774–1793.
- , , . US outpatient office visits for bronchiolitis, 1993–2004. Ambul Pediatr. 2007;7(4):304–307.
- , , , et al. Study of interobserver reliability in clinical assessment of RSV lower respiratory illness: a pediatric investigators collaborative network for infections in Canada (PICNIC) study. Pediatr Pulmonol. 1996;22(1):23–27.
- , , , , . Effect of practice variation on resource utilization in infants hospitalized for viral lower respiratory illness. Pediatrics. 2001;108(4):851–855.
- , , . Bronchiolitis in US emergency departments 1992 to 2000: epidemiology and practice variation. Pediatr Emerg Care. 2005;21(4):242–247.
- , . Recent trends in severe respiratory syncytial virus (RSV) among US infants, 1997 to 2000. J Pediatr. 2003; 143(5 suppl):S127–S132.
- , , , , . Risk of respiratory syncytial virus infection for infants from low‐income families in relationship to age, sex, ethnic group, and maternal antibody level. J Pediatr. 1981;98(5):708–715.
- , , . Socioeconomic environmental factors and hospitalization for acute bronchiolitis during infancy. Acta Paediatr. 2002;91(3):335–338.
- , , , , . Factors associated with longer emergency department length of stay for children with bronchiolitis: a prospective multicenter study. Pediatr Emerg Care. 2009;25(10):636–641.
- , , , , . Prospective multicenter bronchiolitis study: predicting intensive care unit admissions. Acad Emerg Med. 2008;15(10):887–894.
- , , , , . Prospective multicenter study of bronchiolitis: predictors of an unscheduled visit after discharge from the emergency department. Acad Emerg Med. 2010;17(4):376–382.
- Esri. Demographic, consumer, and business data. Available at: http://www.esri.com/data/esri_data/demographic‐overview/demographic. Accessed July 25, 2013.
- , , . A randomized trial of home oxygen therapy from the emergency department for acute bronchiolitis. Pediatrics. 2006;117(3):633–640.
- , , , , , . Adherence to therapy and access to care: the relationship to excess asthma morbidity in African‐American children. Pediatr Asthma Aller. 1994;8(3):179–184.
- , , , . Race/ethnicity and asthma among children presenting to the emergency department: differences in disease severity and management. Pediatrics. 2003;111(5 pt 1):e615–e621.
- , , , . Relationship between patient race and the intensity of hospital services. Med Care. 1987;25(7):592–603.
- , , , , . African‐American and white patients admitted to the intensive care unit: is there a difference in therapy and outcome? Crit Care Med. 1995;23(4):626–636.
- , , . Acute severe asthma: differences in therapies and outcomes among pediatric intensive care units. Crit Care Med. 2002;30(3):581–585.
- , , , . International variation in the management of infants hospitalized with respiratory syncytial virus. International RSV Study Group. Eur J Pediatr. 1998;157(3):215–220.
- , , , , . Effect of practice variation on resource utilization in infants for viral lower respiratory illness. Pediatrics. 2001;108:851–855.
- , , , , , . Impact of site of care, race, and Hispanic ethnicity on medication use for childhood asthma. Pediatrics. 2002;109(1):E1.
- , , , et al. Racial/ethnic variation in asthma status and management practices among children in managed Medicaid. Pediatrics. 2002;109(5):857–865.
- , , , . Treatment adherence among low‐income children with asthma. J Pediatr Psychol. 1998;23(6):345–349.
- American Academy of Pediatrics Steering Committee on Quality Improvement and Management. Classifying recommendations for clinical practice guidelines. Pediatrics. 2004;114(3):874–877.
- , , . Randomised controlled trial of clinical outcome after chest radiograph in ambulatory acute lower‐respiratory infection in children. Lancet. 1998;351(9100):404–408.
- . Cancer risks following diagnostic and therapeutic radiation exposure in children. Pediatr Radiol. 2006;36(suppl 2):121–125.
- , , , et al. Clinical pathways: effects on professional practice, patient outcomes, length of stay and hospital costs. Cochrane Database Syst Rev. 2010;(3):CD006632.
- , , . An evidence‐based clinical pathway for bronchiolitis safely reduces antibiotic overuse. Am J Med Qual. 2002;17(5):195–199.
- , , , et al. A clinical pathway for bronchiolitis is effective in reducing readmission rates. J Pediatr. 2005;147(5):622–626.
- , , , et al. Decreasing unnecessary utilization in acute bronchiolitis care: results from the value in inpatient pediatrics network. J Hosp Med. 2013;8(1):25–30.
- , , . Race/Ethnicity differences in the inpatient management of acute asthma in the United States. Chest. 2009;135(6):1527–1534.
Bronchiolitis is the leading cause of hospitalization for infants in the United States, costs more than $500 million annually, and has seen a 30% increase ($1.34 billion to $1.73 billion) in related hospital charges from 2000 to 2009.13 Almost all children <2 years old are infected with respiratory syncytial virus, the most common cause of bronchiolitis, with 40% developing clinically recognizable bronchiolitis and 2% becoming hospitalized with severe bronchiolitis.[4, 5] Current American Academy of Pediatrics (AAP) guidelines state that routine use of bronchodilators, corticosteroids, and chest x‐rays is not recommended, and supportive care is strongly encouraged.[6] However, a lack of consensus among clinicians persists regarding bronchiolitis management.[7, 8, 9, 10] Although minority children and those with a lower socioeconomic status (SES) in the United States are more likely to present with bronchiolitis to the emergency department (ED) and be subsequently admitted when compared to the general population,[11, 12, 13] to our knowledge, no study has yet examined if race/ethnicity is independently associated with differences in the presentation and management of severe bronchiolitis (ie, bronchiolitis causing hospitalization). Although a prior bronchiolitis‐related study reported that Hispanic children had a longer ED length of stay (LOS) than non‐Hispanic white (NHW) and non‐Hispanic black (NHB) children,[14] other studies concluded that race/ethnicity were not predictors of intensive care unit (ICU) admission or unscheduled healthcare visits post‐ED discharge.[15, 16]
Determining if race/ethnicity is independently associated with certain bronchiolitis management tendencies has implications from both a health disparities standpoint (ie, unequal care based on race/ethnicity) and from a clinical perspective (ie, the potential of certain practices, such as clinical pathways, to increase the likelihood of equitable treatment). To address this knowledge gap, we examined prospective data from a multicenter study designed to evaluate multiple factors related to bronchiolitis hospitalization.
METHODS
Study Design
We conducted a multicenter prospective cohort for 3 consecutive years (20072010) as part of the Multicenter Airway Research Collaboration (MARC), a division of the Emergency Medicine Network (EMNet) (
All patients were treated at the discretion of their physician. Inclusion criteria were hospital admission with physician diagnosis of bronchiolitis, age <2 years, and ability of the child's guardian (eg, parent) to give informed consent. Patients were enrolled within 18 hours of admission. Physician diagnosis of bronchiolitis followed the AAP definition of a child with an acute respiratory illness with some combination of rhinitis, cough, tachypnea, wheezing, crackles, and/or retractions.[6] The exclusion criteria were previous enrollment and if a patient was transferred to a participating site hospital>48 hours after the initial admission. All consent and data forms were translated into Spanish. The institutional review board at each participating site approved the study.
Data Collection
Site investigators used a standardized protocol to enroll 2207 patients admitted with bronchiolitis. Investigators conducted a structured interview that assessed patients' demographic characteristics, medical and environmental history, duration of symptoms, and details of the acute illness. Race/ethnicity was assigned by report of the child's guardian to standard US Census groups. For the purpose of this analysis, mutually exclusive race/ethnicity categories were determined: NHW, NHB, or Hispanic. Non‐Hispanic patients who identified as being both white and black were categorized as NHB. Patients were excluded from analysis if neither white or black race nor Hispanic ethnicity were reported (eg, if only Asian race was reported) because of small numbers (n=67), as were patients missing all race/ethnicity data (n=10). This resulted in a total of 2130 (97%) patients in our analytical dataset. SES was assessed with 2 variables: insurance status (public, private, none) and family income, estimated by matching patients' home ZIP codes and year of enrollment to ZIP code‐based median household annual incomes obtained from Esri Business Analyst Desktop (Esri, Redlands, CA).[17]
ED and daily clinical data, including laboratory tests (eg, complete blood count, basic metabolic panel, urine analysis, blood culture), respiratory rates, oxygen saturation, medical management, and disposition were obtained by medical chart review. Additionally, in an attempt to evaluate bronchiolitis severity at presentation, a modified respiratory distress severity score (RDSS) was calculated based on 4 assessments made during the preadmission visit (ie, ED or office visit before hospital admission): respiratory rate by age, presence of wheezing (yes or no), air entry (normal, mild difficulty, or moderate/severe), and retractions (none, mild, or moderate/severe).[18] Each component was assigned a score of 0, 1, or 2, with the exception of wheeze, which was assigned either a 0 (no wheeze) or a 2 (wheeze), and then summed for a possible total score of 0 to 8.
Last, a follow‐up telephone interview was conducted 1 week after hospital discharge for each enrolled patient. Interviews assessed acute relapse, recent symptoms, and provided additional end points for longitudinal analysis of specific symptoms. All data were manually reviewed at the EMNet Coordinating Center, and site investigators were queried about missing data and discrepancies identified.
Outcome Measures
The major outcomes of this analysis were: albuterol and corticosteroid (inhaled or systemic) use during preadmission visit and hospitalization, chest x‐rays performed at preadmission visit and hospitalization, need for intensive respiratory support (ie, receiving continuous positive airway pressure [CPAP], intubation, or ICU admission), hospital LOS 3 days, discharge on inhaled corticosteroids, and relapse of bronchiolitis requiring medical attention and a change of medication within 1 week of discharge.
Statistical Analysis
Stata 11.2 (StataCorp, College Station, TX) was used for all analyses. We examined unadjusted differences between racial/ethnic groups and clinical presentation, patient management, and outcomes using 2, Fisher exact, or Kruskal‐Wallis test, as appropriate, with results reported as proportions with 95% confidence interval (CI) or median with interquartile range (IQR). Imputed values, calculated with the Stata impute command, were used to calculate the RDSS when 1 of the 4 components was missing; patients missing more than 1 component were not assigned an RDSS value. Multivariable logistic regression was conducted to evaluate the adjusted association between race/ethnicity and the outcomes listed above. Besides race/ethnicity, all multivariable models included the demographic variables of age, sex, insurance, and median household income. Other factors were considered for inclusion if they were associated with the outcome in unadjusted analyses (P<0.20) or deemed clinically relevant. All models were adjusted for the possibility of clustering by site. Results are reported for the race/ethnicity factor as odds ratios with 95% CI.
RESULTS
Of the 2130 subjects included in this analysis, 818 (38%) were NHW, 511 (24%) were NHB, and 801 (38%) were Hispanic. The median age for children was 4.0 months (IQR, 1.88.5 months), and 60% were male. Most children were publicly insured (65%), 31% had private insurance, and approximately 4% had no insurance. The median household income defined by patient ZIP code was $51,810 (IQR, $39,916$66,272), and nearly all children (97%) had a primary care provider (PCP). Approximately 21% of all children had relevant comorbidities and 17% of children were enrolled from the ICU. Overall, the median LOS was 2 days (IQR, 14 days).
The unadjusted associations between race/ethnicity and other demographic and historical characteristics are shown in Table 1. NHB and Hispanic children were more likely to have public insurance and less likely to have relevant major comorbidities when compared to NHW children. With regard to care received the week before hospitalization, NHW children were more likely to have visited their PCP, taken corticosteroids and/or antibiotics, and were least likely to have visited an ED when compared to NHB and Hispanic children.
| White, Non‐Hispanic, n=818, % | Black, Non‐Hispanic, n=511, % | Hispanic, n=801, % | P | |
|---|---|---|---|---|
| ||||
| Demographic characteristics | ||||
| Age, months, median (IQR) | 3.2 (1.57.4) | 5.0 (1.99.2) | 4.4 (2.09.1) | <0.001 |
| Female | 39.7 | 40.9 | 40.4 | 0.91 |
| Insurance | <0.001 | |||
| Private | 56.7 | 17.0 | 13.1 | |
| Medicaid | 32.8 | 70.9 | 77.5 | |
| Other public | 6.8 | 7.6 | 4.2 | |
| None | 3.7 | 4.6 | 5.3 | |
| Median household income by ZIP code, US$, median (IQR) | $60,406 ($48,086$75,077) | $44,191 ($32,922$55,640) | $50,394 ($39,242$62,148) | <0.001 |
| Has primary care provider | 98.5 | 97.3 | 95.4 | 0.001 |
| History | ||||
| Gestational age at birth | 0.002 | |||
| <32 weeks | 4.5 | 9.2 | 6.6 | |
| 3235 weeks | 5.7 | 8.8 | 6.0 | |
| 3537 weeks | 13.3 | 10.0 | 9.7 | |
| 37 weeks | 76.0 | 71.4 | 76.9 | |
| Missing | 0.4 | 0.6 | 0.7 | |
| Weight when born | <0.001 | |||
| <3 pounds | 3.3 | 6.9 | 5.8 | |
| 34.9 pounds | 6.8 | 11.9 | 6.2 | |
| 56.9 pounds | 33.4 | 39.7 | 33.2 | |
| >7 pounds | 55.8 | 40.3 | 53.6 | |
| Missing | 0.7 | 1.4 | 1.4 | |
| Kept in an ICU, premature nursery, or any type of special‐care facility when born | 24.5 | 29.7 | 24.9 | 0.07 |
| Breast fed | 62.3 | 49.1 | 65.5 | <0.001 |
| Attends daycare | 20.7 | 25.2 | 13.3 | <0.001 |
| Number of other children (<18 years old) living in home | <0.001 | |||
| 1 | 24.2 | 25.6 | 17.0 | |
| 2 | 42.7 | 29.2 | 28.3 | |
| 3 | 33.1 | 45.2 | 54.7 | |
| Neither parent has asthma | 66.1 | 56.6 | 77.7 | <0.001 |
| Maternal smoking during pregnancy | 21.8 | 21.3 | 6.0 | <0.001 |
| Secondhand smoke exposure | 12.9 | 20.2 | 8.7 | <0.001 |
| History of wheezing | 21.1 | 25.9 | 21.8 | 0.12 |
| Ever intubated | 9.5 | 13.2 | 9.2 | 0.05 |
| Major relevant comorbidities | 23.6 | 21.1 | 18.2 | 0.03 |
| Received palivizumab (respiratory syncytial virus vaccine) | 8.7 | 12.7 | 8.9 | 0.04 |
| Received influenza vaccine this year | 20.2 | 24.7 | 21.2 | 0.15 |
| In past 12 months, admitted overnight to hospital for bronchiolitis/wheezing/reactive airway disease | 45.0 | 57.9 | 55.9 | 0.06 |
| In past 12 months, admitted overnight to hospital for pneumonia | 16.1 | 14.9 | 25.0 | 0.049 |
| Current illness (before index visit) | ||||
| Any primary care provider or clinic visits during past week | 75.0 | 44.1 | 58.3 | <0.001 |
| Any ED visits during past week | 29.1 | 30.3 | 34.6 | 0.049 |
| Over the past week used inhaled bronchodilator | 40.6 | 36.2 | 37.0 | 0.18 |
| Over the past week used inhaled/nebulized corticosteroids | 8.7 | 8.1 | 7.7 | 0.76 |
| Over the past week taken any steroid liquids or pills or shots for bronchiolitis | 12.8 | 11.7 | 8.3 | 0.012 |
| Over the past week taken antibiotics | 21.9 | 17.0 | 17.9 | 0.045 |
| Onset of difficulty breathing before admission | 0.03 | |||
| None | 2.0 | 2.2 | 2.4 | |
| <24 hours | 28.8 | 27.2 | 25.1 | |
| 13 days | 41.1 | 41.6 | 45.9 | |
| 47 days | 22.1 | 19.1 | 21.2 | |
| >7 days | 6.0 | 9.9 | 5.3 | |
| Over the past 24 hours, the level of discomfort or distress felt by the child because of symptoms | <0.001 | |||
| Mild | 15.5 | 21.3 | 18.5 | |
| Moderate | 47.8 | 39.3 | 37.2 | |
| Severe | 36.1 | 37.6 | 42.6 | |
The unadjusted associations between race/ethnicity and clinical characteristics at preadmission visit and hospital admission are shown in Table 2. RDSS values were calculated for 2130 children; 1,752 (82%) RDSS values contained all 4 components. Of those requiring imputed values, 234 (11%) were missing 1 component, and 139 (7%) were missing more than 1 component. Per RDSS scores, NHB children presented with a more severe case of bronchiolitis when compared to NHW and Hispanic children. During admission, minority children were more likely to receive nebulized albuterol and less likely to visit the ICU. NHB children received the least inpatient laboratory testing and were least likely to receive chest x‐rays during hospital admission among all groups.
| White, Non‐Hispanic, n=818, % | Black, Non‐Hispanic, n=511, % | Hispanic, n=801, % | P | |
|---|---|---|---|---|
| ||||
| Preadmission clinical findings and treatments | ||||
| Reason brought to the hospital | ||||
| Fever | 29.7 | 30.2 | 40.7 | <0.001 |
| Fussy | 32.6 | 31.6 | 28.4 | 0.18 |
| Ear Infection | 6.0 | 4.3 | 4.4 | 0.23 |
| Not drinking well | 35.0 | 27.5 | 27.2 | 0.001 |
| Cough | 54.1 | 55.5 | 61.3 | 0.009 |
| Other reasons | 29.0 | 27.6 | 23.5 | 0.04 |
| Apnea | 8.5 | 6.2 | 6.1 | 0.11 |
| Respiratory rate (breaths/minute) | 0.001 | |||
| <40 | 23.8 | 18.2 | 28.1 | |
| 4049 | 30.8 | 30.7 | 29.3 | |
| 5059 | 17.6 | 15.5 | 16.0 | |
| 60 | 27.8 | 35.6 | 26.6 | |
| Presence of cough | 83.0 | 88.0 | 87.0 | 0.045 |
| Presence of wheezing | 63.0 | 69.0 | 63.0 | 0.42 |
| Fever (temperature 100.4F) | 22.7 | 28.5 | 35.4 | <0.001 |
| Retractions | 0.002 | |||
| None | 22.9 | 19.0 | 23.0 | |
| Mild | 39.4 | 41.7 | 44.4 | |
| Moderate/severe | 28.4 | 31.1 | 28.1 | |
| Missing | 9.4 | 8.2 | 4.5 | |
| Air entry on auscultation | 0.01 | |||
| Normal | 39.6 | 31.7 | 33.6 | |
| Mild difficulty | 31.4 | 33.5 | 36.3 | |
| Moderate difficulty | 11.0 | 14.3 | 14.1 | |
| Severe difficulty | 2.0 | 2.3 | 2.6 | |
| Missing | 16.0 | 18.2 | 13.4 | |
| Oxygen saturation on room air <90 | 12.2 | 9.8 | 11.8 | 0.37 |
| Given nebulized albuterol | 53.0 | 65.0 | 63.0 | <0.001 |
| Given nebulized epinephrine | 15.4 | 20.4 | 18.4 | 0.06 |
| Given steroids, inhaled or systemic | 16.0 | 20.5 | 19.4 | 0.08 |
| Given antibiotics | 25.5 | 22.6 | 27.8 | 0.12 |
| Oral Intake | <0.001 | |||
| Adequate | 41.3 | 50.7 | 40.8 | |
| Inadequate | 43.5 | 32.5 | 47.7 | |
| Missing | 15.2 | 16.8 | 11.5 | |
| IV placed | 56.9 | 51.5 | 61.9 | 0.001 |
| Any laboratory tests | 86.3 | 91.3 | 88.0 | 0.02 |
| Chest x‐ray | 59.0 | 64.0 | 65.0 | 0.03 |
| RDSS, tertiles | <0.001 | |||
| 1 (3.00) | 36.0 | 24.0 | 34.0 | |
| 2 (3.0115.00) | 30.0 | 33.0 | 34.0 | |
| 3 (>5) | 25.0 | 36.0 | 27.0 | |
| Not calculated | 9.0 | 6.0 | 4.0 | |
| Virology results | ||||
| Respiratory syncytial virus | 75.9 | 67.5 | 71.0 | 0.003 |
| Human rhinovirus | 23.8 | 30.1 | 25.0 | 0.03 |
| Human metapneumovirus | 6.1 | 6.8 | 8.4 | 0.20 |
| Inpatient clinical findings and treatments | ||||
| Length of stay 3 days | 46.5 | 39.3 | 45.4 | 0.03 |
| Ever in observation unit | 8.6 | 7.8 | 4.0 | 0.001 |
| Ever in regular ward | 89.4 | 93.0 | 94.5 | 0.001 |
| Ever in step‐down unit | 5.0 | 3.2 | 7.8 | 0.002 |
| Ever in ICU | 20.3 | 15.0 | 15.9 | 0.02 |
| Required CPAP or intubation | 7.7 | 4.6 | 8.8 | 0.02 |
| Given nebulized albuterol | 37.6 | 48.0 | 46.7 | <0.001 |
| Given nebulized epinephrine | 10.7 | 14.9 | 13.0 | 0.07 |
| Given steroids, inhaled or systemic | 21.3 | 27.3 | 23.5 | 0.047 |
| Given antibiotics | 38.9 | 34.3 | 38.6 | 0.19 |
| Received IV fluids | 53.1 | 45.6 | 57.1 | <0.001 |
| Any laboratory tests | 52.2 | 41.6 | 51.7 | <0.001 |
| Chest x‐ray | 27.1 | 18.6 | 22.9 | 0.002 |
Discharge treatment and outcomes at 1‐week follow‐up are shown in Table 3. A total of 1771 patients (83%) were reached by telephone. No statistically significant differences between racial/ethnic groups were found regarding hospital discharge on corticosteroids and likelihood of bronchiolitis‐related relapse.
| White, Non‐Hispanic, n=818, % | Black, Non‐Hispanic, n=511, % | Hispanic, n=801, % | P | |
|---|---|---|---|---|
| Discharged on inhaled corticosteroids | 9.5 | 11.1 | 13.3 | 0.08 |
| Discharged on oral corticosteroids | 9.8 | 12.4 | 8.5 | 0.11 |
| Child's condition at 1‐week follow‐up compared to on discharge | 0.001 | |||
| Much worse/worse | 1.8 | 0.7 | 0.4 | |
| About the same | 3.4 | 6.4 | 2.5 | |
| Better | 38.2 | 39.1 | 34.2 | |
| All better | 56.6 | 53.7 | 62.9 | |
| Child's cough at 1‐week follow‐up compared to on discharge | 0.10 | |||
| Much worse/worse | 2.1 | 1.2 | 1.0 | |
| About the same | 5.0 | 8.4 | 5.2 | |
| Better | 29.4 | 31.2 | 28.6 | |
| All better | 63.5 | 59.2 | 65.2 | |
| Bronchiolitis relapse | 10.7 | 11.9 | 10.3 | 0.81 |
Given the large potential for confounding regarding our initial findings, we examined multivariable‐adjusted associations of race/ethnicity and bronchiolitis management (Table 4). Receiving albuterol during the preadmission visit and chest x‐rays during hospitalization remained significantly associated with race/ethnicity in adjusted analyses, as NHB children were most likely to receive albuterol during the preadmission visit but least likely to receive chest x‐rays during hospitalization. Several outcomes with statistically significant differences found during unadjusted analyses (eg, chest x‐rays at preadmission visit, albuterol during hospitalization, CPAP/emntubation use, ICU admission, and LOS) were not independently associated with race/ethnicity in multivariable models. By contrast, adjusted analyses revealed Hispanic children as significantly more likely to be discharged on inhaled corticosteroids when compared to NHW and NHB children; this association had borderline statistical significance (P=0.08) in the unadjusted analysis. Last, we observed no significant racial/ethnic differences with respect to corticosteroids given at preadmission visit or hospitalization as well as no differences regarding bronchiolitis‐related relapse in either unadjusted or adjusted analyses.
| White, Non‐Hispanic | Black, Non‐Hispanic | Hispanic | ||||
|---|---|---|---|---|---|---|
| OR | 95%CI | OR | 95%CI | OR | 95%CI | |
| ||||||
| Preadmission visit | ||||||
| Chest x‐ray* | 1.00 | (Reference) | 1.06 | (0.831.36) | 1.09 | (0.741.60) |
| Albuterol use | 1.00 | (Reference) | 1.58 | (1.202.07) | 1.42 | (0.892.26) |
| Steroid use, inhaled or systemic | 1.00 | (Reference) | 1.05 | (0.721.54) | 1.11 | (0.751.65) |
| During hospitalization | ||||||
| Chest x‐ray‖ | 1.00 | (Reference) | 0.66 | (0.490.90) | 0.95 | (0.601.50) |
| Albuterol use | 1.00 | (Reference) | 1.21 | (0.821.79) | 1.23 | (0.632.38) |
| Steroid use, inhaled or systemic# | 1.00 | (Reference) | 1.13 | (0.721.80) | 1.19 | (0.791.79) |
| ICU care** | 1.00 | (Reference) | 0.74 | (0.421.29) | 0.87 | (0.631.21) |
| Required CPAP/emntubation | 1.00 | (Reference) | 0.72 | (0.361.41) | 1.84 | (0.933.64) |
| Length of stay >3 days | 1.00 | (Reference) | 0.77 | (0.581.03) | 1.05 | (0.761.47) |
| Discharge | ||||||
| Discharged on inhaled steroids | 1.00 | (Reference) | 1.31 | (0.862.00) | 1.92 | (1.193.10) |
| Bronchiolitis relapse‖‖ | 1.00 | (Reference) | 1.08 | (0.621.87) | 0.96 | (0.551.65) |
DISCUSSION
It is unclear if management and treatment differences found in children with severe bronchiolitis are associated with race/ethnicity. We sought to determine if such differences exist by analyzing data from a prospective multicenter cohort study. Differences in management and treatment are discussed in the context of AAP guidelines, as they are widely used in clinical practice.
The RDSS was used to help assess severity of illness across race/ethnicity. NHB children had the highest RDSS score (ie, most severe bronchiolitis presentation) compared to NHW and Hispanic children. The reason for this difference in severity is unclear, but a potential explanation may be that minority communities lack access to care and as a result delay care and treatment for respiratory disease until care seems absolutely necessary.[19] Indeed, in our sample, minority children were less likely to visit their PCP and take corticosteroids the week before hospitalization when compared with NHW children. Our finding runs counter to a similar study by Boudreaux et al. that found no association between race/ethnicity and the clinical presentation of children with acute asthma during the preadmission setting.[20] The more severe bronchiolitis presentation among NHB children may have suggested that these children would require a longer hospital LOS (3 days). However, our multivariable analysis found no difference in LOS across racial/ethnic groups. This LOS finding is intriguing given previous studies suggesting that minorities, of diverse ages and with diverse diagnoses, were more likely to have a shorter LOS (as well as less likely to be admitted to the ICU with a similar diagnosis) when compared to nonminorities.[21, 22] Additionally, because our study sampled 16 sites, variation in clinical judgment and pediatric ICU protocol may have also played a role.[23]
Our findings also shed light on how differences in bronchiolitis management relate to AAP guidelines. According to the AAP, corticosteroid medications should not be used routinely in the management of bronchiolitis. Despite this recommendation, previous reports indicate that up to 60% of infants with severe bronchiolitis receive corticosteroid therapy.[24, 25] Our finding that Hispanic children with severe bronchiolitis were most likely to be discharged on inhaled corticosteroids is potentially concerning, as it exposes a subset of children to treatment that is not recommended. On the other hand, given the increased risk of future asthma in Hispanic communities, a higher use of inhaled corticosteroids might be seen as appropriate. Either way, our findings are inconsistent with related studies concluding that racial minority pediatric patients with asthma were less likely to receive inhaled corticosteroids.[26, 27, 28, 29] Similarly, NHB children were most likely to receive albuterol during the preadmission visit on multivariable analysis. Although a trial dose of albuterol may be common practice in treating severe bronchiolitis, AAP recommendations do not support its routine application. Increased albuterol during preadmission may have been related to an elevated bronchiolitis severity at presentation among NHB children (as indicated by the RDSS). Potential reasons for these 2 differences in treatment remain unclear. They may represent medical management efforts by discharging physicians to prescribe: (1) corticosteroids to racial/ethnic communities with a higher risk of childhood asthma; (2) albuterol to children presenting with a more severe case of bronchiolitis. These possibilities merit further study.
The AAP also recommends diagnosis of bronchiolitis on the basis of history and physical examination; laboratory and radiologic studies should not be routinely used for diagnostic purposes. Although it is possible for chest radiograph abnormalities to be consistent with bronchiolitis, there is little evidence that an abnormal finding is associated with disease severity.[30] The clinical value of diagnostic testing in children with bronchiolitis is not well supported by evidence, and limiting exposure to radiation should be a priority.[31, 32] Our analysis found that NHW and Hispanic children were more likely to receive chest x‐rays while hospitalized when compared with NHB children. Unnecessary and increased radiation exposure in children is potentially harmful and warrants intervention to minimize risk.
Establishing systematic clinical pathways in bronchiolitis management may address the practice variation found nationwide and across race/ethnicity in this study. Although clinical guidelines provide general recommendations, clinical pathways are defined treatment protocols aiming to standardize and optimize patient outcomes and clinical efficiency. The incorporation of clinical pathways into healthcare systems has increased recently as a result of their favorable association with medical complications, healthcare costs, and LOS.[33] With respect to bronchiolitis, implementation of clinical pathways has proven to reduce use of inappropriate therapies, decrease risk of bronchiolitis‐related hospital readmission, and help with discharge planning.[30, 34, 35]
Notwithstanding the differences found in this study, management of children with bronchiolitis was, in many respects, comparable across racial/ethnic groups. For example, our multivariable analysis found no significant differences across racial/ethnic groups with respect to chest x‐rays and corticosteroid use during the preadmission visit, administration of albuterol or corticosteroids during hospitalization, use of CPAP/emntubation, ICU admission, hospital LOS, or likelihood of a bronchiolitis‐related relapse. The general lack of race/ethnic differences is consistent with similar research on inpatient management of acute asthma.[36]
This study has potential limitations. The hospitals participating in the study are predominantly urban, academically affiliated hospitals. This may result in findings that are less generalizable to rural and community hospitals. Second, the race/ethnicity classification used does not take into consideration the diversity and complexity of defining race/ethnicity in the United States. Third, bronchiolitis is defined as a clinical diagnosis that can encapsulate multiple lower respiratory infection diagnoses. As a result, there may have been variability in clinical and institutional practice. An additional limitation was utilizing RDSS to assess bronchiolitis severity. Although there is currently no validated, universally accepted score to assess bronchiolitis severity, several scores are available in the literature with varying performance. Last, the ZIP code‐based median household incomes used to assess SES are higher than federal data in similar geographic locations, potentially resulting in findings that are less generalizable.
CONCLUSION
This multicenter prospective cohort study found several differences in bronchiolitis presentation and management among children stratified by race/ethnicity in 16 geographically dispersed sites after controlling for multiple factors including SES. Our analysis showed that, when compared to NHW children, NHB children were more likely to be given albuterol during the preadmission visit and less likely to receive chest x‐rays as inpatients; Hispanic children were more likely to be discharged on inhaled corticosteroids. These differences are concerning for 2 reasons: (1) based on current evidence, race/ethnicity should not affect care in children with severe bronchiolitis; and (2) the observed differences in diagnostic testing and treatment are not recommended by the evidence‐based AAP guidelines. It is also important to note that these differences do not demonstrate that a specific race/ethnicity received better or worse clinical care. The goal of this analysis was not to determine the effectiveness of certain management tendencies in children with severe bronchiolitis, but rather to examine differences in the presentation and management of children from different racial/ethnic groups. The causes for the observed findings require further study. In the meantime, we suggest increasing the number of hospitals that incorporate clinical care pathways for severe bronchiolitis to control variation in practice and limit the impact that race/ethnicity may have in the provision of services.
Acknowledgements
The authors thank the MARC‐30 investigators for their ongoing dedication to bronchiolitis research.
Disclosures: This study was supported by the grant U01 AI‐67693 (Camargo) from the National Institutes of Health (Bethesda, MD). The content of this manuscript is solely the responsibility of the authors and does not necessarily represent the official views of the National Institute of Allergy and Infectious Diseases or the National Institutes of Health. The authors have no financial relationships relevant to this article or conflicts of interest to disclose. Mr. Santiago conceptualized the analysis, interpreted the data, drafted the initial manuscript, and approved the final manuscript as submitted. Dr. Mansbach conceptualized and designed the initial study, coordinated data collection at 1 of the sites, critically reviewed the manuscript, and approved the final manuscript as submitted. Dr. Chou was responsible for analysis and interpretation of data, critically reviewed the manuscript, and approved the final manuscript as submitted. Dr. Delgado coordinated data collection at 1 of the sites, critically reviewed the manuscript, and approved the final manuscript as submitted. Dr. Piedra conceptualized and designed the initial study, coordinated virology testing, critically reviewed the manuscript, and approved the final manuscript as submitted. Ms. Sullivan coordinated data collection at all sites, critically reviewed the manuscript, and approved the final manuscript as submitted. Ms. Espinola was responsible for data management, analysis and interpretation of data, drafting of the initial manuscript, and approved the final manuscript as submitted. Dr. Camargo conceptualized and designed the initial study, assisted with data analysis and interpretation of data, critically reviewed the manuscript, and approved the final manuscript as submitted.
APPENDIX
| Principal Investigators at the 16 Participating Sites in MARC‐30 | |
| Besh Barcega, MD | Loma Linda University Children's Hospital, Loma Linda, CA |
| John Cheng, MD and Carlos Delgado, MD | Children's Healthcare of Atlanta at Egleston, Atlanta, GA |
| Dorothy Damore, MD and Nikhil Shah, MD | New York Presbyterian Hospital, New York, NY |
| Haitham Haddad, MD | Rainbow Babies & Children's Hospital, Cleveland, OH |
| Paul Hain, MD and Mark Riederer, MD | Monroe Carell Jr. Children's Hospital at Vanderbilt, Nashville, TN |
| Frank LoVecchio, DO | Maricopa Medical Center, Phoenix, AZ |
| Charles Macias, MD, MPH | Texas Children's Hospital, Houston, TX |
| Jonathan Mansbach, MD, MPH | Boston Children's Hospital, Boston, MA |
| Eugene Mowad, MD | Akron Children's Hospital, Akron, OH |
| Brian Pate, MD | Children's Mercy Hospital & Clinics, Kansas City, MO |
| M. Jason Sanders, MD | Children's Memorial Hermann Hospital, Houston, TX |
| Alan Schroeder, MD | Santa Clara Valley Medical Center, San Jose, CA |
| Michelle Stevenson, MD, MS | Kosair Children's Hospital, Louisville, KY |
| Erin Stucky Fisher, MD | Rady Children's Hospital, San Diego, CA |
| Stephen Teach, MD, MPH | Children's National Medical Center, Washington, DC |
| Lisa Zaoutis, MD | Children's Hospital of Philadelphia, Philadelphia, PA |
- , , . Direct medical costs of bronchiolitis‐related hospitalizations in the United States. Pediatrics. 2006;118(6):2418–2423.
- , , , , . Trends in bronchiolitis hospitalizations in the United States, 2000–2009. Pediatrics. 2013;132(1):28–36.
- , , , , . Infectious disease hospitalizations among infants in the United States. Pediatrics. 2008;121(2):244–252.
- , . Respiratory syncytial virus. Curr Probl Pediatr. 1993;23(2):50–79.
- , , , , . Rates of hospitalization for respiratory syncytial virus infection among children in Medicaid. J Pediatr. 2000;137(6):865–870.
- American Academy of Pediatrics Subcommittee on Diagnosis and Management of Bronchiolitis. Diagnosis and management of bronchiolitis. Pediatrics. 2006;118(4):1774–1793.
- , , . US outpatient office visits for bronchiolitis, 1993–2004. Ambul Pediatr. 2007;7(4):304–307.
- , , , et al. Study of interobserver reliability in clinical assessment of RSV lower respiratory illness: a pediatric investigators collaborative network for infections in Canada (PICNIC) study. Pediatr Pulmonol. 1996;22(1):23–27.
- , , , , . Effect of practice variation on resource utilization in infants hospitalized for viral lower respiratory illness. Pediatrics. 2001;108(4):851–855.
- , , . Bronchiolitis in US emergency departments 1992 to 2000: epidemiology and practice variation. Pediatr Emerg Care. 2005;21(4):242–247.
- , . Recent trends in severe respiratory syncytial virus (RSV) among US infants, 1997 to 2000. J Pediatr. 2003; 143(5 suppl):S127–S132.
- , , , , . Risk of respiratory syncytial virus infection for infants from low‐income families in relationship to age, sex, ethnic group, and maternal antibody level. J Pediatr. 1981;98(5):708–715.
- , , . Socioeconomic environmental factors and hospitalization for acute bronchiolitis during infancy. Acta Paediatr. 2002;91(3):335–338.
- , , , , . Factors associated with longer emergency department length of stay for children with bronchiolitis: a prospective multicenter study. Pediatr Emerg Care. 2009;25(10):636–641.
- , , , , . Prospective multicenter bronchiolitis study: predicting intensive care unit admissions. Acad Emerg Med. 2008;15(10):887–894.
- , , , , . Prospective multicenter study of bronchiolitis: predictors of an unscheduled visit after discharge from the emergency department. Acad Emerg Med. 2010;17(4):376–382.
- Esri. Demographic, consumer, and business data. Available at: http://www.esri.com/data/esri_data/demographic‐overview/demographic. Accessed July 25, 2013.
- , , . A randomized trial of home oxygen therapy from the emergency department for acute bronchiolitis. Pediatrics. 2006;117(3):633–640.
- , , , , , . Adherence to therapy and access to care: the relationship to excess asthma morbidity in African‐American children. Pediatr Asthma Aller. 1994;8(3):179–184.
- , , , . Race/ethnicity and asthma among children presenting to the emergency department: differences in disease severity and management. Pediatrics. 2003;111(5 pt 1):e615–e621.
- , , , . Relationship between patient race and the intensity of hospital services. Med Care. 1987;25(7):592–603.
- , , , , . African‐American and white patients admitted to the intensive care unit: is there a difference in therapy and outcome? Crit Care Med. 1995;23(4):626–636.
- , , . Acute severe asthma: differences in therapies and outcomes among pediatric intensive care units. Crit Care Med. 2002;30(3):581–585.
- , , , . International variation in the management of infants hospitalized with respiratory syncytial virus. International RSV Study Group. Eur J Pediatr. 1998;157(3):215–220.
- , , , , . Effect of practice variation on resource utilization in infants for viral lower respiratory illness. Pediatrics. 2001;108:851–855.
- , , , , , . Impact of site of care, race, and Hispanic ethnicity on medication use for childhood asthma. Pediatrics. 2002;109(1):E1.
- , , , et al. Racial/ethnic variation in asthma status and management practices among children in managed Medicaid. Pediatrics. 2002;109(5):857–865.
- , , , . Treatment adherence among low‐income children with asthma. J Pediatr Psychol. 1998;23(6):345–349.
- American Academy of Pediatrics Steering Committee on Quality Improvement and Management. Classifying recommendations for clinical practice guidelines. Pediatrics. 2004;114(3):874–877.
- , , . Randomised controlled trial of clinical outcome after chest radiograph in ambulatory acute lower‐respiratory infection in children. Lancet. 1998;351(9100):404–408.
- . Cancer risks following diagnostic and therapeutic radiation exposure in children. Pediatr Radiol. 2006;36(suppl 2):121–125.
- , , , et al. Clinical pathways: effects on professional practice, patient outcomes, length of stay and hospital costs. Cochrane Database Syst Rev. 2010;(3):CD006632.
- , , . An evidence‐based clinical pathway for bronchiolitis safely reduces antibiotic overuse. Am J Med Qual. 2002;17(5):195–199.
- , , , et al. A clinical pathway for bronchiolitis is effective in reducing readmission rates. J Pediatr. 2005;147(5):622–626.
- , , , et al. Decreasing unnecessary utilization in acute bronchiolitis care: results from the value in inpatient pediatrics network. J Hosp Med. 2013;8(1):25–30.
- , , . Race/Ethnicity differences in the inpatient management of acute asthma in the United States. Chest. 2009;135(6):1527–1534.
© 2014 Society of Hospital Medicine
Aging and Inpatient Demand
The number of older people in the United States is expected to increase, due to the aging of the post‐World War II baby boomers.[1] For example, those aged 65 years are expected to number 88.5 million in 2050, more than double the number in 2010 of 40.2 million. This demographic shift has raised concerns about future hospital capacity, but the scope of the problem has not been quantified.[2]
A recent analysis calculated the number and length of emergency department visits expected to occur based on the aging of the US population.[3] One finding was that hospital admissions would increase 23% faster than population growth. However, this considered only hospitalizations originating in the emergency department and did not consider all‐source hospitalizations. We obtained data on all‐source hospitalizations and applied them to the US Census Bureau's demographic projections for the future through 2050. This provides a base‐case estimate for how inpatient demand would change if all other influences remained equal. The goal was to isolate the effect of population age makeup on inpatient requirements while holding other influences constant.
METHODS
We used the method of actuarial life table adjustment as described previously.[3] To calculate age‐specific hospitalization rates, we estimated age‐specific hospitalization frequencies (counts) in the United States for 2011 from the Nationwide Inpatient Sample (NIS).[4] This is a stratified probability sample of US community hospitals, defined as all nonfederal, short term, general, and other specialty hospitals, excluding hospital units of institutions. Veterans hospitals and other federal facilities, short‐term rehabilitation hospitals, long‐term non‐acute care hospitals, psychiatric hospitals, and alcoholism/chemical dependency treatment facilities were excluded from NIS 2011. Of hospitals in the sample, 21% are government (nonfederal) owned.
We converted age‐specific hospitalization frequencies derived from this sample into rates by dividing each stratum‐specific admission count by the 2011 population count in each age stratum from the US Census Bureau.[5] The Census Bureau provides detailed predictions of the US population through 2050. Births, deaths, and net international migration are projected for each birth cohort. Using 2011 as the origin, we applied baseline age‐specific hospitalization rates stratum‐wise to the general population expected by the Census Bureau in future years. This gave us stratum‐specific hospitalization frequencies for each future year. We summed these to arrive at the aggregate anticipated hospitalization frequency in each year. For our main outcome measure, we calculated the ratio of change in hospitalization frequency to change in population, comparing each future year to the 2011 baseline. We also calculated aggregate inpatient days, using the same data sources and methods. Our institutional review board exempted this study from review. We used Stata 13.0 (StataCorp, College Station, TX), and Microsoft Excel (Microsoft, Redmond, WA) for all analyses.
RESULTS
Baseline data are displayed in Figure 1. In 2011, there were 0.23 hospitalizations per US resident aged 0 to 4 years, and 0.01 per resident aged 5 to 9 years. From this age forward, hospitalization rates increased steadily with advancing age, reaching 0.63 per resident aged 90 to 94 years. Length of stay also was generally associated with age, though there was a peak among older children.

Projections through 2050 are shown in Table 1 and Figure 2. Table 1 displays the population projections of the US Census Bureau, which expects the US population to increase by 41% between now and 2050. Also shown in the table are our projections, which indicate that, all other things being equal, the annual number of inpatient admissions in the US will increase by 67%. The ratio of 67% to 41% is 1.18, meaning that the frequency of inpatient admissions will grow 18% more than population growth due to the aging of the population. The aggregate number of inpatient days will increase 22% more than population growth. Overall, inpatient capacity must expand by 72% to keep pace.
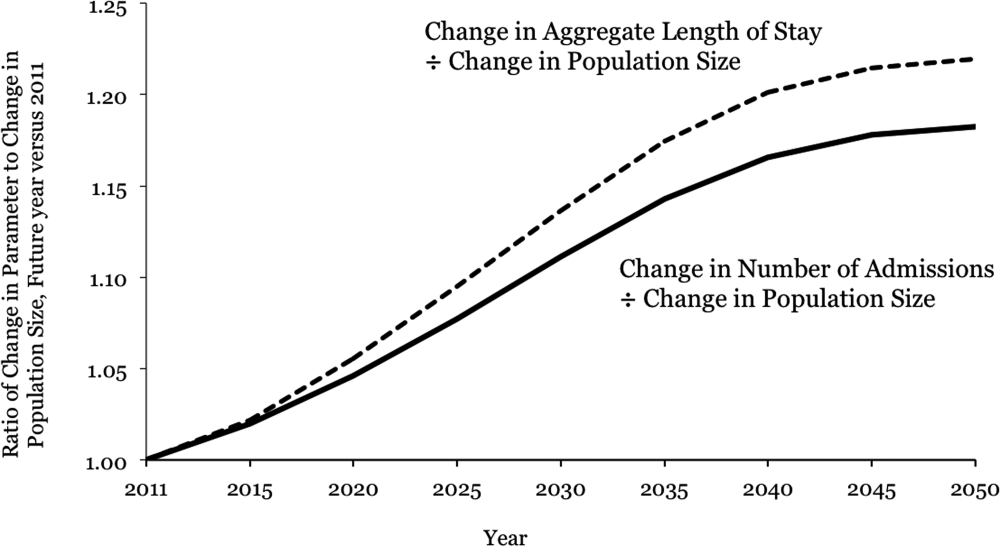
| Year | Population | Hospital Admissions | Aggregate Inpatient Days | Population: Ratio of Future Year to 2011 | Admissions: Ratio of Future Year to 2011 | Ratio of Admission Increase to Population Increase | Aggregate Inpatient Days: Ratio of Future Year to 2011 | Ratio of Increase in Inpatient Days to Population Increase |
|---|---|---|---|---|---|---|---|---|
| ||||||||
| 2011 | 311,591,917 | 38,560,751* | 177,501,515 | 1 | 1 | 1 | 1 | 1 |
| 2015 | 325,539,790 | 41,093,154 | 189,520,706 | 1.04 | 1.07 | 1.02 | 1.07 | 1.02 |
| 2020 | 341,386,665 | 44,196,669 | 205,205,962 | 1.10 | 1.15 | 1.05 | 1.16 | 1.06 |
| 2025 | 357,451,620 | 47,655,492 | 222,911,204 | 1.15 | 1.24 | 1.08 | 1.26 | 1.09 |
| 2030 | 373,503,674 | 51,365,441 | 241,852,384 | 1.20 | 1.33 | 1.11 | 1.36 | 1.14 |
| 2035 | 389,531,156 | 55,091,242 | 260,603,998 | 1.25 | 1.43 | 1.14 | 1.47 | 1.17 |
| 2040 | 405,655,295 | 58,524,016 | 277,530,732 | 1.30 | 1.52 | 1.17 | 1.56 | 1.20 |
| 2045 | 422,058,629 | 61,525,903 | 292,014,192 | 1.35 | 1.60 | 1.18 | 1.65 | 1.21 |
| 2050 | 439,010,253 | 64,249,181 | 304,945,179 | 1.41 | 1.67 | 1.18 | 1.72 | 1.22 |
DISCUSSION
Although US hospital capacity has fallen over the past 3 decades,[6, 7] our analysis suggests that demand for inpatient beds will increase 22% faster than population growth by 2050. The total projected demand increase is 72%, including that attributable to population growth and that attributable to population aging.
These are ceteris paribus projections, which reveal the changes in inpatient demand that would result if 2 conditions held: (1) the US Census Bureau's expectations for population makeup proved correct, and (2) age‐specific hospitalization rates and lengths of stay did not change. In reality, age‐specific hospitalization rates and lengths of stay could change. Examples of change drivers include epidemics, technology, and financial incentives provided by third‐party payers.[7] For example, if an epidemic of a new disease were to occur, age‐specific hospitalization rates could increase across all age groups. Our projections depict what would happen in the absence of any such change. This is useful because we do not know if changes in age‐specific hospitalization rates will occur, and whether there will be increases or decreases. Therefore, our projections should not be viewed as literal predictions, but rather as pieces of the puzzle, necessary but not sufficient elements of an understanding of what the future may hold for inpatient demand.
Clinicians, academics, and government agencies have an interest in understanding inpatient supply and demand on national and local levels. However, their ability to influence supply is limited by the fact that of all registered hospitals in the United States, only 22% are government owned.[1] As a result, decisions about hospital construction and closure are generally left to the free market.[6] Nonetheless, we bear responsibility for monitoring supply and demand, and government regulation of hospitals and reimbursement for inpatient care mean that the public is not entirely without influence. Thirty‐two percent of US residents have government‐issued health insurance.[8]
In the early 20th century, very little healthcare took place in the inpatient setting. However, by the 1970s, inpatient care accounted for a large part of healthcare, due largely to changes in technology and reimbursement. This trend reversed in the 1980s and 1990s, and hospitals closed.[7] In 1975, there were 5875 hospitals in the United States, and in 2000 there were 4915.[6] The number of staffed beds decreased from 942,000 to 826,000.[6] In parallel, likely due to changes in technology (ie, the nature of healthcare), total inpatient days in community hospitals decreased from 223 million in 1991 to 187 million in 2011.[9] On the other hand, increasing access to insurance under the Affordable Care Act could increase utilization, as seen when a 30% increase in hospital utilization occurred when people were enrolled in Oregon's Medicaid program.[10] Also, hospital utilization may increase if Medicare patients require more services.[11]
Actuarial life table analysis has been used to make forecasts related to healthcare supply and demand, though we are not aware of prior applications to the question of hospitalization. A prior study used actuarial life table adjustment to forecast demand for emergency department services.[3] These methods have also been used to forecast the influence of longevity upon healthcare expenditures[12, 13, 14] and to predict demand for specialty services.[15, 16] Of note, rather than reporting ratios of demand growth to population growth, another option would have been to derive a compound growth rate. We are not aware of a precedent for such methods in the prior published applications of actuarial life table analysis and felt that such inductive methods would complicate the interpretation of our results.
The main limitation of our investigation is its scope. We used actuarial life table adjustment to isolate the effect of population aging upon demand for inpatient hospitalizations. This method does not yield a comprehensive prediction of inpatient demand, but rather provides a robust estimate under the assumption that all other things remain equal. Another obvious limitation is that our analysis has a nationwide scope, and was not designed to account for variation from one locale to the next. However, these methods can be used by local health authorities.
CONCLUSIONS
The US Census Bureau expects the US population to increase by 41% over the next 4 decades, and the number of US residents aged 65 years to more than double. Our results indicate that, all other things being equal, this will cause the number of hospital admissions to increase 18% faster than population growth, and the aggregate number of inpatient days to increase 22% faster than population growth. Including both population growth and population aging, the total projected increase required for inpatient capacity is 72%. This is a base‐case, ceteris paribus analysis, and understanding how demand for inpatient services may change will require multiple perspectives. Increasing access to insurance, changing poverty rates, and changes in healthcare delivery and technology are other important factors. The present analysis provides a focused estimate of the influence upon demand for inpatient services due to expected changes in our population's age distribution.
- American Hospital Association. Fast facts on US hospitals, 2011. Available at: http://www.aha.org/research/rc/stat‐studies/fast‐facts.shtml. Accessed August 7, 2013.
- American Hospital Association. Cracks in the foundation: averting a crisis in America's hospitals. AHA 2002. Available at: http://www.aha.org/content/00–10/cracksreprint08‐02.pdf. Accessed August 4, 2013.
- , , , , . Population aging and emergency departments: visits will not increase, lengths‐of‐stay and hospitalizations will. Health Aff (Millwood). 2013;32(7):1306–1312.
- HCUP Nationwide Inpatient Sample (NIS). Healthcare Cost and Utilization Project (HCUP). 2011. Agency for Healthcare Research and Quality, Rockville, MD. Available at: http://www.hcup‐us.ahrq.gov/nisoverview.jsp. Accessed July 25, 2013.
- Bureau of the Census. Population Projections by Age, Sex, Race, and Hispanic Origin: July 1, 2000–2050. Washington, DC: The Bureau; 2008.
- , , , . Does U.S. hospital capacity need to be expanded? Health Aff (Millwood). 2003;22(6):40–54.
- . Decline in hospital utilization and cost inflation under managed care in California. JAMA. 1996;276(13):1060–1064.
- , , . Income, poverty, and health insurance coverage in the United States, 2011. US Census Bureau. Available at: http://www.census.gov/prod/2012pubs/p60–243.pdf. Published September 2012. Accessed August 7, 2013.
- American Hospital Association. Trendwatch. Table 3.1: trends in inpatient utilization in community hospitals, 1991–2011. Available at: http://www.aha.org/research/reports/tw/chartbook/2013/table3‐1.pdf. Accessed November 9, 2013.
- , , , et al. The Oregon health insurance experiment: evidence from the first year. Q J Econ. 2012;127(3):1057–1106.
- American Hospital Association. Trendwatch. Are Medicare patients getting sicker? Available at: http://www.aha.org/research/reports/tw/12dec‐tw‐ptacuity.pdf. Accessed November 9, 2013.
- , , . Longevity and Medicare expenditures. N Engl J Med. 1995;332(15):999–1003.
- , . The aging of America. Impact on health care costs. JAMA. 1990;263(17):2335–2340.
- , . The effect of longevity on spending for acute and long‐term care. N Engl J Med. 2000;342(19):1409–1415.
- , , , . Demographics and cardiology, 1950–2050. J Am Coll Cardiol. 2000;35(4):1067–1081.
- , , , . Population‐based analysis of inpatient vascular procedures and predicting future workload and implications for training. J Vasc Surg. 2012;55(5):1394–1399; discussion 1399–1400.
The number of older people in the United States is expected to increase, due to the aging of the post‐World War II baby boomers.[1] For example, those aged 65 years are expected to number 88.5 million in 2050, more than double the number in 2010 of 40.2 million. This demographic shift has raised concerns about future hospital capacity, but the scope of the problem has not been quantified.[2]
A recent analysis calculated the number and length of emergency department visits expected to occur based on the aging of the US population.[3] One finding was that hospital admissions would increase 23% faster than population growth. However, this considered only hospitalizations originating in the emergency department and did not consider all‐source hospitalizations. We obtained data on all‐source hospitalizations and applied them to the US Census Bureau's demographic projections for the future through 2050. This provides a base‐case estimate for how inpatient demand would change if all other influences remained equal. The goal was to isolate the effect of population age makeup on inpatient requirements while holding other influences constant.
METHODS
We used the method of actuarial life table adjustment as described previously.[3] To calculate age‐specific hospitalization rates, we estimated age‐specific hospitalization frequencies (counts) in the United States for 2011 from the Nationwide Inpatient Sample (NIS).[4] This is a stratified probability sample of US community hospitals, defined as all nonfederal, short term, general, and other specialty hospitals, excluding hospital units of institutions. Veterans hospitals and other federal facilities, short‐term rehabilitation hospitals, long‐term non‐acute care hospitals, psychiatric hospitals, and alcoholism/chemical dependency treatment facilities were excluded from NIS 2011. Of hospitals in the sample, 21% are government (nonfederal) owned.
We converted age‐specific hospitalization frequencies derived from this sample into rates by dividing each stratum‐specific admission count by the 2011 population count in each age stratum from the US Census Bureau.[5] The Census Bureau provides detailed predictions of the US population through 2050. Births, deaths, and net international migration are projected for each birth cohort. Using 2011 as the origin, we applied baseline age‐specific hospitalization rates stratum‐wise to the general population expected by the Census Bureau in future years. This gave us stratum‐specific hospitalization frequencies for each future year. We summed these to arrive at the aggregate anticipated hospitalization frequency in each year. For our main outcome measure, we calculated the ratio of change in hospitalization frequency to change in population, comparing each future year to the 2011 baseline. We also calculated aggregate inpatient days, using the same data sources and methods. Our institutional review board exempted this study from review. We used Stata 13.0 (StataCorp, College Station, TX), and Microsoft Excel (Microsoft, Redmond, WA) for all analyses.
RESULTS
Baseline data are displayed in Figure 1. In 2011, there were 0.23 hospitalizations per US resident aged 0 to 4 years, and 0.01 per resident aged 5 to 9 years. From this age forward, hospitalization rates increased steadily with advancing age, reaching 0.63 per resident aged 90 to 94 years. Length of stay also was generally associated with age, though there was a peak among older children.
Projections through 2050 are shown in Table 1 and Figure 2. Table 1 displays the population projections of the US Census Bureau, which expects the US population to increase by 41% between now and 2050. Also shown in the table are our projections, which indicate that, all other things being equal, the annual number of inpatient admissions in the US will increase by 67%. The ratio of 67% to 41% is 1.18, meaning that the frequency of inpatient admissions will grow 18% more than population growth due to the aging of the population. The aggregate number of inpatient days will increase 22% more than population growth. Overall, inpatient capacity must expand by 72% to keep pace.
| Year | Population | Hospital Admissions | Aggregate Inpatient Days | Population: Ratio of Future Year to 2011 | Admissions: Ratio of Future Year to 2011 | Ratio of Admission Increase to Population Increase | Aggregate Inpatient Days: Ratio of Future Year to 2011 | Ratio of Increase in Inpatient Days to Population Increase |
|---|---|---|---|---|---|---|---|---|
| ||||||||
| 2011 | 311,591,917 | 38,560,751* | 177,501,515 | 1 | 1 | 1 | 1 | 1 |
| 2015 | 325,539,790 | 41,093,154 | 189,520,706 | 1.04 | 1.07 | 1.02 | 1.07 | 1.02 |
| 2020 | 341,386,665 | 44,196,669 | 205,205,962 | 1.10 | 1.15 | 1.05 | 1.16 | 1.06 |
| 2025 | 357,451,620 | 47,655,492 | 222,911,204 | 1.15 | 1.24 | 1.08 | 1.26 | 1.09 |
| 2030 | 373,503,674 | 51,365,441 | 241,852,384 | 1.20 | 1.33 | 1.11 | 1.36 | 1.14 |
| 2035 | 389,531,156 | 55,091,242 | 260,603,998 | 1.25 | 1.43 | 1.14 | 1.47 | 1.17 |
| 2040 | 405,655,295 | 58,524,016 | 277,530,732 | 1.30 | 1.52 | 1.17 | 1.56 | 1.20 |
| 2045 | 422,058,629 | 61,525,903 | 292,014,192 | 1.35 | 1.60 | 1.18 | 1.65 | 1.21 |
| 2050 | 439,010,253 | 64,249,181 | 304,945,179 | 1.41 | 1.67 | 1.18 | 1.72 | 1.22 |
DISCUSSION
Although US hospital capacity has fallen over the past 3 decades,[6, 7] our analysis suggests that demand for inpatient beds will increase 22% faster than population growth by 2050. The total projected demand increase is 72%, including that attributable to population growth and that attributable to population aging.
These are ceteris paribus projections, which reveal the changes in inpatient demand that would result if 2 conditions held: (1) the US Census Bureau's expectations for population makeup proved correct, and (2) age‐specific hospitalization rates and lengths of stay did not change. In reality, age‐specific hospitalization rates and lengths of stay could change. Examples of change drivers include epidemics, technology, and financial incentives provided by third‐party payers.[7] For example, if an epidemic of a new disease were to occur, age‐specific hospitalization rates could increase across all age groups. Our projections depict what would happen in the absence of any such change. This is useful because we do not know if changes in age‐specific hospitalization rates will occur, and whether there will be increases or decreases. Therefore, our projections should not be viewed as literal predictions, but rather as pieces of the puzzle, necessary but not sufficient elements of an understanding of what the future may hold for inpatient demand.
Clinicians, academics, and government agencies have an interest in understanding inpatient supply and demand on national and local levels. However, their ability to influence supply is limited by the fact that of all registered hospitals in the United States, only 22% are government owned.[1] As a result, decisions about hospital construction and closure are generally left to the free market.[6] Nonetheless, we bear responsibility for monitoring supply and demand, and government regulation of hospitals and reimbursement for inpatient care mean that the public is not entirely without influence. Thirty‐two percent of US residents have government‐issued health insurance.[8]
In the early 20th century, very little healthcare took place in the inpatient setting. However, by the 1970s, inpatient care accounted for a large part of healthcare, due largely to changes in technology and reimbursement. This trend reversed in the 1980s and 1990s, and hospitals closed.[7] In 1975, there were 5875 hospitals in the United States, and in 2000 there were 4915.[6] The number of staffed beds decreased from 942,000 to 826,000.[6] In parallel, likely due to changes in technology (ie, the nature of healthcare), total inpatient days in community hospitals decreased from 223 million in 1991 to 187 million in 2011.[9] On the other hand, increasing access to insurance under the Affordable Care Act could increase utilization, as seen when a 30% increase in hospital utilization occurred when people were enrolled in Oregon's Medicaid program.[10] Also, hospital utilization may increase if Medicare patients require more services.[11]
Actuarial life table analysis has been used to make forecasts related to healthcare supply and demand, though we are not aware of prior applications to the question of hospitalization. A prior study used actuarial life table adjustment to forecast demand for emergency department services.[3] These methods have also been used to forecast the influence of longevity upon healthcare expenditures[12, 13, 14] and to predict demand for specialty services.[15, 16] Of note, rather than reporting ratios of demand growth to population growth, another option would have been to derive a compound growth rate. We are not aware of a precedent for such methods in the prior published applications of actuarial life table analysis and felt that such inductive methods would complicate the interpretation of our results.
The main limitation of our investigation is its scope. We used actuarial life table adjustment to isolate the effect of population aging upon demand for inpatient hospitalizations. This method does not yield a comprehensive prediction of inpatient demand, but rather provides a robust estimate under the assumption that all other things remain equal. Another obvious limitation is that our analysis has a nationwide scope, and was not designed to account for variation from one locale to the next. However, these methods can be used by local health authorities.
CONCLUSIONS
The US Census Bureau expects the US population to increase by 41% over the next 4 decades, and the number of US residents aged 65 years to more than double. Our results indicate that, all other things being equal, this will cause the number of hospital admissions to increase 18% faster than population growth, and the aggregate number of inpatient days to increase 22% faster than population growth. Including both population growth and population aging, the total projected increase required for inpatient capacity is 72%. This is a base‐case, ceteris paribus analysis, and understanding how demand for inpatient services may change will require multiple perspectives. Increasing access to insurance, changing poverty rates, and changes in healthcare delivery and technology are other important factors. The present analysis provides a focused estimate of the influence upon demand for inpatient services due to expected changes in our population's age distribution.
- American Hospital Association. Fast facts on US hospitals, 2011. Available at: http://www.aha.org/research/rc/stat‐studies/fast‐facts.shtml. Accessed August 7, 2013.
- American Hospital Association. Cracks in the foundation: averting a crisis in America's hospitals. AHA 2002. Available at: http://www.aha.org/content/00–10/cracksreprint08‐02.pdf. Accessed August 4, 2013.
- , , , , . Population aging and emergency departments: visits will not increase, lengths‐of‐stay and hospitalizations will. Health Aff (Millwood). 2013;32(7):1306–1312.
- HCUP Nationwide Inpatient Sample (NIS). Healthcare Cost and Utilization Project (HCUP). 2011. Agency for Healthcare Research and Quality, Rockville, MD. Available at: http://www.hcup‐us.ahrq.gov/nisoverview.jsp. Accessed July 25, 2013.
- Bureau of the Census. Population Projections by Age, Sex, Race, and Hispanic Origin: July 1, 2000–2050. Washington, DC: The Bureau; 2008.
- , , , . Does U.S. hospital capacity need to be expanded? Health Aff (Millwood). 2003;22(6):40–54.
- . Decline in hospital utilization and cost inflation under managed care in California. JAMA. 1996;276(13):1060–1064.
- , , . Income, poverty, and health insurance coverage in the United States, 2011. US Census Bureau. Available at: http://www.census.gov/prod/2012pubs/p60–243.pdf. Published September 2012. Accessed August 7, 2013.
- American Hospital Association. Trendwatch. Table 3.1: trends in inpatient utilization in community hospitals, 1991–2011. Available at: http://www.aha.org/research/reports/tw/chartbook/2013/table3‐1.pdf. Accessed November 9, 2013.
- , , , et al. The Oregon health insurance experiment: evidence from the first year. Q J Econ. 2012;127(3):1057–1106.
- American Hospital Association. Trendwatch. Are Medicare patients getting sicker? Available at: http://www.aha.org/research/reports/tw/12dec‐tw‐ptacuity.pdf. Accessed November 9, 2013.
- , , . Longevity and Medicare expenditures. N Engl J Med. 1995;332(15):999–1003.
- , . The aging of America. Impact on health care costs. JAMA. 1990;263(17):2335–2340.
- , . The effect of longevity on spending for acute and long‐term care. N Engl J Med. 2000;342(19):1409–1415.
- , , , . Demographics and cardiology, 1950–2050. J Am Coll Cardiol. 2000;35(4):1067–1081.
- , , , . Population‐based analysis of inpatient vascular procedures and predicting future workload and implications for training. J Vasc Surg. 2012;55(5):1394–1399; discussion 1399–1400.
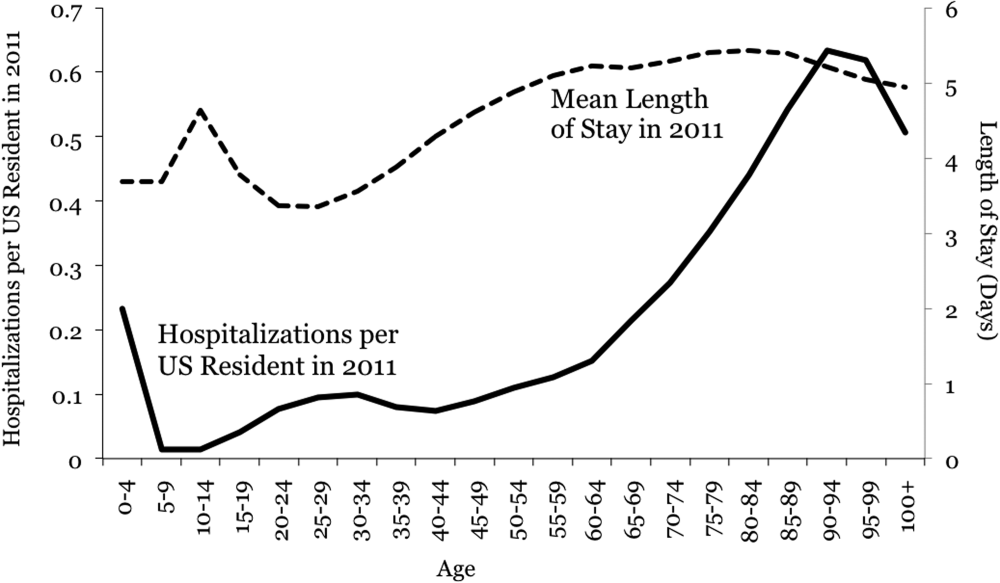
Effectiveness of NIV vs. IMV in AECOPD
Chronic obstructive pulmonary disease (COPD) is now the third leading cause of death in the United States,[1] and its rising mortality trend is unique among the top 5 causes of death.[2] Acute exacerbations of COPD (AECOPD) are important events in the natural history of COPD, accounting for 1.5 million emergency department (ED) visits and 726,000 hospitalizations each year in the United States.[3, 4] Given the significant morbidity and mortality from AECOPD, Healthy People 2020 lists reducing deaths, hospitalizations, and ED visits as the key objectives for COPD.[5]
Over the past 2 decades, noninvasive ventilation (NIV) has emerged as a potentially useful treatment modality in AECOPD patients with acute respiratory failure. Noninvasive ventilation commonly refers to positive‐pressure ventilatory support delivered through a nasal or full‐face mask, such as bilevel positive airway pressure.[6] A number of randomized controlled trials[7, 8, 9] and meta‐analyses[10] have suggested a mortality‐reduction benefit with NIV use compared with standard medical care in AECOPD. To our knowledge, however, very few small randomized controlled trials compared NIV vs invasive mechanical ventilation (IMV) head‐to‐head,[11, 12, 13] and a recent evidence review found only 5 studies (405 subjects) on this topic.[14] Collectively, the limited evidence from randomized trials showed that NIV use resulted in similar intensive care unit (ICU) and in‐hospital mortality, fewer complications (eg, ventilator‐associated pneumonia and sepsis), and shorter hospital length of stays (LOS). Given that these trials have a smaller sample size and tend to exclude older patient (age >75 years) or patients with multiple comorbidities, there is a need to better understand the adoption and effectiveness of NIV treatment for AECOPD in a much larger patient population in the real‐world setting using observational data.
To address these knowledge gaps in the literature, we analyzed data from a large, nationally representative ED and inpatient sample. The objective of the present analysis was 2‐fold: (1) to characterize the use of NIV and IMV in AECOPD patients with acute respiratory failure at a national level; and (2) to compare the effectiveness of NIV vs IMV in the real‐world setting.
METHODS
Study Design and Setting
We conducted a retrospective cohort study using data from the 20062008 Nationwide Emergency Department Sample (NEDS),[15] a component of the Healthcare Cost and Utilization Project sponsored by the Agency for Healthcare Research and Quality. The NEDS is nationally representative of all community hospitalbased EDs in the United States, defined by the American Hospital Association as all nonfederal, short‐term, general, and other specialty hospitals.[16] Community hospitals include academic medical centers if they are nonfederal short‐term hospitals. The NEDS was constructed using administrative records from the State Emergency Department Databases and the State Inpatient Databases. The former captures information on ED visits that do not result in an admission (ie, treat‐and‐release visits or transfers to another hospital); the latter contains information on patients initially seen in the ED and then admitted to the same hospital. Taken together, the resulting NEDS represents all ED visits regardless of disposition and contains information on short‐term outcomes for patients admitted through the ED. In other words, the NEDS is the largest all‐payer ED and inpatient database in the United States. The NEDS represents an approximately 20% stratified sample of US hospital‐based EDs, containing more than 28 million records of ED visits from approximately 1000 hospitals each year. Additional details of the NEDS can be found elsewhere.[15, 17] We received a waiver for this analysis from our institutional review board.
Study Population
Patient visits were included in this analysis if they carried any COPD‐related diagnostic code (ie, International Classification of Diseases, Ninth Revision, Clinical Modification [ICD‐9‐CM] code of 491.xx [chronic bronchitis], 492.xx [emphysema], or 496.xx [chronic airway obstruction, not elsewhere classified]) as their primary ED diagnosis and any acute respiratory failure code (ie, 518.81 [acute respiratory failure], 518.82 [pulmonary insufficiency not elsewhere classified, 518.84 [acute and chronic respiratory failure], or 799.1 [respiratory arrest]) as their secondary diagnosis. Patient visits with a primary diagnosis of acute respiratory failure and a secondary diagnosis of COPD were also included. Patients age <40 years were excluded, because they are much less likely to have COPD.[18]
Modes of Mechanical Ventilation
The primary exposure variable was mode of mechanical ventilation. To compare the effectiveness of different ventilatory modes, patients were divided into 3 groups according to the ventilation mode they received: (1) NIV alone, (2) IMV alone, and (3) combined modes of NIV and IMV. The use of NIV was identified by using Current Procedural Terminology (CPT) code of 94660 or ICD‐9 procedure code 93.90, whereas the use of IMV was identified by using CPT code of 31500 or ICD‐9 procedure code 96.04 or 96.7x.
Patient‐Level and Emergency DepartmentLevel Variables
The NEDS contains information on patient demographics, national quartiles for median household income based on the patient's ZIP code, payment sources, ICD‐9‐CM diagnoses and procedures, ED disposition, hospital LOS, and hospital disposition. Hospital characteristics include annual visit volume, urban‐rural status, ownership, teaching status, and US region. Geographic regions (Northeast, South, Midwest, and West) were defined according to Census Bureau boundaries.[19] To adjust for confounding by patient mix, Elixhauser comorbidity measures were derived based on the ICD‐9 codes, using the Agency for Healthcare Research and Quality's Comorbidity Software.[20] This risk‐adjustment tool has been derived and validated extensively.[21]
Outcome Measures
The outcome measures were all‐cause inpatient mortality, hospital LOS, hospital charges, and ventilator‐related complications. Three ventilator‐related complications were identified using ICD‐9 procedure codes: ventilator‐associated pneumonia (997.31), facial injury (910.x), and iatrogenic pneumothorax (512.1).
Statistical Analysis
Summary statistics are presented as proportions (with 95% confidence intervals [CI]), means (with standard deviations [SD]), or medians (with interquartile ranges). Bivariate associations were examined using Student t tests, Kruskal‐Wallis tests, and [2] tests, as appropriate. Emergency department and discharge weights were used to obtain national estimates at the ED and visit level. At all other times (eg, the propensity score and instrumental variable analyses), the unweighted cohort was analyzed, because survey weights are generally not advised for propensity score analysis using complex survey data.[22]
Propensity Score Analysis
To adjust for baseline patient and ED characteristics that may have confounded the relationship between ventilation mode and clinical outcomes, we performed propensity score and instrumental variable analyses. To compare the effectiveness of NIV vs IMV, a propensity score or predicted probability of NIV was estimated using a logistic‐regression model with all patient characteristics (age, sex, quartiles for median household income, weekend admission, insurance status, season, calendar year, and comorbid conditions) and ED characteristics (urban/rural and teaching status, US region, annual ED volume, and annual volume of AECOPD with respiratory failure) as the independent variables. We then performed 1:1 propensity score matching based on a nearest‐neighbor algorithm with caliper distance of 0.01. Although propensity score matching may result in a smaller sample, it provides a clinically relevant estimate of treatment effect because subjects in the matched sample are potential candidates for either treatment option.[23, 24] An absolute standardized difference between characteristics of <10% was considered as adequate balance.[25]
Instrumental Variable Analysis
When hospitals always or nearly always use NIV or IMV, this suggests the choice is largely independent of patient characteristics, and it is possible to use the hospital preference as a proxy for the actual treatment choice (ie, an instrument variable). The instrumental variable analysis simulates a natural randomization of patients to 2 hospital groups with high and low NIV use.
The main difference between instrumental variable and propensity score analysis is that the former could potentially adjust for unmeasured confounders.[26] We used Stata procedure IVREG to estimate the outcome differences between NIV‐preferring hospitals (NIV use in 90% of patients) and IMV‐preferring hospitals (NIV use in 10% of patients).
All odds ratios (ORs) and ‐coefficients are presented with 95% CIs. All analyses were performed using Stata 12.0 software (StataCorp, College Station, TX). All P values are 2‐sided, with P<0.05 considered statistically significant.
Sensitivity Analyses
We conducted a sensitivity analysis to determine whether it was plausible that an unmeasured confounder could completely explain the observed results. The risk ratio of a hypothetical unmeasured confounder on study outcome and the exposure‐confounder imbalance were both varied to see at what point the observed association was reduced to 1.0.[27]
RESULTS
Patient and ED Characteristics
The 20062008 NEDS sample contained 67,651 ED visits for AECOPD with acute respiratory failure from 1594 US EDs. After the weighting procedure, there were an estimated 101,000 visits annually for AECOPD with acute respiratory failure from approximately 4700 US EDs. In the weighted analysis, the mean patient age of these visits was 68 years, and 56% were made by women. Ninety‐six percent were admitted to the hospital. Of these, the mortality rate was 9% and the mean hospital LOS was 7 days. Figure 1 shows the secular trends in NIV, IMV, and the combined use over the 3‐year study period. Use of IMV decreased from 28% in 2006 to 19% in 2008 (P<0.001), whereas NIV use increased slightly from 14% in 2006 to 16% in 2008 (P=0.049); the combined use of both ventilation modalities remained stable (4%). Inpatient mortality decreased from 10% in 2006 to 7% in 2008 (P<0.001).
Figure 2 shows that the frequency of NIV use (including combined use of NIV and IMV) varied widely between hospitals, ranging from 0% to 100% with a median of 11%. In the unweighted cohort of AECOPD with acute respiratory failure, 43% received some forms of ventilatory support. Table 1 shows the patient and hospital characteristics of the patients receiving ventilatory support: 36% received NIV, 56% received IMV, and 8% received combined use. In general, patients receiving combined use of NIV and IMV tended to have more comorbidities (eg, congestive heart failure and pneumonia) compared with the NIV‐alone or IMV‐alone groups. With respect to hospital characteristics, NIV was used more often in hospitals with higher volumes of COPD exacerbation and respiratory failure, in nonmetropolitan hospitals, and in hospitals in the Northeast.
| NIV Alone (A) (n=10,032) | IMV Alone (B) (n=15,427) | Combined Use (C) (n=2311) | P Value, A vs B | P Value, B vs C | |
|---|---|---|---|---|---|
| |||||
| Patient characteristics | |||||
| Age, y, | <0.001 | 0.64 | |||
| 4049 | 5 | 5 | 5 | ||
| 5059 | 17 | 18 | 19 | ||
| 6069 | 31 | 33 | 33 | ||
| 7079 | 30 | 29 | 29 | ||
| 80 | 17 | 15 | 13 | ||
| Female sex, % | 57 | 53 | 54 | <0.001 | 0.87 |
| Quartile for median household income of patient ZIP code, $, % | <0.001 | <0.001 | |||
| 138,999 | 30 | 34 | 29 | ||
| 39,00047,999 | 28 | 28 | 28 | ||
| 48,00062,999 | 24 | 22 | 24 | ||
| 63,000 | 18 | 15 | 19 | ||
| Weekend admission, % | 27 | 28 | 28 | 0.07 | 0.80 |
| Insurance status, % | <0.001 | 0.91 | |||
| Medicare | 74 | 70 | 70 | ||
| Medicaid | 9 | 12 | 12 | ||
| Private | 12 | 13 | 13 | ||
| Self‐pay | 2 | 3 | 2 | ||
| Other | 2 | 2 | 2 | ||
| Season, % | <0.001 | 0.16 | |||
| Winter (January 1March 31) | 29 | 32 | 31 | ||
| Spring (April 1June 30) | 24 | 25 | 26 | ||
| Summer (July 1September 30) | 22 | 20 | 19 | ||
| Fall (October 1December 31) | 25 | 22 | 24 | ||
| No. of comorbidities, median (IQR) | 4 (35) | 4 (35) | 4 (36) | <0.001 | <0.001 |
| Selected comorbidities, % | |||||
| Hypertension | 56 | 55 | 55 | 0.01 | 0.65 |
| CHF | 38 | 40 | 44 | 0.001 | <0.001 |
| Fluid and electrolyte disorders | 37 | 44 | 49 | <0.001 | <0.001 |
| Diabetes, uncomplicated | 27 | 26 | 29 | 0.04 | 0.002 |
| Pneumonia | 19 | 34 | 39 | <0.001 | <0.001 |
| Deficiency anemia | 16 | 19 | 19 | <0.001 | 0.39 |
| Obesity | 18 | 12 | 17 | <0.001 | <0.001 |
| Depression | 15 | 11 | 11 | <0.001 | 0.54 |
| Pulmonary circulatory diseases | 15 | 11 | 14 | <0.001 | <0.001 |
| Hospital characteristics | |||||
| Annual ED visit volume, median (IQR) | 42,704 (29,50562,470) | 44,119 (29,89564,097) | 46,695 (31,29866,235) | 0.02 | 0.0003 |
| Annual ED volume of COPD exacerbation with respiratory failure, median (IQR) | 45 (2672) | 42 (2368) | 38 (2364) | <0.001 | <0.001 |
| Urban/rural and teaching status, % | <0.001 | <0.001 | |||
| Metropolitan nonteaching | 53 | 52 | 47 | ||
| Metropolitan teaching | 31 | 35 | 39 | ||
| Nonmetropolitan | 16 | 13 | 13 | ||
| US region, % | <0.001 | <0.001 | |||
| Northeast | 28 | 16 | 36 | ||
| Midwest | 17 | 22 | 15 | ||
| South | 41 | 45 | 32 | ||
| West | 14 | 17 | 17 | ||
The unadjusted differences in outcomes are shown in Table 2. The combined‐use group had the highest inpatient mortality, longest LOS, and highest charges, followed by the IMV and NIV groups. In general, complications were few across all 3 groups, but the rate of iatrogenic pneumothorax was notably lower in the NIV group. Table 3 details the statistically significant predictors of NIV use in the propensity score model. Similar to the unadjusted analysis, older age, high‐income neighborhoods, Medicare insurance, and some comorbidities were positively associated with NIV use (eg, pulmonary circulatory disorders and liver disease), whereas a few comorbidities were negatively associated with NIV use (eg, pneumonia, and alcohol and drug abuse). With respect to hospital characteristics, higher case volumes of COPD exacerbation/respiratory failure, Northeastern and nonmetropolitan hospitals, and more recent years were associated with NIV use.
| Outcome | NIV Alone (A) (n=10,032) | IMV Alone (B) (n=15,427) | Combined Use (C) (n=2311) | P Value. A vs B | P Value, B vs C |
|---|---|---|---|---|---|
| |||||
| Inpatient mortality, n (%) | 825 (8) | 2,454 (16) | 407 (18) | <0.001 | 0.04 |
| Hospital length of stay, median (IQR), d | 5 (48) | 8 (513) | 10 (716) | <0.001 | <0.001 |
| Hospital charge per visit, median (IQR), $ | 26,002 (15,74744,638) | 53,432 (31,99892,664) | 64,585 (39,024110,336) | <0.001 | <0.001 |
| Complications* | |||||
| Ventilator‐associated pneumonia, n (%) | 10 (0.1) | 10 (0.1) | 10 (0.5) | 0.09 | 1.00 |
| Facial injury, n (%) | 10 (0.1) | 10 (0.1) | 10 (0.5) | 0.26 | 1.00 |
| Iatrogenic pneumothorax, n (%) | 10 (0.1) | 90 (0.6) | 14 (0.6) | <0.001 | 0.90 |
| Patient Characteristics | Adjusted OR (95% CI)* | P Value |
|---|---|---|
| ||
| Age, y | ||
| 4049 | 1.00 (Reference) | |
| 5059 | 0.96 (0.84‐1.11) | 0.61 |
| 6069 | 0.96 (0.84‐1.10) | 0.56 |
| 7079 | 1.09 (0.94‐1.25) | 0.25 |
| 80 | 1.30 (1.12‐1.52) | 0.001 |
| Quartile for median household income of patient ZIP code, $ | ||
| 138,999 | 1.00 (Reference) | |
| 39,00047,999 | 1.13 (1.05‐1.21) | 0.001 |
| 48,00062,999 | 1.21 (1.12‐1.30) | <0.001 |
| 63,000 | 1.21 (1.11‐1.32) | <0.001 |
| Insurance status | ||
| Medicare | 1.00 (Reference) | |
| Medicaid | 0.79 (0.72‐0.88) | <0.001 |
| Private | 0.88 (0.81‐0.96) | 0.004 |
| Self‐pay | 0.68 (0.56‐0.82) | <0.001 |
| Other | 0.88 (0.73‐1.07) | 0.22 |
| Season | ||
| Winter (January 1March 31) | 1.00 (Reference) | |
| Spring (April 1June 30) | 1.06 (0.99‐1.14) | 0.11 |
| Summer (July 1September 30) | 1.17 (1.08‐1.26) | <0.001 |
| Fall (October 1December 31) | 1.24 (1.15‐1.33) | <0.001 |
| Comorbidity | ||
| CHF | 0.90 (0.85‐0.95) | <0.001 |
| Pulmonary circulatory disorders | 1.40 (1.29‐1.52) | <0.001 |
| Diabetes, complicated | 1.25 (1.08‐1.44) | 0.002 |
| Liver disease | 1.79 (1.40‐2.28) | <0.001 |
| Coagulopathy | 0.54 (0.46‐0.63) | <0.001 |
| Obesity | 1.52 (1.41‐1.65) | <0.001 |
| Weight loss | 0.50 (0.44‐0.57) | <0.001 |
| Fluid and electrolyte disorders | 0.84 (0.80‐0.89) | <0.001 |
| Deficiency anemia | 0.83 (0.78‐0.90) | <0.001 |
| Alcohol abuse | 0.66 (0.58‐0.76) | <0.001 |
| Drug abuse | 0.74 (0.62‐0.88) | 0.001 |
| Psychoses | 1.22 (1.10‐1.37) | <0.001 |
| Depression | 1.45 (1.34‐1.57) | <0.001 |
| Pneumonia | 0.48 (0.45‐0.51) | <0.001 |
| Valvular heart disease | 0.87 (0.77‐0.97) | 0.01 |
| Neurological disorders | 0.89 (0.80‐0.98) | 0.02 |
| RA/collagen vascular diseases | 1.25 (1.02‐1.53) | 0.04 |
| Blood‐loss anemia | 0.72 (0.53‐0.97) | 0.03 |
| Hospital characteristics | ||
| Annual ED visit volume, per 1000‐visit increase | 0.997 (0.996‐0.998) | <0.001 |
| Annual ED volume of COPD exacerbation with respiratory failure, per 10‐visit increase | 1.03 (1.02‐1.03) | <0.001 |
| Urban/rural and teaching status | ||
| Metropolitan nonteaching | 1.00 (Reference) | |
| Metropolitan teaching | 0.91 (0.85‐0.97) | 0.006 |
| Nonmetropolitan | 1.30 (1.20‐1.42) | <0.001 |
| US region | ||
| Northeast | 1.00 (Reference) | |
| Midwest | 0.44 (0.40‐0.48) | <0.001 |
| South | 0.54 (0.50‐0.58) | <0.001 |
| West | 0.51 (0.46‐0.56) | <0.001 |
| Calendar year | ||
| 2006 | 1.00 (Reference) | |
| 2007 | 1.30 (1.22‐1.39) | <0.001 |
| 2008 | 1.65 (1.54‐1.76) | <0.001 |
In terms of propensity score distributions (see Supporting Information, Figure E1, in the online version of this article), there was sufficient overlap of the NIV and IMV groups. After matching on propensity score for the NIV and IMV groups, the differences in baseline characteristics were all balanced (see Supporting Information, Table E1, in the online version of this article), as indicated by <10% standardized differences in all covariates between the 2 groups. Finally, in the propensity scorematched cohort (see Supporting Information, Table E2, in the online version of this article), NIV use remained associated with significantly lower inpatient mortality (risk ratio: 0.54; 95% CI: 0.50‐0.59, P<0.001), a shorter hospital LOS (mean difference, 3.2 days; 95% CI: 3.4 to 2.9 days, P<0.001), and lower hospital charges (mean difference, P<$35,012; 95% CI: $36,848 to $33,176, P<0.001), compared with IMV use. Use of NIV also was associated with a lower rate of iatrogenic pneumothorax than IMV use (0.05% vs 0.5%, P<0.001).
Using hospital preference for NIV vs IMV as an instrument, the instrumental analysis confirmed the benefits of NIV use, with a 5% reduction in inpatient mortality in the NIV‐preferring hospitals (risk difference, P<5%; 95% CI: P<1.8% to P<8.3%).
In the sensitivity analysis to assess the impact of an unmeasured confounder, the confounder would have had to have a very strong impact on outcome (risk ratio: 5) and a severe exposure‐confounder imbalance (odds ratio of exposure on confounder: 5) to reduce the observed association to 1.0. In other words, an individual unmeasured confounder is unlikely to explain the observed association.
DISCUSSION
In this nationally representative sample of 67,651 ED visits for AECOPD with acute respiratory failure, we found that NIV use was increasing from 2006 to 2008. However, the utilization of NIV remained low (16% in 2008) and varied widely by patient and hospital characteristic. As with all observational studies, causality cannot be inferred definitely; however, our study suggests that, NIV usecompared with IMV usewas associated with potentially important benefits: a reduction of inpatient mortality by 46%, shortened hospital LOS by 3 days, reduced hospital charges by approximately $35,000 per visit, and modestly reduced risk of iatrogenic pneumothorax.
A recent analysis using the US Nationwide Inpatient Sample has shown increasing use of NIV and concomitant decreasing mortality in AECOPD over time.[28] Our analysis confirmed these favorable trends in the United States using a much larger NEDS sample (28 million visits in the NEDS vs 8 million visits in the Nationwide Inpatient Sample per year). Despite these favorable trends, NIV was still underutilized for AECOPD with respiratory failure in the United States (16% in 2008) compared with major European countries (40%).[29] Although our study lacked clinical details to arrive at the optimal rate of NIV use, the low rate of NIV use is concerning and suggests room for improvement in NIV use in appropriate patients as outlined by the current COPD guidelines.[18, 30] Why is NIV not widely adopted, given its demonstrated efficacy? Previous surveys have identified several perceived reasons for low NIV use, including lack of physician knowledge, insufficient respiratory therapist training, inadequate equipment, and time required for setting up NIV.[29, 31, 32] Our study adds to the literature by showing the actual predictors of NIV use in the real world. Our data showed that the early adopters were hospitals with higher case volumes, and hospitals in the Northeast and in nonmetropolitan areas. A higher case volume has been linked with lower mortality in AECOPD (ie, practice makes perfect),[33] and frequent NIV use could explain the lower AECOPD mortality in highcase volume centers. Alternatively, smaller hospitals tend to have moonlighters working in EDs who may not be board certified in emergency medicine. Perhaps the logical next step is to conduct a qualitative study to understand the specifics of best practices and provider characteristics in these Northeastern, highercase volume centers. Another incentive to promote NIV use in clinical practice is the cost‐effectiveness associated with this intervention, as previous studies have shown that, compared with usual care, receiving NIV was associated with a reduction in costs, mainly through reduced use of the ICU.[34, 35]
Some patient factors associated with NIV use may be well justified. For example, older AECOPD patients may have an advance directive describing their treatment wishes (eg, do‐not‐intubate order),[36] and therefore NIV was preferred to IMV. Also, our data suggested AECOPD patients with a suspected pneumonia component were less likely to be placed on NIV, which is consistent with COPD guideline recommendations.[18, 30] As outlined in the current guidelines, the major contraindications to NIV include impending respiratory arrest, excessive respiratory secretions, massive gastrointestinal bleeding, recent facial trauma, or altered mental status.[18, 30] By contrast, some factors associated with NIV use may be targeted for intervention, such as lower rates of NIV use in the uninsured, patients who live in low‐income neighborhoods, and hospitals in US regions other than the Northeast.
Current guidelines recommend using NIV in AECOPD patients with early signs of respiratory failure, such as arterial pH of 7.257.35 or pCO2 45 mm Hg.[18, 30] When NIV is considered as the modality of ventilatory support, it should probably be used as early as possible,[37] because evidence suggests that delayed use of NIV may lead to severe respiratory acidosis and increased mortality.[38] Other than in ICUs, NIV can be used on general wards and in EDs that have adequate staff training and experience, because the success rates of NIV in these settings are similar to those reported in ICU studies.[8, 36, 39] In addition, NIV is more cost‐effective when performed outside the ICU.[35] In fact, studies have found a substantial portion of patients had NIV started in the ED (one‐fourth) and on the general ward (one‐fourth).[31, 40] Given the shortage of intensivists in the United States, hospitalists begin to play an important role in provision of critical care outside the ICU.[41] Once NIV is used, it is important to ensure that it is delivered effectively and monitored closely because NIV failure has been shown to be associated with high mortality.[28, 42]
This study has some potential limitations. First, we used administrative claims that lack clinical details such as data on arterial blood gases and severity scores, and thus potential residual confounding may exist. In our study, the IMV group may be sicker than the NIV group, which could partially explain the increased mortality with IMV. However, the propensity scores overlap to a great extent between the 2 study groups, suggesting that a strong confounding bias is less likely, given the observed covariates. Furthermore, the instrumental variable and sensitivity analyses taking into account unmeasured confounders still suggested the benefits of NIV. Second, the NEDS does not contain data on the location where NIV was initiated (eg, ED, ward, or ICU) or the timing of initiating NIV or IMV. As a result, for the combined‐use group, we could not further distinguish the group switching from NIV to IMV (ie, NIV failure)[42] or from IMV to NIV (ie, NIV as a weaning strategy).[43] Accordingly, we chose to focus on the comparativeness effectiveness of NIV vs IMV. Third, although the NEDS data have undergone quality‐control procedures,[44] some misclassification may exist in identifying patient population and interventions. Finally, the analysis may not reflect the most recent trend in NIV use, as the 2010 NEDS data have just been released. In addition, although the study is the largest to date on this topic, our findings may not be generalizable to EDs that were not part of the NEDS.
In summary, in this nationally representative ED and inpatient database, NIV use is increasing for AECOPD with acute respiratory failure; however, its adoption remains low and varies widely between US hospitals. Our observational study suggests that NIV appears to be more effective and safer than IMV in the real‐world setting. There is an opportunity to increase the use of NIV as recommended in guidelines and to promote the use NIV in replacement of IMV in patients with severe AECOPD. Given the increasing mortality burden of COPD, such a strategy may help reduce COPD mortality at the population level, thereby fulfilling the objectives of Healthy People 2020.
Disclosure
Partial results from this study were presented at the 2012 Society for Academic Emergency Medicine Annual Meeting, Chicago, Illinois, May 912, 2012. This project was supported by grant number R03HS020722 from the Agency for Healthcare Research and Quality. The content is solely the responsibility of the authors and does not necessarily represent the official views of the Agency for Healthcare Research and Quality. The authors have no conflicts of interest to disclose.
- Centers for Disease Control and Prevention, National Center for Health Statistics. National Vital Statistics Reports, 2011. Deaths: final data for 2008. Available at: http://www.cdc.gov/nchs/data/nvsr/nvsr59/nvsr59_10.pdf. Accessed August 15, 2012.
- , , , . Trends in the leading causes of death in the United States, 1970–2002. JAMA. 2005;294:1255–1259.
- , , . National study of emergency department visits for acute exacerbation of chronic obstructive pulmonary disease. Acad Emerg Med. 2008;15:1275–1283.
- , , , , . Chronic obstructive pulmonary disease surveillance—United States, 1971–2000. MMWR Surveill Summ. 2002;51:1–16.
- US Department of Health and Human Services. Healthy People 2020. Objectives for Respiratory Diseases. Available at: http://www.healthypeople. gov/2020/topicsobjectives2020/objectiveslist.aspx?topicId=36. Accessed May 3, 2012.
- . Mechanical ventilation: invasive versus noninvasive. Eur Respir J Suppl. 2003;47:31s–37s.
- , , , et al. Noninvasive ventilation for acute exacerbations of chronic obstructive pulmonary disease. N Engl J Med. 1995;333:817–822.
- , , . Early use of non‐invasive ventilation for acute exacerbations of chronic obstructive pulmonary disease on general respiratory wards: a multicentre randomised controlled trial. Lancet. 2000;355:1931–1935.
- , , , et al. Randomised controlled trial of nasal ventilation in acute ventilatory failure due to chronic obstructive airways disease. Lancet. 1993;341:1555–1557.
- , , , . Non‐invasive positive pressure ventilation for treatment of respiratory failure due to exacerbations of chronic obstructive pulmonary disease. Cochrane Database Syst Rev. 2004;(3):CD004104.
- , , , et al. Noninvasive vs. conventional mechanical ventilation in patients with chronic obstructive pulmonary disease after failure of medical treatment in the ward: a randomized trial. Intensive Care Med. 2002;28:1701–1707.
- . Noninvasive vs conventional mechanical ventilation in acute respiratory failure: a multicenter, randomized controlled trial. Chest. 2005;128:3916–3924.
- , , , , , . Mechanical ventilation in chronic obstructive pulmonary disease patients, noninvasive vs. invasive method (randomized prospective study). Coll Antropol. 2009;33:791–797.
- , , , et al. Noninvasive Positive‐Pressure Ventilation (NPPV) for Acute Respiratory Failure. Rockville, MD: Agency for Healthcare Research and Quality; July 2012: Report 12‐EHC089‐EF. Available at: http://effectivehealthcareahrqgov/ehc/products/273/1180/CER68_NPPV_FinalReport_20120706pdf. Accessed December 11, 2012.
- Healthcare Cost and Utilization Project (HCUP). HCUP Nationwide Emergency Department Sample (NEDS). Rockville, MD: Agency for Healthcare Research and Quality; 2012. Available at: http://www.hcup‐us.ahrq.gov/nedsoverview.jsp. Accessed April 15, 2012.
- American Hospital Association. Annual survey database. Available at: http://www.ahadata.com/ahadata/html/AHASurvey.html. Accessed April 15, 2012.
- , , , . Age‐related differences in clinical outcomes for acute asthma in the United States, 2006–2008. J Allergy Clin Immunol. 2012;129:1252e1–1258e1.
- Global Initiative for Chronic Obstructive Lung Disease (GOLD). NHLBI/WHO Global Strategy for the Diagnosis, Management and Prevention of COPD. Available at: http://www.goldcopd.org. Accessed April 15, 2012.
- .US Bureau of the Census. Census regions and divisions of the United States. Available at: http://www.census.gov/geo/www/us_regdiv.pdf. Accessed April 9, 2012.
- .Healthcare Cost and Utilization Project. Comorbidity software. Available at: http://www.hcup‐us.ahrq.gov/toolssoftware/comorbidity/comorbidity.jsp. Accessed April 15, 2012.
- , , , . Comorbidity measures for use with administrative data. Med Care. 1998;36:8–27.
- Healthcare Cost and Utilization Project (HCUP). HCUP Methods Series. Hierarchical Modeling Using HCUP Data. Rockville, MD: Agency for Healthcare Research and Quality; 2012: Report 2007‐01. Available at: http://www.hcup‐us.ahrq.gov/reports/methods/2007_01.pdf. Accessed April 15, 2012.
- , , . Indications for propensity scores and review of their use in pharmacoepidemiology. Basic Clin Pharmacol Toxicol. 2006;98:253–259.
- , , , , , . Antibiotic therapy and treatment failure in patients hospitalized for acute exacerbations of chronic obstructive pulmonary disease. JAMA. 2010;303:2035–2042.
- . An introduction to propensity score methods for reducing the effects of confounding in observational studies. Multivariate Behav Res. 2011;46:399–424.
- , , . Instrumental variable methods in comparative safety and effectiveness research. Pharmacoepidemiol Drug Saf. 2010;19:537–554.
- . Sensitivity analysis and external adjustment for unmeasured confounders in epidemiologic database studies of therapeutics. Pharmacoepidemiol Drug Saf. 2006;15:291–303.
- , , , et al. Outcomes of noninvasive ventilation for acute exacerbations of chronic obstructive pulmonary disease in the United States, 1998–2008. Am J Respir Crit Care Med. 2012;185:152–159.
- , , , , . A European survey of noninvasive ventilation practices. Eur Respir J. 2010;36:362–369.
- , . Standards for the diagnosis and treatment of patients with COPD: a summary of the ATS/ERS position paper. Eur Respir J. 2004;23:932–946.
- , , , . Utilization of noninvasive ventilation in acute care hospitals: a regional survey. Chest. 2006;129:1226–1233.
- , , . A survey of the use of noninvasive ventilation in academic emergency departments in the United States. Respir Care. 2009;54:1306–1312.
- , , . Emergency department case volume and patient outcomes in acute exacerbations of chronic obstructive pulmonary disease. Acad Emerg Med. 2012;19:656–663.
- , , , , . Noninvasive positive pressure ventilation in the setting of severe, acute exacerbations of chronic obstructive pulmonary disease: more effective and less expensive. Crit Care Med. 2000;28:2094–2102.
- , , , . Cost effectiveness of ward based non‐invasive ventilation for acute exacerbations of chronic obstructive pulmonary disease: economic analysis of randomised controlled trial. BMJ. 2003;326:956.
- , , . Noninvasive positive pressure ventilation reverses acute respiratory failure in select “do‐not‐intubate” patients. Crit Care Med. 2005;33:1976–1982.
- , . Noninvasive ventilation for acute exacerbations of chronic obstructive pulmonary disease: “Don't think twice, it's alright!”. Am J Respir Crit Care Med. 2012;185:121–123.
- , , , , . Acidosis, non‐invasive ventilation and mortality in hospitalised COPD exacerbations. Thorax. 2011;66:43–48.
- , , , , . Use of noninvasive positive‐pressure ventilation on the regular hospital ward: experience and correlates of success. Respir Care. 2006;51:1237–1243.
- , , , et al. Bilevel noninvasive positive pressure ventilation for acute respiratory failure: survey of Ontario practice. Crit Care Med. 2005;33:1477–1483.
- . Hospitalists and intensivists: partners in caring for the critically ill—the time has come. J Hosp Med. 2010;5:1–3.
- , , , , , . Incidence and causes of non‐invasive mechanical ventilation failure after initial success. Thorax. 2000;55:819–825.
- , , , . Noninvasive positive pressure ventilation as a weaning strategy for intubated adults with respiratory failure. Cochrane Database Syst Rev. 2010:CD004127.
- Healthcare Cost and Utilization Project (HCUP). HCUP Quality Control Procedures. Rockville, MD: Agency for Healthcare Research and Quality; 2012. Available at: http://www.hcup‐us.ahrq.gov/db/quality.jsp. Accessed December 15, 2012.
Chronic obstructive pulmonary disease (COPD) is now the third leading cause of death in the United States,[1] and its rising mortality trend is unique among the top 5 causes of death.[2] Acute exacerbations of COPD (AECOPD) are important events in the natural history of COPD, accounting for 1.5 million emergency department (ED) visits and 726,000 hospitalizations each year in the United States.[3, 4] Given the significant morbidity and mortality from AECOPD, Healthy People 2020 lists reducing deaths, hospitalizations, and ED visits as the key objectives for COPD.[5]
Over the past 2 decades, noninvasive ventilation (NIV) has emerged as a potentially useful treatment modality in AECOPD patients with acute respiratory failure. Noninvasive ventilation commonly refers to positive‐pressure ventilatory support delivered through a nasal or full‐face mask, such as bilevel positive airway pressure.[6] A number of randomized controlled trials[7, 8, 9] and meta‐analyses[10] have suggested a mortality‐reduction benefit with NIV use compared with standard medical care in AECOPD. To our knowledge, however, very few small randomized controlled trials compared NIV vs invasive mechanical ventilation (IMV) head‐to‐head,[11, 12, 13] and a recent evidence review found only 5 studies (405 subjects) on this topic.[14] Collectively, the limited evidence from randomized trials showed that NIV use resulted in similar intensive care unit (ICU) and in‐hospital mortality, fewer complications (eg, ventilator‐associated pneumonia and sepsis), and shorter hospital length of stays (LOS). Given that these trials have a smaller sample size and tend to exclude older patient (age >75 years) or patients with multiple comorbidities, there is a need to better understand the adoption and effectiveness of NIV treatment for AECOPD in a much larger patient population in the real‐world setting using observational data.
To address these knowledge gaps in the literature, we analyzed data from a large, nationally representative ED and inpatient sample. The objective of the present analysis was 2‐fold: (1) to characterize the use of NIV and IMV in AECOPD patients with acute respiratory failure at a national level; and (2) to compare the effectiveness of NIV vs IMV in the real‐world setting.
METHODS
Study Design and Setting
We conducted a retrospective cohort study using data from the 20062008 Nationwide Emergency Department Sample (NEDS),[15] a component of the Healthcare Cost and Utilization Project sponsored by the Agency for Healthcare Research and Quality. The NEDS is nationally representative of all community hospitalbased EDs in the United States, defined by the American Hospital Association as all nonfederal, short‐term, general, and other specialty hospitals.[16] Community hospitals include academic medical centers if they are nonfederal short‐term hospitals. The NEDS was constructed using administrative records from the State Emergency Department Databases and the State Inpatient Databases. The former captures information on ED visits that do not result in an admission (ie, treat‐and‐release visits or transfers to another hospital); the latter contains information on patients initially seen in the ED and then admitted to the same hospital. Taken together, the resulting NEDS represents all ED visits regardless of disposition and contains information on short‐term outcomes for patients admitted through the ED. In other words, the NEDS is the largest all‐payer ED and inpatient database in the United States. The NEDS represents an approximately 20% stratified sample of US hospital‐based EDs, containing more than 28 million records of ED visits from approximately 1000 hospitals each year. Additional details of the NEDS can be found elsewhere.[15, 17] We received a waiver for this analysis from our institutional review board.
Study Population
Patient visits were included in this analysis if they carried any COPD‐related diagnostic code (ie, International Classification of Diseases, Ninth Revision, Clinical Modification [ICD‐9‐CM] code of 491.xx [chronic bronchitis], 492.xx [emphysema], or 496.xx [chronic airway obstruction, not elsewhere classified]) as their primary ED diagnosis and any acute respiratory failure code (ie, 518.81 [acute respiratory failure], 518.82 [pulmonary insufficiency not elsewhere classified, 518.84 [acute and chronic respiratory failure], or 799.1 [respiratory arrest]) as their secondary diagnosis. Patient visits with a primary diagnosis of acute respiratory failure and a secondary diagnosis of COPD were also included. Patients age <40 years were excluded, because they are much less likely to have COPD.[18]
Modes of Mechanical Ventilation
The primary exposure variable was mode of mechanical ventilation. To compare the effectiveness of different ventilatory modes, patients were divided into 3 groups according to the ventilation mode they received: (1) NIV alone, (2) IMV alone, and (3) combined modes of NIV and IMV. The use of NIV was identified by using Current Procedural Terminology (CPT) code of 94660 or ICD‐9 procedure code 93.90, whereas the use of IMV was identified by using CPT code of 31500 or ICD‐9 procedure code 96.04 or 96.7x.
Patient‐Level and Emergency DepartmentLevel Variables
The NEDS contains information on patient demographics, national quartiles for median household income based on the patient's ZIP code, payment sources, ICD‐9‐CM diagnoses and procedures, ED disposition, hospital LOS, and hospital disposition. Hospital characteristics include annual visit volume, urban‐rural status, ownership, teaching status, and US region. Geographic regions (Northeast, South, Midwest, and West) were defined according to Census Bureau boundaries.[19] To adjust for confounding by patient mix, Elixhauser comorbidity measures were derived based on the ICD‐9 codes, using the Agency for Healthcare Research and Quality's Comorbidity Software.[20] This risk‐adjustment tool has been derived and validated extensively.[21]
Outcome Measures
The outcome measures were all‐cause inpatient mortality, hospital LOS, hospital charges, and ventilator‐related complications. Three ventilator‐related complications were identified using ICD‐9 procedure codes: ventilator‐associated pneumonia (997.31), facial injury (910.x), and iatrogenic pneumothorax (512.1).
Statistical Analysis
Summary statistics are presented as proportions (with 95% confidence intervals [CI]), means (with standard deviations [SD]), or medians (with interquartile ranges). Bivariate associations were examined using Student t tests, Kruskal‐Wallis tests, and [2] tests, as appropriate. Emergency department and discharge weights were used to obtain national estimates at the ED and visit level. At all other times (eg, the propensity score and instrumental variable analyses), the unweighted cohort was analyzed, because survey weights are generally not advised for propensity score analysis using complex survey data.[22]
Propensity Score Analysis
To adjust for baseline patient and ED characteristics that may have confounded the relationship between ventilation mode and clinical outcomes, we performed propensity score and instrumental variable analyses. To compare the effectiveness of NIV vs IMV, a propensity score or predicted probability of NIV was estimated using a logistic‐regression model with all patient characteristics (age, sex, quartiles for median household income, weekend admission, insurance status, season, calendar year, and comorbid conditions) and ED characteristics (urban/rural and teaching status, US region, annual ED volume, and annual volume of AECOPD with respiratory failure) as the independent variables. We then performed 1:1 propensity score matching based on a nearest‐neighbor algorithm with caliper distance of 0.01. Although propensity score matching may result in a smaller sample, it provides a clinically relevant estimate of treatment effect because subjects in the matched sample are potential candidates for either treatment option.[23, 24] An absolute standardized difference between characteristics of <10% was considered as adequate balance.[25]
Instrumental Variable Analysis
When hospitals always or nearly always use NIV or IMV, this suggests the choice is largely independent of patient characteristics, and it is possible to use the hospital preference as a proxy for the actual treatment choice (ie, an instrument variable). The instrumental variable analysis simulates a natural randomization of patients to 2 hospital groups with high and low NIV use.
The main difference between instrumental variable and propensity score analysis is that the former could potentially adjust for unmeasured confounders.[26] We used Stata procedure IVREG to estimate the outcome differences between NIV‐preferring hospitals (NIV use in 90% of patients) and IMV‐preferring hospitals (NIV use in 10% of patients).
All odds ratios (ORs) and ‐coefficients are presented with 95% CIs. All analyses were performed using Stata 12.0 software (StataCorp, College Station, TX). All P values are 2‐sided, with P<0.05 considered statistically significant.
Sensitivity Analyses
We conducted a sensitivity analysis to determine whether it was plausible that an unmeasured confounder could completely explain the observed results. The risk ratio of a hypothetical unmeasured confounder on study outcome and the exposure‐confounder imbalance were both varied to see at what point the observed association was reduced to 1.0.[27]
RESULTS
Patient and ED Characteristics
The 20062008 NEDS sample contained 67,651 ED visits for AECOPD with acute respiratory failure from 1594 US EDs. After the weighting procedure, there were an estimated 101,000 visits annually for AECOPD with acute respiratory failure from approximately 4700 US EDs. In the weighted analysis, the mean patient age of these visits was 68 years, and 56% were made by women. Ninety‐six percent were admitted to the hospital. Of these, the mortality rate was 9% and the mean hospital LOS was 7 days. Figure 1 shows the secular trends in NIV, IMV, and the combined use over the 3‐year study period. Use of IMV decreased from 28% in 2006 to 19% in 2008 (P<0.001), whereas NIV use increased slightly from 14% in 2006 to 16% in 2008 (P=0.049); the combined use of both ventilation modalities remained stable (4%). Inpatient mortality decreased from 10% in 2006 to 7% in 2008 (P<0.001).
Figure 2 shows that the frequency of NIV use (including combined use of NIV and IMV) varied widely between hospitals, ranging from 0% to 100% with a median of 11%. In the unweighted cohort of AECOPD with acute respiratory failure, 43% received some forms of ventilatory support. Table 1 shows the patient and hospital characteristics of the patients receiving ventilatory support: 36% received NIV, 56% received IMV, and 8% received combined use. In general, patients receiving combined use of NIV and IMV tended to have more comorbidities (eg, congestive heart failure and pneumonia) compared with the NIV‐alone or IMV‐alone groups. With respect to hospital characteristics, NIV was used more often in hospitals with higher volumes of COPD exacerbation and respiratory failure, in nonmetropolitan hospitals, and in hospitals in the Northeast.
| NIV Alone (A) (n=10,032) | IMV Alone (B) (n=15,427) | Combined Use (C) (n=2311) | P Value, A vs B | P Value, B vs C | |
|---|---|---|---|---|---|
| |||||
| Patient characteristics | |||||
| Age, y, | <0.001 | 0.64 | |||
| 4049 | 5 | 5 | 5 | ||
| 5059 | 17 | 18 | 19 | ||
| 6069 | 31 | 33 | 33 | ||
| 7079 | 30 | 29 | 29 | ||
| 80 | 17 | 15 | 13 | ||
| Female sex, % | 57 | 53 | 54 | <0.001 | 0.87 |
| Quartile for median household income of patient ZIP code, $, % | <0.001 | <0.001 | |||
| 138,999 | 30 | 34 | 29 | ||
| 39,00047,999 | 28 | 28 | 28 | ||
| 48,00062,999 | 24 | 22 | 24 | ||
| 63,000 | 18 | 15 | 19 | ||
| Weekend admission, % | 27 | 28 | 28 | 0.07 | 0.80 |
| Insurance status, % | <0.001 | 0.91 | |||
| Medicare | 74 | 70 | 70 | ||
| Medicaid | 9 | 12 | 12 | ||
| Private | 12 | 13 | 13 | ||
| Self‐pay | 2 | 3 | 2 | ||
| Other | 2 | 2 | 2 | ||
| Season, % | <0.001 | 0.16 | |||
| Winter (January 1March 31) | 29 | 32 | 31 | ||
| Spring (April 1June 30) | 24 | 25 | 26 | ||
| Summer (July 1September 30) | 22 | 20 | 19 | ||
| Fall (October 1December 31) | 25 | 22 | 24 | ||
| No. of comorbidities, median (IQR) | 4 (35) | 4 (35) | 4 (36) | <0.001 | <0.001 |
| Selected comorbidities, % | |||||
| Hypertension | 56 | 55 | 55 | 0.01 | 0.65 |
| CHF | 38 | 40 | 44 | 0.001 | <0.001 |
| Fluid and electrolyte disorders | 37 | 44 | 49 | <0.001 | <0.001 |
| Diabetes, uncomplicated | 27 | 26 | 29 | 0.04 | 0.002 |
| Pneumonia | 19 | 34 | 39 | <0.001 | <0.001 |
| Deficiency anemia | 16 | 19 | 19 | <0.001 | 0.39 |
| Obesity | 18 | 12 | 17 | <0.001 | <0.001 |
| Depression | 15 | 11 | 11 | <0.001 | 0.54 |
| Pulmonary circulatory diseases | 15 | 11 | 14 | <0.001 | <0.001 |
| Hospital characteristics | |||||
| Annual ED visit volume, median (IQR) | 42,704 (29,50562,470) | 44,119 (29,89564,097) | 46,695 (31,29866,235) | 0.02 | 0.0003 |
| Annual ED volume of COPD exacerbation with respiratory failure, median (IQR) | 45 (2672) | 42 (2368) | 38 (2364) | <0.001 | <0.001 |
| Urban/rural and teaching status, % | <0.001 | <0.001 | |||
| Metropolitan nonteaching | 53 | 52 | 47 | ||
| Metropolitan teaching | 31 | 35 | 39 | ||
| Nonmetropolitan | 16 | 13 | 13 | ||
| US region, % | <0.001 | <0.001 | |||
| Northeast | 28 | 16 | 36 | ||
| Midwest | 17 | 22 | 15 | ||
| South | 41 | 45 | 32 | ||
| West | 14 | 17 | 17 | ||
The unadjusted differences in outcomes are shown in Table 2. The combined‐use group had the highest inpatient mortality, longest LOS, and highest charges, followed by the IMV and NIV groups. In general, complications were few across all 3 groups, but the rate of iatrogenic pneumothorax was notably lower in the NIV group. Table 3 details the statistically significant predictors of NIV use in the propensity score model. Similar to the unadjusted analysis, older age, high‐income neighborhoods, Medicare insurance, and some comorbidities were positively associated with NIV use (eg, pulmonary circulatory disorders and liver disease), whereas a few comorbidities were negatively associated with NIV use (eg, pneumonia, and alcohol and drug abuse). With respect to hospital characteristics, higher case volumes of COPD exacerbation/respiratory failure, Northeastern and nonmetropolitan hospitals, and more recent years were associated with NIV use.
| Outcome | NIV Alone (A) (n=10,032) | IMV Alone (B) (n=15,427) | Combined Use (C) (n=2311) | P Value. A vs B | P Value, B vs C |
|---|---|---|---|---|---|
| |||||
| Inpatient mortality, n (%) | 825 (8) | 2,454 (16) | 407 (18) | <0.001 | 0.04 |
| Hospital length of stay, median (IQR), d | 5 (48) | 8 (513) | 10 (716) | <0.001 | <0.001 |
| Hospital charge per visit, median (IQR), $ | 26,002 (15,74744,638) | 53,432 (31,99892,664) | 64,585 (39,024110,336) | <0.001 | <0.001 |
| Complications* | |||||
| Ventilator‐associated pneumonia, n (%) | 10 (0.1) | 10 (0.1) | 10 (0.5) | 0.09 | 1.00 |
| Facial injury, n (%) | 10 (0.1) | 10 (0.1) | 10 (0.5) | 0.26 | 1.00 |
| Iatrogenic pneumothorax, n (%) | 10 (0.1) | 90 (0.6) | 14 (0.6) | <0.001 | 0.90 |
| Patient Characteristics | Adjusted OR (95% CI)* | P Value |
|---|---|---|
| ||
| Age, y | ||
| 4049 | 1.00 (Reference) | |
| 5059 | 0.96 (0.84‐1.11) | 0.61 |
| 6069 | 0.96 (0.84‐1.10) | 0.56 |
| 7079 | 1.09 (0.94‐1.25) | 0.25 |
| 80 | 1.30 (1.12‐1.52) | 0.001 |
| Quartile for median household income of patient ZIP code, $ | ||
| 138,999 | 1.00 (Reference) | |
| 39,00047,999 | 1.13 (1.05‐1.21) | 0.001 |
| 48,00062,999 | 1.21 (1.12‐1.30) | <0.001 |
| 63,000 | 1.21 (1.11‐1.32) | <0.001 |
| Insurance status | ||
| Medicare | 1.00 (Reference) | |
| Medicaid | 0.79 (0.72‐0.88) | <0.001 |
| Private | 0.88 (0.81‐0.96) | 0.004 |
| Self‐pay | 0.68 (0.56‐0.82) | <0.001 |
| Other | 0.88 (0.73‐1.07) | 0.22 |
| Season | ||
| Winter (January 1March 31) | 1.00 (Reference) | |
| Spring (April 1June 30) | 1.06 (0.99‐1.14) | 0.11 |
| Summer (July 1September 30) | 1.17 (1.08‐1.26) | <0.001 |
| Fall (October 1December 31) | 1.24 (1.15‐1.33) | <0.001 |
| Comorbidity | ||
| CHF | 0.90 (0.85‐0.95) | <0.001 |
| Pulmonary circulatory disorders | 1.40 (1.29‐1.52) | <0.001 |
| Diabetes, complicated | 1.25 (1.08‐1.44) | 0.002 |
| Liver disease | 1.79 (1.40‐2.28) | <0.001 |
| Coagulopathy | 0.54 (0.46‐0.63) | <0.001 |
| Obesity | 1.52 (1.41‐1.65) | <0.001 |
| Weight loss | 0.50 (0.44‐0.57) | <0.001 |
| Fluid and electrolyte disorders | 0.84 (0.80‐0.89) | <0.001 |
| Deficiency anemia | 0.83 (0.78‐0.90) | <0.001 |
| Alcohol abuse | 0.66 (0.58‐0.76) | <0.001 |
| Drug abuse | 0.74 (0.62‐0.88) | 0.001 |
| Psychoses | 1.22 (1.10‐1.37) | <0.001 |
| Depression | 1.45 (1.34‐1.57) | <0.001 |
| Pneumonia | 0.48 (0.45‐0.51) | <0.001 |
| Valvular heart disease | 0.87 (0.77‐0.97) | 0.01 |
| Neurological disorders | 0.89 (0.80‐0.98) | 0.02 |
| RA/collagen vascular diseases | 1.25 (1.02‐1.53) | 0.04 |
| Blood‐loss anemia | 0.72 (0.53‐0.97) | 0.03 |
| Hospital characteristics | ||
| Annual ED visit volume, per 1000‐visit increase | 0.997 (0.996‐0.998) | <0.001 |
| Annual ED volume of COPD exacerbation with respiratory failure, per 10‐visit increase | 1.03 (1.02‐1.03) | <0.001 |
| Urban/rural and teaching status | ||
| Metropolitan nonteaching | 1.00 (Reference) | |
| Metropolitan teaching | 0.91 (0.85‐0.97) | 0.006 |
| Nonmetropolitan | 1.30 (1.20‐1.42) | <0.001 |
| US region | ||
| Northeast | 1.00 (Reference) | |
| Midwest | 0.44 (0.40‐0.48) | <0.001 |
| South | 0.54 (0.50‐0.58) | <0.001 |
| West | 0.51 (0.46‐0.56) | <0.001 |
| Calendar year | ||
| 2006 | 1.00 (Reference) | |
| 2007 | 1.30 (1.22‐1.39) | <0.001 |
| 2008 | 1.65 (1.54‐1.76) | <0.001 |
In terms of propensity score distributions (see Supporting Information, Figure E1, in the online version of this article), there was sufficient overlap of the NIV and IMV groups. After matching on propensity score for the NIV and IMV groups, the differences in baseline characteristics were all balanced (see Supporting Information, Table E1, in the online version of this article), as indicated by <10% standardized differences in all covariates between the 2 groups. Finally, in the propensity scorematched cohort (see Supporting Information, Table E2, in the online version of this article), NIV use remained associated with significantly lower inpatient mortality (risk ratio: 0.54; 95% CI: 0.50‐0.59, P<0.001), a shorter hospital LOS (mean difference, 3.2 days; 95% CI: 3.4 to 2.9 days, P<0.001), and lower hospital charges (mean difference, P<$35,012; 95% CI: $36,848 to $33,176, P<0.001), compared with IMV use. Use of NIV also was associated with a lower rate of iatrogenic pneumothorax than IMV use (0.05% vs 0.5%, P<0.001).
Using hospital preference for NIV vs IMV as an instrument, the instrumental analysis confirmed the benefits of NIV use, with a 5% reduction in inpatient mortality in the NIV‐preferring hospitals (risk difference, P<5%; 95% CI: P<1.8% to P<8.3%).
In the sensitivity analysis to assess the impact of an unmeasured confounder, the confounder would have had to have a very strong impact on outcome (risk ratio: 5) and a severe exposure‐confounder imbalance (odds ratio of exposure on confounder: 5) to reduce the observed association to 1.0. In other words, an individual unmeasured confounder is unlikely to explain the observed association.
DISCUSSION
In this nationally representative sample of 67,651 ED visits for AECOPD with acute respiratory failure, we found that NIV use was increasing from 2006 to 2008. However, the utilization of NIV remained low (16% in 2008) and varied widely by patient and hospital characteristic. As with all observational studies, causality cannot be inferred definitely; however, our study suggests that, NIV usecompared with IMV usewas associated with potentially important benefits: a reduction of inpatient mortality by 46%, shortened hospital LOS by 3 days, reduced hospital charges by approximately $35,000 per visit, and modestly reduced risk of iatrogenic pneumothorax.
A recent analysis using the US Nationwide Inpatient Sample has shown increasing use of NIV and concomitant decreasing mortality in AECOPD over time.[28] Our analysis confirmed these favorable trends in the United States using a much larger NEDS sample (28 million visits in the NEDS vs 8 million visits in the Nationwide Inpatient Sample per year). Despite these favorable trends, NIV was still underutilized for AECOPD with respiratory failure in the United States (16% in 2008) compared with major European countries (40%).[29] Although our study lacked clinical details to arrive at the optimal rate of NIV use, the low rate of NIV use is concerning and suggests room for improvement in NIV use in appropriate patients as outlined by the current COPD guidelines.[18, 30] Why is NIV not widely adopted, given its demonstrated efficacy? Previous surveys have identified several perceived reasons for low NIV use, including lack of physician knowledge, insufficient respiratory therapist training, inadequate equipment, and time required for setting up NIV.[29, 31, 32] Our study adds to the literature by showing the actual predictors of NIV use in the real world. Our data showed that the early adopters were hospitals with higher case volumes, and hospitals in the Northeast and in nonmetropolitan areas. A higher case volume has been linked with lower mortality in AECOPD (ie, practice makes perfect),[33] and frequent NIV use could explain the lower AECOPD mortality in highcase volume centers. Alternatively, smaller hospitals tend to have moonlighters working in EDs who may not be board certified in emergency medicine. Perhaps the logical next step is to conduct a qualitative study to understand the specifics of best practices and provider characteristics in these Northeastern, highercase volume centers. Another incentive to promote NIV use in clinical practice is the cost‐effectiveness associated with this intervention, as previous studies have shown that, compared with usual care, receiving NIV was associated with a reduction in costs, mainly through reduced use of the ICU.[34, 35]
Some patient factors associated with NIV use may be well justified. For example, older AECOPD patients may have an advance directive describing their treatment wishes (eg, do‐not‐intubate order),[36] and therefore NIV was preferred to IMV. Also, our data suggested AECOPD patients with a suspected pneumonia component were less likely to be placed on NIV, which is consistent with COPD guideline recommendations.[18, 30] As outlined in the current guidelines, the major contraindications to NIV include impending respiratory arrest, excessive respiratory secretions, massive gastrointestinal bleeding, recent facial trauma, or altered mental status.[18, 30] By contrast, some factors associated with NIV use may be targeted for intervention, such as lower rates of NIV use in the uninsured, patients who live in low‐income neighborhoods, and hospitals in US regions other than the Northeast.
Current guidelines recommend using NIV in AECOPD patients with early signs of respiratory failure, such as arterial pH of 7.257.35 or pCO2 45 mm Hg.[18, 30] When NIV is considered as the modality of ventilatory support, it should probably be used as early as possible,[37] because evidence suggests that delayed use of NIV may lead to severe respiratory acidosis and increased mortality.[38] Other than in ICUs, NIV can be used on general wards and in EDs that have adequate staff training and experience, because the success rates of NIV in these settings are similar to those reported in ICU studies.[8, 36, 39] In addition, NIV is more cost‐effective when performed outside the ICU.[35] In fact, studies have found a substantial portion of patients had NIV started in the ED (one‐fourth) and on the general ward (one‐fourth).[31, 40] Given the shortage of intensivists in the United States, hospitalists begin to play an important role in provision of critical care outside the ICU.[41] Once NIV is used, it is important to ensure that it is delivered effectively and monitored closely because NIV failure has been shown to be associated with high mortality.[28, 42]
This study has some potential limitations. First, we used administrative claims that lack clinical details such as data on arterial blood gases and severity scores, and thus potential residual confounding may exist. In our study, the IMV group may be sicker than the NIV group, which could partially explain the increased mortality with IMV. However, the propensity scores overlap to a great extent between the 2 study groups, suggesting that a strong confounding bias is less likely, given the observed covariates. Furthermore, the instrumental variable and sensitivity analyses taking into account unmeasured confounders still suggested the benefits of NIV. Second, the NEDS does not contain data on the location where NIV was initiated (eg, ED, ward, or ICU) or the timing of initiating NIV or IMV. As a result, for the combined‐use group, we could not further distinguish the group switching from NIV to IMV (ie, NIV failure)[42] or from IMV to NIV (ie, NIV as a weaning strategy).[43] Accordingly, we chose to focus on the comparativeness effectiveness of NIV vs IMV. Third, although the NEDS data have undergone quality‐control procedures,[44] some misclassification may exist in identifying patient population and interventions. Finally, the analysis may not reflect the most recent trend in NIV use, as the 2010 NEDS data have just been released. In addition, although the study is the largest to date on this topic, our findings may not be generalizable to EDs that were not part of the NEDS.
In summary, in this nationally representative ED and inpatient database, NIV use is increasing for AECOPD with acute respiratory failure; however, its adoption remains low and varies widely between US hospitals. Our observational study suggests that NIV appears to be more effective and safer than IMV in the real‐world setting. There is an opportunity to increase the use of NIV as recommended in guidelines and to promote the use NIV in replacement of IMV in patients with severe AECOPD. Given the increasing mortality burden of COPD, such a strategy may help reduce COPD mortality at the population level, thereby fulfilling the objectives of Healthy People 2020.
Disclosure
Partial results from this study were presented at the 2012 Society for Academic Emergency Medicine Annual Meeting, Chicago, Illinois, May 912, 2012. This project was supported by grant number R03HS020722 from the Agency for Healthcare Research and Quality. The content is solely the responsibility of the authors and does not necessarily represent the official views of the Agency for Healthcare Research and Quality. The authors have no conflicts of interest to disclose.
- Centers for Disease Control and Prevention, National Center for Health Statistics. National Vital Statistics Reports, 2011. Deaths: final data for 2008. Available at: http://www.cdc.gov/nchs/data/nvsr/nvsr59/nvsr59_10.pdf. Accessed August 15, 2012.
- , , , . Trends in the leading causes of death in the United States, 1970–2002. JAMA. 2005;294:1255–1259.
- , , . National study of emergency department visits for acute exacerbation of chronic obstructive pulmonary disease. Acad Emerg Med. 2008;15:1275–1283.
- , , , , . Chronic obstructive pulmonary disease surveillance—United States, 1971–2000. MMWR Surveill Summ. 2002;51:1–16.
- US Department of Health and Human Services. Healthy People 2020. Objectives for Respiratory Diseases. Available at: http://www.healthypeople. gov/2020/topicsobjectives2020/objectiveslist.aspx?topicId=36. Accessed May 3, 2012.
- . Mechanical ventilation: invasive versus noninvasive. Eur Respir J Suppl. 2003;47:31s–37s.
- , , , et al. Noninvasive ventilation for acute exacerbations of chronic obstructive pulmonary disease. N Engl J Med. 1995;333:817–822.
- , , . Early use of non‐invasive ventilation for acute exacerbations of chronic obstructive pulmonary disease on general respiratory wards: a multicentre randomised controlled trial. Lancet. 2000;355:1931–1935.
- , , , et al. Randomised controlled trial of nasal ventilation in acute ventilatory failure due to chronic obstructive airways disease. Lancet. 1993;341:1555–1557.
- , , , . Non‐invasive positive pressure ventilation for treatment of respiratory failure due to exacerbations of chronic obstructive pulmonary disease. Cochrane Database Syst Rev. 2004;(3):CD004104.
- , , , et al. Noninvasive vs. conventional mechanical ventilation in patients with chronic obstructive pulmonary disease after failure of medical treatment in the ward: a randomized trial. Intensive Care Med. 2002;28:1701–1707.
- . Noninvasive vs conventional mechanical ventilation in acute respiratory failure: a multicenter, randomized controlled trial. Chest. 2005;128:3916–3924.
- , , , , , . Mechanical ventilation in chronic obstructive pulmonary disease patients, noninvasive vs. invasive method (randomized prospective study). Coll Antropol. 2009;33:791–797.
- , , , et al. Noninvasive Positive‐Pressure Ventilation (NPPV) for Acute Respiratory Failure. Rockville, MD: Agency for Healthcare Research and Quality; July 2012: Report 12‐EHC089‐EF. Available at: http://effectivehealthcareahrqgov/ehc/products/273/1180/CER68_NPPV_FinalReport_20120706pdf. Accessed December 11, 2012.
- Healthcare Cost and Utilization Project (HCUP). HCUP Nationwide Emergency Department Sample (NEDS). Rockville, MD: Agency for Healthcare Research and Quality; 2012. Available at: http://www.hcup‐us.ahrq.gov/nedsoverview.jsp. Accessed April 15, 2012.
- American Hospital Association. Annual survey database. Available at: http://www.ahadata.com/ahadata/html/AHASurvey.html. Accessed April 15, 2012.
- , , , . Age‐related differences in clinical outcomes for acute asthma in the United States, 2006–2008. J Allergy Clin Immunol. 2012;129:1252e1–1258e1.
- Global Initiative for Chronic Obstructive Lung Disease (GOLD). NHLBI/WHO Global Strategy for the Diagnosis, Management and Prevention of COPD. Available at: http://www.goldcopd.org. Accessed April 15, 2012.
- .US Bureau of the Census. Census regions and divisions of the United States. Available at: http://www.census.gov/geo/www/us_regdiv.pdf. Accessed April 9, 2012.
- .Healthcare Cost and Utilization Project. Comorbidity software. Available at: http://www.hcup‐us.ahrq.gov/toolssoftware/comorbidity/comorbidity.jsp. Accessed April 15, 2012.
- , , , . Comorbidity measures for use with administrative data. Med Care. 1998;36:8–27.
- Healthcare Cost and Utilization Project (HCUP). HCUP Methods Series. Hierarchical Modeling Using HCUP Data. Rockville, MD: Agency for Healthcare Research and Quality; 2012: Report 2007‐01. Available at: http://www.hcup‐us.ahrq.gov/reports/methods/2007_01.pdf. Accessed April 15, 2012.
- , , . Indications for propensity scores and review of their use in pharmacoepidemiology. Basic Clin Pharmacol Toxicol. 2006;98:253–259.
- , , , , , . Antibiotic therapy and treatment failure in patients hospitalized for acute exacerbations of chronic obstructive pulmonary disease. JAMA. 2010;303:2035–2042.
- . An introduction to propensity score methods for reducing the effects of confounding in observational studies. Multivariate Behav Res. 2011;46:399–424.
- , , . Instrumental variable methods in comparative safety and effectiveness research. Pharmacoepidemiol Drug Saf. 2010;19:537–554.
- . Sensitivity analysis and external adjustment for unmeasured confounders in epidemiologic database studies of therapeutics. Pharmacoepidemiol Drug Saf. 2006;15:291–303.
- , , , et al. Outcomes of noninvasive ventilation for acute exacerbations of chronic obstructive pulmonary disease in the United States, 1998–2008. Am J Respir Crit Care Med. 2012;185:152–159.
- , , , , . A European survey of noninvasive ventilation practices. Eur Respir J. 2010;36:362–369.
- , . Standards for the diagnosis and treatment of patients with COPD: a summary of the ATS/ERS position paper. Eur Respir J. 2004;23:932–946.
- , , , . Utilization of noninvasive ventilation in acute care hospitals: a regional survey. Chest. 2006;129:1226–1233.
- , , . A survey of the use of noninvasive ventilation in academic emergency departments in the United States. Respir Care. 2009;54:1306–1312.
- , , . Emergency department case volume and patient outcomes in acute exacerbations of chronic obstructive pulmonary disease. Acad Emerg Med. 2012;19:656–663.
- , , , , . Noninvasive positive pressure ventilation in the setting of severe, acute exacerbations of chronic obstructive pulmonary disease: more effective and less expensive. Crit Care Med. 2000;28:2094–2102.
- , , , . Cost effectiveness of ward based non‐invasive ventilation for acute exacerbations of chronic obstructive pulmonary disease: economic analysis of randomised controlled trial. BMJ. 2003;326:956.
- , , . Noninvasive positive pressure ventilation reverses acute respiratory failure in select “do‐not‐intubate” patients. Crit Care Med. 2005;33:1976–1982.
- , . Noninvasive ventilation for acute exacerbations of chronic obstructive pulmonary disease: “Don't think twice, it's alright!”. Am J Respir Crit Care Med. 2012;185:121–123.
- , , , , . Acidosis, non‐invasive ventilation and mortality in hospitalised COPD exacerbations. Thorax. 2011;66:43–48.
- , , , , . Use of noninvasive positive‐pressure ventilation on the regular hospital ward: experience and correlates of success. Respir Care. 2006;51:1237–1243.
- , , , et al. Bilevel noninvasive positive pressure ventilation for acute respiratory failure: survey of Ontario practice. Crit Care Med. 2005;33:1477–1483.
- . Hospitalists and intensivists: partners in caring for the critically ill—the time has come. J Hosp Med. 2010;5:1–3.
- , , , , , . Incidence and causes of non‐invasive mechanical ventilation failure after initial success. Thorax. 2000;55:819–825.
- , , , . Noninvasive positive pressure ventilation as a weaning strategy for intubated adults with respiratory failure. Cochrane Database Syst Rev. 2010:CD004127.
- Healthcare Cost and Utilization Project (HCUP). HCUP Quality Control Procedures. Rockville, MD: Agency for Healthcare Research and Quality; 2012. Available at: http://www.hcup‐us.ahrq.gov/db/quality.jsp. Accessed December 15, 2012.
Copyright © 2013 Society of Hospital Medicine

Limited communication and management of emergency department hyperglycemia in hospitalized patients
While increasing evidence suggests that hyperglycemia during illness is associated with poor clinical outcome,1, 2 hyperglycemia in the hospital setting is often overlooked and unaddressed.3, 4 Early and intensive management of hyperglycemia may improve outcomes in hospitalized patients.57 Emergency Department (ED) glucose values may present an early opportunity to identify hyperglycemic patients as having unrecognized glucose intolerance and improve early glycemic control for hospitalized patients. Serum glucose values are available for 18% of 110 million annual ED visits in the United States, and many others undergo capillary glucose measurements.8 Although stressors and lack of fasting may contribute to ED hyperglycemia, communication and management should be similar.5 In this study, we hypothesized that in less than 20% of patients ED hyperglycemia would be recognized, communicated to patients, or they would receive ED treatment.
PATIENTS AND METHODS
Study Design
This was a retrospective cohort study using a structured medical record review of consecutive ED patients presenting between September 1, 2004 and August 31, 2005. We obtained our Institutional Review Board's approval with waiver of informed consent.
Study Setting and Population
The site of data collection was an urban, academic institution with approximately 50,000 annual ED visits. Care of hospitalized patients on the medical service is provided or supervised by staff hospitalists. Using the hospital's electronic records, we identified all patients with serum glucose ordered from the ED during the study time period. When there were multiple glucose results, we included only the first glucose values. Based on conservative thresholds for association of random glucose with poor clinical outcomes in hospitalized patients and with undiagnosed diabetes,5, 9 we considered glucose <140 mg/dL (7.8 mmol/L) as normal and categorized the remaining values into 2 groups: 140‐199 mg/dL (7.8‐11.0 mmol/L) and 200 mg/dL (11.1 mmol/L).
Study Protocol
We selected 200 patients from each glucose group using a random number generator, and 2 investigators (D.J.S., A.A.G.) performed a detailed chart review using a standardized data abstraction form. The research team met frequently to maintain consistency in data collection and to resolve disputes.
We recorded demographic data, presence of a primary care provider, relevant past medical history, current medications, ED treatment (insulin, oral hypoglycemic agents, and intravenous fluids), disposition (admission or discharge), and final diagnoses. Additionally, we evaluated capillary blood glucose values during the ED stay and serum glucose values during the ED and hospital stay to evaluate for hypoglycemia (defined as glucose <65 mg/dL). We also evaluate diagnosis codes to identify concurrent infection, sepsis, or trauma that may have been associated with the hyperglycemia, based on previously reported methodology.10, 11 Finally, we examined the inpatient or ED written discharge instructions to evaluate newly started antidiabetic medications, communication of hyperglycemia, and recommendation of repeat glucose/diabetes testing.
Data Analysis
We performed statistical analyses using Stata 9.0 (Stata Corp., College Station, TX) and summarized data using basic descriptive statistics with 95% confidence intervals (95%CIs). We measured interrater agreement for chart abstraction by calculating the kappa statistic for a 5% sample of charts abstracted by both investigators. We considered kappa >0.80 as high interrater agreement. We evaluated differences between subgroups of interest using chi square test. All P values are 2‐tailed, with P < 0.05 considered statistically significant.
RESULTS
During the data collection period, 27,688 (58%) ED visits had at least 1 serum glucose result. After excluding multiple glucose results for the same visit, the median glucose value was 106 mg/dL (range, 7‐2280 mg/dL); 3517 (13%) values were 140‐199 mg/dL, and 2304 (8%) values were 200 mg/dL. We located 385 of the 400 (96%) randomly selected charts. Interrater agreement for chart review was high (kappa = 0.91‐0.98).
Table 1 shows demographic characteristics and Table 2 shows clinical data of the sample, stratified by glucose group and charted diagnosis of diabetes. Overall, 55% of patients with glucose values 140‐199 mg/dL and 16% of patients with glucose 200 mg/dL had no prior diabetes diagnosis. Hyperglycemia was associated with sepsis for 22% of patients, infection without sepsis for 13% of patients, and traumatic injury for 19% of patients.
| Glucose 140199 mg/dL % (95%CI) or Median (IQR) | Glucose 200 mg/dL % (95%CI) or Median (IQR) | ||||
|---|---|---|---|---|---|
| Variable | Diabetes (n = 87) | No Diabetes (n = 107) | Diabetes (n = 160) | No Diabetes (n = 31) | Total n (%) or Median (IQR) (n = 385) |
| |||||
| Demographics | |||||
| Age | 66 (5475) | 68 (5083) | 63 (5275) | 58 (3376) | 64 (5176) |
| Female sex | 39% (2950) | 58% (4867) | 55% (4763) | 26% (1245) | 50% (4555) |
| Race/ethnicity | |||||
| White | 67% (5676) | 75% (6583) | 61% (5369) | 71% (5286) | 258 (67%) |
| Black | 22% (1432) | 9% (517) | 21% (1528) | 10% (226) | 65 (17%) |
| Hispanic | 2% (08) | 4% (19) | 6% (310) | 3% (017) | 26 (4%) |
| Other | 9% (417) | 12% (720) | 12% (819) | 16% (534) | 46 (12%) |
| Insurance | |||||
| Private | 32% (2343) | 41% (3251) | 32% (2540) | 45% (2764) | 137 (36%) |
| Medicare | 61% (5071) | 47%(3757) | 49% (4157) | 32% (1751) | 192 (50%) |
| Medicaid | 6% (213) | 7% (314) | 16% (1022) | 6% (121) | 40 (10%) |
| None | 1% (06) | 5% (211) | 3% (17) | 16% (534) | 16 (4%) |
| Assigned PCP | 95% (8999) | 84% (7690) | 86% (8091) | 71% (5286) | 86% (8390) |
| Past medical history | |||||
| Hypertension | 61% (5071) | 45% (3555) | 58% (5066) | 39% (2156) | 206 (54%) |
| Hyperlipidemia | 28% (1938) | 21% (1329) | 25% (1932) | 10% (226) | 90 (23%) |
| Coronary artery disease | 41% (3152) | 29% (2138) | 26% (2034) | 13% (430) | 113 (29%) |
| Current medications | |||||
| Insulin | 36% (2647) | 0 | 54% (4662) | 0 | 117 (30%) |
| Sulfonylurea | 25% (1736) | 0 | 26% (1933) | 0 | 63 (16%) |
| Other oral hypoglycemic | 39% (2950) | 0 | 24% (1832) | 0 | 73 (19%) |
| Systemic corticosteroids | 5% (111) | 10% (517) | 4% (18) | 6% (121) | 23 (6%) |
| Glucose 140199 mg/dL % (95%CI) or Median (IQR) | Glucose 200 mg/dL % (95%CI) or Median (IQR) | ||||
|---|---|---|---|---|---|
| Variable | Diabetes | No Diabetes | Diabetes | No Diabetes | Total n (%) or Median (IQR) |
| |||||
| ED clinical data | (n = 87) | (n = 107) | (n = 160) | (n = 31) | (n = 385) |
| Glucose value, mg/dL | 167 (163170) | 160 (157163) | 308 (285330) | 272 (242300) | 231 (220244) |
| Insulin | 6% (213) | 1% (03) | 31% (2439) | 19% (737) | 61 (16%) |
| IVF without dextrose* | 44% (3355) | 54% (4464) | 51% (4358) | 68% (4983) | 198 (51%) |
| Hyperglycemia charted as diagnosis | 3% (110) | 0 | 18% (1225) | 16% (534) | 36 (9%) |
| Hospital admission | 76% (6584) | 79% (7187) | 73% (6680) | 84% (6695) | 293 (76%) |
| Discharge data | (n = 84) | (n = 98) | (n = 156) | (n = 25) | (n = 363) |
| New insulin Rx | 8% (316) | 5% (212) | 6% (310) | 16% (536) | 26 (7%) |
| New sulfonylurea Rx | 2% (08) | 1% (06) | 4% (18) | 0 | 10 (3%) |
| New other oral hypoglycemic Rx | 1% (06) | 1% (06) | 3% (17) | 8% (126) | 9 (2%) |
| Any new diabetes Rx | 12% (621) | 7% (314) | 12% (718) | 24% (945) | 42 (12%) |
| Hyperglycemia noted in written instructions | 4% (110) | 3% (19) | 15% (1021) | 24% (945) | 36 (10%) |
| Repeat glucose/diabetes testing charted | 5% (112) | 1% (06) | 9% (515) | 16% (536) | 23 (6%) |
No patient received intravenous fluids with dextrose prior to initial serum glucose determination, and there was no difference in home corticosteroid use between groups (P = 0.23). Patients with known diabetes were more likely to receive insulin in the ED (P < 0.01). Only 1 patient received an oral hypoglycemic agent in the ED. Three patients had documented hypoglycemia on capillary blood glucose during the ED stay, and no patients had hypoglycemia based on serum glucose during the ED or hospital stay. Among hospitalized patients, 61% had inpatient orders for diabetic‐consistent/carbohydrate‐consistent diet, 65% for capillary glucose tests daily, and 63% for sliding scale insulin.
We also present written discharge instructions data for 363 visits (253 inpatient and 110 ED) in Table 2; discharge instructions were not available for 22 visits (12 deaths during hospitalization, 10 missing instructions). New antidiabetic medications were prescribed for 42 (12%) patients, all from the inpatient setting. There was no difference between inpatient and ED communication of hyperglycemia (10% [95%CI, 7%‐14%] versus 9% [95%CI, 4%‐15%]) and recommendation for further outpatient testing (8% [95%CI, 4%‐11%] versus 4% [95%CI, 0%‐7%]) in written discharge instructions (P = 0.73 and 0.16, respectively). Compared to those with glucose 140‐199 mg/dL, patients with glucose 200 mg/dL were more likely to receive written communication of hyperglycemia (17% [95%CI, 11%‐22%] versus 3% [95%CI, 0%‐6%]) and recommendation for further outpatient testing (10% [95%CI, 6%‐14%] versus 3% [95%CI, 0%‐5%] (both, P < 0.01).
DISCUSSION
Although noncritical ED glucose values may be overlooked, values sufficient to motivate inpatient and long‐term management are sometimes uncovered, and when unrecognized may be missed opportunities. Indeed, admission hyperglycemia has been linked to poor clinical outcomes in hospitalized patients for a variety of conditions, particularly for myocardial infarction, stroke, and critical illness.1215
In this study, we evaluated recognition, communication, and management of ED glucose values above a relatively conservative threshold of 140 mg/dL, occurring in 21% of ED glucose results. Diabetes screening thresholds for casual glucose values as low as 120 mg/dL,9 and intensive glycemic control in critically ill patients to a target as low as 110 mg/dL have been suggested.5 Nevertheless, only 16% of our sample received insulin in the ED for hyperglycemia, and hyperglycemia was charted as a diagnosis in only 9% of cases.
This is especially important because 77% of ED visits without hyperglycemia charted as a diagnosis resulted in hospitalization, and early glycemic control was infrequently initiated. Limited ED management of hyperglycemia may be driven by the presence of more critical management issues (eg, 54% of patients had concomitant infection or trauma), lack of familiarity with guidelines, which suggest treatment to glucose <140 mg/dL in critically ill patients and <180 mg/dL in all hospitalized patients,16 or fear of adverse events, such as hypoglycemia. Additionally, ED crowding has been shown to effect decreased quality and timeliness of treatment for pneumonia, and may have similar effects for hyperglycemia.17 Inpatient recognition of hyperglycemia, based on orders for diet, glucose checks, and insulin, appeared significantly better, but this did not translate to improved communication in written discharge instructions. Additionally, many hospitalized patients may spend many hours, or even days, in the ED waiting for beds, which currently is a missed opportunity to initiate early therapy.
Written discharge instructions informed less than 10% of patients of their hyperglycemia or outlined a plan for further evaluation and management. Our prior work suggests that nearly all (95%) ED patients want to be informed of elevated blood glucose and are willing to follow‐up, if instructed.18 The current data suggests that hyperglycemia in ED and hospitalized patients is frequently unrecognized and undertreated, and opportunities to institute an outpatient plan to address hyperglycemia are frequently missed.
This study has several potential limitations. This study was performed at a single academic center, which limits generalizability to other geographic areas and hospital types. Accuracy of abstracted data depended on chart review, which is limited by the possibility of missing, incomplete, or unreliable information. Standardized definitions and abstraction forms limited potential for bias, and high interrater agreement demonstrated internal reliability of the chart review. We considered only initial glucose values and were unable to determine nutritional status; it is possible that subsequent measurements were within an acceptable range. Conversely, hospitalized patients may have developed hyperglycemia subsequent to the initial glucose result, which would underestimate the scope of inpatient hyperglycemia. Also, because there are limited data for interpretation of ED hyperglycemia, we were unable to determine optimal glucose thresholds. Finally, we were unable to evaluate the content of verbal instructions or letters to outpatient providers, which limited our ability to fully describe communication of abnormal findings. However, patients do not often retain information in verbal instructions, in the context of new diagnoses and complex medical regimens.
In summary, recognition, management, and communication of ED hyperglycemia were suboptimal in our patient population and represent a missed opportunity. Enhanced recognition, management, and referral for hyperglycemia observed during usual ED care may provide an unobtrusive method to improve identification of undiagnosed diabetes/prediabetes and initiation of intensive glycemic control for hospitalized patients.
- ,,,,,.Hyperglycemia: an independent marker of in‐hospital mortality in patients with undiagnosed diabetes.J Clin Endocrinol Metab.2002;87:978–982.
- ,,,,,.The relation between hyperglycemia and outcomes in 2,471 patients admitted to the hospital with community‐acquired pneumonia.Diabetes Care.2005;28:810–815.
- ,,,,.Inpatient management of diabetes and hyperglycemia among general medicine patients at a large teaching hospital.J Hosp Med.2006;1:145–150.
- ,,,,.Unrecognized diabetes among hospitalized patients.Diabetes Care.1998;21:246–249.
- ACE/ADA Task Force on Inpatient Diabetes.American College of Endocrinology and American Diabetes Association Consensus statement on inpatient diabetes and glycemic control: a call to action.Diabetes Care.2006;29:1955–1962.
- ,,, et al.Intensive insulin therapy in the medical ICU.N Engl J Med.2006;354:449–461.
- ,,, et al.Randomized trial of insulin‐glucose infusion followed by subcutaneous insulin treatment in diabetic patients with acute myocardial infarction (DIGAMI study): effects on mortality at 1 year.JAm Coll Cardiol.1995;26:57–65.
- ,,.National Hospital Ambulatory Medical Care Survey: 2005 emergency department summary.Adv Data.2007;386:1–32.
- ,,, et al.Performance of recommended screening tests for undiagnosed diabetes and dysglycemia.Diabetes Care.2001;24:1899–1903.
- ,,, et al.The epidemiology of sepsis in the United States from 1979 through 2000.N Engl J Med.2003;348:1546–1554.
- ,,,,,.Completeness and accuracy of International Classification of Disease (ICD) external cause of injury codes in emergency department electronic data.Inj Prev.2007;13:422–425.
- ,,,.Stress hyperglycemia and increased risk of death after myocardial infarction in patients with and without diabetes: a systematic overview.Lancet.2000;355:773–778.
- ,,, et al.Admission blood glucose level as a risk indicator of death after myocardial infarction in patients with and without diabetes mellitus.Arch Intern Med.2004;164:982–989.
- ,,, et al.Effects of admission hyperglycemia on mortality and costs in acute ischemic stroke.Neurology.2002;59:67–71.
- .Association between hyperglycemia and increased hospital mortality in a heterogeneous population of critically ill patients.Mayo Clin Proc.2003;78:1471–1478.
- American Diabetes Association.Standards of Medical Care in Diabetes—2008.Diabetes Care.2008;31;S12–S54.
- ,,,.Effect of emergency department crowding on time to antibiotics in patients admitted with community‐acquired pneumonia.Ann Emerg Med.2007;50:501–509.
- ,,,,.Estimated risk for undiagnosed diabetes in the emergency department: a multicenter survey.Acad Emerg Med.2007;14:492–495.
While increasing evidence suggests that hyperglycemia during illness is associated with poor clinical outcome,1, 2 hyperglycemia in the hospital setting is often overlooked and unaddressed.3, 4 Early and intensive management of hyperglycemia may improve outcomes in hospitalized patients.57 Emergency Department (ED) glucose values may present an early opportunity to identify hyperglycemic patients as having unrecognized glucose intolerance and improve early glycemic control for hospitalized patients. Serum glucose values are available for 18% of 110 million annual ED visits in the United States, and many others undergo capillary glucose measurements.8 Although stressors and lack of fasting may contribute to ED hyperglycemia, communication and management should be similar.5 In this study, we hypothesized that in less than 20% of patients ED hyperglycemia would be recognized, communicated to patients, or they would receive ED treatment.
PATIENTS AND METHODS
Study Design
This was a retrospective cohort study using a structured medical record review of consecutive ED patients presenting between September 1, 2004 and August 31, 2005. We obtained our Institutional Review Board's approval with waiver of informed consent.
Study Setting and Population
The site of data collection was an urban, academic institution with approximately 50,000 annual ED visits. Care of hospitalized patients on the medical service is provided or supervised by staff hospitalists. Using the hospital's electronic records, we identified all patients with serum glucose ordered from the ED during the study time period. When there were multiple glucose results, we included only the first glucose values. Based on conservative thresholds for association of random glucose with poor clinical outcomes in hospitalized patients and with undiagnosed diabetes,5, 9 we considered glucose <140 mg/dL (7.8 mmol/L) as normal and categorized the remaining values into 2 groups: 140‐199 mg/dL (7.8‐11.0 mmol/L) and 200 mg/dL (11.1 mmol/L).
Study Protocol
We selected 200 patients from each glucose group using a random number generator, and 2 investigators (D.J.S., A.A.G.) performed a detailed chart review using a standardized data abstraction form. The research team met frequently to maintain consistency in data collection and to resolve disputes.
We recorded demographic data, presence of a primary care provider, relevant past medical history, current medications, ED treatment (insulin, oral hypoglycemic agents, and intravenous fluids), disposition (admission or discharge), and final diagnoses. Additionally, we evaluated capillary blood glucose values during the ED stay and serum glucose values during the ED and hospital stay to evaluate for hypoglycemia (defined as glucose <65 mg/dL). We also evaluate diagnosis codes to identify concurrent infection, sepsis, or trauma that may have been associated with the hyperglycemia, based on previously reported methodology.10, 11 Finally, we examined the inpatient or ED written discharge instructions to evaluate newly started antidiabetic medications, communication of hyperglycemia, and recommendation of repeat glucose/diabetes testing.
Data Analysis
We performed statistical analyses using Stata 9.0 (Stata Corp., College Station, TX) and summarized data using basic descriptive statistics with 95% confidence intervals (95%CIs). We measured interrater agreement for chart abstraction by calculating the kappa statistic for a 5% sample of charts abstracted by both investigators. We considered kappa >0.80 as high interrater agreement. We evaluated differences between subgroups of interest using chi square test. All P values are 2‐tailed, with P < 0.05 considered statistically significant.
RESULTS
During the data collection period, 27,688 (58%) ED visits had at least 1 serum glucose result. After excluding multiple glucose results for the same visit, the median glucose value was 106 mg/dL (range, 7‐2280 mg/dL); 3517 (13%) values were 140‐199 mg/dL, and 2304 (8%) values were 200 mg/dL. We located 385 of the 400 (96%) randomly selected charts. Interrater agreement for chart review was high (kappa = 0.91‐0.98).
Table 1 shows demographic characteristics and Table 2 shows clinical data of the sample, stratified by glucose group and charted diagnosis of diabetes. Overall, 55% of patients with glucose values 140‐199 mg/dL and 16% of patients with glucose 200 mg/dL had no prior diabetes diagnosis. Hyperglycemia was associated with sepsis for 22% of patients, infection without sepsis for 13% of patients, and traumatic injury for 19% of patients.
| Glucose 140199 mg/dL % (95%CI) or Median (IQR) | Glucose 200 mg/dL % (95%CI) or Median (IQR) | ||||
|---|---|---|---|---|---|
| Variable | Diabetes (n = 87) | No Diabetes (n = 107) | Diabetes (n = 160) | No Diabetes (n = 31) | Total n (%) or Median (IQR) (n = 385) |
| |||||
| Demographics | |||||
| Age | 66 (5475) | 68 (5083) | 63 (5275) | 58 (3376) | 64 (5176) |
| Female sex | 39% (2950) | 58% (4867) | 55% (4763) | 26% (1245) | 50% (4555) |
| Race/ethnicity | |||||
| White | 67% (5676) | 75% (6583) | 61% (5369) | 71% (5286) | 258 (67%) |
| Black | 22% (1432) | 9% (517) | 21% (1528) | 10% (226) | 65 (17%) |
| Hispanic | 2% (08) | 4% (19) | 6% (310) | 3% (017) | 26 (4%) |
| Other | 9% (417) | 12% (720) | 12% (819) | 16% (534) | 46 (12%) |
| Insurance | |||||
| Private | 32% (2343) | 41% (3251) | 32% (2540) | 45% (2764) | 137 (36%) |
| Medicare | 61% (5071) | 47%(3757) | 49% (4157) | 32% (1751) | 192 (50%) |
| Medicaid | 6% (213) | 7% (314) | 16% (1022) | 6% (121) | 40 (10%) |
| None | 1% (06) | 5% (211) | 3% (17) | 16% (534) | 16 (4%) |
| Assigned PCP | 95% (8999) | 84% (7690) | 86% (8091) | 71% (5286) | 86% (8390) |
| Past medical history | |||||
| Hypertension | 61% (5071) | 45% (3555) | 58% (5066) | 39% (2156) | 206 (54%) |
| Hyperlipidemia | 28% (1938) | 21% (1329) | 25% (1932) | 10% (226) | 90 (23%) |
| Coronary artery disease | 41% (3152) | 29% (2138) | 26% (2034) | 13% (430) | 113 (29%) |
| Current medications | |||||
| Insulin | 36% (2647) | 0 | 54% (4662) | 0 | 117 (30%) |
| Sulfonylurea | 25% (1736) | 0 | 26% (1933) | 0 | 63 (16%) |
| Other oral hypoglycemic | 39% (2950) | 0 | 24% (1832) | 0 | 73 (19%) |
| Systemic corticosteroids | 5% (111) | 10% (517) | 4% (18) | 6% (121) | 23 (6%) |
| Glucose 140199 mg/dL % (95%CI) or Median (IQR) | Glucose 200 mg/dL % (95%CI) or Median (IQR) | ||||
|---|---|---|---|---|---|
| Variable | Diabetes | No Diabetes | Diabetes | No Diabetes | Total n (%) or Median (IQR) |
| |||||
| ED clinical data | (n = 87) | (n = 107) | (n = 160) | (n = 31) | (n = 385) |
| Glucose value, mg/dL | 167 (163170) | 160 (157163) | 308 (285330) | 272 (242300) | 231 (220244) |
| Insulin | 6% (213) | 1% (03) | 31% (2439) | 19% (737) | 61 (16%) |
| IVF without dextrose* | 44% (3355) | 54% (4464) | 51% (4358) | 68% (4983) | 198 (51%) |
| Hyperglycemia charted as diagnosis | 3% (110) | 0 | 18% (1225) | 16% (534) | 36 (9%) |
| Hospital admission | 76% (6584) | 79% (7187) | 73% (6680) | 84% (6695) | 293 (76%) |
| Discharge data | (n = 84) | (n = 98) | (n = 156) | (n = 25) | (n = 363) |
| New insulin Rx | 8% (316) | 5% (212) | 6% (310) | 16% (536) | 26 (7%) |
| New sulfonylurea Rx | 2% (08) | 1% (06) | 4% (18) | 0 | 10 (3%) |
| New other oral hypoglycemic Rx | 1% (06) | 1% (06) | 3% (17) | 8% (126) | 9 (2%) |
| Any new diabetes Rx | 12% (621) | 7% (314) | 12% (718) | 24% (945) | 42 (12%) |
| Hyperglycemia noted in written instructions | 4% (110) | 3% (19) | 15% (1021) | 24% (945) | 36 (10%) |
| Repeat glucose/diabetes testing charted | 5% (112) | 1% (06) | 9% (515) | 16% (536) | 23 (6%) |
No patient received intravenous fluids with dextrose prior to initial serum glucose determination, and there was no difference in home corticosteroid use between groups (P = 0.23). Patients with known diabetes were more likely to receive insulin in the ED (P < 0.01). Only 1 patient received an oral hypoglycemic agent in the ED. Three patients had documented hypoglycemia on capillary blood glucose during the ED stay, and no patients had hypoglycemia based on serum glucose during the ED or hospital stay. Among hospitalized patients, 61% had inpatient orders for diabetic‐consistent/carbohydrate‐consistent diet, 65% for capillary glucose tests daily, and 63% for sliding scale insulin.
We also present written discharge instructions data for 363 visits (253 inpatient and 110 ED) in Table 2; discharge instructions were not available for 22 visits (12 deaths during hospitalization, 10 missing instructions). New antidiabetic medications were prescribed for 42 (12%) patients, all from the inpatient setting. There was no difference between inpatient and ED communication of hyperglycemia (10% [95%CI, 7%‐14%] versus 9% [95%CI, 4%‐15%]) and recommendation for further outpatient testing (8% [95%CI, 4%‐11%] versus 4% [95%CI, 0%‐7%]) in written discharge instructions (P = 0.73 and 0.16, respectively). Compared to those with glucose 140‐199 mg/dL, patients with glucose 200 mg/dL were more likely to receive written communication of hyperglycemia (17% [95%CI, 11%‐22%] versus 3% [95%CI, 0%‐6%]) and recommendation for further outpatient testing (10% [95%CI, 6%‐14%] versus 3% [95%CI, 0%‐5%] (both, P < 0.01).
DISCUSSION
Although noncritical ED glucose values may be overlooked, values sufficient to motivate inpatient and long‐term management are sometimes uncovered, and when unrecognized may be missed opportunities. Indeed, admission hyperglycemia has been linked to poor clinical outcomes in hospitalized patients for a variety of conditions, particularly for myocardial infarction, stroke, and critical illness.1215
In this study, we evaluated recognition, communication, and management of ED glucose values above a relatively conservative threshold of 140 mg/dL, occurring in 21% of ED glucose results. Diabetes screening thresholds for casual glucose values as low as 120 mg/dL,9 and intensive glycemic control in critically ill patients to a target as low as 110 mg/dL have been suggested.5 Nevertheless, only 16% of our sample received insulin in the ED for hyperglycemia, and hyperglycemia was charted as a diagnosis in only 9% of cases.
This is especially important because 77% of ED visits without hyperglycemia charted as a diagnosis resulted in hospitalization, and early glycemic control was infrequently initiated. Limited ED management of hyperglycemia may be driven by the presence of more critical management issues (eg, 54% of patients had concomitant infection or trauma), lack of familiarity with guidelines, which suggest treatment to glucose <140 mg/dL in critically ill patients and <180 mg/dL in all hospitalized patients,16 or fear of adverse events, such as hypoglycemia. Additionally, ED crowding has been shown to effect decreased quality and timeliness of treatment for pneumonia, and may have similar effects for hyperglycemia.17 Inpatient recognition of hyperglycemia, based on orders for diet, glucose checks, and insulin, appeared significantly better, but this did not translate to improved communication in written discharge instructions. Additionally, many hospitalized patients may spend many hours, or even days, in the ED waiting for beds, which currently is a missed opportunity to initiate early therapy.
Written discharge instructions informed less than 10% of patients of their hyperglycemia or outlined a plan for further evaluation and management. Our prior work suggests that nearly all (95%) ED patients want to be informed of elevated blood glucose and are willing to follow‐up, if instructed.18 The current data suggests that hyperglycemia in ED and hospitalized patients is frequently unrecognized and undertreated, and opportunities to institute an outpatient plan to address hyperglycemia are frequently missed.
This study has several potential limitations. This study was performed at a single academic center, which limits generalizability to other geographic areas and hospital types. Accuracy of abstracted data depended on chart review, which is limited by the possibility of missing, incomplete, or unreliable information. Standardized definitions and abstraction forms limited potential for bias, and high interrater agreement demonstrated internal reliability of the chart review. We considered only initial glucose values and were unable to determine nutritional status; it is possible that subsequent measurements were within an acceptable range. Conversely, hospitalized patients may have developed hyperglycemia subsequent to the initial glucose result, which would underestimate the scope of inpatient hyperglycemia. Also, because there are limited data for interpretation of ED hyperglycemia, we were unable to determine optimal glucose thresholds. Finally, we were unable to evaluate the content of verbal instructions or letters to outpatient providers, which limited our ability to fully describe communication of abnormal findings. However, patients do not often retain information in verbal instructions, in the context of new diagnoses and complex medical regimens.
In summary, recognition, management, and communication of ED hyperglycemia were suboptimal in our patient population and represent a missed opportunity. Enhanced recognition, management, and referral for hyperglycemia observed during usual ED care may provide an unobtrusive method to improve identification of undiagnosed diabetes/prediabetes and initiation of intensive glycemic control for hospitalized patients.
- ,,,,,.Hyperglycemia: an independent marker of in‐hospital mortality in patients with undiagnosed diabetes.J Clin Endocrinol Metab.2002;87:978–982.
- ,,,,,.The relation between hyperglycemia and outcomes in 2,471 patients admitted to the hospital with community‐acquired pneumonia.Diabetes Care.2005;28:810–815.
- ,,,,.Inpatient management of diabetes and hyperglycemia among general medicine patients at a large teaching hospital.J Hosp Med.2006;1:145–150.
- ,,,,.Unrecognized diabetes among hospitalized patients.Diabetes Care.1998;21:246–249.
- ACE/ADA Task Force on Inpatient Diabetes.American College of Endocrinology and American Diabetes Association Consensus statement on inpatient diabetes and glycemic control: a call to action.Diabetes Care.2006;29:1955–1962.
- ,,, et al.Intensive insulin therapy in the medical ICU.N Engl J Med.2006;354:449–461.
- ,,, et al.Randomized trial of insulin‐glucose infusion followed by subcutaneous insulin treatment in diabetic patients with acute myocardial infarction (DIGAMI study): effects on mortality at 1 year.JAm Coll Cardiol.1995;26:57–65.
- ,,.National Hospital Ambulatory Medical Care Survey: 2005 emergency department summary.Adv Data.2007;386:1–32.
- ,,, et al.Performance of recommended screening tests for undiagnosed diabetes and dysglycemia.Diabetes Care.2001;24:1899–1903.
- ,,, et al.The epidemiology of sepsis in the United States from 1979 through 2000.N Engl J Med.2003;348:1546–1554.
- ,,,,,.Completeness and accuracy of International Classification of Disease (ICD) external cause of injury codes in emergency department electronic data.Inj Prev.2007;13:422–425.
- ,,,.Stress hyperglycemia and increased risk of death after myocardial infarction in patients with and without diabetes: a systematic overview.Lancet.2000;355:773–778.
- ,,, et al.Admission blood glucose level as a risk indicator of death after myocardial infarction in patients with and without diabetes mellitus.Arch Intern Med.2004;164:982–989.
- ,,, et al.Effects of admission hyperglycemia on mortality and costs in acute ischemic stroke.Neurology.2002;59:67–71.
- .Association between hyperglycemia and increased hospital mortality in a heterogeneous population of critically ill patients.Mayo Clin Proc.2003;78:1471–1478.
- American Diabetes Association.Standards of Medical Care in Diabetes—2008.Diabetes Care.2008;31;S12–S54.
- ,,,.Effect of emergency department crowding on time to antibiotics in patients admitted with community‐acquired pneumonia.Ann Emerg Med.2007;50:501–509.
- ,,,,.Estimated risk for undiagnosed diabetes in the emergency department: a multicenter survey.Acad Emerg Med.2007;14:492–495.