User login
Effectiveness of NIV vs. IMV in AECOPD
Chronic obstructive pulmonary disease (COPD) is now the third leading cause of death in the United States,[1] and its rising mortality trend is unique among the top 5 causes of death.[2] Acute exacerbations of COPD (AECOPD) are important events in the natural history of COPD, accounting for 1.5 million emergency department (ED) visits and 726,000 hospitalizations each year in the United States.[3, 4] Given the significant morbidity and mortality from AECOPD, Healthy People 2020 lists reducing deaths, hospitalizations, and ED visits as the key objectives for COPD.[5]
Over the past 2 decades, noninvasive ventilation (NIV) has emerged as a potentially useful treatment modality in AECOPD patients with acute respiratory failure. Noninvasive ventilation commonly refers to positive‐pressure ventilatory support delivered through a nasal or full‐face mask, such as bilevel positive airway pressure.[6] A number of randomized controlled trials[7, 8, 9] and meta‐analyses[10] have suggested a mortality‐reduction benefit with NIV use compared with standard medical care in AECOPD. To our knowledge, however, very few small randomized controlled trials compared NIV vs invasive mechanical ventilation (IMV) head‐to‐head,[11, 12, 13] and a recent evidence review found only 5 studies (405 subjects) on this topic.[14] Collectively, the limited evidence from randomized trials showed that NIV use resulted in similar intensive care unit (ICU) and in‐hospital mortality, fewer complications (eg, ventilator‐associated pneumonia and sepsis), and shorter hospital length of stays (LOS). Given that these trials have a smaller sample size and tend to exclude older patient (age >75 years) or patients with multiple comorbidities, there is a need to better understand the adoption and effectiveness of NIV treatment for AECOPD in a much larger patient population in the real‐world setting using observational data.
To address these knowledge gaps in the literature, we analyzed data from a large, nationally representative ED and inpatient sample. The objective of the present analysis was 2‐fold: (1) to characterize the use of NIV and IMV in AECOPD patients with acute respiratory failure at a national level; and (2) to compare the effectiveness of NIV vs IMV in the real‐world setting.
METHODS
Study Design and Setting
We conducted a retrospective cohort study using data from the 20062008 Nationwide Emergency Department Sample (NEDS),[15] a component of the Healthcare Cost and Utilization Project sponsored by the Agency for Healthcare Research and Quality. The NEDS is nationally representative of all community hospitalbased EDs in the United States, defined by the American Hospital Association as all nonfederal, short‐term, general, and other specialty hospitals.[16] Community hospitals include academic medical centers if they are nonfederal short‐term hospitals. The NEDS was constructed using administrative records from the State Emergency Department Databases and the State Inpatient Databases. The former captures information on ED visits that do not result in an admission (ie, treat‐and‐release visits or transfers to another hospital); the latter contains information on patients initially seen in the ED and then admitted to the same hospital. Taken together, the resulting NEDS represents all ED visits regardless of disposition and contains information on short‐term outcomes for patients admitted through the ED. In other words, the NEDS is the largest all‐payer ED and inpatient database in the United States. The NEDS represents an approximately 20% stratified sample of US hospital‐based EDs, containing more than 28 million records of ED visits from approximately 1000 hospitals each year. Additional details of the NEDS can be found elsewhere.[15, 17] We received a waiver for this analysis from our institutional review board.
Study Population
Patient visits were included in this analysis if they carried any COPD‐related diagnostic code (ie, International Classification of Diseases, Ninth Revision, Clinical Modification [ICD‐9‐CM] code of 491.xx [chronic bronchitis], 492.xx [emphysema], or 496.xx [chronic airway obstruction, not elsewhere classified]) as their primary ED diagnosis and any acute respiratory failure code (ie, 518.81 [acute respiratory failure], 518.82 [pulmonary insufficiency not elsewhere classified, 518.84 [acute and chronic respiratory failure], or 799.1 [respiratory arrest]) as their secondary diagnosis. Patient visits with a primary diagnosis of acute respiratory failure and a secondary diagnosis of COPD were also included. Patients age <40 years were excluded, because they are much less likely to have COPD.[18]
Modes of Mechanical Ventilation
The primary exposure variable was mode of mechanical ventilation. To compare the effectiveness of different ventilatory modes, patients were divided into 3 groups according to the ventilation mode they received: (1) NIV alone, (2) IMV alone, and (3) combined modes of NIV and IMV. The use of NIV was identified by using Current Procedural Terminology (CPT) code of 94660 or ICD‐9 procedure code 93.90, whereas the use of IMV was identified by using CPT code of 31500 or ICD‐9 procedure code 96.04 or 96.7x.
Patient‐Level and Emergency DepartmentLevel Variables
The NEDS contains information on patient demographics, national quartiles for median household income based on the patient's ZIP code, payment sources, ICD‐9‐CM diagnoses and procedures, ED disposition, hospital LOS, and hospital disposition. Hospital characteristics include annual visit volume, urban‐rural status, ownership, teaching status, and US region. Geographic regions (Northeast, South, Midwest, and West) were defined according to Census Bureau boundaries.[19] To adjust for confounding by patient mix, Elixhauser comorbidity measures were derived based on the ICD‐9 codes, using the Agency for Healthcare Research and Quality's Comorbidity Software.[20] This risk‐adjustment tool has been derived and validated extensively.[21]
Outcome Measures
The outcome measures were all‐cause inpatient mortality, hospital LOS, hospital charges, and ventilator‐related complications. Three ventilator‐related complications were identified using ICD‐9 procedure codes: ventilator‐associated pneumonia (997.31), facial injury (910.x), and iatrogenic pneumothorax (512.1).
Statistical Analysis
Summary statistics are presented as proportions (with 95% confidence intervals [CI]), means (with standard deviations [SD]), or medians (with interquartile ranges). Bivariate associations were examined using Student t tests, Kruskal‐Wallis tests, and [2] tests, as appropriate. Emergency department and discharge weights were used to obtain national estimates at the ED and visit level. At all other times (eg, the propensity score and instrumental variable analyses), the unweighted cohort was analyzed, because survey weights are generally not advised for propensity score analysis using complex survey data.[22]
Propensity Score Analysis
To adjust for baseline patient and ED characteristics that may have confounded the relationship between ventilation mode and clinical outcomes, we performed propensity score and instrumental variable analyses. To compare the effectiveness of NIV vs IMV, a propensity score or predicted probability of NIV was estimated using a logistic‐regression model with all patient characteristics (age, sex, quartiles for median household income, weekend admission, insurance status, season, calendar year, and comorbid conditions) and ED characteristics (urban/rural and teaching status, US region, annual ED volume, and annual volume of AECOPD with respiratory failure) as the independent variables. We then performed 1:1 propensity score matching based on a nearest‐neighbor algorithm with caliper distance of 0.01. Although propensity score matching may result in a smaller sample, it provides a clinically relevant estimate of treatment effect because subjects in the matched sample are potential candidates for either treatment option.[23, 24] An absolute standardized difference between characteristics of <10% was considered as adequate balance.[25]
Instrumental Variable Analysis
When hospitals always or nearly always use NIV or IMV, this suggests the choice is largely independent of patient characteristics, and it is possible to use the hospital preference as a proxy for the actual treatment choice (ie, an instrument variable). The instrumental variable analysis simulates a natural randomization of patients to 2 hospital groups with high and low NIV use.
The main difference between instrumental variable and propensity score analysis is that the former could potentially adjust for unmeasured confounders.[26] We used Stata procedure IVREG to estimate the outcome differences between NIV‐preferring hospitals (NIV use in 90% of patients) and IMV‐preferring hospitals (NIV use in 10% of patients).
All odds ratios (ORs) and ‐coefficients are presented with 95% CIs. All analyses were performed using Stata 12.0 software (StataCorp, College Station, TX). All P values are 2‐sided, with P<0.05 considered statistically significant.
Sensitivity Analyses
We conducted a sensitivity analysis to determine whether it was plausible that an unmeasured confounder could completely explain the observed results. The risk ratio of a hypothetical unmeasured confounder on study outcome and the exposure‐confounder imbalance were both varied to see at what point the observed association was reduced to 1.0.[27]
RESULTS
Patient and ED Characteristics
The 20062008 NEDS sample contained 67,651 ED visits for AECOPD with acute respiratory failure from 1594 US EDs. After the weighting procedure, there were an estimated 101,000 visits annually for AECOPD with acute respiratory failure from approximately 4700 US EDs. In the weighted analysis, the mean patient age of these visits was 68 years, and 56% were made by women. Ninety‐six percent were admitted to the hospital. Of these, the mortality rate was 9% and the mean hospital LOS was 7 days. Figure 1 shows the secular trends in NIV, IMV, and the combined use over the 3‐year study period. Use of IMV decreased from 28% in 2006 to 19% in 2008 (P<0.001), whereas NIV use increased slightly from 14% in 2006 to 16% in 2008 (P=0.049); the combined use of both ventilation modalities remained stable (4%). Inpatient mortality decreased from 10% in 2006 to 7% in 2008 (P<0.001).
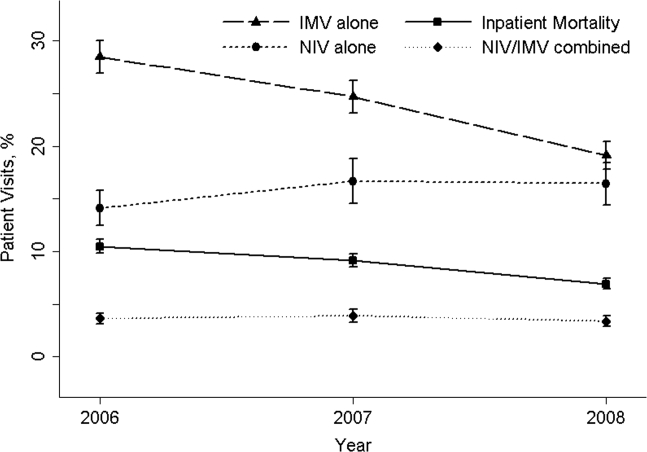
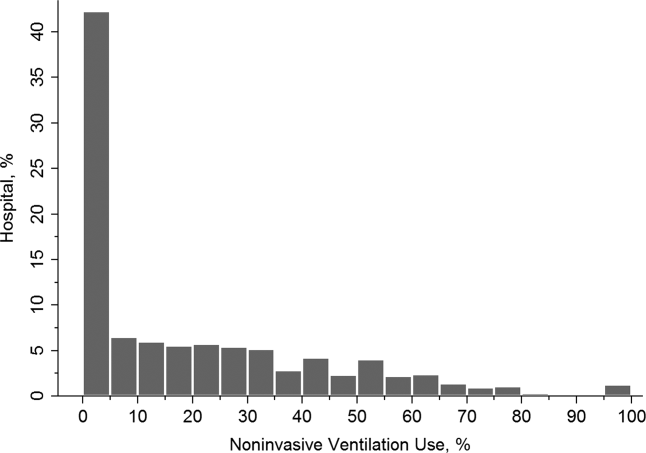
Figure 2 shows that the frequency of NIV use (including combined use of NIV and IMV) varied widely between hospitals, ranging from 0% to 100% with a median of 11%. In the unweighted cohort of AECOPD with acute respiratory failure, 43% received some forms of ventilatory support. Table 1 shows the patient and hospital characteristics of the patients receiving ventilatory support: 36% received NIV, 56% received IMV, and 8% received combined use. In general, patients receiving combined use of NIV and IMV tended to have more comorbidities (eg, congestive heart failure and pneumonia) compared with the NIV‐alone or IMV‐alone groups. With respect to hospital characteristics, NIV was used more often in hospitals with higher volumes of COPD exacerbation and respiratory failure, in nonmetropolitan hospitals, and in hospitals in the Northeast.
| NIV Alone (A) (n=10,032) | IMV Alone (B) (n=15,427) | Combined Use (C) (n=2311) | P Value, A vs B | P Value, B vs C | |
|---|---|---|---|---|---|
| |||||
| Patient characteristics | |||||
| Age, y, | <0.001 | 0.64 | |||
| 4049 | 5 | 5 | 5 | ||
| 5059 | 17 | 18 | 19 | ||
| 6069 | 31 | 33 | 33 | ||
| 7079 | 30 | 29 | 29 | ||
| 80 | 17 | 15 | 13 | ||
| Female sex, % | 57 | 53 | 54 | <0.001 | 0.87 |
| Quartile for median household income of patient ZIP code, $, % | <0.001 | <0.001 | |||
| 138,999 | 30 | 34 | 29 | ||
| 39,00047,999 | 28 | 28 | 28 | ||
| 48,00062,999 | 24 | 22 | 24 | ||
| 63,000 | 18 | 15 | 19 | ||
| Weekend admission, % | 27 | 28 | 28 | 0.07 | 0.80 |
| Insurance status, % | <0.001 | 0.91 | |||
| Medicare | 74 | 70 | 70 | ||
| Medicaid | 9 | 12 | 12 | ||
| Private | 12 | 13 | 13 | ||
| Self‐pay | 2 | 3 | 2 | ||
| Other | 2 | 2 | 2 | ||
| Season, % | <0.001 | 0.16 | |||
| Winter (January 1March 31) | 29 | 32 | 31 | ||
| Spring (April 1June 30) | 24 | 25 | 26 | ||
| Summer (July 1September 30) | 22 | 20 | 19 | ||
| Fall (October 1December 31) | 25 | 22 | 24 | ||
| No. of comorbidities, median (IQR) | 4 (35) | 4 (35) | 4 (36) | <0.001 | <0.001 |
| Selected comorbidities, % | |||||
| Hypertension | 56 | 55 | 55 | 0.01 | 0.65 |
| CHF | 38 | 40 | 44 | 0.001 | <0.001 |
| Fluid and electrolyte disorders | 37 | 44 | 49 | <0.001 | <0.001 |
| Diabetes, uncomplicated | 27 | 26 | 29 | 0.04 | 0.002 |
| Pneumonia | 19 | 34 | 39 | <0.001 | <0.001 |
| Deficiency anemia | 16 | 19 | 19 | <0.001 | 0.39 |
| Obesity | 18 | 12 | 17 | <0.001 | <0.001 |
| Depression | 15 | 11 | 11 | <0.001 | 0.54 |
| Pulmonary circulatory diseases | 15 | 11 | 14 | <0.001 | <0.001 |
| Hospital characteristics | |||||
| Annual ED visit volume, median (IQR) | 42,704 (29,50562,470) | 44,119 (29,89564,097) | 46,695 (31,29866,235) | 0.02 | 0.0003 |
| Annual ED volume of COPD exacerbation with respiratory failure, median (IQR) | 45 (2672) | 42 (2368) | 38 (2364) | <0.001 | <0.001 |
| Urban/rural and teaching status, % | <0.001 | <0.001 | |||
| Metropolitan nonteaching | 53 | 52 | 47 | ||
| Metropolitan teaching | 31 | 35 | 39 | ||
| Nonmetropolitan | 16 | 13 | 13 | ||
| US region, % | <0.001 | <0.001 | |||
| Northeast | 28 | 16 | 36 | ||
| Midwest | 17 | 22 | 15 | ||
| South | 41 | 45 | 32 | ||
| West | 14 | 17 | 17 | ||
The unadjusted differences in outcomes are shown in Table 2. The combined‐use group had the highest inpatient mortality, longest LOS, and highest charges, followed by the IMV and NIV groups. In general, complications were few across all 3 groups, but the rate of iatrogenic pneumothorax was notably lower in the NIV group. Table 3 details the statistically significant predictors of NIV use in the propensity score model. Similar to the unadjusted analysis, older age, high‐income neighborhoods, Medicare insurance, and some comorbidities were positively associated with NIV use (eg, pulmonary circulatory disorders and liver disease), whereas a few comorbidities were negatively associated with NIV use (eg, pneumonia, and alcohol and drug abuse). With respect to hospital characteristics, higher case volumes of COPD exacerbation/respiratory failure, Northeastern and nonmetropolitan hospitals, and more recent years were associated with NIV use.
| Outcome | NIV Alone (A) (n=10,032) | IMV Alone (B) (n=15,427) | Combined Use (C) (n=2311) | P Value. A vs B | P Value, B vs C |
|---|---|---|---|---|---|
| |||||
| Inpatient mortality, n (%) | 825 (8) | 2,454 (16) | 407 (18) | <0.001 | 0.04 |
| Hospital length of stay, median (IQR), d | 5 (48) | 8 (513) | 10 (716) | <0.001 | <0.001 |
| Hospital charge per visit, median (IQR), $ | 26,002 (15,74744,638) | 53,432 (31,99892,664) | 64,585 (39,024110,336) | <0.001 | <0.001 |
| Complications* | |||||
| Ventilator‐associated pneumonia, n (%) | 10 (0.1) | 10 (0.1) | 10 (0.5) | 0.09 | 1.00 |
| Facial injury, n (%) | 10 (0.1) | 10 (0.1) | 10 (0.5) | 0.26 | 1.00 |
| Iatrogenic pneumothorax, n (%) | 10 (0.1) | 90 (0.6) | 14 (0.6) | <0.001 | 0.90 |
| Patient Characteristics | Adjusted OR (95% CI)* | P Value |
|---|---|---|
| ||
| Age, y | ||
| 4049 | 1.00 (Reference) | |
| 5059 | 0.96 (0.84‐1.11) | 0.61 |
| 6069 | 0.96 (0.84‐1.10) | 0.56 |
| 7079 | 1.09 (0.94‐1.25) | 0.25 |
| 80 | 1.30 (1.12‐1.52) | 0.001 |
| Quartile for median household income of patient ZIP code, $ | ||
| 138,999 | 1.00 (Reference) | |
| 39,00047,999 | 1.13 (1.05‐1.21) | 0.001 |
| 48,00062,999 | 1.21 (1.12‐1.30) | <0.001 |
| 63,000 | 1.21 (1.11‐1.32) | <0.001 |
| Insurance status | ||
| Medicare | 1.00 (Reference) | |
| Medicaid | 0.79 (0.72‐0.88) | <0.001 |
| Private | 0.88 (0.81‐0.96) | 0.004 |
| Self‐pay | 0.68 (0.56‐0.82) | <0.001 |
| Other | 0.88 (0.73‐1.07) | 0.22 |
| Season | ||
| Winter (January 1March 31) | 1.00 (Reference) | |
| Spring (April 1June 30) | 1.06 (0.99‐1.14) | 0.11 |
| Summer (July 1September 30) | 1.17 (1.08‐1.26) | <0.001 |
| Fall (October 1December 31) | 1.24 (1.15‐1.33) | <0.001 |
| Comorbidity | ||
| CHF | 0.90 (0.85‐0.95) | <0.001 |
| Pulmonary circulatory disorders | 1.40 (1.29‐1.52) | <0.001 |
| Diabetes, complicated | 1.25 (1.08‐1.44) | 0.002 |
| Liver disease | 1.79 (1.40‐2.28) | <0.001 |
| Coagulopathy | 0.54 (0.46‐0.63) | <0.001 |
| Obesity | 1.52 (1.41‐1.65) | <0.001 |
| Weight loss | 0.50 (0.44‐0.57) | <0.001 |
| Fluid and electrolyte disorders | 0.84 (0.80‐0.89) | <0.001 |
| Deficiency anemia | 0.83 (0.78‐0.90) | <0.001 |
| Alcohol abuse | 0.66 (0.58‐0.76) | <0.001 |
| Drug abuse | 0.74 (0.62‐0.88) | 0.001 |
| Psychoses | 1.22 (1.10‐1.37) | <0.001 |
| Depression | 1.45 (1.34‐1.57) | <0.001 |
| Pneumonia | 0.48 (0.45‐0.51) | <0.001 |
| Valvular heart disease | 0.87 (0.77‐0.97) | 0.01 |
| Neurological disorders | 0.89 (0.80‐0.98) | 0.02 |
| RA/collagen vascular diseases | 1.25 (1.02‐1.53) | 0.04 |
| Blood‐loss anemia | 0.72 (0.53‐0.97) | 0.03 |
| Hospital characteristics | ||
| Annual ED visit volume, per 1000‐visit increase | 0.997 (0.996‐0.998) | <0.001 |
| Annual ED volume of COPD exacerbation with respiratory failure, per 10‐visit increase | 1.03 (1.02‐1.03) | <0.001 |
| Urban/rural and teaching status | ||
| Metropolitan nonteaching | 1.00 (Reference) | |
| Metropolitan teaching | 0.91 (0.85‐0.97) | 0.006 |
| Nonmetropolitan | 1.30 (1.20‐1.42) | <0.001 |
| US region | ||
| Northeast | 1.00 (Reference) | |
| Midwest | 0.44 (0.40‐0.48) | <0.001 |
| South | 0.54 (0.50‐0.58) | <0.001 |
| West | 0.51 (0.46‐0.56) | <0.001 |
| Calendar year | ||
| 2006 | 1.00 (Reference) | |
| 2007 | 1.30 (1.22‐1.39) | <0.001 |
| 2008 | 1.65 (1.54‐1.76) | <0.001 |
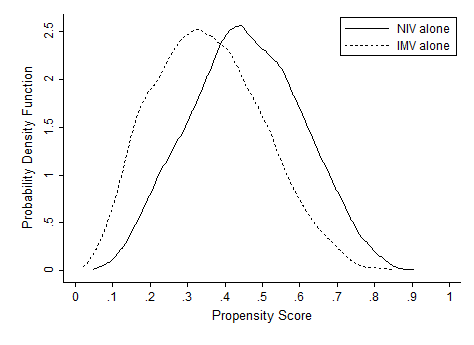
In terms of propensity score distributions (see Supporting Information, Figure E1, in the online version of this article), there was sufficient overlap of the NIV and IMV groups. After matching on propensity score for the NIV and IMV groups, the differences in baseline characteristics were all balanced (see Supporting Information, Table E1, in the online version of this article), as indicated by <10% standardized differences in all covariates between the 2 groups. Finally, in the propensity scorematched cohort (see Supporting Information, Table E2, in the online version of this article), NIV use remained associated with significantly lower inpatient mortality (risk ratio: 0.54; 95% CI: 0.50‐0.59, P<0.001), a shorter hospital LOS (mean difference, 3.2 days; 95% CI: 3.4 to 2.9 days, P<0.001), and lower hospital charges (mean difference, P<$35,012; 95% CI: $36,848 to $33,176, P<0.001), compared with IMV use. Use of NIV also was associated with a lower rate of iatrogenic pneumothorax than IMV use (0.05% vs 0.5%, P<0.001).
Using hospital preference for NIV vs IMV as an instrument, the instrumental analysis confirmed the benefits of NIV use, with a 5% reduction in inpatient mortality in the NIV‐preferring hospitals (risk difference, P<5%; 95% CI: P<1.8% to P<8.3%).
In the sensitivity analysis to assess the impact of an unmeasured confounder, the confounder would have had to have a very strong impact on outcome (risk ratio: 5) and a severe exposure‐confounder imbalance (odds ratio of exposure on confounder: 5) to reduce the observed association to 1.0. In other words, an individual unmeasured confounder is unlikely to explain the observed association.
DISCUSSION
In this nationally representative sample of 67,651 ED visits for AECOPD with acute respiratory failure, we found that NIV use was increasing from 2006 to 2008. However, the utilization of NIV remained low (16% in 2008) and varied widely by patient and hospital characteristic. As with all observational studies, causality cannot be inferred definitely; however, our study suggests that, NIV usecompared with IMV usewas associated with potentially important benefits: a reduction of inpatient mortality by 46%, shortened hospital LOS by 3 days, reduced hospital charges by approximately $35,000 per visit, and modestly reduced risk of iatrogenic pneumothorax.
A recent analysis using the US Nationwide Inpatient Sample has shown increasing use of NIV and concomitant decreasing mortality in AECOPD over time.[28] Our analysis confirmed these favorable trends in the United States using a much larger NEDS sample (28 million visits in the NEDS vs 8 million visits in the Nationwide Inpatient Sample per year). Despite these favorable trends, NIV was still underutilized for AECOPD with respiratory failure in the United States (16% in 2008) compared with major European countries (40%).[29] Although our study lacked clinical details to arrive at the optimal rate of NIV use, the low rate of NIV use is concerning and suggests room for improvement in NIV use in appropriate patients as outlined by the current COPD guidelines.[18, 30] Why is NIV not widely adopted, given its demonstrated efficacy? Previous surveys have identified several perceived reasons for low NIV use, including lack of physician knowledge, insufficient respiratory therapist training, inadequate equipment, and time required for setting up NIV.[29, 31, 32] Our study adds to the literature by showing the actual predictors of NIV use in the real world. Our data showed that the early adopters were hospitals with higher case volumes, and hospitals in the Northeast and in nonmetropolitan areas. A higher case volume has been linked with lower mortality in AECOPD (ie, practice makes perfect),[33] and frequent NIV use could explain the lower AECOPD mortality in highcase volume centers. Alternatively, smaller hospitals tend to have moonlighters working in EDs who may not be board certified in emergency medicine. Perhaps the logical next step is to conduct a qualitative study to understand the specifics of best practices and provider characteristics in these Northeastern, highercase volume centers. Another incentive to promote NIV use in clinical practice is the cost‐effectiveness associated with this intervention, as previous studies have shown that, compared with usual care, receiving NIV was associated with a reduction in costs, mainly through reduced use of the ICU.[34, 35]
Some patient factors associated with NIV use may be well justified. For example, older AECOPD patients may have an advance directive describing their treatment wishes (eg, do‐not‐intubate order),[36] and therefore NIV was preferred to IMV. Also, our data suggested AECOPD patients with a suspected pneumonia component were less likely to be placed on NIV, which is consistent with COPD guideline recommendations.[18, 30] As outlined in the current guidelines, the major contraindications to NIV include impending respiratory arrest, excessive respiratory secretions, massive gastrointestinal bleeding, recent facial trauma, or altered mental status.[18, 30] By contrast, some factors associated with NIV use may be targeted for intervention, such as lower rates of NIV use in the uninsured, patients who live in low‐income neighborhoods, and hospitals in US regions other than the Northeast.
Current guidelines recommend using NIV in AECOPD patients with early signs of respiratory failure, such as arterial pH of 7.257.35 or pCO2 45 mm Hg.[18, 30] When NIV is considered as the modality of ventilatory support, it should probably be used as early as possible,[37] because evidence suggests that delayed use of NIV may lead to severe respiratory acidosis and increased mortality.[38] Other than in ICUs, NIV can be used on general wards and in EDs that have adequate staff training and experience, because the success rates of NIV in these settings are similar to those reported in ICU studies.[8, 36, 39] In addition, NIV is more cost‐effective when performed outside the ICU.[35] In fact, studies have found a substantial portion of patients had NIV started in the ED (one‐fourth) and on the general ward (one‐fourth).[31, 40] Given the shortage of intensivists in the United States, hospitalists begin to play an important role in provision of critical care outside the ICU.[41] Once NIV is used, it is important to ensure that it is delivered effectively and monitored closely because NIV failure has been shown to be associated with high mortality.[28, 42]
This study has some potential limitations. First, we used administrative claims that lack clinical details such as data on arterial blood gases and severity scores, and thus potential residual confounding may exist. In our study, the IMV group may be sicker than the NIV group, which could partially explain the increased mortality with IMV. However, the propensity scores overlap to a great extent between the 2 study groups, suggesting that a strong confounding bias is less likely, given the observed covariates. Furthermore, the instrumental variable and sensitivity analyses taking into account unmeasured confounders still suggested the benefits of NIV. Second, the NEDS does not contain data on the location where NIV was initiated (eg, ED, ward, or ICU) or the timing of initiating NIV or IMV. As a result, for the combined‐use group, we could not further distinguish the group switching from NIV to IMV (ie, NIV failure)[42] or from IMV to NIV (ie, NIV as a weaning strategy).[43] Accordingly, we chose to focus on the comparativeness effectiveness of NIV vs IMV. Third, although the NEDS data have undergone quality‐control procedures,[44] some misclassification may exist in identifying patient population and interventions. Finally, the analysis may not reflect the most recent trend in NIV use, as the 2010 NEDS data have just been released. In addition, although the study is the largest to date on this topic, our findings may not be generalizable to EDs that were not part of the NEDS.
In summary, in this nationally representative ED and inpatient database, NIV use is increasing for AECOPD with acute respiratory failure; however, its adoption remains low and varies widely between US hospitals. Our observational study suggests that NIV appears to be more effective and safer than IMV in the real‐world setting. There is an opportunity to increase the use of NIV as recommended in guidelines and to promote the use NIV in replacement of IMV in patients with severe AECOPD. Given the increasing mortality burden of COPD, such a strategy may help reduce COPD mortality at the population level, thereby fulfilling the objectives of Healthy People 2020.
Disclosure
Partial results from this study were presented at the 2012 Society for Academic Emergency Medicine Annual Meeting, Chicago, Illinois, May 912, 2012. This project was supported by grant number R03HS020722 from the Agency for Healthcare Research and Quality. The content is solely the responsibility of the authors and does not necessarily represent the official views of the Agency for Healthcare Research and Quality. The authors have no conflicts of interest to disclose.
- Centers for Disease Control and Prevention, National Center for Health Statistics. National Vital Statistics Reports, 2011. Deaths: final data for 2008. Available at: http://www.cdc.gov/nchs/data/nvsr/nvsr59/nvsr59_10.pdf. Accessed August 15, 2012.
- , , , . Trends in the leading causes of death in the United States, 1970–2002. JAMA. 2005;294:1255–1259.
- , , . National study of emergency department visits for acute exacerbation of chronic obstructive pulmonary disease. Acad Emerg Med. 2008;15:1275–1283.
- , , , , . Chronic obstructive pulmonary disease surveillance—United States, 1971–2000. MMWR Surveill Summ. 2002;51:1–16.
- US Department of Health and Human Services. Healthy People 2020. Objectives for Respiratory Diseases. Available at: http://www.healthypeople. gov/2020/topicsobjectives2020/objectiveslist.aspx?topicId=36. Accessed May 3, 2012.
- . Mechanical ventilation: invasive versus noninvasive. Eur Respir J Suppl. 2003;47:31s–37s.
- , , , et al. Noninvasive ventilation for acute exacerbations of chronic obstructive pulmonary disease. N Engl J Med. 1995;333:817–822.
- , , . Early use of non‐invasive ventilation for acute exacerbations of chronic obstructive pulmonary disease on general respiratory wards: a multicentre randomised controlled trial. Lancet. 2000;355:1931–1935.
- , , , et al. Randomised controlled trial of nasal ventilation in acute ventilatory failure due to chronic obstructive airways disease. Lancet. 1993;341:1555–1557.
- , , , . Non‐invasive positive pressure ventilation for treatment of respiratory failure due to exacerbations of chronic obstructive pulmonary disease. Cochrane Database Syst Rev. 2004;(3):CD004104.
- , , , et al. Noninvasive vs. conventional mechanical ventilation in patients with chronic obstructive pulmonary disease after failure of medical treatment in the ward: a randomized trial. Intensive Care Med. 2002;28:1701–1707.
- . Noninvasive vs conventional mechanical ventilation in acute respiratory failure: a multicenter, randomized controlled trial. Chest. 2005;128:3916–3924.
- , , , , , . Mechanical ventilation in chronic obstructive pulmonary disease patients, noninvasive vs. invasive method (randomized prospective study). Coll Antropol. 2009;33:791–797.
- , , , et al. Noninvasive Positive‐Pressure Ventilation (NPPV) for Acute Respiratory Failure. Rockville, MD: Agency for Healthcare Research and Quality; July 2012: Report 12‐EHC089‐EF. Available at: http://effectivehealthcareahrqgov/ehc/products/273/1180/CER68_NPPV_FinalReport_20120706pdf. Accessed December 11, 2012.
- Healthcare Cost and Utilization Project (HCUP). HCUP Nationwide Emergency Department Sample (NEDS). Rockville, MD: Agency for Healthcare Research and Quality; 2012. Available at: http://www.hcup‐us.ahrq.gov/nedsoverview.jsp. Accessed April 15, 2012.
- American Hospital Association. Annual survey database. Available at: http://www.ahadata.com/ahadata/html/AHASurvey.html. Accessed April 15, 2012.
- , , , . Age‐related differences in clinical outcomes for acute asthma in the United States, 2006–2008. J Allergy Clin Immunol. 2012;129:1252e1–1258e1.
- Global Initiative for Chronic Obstructive Lung Disease (GOLD). NHLBI/WHO Global Strategy for the Diagnosis, Management and Prevention of COPD. Available at: http://www.goldcopd.org. Accessed April 15, 2012.
- .US Bureau of the Census. Census regions and divisions of the United States. Available at: http://www.census.gov/geo/www/us_regdiv.pdf. Accessed April 9, 2012.
- .Healthcare Cost and Utilization Project. Comorbidity software. Available at: http://www.hcup‐us.ahrq.gov/toolssoftware/comorbidity/comorbidity.jsp. Accessed April 15, 2012.
- , , , . Comorbidity measures for use with administrative data. Med Care. 1998;36:8–27.
- Healthcare Cost and Utilization Project (HCUP). HCUP Methods Series. Hierarchical Modeling Using HCUP Data. Rockville, MD: Agency for Healthcare Research and Quality; 2012: Report 2007‐01. Available at: http://www.hcup‐us.ahrq.gov/reports/methods/2007_01.pdf. Accessed April 15, 2012.
- , , . Indications for propensity scores and review of their use in pharmacoepidemiology. Basic Clin Pharmacol Toxicol. 2006;98:253–259.
- , , , , , . Antibiotic therapy and treatment failure in patients hospitalized for acute exacerbations of chronic obstructive pulmonary disease. JAMA. 2010;303:2035–2042.
- . An introduction to propensity score methods for reducing the effects of confounding in observational studies. Multivariate Behav Res. 2011;46:399–424.
- , , . Instrumental variable methods in comparative safety and effectiveness research. Pharmacoepidemiol Drug Saf. 2010;19:537–554.
- . Sensitivity analysis and external adjustment for unmeasured confounders in epidemiologic database studies of therapeutics. Pharmacoepidemiol Drug Saf. 2006;15:291–303.
- , , , et al. Outcomes of noninvasive ventilation for acute exacerbations of chronic obstructive pulmonary disease in the United States, 1998–2008. Am J Respir Crit Care Med. 2012;185:152–159.
- , , , , . A European survey of noninvasive ventilation practices. Eur Respir J. 2010;36:362–369.
- , . Standards for the diagnosis and treatment of patients with COPD: a summary of the ATS/ERS position paper. Eur Respir J. 2004;23:932–946.
- , , , . Utilization of noninvasive ventilation in acute care hospitals: a regional survey. Chest. 2006;129:1226–1233.
- , , . A survey of the use of noninvasive ventilation in academic emergency departments in the United States. Respir Care. 2009;54:1306–1312.
- , , . Emergency department case volume and patient outcomes in acute exacerbations of chronic obstructive pulmonary disease. Acad Emerg Med. 2012;19:656–663.
- , , , , . Noninvasive positive pressure ventilation in the setting of severe, acute exacerbations of chronic obstructive pulmonary disease: more effective and less expensive. Crit Care Med. 2000;28:2094–2102.
- , , , . Cost effectiveness of ward based non‐invasive ventilation for acute exacerbations of chronic obstructive pulmonary disease: economic analysis of randomised controlled trial. BMJ. 2003;326:956.
- , , . Noninvasive positive pressure ventilation reverses acute respiratory failure in select “do‐not‐intubate” patients. Crit Care Med. 2005;33:1976–1982.
- , . Noninvasive ventilation for acute exacerbations of chronic obstructive pulmonary disease: “Don't think twice, it's alright!”. Am J Respir Crit Care Med. 2012;185:121–123.
- , , , , . Acidosis, non‐invasive ventilation and mortality in hospitalised COPD exacerbations. Thorax. 2011;66:43–48.
- , , , , . Use of noninvasive positive‐pressure ventilation on the regular hospital ward: experience and correlates of success. Respir Care. 2006;51:1237–1243.
- , , , et al. Bilevel noninvasive positive pressure ventilation for acute respiratory failure: survey of Ontario practice. Crit Care Med. 2005;33:1477–1483.
- . Hospitalists and intensivists: partners in caring for the critically ill—the time has come. J Hosp Med. 2010;5:1–3.
- , , , , , . Incidence and causes of non‐invasive mechanical ventilation failure after initial success. Thorax. 2000;55:819–825.
- , , , . Noninvasive positive pressure ventilation as a weaning strategy for intubated adults with respiratory failure. Cochrane Database Syst Rev. 2010:CD004127.
- Healthcare Cost and Utilization Project (HCUP). HCUP Quality Control Procedures. Rockville, MD: Agency for Healthcare Research and Quality; 2012. Available at: http://www.hcup‐us.ahrq.gov/db/quality.jsp. Accessed December 15, 2012.
Chronic obstructive pulmonary disease (COPD) is now the third leading cause of death in the United States,[1] and its rising mortality trend is unique among the top 5 causes of death.[2] Acute exacerbations of COPD (AECOPD) are important events in the natural history of COPD, accounting for 1.5 million emergency department (ED) visits and 726,000 hospitalizations each year in the United States.[3, 4] Given the significant morbidity and mortality from AECOPD, Healthy People 2020 lists reducing deaths, hospitalizations, and ED visits as the key objectives for COPD.[5]
Over the past 2 decades, noninvasive ventilation (NIV) has emerged as a potentially useful treatment modality in AECOPD patients with acute respiratory failure. Noninvasive ventilation commonly refers to positive‐pressure ventilatory support delivered through a nasal or full‐face mask, such as bilevel positive airway pressure.[6] A number of randomized controlled trials[7, 8, 9] and meta‐analyses[10] have suggested a mortality‐reduction benefit with NIV use compared with standard medical care in AECOPD. To our knowledge, however, very few small randomized controlled trials compared NIV vs invasive mechanical ventilation (IMV) head‐to‐head,[11, 12, 13] and a recent evidence review found only 5 studies (405 subjects) on this topic.[14] Collectively, the limited evidence from randomized trials showed that NIV use resulted in similar intensive care unit (ICU) and in‐hospital mortality, fewer complications (eg, ventilator‐associated pneumonia and sepsis), and shorter hospital length of stays (LOS). Given that these trials have a smaller sample size and tend to exclude older patient (age >75 years) or patients with multiple comorbidities, there is a need to better understand the adoption and effectiveness of NIV treatment for AECOPD in a much larger patient population in the real‐world setting using observational data.
To address these knowledge gaps in the literature, we analyzed data from a large, nationally representative ED and inpatient sample. The objective of the present analysis was 2‐fold: (1) to characterize the use of NIV and IMV in AECOPD patients with acute respiratory failure at a national level; and (2) to compare the effectiveness of NIV vs IMV in the real‐world setting.
METHODS
Study Design and Setting
We conducted a retrospective cohort study using data from the 20062008 Nationwide Emergency Department Sample (NEDS),[15] a component of the Healthcare Cost and Utilization Project sponsored by the Agency for Healthcare Research and Quality. The NEDS is nationally representative of all community hospitalbased EDs in the United States, defined by the American Hospital Association as all nonfederal, short‐term, general, and other specialty hospitals.[16] Community hospitals include academic medical centers if they are nonfederal short‐term hospitals. The NEDS was constructed using administrative records from the State Emergency Department Databases and the State Inpatient Databases. The former captures information on ED visits that do not result in an admission (ie, treat‐and‐release visits or transfers to another hospital); the latter contains information on patients initially seen in the ED and then admitted to the same hospital. Taken together, the resulting NEDS represents all ED visits regardless of disposition and contains information on short‐term outcomes for patients admitted through the ED. In other words, the NEDS is the largest all‐payer ED and inpatient database in the United States. The NEDS represents an approximately 20% stratified sample of US hospital‐based EDs, containing more than 28 million records of ED visits from approximately 1000 hospitals each year. Additional details of the NEDS can be found elsewhere.[15, 17] We received a waiver for this analysis from our institutional review board.
Study Population
Patient visits were included in this analysis if they carried any COPD‐related diagnostic code (ie, International Classification of Diseases, Ninth Revision, Clinical Modification [ICD‐9‐CM] code of 491.xx [chronic bronchitis], 492.xx [emphysema], or 496.xx [chronic airway obstruction, not elsewhere classified]) as their primary ED diagnosis and any acute respiratory failure code (ie, 518.81 [acute respiratory failure], 518.82 [pulmonary insufficiency not elsewhere classified, 518.84 [acute and chronic respiratory failure], or 799.1 [respiratory arrest]) as their secondary diagnosis. Patient visits with a primary diagnosis of acute respiratory failure and a secondary diagnosis of COPD were also included. Patients age <40 years were excluded, because they are much less likely to have COPD.[18]
Modes of Mechanical Ventilation
The primary exposure variable was mode of mechanical ventilation. To compare the effectiveness of different ventilatory modes, patients were divided into 3 groups according to the ventilation mode they received: (1) NIV alone, (2) IMV alone, and (3) combined modes of NIV and IMV. The use of NIV was identified by using Current Procedural Terminology (CPT) code of 94660 or ICD‐9 procedure code 93.90, whereas the use of IMV was identified by using CPT code of 31500 or ICD‐9 procedure code 96.04 or 96.7x.
Patient‐Level and Emergency DepartmentLevel Variables
The NEDS contains information on patient demographics, national quartiles for median household income based on the patient's ZIP code, payment sources, ICD‐9‐CM diagnoses and procedures, ED disposition, hospital LOS, and hospital disposition. Hospital characteristics include annual visit volume, urban‐rural status, ownership, teaching status, and US region. Geographic regions (Northeast, South, Midwest, and West) were defined according to Census Bureau boundaries.[19] To adjust for confounding by patient mix, Elixhauser comorbidity measures were derived based on the ICD‐9 codes, using the Agency for Healthcare Research and Quality's Comorbidity Software.[20] This risk‐adjustment tool has been derived and validated extensively.[21]
Outcome Measures
The outcome measures were all‐cause inpatient mortality, hospital LOS, hospital charges, and ventilator‐related complications. Three ventilator‐related complications were identified using ICD‐9 procedure codes: ventilator‐associated pneumonia (997.31), facial injury (910.x), and iatrogenic pneumothorax (512.1).
Statistical Analysis
Summary statistics are presented as proportions (with 95% confidence intervals [CI]), means (with standard deviations [SD]), or medians (with interquartile ranges). Bivariate associations were examined using Student t tests, Kruskal‐Wallis tests, and [2] tests, as appropriate. Emergency department and discharge weights were used to obtain national estimates at the ED and visit level. At all other times (eg, the propensity score and instrumental variable analyses), the unweighted cohort was analyzed, because survey weights are generally not advised for propensity score analysis using complex survey data.[22]
Propensity Score Analysis
To adjust for baseline patient and ED characteristics that may have confounded the relationship between ventilation mode and clinical outcomes, we performed propensity score and instrumental variable analyses. To compare the effectiveness of NIV vs IMV, a propensity score or predicted probability of NIV was estimated using a logistic‐regression model with all patient characteristics (age, sex, quartiles for median household income, weekend admission, insurance status, season, calendar year, and comorbid conditions) and ED characteristics (urban/rural and teaching status, US region, annual ED volume, and annual volume of AECOPD with respiratory failure) as the independent variables. We then performed 1:1 propensity score matching based on a nearest‐neighbor algorithm with caliper distance of 0.01. Although propensity score matching may result in a smaller sample, it provides a clinically relevant estimate of treatment effect because subjects in the matched sample are potential candidates for either treatment option.[23, 24] An absolute standardized difference between characteristics of <10% was considered as adequate balance.[25]
Instrumental Variable Analysis
When hospitals always or nearly always use NIV or IMV, this suggests the choice is largely independent of patient characteristics, and it is possible to use the hospital preference as a proxy for the actual treatment choice (ie, an instrument variable). The instrumental variable analysis simulates a natural randomization of patients to 2 hospital groups with high and low NIV use.
The main difference between instrumental variable and propensity score analysis is that the former could potentially adjust for unmeasured confounders.[26] We used Stata procedure IVREG to estimate the outcome differences between NIV‐preferring hospitals (NIV use in 90% of patients) and IMV‐preferring hospitals (NIV use in 10% of patients).
All odds ratios (ORs) and ‐coefficients are presented with 95% CIs. All analyses were performed using Stata 12.0 software (StataCorp, College Station, TX). All P values are 2‐sided, with P<0.05 considered statistically significant.
Sensitivity Analyses
We conducted a sensitivity analysis to determine whether it was plausible that an unmeasured confounder could completely explain the observed results. The risk ratio of a hypothetical unmeasured confounder on study outcome and the exposure‐confounder imbalance were both varied to see at what point the observed association was reduced to 1.0.[27]
RESULTS
Patient and ED Characteristics
The 20062008 NEDS sample contained 67,651 ED visits for AECOPD with acute respiratory failure from 1594 US EDs. After the weighting procedure, there were an estimated 101,000 visits annually for AECOPD with acute respiratory failure from approximately 4700 US EDs. In the weighted analysis, the mean patient age of these visits was 68 years, and 56% were made by women. Ninety‐six percent were admitted to the hospital. Of these, the mortality rate was 9% and the mean hospital LOS was 7 days. Figure 1 shows the secular trends in NIV, IMV, and the combined use over the 3‐year study period. Use of IMV decreased from 28% in 2006 to 19% in 2008 (P<0.001), whereas NIV use increased slightly from 14% in 2006 to 16% in 2008 (P=0.049); the combined use of both ventilation modalities remained stable (4%). Inpatient mortality decreased from 10% in 2006 to 7% in 2008 (P<0.001).
Figure 2 shows that the frequency of NIV use (including combined use of NIV and IMV) varied widely between hospitals, ranging from 0% to 100% with a median of 11%. In the unweighted cohort of AECOPD with acute respiratory failure, 43% received some forms of ventilatory support. Table 1 shows the patient and hospital characteristics of the patients receiving ventilatory support: 36% received NIV, 56% received IMV, and 8% received combined use. In general, patients receiving combined use of NIV and IMV tended to have more comorbidities (eg, congestive heart failure and pneumonia) compared with the NIV‐alone or IMV‐alone groups. With respect to hospital characteristics, NIV was used more often in hospitals with higher volumes of COPD exacerbation and respiratory failure, in nonmetropolitan hospitals, and in hospitals in the Northeast.
| NIV Alone (A) (n=10,032) | IMV Alone (B) (n=15,427) | Combined Use (C) (n=2311) | P Value, A vs B | P Value, B vs C | |
|---|---|---|---|---|---|
| |||||
| Patient characteristics | |||||
| Age, y, | <0.001 | 0.64 | |||
| 4049 | 5 | 5 | 5 | ||
| 5059 | 17 | 18 | 19 | ||
| 6069 | 31 | 33 | 33 | ||
| 7079 | 30 | 29 | 29 | ||
| 80 | 17 | 15 | 13 | ||
| Female sex, % | 57 | 53 | 54 | <0.001 | 0.87 |
| Quartile for median household income of patient ZIP code, $, % | <0.001 | <0.001 | |||
| 138,999 | 30 | 34 | 29 | ||
| 39,00047,999 | 28 | 28 | 28 | ||
| 48,00062,999 | 24 | 22 | 24 | ||
| 63,000 | 18 | 15 | 19 | ||
| Weekend admission, % | 27 | 28 | 28 | 0.07 | 0.80 |
| Insurance status, % | <0.001 | 0.91 | |||
| Medicare | 74 | 70 | 70 | ||
| Medicaid | 9 | 12 | 12 | ||
| Private | 12 | 13 | 13 | ||
| Self‐pay | 2 | 3 | 2 | ||
| Other | 2 | 2 | 2 | ||
| Season, % | <0.001 | 0.16 | |||
| Winter (January 1March 31) | 29 | 32 | 31 | ||
| Spring (April 1June 30) | 24 | 25 | 26 | ||
| Summer (July 1September 30) | 22 | 20 | 19 | ||
| Fall (October 1December 31) | 25 | 22 | 24 | ||
| No. of comorbidities, median (IQR) | 4 (35) | 4 (35) | 4 (36) | <0.001 | <0.001 |
| Selected comorbidities, % | |||||
| Hypertension | 56 | 55 | 55 | 0.01 | 0.65 |
| CHF | 38 | 40 | 44 | 0.001 | <0.001 |
| Fluid and electrolyte disorders | 37 | 44 | 49 | <0.001 | <0.001 |
| Diabetes, uncomplicated | 27 | 26 | 29 | 0.04 | 0.002 |
| Pneumonia | 19 | 34 | 39 | <0.001 | <0.001 |
| Deficiency anemia | 16 | 19 | 19 | <0.001 | 0.39 |
| Obesity | 18 | 12 | 17 | <0.001 | <0.001 |
| Depression | 15 | 11 | 11 | <0.001 | 0.54 |
| Pulmonary circulatory diseases | 15 | 11 | 14 | <0.001 | <0.001 |
| Hospital characteristics | |||||
| Annual ED visit volume, median (IQR) | 42,704 (29,50562,470) | 44,119 (29,89564,097) | 46,695 (31,29866,235) | 0.02 | 0.0003 |
| Annual ED volume of COPD exacerbation with respiratory failure, median (IQR) | 45 (2672) | 42 (2368) | 38 (2364) | <0.001 | <0.001 |
| Urban/rural and teaching status, % | <0.001 | <0.001 | |||
| Metropolitan nonteaching | 53 | 52 | 47 | ||
| Metropolitan teaching | 31 | 35 | 39 | ||
| Nonmetropolitan | 16 | 13 | 13 | ||
| US region, % | <0.001 | <0.001 | |||
| Northeast | 28 | 16 | 36 | ||
| Midwest | 17 | 22 | 15 | ||
| South | 41 | 45 | 32 | ||
| West | 14 | 17 | 17 | ||
The unadjusted differences in outcomes are shown in Table 2. The combined‐use group had the highest inpatient mortality, longest LOS, and highest charges, followed by the IMV and NIV groups. In general, complications were few across all 3 groups, but the rate of iatrogenic pneumothorax was notably lower in the NIV group. Table 3 details the statistically significant predictors of NIV use in the propensity score model. Similar to the unadjusted analysis, older age, high‐income neighborhoods, Medicare insurance, and some comorbidities were positively associated with NIV use (eg, pulmonary circulatory disorders and liver disease), whereas a few comorbidities were negatively associated with NIV use (eg, pneumonia, and alcohol and drug abuse). With respect to hospital characteristics, higher case volumes of COPD exacerbation/respiratory failure, Northeastern and nonmetropolitan hospitals, and more recent years were associated with NIV use.
| Outcome | NIV Alone (A) (n=10,032) | IMV Alone (B) (n=15,427) | Combined Use (C) (n=2311) | P Value. A vs B | P Value, B vs C |
|---|---|---|---|---|---|
| |||||
| Inpatient mortality, n (%) | 825 (8) | 2,454 (16) | 407 (18) | <0.001 | 0.04 |
| Hospital length of stay, median (IQR), d | 5 (48) | 8 (513) | 10 (716) | <0.001 | <0.001 |
| Hospital charge per visit, median (IQR), $ | 26,002 (15,74744,638) | 53,432 (31,99892,664) | 64,585 (39,024110,336) | <0.001 | <0.001 |
| Complications* | |||||
| Ventilator‐associated pneumonia, n (%) | 10 (0.1) | 10 (0.1) | 10 (0.5) | 0.09 | 1.00 |
| Facial injury, n (%) | 10 (0.1) | 10 (0.1) | 10 (0.5) | 0.26 | 1.00 |
| Iatrogenic pneumothorax, n (%) | 10 (0.1) | 90 (0.6) | 14 (0.6) | <0.001 | 0.90 |
| Patient Characteristics | Adjusted OR (95% CI)* | P Value |
|---|---|---|
| ||
| Age, y | ||
| 4049 | 1.00 (Reference) | |
| 5059 | 0.96 (0.84‐1.11) | 0.61 |
| 6069 | 0.96 (0.84‐1.10) | 0.56 |
| 7079 | 1.09 (0.94‐1.25) | 0.25 |
| 80 | 1.30 (1.12‐1.52) | 0.001 |
| Quartile for median household income of patient ZIP code, $ | ||
| 138,999 | 1.00 (Reference) | |
| 39,00047,999 | 1.13 (1.05‐1.21) | 0.001 |
| 48,00062,999 | 1.21 (1.12‐1.30) | <0.001 |
| 63,000 | 1.21 (1.11‐1.32) | <0.001 |
| Insurance status | ||
| Medicare | 1.00 (Reference) | |
| Medicaid | 0.79 (0.72‐0.88) | <0.001 |
| Private | 0.88 (0.81‐0.96) | 0.004 |
| Self‐pay | 0.68 (0.56‐0.82) | <0.001 |
| Other | 0.88 (0.73‐1.07) | 0.22 |
| Season | ||
| Winter (January 1March 31) | 1.00 (Reference) | |
| Spring (April 1June 30) | 1.06 (0.99‐1.14) | 0.11 |
| Summer (July 1September 30) | 1.17 (1.08‐1.26) | <0.001 |
| Fall (October 1December 31) | 1.24 (1.15‐1.33) | <0.001 |
| Comorbidity | ||
| CHF | 0.90 (0.85‐0.95) | <0.001 |
| Pulmonary circulatory disorders | 1.40 (1.29‐1.52) | <0.001 |
| Diabetes, complicated | 1.25 (1.08‐1.44) | 0.002 |
| Liver disease | 1.79 (1.40‐2.28) | <0.001 |
| Coagulopathy | 0.54 (0.46‐0.63) | <0.001 |
| Obesity | 1.52 (1.41‐1.65) | <0.001 |
| Weight loss | 0.50 (0.44‐0.57) | <0.001 |
| Fluid and electrolyte disorders | 0.84 (0.80‐0.89) | <0.001 |
| Deficiency anemia | 0.83 (0.78‐0.90) | <0.001 |
| Alcohol abuse | 0.66 (0.58‐0.76) | <0.001 |
| Drug abuse | 0.74 (0.62‐0.88) | 0.001 |
| Psychoses | 1.22 (1.10‐1.37) | <0.001 |
| Depression | 1.45 (1.34‐1.57) | <0.001 |
| Pneumonia | 0.48 (0.45‐0.51) | <0.001 |
| Valvular heart disease | 0.87 (0.77‐0.97) | 0.01 |
| Neurological disorders | 0.89 (0.80‐0.98) | 0.02 |
| RA/collagen vascular diseases | 1.25 (1.02‐1.53) | 0.04 |
| Blood‐loss anemia | 0.72 (0.53‐0.97) | 0.03 |
| Hospital characteristics | ||
| Annual ED visit volume, per 1000‐visit increase | 0.997 (0.996‐0.998) | <0.001 |
| Annual ED volume of COPD exacerbation with respiratory failure, per 10‐visit increase | 1.03 (1.02‐1.03) | <0.001 |
| Urban/rural and teaching status | ||
| Metropolitan nonteaching | 1.00 (Reference) | |
| Metropolitan teaching | 0.91 (0.85‐0.97) | 0.006 |
| Nonmetropolitan | 1.30 (1.20‐1.42) | <0.001 |
| US region | ||
| Northeast | 1.00 (Reference) | |
| Midwest | 0.44 (0.40‐0.48) | <0.001 |
| South | 0.54 (0.50‐0.58) | <0.001 |
| West | 0.51 (0.46‐0.56) | <0.001 |
| Calendar year | ||
| 2006 | 1.00 (Reference) | |
| 2007 | 1.30 (1.22‐1.39) | <0.001 |
| 2008 | 1.65 (1.54‐1.76) | <0.001 |
In terms of propensity score distributions (see Supporting Information, Figure E1, in the online version of this article), there was sufficient overlap of the NIV and IMV groups. After matching on propensity score for the NIV and IMV groups, the differences in baseline characteristics were all balanced (see Supporting Information, Table E1, in the online version of this article), as indicated by <10% standardized differences in all covariates between the 2 groups. Finally, in the propensity scorematched cohort (see Supporting Information, Table E2, in the online version of this article), NIV use remained associated with significantly lower inpatient mortality (risk ratio: 0.54; 95% CI: 0.50‐0.59, P<0.001), a shorter hospital LOS (mean difference, 3.2 days; 95% CI: 3.4 to 2.9 days, P<0.001), and lower hospital charges (mean difference, P<$35,012; 95% CI: $36,848 to $33,176, P<0.001), compared with IMV use. Use of NIV also was associated with a lower rate of iatrogenic pneumothorax than IMV use (0.05% vs 0.5%, P<0.001).
Using hospital preference for NIV vs IMV as an instrument, the instrumental analysis confirmed the benefits of NIV use, with a 5% reduction in inpatient mortality in the NIV‐preferring hospitals (risk difference, P<5%; 95% CI: P<1.8% to P<8.3%).
In the sensitivity analysis to assess the impact of an unmeasured confounder, the confounder would have had to have a very strong impact on outcome (risk ratio: 5) and a severe exposure‐confounder imbalance (odds ratio of exposure on confounder: 5) to reduce the observed association to 1.0. In other words, an individual unmeasured confounder is unlikely to explain the observed association.
DISCUSSION
In this nationally representative sample of 67,651 ED visits for AECOPD with acute respiratory failure, we found that NIV use was increasing from 2006 to 2008. However, the utilization of NIV remained low (16% in 2008) and varied widely by patient and hospital characteristic. As with all observational studies, causality cannot be inferred definitely; however, our study suggests that, NIV usecompared with IMV usewas associated with potentially important benefits: a reduction of inpatient mortality by 46%, shortened hospital LOS by 3 days, reduced hospital charges by approximately $35,000 per visit, and modestly reduced risk of iatrogenic pneumothorax.
A recent analysis using the US Nationwide Inpatient Sample has shown increasing use of NIV and concomitant decreasing mortality in AECOPD over time.[28] Our analysis confirmed these favorable trends in the United States using a much larger NEDS sample (28 million visits in the NEDS vs 8 million visits in the Nationwide Inpatient Sample per year). Despite these favorable trends, NIV was still underutilized for AECOPD with respiratory failure in the United States (16% in 2008) compared with major European countries (40%).[29] Although our study lacked clinical details to arrive at the optimal rate of NIV use, the low rate of NIV use is concerning and suggests room for improvement in NIV use in appropriate patients as outlined by the current COPD guidelines.[18, 30] Why is NIV not widely adopted, given its demonstrated efficacy? Previous surveys have identified several perceived reasons for low NIV use, including lack of physician knowledge, insufficient respiratory therapist training, inadequate equipment, and time required for setting up NIV.[29, 31, 32] Our study adds to the literature by showing the actual predictors of NIV use in the real world. Our data showed that the early adopters were hospitals with higher case volumes, and hospitals in the Northeast and in nonmetropolitan areas. A higher case volume has been linked with lower mortality in AECOPD (ie, practice makes perfect),[33] and frequent NIV use could explain the lower AECOPD mortality in highcase volume centers. Alternatively, smaller hospitals tend to have moonlighters working in EDs who may not be board certified in emergency medicine. Perhaps the logical next step is to conduct a qualitative study to understand the specifics of best practices and provider characteristics in these Northeastern, highercase volume centers. Another incentive to promote NIV use in clinical practice is the cost‐effectiveness associated with this intervention, as previous studies have shown that, compared with usual care, receiving NIV was associated with a reduction in costs, mainly through reduced use of the ICU.[34, 35]
Some patient factors associated with NIV use may be well justified. For example, older AECOPD patients may have an advance directive describing their treatment wishes (eg, do‐not‐intubate order),[36] and therefore NIV was preferred to IMV. Also, our data suggested AECOPD patients with a suspected pneumonia component were less likely to be placed on NIV, which is consistent with COPD guideline recommendations.[18, 30] As outlined in the current guidelines, the major contraindications to NIV include impending respiratory arrest, excessive respiratory secretions, massive gastrointestinal bleeding, recent facial trauma, or altered mental status.[18, 30] By contrast, some factors associated with NIV use may be targeted for intervention, such as lower rates of NIV use in the uninsured, patients who live in low‐income neighborhoods, and hospitals in US regions other than the Northeast.
Current guidelines recommend using NIV in AECOPD patients with early signs of respiratory failure, such as arterial pH of 7.257.35 or pCO2 45 mm Hg.[18, 30] When NIV is considered as the modality of ventilatory support, it should probably be used as early as possible,[37] because evidence suggests that delayed use of NIV may lead to severe respiratory acidosis and increased mortality.[38] Other than in ICUs, NIV can be used on general wards and in EDs that have adequate staff training and experience, because the success rates of NIV in these settings are similar to those reported in ICU studies.[8, 36, 39] In addition, NIV is more cost‐effective when performed outside the ICU.[35] In fact, studies have found a substantial portion of patients had NIV started in the ED (one‐fourth) and on the general ward (one‐fourth).[31, 40] Given the shortage of intensivists in the United States, hospitalists begin to play an important role in provision of critical care outside the ICU.[41] Once NIV is used, it is important to ensure that it is delivered effectively and monitored closely because NIV failure has been shown to be associated with high mortality.[28, 42]
This study has some potential limitations. First, we used administrative claims that lack clinical details such as data on arterial blood gases and severity scores, and thus potential residual confounding may exist. In our study, the IMV group may be sicker than the NIV group, which could partially explain the increased mortality with IMV. However, the propensity scores overlap to a great extent between the 2 study groups, suggesting that a strong confounding bias is less likely, given the observed covariates. Furthermore, the instrumental variable and sensitivity analyses taking into account unmeasured confounders still suggested the benefits of NIV. Second, the NEDS does not contain data on the location where NIV was initiated (eg, ED, ward, or ICU) or the timing of initiating NIV or IMV. As a result, for the combined‐use group, we could not further distinguish the group switching from NIV to IMV (ie, NIV failure)[42] or from IMV to NIV (ie, NIV as a weaning strategy).[43] Accordingly, we chose to focus on the comparativeness effectiveness of NIV vs IMV. Third, although the NEDS data have undergone quality‐control procedures,[44] some misclassification may exist in identifying patient population and interventions. Finally, the analysis may not reflect the most recent trend in NIV use, as the 2010 NEDS data have just been released. In addition, although the study is the largest to date on this topic, our findings may not be generalizable to EDs that were not part of the NEDS.
In summary, in this nationally representative ED and inpatient database, NIV use is increasing for AECOPD with acute respiratory failure; however, its adoption remains low and varies widely between US hospitals. Our observational study suggests that NIV appears to be more effective and safer than IMV in the real‐world setting. There is an opportunity to increase the use of NIV as recommended in guidelines and to promote the use NIV in replacement of IMV in patients with severe AECOPD. Given the increasing mortality burden of COPD, such a strategy may help reduce COPD mortality at the population level, thereby fulfilling the objectives of Healthy People 2020.
Disclosure
Partial results from this study were presented at the 2012 Society for Academic Emergency Medicine Annual Meeting, Chicago, Illinois, May 912, 2012. This project was supported by grant number R03HS020722 from the Agency for Healthcare Research and Quality. The content is solely the responsibility of the authors and does not necessarily represent the official views of the Agency for Healthcare Research and Quality. The authors have no conflicts of interest to disclose.
- Centers for Disease Control and Prevention, National Center for Health Statistics. National Vital Statistics Reports, 2011. Deaths: final data for 2008. Available at: http://www.cdc.gov/nchs/data/nvsr/nvsr59/nvsr59_10.pdf. Accessed August 15, 2012.
- , , , . Trends in the leading causes of death in the United States, 1970–2002. JAMA. 2005;294:1255–1259.
- , , . National study of emergency department visits for acute exacerbation of chronic obstructive pulmonary disease. Acad Emerg Med. 2008;15:1275–1283.
- , , , , . Chronic obstructive pulmonary disease surveillance—United States, 1971–2000. MMWR Surveill Summ. 2002;51:1–16.
- US Department of Health and Human Services. Healthy People 2020. Objectives for Respiratory Diseases. Available at: http://www.healthypeople. gov/2020/topicsobjectives2020/objectiveslist.aspx?topicId=36. Accessed May 3, 2012.
- . Mechanical ventilation: invasive versus noninvasive. Eur Respir J Suppl. 2003;47:31s–37s.
- , , , et al. Noninvasive ventilation for acute exacerbations of chronic obstructive pulmonary disease. N Engl J Med. 1995;333:817–822.
- , , . Early use of non‐invasive ventilation for acute exacerbations of chronic obstructive pulmonary disease on general respiratory wards: a multicentre randomised controlled trial. Lancet. 2000;355:1931–1935.
- , , , et al. Randomised controlled trial of nasal ventilation in acute ventilatory failure due to chronic obstructive airways disease. Lancet. 1993;341:1555–1557.
- , , , . Non‐invasive positive pressure ventilation for treatment of respiratory failure due to exacerbations of chronic obstructive pulmonary disease. Cochrane Database Syst Rev. 2004;(3):CD004104.
- , , , et al. Noninvasive vs. conventional mechanical ventilation in patients with chronic obstructive pulmonary disease after failure of medical treatment in the ward: a randomized trial. Intensive Care Med. 2002;28:1701–1707.
- . Noninvasive vs conventional mechanical ventilation in acute respiratory failure: a multicenter, randomized controlled trial. Chest. 2005;128:3916–3924.
- , , , , , . Mechanical ventilation in chronic obstructive pulmonary disease patients, noninvasive vs. invasive method (randomized prospective study). Coll Antropol. 2009;33:791–797.
- , , , et al. Noninvasive Positive‐Pressure Ventilation (NPPV) for Acute Respiratory Failure. Rockville, MD: Agency for Healthcare Research and Quality; July 2012: Report 12‐EHC089‐EF. Available at: http://effectivehealthcareahrqgov/ehc/products/273/1180/CER68_NPPV_FinalReport_20120706pdf. Accessed December 11, 2012.
- Healthcare Cost and Utilization Project (HCUP). HCUP Nationwide Emergency Department Sample (NEDS). Rockville, MD: Agency for Healthcare Research and Quality; 2012. Available at: http://www.hcup‐us.ahrq.gov/nedsoverview.jsp. Accessed April 15, 2012.
- American Hospital Association. Annual survey database. Available at: http://www.ahadata.com/ahadata/html/AHASurvey.html. Accessed April 15, 2012.
- , , , . Age‐related differences in clinical outcomes for acute asthma in the United States, 2006–2008. J Allergy Clin Immunol. 2012;129:1252e1–1258e1.
- Global Initiative for Chronic Obstructive Lung Disease (GOLD). NHLBI/WHO Global Strategy for the Diagnosis, Management and Prevention of COPD. Available at: http://www.goldcopd.org. Accessed April 15, 2012.
- .US Bureau of the Census. Census regions and divisions of the United States. Available at: http://www.census.gov/geo/www/us_regdiv.pdf. Accessed April 9, 2012.
- .Healthcare Cost and Utilization Project. Comorbidity software. Available at: http://www.hcup‐us.ahrq.gov/toolssoftware/comorbidity/comorbidity.jsp. Accessed April 15, 2012.
- , , , . Comorbidity measures for use with administrative data. Med Care. 1998;36:8–27.
- Healthcare Cost and Utilization Project (HCUP). HCUP Methods Series. Hierarchical Modeling Using HCUP Data. Rockville, MD: Agency for Healthcare Research and Quality; 2012: Report 2007‐01. Available at: http://www.hcup‐us.ahrq.gov/reports/methods/2007_01.pdf. Accessed April 15, 2012.
- , , . Indications for propensity scores and review of their use in pharmacoepidemiology. Basic Clin Pharmacol Toxicol. 2006;98:253–259.
- , , , , , . Antibiotic therapy and treatment failure in patients hospitalized for acute exacerbations of chronic obstructive pulmonary disease. JAMA. 2010;303:2035–2042.
- . An introduction to propensity score methods for reducing the effects of confounding in observational studies. Multivariate Behav Res. 2011;46:399–424.
- , , . Instrumental variable methods in comparative safety and effectiveness research. Pharmacoepidemiol Drug Saf. 2010;19:537–554.
- . Sensitivity analysis and external adjustment for unmeasured confounders in epidemiologic database studies of therapeutics. Pharmacoepidemiol Drug Saf. 2006;15:291–303.
- , , , et al. Outcomes of noninvasive ventilation for acute exacerbations of chronic obstructive pulmonary disease in the United States, 1998–2008. Am J Respir Crit Care Med. 2012;185:152–159.
- , , , , . A European survey of noninvasive ventilation practices. Eur Respir J. 2010;36:362–369.
- , . Standards for the diagnosis and treatment of patients with COPD: a summary of the ATS/ERS position paper. Eur Respir J. 2004;23:932–946.
- , , , . Utilization of noninvasive ventilation in acute care hospitals: a regional survey. Chest. 2006;129:1226–1233.
- , , . A survey of the use of noninvasive ventilation in academic emergency departments in the United States. Respir Care. 2009;54:1306–1312.
- , , . Emergency department case volume and patient outcomes in acute exacerbations of chronic obstructive pulmonary disease. Acad Emerg Med. 2012;19:656–663.
- , , , , . Noninvasive positive pressure ventilation in the setting of severe, acute exacerbations of chronic obstructive pulmonary disease: more effective and less expensive. Crit Care Med. 2000;28:2094–2102.
- , , , . Cost effectiveness of ward based non‐invasive ventilation for acute exacerbations of chronic obstructive pulmonary disease: economic analysis of randomised controlled trial. BMJ. 2003;326:956.
- , , . Noninvasive positive pressure ventilation reverses acute respiratory failure in select “do‐not‐intubate” patients. Crit Care Med. 2005;33:1976–1982.
- , . Noninvasive ventilation for acute exacerbations of chronic obstructive pulmonary disease: “Don't think twice, it's alright!”. Am J Respir Crit Care Med. 2012;185:121–123.
- , , , , . Acidosis, non‐invasive ventilation and mortality in hospitalised COPD exacerbations. Thorax. 2011;66:43–48.
- , , , , . Use of noninvasive positive‐pressure ventilation on the regular hospital ward: experience and correlates of success. Respir Care. 2006;51:1237–1243.
- , , , et al. Bilevel noninvasive positive pressure ventilation for acute respiratory failure: survey of Ontario practice. Crit Care Med. 2005;33:1477–1483.
- . Hospitalists and intensivists: partners in caring for the critically ill—the time has come. J Hosp Med. 2010;5:1–3.
- , , , , , . Incidence and causes of non‐invasive mechanical ventilation failure after initial success. Thorax. 2000;55:819–825.
- , , , . Noninvasive positive pressure ventilation as a weaning strategy for intubated adults with respiratory failure. Cochrane Database Syst Rev. 2010:CD004127.
- Healthcare Cost and Utilization Project (HCUP). HCUP Quality Control Procedures. Rockville, MD: Agency for Healthcare Research and Quality; 2012. Available at: http://www.hcup‐us.ahrq.gov/db/quality.jsp. Accessed December 15, 2012.
Copyright © 2013 Society of Hospital Medicine