User login
The number of older people in the United States is expected to increase, due to the aging of the post‐World War II baby boomers.[1] For example, those aged 65 years are expected to number 88.5 million in 2050, more than double the number in 2010 of 40.2 million. This demographic shift has raised concerns about future hospital capacity, but the scope of the problem has not been quantified.[2]
A recent analysis calculated the number and length of emergency department visits expected to occur based on the aging of the US population.[3] One finding was that hospital admissions would increase 23% faster than population growth. However, this considered only hospitalizations originating in the emergency department and did not consider all‐source hospitalizations. We obtained data on all‐source hospitalizations and applied them to the US Census Bureau's demographic projections for the future through 2050. This provides a base‐case estimate for how inpatient demand would change if all other influences remained equal. The goal was to isolate the effect of population age makeup on inpatient requirements while holding other influences constant.
METHODS
We used the method of actuarial life table adjustment as described previously.[3] To calculate age‐specific hospitalization rates, we estimated age‐specific hospitalization frequencies (counts) in the United States for 2011 from the Nationwide Inpatient Sample (NIS).[4] This is a stratified probability sample of US community hospitals, defined as all nonfederal, short term, general, and other specialty hospitals, excluding hospital units of institutions. Veterans hospitals and other federal facilities, short‐term rehabilitation hospitals, long‐term non‐acute care hospitals, psychiatric hospitals, and alcoholism/chemical dependency treatment facilities were excluded from NIS 2011. Of hospitals in the sample, 21% are government (nonfederal) owned.
We converted age‐specific hospitalization frequencies derived from this sample into rates by dividing each stratum‐specific admission count by the 2011 population count in each age stratum from the US Census Bureau.[5] The Census Bureau provides detailed predictions of the US population through 2050. Births, deaths, and net international migration are projected for each birth cohort. Using 2011 as the origin, we applied baseline age‐specific hospitalization rates stratum‐wise to the general population expected by the Census Bureau in future years. This gave us stratum‐specific hospitalization frequencies for each future year. We summed these to arrive at the aggregate anticipated hospitalization frequency in each year. For our main outcome measure, we calculated the ratio of change in hospitalization frequency to change in population, comparing each future year to the 2011 baseline. We also calculated aggregate inpatient days, using the same data sources and methods. Our institutional review board exempted this study from review. We used Stata 13.0 (StataCorp, College Station, TX), and Microsoft Excel (Microsoft, Redmond, WA) for all analyses.
RESULTS
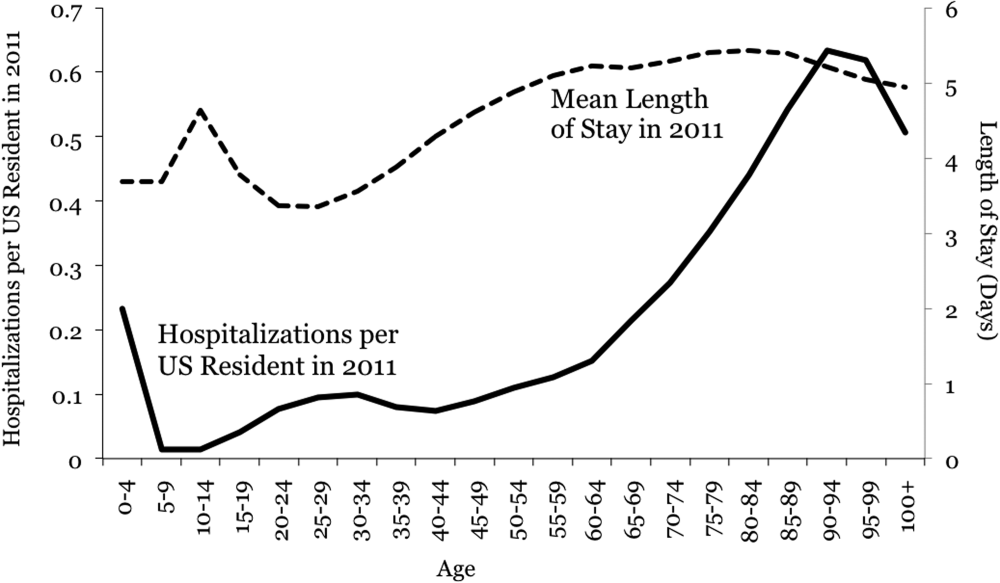
Baseline data are displayed in Figure 1. In 2011, there were 0.23 hospitalizations per US resident aged 0 to 4 years, and 0.01 per resident aged 5 to 9 years. From this age forward, hospitalization rates increased steadily with advancing age, reaching 0.63 per resident aged 90 to 94 years. Length of stay also was generally associated with age, though there was a peak among older children.

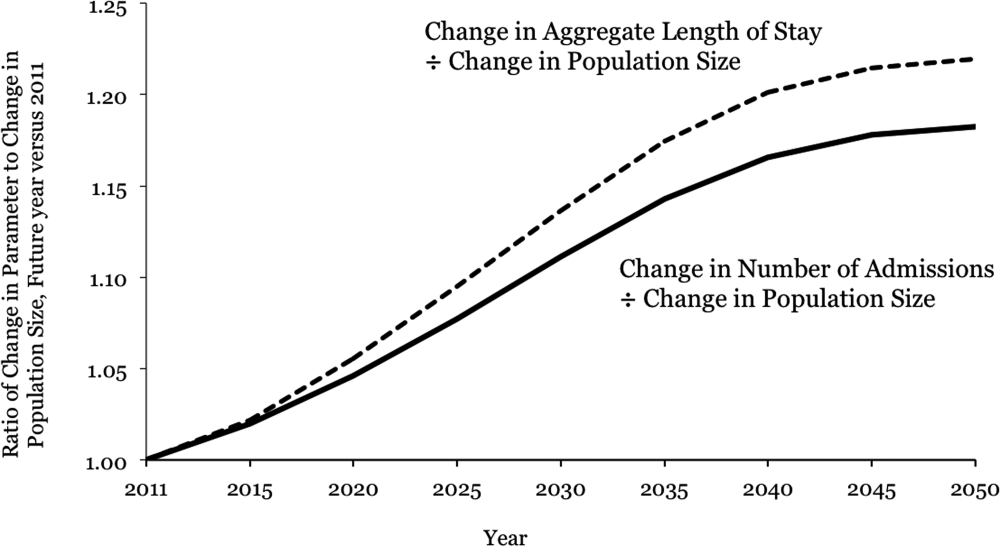
Projections through 2050 are shown in Table 1 and Figure 2. Table 1 displays the population projections of the US Census Bureau, which expects the US population to increase by 41% between now and 2050. Also shown in the table are our projections, which indicate that, all other things being equal, the annual number of inpatient admissions in the US will increase by 67%. The ratio of 67% to 41% is 1.18, meaning that the frequency of inpatient admissions will grow 18% more than population growth due to the aging of the population. The aggregate number of inpatient days will increase 22% more than population growth. Overall, inpatient capacity must expand by 72% to keep pace.
| Year | Population | Hospital Admissions | Aggregate Inpatient Days | Population: Ratio of Future Year to 2011 | Admissions: Ratio of Future Year to 2011 | Ratio of Admission Increase to Population Increase | Aggregate Inpatient Days: Ratio of Future Year to 2011 | Ratio of Increase in Inpatient Days to Population Increase |
|---|---|---|---|---|---|---|---|---|
| ||||||||
| 2011 | 311,591,917 | 38,560,751* | 177,501,515 | 1 | 1 | 1 | 1 | 1 |
| 2015 | 325,539,790 | 41,093,154 | 189,520,706 | 1.04 | 1.07 | 1.02 | 1.07 | 1.02 |
| 2020 | 341,386,665 | 44,196,669 | 205,205,962 | 1.10 | 1.15 | 1.05 | 1.16 | 1.06 |
| 2025 | 357,451,620 | 47,655,492 | 222,911,204 | 1.15 | 1.24 | 1.08 | 1.26 | 1.09 |
| 2030 | 373,503,674 | 51,365,441 | 241,852,384 | 1.20 | 1.33 | 1.11 | 1.36 | 1.14 |
| 2035 | 389,531,156 | 55,091,242 | 260,603,998 | 1.25 | 1.43 | 1.14 | 1.47 | 1.17 |
| 2040 | 405,655,295 | 58,524,016 | 277,530,732 | 1.30 | 1.52 | 1.17 | 1.56 | 1.20 |
| 2045 | 422,058,629 | 61,525,903 | 292,014,192 | 1.35 | 1.60 | 1.18 | 1.65 | 1.21 |
| 2050 | 439,010,253 | 64,249,181 | 304,945,179 | 1.41 | 1.67 | 1.18 | 1.72 | 1.22 |
DISCUSSION
Although US hospital capacity has fallen over the past 3 decades,[6, 7] our analysis suggests that demand for inpatient beds will increase 22% faster than population growth by 2050. The total projected demand increase is 72%, including that attributable to population growth and that attributable to population aging.
These are ceteris paribus projections, which reveal the changes in inpatient demand that would result if 2 conditions held: (1) the US Census Bureau's expectations for population makeup proved correct, and (2) age‐specific hospitalization rates and lengths of stay did not change. In reality, age‐specific hospitalization rates and lengths of stay could change. Examples of change drivers include epidemics, technology, and financial incentives provided by third‐party payers.[7] For example, if an epidemic of a new disease were to occur, age‐specific hospitalization rates could increase across all age groups. Our projections depict what would happen in the absence of any such change. This is useful because we do not know if changes in age‐specific hospitalization rates will occur, and whether there will be increases or decreases. Therefore, our projections should not be viewed as literal predictions, but rather as pieces of the puzzle, necessary but not sufficient elements of an understanding of what the future may hold for inpatient demand.
Clinicians, academics, and government agencies have an interest in understanding inpatient supply and demand on national and local levels. However, their ability to influence supply is limited by the fact that of all registered hospitals in the United States, only 22% are government owned.[1] As a result, decisions about hospital construction and closure are generally left to the free market.[6] Nonetheless, we bear responsibility for monitoring supply and demand, and government regulation of hospitals and reimbursement for inpatient care mean that the public is not entirely without influence. Thirty‐two percent of US residents have government‐issued health insurance.[8]
In the early 20th century, very little healthcare took place in the inpatient setting. However, by the 1970s, inpatient care accounted for a large part of healthcare, due largely to changes in technology and reimbursement. This trend reversed in the 1980s and 1990s, and hospitals closed.[7] In 1975, there were 5875 hospitals in the United States, and in 2000 there were 4915.[6] The number of staffed beds decreased from 942,000 to 826,000.[6] In parallel, likely due to changes in technology (ie, the nature of healthcare), total inpatient days in community hospitals decreased from 223 million in 1991 to 187 million in 2011.[9] On the other hand, increasing access to insurance under the Affordable Care Act could increase utilization, as seen when a 30% increase in hospital utilization occurred when people were enrolled in Oregon's Medicaid program.[10] Also, hospital utilization may increase if Medicare patients require more services.[11]
Actuarial life table analysis has been used to make forecasts related to healthcare supply and demand, though we are not aware of prior applications to the question of hospitalization. A prior study used actuarial life table adjustment to forecast demand for emergency department services.[3] These methods have also been used to forecast the influence of longevity upon healthcare expenditures[12, 13, 14] and to predict demand for specialty services.[15, 16] Of note, rather than reporting ratios of demand growth to population growth, another option would have been to derive a compound growth rate. We are not aware of a precedent for such methods in the prior published applications of actuarial life table analysis and felt that such inductive methods would complicate the interpretation of our results.
The main limitation of our investigation is its scope. We used actuarial life table adjustment to isolate the effect of population aging upon demand for inpatient hospitalizations. This method does not yield a comprehensive prediction of inpatient demand, but rather provides a robust estimate under the assumption that all other things remain equal. Another obvious limitation is that our analysis has a nationwide scope, and was not designed to account for variation from one locale to the next. However, these methods can be used by local health authorities.
CONCLUSIONS
The US Census Bureau expects the US population to increase by 41% over the next 4 decades, and the number of US residents aged 65 years to more than double. Our results indicate that, all other things being equal, this will cause the number of hospital admissions to increase 18% faster than population growth, and the aggregate number of inpatient days to increase 22% faster than population growth. Including both population growth and population aging, the total projected increase required for inpatient capacity is 72%. This is a base‐case, ceteris paribus analysis, and understanding how demand for inpatient services may change will require multiple perspectives. Increasing access to insurance, changing poverty rates, and changes in healthcare delivery and technology are other important factors. The present analysis provides a focused estimate of the influence upon demand for inpatient services due to expected changes in our population's age distribution.
- American Hospital Association. Fast facts on US hospitals, 2011. Available at: http://www.aha.org/research/rc/stat‐studies/fast‐facts.shtml. Accessed August 7, 2013.
- American Hospital Association. Cracks in the foundation: averting a crisis in America's hospitals. AHA 2002. Available at: http://www.aha.org/content/00–10/cracksreprint08‐02.pdf. Accessed August 4, 2013.
- , , , , . Population aging and emergency departments: visits will not increase, lengths‐of‐stay and hospitalizations will. Health Aff (Millwood). 2013;32(7):1306–1312.
- HCUP Nationwide Inpatient Sample (NIS). Healthcare Cost and Utilization Project (HCUP). 2011. Agency for Healthcare Research and Quality, Rockville, MD. Available at: http://www.hcup‐us.ahrq.gov/nisoverview.jsp. Accessed July 25, 2013.
- Bureau of the Census. Population Projections by Age, Sex, Race, and Hispanic Origin: July 1, 2000–2050. Washington, DC: The Bureau; 2008.
- , , , . Does U.S. hospital capacity need to be expanded? Health Aff (Millwood). 2003;22(6):40–54.
- . Decline in hospital utilization and cost inflation under managed care in California. JAMA. 1996;276(13):1060–1064.
- , , . Income, poverty, and health insurance coverage in the United States, 2011. US Census Bureau. Available at: http://www.census.gov/prod/2012pubs/p60–243.pdf. Published September 2012. Accessed August 7, 2013.
- American Hospital Association. Trendwatch. Table 3.1: trends in inpatient utilization in community hospitals, 1991–2011. Available at: http://www.aha.org/research/reports/tw/chartbook/2013/table3‐1.pdf. Accessed November 9, 2013.
- , , , et al. The Oregon health insurance experiment: evidence from the first year. Q J Econ. 2012;127(3):1057–1106.
- American Hospital Association. Trendwatch. Are Medicare patients getting sicker? Available at: http://www.aha.org/research/reports/tw/12dec‐tw‐ptacuity.pdf. Accessed November 9, 2013.
- , , . Longevity and Medicare expenditures. N Engl J Med. 1995;332(15):999–1003.
- , . The aging of America. Impact on health care costs. JAMA. 1990;263(17):2335–2340.
- , . The effect of longevity on spending for acute and long‐term care. N Engl J Med. 2000;342(19):1409–1415.
- , , , . Demographics and cardiology, 1950–2050. J Am Coll Cardiol. 2000;35(4):1067–1081.
- , , , . Population‐based analysis of inpatient vascular procedures and predicting future workload and implications for training. J Vasc Surg. 2012;55(5):1394–1399; discussion 1399–1400.
The number of older people in the United States is expected to increase, due to the aging of the post‐World War II baby boomers.[1] For example, those aged 65 years are expected to number 88.5 million in 2050, more than double the number in 2010 of 40.2 million. This demographic shift has raised concerns about future hospital capacity, but the scope of the problem has not been quantified.[2]
A recent analysis calculated the number and length of emergency department visits expected to occur based on the aging of the US population.[3] One finding was that hospital admissions would increase 23% faster than population growth. However, this considered only hospitalizations originating in the emergency department and did not consider all‐source hospitalizations. We obtained data on all‐source hospitalizations and applied them to the US Census Bureau's demographic projections for the future through 2050. This provides a base‐case estimate for how inpatient demand would change if all other influences remained equal. The goal was to isolate the effect of population age makeup on inpatient requirements while holding other influences constant.
METHODS
We used the method of actuarial life table adjustment as described previously.[3] To calculate age‐specific hospitalization rates, we estimated age‐specific hospitalization frequencies (counts) in the United States for 2011 from the Nationwide Inpatient Sample (NIS).[4] This is a stratified probability sample of US community hospitals, defined as all nonfederal, short term, general, and other specialty hospitals, excluding hospital units of institutions. Veterans hospitals and other federal facilities, short‐term rehabilitation hospitals, long‐term non‐acute care hospitals, psychiatric hospitals, and alcoholism/chemical dependency treatment facilities were excluded from NIS 2011. Of hospitals in the sample, 21% are government (nonfederal) owned.
We converted age‐specific hospitalization frequencies derived from this sample into rates by dividing each stratum‐specific admission count by the 2011 population count in each age stratum from the US Census Bureau.[5] The Census Bureau provides detailed predictions of the US population through 2050. Births, deaths, and net international migration are projected for each birth cohort. Using 2011 as the origin, we applied baseline age‐specific hospitalization rates stratum‐wise to the general population expected by the Census Bureau in future years. This gave us stratum‐specific hospitalization frequencies for each future year. We summed these to arrive at the aggregate anticipated hospitalization frequency in each year. For our main outcome measure, we calculated the ratio of change in hospitalization frequency to change in population, comparing each future year to the 2011 baseline. We also calculated aggregate inpatient days, using the same data sources and methods. Our institutional review board exempted this study from review. We used Stata 13.0 (StataCorp, College Station, TX), and Microsoft Excel (Microsoft, Redmond, WA) for all analyses.
RESULTS
Baseline data are displayed in Figure 1. In 2011, there were 0.23 hospitalizations per US resident aged 0 to 4 years, and 0.01 per resident aged 5 to 9 years. From this age forward, hospitalization rates increased steadily with advancing age, reaching 0.63 per resident aged 90 to 94 years. Length of stay also was generally associated with age, though there was a peak among older children.
Projections through 2050 are shown in Table 1 and Figure 2. Table 1 displays the population projections of the US Census Bureau, which expects the US population to increase by 41% between now and 2050. Also shown in the table are our projections, which indicate that, all other things being equal, the annual number of inpatient admissions in the US will increase by 67%. The ratio of 67% to 41% is 1.18, meaning that the frequency of inpatient admissions will grow 18% more than population growth due to the aging of the population. The aggregate number of inpatient days will increase 22% more than population growth. Overall, inpatient capacity must expand by 72% to keep pace.
| Year | Population | Hospital Admissions | Aggregate Inpatient Days | Population: Ratio of Future Year to 2011 | Admissions: Ratio of Future Year to 2011 | Ratio of Admission Increase to Population Increase | Aggregate Inpatient Days: Ratio of Future Year to 2011 | Ratio of Increase in Inpatient Days to Population Increase |
|---|---|---|---|---|---|---|---|---|
| ||||||||
| 2011 | 311,591,917 | 38,560,751* | 177,501,515 | 1 | 1 | 1 | 1 | 1 |
| 2015 | 325,539,790 | 41,093,154 | 189,520,706 | 1.04 | 1.07 | 1.02 | 1.07 | 1.02 |
| 2020 | 341,386,665 | 44,196,669 | 205,205,962 | 1.10 | 1.15 | 1.05 | 1.16 | 1.06 |
| 2025 | 357,451,620 | 47,655,492 | 222,911,204 | 1.15 | 1.24 | 1.08 | 1.26 | 1.09 |
| 2030 | 373,503,674 | 51,365,441 | 241,852,384 | 1.20 | 1.33 | 1.11 | 1.36 | 1.14 |
| 2035 | 389,531,156 | 55,091,242 | 260,603,998 | 1.25 | 1.43 | 1.14 | 1.47 | 1.17 |
| 2040 | 405,655,295 | 58,524,016 | 277,530,732 | 1.30 | 1.52 | 1.17 | 1.56 | 1.20 |
| 2045 | 422,058,629 | 61,525,903 | 292,014,192 | 1.35 | 1.60 | 1.18 | 1.65 | 1.21 |
| 2050 | 439,010,253 | 64,249,181 | 304,945,179 | 1.41 | 1.67 | 1.18 | 1.72 | 1.22 |
DISCUSSION
Although US hospital capacity has fallen over the past 3 decades,[6, 7] our analysis suggests that demand for inpatient beds will increase 22% faster than population growth by 2050. The total projected demand increase is 72%, including that attributable to population growth and that attributable to population aging.
These are ceteris paribus projections, which reveal the changes in inpatient demand that would result if 2 conditions held: (1) the US Census Bureau's expectations for population makeup proved correct, and (2) age‐specific hospitalization rates and lengths of stay did not change. In reality, age‐specific hospitalization rates and lengths of stay could change. Examples of change drivers include epidemics, technology, and financial incentives provided by third‐party payers.[7] For example, if an epidemic of a new disease were to occur, age‐specific hospitalization rates could increase across all age groups. Our projections depict what would happen in the absence of any such change. This is useful because we do not know if changes in age‐specific hospitalization rates will occur, and whether there will be increases or decreases. Therefore, our projections should not be viewed as literal predictions, but rather as pieces of the puzzle, necessary but not sufficient elements of an understanding of what the future may hold for inpatient demand.
Clinicians, academics, and government agencies have an interest in understanding inpatient supply and demand on national and local levels. However, their ability to influence supply is limited by the fact that of all registered hospitals in the United States, only 22% are government owned.[1] As a result, decisions about hospital construction and closure are generally left to the free market.[6] Nonetheless, we bear responsibility for monitoring supply and demand, and government regulation of hospitals and reimbursement for inpatient care mean that the public is not entirely without influence. Thirty‐two percent of US residents have government‐issued health insurance.[8]
In the early 20th century, very little healthcare took place in the inpatient setting. However, by the 1970s, inpatient care accounted for a large part of healthcare, due largely to changes in technology and reimbursement. This trend reversed in the 1980s and 1990s, and hospitals closed.[7] In 1975, there were 5875 hospitals in the United States, and in 2000 there were 4915.[6] The number of staffed beds decreased from 942,000 to 826,000.[6] In parallel, likely due to changes in technology (ie, the nature of healthcare), total inpatient days in community hospitals decreased from 223 million in 1991 to 187 million in 2011.[9] On the other hand, increasing access to insurance under the Affordable Care Act could increase utilization, as seen when a 30% increase in hospital utilization occurred when people were enrolled in Oregon's Medicaid program.[10] Also, hospital utilization may increase if Medicare patients require more services.[11]
Actuarial life table analysis has been used to make forecasts related to healthcare supply and demand, though we are not aware of prior applications to the question of hospitalization. A prior study used actuarial life table adjustment to forecast demand for emergency department services.[3] These methods have also been used to forecast the influence of longevity upon healthcare expenditures[12, 13, 14] and to predict demand for specialty services.[15, 16] Of note, rather than reporting ratios of demand growth to population growth, another option would have been to derive a compound growth rate. We are not aware of a precedent for such methods in the prior published applications of actuarial life table analysis and felt that such inductive methods would complicate the interpretation of our results.
The main limitation of our investigation is its scope. We used actuarial life table adjustment to isolate the effect of population aging upon demand for inpatient hospitalizations. This method does not yield a comprehensive prediction of inpatient demand, but rather provides a robust estimate under the assumption that all other things remain equal. Another obvious limitation is that our analysis has a nationwide scope, and was not designed to account for variation from one locale to the next. However, these methods can be used by local health authorities.
CONCLUSIONS
The US Census Bureau expects the US population to increase by 41% over the next 4 decades, and the number of US residents aged 65 years to more than double. Our results indicate that, all other things being equal, this will cause the number of hospital admissions to increase 18% faster than population growth, and the aggregate number of inpatient days to increase 22% faster than population growth. Including both population growth and population aging, the total projected increase required for inpatient capacity is 72%. This is a base‐case, ceteris paribus analysis, and understanding how demand for inpatient services may change will require multiple perspectives. Increasing access to insurance, changing poverty rates, and changes in healthcare delivery and technology are other important factors. The present analysis provides a focused estimate of the influence upon demand for inpatient services due to expected changes in our population's age distribution.
- American Hospital Association. Fast facts on US hospitals, 2011. Available at: http://www.aha.org/research/rc/stat‐studies/fast‐facts.shtml. Accessed August 7, 2013.
- American Hospital Association. Cracks in the foundation: averting a crisis in America's hospitals. AHA 2002. Available at: http://www.aha.org/content/00–10/cracksreprint08‐02.pdf. Accessed August 4, 2013.
- , , , , . Population aging and emergency departments: visits will not increase, lengths‐of‐stay and hospitalizations will. Health Aff (Millwood). 2013;32(7):1306–1312.
- HCUP Nationwide Inpatient Sample (NIS). Healthcare Cost and Utilization Project (HCUP). 2011. Agency for Healthcare Research and Quality, Rockville, MD. Available at: http://www.hcup‐us.ahrq.gov/nisoverview.jsp. Accessed July 25, 2013.
- Bureau of the Census. Population Projections by Age, Sex, Race, and Hispanic Origin: July 1, 2000–2050. Washington, DC: The Bureau; 2008.
- , , , . Does U.S. hospital capacity need to be expanded? Health Aff (Millwood). 2003;22(6):40–54.
- . Decline in hospital utilization and cost inflation under managed care in California. JAMA. 1996;276(13):1060–1064.
- , , . Income, poverty, and health insurance coverage in the United States, 2011. US Census Bureau. Available at: http://www.census.gov/prod/2012pubs/p60–243.pdf. Published September 2012. Accessed August 7, 2013.
- American Hospital Association. Trendwatch. Table 3.1: trends in inpatient utilization in community hospitals, 1991–2011. Available at: http://www.aha.org/research/reports/tw/chartbook/2013/table3‐1.pdf. Accessed November 9, 2013.
- , , , et al. The Oregon health insurance experiment: evidence from the first year. Q J Econ. 2012;127(3):1057–1106.
- American Hospital Association. Trendwatch. Are Medicare patients getting sicker? Available at: http://www.aha.org/research/reports/tw/12dec‐tw‐ptacuity.pdf. Accessed November 9, 2013.
- , , . Longevity and Medicare expenditures. N Engl J Med. 1995;332(15):999–1003.
- , . The aging of America. Impact on health care costs. JAMA. 1990;263(17):2335–2340.
- , . The effect of longevity on spending for acute and long‐term care. N Engl J Med. 2000;342(19):1409–1415.
- , , , . Demographics and cardiology, 1950–2050. J Am Coll Cardiol. 2000;35(4):1067–1081.
- , , , . Population‐based analysis of inpatient vascular procedures and predicting future workload and implications for training. J Vasc Surg. 2012;55(5):1394–1399; discussion 1399–1400.