User login
LOS in Children With Medical Complexity
Children with medical complexity (CMC) have complex and chronic health conditions that often involve multiple organ systems and severely affect cognitive and physical functioning. Although the prevalence of CMC is low (1% of all children), they account for nearly one‐fifth of all pediatric admissions and one‐half of all hospital days and charges in the United States.[1] Over the last decade, CMC have had a particularly large and increasing impact in tertiary‐care children's hospitals.[1, 2] The Institute of Medicine has identified CMC as a priority population for a revised healthcare system.[3]
Medical homes, hospitals, health plans, states, federal agencies, and others are striving to reduce excessive hospital use in CMC because of its high cost.[4, 5, 6] Containing length of stay (LOS)an increasingly used indicator of the time sensitiveness and efficiency of hospital careis a common aim across these initiatives. CMC have longer hospitalizations than children without medical complexity. Speculated reasons for this are that CMC tend to have (1) higher severity of acute illnesses (eg, pneumonia, cellulitis), (2) prolonged recovery time in the hospital, and (3) higher risk of adverse events in the hospital. Moreover, hospital clinicians caring for CMC often find it difficult to determine discharge readiness, given that many CMC do not return to a completely healthy baseline.[7]
Little is known about long LOS in CMC, including which CMC have the highest risk of experiencing such stays and which stays might have the greatest opportunity to be shortened. Patient characteristics associated with prolonged length of stay have been studied extensively for many pediatric conditions (eg, asthma).[8, 9, 10, 11, 12, 13, 14] However, most of these studies excluded CMC. Therefore, the objectives of this study were to examine (1) the prevalence of long LOS in CMC, (2) patient characteristics associated with long LOS, and (3) hospital‐to‐hospital variation in prevalence of long LOS hospitalizations.
METHODS
Study Design and Data Source
This study is a multicenter, retrospective cohort analysis of the Pediatric Health Information System (PHIS). PHIS is an administrative database of 44 not for profit, tertiary care pediatric hospitals affiliated with the Children's Hospital Association (CHA) (Overland Park, KS). PHIS contains data regarding patient demographics, diagnoses, and procedures (with International Classification of Diseases, 9th Revision, Clinical Modification [ICD‐9‐CM] codes), All‐Patient Refined Diagnostic Related Groups version 30 (APR‐DRGs) (3M Health Information Systems, Salt Lake City, UT), and service lines that aggregate the APR‐DRGs into 38 distinct groups. Data quality and reliability are assured through CHA and participating hospitals. In accordance with the policies of the Cincinnati Children's Hospital Medical Center Institutional Review Board, this study of deidentified data was not considered human subjects research.
Study Population
Inclusion Criteria
Children discharged following an observation or inpatient admission from a hospital participating in the PHIS database between January 1, 2013 and December 31, 2014 were eligible for inclusion if they were considered medically complex. Medical complexity was defined using Clinical Risk Groups (CRGs) version 1.8, developed by 3M Health Information Systems and the National Association of Children's Hospitals and Related Institutions. CRGs were used to assign each hospitalized patient to 1 of 9 mutually exclusive chronicity groups according to the presence, type, and severity of chronic conditions.[15, 16, 17, 18] Each patient's CRG designation was based on 2 years of previous hospital encounters.
As defined in prior studies and definitional frameworks of CMC,[1] patients belonging to CRG group 6 (significant chronic disease in 2 organ systems), CRG group 7 (dominant chronic disease in 3 organ systems), and CRG group 9 (catastrophic condition) were considered medically complex.[17, 19] Patients with malignancies (CRG group 8) were not included for analysis because they are a unique population with anticipated, long hospital stays. Patients with CRG group 5, representing those with chronic conditions affecting a single body system, were also not included because most do not have attributes consistent with medical complexity.
Exclusion Criteria
We used the APR‐DRG system, which leverages ICD‐9‐CM codes to identify the health problem most responsible for the hospitalization, to refine the study cohort. We excluded hospitalizations that were classified by the APR‐DRG system as neonatal, as we did not wish to focus on LOS in the neonatal intensive care unit (ICU) or for birth admissions. Similarly, hospitalizations for chemotherapy (APR‐DRG 693) or malignancy (identified with previously used ICD‐9‐CM codes)[20] were also excluded because long LOS is anticipated. We also excluded hospitalizations for medical rehabilitation (APR‐DRG 860).
Outcome Measures
The primary outcome measure was long LOS, defined as LOS 10 days. The cut point of LOS 10 days represents the 90th percentile of LOS for all children, with and without medical complexity, hospitalized during 2013 to 2014. LOS 10 days has previously been used as a threshold of long LOS.[21] For hospitalizations involving transfer at admission from another acute care facility, LOS was measured from the date of transfer. We also assessed hospitals' cost attributable to long LOS admissions.
Patient Demographics and Clinical Characteristics
We measured demographic characteristics including age, gender, race/ethnicity, insurance type, and distance traveled (the linear distance between the centroid of the patient's home ZIP code and the centroid of the hospital's ZIP code). Clinical characteristics included CRG classification, complex chronic condition (CCC), and dependence on medical technology. CCCs are defined as any medical condition that can be reasonably expected to last at least 12 months (unless death intervenes) and to involve either several different organ systems or 1 system severely enough to require specialty pediatric care and probably some period of hospitalization in a tertiary care center.[20] Medical technology included devices used to optimize the health and functioning of the child (eg, gastrostomy, tracheostomy, cerebrospinal fluid shunt).[22]
Hospitalization Characteristics
Characteristics of the hospitalization included transfer from an outside facility, ICU admission, surgical procedure (using surgical APR‐DRGs), and discharge disposition (home, skilled nursing facility, home health services, death, other). Cost of the hospitalization was estimated in the PHIS from charges using hospital and year‐specific ratios of cost to charge.
Statistical Analysis
Continuous data (eg, distance from hospital to home residence) were described with median and interquartile ranges (IQR) because they were not normally distributed. Categorical data (eg, type of chronic condition) were described with counts and frequencies. In bivariate analyses, demographic, clinical, and hospitalization characteristics were stratified by LOS (long LOS vs LOS <10 days), and compared using 2 statistics or Wilcoxon rank sum tests as appropriate.
We modeled the likelihood of experiencing a long LOS using generalized linear mixed effects models with a random hospital intercept and discharge‐level fixed effects for age, gender, payor, CCC type, ICU utilization, transfer status, a medical/surgical admission indicator derived from the APR‐DRG, and CRG assigned to each hospitalization. To examine hospital‐to‐hospital variability, we generated hospital risk‐adjusted rates of long LOS from these models. Similar models and hospital risk‐adjusted rates were built for a post hoc correlational analysis of 30‐day all cause readmission, where hospitals' rates and percent of long LOS were compared with a Pearson correlation coefficient. Also, for our multivariable models, we performed a sensitivity analysis using an alternative definition of long LOS as 4 days (the 75th percentile of LOS for all children, with and without medical complexity, hospitalized during 20132014). All analyses were performed using SAS version 9.4 (SAS Institute, Cary, NC), and P values <0.05 were considered statistically significant.
RESULTS
Study Population
There were 954,018 hospitalizations of 217,163 CMC at 44 children's hospitals included for analysis. Forty‐seven percent of hospitalizations were for females, 49.4% for non‐Hispanic whites, and 61.1% for children with government insurance. Fifteen percent (n = 142,082) had a long LOS of 10 days. The median (IQR) LOS of hospitalizations <10 days versus 10 days were 2 (IQR, 14) and 16 days (IQR, 1226), respectively. Long LOS hospitalizations accounted for 61.1% (3.7 million) hospital days and 61.8% ($13.7 billion) of total hospitalization costs for all CMC in the cohort (Table 1).
| Characteristic | Overall (n = 954,018) | Length of Stay | |
|---|---|---|---|
| <10 Days (n = 811,936) | 10 Days (n = 142,082) | ||
| |||
| Age at admission, y, % | |||
| <1 | 14.6 | 12.7 | 25.7 |
| 14 | 27.1 | 27.9 | 22.4 |
| 59 | 20.1 | 21.0 | 14.9 |
| 1018 | 33.6 | 34.0 | 31.7 |
| 18+ | 4.6 | 4.4 | 5.4 |
| Gender, % | |||
| Female | 47.0 | 46.9 | 47.5 |
| Race/ethnicity, % | |||
| Non‐Hispanic white | 49.4 | 49.4 | 49.4 |
| Non‐Hispanic black | 23.1 | 23.8 | 19.3 |
| Hispanic | 18.2 | 17.8 | 20.4 |
| Asian | 2.0 | 1.9 | 2.3 |
| Other | 7.4 | 7.1 | 8.6 |
| Complex chronic condition, % | |||
| Any | 79.5 | 77.3 | 91.8 |
| Technology assistance | 37.1 | 34.1 | 54.2 |
| Gastrointestinal | 30.0 | 27.2 | 45.9 |
| Neuromuscular | 28.2 | 27.7 | 30.9 |
| Cardiovascular | 16.8 | 14.5 | 29.9 |
| Respiratory | 14.1 | 11.5 | 29.4 |
| Congenital/genetic defect | 17.2 | 16.7 | 20.2 |
| Metabolic | 9.9 | 8.9 | 15.4 |
| Renal | 10.1 | 9.5 | 13.8 |
| Hematology/emmmunodeficiency | 11.7 | 12.0 | 10.0 |
| Neonatal | 3.8 | 3.1 | 7.7 |
| Transplantation | 4.5 | 4.2 | 6.7 |
| Clinical risk group, % | |||
| Chronic condition in 2 systems | 68.4 | 71.2 | 53.9 |
| Catastrophic chronic condition | 31.4 | 28.8 | 46.1 |
| Distance from hospital to home residence in miles, median [IQR] | 16.2 [7.440.4] | 15.8 [7.338.7] | 19.1 [8.552.6] |
| Transferred from outside hospital (%) | 6.5 | 5.3 | 13.6 |
| Admitted for surgery, % | 23.4 | 20.7 | 38.7 |
| Use of intensive care, % | 19.6 | 14.9 | 46.5 |
| Discharge disposition, % | |||
| Home | 91.2 | 92.9 | 81.4 |
| Home healthcare | 4.5 | 3.5 | 9.9 |
| Other | 2.9 | 2.6 | 4.5 |
| Postacute care facility | 1.1 | 0.8 | 3.1 |
| Died | 0.4 | 0.3 | 1.1 |
| Payor, % | |||
| Government | 61.1 | 60.6 | 63.5 |
| Private | 33.2 | 33.6 | 30.9 |
| Other | 5.7 | 5.7 | 5.7 |
| Hospital resource use | |||
| Median length of stay [IQR] | 3 [16] | 2 [14] | 16 [1226] |
| Median hospital cost [IQR] | $8,144 [$4,122$18,447] | $6,689 [$3,685$12,395] | $49,207 [$29,444$95,738] |
| Total hospital cost, $, billions | $22.2 | $8.5 | $13.7 |
Demographics and Clinical Characteristics of Children With and Without Long LOS
Compared with hospitalized CMC with LOS <10 days, a higher percentage of hospitalizations with LOS 10 days were CMC age <1 year (25.7% vs 12.7%, P < 0.001) and Hispanic (20.4% vs 17.8%, P < 0.001). CMC hospitalizations with a long LOS had a higher percentage of any CCC (91.8% vs 77.3%, P < 0.001); the most common CCCs were gastrointestinal (45.9%), neuromuscular (30.9%), and cardiovascular (29.9%). Hospitalizations of CMC with a long LOS had a higher percentage of a catastrophic chronic condition (46.1% vs 28.8%, P < 0.001) and technology dependence (46.1% vs 28.8%, P < 0.001) (Table 1).
Hospitalization Characteristics of Children With and Without Long LOS
Compared with hospitalizations of CMC with LOS <10 days, hospitalizations of CMC with a long LOS more often involved transfer in from another hospital at admission (13.6% vs 5.3%, P < 0.001). CMC hospital stays with a long LOS more often involved surgery (38.7% vs 20.7%, P < 0.001) and use of intensive care (46.5% vs 14.9%; P < 0.001). A higher percentage of CMC with long LOS were discharged with home health services (9.9% vs 3.5%; P < 0.001) (Table 1).
The most common admitting diagnoses and CCCs for hospitalizations of CMC with long LOS are presented in Table 2. The two most prevalent APR‐DRGs in CMC hospitalizations lasting 10 days or longer were cystic fibrosis (10.7%) and respiratory system disease with ventilator support (5.5%). The two most common chronic condition characteristics represented among long CMC hospitalizations were gastrointestinal devices (eg, gastrostomy tube) (39.7%) and heart and great vessel malformations (eg, tetralogy of Fallot) (12.8%). The 5 most common CCC subcategories, as listed in Table 2, account for nearly 100% of the patients with long LOS hospitalizations.
| |
| Most common reason for admission* | |
| Cystic fibrosis | 10.7% |
| Respiratory system diagnosis with ventilator support 96+ hours | 5.5% |
| Malfunction, reaction, and complication of cardiac or vascular device or procedure | 2.8% |
| Craniotomy except for trauma | 2.6% |
| Major small and large bowel procedures | 2.3% |
| Most common complex chronic condition | |
| Gastrointestinal devices | 39.7% |
| Heart and great vessel malformations | 12.8% |
| Cystic fibrosis | 12.5% |
| Dysrhythmias | 11.0% |
| Respiratory devices | 10.7% |
Multivariable Analysis of Characteristics Associated With Long LOS
In multivariable analysis, the highest likelihood of long LOS was experienced by children who received care in the ICU (odds ratio [OR]: 3.5, 95% confidence interval [CI]: 3.43.5), who had a respiratory CCC (OR: 2.7, 95% CI: 2.62.7), and who were transferred from another acute care hospital at admission (OR: 2.1, 95% CI: 2.0, 2.1). The likelihood of long LOS was also higher in children <1 year of age (OR: 1.2, 95% CI: 1.21.3), and Hispanic children (OR: 1.1, 95% CI 1.0‐1.10) (Table 3). Similar multivariable findings were observed in sensitivity analysis using the 75th percentile of LOS (4 days) as the model outcome.
| Characteristic | Odds Ratio (95% CI) of LOS 10 Days | P Value |
|---|---|---|
| ||
| Use of intensive care | 3.5 (3.4‐3.5) | <0.001 |
| Transfer from another acute‐care hospital | 2.1 (2.0‐2.1) | <0.001 |
| Procedure/surgery | 1.8 (1.8‐1.9) | <0.001 |
| Complex chronic condition | ||
| Respiratory | 2.7 (2.6‐2.7) | <0.001 |
| Gastrointestinal | 1.8 (1.8‐1.8) | <0.001 |
| Metabolic | 1.7 (1.7‐1.7) | <0.001 |
| Cardiovascular | 1.6 (1.5‐1.6) | <0.001 |
| Neonatal | 1.5 (1.5‐1.5) | <0.001 |
| Renal | 1.4 (1.4‐1.4) | <0.001 |
| Transplant | 1.4 (1.4‐1.4) | <0.001 |
| Hematology and immunodeficiency | 1.3 (1.3‐1.3) | <0.001 |
| Technology assistance | 1.1 (1.1, 1.1) | <0.001 |
| Neuromuscular | 0.9 (0.9‐0.9) | <0.001 |
| Congenital or genetic defect | 0.8 (0.8‐0.8) | <0.001 |
| Age at admission, y | ||
| <1 | 1.2 (1.2‐1.3) | <0.001 |
| 14 | 0.5 (0.5‐0.5) | <0.001 |
| 59 | 0.6 (0.6‐0.6) | <0.001 |
| 1018 | 0.9 (0.9‐0.9) | <0.001 |
| 18+ | Reference | |
| Male | 0.9 (0.9‐0.9) | <0.001 |
| Race/ethnicity | ||
| Non‐Hispanic black | 0.9 (0.9‐0.9) | <0.001 |
| Hispanic | 1.1 (1.0‐1.1) | <0.001 |
| Asian | 1.0 (1.0‐1.1) | 0.3 |
| Other | 1.1 (1.1‐1.1) | <0.001 |
| Non‐Hispanic white | Reference | |
| Payor | ||
| Private | 0.9 (0.8 0.9) | <0.001 |
| Other | 1.0 (1.0‐1.0) | 0.4 |
| Government | Reference | |
| Season | ||
| Spring | 1.0 (1.0 1.0) | <0.001 |
| Summer | 0.9 (0.9‐0.9) | <0.001 |
| Fall | 1.0 (0.9‐1.0) | <0.001 |
| Winter | Reference | |
Variation in the Prevalence of Long LOS Across Children's Hospitals
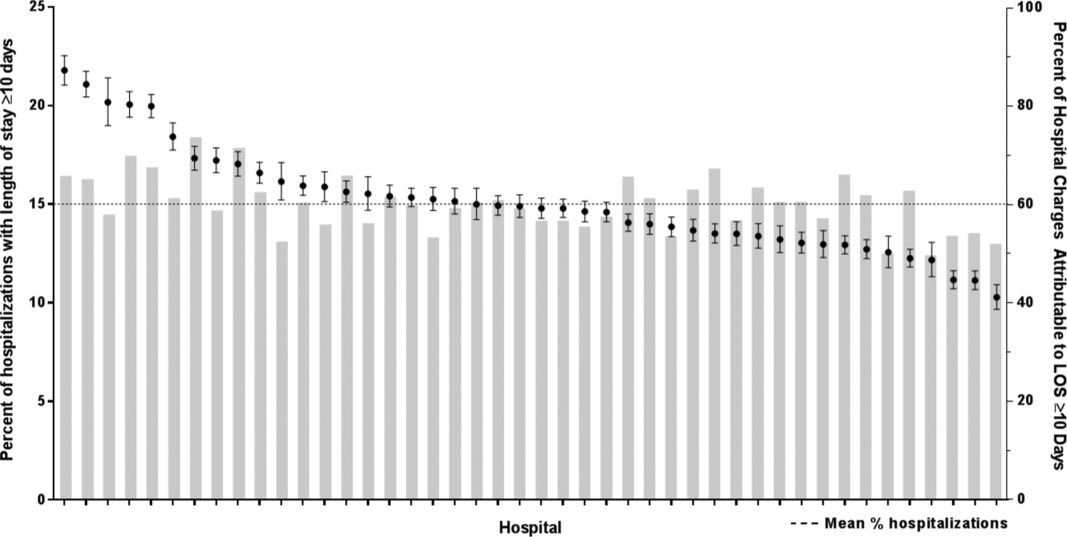
After controlling for demographic, clinical, and hospital characteristics associated with long LOS, there was significant (P < 0.001) variation in the prevalence of long LOS for CMC across children's hospitals in the cohort (range, 10.3%21.8%) (Figure 1). Twelve (27%) hospitals had a significantly (P < 0.001) higher prevalence of long LOS for their hospitalized CMC, compared to the mean. Eighteen (41%) had a significantly (P < 0.001) lower prevalence of long LOS for their hospitalized CMC. There was also significant variation across hospitals with respect to cost, with 49.7% to 73.7% of all hospital costs of CMC attributed to long LOS hospitalizations. Finally, there was indirect correlation with the prevalence of LOS across hospitals and the hospitals' 30‐day readmission rate ( = 0.3; P = 0.04). As the prevalence of long LOS increased, the readmission rate decreased.
DISCUSSION
The main findings from this study suggest that a small percentage of CMC experiencing long LOS account for the majority of hospital bed days and cost of all hospitalized CMC in children's hospitals. The likelihood of long LOS varies significantly by CMC's age, race/ethnicity, and payor as well as by type and number of chronic conditions. Among CMC with long LOS, the use of gastrointestinal devices such as gastrostomy tubes, as well as congenital heart disease, were highly prevalent. In multivariable analysis, the characteristics most strongly associated with LOS 10 days were use of the ICU, respiratory complex chronic condition, and transfer from another medical facility at admission. After adjusting for these factors, there was significant variation in the prevalence of LOS 10 days for CMC across children's hospitals.
Although it is well known that CMC as a whole have a major impact on resource use in children's hospitals, this study reveals that 15% of hospitalizations of CMC account for 62% of all hospital costs of CMC. That is, a small fraction of hospitalizations of CMC is largely responsible for the significant financial impact of hospital resource use. To date, most clinical efforts and policies striving to reduce hospital use in CMC have focused on avoiding readmissions or index hospital admissions entirely, rather than improving the efficiency of hospital care after admission occurs.[23, 24, 25, 26] In the adult population, the impact of long LOS on hospital costs has been recognized, and several Medicare incentive programs have focused on in‐hospital timeliness and efficiency. As a result, LOS in Medicare beneficiaries has decreased dramatically over the past 2 decades.[27, 28, 29, 30] Optimizing the efficiency of hospital care for CMC may be an important goal to pursue, especially with precedent set in the adult literature.
Perhaps the substantial variation across hospitals in the prevalence of long LOS in CMC indicates opportunity to improve the efficiency of their inpatient care. This variation was not due to differences across hospitals' case mix of CMC. Further investigation is needed to determine how much of it is due to differences in quality of care. Clinical practice guidelines for hospital treatment of common illnesses usually exclude CMC. In our clinical experience across 9 children's hospitals, we have experienced varying approaches to setting discharge goals (ie, parameters on how healthy the child needs to be to ensure a successful hospital discharge) for CMC.[31] When the goals are absent or not clearly articulated, they can contribute to a prolonged hospitalization. Some families of CMC report significant issues when working with pediatric hospital staff to assess their child's discharge readiness.[7, 32, 33] In addition, there is significant variation across states and regions in access to and quality of post‐discharge health services (eg, home nursing, postacute care, durable medical equipment).[34, 35] In some areas, many CMC are not actively involved with their primary care physician.[5] These issues might also influence the ability of some children's hospitals to efficiently discharge CMC to a safe and supportive post‐discharge environment. Further examination of hospital outliersthose with the lowest and highest percentage of CMC hospitalizations with long LOSmay reveal opportunities to identify and spread best practices.
The demographic and clinical factors associated with long LOS in the present study, including age, ICU use, and transfer from another hospital, might help hospitals target which CMC have the greatest risk for experiencing long LOS. We found that infants age <1 year had longer LOS when compared with older children. Similar to our findings, younger‐aged children hospitalized with bronchiolitis have longer LOS.[36] Certainly, infants with medical complexity, in general, are a high‐acuity population with the potential for rapid clinical deterioration during an acute illness. Prolonged hospitalization for treatment and stabilization may be expected for many of them. Additional investigation is warranted to examine ICU use in CMC, and whether ICU admission or duration can be safely prevented or abbreviated. Opportunities to assess the quality of transfers into children's hospitals of CMC admitted to outside hospitals may be necessary. A study of pediatric burn patients reported that patients initially stabilized at a facility that was not a burn center and subsequently transferred to a burn center had a longer LOS than patients solely treated at a designated burn center.[37] Furthermore, events during transport itself may adversely impact the stability of an already fragile patient. Interventions to optimize the quality of care provided by transport teams have resulted in decreased LOS at the receiving hospital.[38]
This study's findings should be considered in the context of several limitations. Absent a gold‐standard definition of long LOS, we used the distribution of LOS across patients to inform our methods; LOS at the 90th percentile was selected as long. Although our sensitivity analysis using LOS at the 75th percentile produced similar findings, other cut points in LOS might be associated with different results. The study is not positioned to determine how much of the reported LOS was excessive, unnecessary, or preventable. The study findings may not generalize to types of hospitals not contained in PHIS (eg, nonchildren's hospitals and community hospitals). We did not focus on the impact of a new diagnosis (eg, new chronic illness) or acute in‐hospital event (eg, nosocomial infection) on prolonged LOS; future studies should investigate these clinical events with LOS.
PHIS does not contain information regarding characteristics that could influence LOS, including the children's social and familial attributes, transportation availability, home equipment needs, and local availability of postacute care facilities. Moreover, PHIS does not contain information about the hospital discharge procedures, process, or personnel across hospitals, which could influence LOS. Future studies on prolonged LOS should consider assessing this information. Because of the large sample size of hospitalizations included, the statistical power for the analyses was strong, rendering it possible that some findings that were statistically significant might have modest clinical significance (eg, relationship of Hispanic ethnicity with prolonged LOS). We could not determine why a positive correlation was not observed between hospitals' long LOS prevalence and their percentage of cost associated with long LOS; future studies should investigate the reasons for this finding.
Despite these limitations, the findings of the present study highlight the significance of long LOS in hospitalized CMC. These long hospitalizations account for a significant proportion of all hospital costs for this important population of children. The prevalence of long LOS for CMC varies considerably across children's hospitals, even after accounting for the case mix. Efforts to curtail hospital resource use and costs for CMC may benefit from focus on long LOS.
- , , , et al. Inpatient growth and resource use in 28 children's hospitals: a longitudinal, multi‐institutional study. JAMA Pediatr. 2013;167(2):170–177.
- , , , et al. Children with complex chronic conditions in inpatient hospital settings in the united states. Pediatrics. 2010;126(4):647–655.
- , . Meeting the health care needs of persons with disabilities. Milbank Q. 2002;80(2):381–391.
- , , , et al. Effect of an enhanced medical home on serious illness and cost of care among high‐risk children with chronic illness: a randomized clinical trial. JAMA. 2014;312(24):2640–2648.
- , , , et al. Children with medical complexity and Medicaid: spending and cost savings. Health Aff Proj Hope. 2014;33(12):2199–2206.
- Children's Hospital Association. CARE Award. Available at: https://www.childrenshospitals.org/Programs‐and‐Services/Quality‐Improvement‐and‐Measurement/CARE‐Award. Accessed December 18, 2015.
- , , , et al. Hospital readmission and parent perceptions of their child's hospital discharge. Int J Qual Health Care. 2013;25(5):573–581.
- , , , et al. Weekend matters: Friday and Saturday admissions are associated with prolonged hospitalization of children. Clin Pediatr (Phila). 2013;52(9):875–878.
- , , , . Attributable cost and length of stay for central line‐associated bloodstream infections. Pediatrics. 2014;133(6):e1525–e1532.
- , , , et al. Effect of healthcare‐acquired infection on length of hospital stay and cost. Infect Control Hosp Epidemiol. 2007;28(3):280–292.
- , , , , . Hospital utilization and costs among children with influenza, 2003. Am J Prev Med. 2009;36(4):292–296.
- , , , . Charges and lengths of stay attributable to adverse patient‐care events using pediatric‐specific quality indicators: a multicenter study of freestanding children's hospitals. Pediatrics. 2008;121(6):e1653–e1659.
- , , , , . Variation in resource utilization for the management of uncomplicated community‐acquired pneumonia across community and children's hospitals. J Pediatr. 2014;165(3):585–591.
- , , , , . Variation and outcomes associated with direct hospital admission among children with pneumonia in the United States. JAMA Pediatr. 2014;168(9):829–836.
- , , , et al. Clinical Risk Groups (CRGs): a classification system for risk‐adjusted capitation‐based payment and health care management. Med Care. 2004;42(1):81–90.
- , , , et al. Identifying children with lifelong chronic conditions for care coordination by using hospital discharge data. Acad Pediatr. 2010;10(6):417–423.
- , , , , . Profile of medical charges for children by health status group and severity level in a Washington State Health Plan. Health Serv Res. 2004;39(1):73–89.
- , , , . Using medical billing data to evaluate chronically ill children over time. J Ambulatory Care Manage. 2006;29(4):283–290.
- , , , , , . Medical complexity and pediatric emergency department and inpatient utilization. Pediatrics. 2013;131(2):e559–e565.
- , , , , . Pediatric complex chronic conditions classification system version 2: updated for ICD‐10 and complex medical technology dependence and transplantation. BMC Pediatr. 2014;14:199.
- . Analyzing intensive care unit length of stay data: problems and possible solutions. Crit Care Med. 1997;25(9):1594–1600.
- , , , et al. Hospital utilization and characteristics of patients experiencing recurrent readmissions within children's hospitals. JAMA. 2011;305(7):682–690.
- . Hospital readmissions and repeat emergency department visits among children with medical complexity: an integrative review. J Pediatr Nurs. 2013;28(4):316–339.
- , , , . Hospital readmission in children with complex chronic conditions discharged from subacute care. Hosp Pediatr. 2014;4(3):153–158.
- , , , et al. Preventing hospitalizations in children with medical complexity: a systematic review. Pediatrics. 2014;134(6):e1628–e1647.
- , , , . Hospital readmissions for newly discharged pediatric home mechanical ventilation patients. Pediatr Pulmonol. 2012;47(4):409–414.
- , , , et al. Clinical characteristics and outcomes of Medicare patients undergoing total hip arthroplasty, 1991–2008. JAMA. 2011;305(15):1560–1567.
- , , , et al. Trends in length of stay and short‐term outcomes among Medicare patients hospitalized for heart failure, 1993–2006. JAMA. 2010;303(21):2141–2147.
- U.S. Department of Health and Human Services. CMS Statistics 2013. Available at: https://www.cms.gov/Research‐Statistics‐Data‐and‐Systems/Statistics‐Trends‐and‐Reports/CMS‐Statistics‐Reference‐Booklet/Downloads/CMS_Stats_2013_final.pdf. Published August 2013. Accessed October 6, 2015.
- Centers for Medicare and Medicaid Services. Evaluation of the premier hospital quality incentive demonstration. Available at: https://www.cms.gov/Research‐Statistics‐Data‐and‐Systems/Statistics‐Trends‐and‐Reports/Reports/downloads/Premier_ExecSum_2010.pdf. Published March 3, 2009. Accessed September 18, 2015.
- , , , et al. A framework of pediatric hospital discharge care informed by legislation, research, and practice. JAMA Pediatr. 2014;168(10):955–962; quiz 965–966.
- , , , , . Parent and provider perspectives on pediatric readmissions: what can we learn about readiness for discharge? Hosp Pediatr. 2015;5(11):559–565.
- , . Preventing readmissions in children: how do we do that? Hosp Pediatr. 2015;5(11):602–604.
- , , . Pediatric post‐acute hospital care: striving for identity and value. Hosp Pediatr. 2015;5(10):548–551.
- , , , et al. Pediatric hospital discharges to home health and postacute facility care: a national study. JAMA Pediatr. 2016;170(4):326–333.
- , , , et al. Bronchiolitis: clinical characteristics associated with hospitalization and length of stay. Pediatr Emerg Care. 2012;28(2):99–103.
- , , , , . The effect of transfers between health care facilities on costs and length of stay for pediatric burn patients. J Burn Care Res. 2015;36(1):178–183.
- , , , et al. Goal‐directed resuscitative interventions during pediatric interfacility transport. Crit Care Med. 2015;43(8):1692–1698.
Children with medical complexity (CMC) have complex and chronic health conditions that often involve multiple organ systems and severely affect cognitive and physical functioning. Although the prevalence of CMC is low (1% of all children), they account for nearly one‐fifth of all pediatric admissions and one‐half of all hospital days and charges in the United States.[1] Over the last decade, CMC have had a particularly large and increasing impact in tertiary‐care children's hospitals.[1, 2] The Institute of Medicine has identified CMC as a priority population for a revised healthcare system.[3]
Medical homes, hospitals, health plans, states, federal agencies, and others are striving to reduce excessive hospital use in CMC because of its high cost.[4, 5, 6] Containing length of stay (LOS)an increasingly used indicator of the time sensitiveness and efficiency of hospital careis a common aim across these initiatives. CMC have longer hospitalizations than children without medical complexity. Speculated reasons for this are that CMC tend to have (1) higher severity of acute illnesses (eg, pneumonia, cellulitis), (2) prolonged recovery time in the hospital, and (3) higher risk of adverse events in the hospital. Moreover, hospital clinicians caring for CMC often find it difficult to determine discharge readiness, given that many CMC do not return to a completely healthy baseline.[7]
Little is known about long LOS in CMC, including which CMC have the highest risk of experiencing such stays and which stays might have the greatest opportunity to be shortened. Patient characteristics associated with prolonged length of stay have been studied extensively for many pediatric conditions (eg, asthma).[8, 9, 10, 11, 12, 13, 14] However, most of these studies excluded CMC. Therefore, the objectives of this study were to examine (1) the prevalence of long LOS in CMC, (2) patient characteristics associated with long LOS, and (3) hospital‐to‐hospital variation in prevalence of long LOS hospitalizations.
METHODS
Study Design and Data Source
This study is a multicenter, retrospective cohort analysis of the Pediatric Health Information System (PHIS). PHIS is an administrative database of 44 not for profit, tertiary care pediatric hospitals affiliated with the Children's Hospital Association (CHA) (Overland Park, KS). PHIS contains data regarding patient demographics, diagnoses, and procedures (with International Classification of Diseases, 9th Revision, Clinical Modification [ICD‐9‐CM] codes), All‐Patient Refined Diagnostic Related Groups version 30 (APR‐DRGs) (3M Health Information Systems, Salt Lake City, UT), and service lines that aggregate the APR‐DRGs into 38 distinct groups. Data quality and reliability are assured through CHA and participating hospitals. In accordance with the policies of the Cincinnati Children's Hospital Medical Center Institutional Review Board, this study of deidentified data was not considered human subjects research.
Study Population
Inclusion Criteria
Children discharged following an observation or inpatient admission from a hospital participating in the PHIS database between January 1, 2013 and December 31, 2014 were eligible for inclusion if they were considered medically complex. Medical complexity was defined using Clinical Risk Groups (CRGs) version 1.8, developed by 3M Health Information Systems and the National Association of Children's Hospitals and Related Institutions. CRGs were used to assign each hospitalized patient to 1 of 9 mutually exclusive chronicity groups according to the presence, type, and severity of chronic conditions.[15, 16, 17, 18] Each patient's CRG designation was based on 2 years of previous hospital encounters.
As defined in prior studies and definitional frameworks of CMC,[1] patients belonging to CRG group 6 (significant chronic disease in 2 organ systems), CRG group 7 (dominant chronic disease in 3 organ systems), and CRG group 9 (catastrophic condition) were considered medically complex.[17, 19] Patients with malignancies (CRG group 8) were not included for analysis because they are a unique population with anticipated, long hospital stays. Patients with CRG group 5, representing those with chronic conditions affecting a single body system, were also not included because most do not have attributes consistent with medical complexity.
Exclusion Criteria
We used the APR‐DRG system, which leverages ICD‐9‐CM codes to identify the health problem most responsible for the hospitalization, to refine the study cohort. We excluded hospitalizations that were classified by the APR‐DRG system as neonatal, as we did not wish to focus on LOS in the neonatal intensive care unit (ICU) or for birth admissions. Similarly, hospitalizations for chemotherapy (APR‐DRG 693) or malignancy (identified with previously used ICD‐9‐CM codes)[20] were also excluded because long LOS is anticipated. We also excluded hospitalizations for medical rehabilitation (APR‐DRG 860).
Outcome Measures
The primary outcome measure was long LOS, defined as LOS 10 days. The cut point of LOS 10 days represents the 90th percentile of LOS for all children, with and without medical complexity, hospitalized during 2013 to 2014. LOS 10 days has previously been used as a threshold of long LOS.[21] For hospitalizations involving transfer at admission from another acute care facility, LOS was measured from the date of transfer. We also assessed hospitals' cost attributable to long LOS admissions.
Patient Demographics and Clinical Characteristics
We measured demographic characteristics including age, gender, race/ethnicity, insurance type, and distance traveled (the linear distance between the centroid of the patient's home ZIP code and the centroid of the hospital's ZIP code). Clinical characteristics included CRG classification, complex chronic condition (CCC), and dependence on medical technology. CCCs are defined as any medical condition that can be reasonably expected to last at least 12 months (unless death intervenes) and to involve either several different organ systems or 1 system severely enough to require specialty pediatric care and probably some period of hospitalization in a tertiary care center.[20] Medical technology included devices used to optimize the health and functioning of the child (eg, gastrostomy, tracheostomy, cerebrospinal fluid shunt).[22]
Hospitalization Characteristics
Characteristics of the hospitalization included transfer from an outside facility, ICU admission, surgical procedure (using surgical APR‐DRGs), and discharge disposition (home, skilled nursing facility, home health services, death, other). Cost of the hospitalization was estimated in the PHIS from charges using hospital and year‐specific ratios of cost to charge.
Statistical Analysis
Continuous data (eg, distance from hospital to home residence) were described with median and interquartile ranges (IQR) because they were not normally distributed. Categorical data (eg, type of chronic condition) were described with counts and frequencies. In bivariate analyses, demographic, clinical, and hospitalization characteristics were stratified by LOS (long LOS vs LOS <10 days), and compared using 2 statistics or Wilcoxon rank sum tests as appropriate.
We modeled the likelihood of experiencing a long LOS using generalized linear mixed effects models with a random hospital intercept and discharge‐level fixed effects for age, gender, payor, CCC type, ICU utilization, transfer status, a medical/surgical admission indicator derived from the APR‐DRG, and CRG assigned to each hospitalization. To examine hospital‐to‐hospital variability, we generated hospital risk‐adjusted rates of long LOS from these models. Similar models and hospital risk‐adjusted rates were built for a post hoc correlational analysis of 30‐day all cause readmission, where hospitals' rates and percent of long LOS were compared with a Pearson correlation coefficient. Also, for our multivariable models, we performed a sensitivity analysis using an alternative definition of long LOS as 4 days (the 75th percentile of LOS for all children, with and without medical complexity, hospitalized during 20132014). All analyses were performed using SAS version 9.4 (SAS Institute, Cary, NC), and P values <0.05 were considered statistically significant.
RESULTS
Study Population
There were 954,018 hospitalizations of 217,163 CMC at 44 children's hospitals included for analysis. Forty‐seven percent of hospitalizations were for females, 49.4% for non‐Hispanic whites, and 61.1% for children with government insurance. Fifteen percent (n = 142,082) had a long LOS of 10 days. The median (IQR) LOS of hospitalizations <10 days versus 10 days were 2 (IQR, 14) and 16 days (IQR, 1226), respectively. Long LOS hospitalizations accounted for 61.1% (3.7 million) hospital days and 61.8% ($13.7 billion) of total hospitalization costs for all CMC in the cohort (Table 1).
| Characteristic | Overall (n = 954,018) | Length of Stay | |
|---|---|---|---|
| <10 Days (n = 811,936) | 10 Days (n = 142,082) | ||
| |||
| Age at admission, y, % | |||
| <1 | 14.6 | 12.7 | 25.7 |
| 14 | 27.1 | 27.9 | 22.4 |
| 59 | 20.1 | 21.0 | 14.9 |
| 1018 | 33.6 | 34.0 | 31.7 |
| 18+ | 4.6 | 4.4 | 5.4 |
| Gender, % | |||
| Female | 47.0 | 46.9 | 47.5 |
| Race/ethnicity, % | |||
| Non‐Hispanic white | 49.4 | 49.4 | 49.4 |
| Non‐Hispanic black | 23.1 | 23.8 | 19.3 |
| Hispanic | 18.2 | 17.8 | 20.4 |
| Asian | 2.0 | 1.9 | 2.3 |
| Other | 7.4 | 7.1 | 8.6 |
| Complex chronic condition, % | |||
| Any | 79.5 | 77.3 | 91.8 |
| Technology assistance | 37.1 | 34.1 | 54.2 |
| Gastrointestinal | 30.0 | 27.2 | 45.9 |
| Neuromuscular | 28.2 | 27.7 | 30.9 |
| Cardiovascular | 16.8 | 14.5 | 29.9 |
| Respiratory | 14.1 | 11.5 | 29.4 |
| Congenital/genetic defect | 17.2 | 16.7 | 20.2 |
| Metabolic | 9.9 | 8.9 | 15.4 |
| Renal | 10.1 | 9.5 | 13.8 |
| Hematology/emmmunodeficiency | 11.7 | 12.0 | 10.0 |
| Neonatal | 3.8 | 3.1 | 7.7 |
| Transplantation | 4.5 | 4.2 | 6.7 |
| Clinical risk group, % | |||
| Chronic condition in 2 systems | 68.4 | 71.2 | 53.9 |
| Catastrophic chronic condition | 31.4 | 28.8 | 46.1 |
| Distance from hospital to home residence in miles, median [IQR] | 16.2 [7.440.4] | 15.8 [7.338.7] | 19.1 [8.552.6] |
| Transferred from outside hospital (%) | 6.5 | 5.3 | 13.6 |
| Admitted for surgery, % | 23.4 | 20.7 | 38.7 |
| Use of intensive care, % | 19.6 | 14.9 | 46.5 |
| Discharge disposition, % | |||
| Home | 91.2 | 92.9 | 81.4 |
| Home healthcare | 4.5 | 3.5 | 9.9 |
| Other | 2.9 | 2.6 | 4.5 |
| Postacute care facility | 1.1 | 0.8 | 3.1 |
| Died | 0.4 | 0.3 | 1.1 |
| Payor, % | |||
| Government | 61.1 | 60.6 | 63.5 |
| Private | 33.2 | 33.6 | 30.9 |
| Other | 5.7 | 5.7 | 5.7 |
| Hospital resource use | |||
| Median length of stay [IQR] | 3 [16] | 2 [14] | 16 [1226] |
| Median hospital cost [IQR] | $8,144 [$4,122$18,447] | $6,689 [$3,685$12,395] | $49,207 [$29,444$95,738] |
| Total hospital cost, $, billions | $22.2 | $8.5 | $13.7 |
Demographics and Clinical Characteristics of Children With and Without Long LOS
Compared with hospitalized CMC with LOS <10 days, a higher percentage of hospitalizations with LOS 10 days were CMC age <1 year (25.7% vs 12.7%, P < 0.001) and Hispanic (20.4% vs 17.8%, P < 0.001). CMC hospitalizations with a long LOS had a higher percentage of any CCC (91.8% vs 77.3%, P < 0.001); the most common CCCs were gastrointestinal (45.9%), neuromuscular (30.9%), and cardiovascular (29.9%). Hospitalizations of CMC with a long LOS had a higher percentage of a catastrophic chronic condition (46.1% vs 28.8%, P < 0.001) and technology dependence (46.1% vs 28.8%, P < 0.001) (Table 1).
Hospitalization Characteristics of Children With and Without Long LOS
Compared with hospitalizations of CMC with LOS <10 days, hospitalizations of CMC with a long LOS more often involved transfer in from another hospital at admission (13.6% vs 5.3%, P < 0.001). CMC hospital stays with a long LOS more often involved surgery (38.7% vs 20.7%, P < 0.001) and use of intensive care (46.5% vs 14.9%; P < 0.001). A higher percentage of CMC with long LOS were discharged with home health services (9.9% vs 3.5%; P < 0.001) (Table 1).
The most common admitting diagnoses and CCCs for hospitalizations of CMC with long LOS are presented in Table 2. The two most prevalent APR‐DRGs in CMC hospitalizations lasting 10 days or longer were cystic fibrosis (10.7%) and respiratory system disease with ventilator support (5.5%). The two most common chronic condition characteristics represented among long CMC hospitalizations were gastrointestinal devices (eg, gastrostomy tube) (39.7%) and heart and great vessel malformations (eg, tetralogy of Fallot) (12.8%). The 5 most common CCC subcategories, as listed in Table 2, account for nearly 100% of the patients with long LOS hospitalizations.
| |
| Most common reason for admission* | |
| Cystic fibrosis | 10.7% |
| Respiratory system diagnosis with ventilator support 96+ hours | 5.5% |
| Malfunction, reaction, and complication of cardiac or vascular device or procedure | 2.8% |
| Craniotomy except for trauma | 2.6% |
| Major small and large bowel procedures | 2.3% |
| Most common complex chronic condition | |
| Gastrointestinal devices | 39.7% |
| Heart and great vessel malformations | 12.8% |
| Cystic fibrosis | 12.5% |
| Dysrhythmias | 11.0% |
| Respiratory devices | 10.7% |
Multivariable Analysis of Characteristics Associated With Long LOS
In multivariable analysis, the highest likelihood of long LOS was experienced by children who received care in the ICU (odds ratio [OR]: 3.5, 95% confidence interval [CI]: 3.43.5), who had a respiratory CCC (OR: 2.7, 95% CI: 2.62.7), and who were transferred from another acute care hospital at admission (OR: 2.1, 95% CI: 2.0, 2.1). The likelihood of long LOS was also higher in children <1 year of age (OR: 1.2, 95% CI: 1.21.3), and Hispanic children (OR: 1.1, 95% CI 1.0‐1.10) (Table 3). Similar multivariable findings were observed in sensitivity analysis using the 75th percentile of LOS (4 days) as the model outcome.
| Characteristic | Odds Ratio (95% CI) of LOS 10 Days | P Value |
|---|---|---|
| ||
| Use of intensive care | 3.5 (3.4‐3.5) | <0.001 |
| Transfer from another acute‐care hospital | 2.1 (2.0‐2.1) | <0.001 |
| Procedure/surgery | 1.8 (1.8‐1.9) | <0.001 |
| Complex chronic condition | ||
| Respiratory | 2.7 (2.6‐2.7) | <0.001 |
| Gastrointestinal | 1.8 (1.8‐1.8) | <0.001 |
| Metabolic | 1.7 (1.7‐1.7) | <0.001 |
| Cardiovascular | 1.6 (1.5‐1.6) | <0.001 |
| Neonatal | 1.5 (1.5‐1.5) | <0.001 |
| Renal | 1.4 (1.4‐1.4) | <0.001 |
| Transplant | 1.4 (1.4‐1.4) | <0.001 |
| Hematology and immunodeficiency | 1.3 (1.3‐1.3) | <0.001 |
| Technology assistance | 1.1 (1.1, 1.1) | <0.001 |
| Neuromuscular | 0.9 (0.9‐0.9) | <0.001 |
| Congenital or genetic defect | 0.8 (0.8‐0.8) | <0.001 |
| Age at admission, y | ||
| <1 | 1.2 (1.2‐1.3) | <0.001 |
| 14 | 0.5 (0.5‐0.5) | <0.001 |
| 59 | 0.6 (0.6‐0.6) | <0.001 |
| 1018 | 0.9 (0.9‐0.9) | <0.001 |
| 18+ | Reference | |
| Male | 0.9 (0.9‐0.9) | <0.001 |
| Race/ethnicity | ||
| Non‐Hispanic black | 0.9 (0.9‐0.9) | <0.001 |
| Hispanic | 1.1 (1.0‐1.1) | <0.001 |
| Asian | 1.0 (1.0‐1.1) | 0.3 |
| Other | 1.1 (1.1‐1.1) | <0.001 |
| Non‐Hispanic white | Reference | |
| Payor | ||
| Private | 0.9 (0.8 0.9) | <0.001 |
| Other | 1.0 (1.0‐1.0) | 0.4 |
| Government | Reference | |
| Season | ||
| Spring | 1.0 (1.0 1.0) | <0.001 |
| Summer | 0.9 (0.9‐0.9) | <0.001 |
| Fall | 1.0 (0.9‐1.0) | <0.001 |
| Winter | Reference | |
Variation in the Prevalence of Long LOS Across Children's Hospitals
After controlling for demographic, clinical, and hospital characteristics associated with long LOS, there was significant (P < 0.001) variation in the prevalence of long LOS for CMC across children's hospitals in the cohort (range, 10.3%21.8%) (Figure 1). Twelve (27%) hospitals had a significantly (P < 0.001) higher prevalence of long LOS for their hospitalized CMC, compared to the mean. Eighteen (41%) had a significantly (P < 0.001) lower prevalence of long LOS for their hospitalized CMC. There was also significant variation across hospitals with respect to cost, with 49.7% to 73.7% of all hospital costs of CMC attributed to long LOS hospitalizations. Finally, there was indirect correlation with the prevalence of LOS across hospitals and the hospitals' 30‐day readmission rate ( = 0.3; P = 0.04). As the prevalence of long LOS increased, the readmission rate decreased.
DISCUSSION
The main findings from this study suggest that a small percentage of CMC experiencing long LOS account for the majority of hospital bed days and cost of all hospitalized CMC in children's hospitals. The likelihood of long LOS varies significantly by CMC's age, race/ethnicity, and payor as well as by type and number of chronic conditions. Among CMC with long LOS, the use of gastrointestinal devices such as gastrostomy tubes, as well as congenital heart disease, were highly prevalent. In multivariable analysis, the characteristics most strongly associated with LOS 10 days were use of the ICU, respiratory complex chronic condition, and transfer from another medical facility at admission. After adjusting for these factors, there was significant variation in the prevalence of LOS 10 days for CMC across children's hospitals.
Although it is well known that CMC as a whole have a major impact on resource use in children's hospitals, this study reveals that 15% of hospitalizations of CMC account for 62% of all hospital costs of CMC. That is, a small fraction of hospitalizations of CMC is largely responsible for the significant financial impact of hospital resource use. To date, most clinical efforts and policies striving to reduce hospital use in CMC have focused on avoiding readmissions or index hospital admissions entirely, rather than improving the efficiency of hospital care after admission occurs.[23, 24, 25, 26] In the adult population, the impact of long LOS on hospital costs has been recognized, and several Medicare incentive programs have focused on in‐hospital timeliness and efficiency. As a result, LOS in Medicare beneficiaries has decreased dramatically over the past 2 decades.[27, 28, 29, 30] Optimizing the efficiency of hospital care for CMC may be an important goal to pursue, especially with precedent set in the adult literature.
Perhaps the substantial variation across hospitals in the prevalence of long LOS in CMC indicates opportunity to improve the efficiency of their inpatient care. This variation was not due to differences across hospitals' case mix of CMC. Further investigation is needed to determine how much of it is due to differences in quality of care. Clinical practice guidelines for hospital treatment of common illnesses usually exclude CMC. In our clinical experience across 9 children's hospitals, we have experienced varying approaches to setting discharge goals (ie, parameters on how healthy the child needs to be to ensure a successful hospital discharge) for CMC.[31] When the goals are absent or not clearly articulated, they can contribute to a prolonged hospitalization. Some families of CMC report significant issues when working with pediatric hospital staff to assess their child's discharge readiness.[7, 32, 33] In addition, there is significant variation across states and regions in access to and quality of post‐discharge health services (eg, home nursing, postacute care, durable medical equipment).[34, 35] In some areas, many CMC are not actively involved with their primary care physician.[5] These issues might also influence the ability of some children's hospitals to efficiently discharge CMC to a safe and supportive post‐discharge environment. Further examination of hospital outliersthose with the lowest and highest percentage of CMC hospitalizations with long LOSmay reveal opportunities to identify and spread best practices.
The demographic and clinical factors associated with long LOS in the present study, including age, ICU use, and transfer from another hospital, might help hospitals target which CMC have the greatest risk for experiencing long LOS. We found that infants age <1 year had longer LOS when compared with older children. Similar to our findings, younger‐aged children hospitalized with bronchiolitis have longer LOS.[36] Certainly, infants with medical complexity, in general, are a high‐acuity population with the potential for rapid clinical deterioration during an acute illness. Prolonged hospitalization for treatment and stabilization may be expected for many of them. Additional investigation is warranted to examine ICU use in CMC, and whether ICU admission or duration can be safely prevented or abbreviated. Opportunities to assess the quality of transfers into children's hospitals of CMC admitted to outside hospitals may be necessary. A study of pediatric burn patients reported that patients initially stabilized at a facility that was not a burn center and subsequently transferred to a burn center had a longer LOS than patients solely treated at a designated burn center.[37] Furthermore, events during transport itself may adversely impact the stability of an already fragile patient. Interventions to optimize the quality of care provided by transport teams have resulted in decreased LOS at the receiving hospital.[38]
This study's findings should be considered in the context of several limitations. Absent a gold‐standard definition of long LOS, we used the distribution of LOS across patients to inform our methods; LOS at the 90th percentile was selected as long. Although our sensitivity analysis using LOS at the 75th percentile produced similar findings, other cut points in LOS might be associated with different results. The study is not positioned to determine how much of the reported LOS was excessive, unnecessary, or preventable. The study findings may not generalize to types of hospitals not contained in PHIS (eg, nonchildren's hospitals and community hospitals). We did not focus on the impact of a new diagnosis (eg, new chronic illness) or acute in‐hospital event (eg, nosocomial infection) on prolonged LOS; future studies should investigate these clinical events with LOS.
PHIS does not contain information regarding characteristics that could influence LOS, including the children's social and familial attributes, transportation availability, home equipment needs, and local availability of postacute care facilities. Moreover, PHIS does not contain information about the hospital discharge procedures, process, or personnel across hospitals, which could influence LOS. Future studies on prolonged LOS should consider assessing this information. Because of the large sample size of hospitalizations included, the statistical power for the analyses was strong, rendering it possible that some findings that were statistically significant might have modest clinical significance (eg, relationship of Hispanic ethnicity with prolonged LOS). We could not determine why a positive correlation was not observed between hospitals' long LOS prevalence and their percentage of cost associated with long LOS; future studies should investigate the reasons for this finding.
Despite these limitations, the findings of the present study highlight the significance of long LOS in hospitalized CMC. These long hospitalizations account for a significant proportion of all hospital costs for this important population of children. The prevalence of long LOS for CMC varies considerably across children's hospitals, even after accounting for the case mix. Efforts to curtail hospital resource use and costs for CMC may benefit from focus on long LOS.
- , , , et al. Inpatient growth and resource use in 28 children's hospitals: a longitudinal, multi‐institutional study. JAMA Pediatr. 2013;167(2):170–177.
- , , , et al. Children with complex chronic conditions in inpatient hospital settings in the united states. Pediatrics. 2010;126(4):647–655.
- , . Meeting the health care needs of persons with disabilities. Milbank Q. 2002;80(2):381–391.
- , , , et al. Effect of an enhanced medical home on serious illness and cost of care among high‐risk children with chronic illness: a randomized clinical trial. JAMA. 2014;312(24):2640–2648.
- , , , et al. Children with medical complexity and Medicaid: spending and cost savings. Health Aff Proj Hope. 2014;33(12):2199–2206.
- Children's Hospital Association. CARE Award. Available at: https://www.childrenshospitals.org/Programs‐and‐Services/Quality‐Improvement‐and‐Measurement/CARE‐Award. Accessed December 18, 2015.
- , , , et al. Hospital readmission and parent perceptions of their child's hospital discharge. Int J Qual Health Care. 2013;25(5):573–581.
- , , , et al. Weekend matters: Friday and Saturday admissions are associated with prolonged hospitalization of children. Clin Pediatr (Phila). 2013;52(9):875–878.
- , , , . Attributable cost and length of stay for central line‐associated bloodstream infections. Pediatrics. 2014;133(6):e1525–e1532.
- , , , et al. Effect of healthcare‐acquired infection on length of hospital stay and cost. Infect Control Hosp Epidemiol. 2007;28(3):280–292.
- , , , , . Hospital utilization and costs among children with influenza, 2003. Am J Prev Med. 2009;36(4):292–296.
- , , , . Charges and lengths of stay attributable to adverse patient‐care events using pediatric‐specific quality indicators: a multicenter study of freestanding children's hospitals. Pediatrics. 2008;121(6):e1653–e1659.
- , , , , . Variation in resource utilization for the management of uncomplicated community‐acquired pneumonia across community and children's hospitals. J Pediatr. 2014;165(3):585–591.
- , , , , . Variation and outcomes associated with direct hospital admission among children with pneumonia in the United States. JAMA Pediatr. 2014;168(9):829–836.
- , , , et al. Clinical Risk Groups (CRGs): a classification system for risk‐adjusted capitation‐based payment and health care management. Med Care. 2004;42(1):81–90.
- , , , et al. Identifying children with lifelong chronic conditions for care coordination by using hospital discharge data. Acad Pediatr. 2010;10(6):417–423.
- , , , , . Profile of medical charges for children by health status group and severity level in a Washington State Health Plan. Health Serv Res. 2004;39(1):73–89.
- , , , . Using medical billing data to evaluate chronically ill children over time. J Ambulatory Care Manage. 2006;29(4):283–290.
- , , , , , . Medical complexity and pediatric emergency department and inpatient utilization. Pediatrics. 2013;131(2):e559–e565.
- , , , , . Pediatric complex chronic conditions classification system version 2: updated for ICD‐10 and complex medical technology dependence and transplantation. BMC Pediatr. 2014;14:199.
- . Analyzing intensive care unit length of stay data: problems and possible solutions. Crit Care Med. 1997;25(9):1594–1600.
- , , , et al. Hospital utilization and characteristics of patients experiencing recurrent readmissions within children's hospitals. JAMA. 2011;305(7):682–690.
- . Hospital readmissions and repeat emergency department visits among children with medical complexity: an integrative review. J Pediatr Nurs. 2013;28(4):316–339.
- , , , . Hospital readmission in children with complex chronic conditions discharged from subacute care. Hosp Pediatr. 2014;4(3):153–158.
- , , , et al. Preventing hospitalizations in children with medical complexity: a systematic review. Pediatrics. 2014;134(6):e1628–e1647.
- , , , . Hospital readmissions for newly discharged pediatric home mechanical ventilation patients. Pediatr Pulmonol. 2012;47(4):409–414.
- , , , et al. Clinical characteristics and outcomes of Medicare patients undergoing total hip arthroplasty, 1991–2008. JAMA. 2011;305(15):1560–1567.
- , , , et al. Trends in length of stay and short‐term outcomes among Medicare patients hospitalized for heart failure, 1993–2006. JAMA. 2010;303(21):2141–2147.
- U.S. Department of Health and Human Services. CMS Statistics 2013. Available at: https://www.cms.gov/Research‐Statistics‐Data‐and‐Systems/Statistics‐Trends‐and‐Reports/CMS‐Statistics‐Reference‐Booklet/Downloads/CMS_Stats_2013_final.pdf. Published August 2013. Accessed October 6, 2015.
- Centers for Medicare and Medicaid Services. Evaluation of the premier hospital quality incentive demonstration. Available at: https://www.cms.gov/Research‐Statistics‐Data‐and‐Systems/Statistics‐Trends‐and‐Reports/Reports/downloads/Premier_ExecSum_2010.pdf. Published March 3, 2009. Accessed September 18, 2015.
- , , , et al. A framework of pediatric hospital discharge care informed by legislation, research, and practice. JAMA Pediatr. 2014;168(10):955–962; quiz 965–966.
- , , , , . Parent and provider perspectives on pediatric readmissions: what can we learn about readiness for discharge? Hosp Pediatr. 2015;5(11):559–565.
- , . Preventing readmissions in children: how do we do that? Hosp Pediatr. 2015;5(11):602–604.
- , , . Pediatric post‐acute hospital care: striving for identity and value. Hosp Pediatr. 2015;5(10):548–551.
- , , , et al. Pediatric hospital discharges to home health and postacute facility care: a national study. JAMA Pediatr. 2016;170(4):326–333.
- , , , et al. Bronchiolitis: clinical characteristics associated with hospitalization and length of stay. Pediatr Emerg Care. 2012;28(2):99–103.
- , , , , . The effect of transfers between health care facilities on costs and length of stay for pediatric burn patients. J Burn Care Res. 2015;36(1):178–183.
- , , , et al. Goal‐directed resuscitative interventions during pediatric interfacility transport. Crit Care Med. 2015;43(8):1692–1698.

Impact of Pneumonia Guidelines
Overutilization of resources is a significant, yet underappreciated, problem in medicine. Many interventions target underutilization (eg, immunizations) or misuse (eg, antibiotic prescribing for viral pharyngitis), yet overutilization remains as a significant contributor to healthcare waste.[1] In an effort to reduce waste, the Choosing Wisely campaign created a work group to highlight areas of overutilization, specifically noting both diagnostic tests and therapies for common pediatric conditions with no proven benefit and possible harm to the patient.[2] Respiratory illnesses have been a target of many quality‐improvement efforts, and pneumonia represents a common diagnosis in pediatrics.[3] The use of diagnostic testing for pneumonia is an area where care can be optimized and aligned with evidence.
Laboratory testing and diagnostic imaging are routinely used for the management of children with community‐acquired pneumonia (CAP). Several studies have documented substantial variability in the use of these resources for pneumonia management, with higher resource use associated with a higher chance of hospitalization after emergency department (ED) evaluation and a longer length of stay among those requiring hospitalization.[4, 5] This variation in diagnostic resource utilization has been attributed, at least in part, to a lack of consensus on the management of pneumonia. There is wide variability in diagnostic testing, and due to potential consequences for patients presenting with pneumonia, efforts to standardize care offer an opportunity to improve healthcare value.
In August 2011, the first national, evidence‐based consensus guidelines for the management of childhood CAP were published jointly by the Pediatric Infectious Diseases Society (PIDS) and the Infectious Diseases Society of America (IDSA).[6] A primary focus of these guidelines was the recommendation for the use of narrow spectrum antibiotics for the management of uncomplicated pneumonia. Previous studies have assessed the impact of the publication of the PIDS/IDSA guidelines on empiric antibiotic selection for the management of pneumonia.[7, 8] In addition, the guidelines provided recommendations regarding diagnostic test utilization, in particular discouraging blood tests (eg, complete blood counts) and radiologic studies for nontoxic, fully immunized children treated as outpatients, as well as repeat testing for children hospitalized with CAP who are improving.
Although single centers have demonstrated changes in utilization patterns based on clinical practice guidelines,[9, 10, 11, 12] whether these guidelines have impacted diagnostic test utilization among US children with CAP in a larger scale remains unknown. Therefore, we sought to determine the impact of the PIDS/IDSA guidelines on the use of diagnostic testing among children with CAP using a national sample of US children's hospitals. Because the guidelines discourage repeat diagnostic testing in patients who are improving, we also evaluated the association between repeat diagnostic studies and severity of illness.
METHODS
This retrospective cohort study used data from the Pediatric Health Information System (PHIS) (Children's Hospital Association, Overland Park, KS). The PHIS database contains deidentified administrative data, detailing demographic, diagnostic, procedure, and billing data from 47 freestanding, tertiary care children's hospitals. This database accounts for approximately 20% of all annual pediatric hospitalizations in the United States. Data quality is ensured through a joint effort between the Children's Hospital Association and participating hospitals.
Patient Population
Data from 32 (of the 47) hospitals included in PHIS with complete inpatient and ED data were used to evaluate hospital‐level resource utilization for children 1 to 18 years of age discharged January 1, 2008 to June 30, 2014 with a diagnosis of pneumonia (International Classification of Diseases, 9th Revision [ICD‐9] codes 480.x‐486.x, 487.0).[13] Our goal was to identify previously healthy children with uncomplicated pneumonia, so we excluded patients with complex chronic conditions,[14] billing charges for intensive care management and/or pleural drainage procedure (IDC‐9 codes 510.0, 510.9, 511.0, 511.1, 511.8, 511.9, 513.x) on day of admission or the next day, or prior pneumonia admission in the last 30 days. We studied 2 mutually exclusive populations: children with pneumonia treated in the ED (ie, patients who were evaluated in the ED and discharged to home), and children hospitalized with pneumonia, including those admitted through the ED.
Guideline Publication and Study Periods
For an exploratory before and after comparison, patients were grouped into 2 cohorts based on a guideline online publication date of August 1, 2011: preguideline (January 1, 2008 to July 31, 2011) and postguideline (August 1, 2011 to June 30, 2014).
Study Outcomes
The measured outcomes were the monthly proportion of pneumonia patients for whom specific diagnostic tests were performed, as determined from billing data. The diagnostic tests evaluated were complete blood count (CBC), blood culture, C‐reactive protein (CRP), and chest radiograph (CXR). Standardized costs were also calculated from PHIS charges as previously described to standardize the cost of the individual tests and remove interhospital cost variation.[3]
Relationship of Repeat Testing and Severity of Illness
Because higher illness severity and clinical deterioration may warrant repeat testing, we also explored the association of repeat diagnostic testing for inpatients with severity of illness by using the following variables as measures of severity: length of stay (LOS), transfer to intensive care unit (ICU), or pleural drainage procedure after admission (>2 calendar days after admission). Repeat diagnostic testing was stratified by number of tests.
Statistical Analysis
The categorical demographic characteristics of the pre‐ and postguideline populations were summarized using frequencies and percentages, and compared using 2 tests. Continuous demographics were summarized with medians and interquartile ranges (IQRs) and compared with the Wilcoxon rank sum test. Segmented regression, clustered by hospital, was used to assess trends in monthly resource utilization as well as associated standardized costs before and after guidelines publication. To estimate the impact of the guidelines overall, we compared the observed diagnostic resource use at the end of the study period with expected use projected from trends in the preguidelines period (ie, if there were no new guidelines). Individual interrupted time series were also built for each hospital. From these models, we assessed which hospitals had a significant difference between the rate observed at the end of the study and that estimated from their preguideline trajectory. To assess the relationship between the number of positive improvements at a hospital and hospital characteristics, we used Spearman's correlation and Kruskal‐Wallis tests. All analyses were performed with SAS version 9.3 (SAS Institute, Inc., Cary, NC), and P values <0.05 were considered statistically significant. In accordance with the policies of the Cincinnati Children's Hospital Medical Center Institutional Review Board, this research, using a deidentified dataset, was not considered human subjects research.
RESULTS
There were 275,288 hospital admissions meeting study inclusion criteria of 1 to 18 years of age with a diagnosis of pneumonia from 2008 to 2014. Of these, 54,749 met exclusion criteria (1874 had pleural drainage procedure on day 0 or 1, 51,306 had complex chronic conditions, 1569 were hospitalized with pneumonia in the last 30 days). Characteristics of the remaining 220,539 patients in the final sample are shown in Table 1. The median age was 4 years (IQR, 27 years); a majority of the children were male (53%) and had public insurance (58%). There were 128,855 patients in the preguideline period (January 1, 2008 to July 31, 2011) and 91,684 in the post guideline period (August 1, 2011June 30, 2014).
| Overall | Preguideline | Postguideline | P | |
|---|---|---|---|---|
| ||||
| No. of discharges | 220,539 | 128,855 | 91,684 | |
| Type of encounter | ||||
| ED only | 150,215 (68.1) | 88,790 (68.9) | 61,425 (67) | <0.001 |
| Inpatient | 70,324 (31.9) | 40,065 (31.1) | 30,259 (33) | |
| Age | ||||
| 14 years | 129,360 (58.7) | 77,802 (60.4) | 51,558 (56.2) | <0.001 |
| 59 years | 58,609 (26.6) | 32,708 (25.4) | 25,901 (28.3) | |
| 1018 years | 32,570 (14.8) | 18,345 (14.2) | 14,225 (15.5) | |
| Median [IQR] | 4 [27] | 3 [27] | 4 [27] | <0.001 |
| Gender | ||||
| Male | 116,718 (52.9) | 68,319 (53) | 48,399 (52.8) | 00.285 |
| Female | 103,813 (47.1) | 60,532 (47) | 43,281 (47.2) | |
| Race | ||||
| Non‐Hispanic white | 84,423 (38.3) | 47,327 (36.7) | 37,096 (40.5) | <0.001 |
| Non‐Hispanic black | 60,062 (27.2) | 35,870 (27.8) | 24,192 (26.4) | |
| Hispanic | 51,184 (23.2) | 31,167 (24.2) | 20,017 (21.8) | |
| Asian | 6,444 (2.9) | 3,691 (2.9) | 2,753 (3) | |
| Other | 18,426 (8.4) | 10,800 (8.4) | 7,626 (8.3) | |
| Payer | ||||
| Government | 128,047 (58.1) | 70,742 (54.9) | 57,305 (62.5) | <0.001 |
| Private | 73,338 (33.3) | 44,410 (34.5) | 28,928 (31.6) | |
| Other | 19,154 (8.7) | 13,703 (10.6) | 5,451 (5.9) | |
| Disposition | ||||
| HHS | 684 (0.3) | 411 (0.3) | 273 (0.3) | <0.001 |
| Home | 209,710 (95.1) | 123,236 (95.6) | 86,474 (94.3) | |
| Other | 9,749 (4.4) | 4,962 (3.9) | 4,787 (5.2) | |
| SNF | 396 (0.2) | 246 (0.2) | 150 (0.2) | |
| Season | ||||
| Spring | 60,171 (27.3) | 36,709 (28.5) | 23,462 (25.6) | <0.001 |
| Summer | 29,891 (13.6) | 17,748 (13.8) | 12,143 (13.2) | |
| Fall | 52,161 (23.7) | 28,332 (22) | 23,829 (26) | |
| Winter | 78,316 (35.5) | 46,066 (35.8) | 32,250 (35.2) | |
| LOS | ||||
| 13 days | 204,812 (92.9) | 119,497 (92.7) | 85,315 (93.1) | <0.001 |
| 46 days | 10,454 (4.7) | 6,148 (4.8) | 4,306 (4.7) | |
| 7+ days | 5,273 (2.4) | 3,210 (2.5) | 2,063 (2.3) | |
| Median [IQR] | 1 [11] | 1 [11] | 1 [11] | 0.144 |
| Admitted patients, median [IQR] | 2 [13] | 2 [13] | 2 [13] | <0.001 |
Discharged From the ED
Throughout the study, utilization of CBC, blood cultures, and CRP was <20%, whereas CXR use was >75%. In segmented regression analysis, CRP utilization was relatively stable before the guidelines publication. However, by the end of the study period, the projected estimate of CRP utilization without guidelines (expected) was 2.9% compared with 4.8% with the guidelines (observed) (P < 0.05) (Figure 1). A similar pattern of higher rates of diagnostic utilization after the guidelines compared with projected estimates without the guidelines was also seen in the ED utilization of CBC, blood cultures, and CXR (Figure 1); however, these trends did not achieve statistical significance. Table 2 provides specific values. Using a standard cost of $19.52 for CRP testing, annual costs across all hospitals increased $11,783 for ED evaluation of CAP.
Baseline (%) | Preguideline Trend | Level Change at Guideline | Change in Trend After Guideline | Estimates at End of Study* | |||
|---|---|---|---|---|---|---|---|
Without Guideline (%) | With Guideline (%) | P | |||||
| |||||||
| ED‐only encounters | |||||||
| Blood culture | 14.6 | 0.1 | 0.8 | 0.1 | 5.5 | 8.6 | NS |
| CBC | 19.2 | 0.1 | 0.4 | 0.1 | 10.7 | 14.0 | NS |
| CRP | 5.4 | 0.0 | 0.6 | 0.1 | 2.9 | 4.8 | <0.05 |
| Chest x‐ray | 85.4 | 0.1 | 0.1 | 0.0 | 80.9 | 81.1 | NS |
| Inpatient encounters | |||||||
| Blood culture | 50.6 | 0.0 | 1.7 | 0.2 | 49.2 | 41.4 | <0.05 |
| Repeat blood culture | 6.5 | 0.0 | 1.0 | 0.1 | 8.9 | 5.8 | NS |
| CBC | 65.2 | 0.0 | 3.1 | 0.0 | 65.0 | 62.2 | NS |
| Repeat CBC | 23.4 | 0.0 | 4.2 | 0.0 | 20.8 | 16.0 | NS |
| CRP | 25.7 | 0.0 | 1.1 | 0.0 | 23.8 | 23.5 | NS |
| Repeat CRP | 12.5 | 0.1 | 2.2 | 0.1 | 7.1 | 7.3 | NS |
| Chest x‐ray | 89.4 | 0.1 | 0.7 | 0.0 | 85.4 | 83.9 | NS |
| Repeat chest x‐ray | 25.5 | 0.0 | 2.0 | 0.1 | 24.1 | 17.7 | <0.05 |
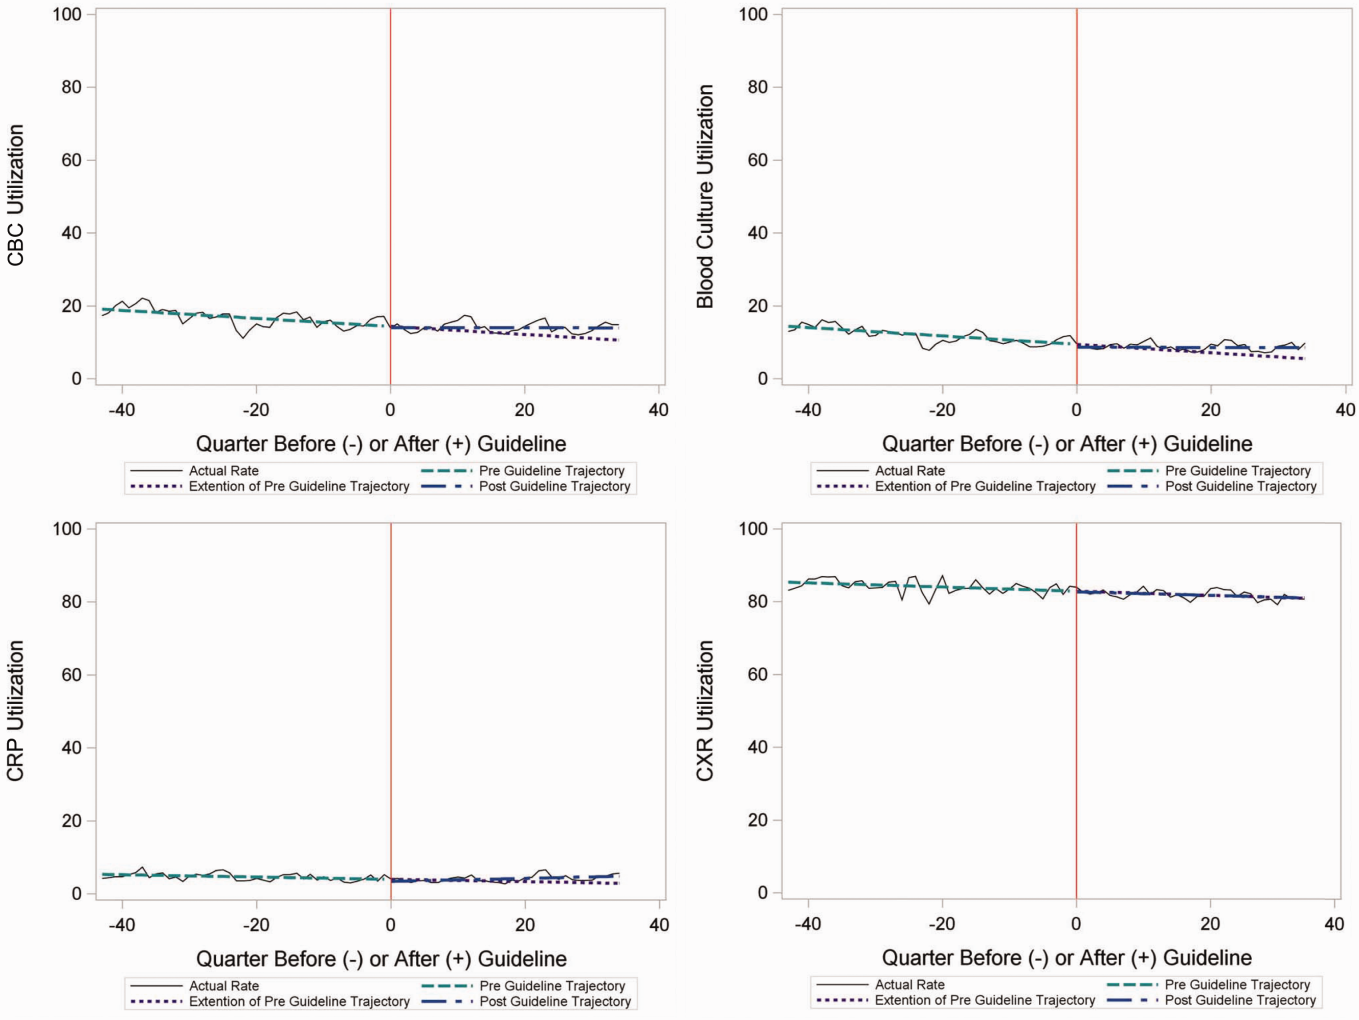
Inpatient Encounters
In the segmented regression analysis of children hospitalized with CAP, guideline publication was associated with changes in the monthly use of some diagnostic tests. For example, by the end of the study period, the use of blood culture was 41.4% (observed), whereas the projected estimated use in the absence of the guidelines was 49.2% (expected) (P < 0.05) (Figure 2). Table 2 includes the data for the other tests, CBC, CRP, and CXR, in which similar patterns are noted with lower utilization rates after the guidelines, compared with expected utilization rates without the guidelines; however, these trends did not achieve statistical significance. Evaluating the utilization of repeat testing for inpatients, only repeat CXR achieved statistical significance (P < 0.05), with utilization rates of 17.7% with the guidelines (actual) compared with 24.1% without the guidelines (predicted).
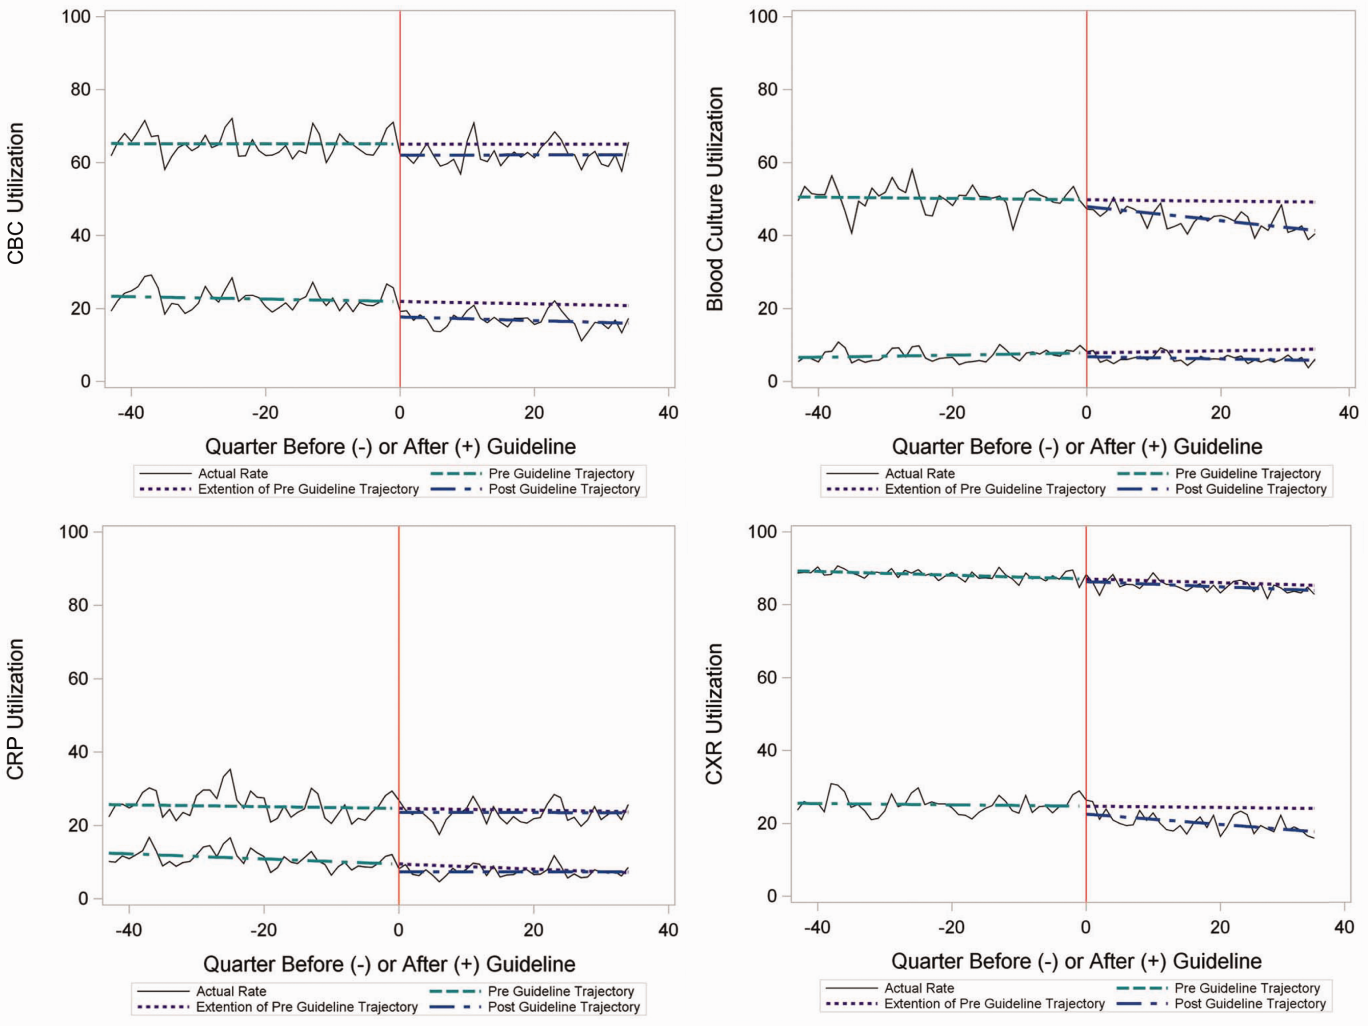
To better understand the use of repeat testing, a comparison of severity outcomesLOS, ICU transfer, and pleural drainage procedureswas performed between patients with no repeat testing (70%) and patients with 1 or more repeat tests (30%). Patients with repeat testing had longer LOS (no repeat testing LOS 1 [IQR, 12]) versus 1 repeat test LOS 3 ([IQR, 24] vs 2+ repeat tests LOS 5 [IQR, 38]), higher rate of ICU transfer (no repeat testing 4.6% vs 1 repeat test 14.6% vs 2+ repeat test 35.6%), and higher rate of pleural drainage (no repeat testing 0% vs 1 repeat test 0.1% vs 2+ repeat test 5.9%] (all P < 0.001).
Using standard costs of $37.57 for blood cultures and $73.28 for CXR, annual costs for children with CAP across all hospitals decreased by $91,512 due to decreased utilization of blood cultures, and by $146,840 due to decreased utilization of CXR.
Hospital‐Level Variation in the Impact of the National Guideline
Figure 3 is a visual representation (heat map) of the impact of the guidelines at the hospital level at the end of the study from the individual interrupted time series. Based on this heat map (Figure 3), there was wide variability between hospitals in the impact of the guideline on each test in different settings (ED or inpatient). By diagnostic testing, 7 hospitals significantly decreased utilization of blood cultures for inpatients, and 5 hospitals significantly decreased utilization for repeat blood cultures and repeat CXR. Correlation between the number of positive improvements at a hospital and region (P = 0.974), number of CAP cases (P = 0.731), or percentage of public insurance (P = 0.241) were all nonsignificant.
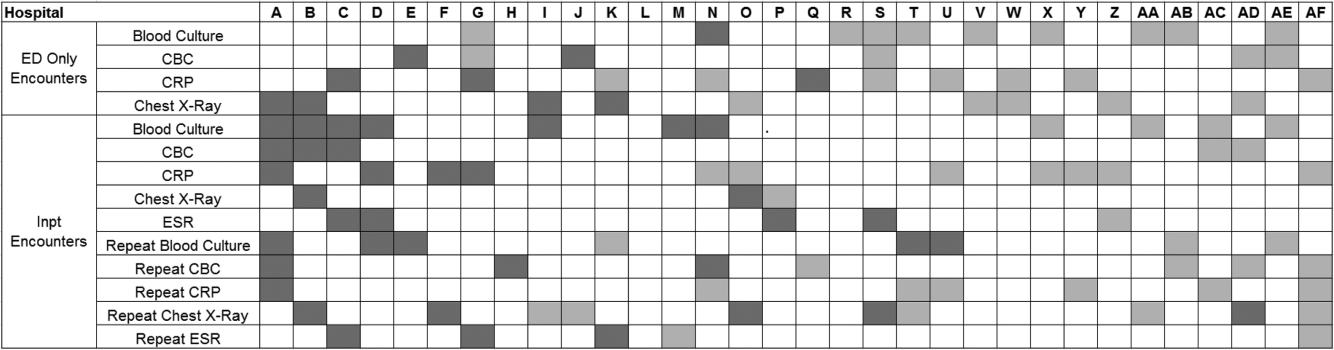
DISCUSSION
This study complements previous assessments by evaluating the impact of the 2011 IDSA/PIDS consensus guidelines on the management of children with CAP cared for at US children's hospitals. Prior studies have shown increased use of narrow‐spectrum antibiotics for children with CAP after the publication of these guidelines.[7] The current study focused on diagnostic testing for CAP before and after the publication of the 2011 guidelines. In the ED setting, use of some diagnostic tests (blood culture, CBC, CXR, CRP) was declining prior to guideline publication, but appeared to plateau and/or increase after 2011. Among children admitted with CAP, use of diagnostic testing was relatively stable prior to 2011, and use of these tests (blood culture, CBC, CXR, CRP) declined after guideline publication. Overall, changes in diagnostic resource utilization 3 years after publication were modest, with few changes achieving statistical significance. There was a large variability in the impact of guidelines on test use between hospitals.
For outpatients, including those managed in the ED, the PIDS/IDSA guidelines recommend limited laboratory testing in nontoxic, fully immunized patients. The guidelines discourage the use of diagnostic testing among outpatients because of their low yield (eg, blood culture), and because test results may not impact management (eg, CBC).[6] In the years prior to guideline publication, there was already a declining trend in testing rates, including blood cultures, CBC, and CRP, for patients in the ED. After guideline publication, the rate of blood cultures, CBC, and CRP increased, but only the increase in CRP utilization achieved statistical significance. We would not expect utilization for common diagnostic tests (eg, CBC for outpatients with CAP) to be at or close to 0% because of the complexity of clinical decision making regarding admission that factors in aspects of patient history, exam findings, and underlying risk.[15] ED utilization of blood cultures was <10%, CBC <15%, and CRP <5% after guideline publication, which may represent the lowest testing limit that could be achieved.
CXRs obtained in the ED did not decrease over the entire study period. The rates of CXR use (close to 80%) seen in our study are similar to prior ED studies.[5, 16] Management of children with CAP in the ED might be different than outpatient primary care management because (1) unlike primary care providers, ED providers do not have an established relationship with their patients and do not have the opportunity for follow‐up and serial exams, making them less likely to tolerate diagnostic uncertainty; and (2) ED providers may see sicker patients. However, use of CXR in the ED does represent an opportunity for further study to understand if decreased utilization is feasible without adversely impacting clinical outcomes.
The CAP guidelines provide a strong recommendation to obtain blood culture in moderate to severe pneumonia. Despite this, blood culture utilization declined after guideline publication. Less than 10% of children hospitalized with uncomplicated CAP have positive blood cultures, which calls into question the utility of blood cultures for all admitted patients.[17, 18, 19] The recent EPIC (Epidemiology of Pneumonia in the Community) study showed that a majority of children hospitalized with pneumonia do not have growth of bacteria in culture, but there may be a role for blood cultures in patients with a strong suspicion of complicated CAP or in the patient with moderate to severe disease.[20] In addition to blood cultures, the guidelines also recommend CBC and CXR in moderate to severely ill children. This observed decline in testing in CBC and CXR may be related to individual physician assessments of which patients are moderately to severely ill, as the guidelines do not recommend testing for children with less severe disease. Our exclusion of patients requiring intensive care management or pleural drainage on admission might have selected children with a milder course of illness, although still requiring admission.
The guidelines discourage repeat diagnostic testing among children hospitalized with CAP who are improving. In this study, repeat CXR and CBC occurred in approximately 20% of patients, but repeat blood culture and CRP was much lower. As with initial diagnostic testing for inpatients with CAP, the rates of some repeat testing decreased with the guidelines. However, those with repeat testing had longer LOS and were more likely to require ICU transfer or a pleural drainage procedure compared to children without repeat testing. This suggests that repeat testing is used more often in children with a severe presentation or a worsening clinical course, and not done routinely on hospitalized patients.
The financial impact of decreased testing is modest, because the tests themselves are relatively inexpensive. However, the lack of substantial cost savings should not preclude efforts to continue to improve adherence to the guidelines. Not only is increased testing associated with higher hospitalization rates,[5] potentially yielding higher costs and family stress, increased testing may also lead to patient discomfort and possibly increased radiation exposure through chest radiography.
Many of the diagnostic testing recommendations in the CAP guidelines are based on weak evidence, which may contribute to the lack of substantial adoption. Nevertheless, adherence to guideline recommendations requires sustained effort on the part of individual physicians that should be encouraged through institutional support.[21] Continuous education and clinical decision support, as well as reminders in the electronic medical record, would make guideline recommendations more visible and may help overcome the inertia of previous practice.[15] The hospital‐level heat map (Figure 3) included in this study demonstrates that the impact of the guidelines was variable across sites. Although a few sites had decreased diagnostic testing in many areas with no increased testing in any category, there were several sites that had no improvement in any diagnostic testing category. In addition, hospital‐level factors like size, geography, and insurance status were not associated with number of improvements. To better understand drivers of change at individual hospitals, future studies should evaluate specific strategies utilized by the rapid guideline adopters.
This study is subject to several limitations. The use of ICD‐9 codes to identify patients with CAP may not capture all patients with this diagnosis; however, these codes have been previously validated.[13] Additionally, because patients were identified using ICD‐9 coding assigned at the time of discharge, testing performed in the ED setting may not reflect care for a child with known pneumonia, but rather may reflect testing for a child with fever or other signs of infection. PHIS collects data from freestanding children's hospitals, which care for a majority of children with CAP in the US, but our findings may not be generalizable to other hospitals. In addition, we did not examine drivers of trends within individual institutions. We did not have detailed information to examine whether the PHIS hospitals in our study had actively worked to adopt the CAP guidelines. We were also unable to assess physician's familiarity with guidelines or the level of disagreement with the recommendations. Furthermore, the PHIS database does not permit detailed correlation of diagnostic testing with clinical parameters. In contrast to the diagnostic testing evaluated in this study, which is primarily discouraged by the IDSA/PIDS guidelines, respiratory viral testing for children with CAP is recommended but could not be evaluated, as data on such testing are not readily available in PHIS.
CONCLUSION
Publication of the IDSA/PIDS evidence‐based guidelines for the management of CAP was associated with modest, variable changes in use of diagnostic testing. Further adoption of the CAP guidelines should reduce variation in care and decrease unnecessary resource utilization in the management of CAP. Our study demonstrates that efforts to promote decreased resource utilization should target specific situations (eg, repeat testing for inpatients who are improving). Adherence to guidelines may be improved by the adoption of local practices that integrate and improve daily workflow, like order sets and clinical decision support tools.
Disclosure: Nothing to report.
- , . Eliminating waste in US health care. JAMA. 2012;307(14):1513–1516.
- , , , et al. Choosing wisely in pediatric hospital medicine: five opportunities for improved healthcare value. J Hosp Med. 2013;8(9):479–485.
- , , , et al.; Pediatric Research in Inpatient Settings (PRIS) Network. Prioritization of comparative effectiveness research topics in hospital pediatrics. Arch Pediatr Adolesc Med. 2012;166(12):1155–1164.
- , , , et al. Variability in processes of care and outcomes among children hospitalized with community‐acquired pneumonia. Pediatr Infect Dis J. 2012;31(10):1036–1041.
- , , , , . Variation in emergency department diagnostic testing and disposition outcomes in pneumonia. Pediatrics. 2013;132(2):237–244.
- , , , et al.; Pediatric Infectious Diseases Society and the Infectious Diseases Society of America. The management of community‐acquired pneumonia in infants and children older than 3 months of age: clinical practice guidelines by the Pediatric Infectious Diseases Society and the Infectious Diseases Society of America. Clin Infect Dis. 2011;53(7):e25–e76.
- , , , et al., Impact of Infectious Diseases Society of America/Pediatric Infectious Diseases Society guidelines on treatment of community‐acquired pneumonia in hospitalized children. Clin Infect Dis. 2014;58(6):834–838.
- , , , et al. Antibiotic choice for children hospitalized with pneumonia and adherence to national guidelines. Pediatrics. 2015;136(1):44–52.
- , , , et al. Quality improvement methods increase appropriate antibiotic prescribing for childhood pneumonia. Pediatrics. 2013;131(5):e1623–e1631.
- , , , et al. Improvement methodology increases guideline recommended blood cultures in children with pneumonia. Pediatrics. 2015;135(4):e1052–e1059.
- , , , , , . Impact of a guideline on management of children hospitalized with community‐acquired pneumonia. Pediatrics. 2012;129(3):e597–e604.
- , , , . Effectiveness of antimicrobial guidelines for community‐acquired pneumonia in children. Pediatrics. 2012;129(5):e1326–e1333.
- , , , et al. Identifying pediatric community‐acquired pneumonia hospitalizations: accuracy of administrative billing codes. JAMA Pediatr. 2013;167(9):851–858.
- , , , , . Pediatric complex chronic conditions classification system version 2: updated for ICD‐10 and complex medical technology dependence and transplantation. BMC Pediatr. 2014;14:199.
- , . Establishing superior benchmarks of care in clinical practice: a proposal to drive achievable health care value. JAMA Pediatr. 2015;169(4):301–302.
- , , , . Emergency department management of childhood pneumonia in the United States prior to publication of national guidelines. Acad Emerg Med. 2013;20(3):240–246.
- , , , et al. Prevalence of bacteremia in hospitalized pediatric patients with community‐acquired pneumonia. Pediatr Infect Dis J. 2013;32(7):736–740.
- , , , , . The prevalence of bacteremia in pediatric patients with community‐acquired pneumonia: guidelines to reduce the frequency of obtaining blood cultures. Hosp Pediatr. 2013;3(2):92–96.
- . Do all children hospitalized with community‐acquired pneumonia require blood cultures? Hosp Pediatr. 2013;3(2):177–179.
- , , , et al.; CDC EPIC Study Team. Community‐acquired pneumonia requiring hospitalization among U.S. children. N Engl J Med. 2015;372(9):835–845.
- , , , et al. Influence of hospital guidelines on management of children hospitalized with pneumonia. Pediatrics. 2012;130(5):e823–e830.
Overutilization of resources is a significant, yet underappreciated, problem in medicine. Many interventions target underutilization (eg, immunizations) or misuse (eg, antibiotic prescribing for viral pharyngitis), yet overutilization remains as a significant contributor to healthcare waste.[1] In an effort to reduce waste, the Choosing Wisely campaign created a work group to highlight areas of overutilization, specifically noting both diagnostic tests and therapies for common pediatric conditions with no proven benefit and possible harm to the patient.[2] Respiratory illnesses have been a target of many quality‐improvement efforts, and pneumonia represents a common diagnosis in pediatrics.[3] The use of diagnostic testing for pneumonia is an area where care can be optimized and aligned with evidence.
Laboratory testing and diagnostic imaging are routinely used for the management of children with community‐acquired pneumonia (CAP). Several studies have documented substantial variability in the use of these resources for pneumonia management, with higher resource use associated with a higher chance of hospitalization after emergency department (ED) evaluation and a longer length of stay among those requiring hospitalization.[4, 5] This variation in diagnostic resource utilization has been attributed, at least in part, to a lack of consensus on the management of pneumonia. There is wide variability in diagnostic testing, and due to potential consequences for patients presenting with pneumonia, efforts to standardize care offer an opportunity to improve healthcare value.
In August 2011, the first national, evidence‐based consensus guidelines for the management of childhood CAP were published jointly by the Pediatric Infectious Diseases Society (PIDS) and the Infectious Diseases Society of America (IDSA).[6] A primary focus of these guidelines was the recommendation for the use of narrow spectrum antibiotics for the management of uncomplicated pneumonia. Previous studies have assessed the impact of the publication of the PIDS/IDSA guidelines on empiric antibiotic selection for the management of pneumonia.[7, 8] In addition, the guidelines provided recommendations regarding diagnostic test utilization, in particular discouraging blood tests (eg, complete blood counts) and radiologic studies for nontoxic, fully immunized children treated as outpatients, as well as repeat testing for children hospitalized with CAP who are improving.
Although single centers have demonstrated changes in utilization patterns based on clinical practice guidelines,[9, 10, 11, 12] whether these guidelines have impacted diagnostic test utilization among US children with CAP in a larger scale remains unknown. Therefore, we sought to determine the impact of the PIDS/IDSA guidelines on the use of diagnostic testing among children with CAP using a national sample of US children's hospitals. Because the guidelines discourage repeat diagnostic testing in patients who are improving, we also evaluated the association between repeat diagnostic studies and severity of illness.
METHODS
This retrospective cohort study used data from the Pediatric Health Information System (PHIS) (Children's Hospital Association, Overland Park, KS). The PHIS database contains deidentified administrative data, detailing demographic, diagnostic, procedure, and billing data from 47 freestanding, tertiary care children's hospitals. This database accounts for approximately 20% of all annual pediatric hospitalizations in the United States. Data quality is ensured through a joint effort between the Children's Hospital Association and participating hospitals.
Patient Population
Data from 32 (of the 47) hospitals included in PHIS with complete inpatient and ED data were used to evaluate hospital‐level resource utilization for children 1 to 18 years of age discharged January 1, 2008 to June 30, 2014 with a diagnosis of pneumonia (International Classification of Diseases, 9th Revision [ICD‐9] codes 480.x‐486.x, 487.0).[13] Our goal was to identify previously healthy children with uncomplicated pneumonia, so we excluded patients with complex chronic conditions,[14] billing charges for intensive care management and/or pleural drainage procedure (IDC‐9 codes 510.0, 510.9, 511.0, 511.1, 511.8, 511.9, 513.x) on day of admission or the next day, or prior pneumonia admission in the last 30 days. We studied 2 mutually exclusive populations: children with pneumonia treated in the ED (ie, patients who were evaluated in the ED and discharged to home), and children hospitalized with pneumonia, including those admitted through the ED.
Guideline Publication and Study Periods
For an exploratory before and after comparison, patients were grouped into 2 cohorts based on a guideline online publication date of August 1, 2011: preguideline (January 1, 2008 to July 31, 2011) and postguideline (August 1, 2011 to June 30, 2014).
Study Outcomes
The measured outcomes were the monthly proportion of pneumonia patients for whom specific diagnostic tests were performed, as determined from billing data. The diagnostic tests evaluated were complete blood count (CBC), blood culture, C‐reactive protein (CRP), and chest radiograph (CXR). Standardized costs were also calculated from PHIS charges as previously described to standardize the cost of the individual tests and remove interhospital cost variation.[3]
Relationship of Repeat Testing and Severity of Illness
Because higher illness severity and clinical deterioration may warrant repeat testing, we also explored the association of repeat diagnostic testing for inpatients with severity of illness by using the following variables as measures of severity: length of stay (LOS), transfer to intensive care unit (ICU), or pleural drainage procedure after admission (>2 calendar days after admission). Repeat diagnostic testing was stratified by number of tests.
Statistical Analysis
The categorical demographic characteristics of the pre‐ and postguideline populations were summarized using frequencies and percentages, and compared using 2 tests. Continuous demographics were summarized with medians and interquartile ranges (IQRs) and compared with the Wilcoxon rank sum test. Segmented regression, clustered by hospital, was used to assess trends in monthly resource utilization as well as associated standardized costs before and after guidelines publication. To estimate the impact of the guidelines overall, we compared the observed diagnostic resource use at the end of the study period with expected use projected from trends in the preguidelines period (ie, if there were no new guidelines). Individual interrupted time series were also built for each hospital. From these models, we assessed which hospitals had a significant difference between the rate observed at the end of the study and that estimated from their preguideline trajectory. To assess the relationship between the number of positive improvements at a hospital and hospital characteristics, we used Spearman's correlation and Kruskal‐Wallis tests. All analyses were performed with SAS version 9.3 (SAS Institute, Inc., Cary, NC), and P values <0.05 were considered statistically significant. In accordance with the policies of the Cincinnati Children's Hospital Medical Center Institutional Review Board, this research, using a deidentified dataset, was not considered human subjects research.
RESULTS
There were 275,288 hospital admissions meeting study inclusion criteria of 1 to 18 years of age with a diagnosis of pneumonia from 2008 to 2014. Of these, 54,749 met exclusion criteria (1874 had pleural drainage procedure on day 0 or 1, 51,306 had complex chronic conditions, 1569 were hospitalized with pneumonia in the last 30 days). Characteristics of the remaining 220,539 patients in the final sample are shown in Table 1. The median age was 4 years (IQR, 27 years); a majority of the children were male (53%) and had public insurance (58%). There were 128,855 patients in the preguideline period (January 1, 2008 to July 31, 2011) and 91,684 in the post guideline period (August 1, 2011June 30, 2014).
| Overall | Preguideline | Postguideline | P | |
|---|---|---|---|---|
| ||||
| No. of discharges | 220,539 | 128,855 | 91,684 | |
| Type of encounter | ||||
| ED only | 150,215 (68.1) | 88,790 (68.9) | 61,425 (67) | <0.001 |
| Inpatient | 70,324 (31.9) | 40,065 (31.1) | 30,259 (33) | |
| Age | ||||
| 14 years | 129,360 (58.7) | 77,802 (60.4) | 51,558 (56.2) | <0.001 |
| 59 years | 58,609 (26.6) | 32,708 (25.4) | 25,901 (28.3) | |
| 1018 years | 32,570 (14.8) | 18,345 (14.2) | 14,225 (15.5) | |
| Median [IQR] | 4 [27] | 3 [27] | 4 [27] | <0.001 |
| Gender | ||||
| Male | 116,718 (52.9) | 68,319 (53) | 48,399 (52.8) | 00.285 |
| Female | 103,813 (47.1) | 60,532 (47) | 43,281 (47.2) | |
| Race | ||||
| Non‐Hispanic white | 84,423 (38.3) | 47,327 (36.7) | 37,096 (40.5) | <0.001 |
| Non‐Hispanic black | 60,062 (27.2) | 35,870 (27.8) | 24,192 (26.4) | |
| Hispanic | 51,184 (23.2) | 31,167 (24.2) | 20,017 (21.8) | |
| Asian | 6,444 (2.9) | 3,691 (2.9) | 2,753 (3) | |
| Other | 18,426 (8.4) | 10,800 (8.4) | 7,626 (8.3) | |
| Payer | ||||
| Government | 128,047 (58.1) | 70,742 (54.9) | 57,305 (62.5) | <0.001 |
| Private | 73,338 (33.3) | 44,410 (34.5) | 28,928 (31.6) | |
| Other | 19,154 (8.7) | 13,703 (10.6) | 5,451 (5.9) | |
| Disposition | ||||
| HHS | 684 (0.3) | 411 (0.3) | 273 (0.3) | <0.001 |
| Home | 209,710 (95.1) | 123,236 (95.6) | 86,474 (94.3) | |
| Other | 9,749 (4.4) | 4,962 (3.9) | 4,787 (5.2) | |
| SNF | 396 (0.2) | 246 (0.2) | 150 (0.2) | |
| Season | ||||
| Spring | 60,171 (27.3) | 36,709 (28.5) | 23,462 (25.6) | <0.001 |
| Summer | 29,891 (13.6) | 17,748 (13.8) | 12,143 (13.2) | |
| Fall | 52,161 (23.7) | 28,332 (22) | 23,829 (26) | |
| Winter | 78,316 (35.5) | 46,066 (35.8) | 32,250 (35.2) | |
| LOS | ||||
| 13 days | 204,812 (92.9) | 119,497 (92.7) | 85,315 (93.1) | <0.001 |
| 46 days | 10,454 (4.7) | 6,148 (4.8) | 4,306 (4.7) | |
| 7+ days | 5,273 (2.4) | 3,210 (2.5) | 2,063 (2.3) | |
| Median [IQR] | 1 [11] | 1 [11] | 1 [11] | 0.144 |
| Admitted patients, median [IQR] | 2 [13] | 2 [13] | 2 [13] | <0.001 |
Discharged From the ED
Throughout the study, utilization of CBC, blood cultures, and CRP was <20%, whereas CXR use was >75%. In segmented regression analysis, CRP utilization was relatively stable before the guidelines publication. However, by the end of the study period, the projected estimate of CRP utilization without guidelines (expected) was 2.9% compared with 4.8% with the guidelines (observed) (P < 0.05) (Figure 1). A similar pattern of higher rates of diagnostic utilization after the guidelines compared with projected estimates without the guidelines was also seen in the ED utilization of CBC, blood cultures, and CXR (Figure 1); however, these trends did not achieve statistical significance. Table 2 provides specific values. Using a standard cost of $19.52 for CRP testing, annual costs across all hospitals increased $11,783 for ED evaluation of CAP.
Baseline (%) | Preguideline Trend | Level Change at Guideline | Change in Trend After Guideline | Estimates at End of Study* | |||
|---|---|---|---|---|---|---|---|
Without Guideline (%) | With Guideline (%) | P | |||||
| |||||||
| ED‐only encounters | |||||||
| Blood culture | 14.6 | 0.1 | 0.8 | 0.1 | 5.5 | 8.6 | NS |
| CBC | 19.2 | 0.1 | 0.4 | 0.1 | 10.7 | 14.0 | NS |
| CRP | 5.4 | 0.0 | 0.6 | 0.1 | 2.9 | 4.8 | <0.05 |
| Chest x‐ray | 85.4 | 0.1 | 0.1 | 0.0 | 80.9 | 81.1 | NS |
| Inpatient encounters | |||||||
| Blood culture | 50.6 | 0.0 | 1.7 | 0.2 | 49.2 | 41.4 | <0.05 |
| Repeat blood culture | 6.5 | 0.0 | 1.0 | 0.1 | 8.9 | 5.8 | NS |
| CBC | 65.2 | 0.0 | 3.1 | 0.0 | 65.0 | 62.2 | NS |
| Repeat CBC | 23.4 | 0.0 | 4.2 | 0.0 | 20.8 | 16.0 | NS |
| CRP | 25.7 | 0.0 | 1.1 | 0.0 | 23.8 | 23.5 | NS |
| Repeat CRP | 12.5 | 0.1 | 2.2 | 0.1 | 7.1 | 7.3 | NS |
| Chest x‐ray | 89.4 | 0.1 | 0.7 | 0.0 | 85.4 | 83.9 | NS |
| Repeat chest x‐ray | 25.5 | 0.0 | 2.0 | 0.1 | 24.1 | 17.7 | <0.05 |
Inpatient Encounters
In the segmented regression analysis of children hospitalized with CAP, guideline publication was associated with changes in the monthly use of some diagnostic tests. For example, by the end of the study period, the use of blood culture was 41.4% (observed), whereas the projected estimated use in the absence of the guidelines was 49.2% (expected) (P < 0.05) (Figure 2). Table 2 includes the data for the other tests, CBC, CRP, and CXR, in which similar patterns are noted with lower utilization rates after the guidelines, compared with expected utilization rates without the guidelines; however, these trends did not achieve statistical significance. Evaluating the utilization of repeat testing for inpatients, only repeat CXR achieved statistical significance (P < 0.05), with utilization rates of 17.7% with the guidelines (actual) compared with 24.1% without the guidelines (predicted).
To better understand the use of repeat testing, a comparison of severity outcomesLOS, ICU transfer, and pleural drainage procedureswas performed between patients with no repeat testing (70%) and patients with 1 or more repeat tests (30%). Patients with repeat testing had longer LOS (no repeat testing LOS 1 [IQR, 12]) versus 1 repeat test LOS 3 ([IQR, 24] vs 2+ repeat tests LOS 5 [IQR, 38]), higher rate of ICU transfer (no repeat testing 4.6% vs 1 repeat test 14.6% vs 2+ repeat test 35.6%), and higher rate of pleural drainage (no repeat testing 0% vs 1 repeat test 0.1% vs 2+ repeat test 5.9%] (all P < 0.001).
Using standard costs of $37.57 for blood cultures and $73.28 for CXR, annual costs for children with CAP across all hospitals decreased by $91,512 due to decreased utilization of blood cultures, and by $146,840 due to decreased utilization of CXR.
Hospital‐Level Variation in the Impact of the National Guideline
Figure 3 is a visual representation (heat map) of the impact of the guidelines at the hospital level at the end of the study from the individual interrupted time series. Based on this heat map (Figure 3), there was wide variability between hospitals in the impact of the guideline on each test in different settings (ED or inpatient). By diagnostic testing, 7 hospitals significantly decreased utilization of blood cultures for inpatients, and 5 hospitals significantly decreased utilization for repeat blood cultures and repeat CXR. Correlation between the number of positive improvements at a hospital and region (P = 0.974), number of CAP cases (P = 0.731), or percentage of public insurance (P = 0.241) were all nonsignificant.
DISCUSSION
This study complements previous assessments by evaluating the impact of the 2011 IDSA/PIDS consensus guidelines on the management of children with CAP cared for at US children's hospitals. Prior studies have shown increased use of narrow‐spectrum antibiotics for children with CAP after the publication of these guidelines.[7] The current study focused on diagnostic testing for CAP before and after the publication of the 2011 guidelines. In the ED setting, use of some diagnostic tests (blood culture, CBC, CXR, CRP) was declining prior to guideline publication, but appeared to plateau and/or increase after 2011. Among children admitted with CAP, use of diagnostic testing was relatively stable prior to 2011, and use of these tests (blood culture, CBC, CXR, CRP) declined after guideline publication. Overall, changes in diagnostic resource utilization 3 years after publication were modest, with few changes achieving statistical significance. There was a large variability in the impact of guidelines on test use between hospitals.
For outpatients, including those managed in the ED, the PIDS/IDSA guidelines recommend limited laboratory testing in nontoxic, fully immunized patients. The guidelines discourage the use of diagnostic testing among outpatients because of their low yield (eg, blood culture), and because test results may not impact management (eg, CBC).[6] In the years prior to guideline publication, there was already a declining trend in testing rates, including blood cultures, CBC, and CRP, for patients in the ED. After guideline publication, the rate of blood cultures, CBC, and CRP increased, but only the increase in CRP utilization achieved statistical significance. We would not expect utilization for common diagnostic tests (eg, CBC for outpatients with CAP) to be at or close to 0% because of the complexity of clinical decision making regarding admission that factors in aspects of patient history, exam findings, and underlying risk.[15] ED utilization of blood cultures was <10%, CBC <15%, and CRP <5% after guideline publication, which may represent the lowest testing limit that could be achieved.
CXRs obtained in the ED did not decrease over the entire study period. The rates of CXR use (close to 80%) seen in our study are similar to prior ED studies.[5, 16] Management of children with CAP in the ED might be different than outpatient primary care management because (1) unlike primary care providers, ED providers do not have an established relationship with their patients and do not have the opportunity for follow‐up and serial exams, making them less likely to tolerate diagnostic uncertainty; and (2) ED providers may see sicker patients. However, use of CXR in the ED does represent an opportunity for further study to understand if decreased utilization is feasible without adversely impacting clinical outcomes.
The CAP guidelines provide a strong recommendation to obtain blood culture in moderate to severe pneumonia. Despite this, blood culture utilization declined after guideline publication. Less than 10% of children hospitalized with uncomplicated CAP have positive blood cultures, which calls into question the utility of blood cultures for all admitted patients.[17, 18, 19] The recent EPIC (Epidemiology of Pneumonia in the Community) study showed that a majority of children hospitalized with pneumonia do not have growth of bacteria in culture, but there may be a role for blood cultures in patients with a strong suspicion of complicated CAP or in the patient with moderate to severe disease.[20] In addition to blood cultures, the guidelines also recommend CBC and CXR in moderate to severely ill children. This observed decline in testing in CBC and CXR may be related to individual physician assessments of which patients are moderately to severely ill, as the guidelines do not recommend testing for children with less severe disease. Our exclusion of patients requiring intensive care management or pleural drainage on admission might have selected children with a milder course of illness, although still requiring admission.
The guidelines discourage repeat diagnostic testing among children hospitalized with CAP who are improving. In this study, repeat CXR and CBC occurred in approximately 20% of patients, but repeat blood culture and CRP was much lower. As with initial diagnostic testing for inpatients with CAP, the rates of some repeat testing decreased with the guidelines. However, those with repeat testing had longer LOS and were more likely to require ICU transfer or a pleural drainage procedure compared to children without repeat testing. This suggests that repeat testing is used more often in children with a severe presentation or a worsening clinical course, and not done routinely on hospitalized patients.
The financial impact of decreased testing is modest, because the tests themselves are relatively inexpensive. However, the lack of substantial cost savings should not preclude efforts to continue to improve adherence to the guidelines. Not only is increased testing associated with higher hospitalization rates,[5] potentially yielding higher costs and family stress, increased testing may also lead to patient discomfort and possibly increased radiation exposure through chest radiography.
Many of the diagnostic testing recommendations in the CAP guidelines are based on weak evidence, which may contribute to the lack of substantial adoption. Nevertheless, adherence to guideline recommendations requires sustained effort on the part of individual physicians that should be encouraged through institutional support.[21] Continuous education and clinical decision support, as well as reminders in the electronic medical record, would make guideline recommendations more visible and may help overcome the inertia of previous practice.[15] The hospital‐level heat map (Figure 3) included in this study demonstrates that the impact of the guidelines was variable across sites. Although a few sites had decreased diagnostic testing in many areas with no increased testing in any category, there were several sites that had no improvement in any diagnostic testing category. In addition, hospital‐level factors like size, geography, and insurance status were not associated with number of improvements. To better understand drivers of change at individual hospitals, future studies should evaluate specific strategies utilized by the rapid guideline adopters.
This study is subject to several limitations. The use of ICD‐9 codes to identify patients with CAP may not capture all patients with this diagnosis; however, these codes have been previously validated.[13] Additionally, because patients were identified using ICD‐9 coding assigned at the time of discharge, testing performed in the ED setting may not reflect care for a child with known pneumonia, but rather may reflect testing for a child with fever or other signs of infection. PHIS collects data from freestanding children's hospitals, which care for a majority of children with CAP in the US, but our findings may not be generalizable to other hospitals. In addition, we did not examine drivers of trends within individual institutions. We did not have detailed information to examine whether the PHIS hospitals in our study had actively worked to adopt the CAP guidelines. We were also unable to assess physician's familiarity with guidelines or the level of disagreement with the recommendations. Furthermore, the PHIS database does not permit detailed correlation of diagnostic testing with clinical parameters. In contrast to the diagnostic testing evaluated in this study, which is primarily discouraged by the IDSA/PIDS guidelines, respiratory viral testing for children with CAP is recommended but could not be evaluated, as data on such testing are not readily available in PHIS.
CONCLUSION
Publication of the IDSA/PIDS evidence‐based guidelines for the management of CAP was associated with modest, variable changes in use of diagnostic testing. Further adoption of the CAP guidelines should reduce variation in care and decrease unnecessary resource utilization in the management of CAP. Our study demonstrates that efforts to promote decreased resource utilization should target specific situations (eg, repeat testing for inpatients who are improving). Adherence to guidelines may be improved by the adoption of local practices that integrate and improve daily workflow, like order sets and clinical decision support tools.
Disclosure: Nothing to report.
- , . Eliminating waste in US health care. JAMA. 2012;307(14):1513–1516.
- , , , et al. Choosing wisely in pediatric hospital medicine: five opportunities for improved healthcare value. J Hosp Med. 2013;8(9):479–485.
- , , , et al.; Pediatric Research in Inpatient Settings (PRIS) Network. Prioritization of comparative effectiveness research topics in hospital pediatrics. Arch Pediatr Adolesc Med. 2012;166(12):1155–1164.
- , , , et al. Variability in processes of care and outcomes among children hospitalized with community‐acquired pneumonia. Pediatr Infect Dis J. 2012;31(10):1036–1041.
- , , , , . Variation in emergency department diagnostic testing and disposition outcomes in pneumonia. Pediatrics. 2013;132(2):237–244.
- , , , et al.; Pediatric Infectious Diseases Society and the Infectious Diseases Society of America. The management of community‐acquired pneumonia in infants and children older than 3 months of age: clinical practice guidelines by the Pediatric Infectious Diseases Society and the Infectious Diseases Society of America. Clin Infect Dis. 2011;53(7):e25–e76.
- , , , et al., Impact of Infectious Diseases Society of America/Pediatric Infectious Diseases Society guidelines on treatment of community‐acquired pneumonia in hospitalized children. Clin Infect Dis. 2014;58(6):834–838.
- , , , et al. Antibiotic choice for children hospitalized with pneumonia and adherence to national guidelines. Pediatrics. 2015;136(1):44–52.
- , , , et al. Quality improvement methods increase appropriate antibiotic prescribing for childhood pneumonia. Pediatrics. 2013;131(5):e1623–e1631.
- , , , et al. Improvement methodology increases guideline recommended blood cultures in children with pneumonia. Pediatrics. 2015;135(4):e1052–e1059.
- , , , , , . Impact of a guideline on management of children hospitalized with community‐acquired pneumonia. Pediatrics. 2012;129(3):e597–e604.
- , , , . Effectiveness of antimicrobial guidelines for community‐acquired pneumonia in children. Pediatrics. 2012;129(5):e1326–e1333.
- , , , et al. Identifying pediatric community‐acquired pneumonia hospitalizations: accuracy of administrative billing codes. JAMA Pediatr. 2013;167(9):851–858.
- , , , , . Pediatric complex chronic conditions classification system version 2: updated for ICD‐10 and complex medical technology dependence and transplantation. BMC Pediatr. 2014;14:199.
- , . Establishing superior benchmarks of care in clinical practice: a proposal to drive achievable health care value. JAMA Pediatr. 2015;169(4):301–302.
- , , , . Emergency department management of childhood pneumonia in the United States prior to publication of national guidelines. Acad Emerg Med. 2013;20(3):240–246.
- , , , et al. Prevalence of bacteremia in hospitalized pediatric patients with community‐acquired pneumonia. Pediatr Infect Dis J. 2013;32(7):736–740.
- , , , , . The prevalence of bacteremia in pediatric patients with community‐acquired pneumonia: guidelines to reduce the frequency of obtaining blood cultures. Hosp Pediatr. 2013;3(2):92–96.
- . Do all children hospitalized with community‐acquired pneumonia require blood cultures? Hosp Pediatr. 2013;3(2):177–179.
- , , , et al.; CDC EPIC Study Team. Community‐acquired pneumonia requiring hospitalization among U.S. children. N Engl J Med. 2015;372(9):835–845.
- , , , et al. Influence of hospital guidelines on management of children hospitalized with pneumonia. Pediatrics. 2012;130(5):e823–e830.
© 2015 Society of Hospital Medicine
