User login
LOS in Children With Medical Complexity
Children with medical complexity (CMC) have complex and chronic health conditions that often involve multiple organ systems and severely affect cognitive and physical functioning. Although the prevalence of CMC is low (1% of all children), they account for nearly one‐fifth of all pediatric admissions and one‐half of all hospital days and charges in the United States.[1] Over the last decade, CMC have had a particularly large and increasing impact in tertiary‐care children's hospitals.[1, 2] The Institute of Medicine has identified CMC as a priority population for a revised healthcare system.[3]
Medical homes, hospitals, health plans, states, federal agencies, and others are striving to reduce excessive hospital use in CMC because of its high cost.[4, 5, 6] Containing length of stay (LOS)an increasingly used indicator of the time sensitiveness and efficiency of hospital careis a common aim across these initiatives. CMC have longer hospitalizations than children without medical complexity. Speculated reasons for this are that CMC tend to have (1) higher severity of acute illnesses (eg, pneumonia, cellulitis), (2) prolonged recovery time in the hospital, and (3) higher risk of adverse events in the hospital. Moreover, hospital clinicians caring for CMC often find it difficult to determine discharge readiness, given that many CMC do not return to a completely healthy baseline.[7]
Little is known about long LOS in CMC, including which CMC have the highest risk of experiencing such stays and which stays might have the greatest opportunity to be shortened. Patient characteristics associated with prolonged length of stay have been studied extensively for many pediatric conditions (eg, asthma).[8, 9, 10, 11, 12, 13, 14] However, most of these studies excluded CMC. Therefore, the objectives of this study were to examine (1) the prevalence of long LOS in CMC, (2) patient characteristics associated with long LOS, and (3) hospital‐to‐hospital variation in prevalence of long LOS hospitalizations.
METHODS
Study Design and Data Source
This study is a multicenter, retrospective cohort analysis of the Pediatric Health Information System (PHIS). PHIS is an administrative database of 44 not for profit, tertiary care pediatric hospitals affiliated with the Children's Hospital Association (CHA) (Overland Park, KS). PHIS contains data regarding patient demographics, diagnoses, and procedures (with International Classification of Diseases, 9th Revision, Clinical Modification [ICD‐9‐CM] codes), All‐Patient Refined Diagnostic Related Groups version 30 (APR‐DRGs) (3M Health Information Systems, Salt Lake City, UT), and service lines that aggregate the APR‐DRGs into 38 distinct groups. Data quality and reliability are assured through CHA and participating hospitals. In accordance with the policies of the Cincinnati Children's Hospital Medical Center Institutional Review Board, this study of deidentified data was not considered human subjects research.
Study Population
Inclusion Criteria
Children discharged following an observation or inpatient admission from a hospital participating in the PHIS database between January 1, 2013 and December 31, 2014 were eligible for inclusion if they were considered medically complex. Medical complexity was defined using Clinical Risk Groups (CRGs) version 1.8, developed by 3M Health Information Systems and the National Association of Children's Hospitals and Related Institutions. CRGs were used to assign each hospitalized patient to 1 of 9 mutually exclusive chronicity groups according to the presence, type, and severity of chronic conditions.[15, 16, 17, 18] Each patient's CRG designation was based on 2 years of previous hospital encounters.
As defined in prior studies and definitional frameworks of CMC,[1] patients belonging to CRG group 6 (significant chronic disease in 2 organ systems), CRG group 7 (dominant chronic disease in 3 organ systems), and CRG group 9 (catastrophic condition) were considered medically complex.[17, 19] Patients with malignancies (CRG group 8) were not included for analysis because they are a unique population with anticipated, long hospital stays. Patients with CRG group 5, representing those with chronic conditions affecting a single body system, were also not included because most do not have attributes consistent with medical complexity.
Exclusion Criteria
We used the APR‐DRG system, which leverages ICD‐9‐CM codes to identify the health problem most responsible for the hospitalization, to refine the study cohort. We excluded hospitalizations that were classified by the APR‐DRG system as neonatal, as we did not wish to focus on LOS in the neonatal intensive care unit (ICU) or for birth admissions. Similarly, hospitalizations for chemotherapy (APR‐DRG 693) or malignancy (identified with previously used ICD‐9‐CM codes)[20] were also excluded because long LOS is anticipated. We also excluded hospitalizations for medical rehabilitation (APR‐DRG 860).
Outcome Measures
The primary outcome measure was long LOS, defined as LOS 10 days. The cut point of LOS 10 days represents the 90th percentile of LOS for all children, with and without medical complexity, hospitalized during 2013 to 2014. LOS 10 days has previously been used as a threshold of long LOS.[21] For hospitalizations involving transfer at admission from another acute care facility, LOS was measured from the date of transfer. We also assessed hospitals' cost attributable to long LOS admissions.
Patient Demographics and Clinical Characteristics
We measured demographic characteristics including age, gender, race/ethnicity, insurance type, and distance traveled (the linear distance between the centroid of the patient's home ZIP code and the centroid of the hospital's ZIP code). Clinical characteristics included CRG classification, complex chronic condition (CCC), and dependence on medical technology. CCCs are defined as any medical condition that can be reasonably expected to last at least 12 months (unless death intervenes) and to involve either several different organ systems or 1 system severely enough to require specialty pediatric care and probably some period of hospitalization in a tertiary care center.[20] Medical technology included devices used to optimize the health and functioning of the child (eg, gastrostomy, tracheostomy, cerebrospinal fluid shunt).[22]
Hospitalization Characteristics
Characteristics of the hospitalization included transfer from an outside facility, ICU admission, surgical procedure (using surgical APR‐DRGs), and discharge disposition (home, skilled nursing facility, home health services, death, other). Cost of the hospitalization was estimated in the PHIS from charges using hospital and year‐specific ratios of cost to charge.
Statistical Analysis
Continuous data (eg, distance from hospital to home residence) were described with median and interquartile ranges (IQR) because they were not normally distributed. Categorical data (eg, type of chronic condition) were described with counts and frequencies. In bivariate analyses, demographic, clinical, and hospitalization characteristics were stratified by LOS (long LOS vs LOS <10 days), and compared using 2 statistics or Wilcoxon rank sum tests as appropriate.
We modeled the likelihood of experiencing a long LOS using generalized linear mixed effects models with a random hospital intercept and discharge‐level fixed effects for age, gender, payor, CCC type, ICU utilization, transfer status, a medical/surgical admission indicator derived from the APR‐DRG, and CRG assigned to each hospitalization. To examine hospital‐to‐hospital variability, we generated hospital risk‐adjusted rates of long LOS from these models. Similar models and hospital risk‐adjusted rates were built for a post hoc correlational analysis of 30‐day all cause readmission, where hospitals' rates and percent of long LOS were compared with a Pearson correlation coefficient. Also, for our multivariable models, we performed a sensitivity analysis using an alternative definition of long LOS as 4 days (the 75th percentile of LOS for all children, with and without medical complexity, hospitalized during 20132014). All analyses were performed using SAS version 9.4 (SAS Institute, Cary, NC), and P values <0.05 were considered statistically significant.
RESULTS
Study Population
There were 954,018 hospitalizations of 217,163 CMC at 44 children's hospitals included for analysis. Forty‐seven percent of hospitalizations were for females, 49.4% for non‐Hispanic whites, and 61.1% for children with government insurance. Fifteen percent (n = 142,082) had a long LOS of 10 days. The median (IQR) LOS of hospitalizations <10 days versus 10 days were 2 (IQR, 14) and 16 days (IQR, 1226), respectively. Long LOS hospitalizations accounted for 61.1% (3.7 million) hospital days and 61.8% ($13.7 billion) of total hospitalization costs for all CMC in the cohort (Table 1).
| Characteristic | Overall (n = 954,018) | Length of Stay | |
|---|---|---|---|
| <10 Days (n = 811,936) | 10 Days (n = 142,082) | ||
| |||
| Age at admission, y, % | |||
| <1 | 14.6 | 12.7 | 25.7 |
| 14 | 27.1 | 27.9 | 22.4 |
| 59 | 20.1 | 21.0 | 14.9 |
| 1018 | 33.6 | 34.0 | 31.7 |
| 18+ | 4.6 | 4.4 | 5.4 |
| Gender, % | |||
| Female | 47.0 | 46.9 | 47.5 |
| Race/ethnicity, % | |||
| Non‐Hispanic white | 49.4 | 49.4 | 49.4 |
| Non‐Hispanic black | 23.1 | 23.8 | 19.3 |
| Hispanic | 18.2 | 17.8 | 20.4 |
| Asian | 2.0 | 1.9 | 2.3 |
| Other | 7.4 | 7.1 | 8.6 |
| Complex chronic condition, % | |||
| Any | 79.5 | 77.3 | 91.8 |
| Technology assistance | 37.1 | 34.1 | 54.2 |
| Gastrointestinal | 30.0 | 27.2 | 45.9 |
| Neuromuscular | 28.2 | 27.7 | 30.9 |
| Cardiovascular | 16.8 | 14.5 | 29.9 |
| Respiratory | 14.1 | 11.5 | 29.4 |
| Congenital/genetic defect | 17.2 | 16.7 | 20.2 |
| Metabolic | 9.9 | 8.9 | 15.4 |
| Renal | 10.1 | 9.5 | 13.8 |
| Hematology/emmmunodeficiency | 11.7 | 12.0 | 10.0 |
| Neonatal | 3.8 | 3.1 | 7.7 |
| Transplantation | 4.5 | 4.2 | 6.7 |
| Clinical risk group, % | |||
| Chronic condition in 2 systems | 68.4 | 71.2 | 53.9 |
| Catastrophic chronic condition | 31.4 | 28.8 | 46.1 |
| Distance from hospital to home residence in miles, median [IQR] | 16.2 [7.440.4] | 15.8 [7.338.7] | 19.1 [8.552.6] |
| Transferred from outside hospital (%) | 6.5 | 5.3 | 13.6 |
| Admitted for surgery, % | 23.4 | 20.7 | 38.7 |
| Use of intensive care, % | 19.6 | 14.9 | 46.5 |
| Discharge disposition, % | |||
| Home | 91.2 | 92.9 | 81.4 |
| Home healthcare | 4.5 | 3.5 | 9.9 |
| Other | 2.9 | 2.6 | 4.5 |
| Postacute care facility | 1.1 | 0.8 | 3.1 |
| Died | 0.4 | 0.3 | 1.1 |
| Payor, % | |||
| Government | 61.1 | 60.6 | 63.5 |
| Private | 33.2 | 33.6 | 30.9 |
| Other | 5.7 | 5.7 | 5.7 |
| Hospital resource use | |||
| Median length of stay [IQR] | 3 [16] | 2 [14] | 16 [1226] |
| Median hospital cost [IQR] | $8,144 [$4,122$18,447] | $6,689 [$3,685$12,395] | $49,207 [$29,444$95,738] |
| Total hospital cost, $, billions | $22.2 | $8.5 | $13.7 |
Demographics and Clinical Characteristics of Children With and Without Long LOS
Compared with hospitalized CMC with LOS <10 days, a higher percentage of hospitalizations with LOS 10 days were CMC age <1 year (25.7% vs 12.7%, P < 0.001) and Hispanic (20.4% vs 17.8%, P < 0.001). CMC hospitalizations with a long LOS had a higher percentage of any CCC (91.8% vs 77.3%, P < 0.001); the most common CCCs were gastrointestinal (45.9%), neuromuscular (30.9%), and cardiovascular (29.9%). Hospitalizations of CMC with a long LOS had a higher percentage of a catastrophic chronic condition (46.1% vs 28.8%, P < 0.001) and technology dependence (46.1% vs 28.8%, P < 0.001) (Table 1).
Hospitalization Characteristics of Children With and Without Long LOS
Compared with hospitalizations of CMC with LOS <10 days, hospitalizations of CMC with a long LOS more often involved transfer in from another hospital at admission (13.6% vs 5.3%, P < 0.001). CMC hospital stays with a long LOS more often involved surgery (38.7% vs 20.7%, P < 0.001) and use of intensive care (46.5% vs 14.9%; P < 0.001). A higher percentage of CMC with long LOS were discharged with home health services (9.9% vs 3.5%; P < 0.001) (Table 1).
The most common admitting diagnoses and CCCs for hospitalizations of CMC with long LOS are presented in Table 2. The two most prevalent APR‐DRGs in CMC hospitalizations lasting 10 days or longer were cystic fibrosis (10.7%) and respiratory system disease with ventilator support (5.5%). The two most common chronic condition characteristics represented among long CMC hospitalizations were gastrointestinal devices (eg, gastrostomy tube) (39.7%) and heart and great vessel malformations (eg, tetralogy of Fallot) (12.8%). The 5 most common CCC subcategories, as listed in Table 2, account for nearly 100% of the patients with long LOS hospitalizations.
| |
| Most common reason for admission* | |
| Cystic fibrosis | 10.7% |
| Respiratory system diagnosis with ventilator support 96+ hours | 5.5% |
| Malfunction, reaction, and complication of cardiac or vascular device or procedure | 2.8% |
| Craniotomy except for trauma | 2.6% |
| Major small and large bowel procedures | 2.3% |
| Most common complex chronic condition | |
| Gastrointestinal devices | 39.7% |
| Heart and great vessel malformations | 12.8% |
| Cystic fibrosis | 12.5% |
| Dysrhythmias | 11.0% |
| Respiratory devices | 10.7% |
Multivariable Analysis of Characteristics Associated With Long LOS
In multivariable analysis, the highest likelihood of long LOS was experienced by children who received care in the ICU (odds ratio [OR]: 3.5, 95% confidence interval [CI]: 3.43.5), who had a respiratory CCC (OR: 2.7, 95% CI: 2.62.7), and who were transferred from another acute care hospital at admission (OR: 2.1, 95% CI: 2.0, 2.1). The likelihood of long LOS was also higher in children <1 year of age (OR: 1.2, 95% CI: 1.21.3), and Hispanic children (OR: 1.1, 95% CI 1.0‐1.10) (Table 3). Similar multivariable findings were observed in sensitivity analysis using the 75th percentile of LOS (4 days) as the model outcome.
| Characteristic | Odds Ratio (95% CI) of LOS 10 Days | P Value |
|---|---|---|
| ||
| Use of intensive care | 3.5 (3.4‐3.5) | <0.001 |
| Transfer from another acute‐care hospital | 2.1 (2.0‐2.1) | <0.001 |
| Procedure/surgery | 1.8 (1.8‐1.9) | <0.001 |
| Complex chronic condition | ||
| Respiratory | 2.7 (2.6‐2.7) | <0.001 |
| Gastrointestinal | 1.8 (1.8‐1.8) | <0.001 |
| Metabolic | 1.7 (1.7‐1.7) | <0.001 |
| Cardiovascular | 1.6 (1.5‐1.6) | <0.001 |
| Neonatal | 1.5 (1.5‐1.5) | <0.001 |
| Renal | 1.4 (1.4‐1.4) | <0.001 |
| Transplant | 1.4 (1.4‐1.4) | <0.001 |
| Hematology and immunodeficiency | 1.3 (1.3‐1.3) | <0.001 |
| Technology assistance | 1.1 (1.1, 1.1) | <0.001 |
| Neuromuscular | 0.9 (0.9‐0.9) | <0.001 |
| Congenital or genetic defect | 0.8 (0.8‐0.8) | <0.001 |
| Age at admission, y | ||
| <1 | 1.2 (1.2‐1.3) | <0.001 |
| 14 | 0.5 (0.5‐0.5) | <0.001 |
| 59 | 0.6 (0.6‐0.6) | <0.001 |
| 1018 | 0.9 (0.9‐0.9) | <0.001 |
| 18+ | Reference | |
| Male | 0.9 (0.9‐0.9) | <0.001 |
| Race/ethnicity | ||
| Non‐Hispanic black | 0.9 (0.9‐0.9) | <0.001 |
| Hispanic | 1.1 (1.0‐1.1) | <0.001 |
| Asian | 1.0 (1.0‐1.1) | 0.3 |
| Other | 1.1 (1.1‐1.1) | <0.001 |
| Non‐Hispanic white | Reference | |
| Payor | ||
| Private | 0.9 (0.8 0.9) | <0.001 |
| Other | 1.0 (1.0‐1.0) | 0.4 |
| Government | Reference | |
| Season | ||
| Spring | 1.0 (1.0 1.0) | <0.001 |
| Summer | 0.9 (0.9‐0.9) | <0.001 |
| Fall | 1.0 (0.9‐1.0) | <0.001 |
| Winter | Reference | |
Variation in the Prevalence of Long LOS Across Children's Hospitals
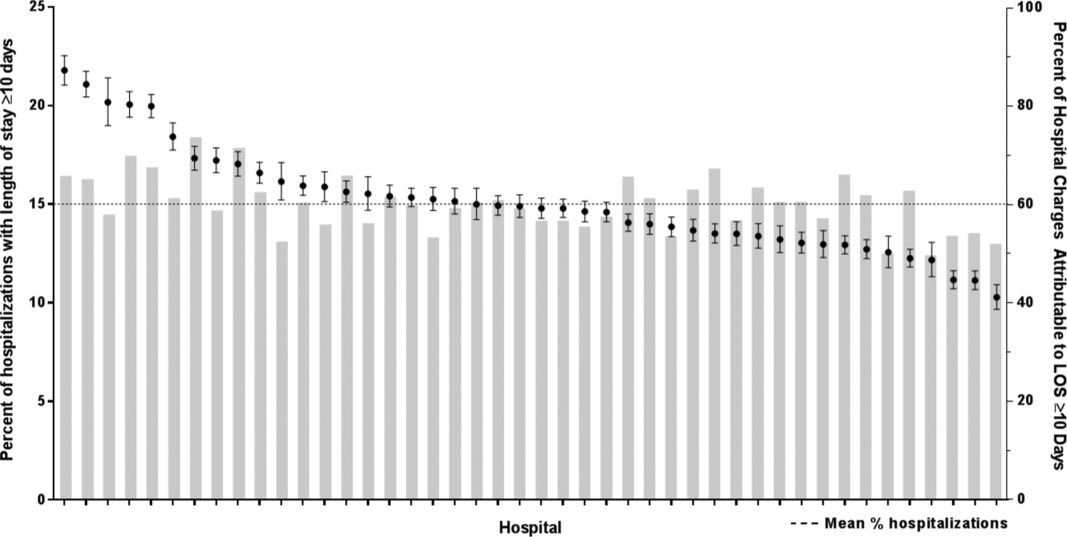
After controlling for demographic, clinical, and hospital characteristics associated with long LOS, there was significant (P < 0.001) variation in the prevalence of long LOS for CMC across children's hospitals in the cohort (range, 10.3%21.8%) (Figure 1). Twelve (27%) hospitals had a significantly (P < 0.001) higher prevalence of long LOS for their hospitalized CMC, compared to the mean. Eighteen (41%) had a significantly (P < 0.001) lower prevalence of long LOS for their hospitalized CMC. There was also significant variation across hospitals with respect to cost, with 49.7% to 73.7% of all hospital costs of CMC attributed to long LOS hospitalizations. Finally, there was indirect correlation with the prevalence of LOS across hospitals and the hospitals' 30‐day readmission rate ( = 0.3; P = 0.04). As the prevalence of long LOS increased, the readmission rate decreased.
DISCUSSION
The main findings from this study suggest that a small percentage of CMC experiencing long LOS account for the majority of hospital bed days and cost of all hospitalized CMC in children's hospitals. The likelihood of long LOS varies significantly by CMC's age, race/ethnicity, and payor as well as by type and number of chronic conditions. Among CMC with long LOS, the use of gastrointestinal devices such as gastrostomy tubes, as well as congenital heart disease, were highly prevalent. In multivariable analysis, the characteristics most strongly associated with LOS 10 days were use of the ICU, respiratory complex chronic condition, and transfer from another medical facility at admission. After adjusting for these factors, there was significant variation in the prevalence of LOS 10 days for CMC across children's hospitals.
Although it is well known that CMC as a whole have a major impact on resource use in children's hospitals, this study reveals that 15% of hospitalizations of CMC account for 62% of all hospital costs of CMC. That is, a small fraction of hospitalizations of CMC is largely responsible for the significant financial impact of hospital resource use. To date, most clinical efforts and policies striving to reduce hospital use in CMC have focused on avoiding readmissions or index hospital admissions entirely, rather than improving the efficiency of hospital care after admission occurs.[23, 24, 25, 26] In the adult population, the impact of long LOS on hospital costs has been recognized, and several Medicare incentive programs have focused on in‐hospital timeliness and efficiency. As a result, LOS in Medicare beneficiaries has decreased dramatically over the past 2 decades.[27, 28, 29, 30] Optimizing the efficiency of hospital care for CMC may be an important goal to pursue, especially with precedent set in the adult literature.
Perhaps the substantial variation across hospitals in the prevalence of long LOS in CMC indicates opportunity to improve the efficiency of their inpatient care. This variation was not due to differences across hospitals' case mix of CMC. Further investigation is needed to determine how much of it is due to differences in quality of care. Clinical practice guidelines for hospital treatment of common illnesses usually exclude CMC. In our clinical experience across 9 children's hospitals, we have experienced varying approaches to setting discharge goals (ie, parameters on how healthy the child needs to be to ensure a successful hospital discharge) for CMC.[31] When the goals are absent or not clearly articulated, they can contribute to a prolonged hospitalization. Some families of CMC report significant issues when working with pediatric hospital staff to assess their child's discharge readiness.[7, 32, 33] In addition, there is significant variation across states and regions in access to and quality of post‐discharge health services (eg, home nursing, postacute care, durable medical equipment).[34, 35] In some areas, many CMC are not actively involved with their primary care physician.[5] These issues might also influence the ability of some children's hospitals to efficiently discharge CMC to a safe and supportive post‐discharge environment. Further examination of hospital outliersthose with the lowest and highest percentage of CMC hospitalizations with long LOSmay reveal opportunities to identify and spread best practices.
The demographic and clinical factors associated with long LOS in the present study, including age, ICU use, and transfer from another hospital, might help hospitals target which CMC have the greatest risk for experiencing long LOS. We found that infants age <1 year had longer LOS when compared with older children. Similar to our findings, younger‐aged children hospitalized with bronchiolitis have longer LOS.[36] Certainly, infants with medical complexity, in general, are a high‐acuity population with the potential for rapid clinical deterioration during an acute illness. Prolonged hospitalization for treatment and stabilization may be expected for many of them. Additional investigation is warranted to examine ICU use in CMC, and whether ICU admission or duration can be safely prevented or abbreviated. Opportunities to assess the quality of transfers into children's hospitals of CMC admitted to outside hospitals may be necessary. A study of pediatric burn patients reported that patients initially stabilized at a facility that was not a burn center and subsequently transferred to a burn center had a longer LOS than patients solely treated at a designated burn center.[37] Furthermore, events during transport itself may adversely impact the stability of an already fragile patient. Interventions to optimize the quality of care provided by transport teams have resulted in decreased LOS at the receiving hospital.[38]
This study's findings should be considered in the context of several limitations. Absent a gold‐standard definition of long LOS, we used the distribution of LOS across patients to inform our methods; LOS at the 90th percentile was selected as long. Although our sensitivity analysis using LOS at the 75th percentile produced similar findings, other cut points in LOS might be associated with different results. The study is not positioned to determine how much of the reported LOS was excessive, unnecessary, or preventable. The study findings may not generalize to types of hospitals not contained in PHIS (eg, nonchildren's hospitals and community hospitals). We did not focus on the impact of a new diagnosis (eg, new chronic illness) or acute in‐hospital event (eg, nosocomial infection) on prolonged LOS; future studies should investigate these clinical events with LOS.
PHIS does not contain information regarding characteristics that could influence LOS, including the children's social and familial attributes, transportation availability, home equipment needs, and local availability of postacute care facilities. Moreover, PHIS does not contain information about the hospital discharge procedures, process, or personnel across hospitals, which could influence LOS. Future studies on prolonged LOS should consider assessing this information. Because of the large sample size of hospitalizations included, the statistical power for the analyses was strong, rendering it possible that some findings that were statistically significant might have modest clinical significance (eg, relationship of Hispanic ethnicity with prolonged LOS). We could not determine why a positive correlation was not observed between hospitals' long LOS prevalence and their percentage of cost associated with long LOS; future studies should investigate the reasons for this finding.
Despite these limitations, the findings of the present study highlight the significance of long LOS in hospitalized CMC. These long hospitalizations account for a significant proportion of all hospital costs for this important population of children. The prevalence of long LOS for CMC varies considerably across children's hospitals, even after accounting for the case mix. Efforts to curtail hospital resource use and costs for CMC may benefit from focus on long LOS.
- , , , et al. Inpatient growth and resource use in 28 children's hospitals: a longitudinal, multi‐institutional study. JAMA Pediatr. 2013;167(2):170–177.
- , , , et al. Children with complex chronic conditions in inpatient hospital settings in the united states. Pediatrics. 2010;126(4):647–655.
- , . Meeting the health care needs of persons with disabilities. Milbank Q. 2002;80(2):381–391.
- , , , et al. Effect of an enhanced medical home on serious illness and cost of care among high‐risk children with chronic illness: a randomized clinical trial. JAMA. 2014;312(24):2640–2648.
- , , , et al. Children with medical complexity and Medicaid: spending and cost savings. Health Aff Proj Hope. 2014;33(12):2199–2206.
- Children's Hospital Association. CARE Award. Available at: https://www.childrenshospitals.org/Programs‐and‐Services/Quality‐Improvement‐and‐Measurement/CARE‐Award. Accessed December 18, 2015.
- , , , et al. Hospital readmission and parent perceptions of their child's hospital discharge. Int J Qual Health Care. 2013;25(5):573–581.
- , , , et al. Weekend matters: Friday and Saturday admissions are associated with prolonged hospitalization of children. Clin Pediatr (Phila). 2013;52(9):875–878.
- , , , . Attributable cost and length of stay for central line‐associated bloodstream infections. Pediatrics. 2014;133(6):e1525–e1532.
- , , , et al. Effect of healthcare‐acquired infection on length of hospital stay and cost. Infect Control Hosp Epidemiol. 2007;28(3):280–292.
- , , , , . Hospital utilization and costs among children with influenza, 2003. Am J Prev Med. 2009;36(4):292–296.
- , , , . Charges and lengths of stay attributable to adverse patient‐care events using pediatric‐specific quality indicators: a multicenter study of freestanding children's hospitals. Pediatrics. 2008;121(6):e1653–e1659.
- , , , , . Variation in resource utilization for the management of uncomplicated community‐acquired pneumonia across community and children's hospitals. J Pediatr. 2014;165(3):585–591.
- , , , , . Variation and outcomes associated with direct hospital admission among children with pneumonia in the United States. JAMA Pediatr. 2014;168(9):829–836.
- , , , et al. Clinical Risk Groups (CRGs): a classification system for risk‐adjusted capitation‐based payment and health care management. Med Care. 2004;42(1):81–90.
- , , , et al. Identifying children with lifelong chronic conditions for care coordination by using hospital discharge data. Acad Pediatr. 2010;10(6):417–423.
- , , , , . Profile of medical charges for children by health status group and severity level in a Washington State Health Plan. Health Serv Res. 2004;39(1):73–89.
- , , , . Using medical billing data to evaluate chronically ill children over time. J Ambulatory Care Manage. 2006;29(4):283–290.
- , , , , , . Medical complexity and pediatric emergency department and inpatient utilization. Pediatrics. 2013;131(2):e559–e565.
- , , , , . Pediatric complex chronic conditions classification system version 2: updated for ICD‐10 and complex medical technology dependence and transplantation. BMC Pediatr. 2014;14:199.
- . Analyzing intensive care unit length of stay data: problems and possible solutions. Crit Care Med. 1997;25(9):1594–1600.
- , , , et al. Hospital utilization and characteristics of patients experiencing recurrent readmissions within children's hospitals. JAMA. 2011;305(7):682–690.
- . Hospital readmissions and repeat emergency department visits among children with medical complexity: an integrative review. J Pediatr Nurs. 2013;28(4):316–339.
- , , , . Hospital readmission in children with complex chronic conditions discharged from subacute care. Hosp Pediatr. 2014;4(3):153–158.
- , , , et al. Preventing hospitalizations in children with medical complexity: a systematic review. Pediatrics. 2014;134(6):e1628–e1647.
- , , , . Hospital readmissions for newly discharged pediatric home mechanical ventilation patients. Pediatr Pulmonol. 2012;47(4):409–414.
- , , , et al. Clinical characteristics and outcomes of Medicare patients undergoing total hip arthroplasty, 1991–2008. JAMA. 2011;305(15):1560–1567.
- , , , et al. Trends in length of stay and short‐term outcomes among Medicare patients hospitalized for heart failure, 1993–2006. JAMA. 2010;303(21):2141–2147.
- U.S. Department of Health and Human Services. CMS Statistics 2013. Available at: https://www.cms.gov/Research‐Statistics‐Data‐and‐Systems/Statistics‐Trends‐and‐Reports/CMS‐Statistics‐Reference‐Booklet/Downloads/CMS_Stats_2013_final.pdf. Published August 2013. Accessed October 6, 2015.
- Centers for Medicare and Medicaid Services. Evaluation of the premier hospital quality incentive demonstration. Available at: https://www.cms.gov/Research‐Statistics‐Data‐and‐Systems/Statistics‐Trends‐and‐Reports/Reports/downloads/Premier_ExecSum_2010.pdf. Published March 3, 2009. Accessed September 18, 2015.
- , , , et al. A framework of pediatric hospital discharge care informed by legislation, research, and practice. JAMA Pediatr. 2014;168(10):955–962; quiz 965–966.
- , , , , . Parent and provider perspectives on pediatric readmissions: what can we learn about readiness for discharge? Hosp Pediatr. 2015;5(11):559–565.
- , . Preventing readmissions in children: how do we do that? Hosp Pediatr. 2015;5(11):602–604.
- , , . Pediatric post‐acute hospital care: striving for identity and value. Hosp Pediatr. 2015;5(10):548–551.
- , , , et al. Pediatric hospital discharges to home health and postacute facility care: a national study. JAMA Pediatr. 2016;170(4):326–333.
- , , , et al. Bronchiolitis: clinical characteristics associated with hospitalization and length of stay. Pediatr Emerg Care. 2012;28(2):99–103.
- , , , , . The effect of transfers between health care facilities on costs and length of stay for pediatric burn patients. J Burn Care Res. 2015;36(1):178–183.
- , , , et al. Goal‐directed resuscitative interventions during pediatric interfacility transport. Crit Care Med. 2015;43(8):1692–1698.
Children with medical complexity (CMC) have complex and chronic health conditions that often involve multiple organ systems and severely affect cognitive and physical functioning. Although the prevalence of CMC is low (1% of all children), they account for nearly one‐fifth of all pediatric admissions and one‐half of all hospital days and charges in the United States.[1] Over the last decade, CMC have had a particularly large and increasing impact in tertiary‐care children's hospitals.[1, 2] The Institute of Medicine has identified CMC as a priority population for a revised healthcare system.[3]
Medical homes, hospitals, health plans, states, federal agencies, and others are striving to reduce excessive hospital use in CMC because of its high cost.[4, 5, 6] Containing length of stay (LOS)an increasingly used indicator of the time sensitiveness and efficiency of hospital careis a common aim across these initiatives. CMC have longer hospitalizations than children without medical complexity. Speculated reasons for this are that CMC tend to have (1) higher severity of acute illnesses (eg, pneumonia, cellulitis), (2) prolonged recovery time in the hospital, and (3) higher risk of adverse events in the hospital. Moreover, hospital clinicians caring for CMC often find it difficult to determine discharge readiness, given that many CMC do not return to a completely healthy baseline.[7]
Little is known about long LOS in CMC, including which CMC have the highest risk of experiencing such stays and which stays might have the greatest opportunity to be shortened. Patient characteristics associated with prolonged length of stay have been studied extensively for many pediatric conditions (eg, asthma).[8, 9, 10, 11, 12, 13, 14] However, most of these studies excluded CMC. Therefore, the objectives of this study were to examine (1) the prevalence of long LOS in CMC, (2) patient characteristics associated with long LOS, and (3) hospital‐to‐hospital variation in prevalence of long LOS hospitalizations.
METHODS
Study Design and Data Source
This study is a multicenter, retrospective cohort analysis of the Pediatric Health Information System (PHIS). PHIS is an administrative database of 44 not for profit, tertiary care pediatric hospitals affiliated with the Children's Hospital Association (CHA) (Overland Park, KS). PHIS contains data regarding patient demographics, diagnoses, and procedures (with International Classification of Diseases, 9th Revision, Clinical Modification [ICD‐9‐CM] codes), All‐Patient Refined Diagnostic Related Groups version 30 (APR‐DRGs) (3M Health Information Systems, Salt Lake City, UT), and service lines that aggregate the APR‐DRGs into 38 distinct groups. Data quality and reliability are assured through CHA and participating hospitals. In accordance with the policies of the Cincinnati Children's Hospital Medical Center Institutional Review Board, this study of deidentified data was not considered human subjects research.
Study Population
Inclusion Criteria
Children discharged following an observation or inpatient admission from a hospital participating in the PHIS database between January 1, 2013 and December 31, 2014 were eligible for inclusion if they were considered medically complex. Medical complexity was defined using Clinical Risk Groups (CRGs) version 1.8, developed by 3M Health Information Systems and the National Association of Children's Hospitals and Related Institutions. CRGs were used to assign each hospitalized patient to 1 of 9 mutually exclusive chronicity groups according to the presence, type, and severity of chronic conditions.[15, 16, 17, 18] Each patient's CRG designation was based on 2 years of previous hospital encounters.
As defined in prior studies and definitional frameworks of CMC,[1] patients belonging to CRG group 6 (significant chronic disease in 2 organ systems), CRG group 7 (dominant chronic disease in 3 organ systems), and CRG group 9 (catastrophic condition) were considered medically complex.[17, 19] Patients with malignancies (CRG group 8) were not included for analysis because they are a unique population with anticipated, long hospital stays. Patients with CRG group 5, representing those with chronic conditions affecting a single body system, were also not included because most do not have attributes consistent with medical complexity.
Exclusion Criteria
We used the APR‐DRG system, which leverages ICD‐9‐CM codes to identify the health problem most responsible for the hospitalization, to refine the study cohort. We excluded hospitalizations that were classified by the APR‐DRG system as neonatal, as we did not wish to focus on LOS in the neonatal intensive care unit (ICU) or for birth admissions. Similarly, hospitalizations for chemotherapy (APR‐DRG 693) or malignancy (identified with previously used ICD‐9‐CM codes)[20] were also excluded because long LOS is anticipated. We also excluded hospitalizations for medical rehabilitation (APR‐DRG 860).
Outcome Measures
The primary outcome measure was long LOS, defined as LOS 10 days. The cut point of LOS 10 days represents the 90th percentile of LOS for all children, with and without medical complexity, hospitalized during 2013 to 2014. LOS 10 days has previously been used as a threshold of long LOS.[21] For hospitalizations involving transfer at admission from another acute care facility, LOS was measured from the date of transfer. We also assessed hospitals' cost attributable to long LOS admissions.
Patient Demographics and Clinical Characteristics
We measured demographic characteristics including age, gender, race/ethnicity, insurance type, and distance traveled (the linear distance between the centroid of the patient's home ZIP code and the centroid of the hospital's ZIP code). Clinical characteristics included CRG classification, complex chronic condition (CCC), and dependence on medical technology. CCCs are defined as any medical condition that can be reasonably expected to last at least 12 months (unless death intervenes) and to involve either several different organ systems or 1 system severely enough to require specialty pediatric care and probably some period of hospitalization in a tertiary care center.[20] Medical technology included devices used to optimize the health and functioning of the child (eg, gastrostomy, tracheostomy, cerebrospinal fluid shunt).[22]
Hospitalization Characteristics
Characteristics of the hospitalization included transfer from an outside facility, ICU admission, surgical procedure (using surgical APR‐DRGs), and discharge disposition (home, skilled nursing facility, home health services, death, other). Cost of the hospitalization was estimated in the PHIS from charges using hospital and year‐specific ratios of cost to charge.
Statistical Analysis
Continuous data (eg, distance from hospital to home residence) were described with median and interquartile ranges (IQR) because they were not normally distributed. Categorical data (eg, type of chronic condition) were described with counts and frequencies. In bivariate analyses, demographic, clinical, and hospitalization characteristics were stratified by LOS (long LOS vs LOS <10 days), and compared using 2 statistics or Wilcoxon rank sum tests as appropriate.
We modeled the likelihood of experiencing a long LOS using generalized linear mixed effects models with a random hospital intercept and discharge‐level fixed effects for age, gender, payor, CCC type, ICU utilization, transfer status, a medical/surgical admission indicator derived from the APR‐DRG, and CRG assigned to each hospitalization. To examine hospital‐to‐hospital variability, we generated hospital risk‐adjusted rates of long LOS from these models. Similar models and hospital risk‐adjusted rates were built for a post hoc correlational analysis of 30‐day all cause readmission, where hospitals' rates and percent of long LOS were compared with a Pearson correlation coefficient. Also, for our multivariable models, we performed a sensitivity analysis using an alternative definition of long LOS as 4 days (the 75th percentile of LOS for all children, with and without medical complexity, hospitalized during 20132014). All analyses were performed using SAS version 9.4 (SAS Institute, Cary, NC), and P values <0.05 were considered statistically significant.
RESULTS
Study Population
There were 954,018 hospitalizations of 217,163 CMC at 44 children's hospitals included for analysis. Forty‐seven percent of hospitalizations were for females, 49.4% for non‐Hispanic whites, and 61.1% for children with government insurance. Fifteen percent (n = 142,082) had a long LOS of 10 days. The median (IQR) LOS of hospitalizations <10 days versus 10 days were 2 (IQR, 14) and 16 days (IQR, 1226), respectively. Long LOS hospitalizations accounted for 61.1% (3.7 million) hospital days and 61.8% ($13.7 billion) of total hospitalization costs for all CMC in the cohort (Table 1).
| Characteristic | Overall (n = 954,018) | Length of Stay | |
|---|---|---|---|
| <10 Days (n = 811,936) | 10 Days (n = 142,082) | ||
| |||
| Age at admission, y, % | |||
| <1 | 14.6 | 12.7 | 25.7 |
| 14 | 27.1 | 27.9 | 22.4 |
| 59 | 20.1 | 21.0 | 14.9 |
| 1018 | 33.6 | 34.0 | 31.7 |
| 18+ | 4.6 | 4.4 | 5.4 |
| Gender, % | |||
| Female | 47.0 | 46.9 | 47.5 |
| Race/ethnicity, % | |||
| Non‐Hispanic white | 49.4 | 49.4 | 49.4 |
| Non‐Hispanic black | 23.1 | 23.8 | 19.3 |
| Hispanic | 18.2 | 17.8 | 20.4 |
| Asian | 2.0 | 1.9 | 2.3 |
| Other | 7.4 | 7.1 | 8.6 |
| Complex chronic condition, % | |||
| Any | 79.5 | 77.3 | 91.8 |
| Technology assistance | 37.1 | 34.1 | 54.2 |
| Gastrointestinal | 30.0 | 27.2 | 45.9 |
| Neuromuscular | 28.2 | 27.7 | 30.9 |
| Cardiovascular | 16.8 | 14.5 | 29.9 |
| Respiratory | 14.1 | 11.5 | 29.4 |
| Congenital/genetic defect | 17.2 | 16.7 | 20.2 |
| Metabolic | 9.9 | 8.9 | 15.4 |
| Renal | 10.1 | 9.5 | 13.8 |
| Hematology/emmmunodeficiency | 11.7 | 12.0 | 10.0 |
| Neonatal | 3.8 | 3.1 | 7.7 |
| Transplantation | 4.5 | 4.2 | 6.7 |
| Clinical risk group, % | |||
| Chronic condition in 2 systems | 68.4 | 71.2 | 53.9 |
| Catastrophic chronic condition | 31.4 | 28.8 | 46.1 |
| Distance from hospital to home residence in miles, median [IQR] | 16.2 [7.440.4] | 15.8 [7.338.7] | 19.1 [8.552.6] |
| Transferred from outside hospital (%) | 6.5 | 5.3 | 13.6 |
| Admitted for surgery, % | 23.4 | 20.7 | 38.7 |
| Use of intensive care, % | 19.6 | 14.9 | 46.5 |
| Discharge disposition, % | |||
| Home | 91.2 | 92.9 | 81.4 |
| Home healthcare | 4.5 | 3.5 | 9.9 |
| Other | 2.9 | 2.6 | 4.5 |
| Postacute care facility | 1.1 | 0.8 | 3.1 |
| Died | 0.4 | 0.3 | 1.1 |
| Payor, % | |||
| Government | 61.1 | 60.6 | 63.5 |
| Private | 33.2 | 33.6 | 30.9 |
| Other | 5.7 | 5.7 | 5.7 |
| Hospital resource use | |||
| Median length of stay [IQR] | 3 [16] | 2 [14] | 16 [1226] |
| Median hospital cost [IQR] | $8,144 [$4,122$18,447] | $6,689 [$3,685$12,395] | $49,207 [$29,444$95,738] |
| Total hospital cost, $, billions | $22.2 | $8.5 | $13.7 |
Demographics and Clinical Characteristics of Children With and Without Long LOS
Compared with hospitalized CMC with LOS <10 days, a higher percentage of hospitalizations with LOS 10 days were CMC age <1 year (25.7% vs 12.7%, P < 0.001) and Hispanic (20.4% vs 17.8%, P < 0.001). CMC hospitalizations with a long LOS had a higher percentage of any CCC (91.8% vs 77.3%, P < 0.001); the most common CCCs were gastrointestinal (45.9%), neuromuscular (30.9%), and cardiovascular (29.9%). Hospitalizations of CMC with a long LOS had a higher percentage of a catastrophic chronic condition (46.1% vs 28.8%, P < 0.001) and technology dependence (46.1% vs 28.8%, P < 0.001) (Table 1).
Hospitalization Characteristics of Children With and Without Long LOS
Compared with hospitalizations of CMC with LOS <10 days, hospitalizations of CMC with a long LOS more often involved transfer in from another hospital at admission (13.6% vs 5.3%, P < 0.001). CMC hospital stays with a long LOS more often involved surgery (38.7% vs 20.7%, P < 0.001) and use of intensive care (46.5% vs 14.9%; P < 0.001). A higher percentage of CMC with long LOS were discharged with home health services (9.9% vs 3.5%; P < 0.001) (Table 1).
The most common admitting diagnoses and CCCs for hospitalizations of CMC with long LOS are presented in Table 2. The two most prevalent APR‐DRGs in CMC hospitalizations lasting 10 days or longer were cystic fibrosis (10.7%) and respiratory system disease with ventilator support (5.5%). The two most common chronic condition characteristics represented among long CMC hospitalizations were gastrointestinal devices (eg, gastrostomy tube) (39.7%) and heart and great vessel malformations (eg, tetralogy of Fallot) (12.8%). The 5 most common CCC subcategories, as listed in Table 2, account for nearly 100% of the patients with long LOS hospitalizations.
| |
| Most common reason for admission* | |
| Cystic fibrosis | 10.7% |
| Respiratory system diagnosis with ventilator support 96+ hours | 5.5% |
| Malfunction, reaction, and complication of cardiac or vascular device or procedure | 2.8% |
| Craniotomy except for trauma | 2.6% |
| Major small and large bowel procedures | 2.3% |
| Most common complex chronic condition | |
| Gastrointestinal devices | 39.7% |
| Heart and great vessel malformations | 12.8% |
| Cystic fibrosis | 12.5% |
| Dysrhythmias | 11.0% |
| Respiratory devices | 10.7% |
Multivariable Analysis of Characteristics Associated With Long LOS
In multivariable analysis, the highest likelihood of long LOS was experienced by children who received care in the ICU (odds ratio [OR]: 3.5, 95% confidence interval [CI]: 3.43.5), who had a respiratory CCC (OR: 2.7, 95% CI: 2.62.7), and who were transferred from another acute care hospital at admission (OR: 2.1, 95% CI: 2.0, 2.1). The likelihood of long LOS was also higher in children <1 year of age (OR: 1.2, 95% CI: 1.21.3), and Hispanic children (OR: 1.1, 95% CI 1.0‐1.10) (Table 3). Similar multivariable findings were observed in sensitivity analysis using the 75th percentile of LOS (4 days) as the model outcome.
| Characteristic | Odds Ratio (95% CI) of LOS 10 Days | P Value |
|---|---|---|
| ||
| Use of intensive care | 3.5 (3.4‐3.5) | <0.001 |
| Transfer from another acute‐care hospital | 2.1 (2.0‐2.1) | <0.001 |
| Procedure/surgery | 1.8 (1.8‐1.9) | <0.001 |
| Complex chronic condition | ||
| Respiratory | 2.7 (2.6‐2.7) | <0.001 |
| Gastrointestinal | 1.8 (1.8‐1.8) | <0.001 |
| Metabolic | 1.7 (1.7‐1.7) | <0.001 |
| Cardiovascular | 1.6 (1.5‐1.6) | <0.001 |
| Neonatal | 1.5 (1.5‐1.5) | <0.001 |
| Renal | 1.4 (1.4‐1.4) | <0.001 |
| Transplant | 1.4 (1.4‐1.4) | <0.001 |
| Hematology and immunodeficiency | 1.3 (1.3‐1.3) | <0.001 |
| Technology assistance | 1.1 (1.1, 1.1) | <0.001 |
| Neuromuscular | 0.9 (0.9‐0.9) | <0.001 |
| Congenital or genetic defect | 0.8 (0.8‐0.8) | <0.001 |
| Age at admission, y | ||
| <1 | 1.2 (1.2‐1.3) | <0.001 |
| 14 | 0.5 (0.5‐0.5) | <0.001 |
| 59 | 0.6 (0.6‐0.6) | <0.001 |
| 1018 | 0.9 (0.9‐0.9) | <0.001 |
| 18+ | Reference | |
| Male | 0.9 (0.9‐0.9) | <0.001 |
| Race/ethnicity | ||
| Non‐Hispanic black | 0.9 (0.9‐0.9) | <0.001 |
| Hispanic | 1.1 (1.0‐1.1) | <0.001 |
| Asian | 1.0 (1.0‐1.1) | 0.3 |
| Other | 1.1 (1.1‐1.1) | <0.001 |
| Non‐Hispanic white | Reference | |
| Payor | ||
| Private | 0.9 (0.8 0.9) | <0.001 |
| Other | 1.0 (1.0‐1.0) | 0.4 |
| Government | Reference | |
| Season | ||
| Spring | 1.0 (1.0 1.0) | <0.001 |
| Summer | 0.9 (0.9‐0.9) | <0.001 |
| Fall | 1.0 (0.9‐1.0) | <0.001 |
| Winter | Reference | |
Variation in the Prevalence of Long LOS Across Children's Hospitals
After controlling for demographic, clinical, and hospital characteristics associated with long LOS, there was significant (P < 0.001) variation in the prevalence of long LOS for CMC across children's hospitals in the cohort (range, 10.3%21.8%) (Figure 1). Twelve (27%) hospitals had a significantly (P < 0.001) higher prevalence of long LOS for their hospitalized CMC, compared to the mean. Eighteen (41%) had a significantly (P < 0.001) lower prevalence of long LOS for their hospitalized CMC. There was also significant variation across hospitals with respect to cost, with 49.7% to 73.7% of all hospital costs of CMC attributed to long LOS hospitalizations. Finally, there was indirect correlation with the prevalence of LOS across hospitals and the hospitals' 30‐day readmission rate ( = 0.3; P = 0.04). As the prevalence of long LOS increased, the readmission rate decreased.
DISCUSSION
The main findings from this study suggest that a small percentage of CMC experiencing long LOS account for the majority of hospital bed days and cost of all hospitalized CMC in children's hospitals. The likelihood of long LOS varies significantly by CMC's age, race/ethnicity, and payor as well as by type and number of chronic conditions. Among CMC with long LOS, the use of gastrointestinal devices such as gastrostomy tubes, as well as congenital heart disease, were highly prevalent. In multivariable analysis, the characteristics most strongly associated with LOS 10 days were use of the ICU, respiratory complex chronic condition, and transfer from another medical facility at admission. After adjusting for these factors, there was significant variation in the prevalence of LOS 10 days for CMC across children's hospitals.
Although it is well known that CMC as a whole have a major impact on resource use in children's hospitals, this study reveals that 15% of hospitalizations of CMC account for 62% of all hospital costs of CMC. That is, a small fraction of hospitalizations of CMC is largely responsible for the significant financial impact of hospital resource use. To date, most clinical efforts and policies striving to reduce hospital use in CMC have focused on avoiding readmissions or index hospital admissions entirely, rather than improving the efficiency of hospital care after admission occurs.[23, 24, 25, 26] In the adult population, the impact of long LOS on hospital costs has been recognized, and several Medicare incentive programs have focused on in‐hospital timeliness and efficiency. As a result, LOS in Medicare beneficiaries has decreased dramatically over the past 2 decades.[27, 28, 29, 30] Optimizing the efficiency of hospital care for CMC may be an important goal to pursue, especially with precedent set in the adult literature.
Perhaps the substantial variation across hospitals in the prevalence of long LOS in CMC indicates opportunity to improve the efficiency of their inpatient care. This variation was not due to differences across hospitals' case mix of CMC. Further investigation is needed to determine how much of it is due to differences in quality of care. Clinical practice guidelines for hospital treatment of common illnesses usually exclude CMC. In our clinical experience across 9 children's hospitals, we have experienced varying approaches to setting discharge goals (ie, parameters on how healthy the child needs to be to ensure a successful hospital discharge) for CMC.[31] When the goals are absent or not clearly articulated, they can contribute to a prolonged hospitalization. Some families of CMC report significant issues when working with pediatric hospital staff to assess their child's discharge readiness.[7, 32, 33] In addition, there is significant variation across states and regions in access to and quality of post‐discharge health services (eg, home nursing, postacute care, durable medical equipment).[34, 35] In some areas, many CMC are not actively involved with their primary care physician.[5] These issues might also influence the ability of some children's hospitals to efficiently discharge CMC to a safe and supportive post‐discharge environment. Further examination of hospital outliersthose with the lowest and highest percentage of CMC hospitalizations with long LOSmay reveal opportunities to identify and spread best practices.
The demographic and clinical factors associated with long LOS in the present study, including age, ICU use, and transfer from another hospital, might help hospitals target which CMC have the greatest risk for experiencing long LOS. We found that infants age <1 year had longer LOS when compared with older children. Similar to our findings, younger‐aged children hospitalized with bronchiolitis have longer LOS.[36] Certainly, infants with medical complexity, in general, are a high‐acuity population with the potential for rapid clinical deterioration during an acute illness. Prolonged hospitalization for treatment and stabilization may be expected for many of them. Additional investigation is warranted to examine ICU use in CMC, and whether ICU admission or duration can be safely prevented or abbreviated. Opportunities to assess the quality of transfers into children's hospitals of CMC admitted to outside hospitals may be necessary. A study of pediatric burn patients reported that patients initially stabilized at a facility that was not a burn center and subsequently transferred to a burn center had a longer LOS than patients solely treated at a designated burn center.[37] Furthermore, events during transport itself may adversely impact the stability of an already fragile patient. Interventions to optimize the quality of care provided by transport teams have resulted in decreased LOS at the receiving hospital.[38]
This study's findings should be considered in the context of several limitations. Absent a gold‐standard definition of long LOS, we used the distribution of LOS across patients to inform our methods; LOS at the 90th percentile was selected as long. Although our sensitivity analysis using LOS at the 75th percentile produced similar findings, other cut points in LOS might be associated with different results. The study is not positioned to determine how much of the reported LOS was excessive, unnecessary, or preventable. The study findings may not generalize to types of hospitals not contained in PHIS (eg, nonchildren's hospitals and community hospitals). We did not focus on the impact of a new diagnosis (eg, new chronic illness) or acute in‐hospital event (eg, nosocomial infection) on prolonged LOS; future studies should investigate these clinical events with LOS.
PHIS does not contain information regarding characteristics that could influence LOS, including the children's social and familial attributes, transportation availability, home equipment needs, and local availability of postacute care facilities. Moreover, PHIS does not contain information about the hospital discharge procedures, process, or personnel across hospitals, which could influence LOS. Future studies on prolonged LOS should consider assessing this information. Because of the large sample size of hospitalizations included, the statistical power for the analyses was strong, rendering it possible that some findings that were statistically significant might have modest clinical significance (eg, relationship of Hispanic ethnicity with prolonged LOS). We could not determine why a positive correlation was not observed between hospitals' long LOS prevalence and their percentage of cost associated with long LOS; future studies should investigate the reasons for this finding.
Despite these limitations, the findings of the present study highlight the significance of long LOS in hospitalized CMC. These long hospitalizations account for a significant proportion of all hospital costs for this important population of children. The prevalence of long LOS for CMC varies considerably across children's hospitals, even after accounting for the case mix. Efforts to curtail hospital resource use and costs for CMC may benefit from focus on long LOS.
- , , , et al. Inpatient growth and resource use in 28 children's hospitals: a longitudinal, multi‐institutional study. JAMA Pediatr. 2013;167(2):170–177.
- , , , et al. Children with complex chronic conditions in inpatient hospital settings in the united states. Pediatrics. 2010;126(4):647–655.
- , . Meeting the health care needs of persons with disabilities. Milbank Q. 2002;80(2):381–391.
- , , , et al. Effect of an enhanced medical home on serious illness and cost of care among high‐risk children with chronic illness: a randomized clinical trial. JAMA. 2014;312(24):2640–2648.
- , , , et al. Children with medical complexity and Medicaid: spending and cost savings. Health Aff Proj Hope. 2014;33(12):2199–2206.
- Children's Hospital Association. CARE Award. Available at: https://www.childrenshospitals.org/Programs‐and‐Services/Quality‐Improvement‐and‐Measurement/CARE‐Award. Accessed December 18, 2015.
- , , , et al. Hospital readmission and parent perceptions of their child's hospital discharge. Int J Qual Health Care. 2013;25(5):573–581.
- , , , et al. Weekend matters: Friday and Saturday admissions are associated with prolonged hospitalization of children. Clin Pediatr (Phila). 2013;52(9):875–878.
- , , , . Attributable cost and length of stay for central line‐associated bloodstream infections. Pediatrics. 2014;133(6):e1525–e1532.
- , , , et al. Effect of healthcare‐acquired infection on length of hospital stay and cost. Infect Control Hosp Epidemiol. 2007;28(3):280–292.
- , , , , . Hospital utilization and costs among children with influenza, 2003. Am J Prev Med. 2009;36(4):292–296.
- , , , . Charges and lengths of stay attributable to adverse patient‐care events using pediatric‐specific quality indicators: a multicenter study of freestanding children's hospitals. Pediatrics. 2008;121(6):e1653–e1659.
- , , , , . Variation in resource utilization for the management of uncomplicated community‐acquired pneumonia across community and children's hospitals. J Pediatr. 2014;165(3):585–591.
- , , , , . Variation and outcomes associated with direct hospital admission among children with pneumonia in the United States. JAMA Pediatr. 2014;168(9):829–836.
- , , , et al. Clinical Risk Groups (CRGs): a classification system for risk‐adjusted capitation‐based payment and health care management. Med Care. 2004;42(1):81–90.
- , , , et al. Identifying children with lifelong chronic conditions for care coordination by using hospital discharge data. Acad Pediatr. 2010;10(6):417–423.
- , , , , . Profile of medical charges for children by health status group and severity level in a Washington State Health Plan. Health Serv Res. 2004;39(1):73–89.
- , , , . Using medical billing data to evaluate chronically ill children over time. J Ambulatory Care Manage. 2006;29(4):283–290.
- , , , , , . Medical complexity and pediatric emergency department and inpatient utilization. Pediatrics. 2013;131(2):e559–e565.
- , , , , . Pediatric complex chronic conditions classification system version 2: updated for ICD‐10 and complex medical technology dependence and transplantation. BMC Pediatr. 2014;14:199.
- . Analyzing intensive care unit length of stay data: problems and possible solutions. Crit Care Med. 1997;25(9):1594–1600.
- , , , et al. Hospital utilization and characteristics of patients experiencing recurrent readmissions within children's hospitals. JAMA. 2011;305(7):682–690.
- . Hospital readmissions and repeat emergency department visits among children with medical complexity: an integrative review. J Pediatr Nurs. 2013;28(4):316–339.
- , , , . Hospital readmission in children with complex chronic conditions discharged from subacute care. Hosp Pediatr. 2014;4(3):153–158.
- , , , et al. Preventing hospitalizations in children with medical complexity: a systematic review. Pediatrics. 2014;134(6):e1628–e1647.
- , , , . Hospital readmissions for newly discharged pediatric home mechanical ventilation patients. Pediatr Pulmonol. 2012;47(4):409–414.
- , , , et al. Clinical characteristics and outcomes of Medicare patients undergoing total hip arthroplasty, 1991–2008. JAMA. 2011;305(15):1560–1567.
- , , , et al. Trends in length of stay and short‐term outcomes among Medicare patients hospitalized for heart failure, 1993–2006. JAMA. 2010;303(21):2141–2147.
- U.S. Department of Health and Human Services. CMS Statistics 2013. Available at: https://www.cms.gov/Research‐Statistics‐Data‐and‐Systems/Statistics‐Trends‐and‐Reports/CMS‐Statistics‐Reference‐Booklet/Downloads/CMS_Stats_2013_final.pdf. Published August 2013. Accessed October 6, 2015.
- Centers for Medicare and Medicaid Services. Evaluation of the premier hospital quality incentive demonstration. Available at: https://www.cms.gov/Research‐Statistics‐Data‐and‐Systems/Statistics‐Trends‐and‐Reports/Reports/downloads/Premier_ExecSum_2010.pdf. Published March 3, 2009. Accessed September 18, 2015.
- , , , et al. A framework of pediatric hospital discharge care informed by legislation, research, and practice. JAMA Pediatr. 2014;168(10):955–962; quiz 965–966.
- , , , , . Parent and provider perspectives on pediatric readmissions: what can we learn about readiness for discharge? Hosp Pediatr. 2015;5(11):559–565.
- , . Preventing readmissions in children: how do we do that? Hosp Pediatr. 2015;5(11):602–604.
- , , . Pediatric post‐acute hospital care: striving for identity and value. Hosp Pediatr. 2015;5(10):548–551.
- , , , et al. Pediatric hospital discharges to home health and postacute facility care: a national study. JAMA Pediatr. 2016;170(4):326–333.
- , , , et al. Bronchiolitis: clinical characteristics associated with hospitalization and length of stay. Pediatr Emerg Care. 2012;28(2):99–103.
- , , , , . The effect of transfers between health care facilities on costs and length of stay for pediatric burn patients. J Burn Care Res. 2015;36(1):178–183.
- , , , et al. Goal‐directed resuscitative interventions during pediatric interfacility transport. Crit Care Med. 2015;43(8):1692–1698.

Verbal Communication at Discharge
Timely and reliable communication of important data between hospital‐based physicians and primary care physicians is critical for prevention of medical adverse events.[1, 2] Extrapolation from high‐performance organizations outside of medicine suggests that verbal communication is an important component of patient handoffs.[3, 4] Though the Joint Commission does not mandate verbal communication during handoffs per se, stipulating instead that handoff participants have an opportunity to ask and respond to questions,[5] there is some evidence that primary care providers prefer verbal handoffs at least for certain patients such as those with medical complexity.[6] Verbal communication offers the receiver the opportunity to ask questions, but in practice, 2‐way verbal communication is often difficult to achieve at hospital discharge.
At our institution, hospital medicine (HM) physicians serve as the primary inpatient providers for nearly 90% of all general pediatric admissions. When the HM service was established, primary care physicians (PCPs) and HM physicians together agreed upon an expectation for verbal, physician‐to‐physician communication at the time of discharge. Discharge communication is provided by either residents or attendings depending on the facility. A telephone operator service called Physician Priority Link (PPL) was made available to facilitate this communication. The PPL service is staffed 24/7 by operators whose only responsibilities are to connect providers inside and outside the institution. By utilizing this service, PCPs could respond in a nonemergent fashion to discharge phone calls.
Over the last several years, PCPs have observed high variation in the reliability of discharge communication phone calls. A review of PPL phone records in 2009 showed that only 52% of HM discharges had a record of a call initiated to the PCP on the day of discharge. The overall goal of this improvement project was to improve the completion of verbal handoffs from HM physicians (residents or attendings) to PCPs. The specific aim of the project was to increase the proportion of completed verbal handoffs from on‐call residents or attendings to PCPs within 24 hours of discharge to more than 90% within 18 months.
METHODS
Human Subjects Protection
Our project was undertaken in accordance with institutional review board (IRB) policy on systems improvement work and did not require formal IRB review.
Setting
This study included all patients admitted to the HM service at an academic children's hospital and its satellite campus.
Planning the Intervention
The project was championed by physicians on the HM service and supported by a chief resident, PPL administrators, and 2 information technology analysts.
At the onset of the project, the team mapped the process for completing a discharge call to the PCPs, conducted a modified failure mode and effects analysis,[7, 8] and examined the key drivers used to prioritize interventions (Figure 1). Through the modified failure modes effect analysis, the team was able to identify system issues that led to unsuccessful communication: failure of call initiation, absence of an identified PCP, long wait times on hold, failure of PCP to call back, and failure of the call to be documented. These failure modes informed the key drivers to achieving the study aim. Figure 2 depicts the final key drivers, which were revised through testing and learning.


Interventions Targeting Key Stakeholder Buy‐in
To improve resident buy‐in and participation, the purpose and goals of the projects were discussed at resident morning report and during monthly team meetings by the pediatric chief resident on our improvement team. Resident physicians were interested in participating to reduce interruptions during daily rounds and to improve interactions with PCPs. The PPL staff was interested in standardizing the discharge call process to reduce confusion in identifying the appropriate contact when PCPs called residents back to discuss discharges. PCPs were interested in ensuring good communication at discharge, and individual PCPs were engaged through person‐to‐person contact by 1 of the HM physician champions.
Interventions to Standardization the Communication Process
To facilitate initiation of calls to PCPs at hospital discharge, the improvement team created a standard process using the PPL service (Figure 3). All patients discharged from the HM service were included in the process. Discharging physicians (who were usually but not always residents, depending on the facility), were instructed to call the PPL operator at the time of discharge. The PPL operator would then page the patient's PCP. It was the responsibility of the discharging physician to identify a PCP prior to discharge. Instances where no PCP was identified were counted as process failures because no phone call could be made. The expectation for the PCPs was that they would return the page within 20 minutes. PPL operators would then page back to the discharging physician to connect the 2 parties with the expectation that the discharging physician respond within 2 to 4 minutes to the PPL operator's page. Standardization of all calls through PPL allowed efficient tracking of incomplete calls and operators to reattempt calls that were not completed. This process also shifted the burden of following up on incomplete calls to PPL. The use of PPL to make the connection also allowed the physician to complete other work while awaiting a call back from the PCP.

Leveraging the Electronic Health Record for Process Initiation
To ensure reliable initiation of the discharge communication pathway, the improvement team introduced changes to the electronic health record (HER) (EpicCare Inpatient; Epic Systems Corp., Verona, WI), which generated a message to PPL operators whenever a discharge order was entered for an HM patient. The message contained the patient's name, medical record number, discharge date, discharging physician, and PCP name and phone number. A checklist was implemented by PPL to ensure that duplicate phone calls were not made. To initiate communication, the operator contacted the resident via text page to ensure they were ready to initiate the call. If the resident was ready to place a call, the operator then generated a phone call to the PCP. When the PCP returned the call, the operator connected the HM resident with the PCP for the handoff.
As the project progressed, several adaptations were made to address newly identified failure modes. To address confusion among PPL operators about which resident physicians should take discharge phone calls after the discharging resident was no longer available (for example, after a shift change), primary responsibility for discharge phone calls was reassigned to the daily on‐call resident rather than the resident who wrote the discharge order. Because the on‐call residents carry a single pager, the pager number listed on the automated discharge notification to PPL would never change and would always reach the appropriate team member. Second, to address the anticipated increase in interruption of resident workflow by calls back from PCPs, particularly during rounds, operators accessed information on pending discharge phone calls in batches at times of increased resident availability to minimize hold times for PCPs and work interruptions for the discharging physicians. Batch times were 1 pm and 4 pm to allow for completion of morning rounds, resident conference at noon, and patient‐care activities during the afternoon. Calls initiated after 4 pm were dispatched at the time of the discharge, and calls initiated after 10 pm were deferred to the following day.
Transparency of Data
Throughout the study, weekly failure data were generated from the EHR and emailed to improvement team members, enabling them to focus on near real‐time feedback of data to create a visible and more reliable system. With the standardization of all discharge calls directed to the PPL operators, the team was able to create a call record linked to the patient's medical record number. Team‐specific and overall results for the 5 HM resident teams were displayed weekly on a run chart in the resident conference room. As improvements in call initiation were demonstrated, completion rate data were also shared every several months with the attending hospitalists during a regularly scheduled divisional conference. This transparency of data gave the improvement team the opportunity to provide individual feedback to residents and attendings about failures. The weekly review of failure data allowed team leaders to learn from failures, identify knowledge gaps, and ensure accountability with the HM physicians.
Planning the Study of the Intervention
Data were collected prospectively from July 2011 to March 2014. A weekly list of patients discharged from the HM service was extracted from the EHR and compared to electronic call logs collected by PPL on the day of discharge. A standard sample size of 30 calls was audited separately by PPL and 1 of the physician leads to verify that the patients were discharged from the HM service and validate the percentage of completed and initiated calls.
The percentage of calls initiated within 24 hours of discharge was tracked as a process measure and served as the initial focus of improvement efforts. Our primary outcome measure was the percentage of calls completed to the PCP by the HM physician within 24 hours of discharge.
Methods of Evaluation and Analysis
We used improvement science methods and run charts to determine the percentage of patients discharged from the HM service with a call initiated to the PCP and completed within 24 hours of discharge. Data on calls initiated within 24 hours of discharge were plotted on a run chart to examine the impact of interventions over time. Once interventions targeted at call initiation had been implemented, we began tracking our primary outcome measure. A new run chart was created documenting the percentage of calls completed. For both metrics, the centerline was adjusted using established rules for special cause variation in run charts.[9, 10, 11, 12, 13]
RESULTS
From July 2011 to March 2014, there were 6313 discharges from the HM service. The process measure (percentage of calls initiated) improved from 50% to 97% after 4 interventions (Figure 4). Data for the outcome measure (percentage of calls completed) were collected starting in August 2012, shortly after linking the EHR discharge order to the discharge call. Over the first 8 weeks, our median was 80%, which increased to a median of 93% (Figure 5). These results were sustained for 18 months.

Several key interventions were identified that were critical to achievement of our goal. Standardization of the communication process through PPL was temporally associated with a shift in the median rate of call initiation from 52% to 72%. Use of the discharge order to initiate discharge communication was associated with an increase from 72% to 97%. Finally, the percentage of completed verbal handoffs increased to more than 93% following batching of phone calls to PCPs at specific times during the day.
DISCUSSION
We used improvement and reliability science methods to implement a successful process for improving verbal handoffs from HM physicians to PCPs within 24 hours of discharge to 93%. This result has been sustained for 18 months.
Utilization of the PPL call center for flexible call facilitation along with support for data analysis and leveraging the EHR to automate the process increased reliability, leading to rapid improvement. Prior to mandating the use of PPL to connect discharging physicians with PCPs, the exact rate of successful handoffs in our institution was not known. We do know, however, that only 52% of calls were initiated, so clearly a large gap was present prior to our improvement work. Data collection from the PPL system was automated so that accurate, timely, and sustainable data could be provided, greatly aiding improvement efforts. Flexibility in call‐back timing was also crucial, because coordinating the availability of PCPs and discharging physicians is often challenging. The EHR‐initiated process for discharge communication was a key intervention, and improvement of our process measure to 97% performance was associated with this implementation. Two final interventions: (1) assignment of responsibility for communication to a team pager held by a designated resident and (2) batching of calls to specific times streamlined the EHR‐initiated process and were associated with achievement of our main outcome goal of >90% completed verbal communication.
There are several reports of successful interventions to improve receipt or content of discharge summaries by PCPs following hospital discharge available in the literature.[14, 15, 16, 17, 18, 19, 20] Recently, Shen et al. reported on the success of a multisite improvement collaborative involving pediatric hospitalist programs at community hospitals whose aim was to improve the timely documentation of communication directed at PCPs.[21] In their report, all 7 hospital sites that participated in the collaborative for more than 4 months were able to demonstrate substantial improvement in documentation of some form of communication directed at PCPs (whether by e‐mail, fax, or telephone call), from a baseline of approximately 50% to more than 90%. A limitation of their study was that they were unable to document whether PCPs had received any information or by what method. A recent survey of PCPs by Sheu et al. indicated that for many discharges, information in addition to that present in the EHR was desirable to ensure a safe transition of care.[6] Two‐way communication, such as with a phone call, allows for senders to verify information receipt and for receivers to ask questions to ensure complete information. To our knowledge, there have been no previous reports describing processes for improving verbal communication between hospitalist services and PCPs at discharge.
It may be that use of the call system allowed PCPs to return phone calls regarding discharges at convenient stopping points in their day while allowing discharging physicians to initiate a call without having to wait on hold. Interestingly, though we anticipated the need for additional PPL resources during the course of this improvement, the final process was efficient enough that PPL did not require additional staffing to accommodate the higher call volume.
A key insight during our implementation was that relying on the EHR to initiate every discharge communication created disruption of resident workflow due to disregard of patient, resident, and PCP factors. This was reflected by the improvement in call initiation (our process measure) following this intervention, whereas at the same time call completion (our outcome measure) remained below goal. To achieve our goal of completing verbal communication required a process that was highly reliable yet flexible enough to allow discharging physicians to complete the call in the unpredictable environment of inpatient care. Ultimately, this was achieved by allowing discharging physicians to initiate the process when convenient, and allowing for the EHR‐initiated process to function as a backup strategy to identify and mitigate failures of initiation.
An important limitation of our study was the lack of PCPs on the improvement team, likely making the success of the project more difficult than it might have been. For example, during the study we did not measure the time PCPs spent on hold or how many reattempts were needed to complete the communication loop. Immediately following the completion of our study, it became apparent that physicians returning calls for our own institution's primary care clinic were experiencing regular workflow interruptions and occasional hold times more than 20 minutes, necessitating ongoing further work to determine the root causes and solutions to these problems. Though this work is ongoing, average PCP hold times measured from a sample of call reviews in 2013 to 2014 was 3 minutes and 15 seconds.
This study has several other limitations. We were unable to account for phone calls to PCPs initiated outside of the new process. It may be that PCPs were called more than 52% of the time at baseline due to noncompliance with the new protocol. Also, we only have data for call completion starting after implementation of the link between the discharge order and the discharge phone call, making the baseline appear artificially high and precluding any analysis of how earlier interventions affected our outcome metric. Communication with PCPs should ideally occur prior to discharge. An important limitation of our process is that calls could occur several hours after discharge between an on‐call resident and an on‐call outpatient physician rather than between the PCP and the discharging resident, limiting appropriate information exchange. Though verbal discharge communication is a desirable goal for many reasons, the current project did not focus on the quality of the call or the information that was transmitted to the PCP. Additionally, direct attending‐to‐attending communication may be valuable with medically or socially complex discharges, but we did not have a process to facilitate this. We also did not measure what effect our new process had on outcomes such as quality of patient and family transition from hospital or physician satisfaction. The existence of programs similar to our PPL subspecialty referral line may be limited to large institutions. However, it should be noted that although some internal resource reallocation was necessary within PPL, no actual staffing increases were required despite a large increase in call volume. It may be that any hospital operator system could be adapted for this purpose with modest additional resources. Finally, although our EHR system is widely utilized, there are many competing systems in the market, and our intervention required utilization of EHR capabilities that may not be present in all systems. However, our EHR intervention utilized existing functionality and did not require modification of the system.
This project focused on discharge phone calls to primary care physicians for patients hospitalized on the hospital medicine service. Because communication with the PCP should ideally occur prior to discharge, future work will include identifying a more proximal trigger than the discharge order to which to link the EHR trigger for discharge communication. Other next steps to improve handoff effectiveness and optimize the efficiency of our process include identifying essential information that should be transmitted to the primary care physician at the time of the phone call, developing processes to ensure communication of this information, measuring PCP satisfaction with this communication, and measuring the impact on patient outcomes. Finally, though expert opinion indicates that verbal handoffs may have safety advantages over nonverbal handoffs, studies comparing the safety and efficacy of verbal versus nonverbal handoffs at patient discharge are lacking. Studies establishing the relative efficacy and safety of verbal versus nonverbal handoffs at hospital discharge are needed. Knowledge gained from these activities could inform future projects centered on the spread of the process to other hospital services and/or other hospitals.
CONCLUSION
We increased the percentage of calls initiated to PCPs at patient discharge from 52% to 97% and the percentage of calls completed between HM physicians and PCPs to 93% through the use of a standardized discharge communication process coupled with a basic EHR messaging functionality. The results of this study may be of interest for further testing and adaptation for any institution with an electronic healthcare system.
Disclosure: Nothing to report.
- , , . Passing the clinical baton: 6 principles to guide the hospitalist. Am J Med. 2001;111(9B):36S–39S.
- , , , , . Evaluating communication between pediatric primary care physicians and hospitalists. Clin Pediatr. 2011;50(10):923–928.
- , , , , , . Hospitalist handoffs: a systematic review and task force recommendations. J Hosp Med. 2009;4(7):433–440.
- , , , , . Handoff strategies in settings with high consequences for failure: lessons for health care operations. Int J Qual Health Care. 2004;16(2):125–132.
- Agency for Healthcare Research and Quality. Patient safety primers: handoffs and signouts. Available at: http://www.psnet.ahrq.gov/primer.aspx?primerID=9. Accessed March 19, 2014.
- , , , , . We need to talk: primary care provider communication at discharge in the era of a shared electronic medical record. J Hosp Med. 2015;10(5):307–310.
- , , . Failure mode and effects analysis: a novel approach to avoiding dangerous medication errors and accidents. Hosp Pharm. 1994;29:319–330.
- , , , . Using health care Failure Mode and Effect Analysis: the VA National Center for Patient Safety's prospective risk analysis system. Jt Comm J Qual Improv. 2002;28:248–267, 209.
- . Statistical quality control methods in infection control and hospital epidemiology, Part II: Chart use, statistical properties, and research issues. Infect Control Hosp Epidemiol. 1998;19(4):265–283.
- . Statistical quality control methods in infection control and hospital epidemiology, part I: Introduction and basic theory. Infect Control Hosp Epidemiol. 1998;19(3):194–214.
- , , . Statistical process control as a tool for research and healthcare improvement. Qual Saf Health Care. 2003;12(6):458–464.
- . The Improvement Guide: A Practical Approach to Enhancing Organizational +Performance. 2nd ed. San Francisco, CA: Jossey‐Bass; 2009.
- , . The Health Care Data Guide: Learning From Data for Improvement. 1st ed. San Francisco, CA: Jossey‐Bass; 2011.
- , . The initial hospital discharge note: send out with the patient or post? Health Trends. 1984;16(2):48.
- , . Which type of hospital discharge report reaches general practitioners most quickly? BMJ. 1989;298(6670):362–363.
- , . The application of a computer data base system to the generation of hospital discharge summaries. Obstet Gynecol. 1989;73(5 pt 1):803–807.
- . Hospital discharge medication: is seven days supply sufficient? Public Health. 1991;105(3):243–247.
- , , , et al. Electronic communication between providers of primary and secondary care. BMJ. 1992;305(6861):1068–1070.
- , , . Communication of discharge information for elderly patients in hospital. Ulster Med J. 1992;61(1):56–58.
- , , , , . A quality use of medicines program for continuity of care in therapeutics from hospital to community. Med J Aust. 2002;177(1):32–34.
- , , , , , . Pediatric hospitalists collaborate to improve timeliness of discharge communication. Hosp Pediatr. 2013;3(3):258–265.
Timely and reliable communication of important data between hospital‐based physicians and primary care physicians is critical for prevention of medical adverse events.[1, 2] Extrapolation from high‐performance organizations outside of medicine suggests that verbal communication is an important component of patient handoffs.[3, 4] Though the Joint Commission does not mandate verbal communication during handoffs per se, stipulating instead that handoff participants have an opportunity to ask and respond to questions,[5] there is some evidence that primary care providers prefer verbal handoffs at least for certain patients such as those with medical complexity.[6] Verbal communication offers the receiver the opportunity to ask questions, but in practice, 2‐way verbal communication is often difficult to achieve at hospital discharge.
At our institution, hospital medicine (HM) physicians serve as the primary inpatient providers for nearly 90% of all general pediatric admissions. When the HM service was established, primary care physicians (PCPs) and HM physicians together agreed upon an expectation for verbal, physician‐to‐physician communication at the time of discharge. Discharge communication is provided by either residents or attendings depending on the facility. A telephone operator service called Physician Priority Link (PPL) was made available to facilitate this communication. The PPL service is staffed 24/7 by operators whose only responsibilities are to connect providers inside and outside the institution. By utilizing this service, PCPs could respond in a nonemergent fashion to discharge phone calls.
Over the last several years, PCPs have observed high variation in the reliability of discharge communication phone calls. A review of PPL phone records in 2009 showed that only 52% of HM discharges had a record of a call initiated to the PCP on the day of discharge. The overall goal of this improvement project was to improve the completion of verbal handoffs from HM physicians (residents or attendings) to PCPs. The specific aim of the project was to increase the proportion of completed verbal handoffs from on‐call residents or attendings to PCPs within 24 hours of discharge to more than 90% within 18 months.
METHODS
Human Subjects Protection
Our project was undertaken in accordance with institutional review board (IRB) policy on systems improvement work and did not require formal IRB review.
Setting
This study included all patients admitted to the HM service at an academic children's hospital and its satellite campus.
Planning the Intervention
The project was championed by physicians on the HM service and supported by a chief resident, PPL administrators, and 2 information technology analysts.
At the onset of the project, the team mapped the process for completing a discharge call to the PCPs, conducted a modified failure mode and effects analysis,[7, 8] and examined the key drivers used to prioritize interventions (Figure 1). Through the modified failure modes effect analysis, the team was able to identify system issues that led to unsuccessful communication: failure of call initiation, absence of an identified PCP, long wait times on hold, failure of PCP to call back, and failure of the call to be documented. These failure modes informed the key drivers to achieving the study aim. Figure 2 depicts the final key drivers, which were revised through testing and learning.
Interventions Targeting Key Stakeholder Buy‐in
To improve resident buy‐in and participation, the purpose and goals of the projects were discussed at resident morning report and during monthly team meetings by the pediatric chief resident on our improvement team. Resident physicians were interested in participating to reduce interruptions during daily rounds and to improve interactions with PCPs. The PPL staff was interested in standardizing the discharge call process to reduce confusion in identifying the appropriate contact when PCPs called residents back to discuss discharges. PCPs were interested in ensuring good communication at discharge, and individual PCPs were engaged through person‐to‐person contact by 1 of the HM physician champions.
Interventions to Standardization the Communication Process
To facilitate initiation of calls to PCPs at hospital discharge, the improvement team created a standard process using the PPL service (Figure 3). All patients discharged from the HM service were included in the process. Discharging physicians (who were usually but not always residents, depending on the facility), were instructed to call the PPL operator at the time of discharge. The PPL operator would then page the patient's PCP. It was the responsibility of the discharging physician to identify a PCP prior to discharge. Instances where no PCP was identified were counted as process failures because no phone call could be made. The expectation for the PCPs was that they would return the page within 20 minutes. PPL operators would then page back to the discharging physician to connect the 2 parties with the expectation that the discharging physician respond within 2 to 4 minutes to the PPL operator's page. Standardization of all calls through PPL allowed efficient tracking of incomplete calls and operators to reattempt calls that were not completed. This process also shifted the burden of following up on incomplete calls to PPL. The use of PPL to make the connection also allowed the physician to complete other work while awaiting a call back from the PCP.
Leveraging the Electronic Health Record for Process Initiation
To ensure reliable initiation of the discharge communication pathway, the improvement team introduced changes to the electronic health record (HER) (EpicCare Inpatient; Epic Systems Corp., Verona, WI), which generated a message to PPL operators whenever a discharge order was entered for an HM patient. The message contained the patient's name, medical record number, discharge date, discharging physician, and PCP name and phone number. A checklist was implemented by PPL to ensure that duplicate phone calls were not made. To initiate communication, the operator contacted the resident via text page to ensure they were ready to initiate the call. If the resident was ready to place a call, the operator then generated a phone call to the PCP. When the PCP returned the call, the operator connected the HM resident with the PCP for the handoff.
As the project progressed, several adaptations were made to address newly identified failure modes. To address confusion among PPL operators about which resident physicians should take discharge phone calls after the discharging resident was no longer available (for example, after a shift change), primary responsibility for discharge phone calls was reassigned to the daily on‐call resident rather than the resident who wrote the discharge order. Because the on‐call residents carry a single pager, the pager number listed on the automated discharge notification to PPL would never change and would always reach the appropriate team member. Second, to address the anticipated increase in interruption of resident workflow by calls back from PCPs, particularly during rounds, operators accessed information on pending discharge phone calls in batches at times of increased resident availability to minimize hold times for PCPs and work interruptions for the discharging physicians. Batch times were 1 pm and 4 pm to allow for completion of morning rounds, resident conference at noon, and patient‐care activities during the afternoon. Calls initiated after 4 pm were dispatched at the time of the discharge, and calls initiated after 10 pm were deferred to the following day.
Transparency of Data
Throughout the study, weekly failure data were generated from the EHR and emailed to improvement team members, enabling them to focus on near real‐time feedback of data to create a visible and more reliable system. With the standardization of all discharge calls directed to the PPL operators, the team was able to create a call record linked to the patient's medical record number. Team‐specific and overall results for the 5 HM resident teams were displayed weekly on a run chart in the resident conference room. As improvements in call initiation were demonstrated, completion rate data were also shared every several months with the attending hospitalists during a regularly scheduled divisional conference. This transparency of data gave the improvement team the opportunity to provide individual feedback to residents and attendings about failures. The weekly review of failure data allowed team leaders to learn from failures, identify knowledge gaps, and ensure accountability with the HM physicians.
Planning the Study of the Intervention
Data were collected prospectively from July 2011 to March 2014. A weekly list of patients discharged from the HM service was extracted from the EHR and compared to electronic call logs collected by PPL on the day of discharge. A standard sample size of 30 calls was audited separately by PPL and 1 of the physician leads to verify that the patients were discharged from the HM service and validate the percentage of completed and initiated calls.
The percentage of calls initiated within 24 hours of discharge was tracked as a process measure and served as the initial focus of improvement efforts. Our primary outcome measure was the percentage of calls completed to the PCP by the HM physician within 24 hours of discharge.
Methods of Evaluation and Analysis
We used improvement science methods and run charts to determine the percentage of patients discharged from the HM service with a call initiated to the PCP and completed within 24 hours of discharge. Data on calls initiated within 24 hours of discharge were plotted on a run chart to examine the impact of interventions over time. Once interventions targeted at call initiation had been implemented, we began tracking our primary outcome measure. A new run chart was created documenting the percentage of calls completed. For both metrics, the centerline was adjusted using established rules for special cause variation in run charts.[9, 10, 11, 12, 13]
RESULTS
From July 2011 to March 2014, there were 6313 discharges from the HM service. The process measure (percentage of calls initiated) improved from 50% to 97% after 4 interventions (Figure 4). Data for the outcome measure (percentage of calls completed) were collected starting in August 2012, shortly after linking the EHR discharge order to the discharge call. Over the first 8 weeks, our median was 80%, which increased to a median of 93% (Figure 5). These results were sustained for 18 months.
Several key interventions were identified that were critical to achievement of our goal. Standardization of the communication process through PPL was temporally associated with a shift in the median rate of call initiation from 52% to 72%. Use of the discharge order to initiate discharge communication was associated with an increase from 72% to 97%. Finally, the percentage of completed verbal handoffs increased to more than 93% following batching of phone calls to PCPs at specific times during the day.
DISCUSSION
We used improvement and reliability science methods to implement a successful process for improving verbal handoffs from HM physicians to PCPs within 24 hours of discharge to 93%. This result has been sustained for 18 months.
Utilization of the PPL call center for flexible call facilitation along with support for data analysis and leveraging the EHR to automate the process increased reliability, leading to rapid improvement. Prior to mandating the use of PPL to connect discharging physicians with PCPs, the exact rate of successful handoffs in our institution was not known. We do know, however, that only 52% of calls were initiated, so clearly a large gap was present prior to our improvement work. Data collection from the PPL system was automated so that accurate, timely, and sustainable data could be provided, greatly aiding improvement efforts. Flexibility in call‐back timing was also crucial, because coordinating the availability of PCPs and discharging physicians is often challenging. The EHR‐initiated process for discharge communication was a key intervention, and improvement of our process measure to 97% performance was associated with this implementation. Two final interventions: (1) assignment of responsibility for communication to a team pager held by a designated resident and (2) batching of calls to specific times streamlined the EHR‐initiated process and were associated with achievement of our main outcome goal of >90% completed verbal communication.
There are several reports of successful interventions to improve receipt or content of discharge summaries by PCPs following hospital discharge available in the literature.[14, 15, 16, 17, 18, 19, 20] Recently, Shen et al. reported on the success of a multisite improvement collaborative involving pediatric hospitalist programs at community hospitals whose aim was to improve the timely documentation of communication directed at PCPs.[21] In their report, all 7 hospital sites that participated in the collaborative for more than 4 months were able to demonstrate substantial improvement in documentation of some form of communication directed at PCPs (whether by e‐mail, fax, or telephone call), from a baseline of approximately 50% to more than 90%. A limitation of their study was that they were unable to document whether PCPs had received any information or by what method. A recent survey of PCPs by Sheu et al. indicated that for many discharges, information in addition to that present in the EHR was desirable to ensure a safe transition of care.[6] Two‐way communication, such as with a phone call, allows for senders to verify information receipt and for receivers to ask questions to ensure complete information. To our knowledge, there have been no previous reports describing processes for improving verbal communication between hospitalist services and PCPs at discharge.
It may be that use of the call system allowed PCPs to return phone calls regarding discharges at convenient stopping points in their day while allowing discharging physicians to initiate a call without having to wait on hold. Interestingly, though we anticipated the need for additional PPL resources during the course of this improvement, the final process was efficient enough that PPL did not require additional staffing to accommodate the higher call volume.
A key insight during our implementation was that relying on the EHR to initiate every discharge communication created disruption of resident workflow due to disregard of patient, resident, and PCP factors. This was reflected by the improvement in call initiation (our process measure) following this intervention, whereas at the same time call completion (our outcome measure) remained below goal. To achieve our goal of completing verbal communication required a process that was highly reliable yet flexible enough to allow discharging physicians to complete the call in the unpredictable environment of inpatient care. Ultimately, this was achieved by allowing discharging physicians to initiate the process when convenient, and allowing for the EHR‐initiated process to function as a backup strategy to identify and mitigate failures of initiation.
An important limitation of our study was the lack of PCPs on the improvement team, likely making the success of the project more difficult than it might have been. For example, during the study we did not measure the time PCPs spent on hold or how many reattempts were needed to complete the communication loop. Immediately following the completion of our study, it became apparent that physicians returning calls for our own institution's primary care clinic were experiencing regular workflow interruptions and occasional hold times more than 20 minutes, necessitating ongoing further work to determine the root causes and solutions to these problems. Though this work is ongoing, average PCP hold times measured from a sample of call reviews in 2013 to 2014 was 3 minutes and 15 seconds.
This study has several other limitations. We were unable to account for phone calls to PCPs initiated outside of the new process. It may be that PCPs were called more than 52% of the time at baseline due to noncompliance with the new protocol. Also, we only have data for call completion starting after implementation of the link between the discharge order and the discharge phone call, making the baseline appear artificially high and precluding any analysis of how earlier interventions affected our outcome metric. Communication with PCPs should ideally occur prior to discharge. An important limitation of our process is that calls could occur several hours after discharge between an on‐call resident and an on‐call outpatient physician rather than between the PCP and the discharging resident, limiting appropriate information exchange. Though verbal discharge communication is a desirable goal for many reasons, the current project did not focus on the quality of the call or the information that was transmitted to the PCP. Additionally, direct attending‐to‐attending communication may be valuable with medically or socially complex discharges, but we did not have a process to facilitate this. We also did not measure what effect our new process had on outcomes such as quality of patient and family transition from hospital or physician satisfaction. The existence of programs similar to our PPL subspecialty referral line may be limited to large institutions. However, it should be noted that although some internal resource reallocation was necessary within PPL, no actual staffing increases were required despite a large increase in call volume. It may be that any hospital operator system could be adapted for this purpose with modest additional resources. Finally, although our EHR system is widely utilized, there are many competing systems in the market, and our intervention required utilization of EHR capabilities that may not be present in all systems. However, our EHR intervention utilized existing functionality and did not require modification of the system.
This project focused on discharge phone calls to primary care physicians for patients hospitalized on the hospital medicine service. Because communication with the PCP should ideally occur prior to discharge, future work will include identifying a more proximal trigger than the discharge order to which to link the EHR trigger for discharge communication. Other next steps to improve handoff effectiveness and optimize the efficiency of our process include identifying essential information that should be transmitted to the primary care physician at the time of the phone call, developing processes to ensure communication of this information, measuring PCP satisfaction with this communication, and measuring the impact on patient outcomes. Finally, though expert opinion indicates that verbal handoffs may have safety advantages over nonverbal handoffs, studies comparing the safety and efficacy of verbal versus nonverbal handoffs at patient discharge are lacking. Studies establishing the relative efficacy and safety of verbal versus nonverbal handoffs at hospital discharge are needed. Knowledge gained from these activities could inform future projects centered on the spread of the process to other hospital services and/or other hospitals.
CONCLUSION
We increased the percentage of calls initiated to PCPs at patient discharge from 52% to 97% and the percentage of calls completed between HM physicians and PCPs to 93% through the use of a standardized discharge communication process coupled with a basic EHR messaging functionality. The results of this study may be of interest for further testing and adaptation for any institution with an electronic healthcare system.
Disclosure: Nothing to report.
- , , . Passing the clinical baton: 6 principles to guide the hospitalist. Am J Med. 2001;111(9B):36S–39S.
- , , , , . Evaluating communication between pediatric primary care physicians and hospitalists. Clin Pediatr. 2011;50(10):923–928.
- , , , , , . Hospitalist handoffs: a systematic review and task force recommendations. J Hosp Med. 2009;4(7):433–440.
- , , , , . Handoff strategies in settings with high consequences for failure: lessons for health care operations. Int J Qual Health Care. 2004;16(2):125–132.
- Agency for Healthcare Research and Quality. Patient safety primers: handoffs and signouts. Available at: http://www.psnet.ahrq.gov/primer.aspx?primerID=9. Accessed March 19, 2014.
- , , , , . We need to talk: primary care provider communication at discharge in the era of a shared electronic medical record. J Hosp Med. 2015;10(5):307–310.
- , , . Failure mode and effects analysis: a novel approach to avoiding dangerous medication errors and accidents. Hosp Pharm. 1994;29:319–330.
- , , , . Using health care Failure Mode and Effect Analysis: the VA National Center for Patient Safety's prospective risk analysis system. Jt Comm J Qual Improv. 2002;28:248–267, 209.
- . Statistical quality control methods in infection control and hospital epidemiology, Part II: Chart use, statistical properties, and research issues. Infect Control Hosp Epidemiol. 1998;19(4):265–283.
- . Statistical quality control methods in infection control and hospital epidemiology, part I: Introduction and basic theory. Infect Control Hosp Epidemiol. 1998;19(3):194–214.
- , , . Statistical process control as a tool for research and healthcare improvement. Qual Saf Health Care. 2003;12(6):458–464.
- . The Improvement Guide: A Practical Approach to Enhancing Organizational +Performance. 2nd ed. San Francisco, CA: Jossey‐Bass; 2009.
- , . The Health Care Data Guide: Learning From Data for Improvement. 1st ed. San Francisco, CA: Jossey‐Bass; 2011.
- , . The initial hospital discharge note: send out with the patient or post? Health Trends. 1984;16(2):48.
- , . Which type of hospital discharge report reaches general practitioners most quickly? BMJ. 1989;298(6670):362–363.
- , . The application of a computer data base system to the generation of hospital discharge summaries. Obstet Gynecol. 1989;73(5 pt 1):803–807.
- . Hospital discharge medication: is seven days supply sufficient? Public Health. 1991;105(3):243–247.
- , , , et al. Electronic communication between providers of primary and secondary care. BMJ. 1992;305(6861):1068–1070.
- , , . Communication of discharge information for elderly patients in hospital. Ulster Med J. 1992;61(1):56–58.
- , , , , . A quality use of medicines program for continuity of care in therapeutics from hospital to community. Med J Aust. 2002;177(1):32–34.
- , , , , , . Pediatric hospitalists collaborate to improve timeliness of discharge communication. Hosp Pediatr. 2013;3(3):258–265.
© 2015 Society of Hospital Medicine