User login
Verbal Communication at Discharge
Timely and reliable communication of important data between hospital‐based physicians and primary care physicians is critical for prevention of medical adverse events.[1, 2] Extrapolation from high‐performance organizations outside of medicine suggests that verbal communication is an important component of patient handoffs.[3, 4] Though the Joint Commission does not mandate verbal communication during handoffs per se, stipulating instead that handoff participants have an opportunity to ask and respond to questions,[5] there is some evidence that primary care providers prefer verbal handoffs at least for certain patients such as those with medical complexity.[6] Verbal communication offers the receiver the opportunity to ask questions, but in practice, 2‐way verbal communication is often difficult to achieve at hospital discharge.
At our institution, hospital medicine (HM) physicians serve as the primary inpatient providers for nearly 90% of all general pediatric admissions. When the HM service was established, primary care physicians (PCPs) and HM physicians together agreed upon an expectation for verbal, physician‐to‐physician communication at the time of discharge. Discharge communication is provided by either residents or attendings depending on the facility. A telephone operator service called Physician Priority Link (PPL) was made available to facilitate this communication. The PPL service is staffed 24/7 by operators whose only responsibilities are to connect providers inside and outside the institution. By utilizing this service, PCPs could respond in a nonemergent fashion to discharge phone calls.
Over the last several years, PCPs have observed high variation in the reliability of discharge communication phone calls. A review of PPL phone records in 2009 showed that only 52% of HM discharges had a record of a call initiated to the PCP on the day of discharge. The overall goal of this improvement project was to improve the completion of verbal handoffs from HM physicians (residents or attendings) to PCPs. The specific aim of the project was to increase the proportion of completed verbal handoffs from on‐call residents or attendings to PCPs within 24 hours of discharge to more than 90% within 18 months.
METHODS
Human Subjects Protection
Our project was undertaken in accordance with institutional review board (IRB) policy on systems improvement work and did not require formal IRB review.
Setting
This study included all patients admitted to the HM service at an academic children's hospital and its satellite campus.
Planning the Intervention
The project was championed by physicians on the HM service and supported by a chief resident, PPL administrators, and 2 information technology analysts.
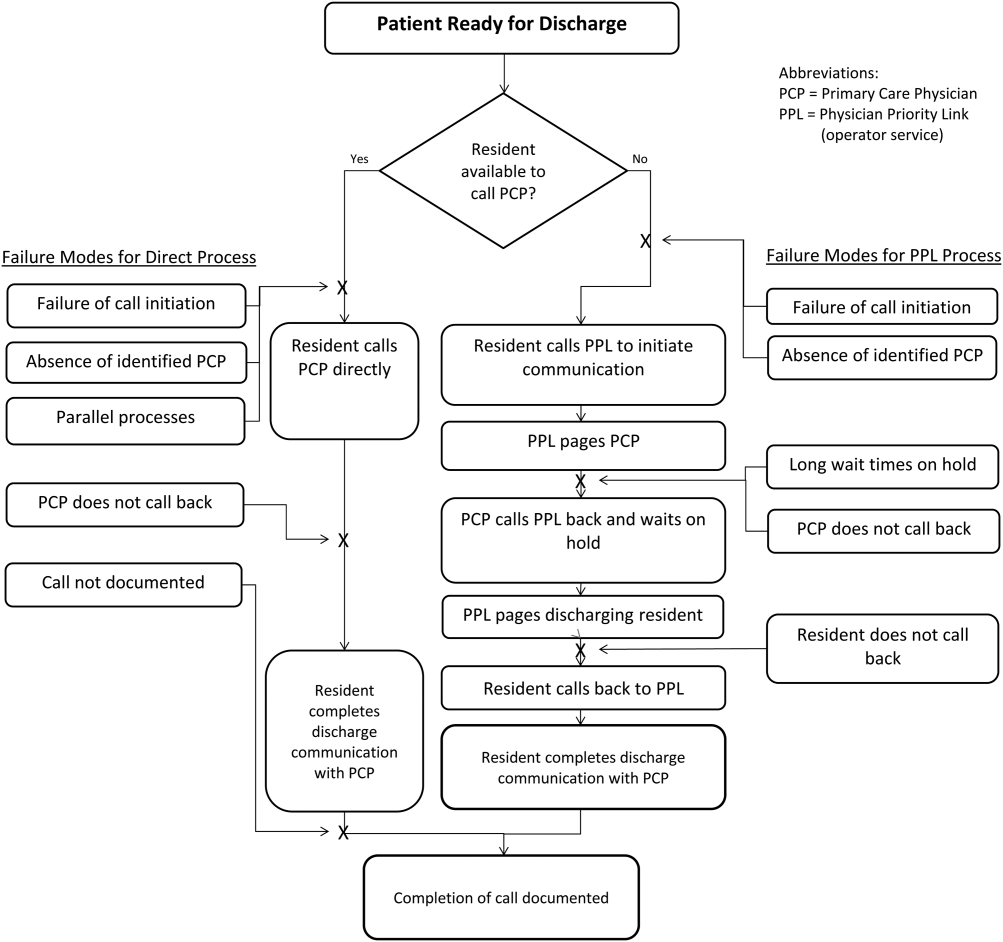
At the onset of the project, the team mapped the process for completing a discharge call to the PCPs, conducted a modified failure mode and effects analysis,[7, 8] and examined the key drivers used to prioritize interventions (Figure 1). Through the modified failure modes effect analysis, the team was able to identify system issues that led to unsuccessful communication: failure of call initiation, absence of an identified PCP, long wait times on hold, failure of PCP to call back, and failure of the call to be documented. These failure modes informed the key drivers to achieving the study aim. Figure 2 depicts the final key drivers, which were revised through testing and learning.


Interventions Targeting Key Stakeholder Buy‐in
To improve resident buy‐in and participation, the purpose and goals of the projects were discussed at resident morning report and during monthly team meetings by the pediatric chief resident on our improvement team. Resident physicians were interested in participating to reduce interruptions during daily rounds and to improve interactions with PCPs. The PPL staff was interested in standardizing the discharge call process to reduce confusion in identifying the appropriate contact when PCPs called residents back to discuss discharges. PCPs were interested in ensuring good communication at discharge, and individual PCPs were engaged through person‐to‐person contact by 1 of the HM physician champions.
Interventions to Standardization the Communication Process
To facilitate initiation of calls to PCPs at hospital discharge, the improvement team created a standard process using the PPL service (Figure 3). All patients discharged from the HM service were included in the process. Discharging physicians (who were usually but not always residents, depending on the facility), were instructed to call the PPL operator at the time of discharge. The PPL operator would then page the patient's PCP. It was the responsibility of the discharging physician to identify a PCP prior to discharge. Instances where no PCP was identified were counted as process failures because no phone call could be made. The expectation for the PCPs was that they would return the page within 20 minutes. PPL operators would then page back to the discharging physician to connect the 2 parties with the expectation that the discharging physician respond within 2 to 4 minutes to the PPL operator's page. Standardization of all calls through PPL allowed efficient tracking of incomplete calls and operators to reattempt calls that were not completed. This process also shifted the burden of following up on incomplete calls to PPL. The use of PPL to make the connection also allowed the physician to complete other work while awaiting a call back from the PCP.

Leveraging the Electronic Health Record for Process Initiation
To ensure reliable initiation of the discharge communication pathway, the improvement team introduced changes to the electronic health record (HER) (EpicCare Inpatient; Epic Systems Corp., Verona, WI), which generated a message to PPL operators whenever a discharge order was entered for an HM patient. The message contained the patient's name, medical record number, discharge date, discharging physician, and PCP name and phone number. A checklist was implemented by PPL to ensure that duplicate phone calls were not made. To initiate communication, the operator contacted the resident via text page to ensure they were ready to initiate the call. If the resident was ready to place a call, the operator then generated a phone call to the PCP. When the PCP returned the call, the operator connected the HM resident with the PCP for the handoff.
As the project progressed, several adaptations were made to address newly identified failure modes. To address confusion among PPL operators about which resident physicians should take discharge phone calls after the discharging resident was no longer available (for example, after a shift change), primary responsibility for discharge phone calls was reassigned to the daily on‐call resident rather than the resident who wrote the discharge order. Because the on‐call residents carry a single pager, the pager number listed on the automated discharge notification to PPL would never change and would always reach the appropriate team member. Second, to address the anticipated increase in interruption of resident workflow by calls back from PCPs, particularly during rounds, operators accessed information on pending discharge phone calls in batches at times of increased resident availability to minimize hold times for PCPs and work interruptions for the discharging physicians. Batch times were 1 pm and 4 pm to allow for completion of morning rounds, resident conference at noon, and patient‐care activities during the afternoon. Calls initiated after 4 pm were dispatched at the time of the discharge, and calls initiated after 10 pm were deferred to the following day.
Transparency of Data
Throughout the study, weekly failure data were generated from the EHR and emailed to improvement team members, enabling them to focus on near real‐time feedback of data to create a visible and more reliable system. With the standardization of all discharge calls directed to the PPL operators, the team was able to create a call record linked to the patient's medical record number. Team‐specific and overall results for the 5 HM resident teams were displayed weekly on a run chart in the resident conference room. As improvements in call initiation were demonstrated, completion rate data were also shared every several months with the attending hospitalists during a regularly scheduled divisional conference. This transparency of data gave the improvement team the opportunity to provide individual feedback to residents and attendings about failures. The weekly review of failure data allowed team leaders to learn from failures, identify knowledge gaps, and ensure accountability with the HM physicians.
Planning the Study of the Intervention
Data were collected prospectively from July 2011 to March 2014. A weekly list of patients discharged from the HM service was extracted from the EHR and compared to electronic call logs collected by PPL on the day of discharge. A standard sample size of 30 calls was audited separately by PPL and 1 of the physician leads to verify that the patients were discharged from the HM service and validate the percentage of completed and initiated calls.
The percentage of calls initiated within 24 hours of discharge was tracked as a process measure and served as the initial focus of improvement efforts. Our primary outcome measure was the percentage of calls completed to the PCP by the HM physician within 24 hours of discharge.
Methods of Evaluation and Analysis
We used improvement science methods and run charts to determine the percentage of patients discharged from the HM service with a call initiated to the PCP and completed within 24 hours of discharge. Data on calls initiated within 24 hours of discharge were plotted on a run chart to examine the impact of interventions over time. Once interventions targeted at call initiation had been implemented, we began tracking our primary outcome measure. A new run chart was created documenting the percentage of calls completed. For both metrics, the centerline was adjusted using established rules for special cause variation in run charts.[9, 10, 11, 12, 13]
RESULTS
From July 2011 to March 2014, there were 6313 discharges from the HM service. The process measure (percentage of calls initiated) improved from 50% to 97% after 4 interventions (Figure 4). Data for the outcome measure (percentage of calls completed) were collected starting in August 2012, shortly after linking the EHR discharge order to the discharge call. Over the first 8 weeks, our median was 80%, which increased to a median of 93% (Figure 5). These results were sustained for 18 months.
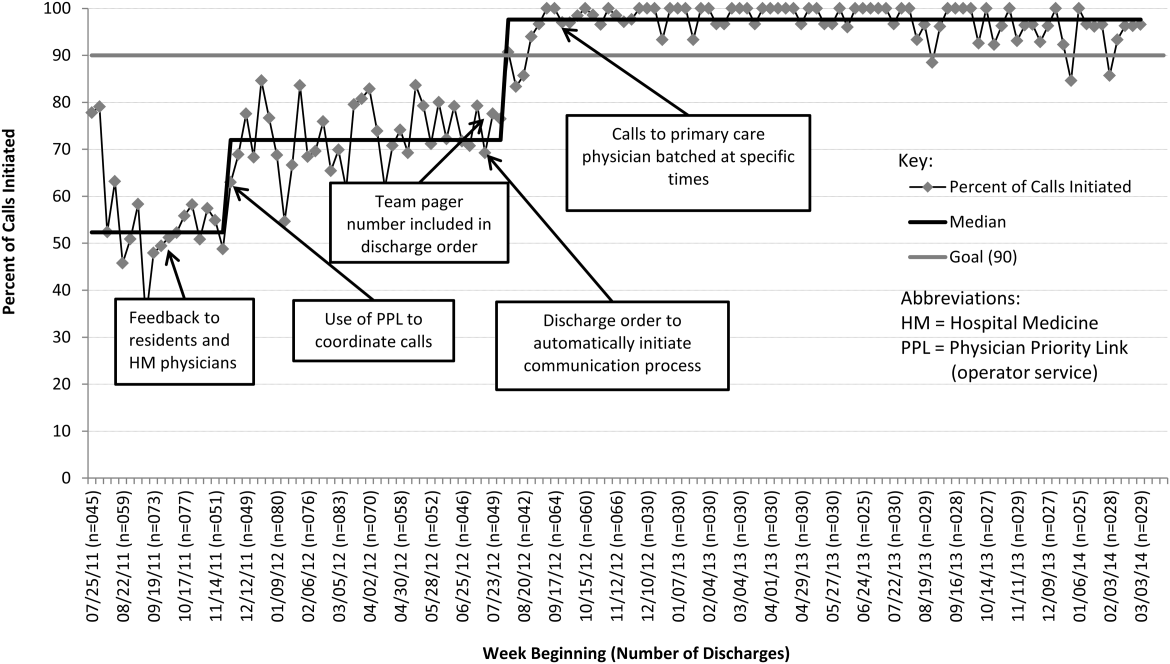

Several key interventions were identified that were critical to achievement of our goal. Standardization of the communication process through PPL was temporally associated with a shift in the median rate of call initiation from 52% to 72%. Use of the discharge order to initiate discharge communication was associated with an increase from 72% to 97%. Finally, the percentage of completed verbal handoffs increased to more than 93% following batching of phone calls to PCPs at specific times during the day.
DISCUSSION
We used improvement and reliability science methods to implement a successful process for improving verbal handoffs from HM physicians to PCPs within 24 hours of discharge to 93%. This result has been sustained for 18 months.
Utilization of the PPL call center for flexible call facilitation along with support for data analysis and leveraging the EHR to automate the process increased reliability, leading to rapid improvement. Prior to mandating the use of PPL to connect discharging physicians with PCPs, the exact rate of successful handoffs in our institution was not known. We do know, however, that only 52% of calls were initiated, so clearly a large gap was present prior to our improvement work. Data collection from the PPL system was automated so that accurate, timely, and sustainable data could be provided, greatly aiding improvement efforts. Flexibility in call‐back timing was also crucial, because coordinating the availability of PCPs and discharging physicians is often challenging. The EHR‐initiated process for discharge communication was a key intervention, and improvement of our process measure to 97% performance was associated with this implementation. Two final interventions: (1) assignment of responsibility for communication to a team pager held by a designated resident and (2) batching of calls to specific times streamlined the EHR‐initiated process and were associated with achievement of our main outcome goal of >90% completed verbal communication.
There are several reports of successful interventions to improve receipt or content of discharge summaries by PCPs following hospital discharge available in the literature.[14, 15, 16, 17, 18, 19, 20] Recently, Shen et al. reported on the success of a multisite improvement collaborative involving pediatric hospitalist programs at community hospitals whose aim was to improve the timely documentation of communication directed at PCPs.[21] In their report, all 7 hospital sites that participated in the collaborative for more than 4 months were able to demonstrate substantial improvement in documentation of some form of communication directed at PCPs (whether by e‐mail, fax, or telephone call), from a baseline of approximately 50% to more than 90%. A limitation of their study was that they were unable to document whether PCPs had received any information or by what method. A recent survey of PCPs by Sheu et al. indicated that for many discharges, information in addition to that present in the EHR was desirable to ensure a safe transition of care.[6] Two‐way communication, such as with a phone call, allows for senders to verify information receipt and for receivers to ask questions to ensure complete information. To our knowledge, there have been no previous reports describing processes for improving verbal communication between hospitalist services and PCPs at discharge.
It may be that use of the call system allowed PCPs to return phone calls regarding discharges at convenient stopping points in their day while allowing discharging physicians to initiate a call without having to wait on hold. Interestingly, though we anticipated the need for additional PPL resources during the course of this improvement, the final process was efficient enough that PPL did not require additional staffing to accommodate the higher call volume.
A key insight during our implementation was that relying on the EHR to initiate every discharge communication created disruption of resident workflow due to disregard of patient, resident, and PCP factors. This was reflected by the improvement in call initiation (our process measure) following this intervention, whereas at the same time call completion (our outcome measure) remained below goal. To achieve our goal of completing verbal communication required a process that was highly reliable yet flexible enough to allow discharging physicians to complete the call in the unpredictable environment of inpatient care. Ultimately, this was achieved by allowing discharging physicians to initiate the process when convenient, and allowing for the EHR‐initiated process to function as a backup strategy to identify and mitigate failures of initiation.
An important limitation of our study was the lack of PCPs on the improvement team, likely making the success of the project more difficult than it might have been. For example, during the study we did not measure the time PCPs spent on hold or how many reattempts were needed to complete the communication loop. Immediately following the completion of our study, it became apparent that physicians returning calls for our own institution's primary care clinic were experiencing regular workflow interruptions and occasional hold times more than 20 minutes, necessitating ongoing further work to determine the root causes and solutions to these problems. Though this work is ongoing, average PCP hold times measured from a sample of call reviews in 2013 to 2014 was 3 minutes and 15 seconds.
This study has several other limitations. We were unable to account for phone calls to PCPs initiated outside of the new process. It may be that PCPs were called more than 52% of the time at baseline due to noncompliance with the new protocol. Also, we only have data for call completion starting after implementation of the link between the discharge order and the discharge phone call, making the baseline appear artificially high and precluding any analysis of how earlier interventions affected our outcome metric. Communication with PCPs should ideally occur prior to discharge. An important limitation of our process is that calls could occur several hours after discharge between an on‐call resident and an on‐call outpatient physician rather than between the PCP and the discharging resident, limiting appropriate information exchange. Though verbal discharge communication is a desirable goal for many reasons, the current project did not focus on the quality of the call or the information that was transmitted to the PCP. Additionally, direct attending‐to‐attending communication may be valuable with medically or socially complex discharges, but we did not have a process to facilitate this. We also did not measure what effect our new process had on outcomes such as quality of patient and family transition from hospital or physician satisfaction. The existence of programs similar to our PPL subspecialty referral line may be limited to large institutions. However, it should be noted that although some internal resource reallocation was necessary within PPL, no actual staffing increases were required despite a large increase in call volume. It may be that any hospital operator system could be adapted for this purpose with modest additional resources. Finally, although our EHR system is widely utilized, there are many competing systems in the market, and our intervention required utilization of EHR capabilities that may not be present in all systems. However, our EHR intervention utilized existing functionality and did not require modification of the system.
This project focused on discharge phone calls to primary care physicians for patients hospitalized on the hospital medicine service. Because communication with the PCP should ideally occur prior to discharge, future work will include identifying a more proximal trigger than the discharge order to which to link the EHR trigger for discharge communication. Other next steps to improve handoff effectiveness and optimize the efficiency of our process include identifying essential information that should be transmitted to the primary care physician at the time of the phone call, developing processes to ensure communication of this information, measuring PCP satisfaction with this communication, and measuring the impact on patient outcomes. Finally, though expert opinion indicates that verbal handoffs may have safety advantages over nonverbal handoffs, studies comparing the safety and efficacy of verbal versus nonverbal handoffs at patient discharge are lacking. Studies establishing the relative efficacy and safety of verbal versus nonverbal handoffs at hospital discharge are needed. Knowledge gained from these activities could inform future projects centered on the spread of the process to other hospital services and/or other hospitals.
CONCLUSION
We increased the percentage of calls initiated to PCPs at patient discharge from 52% to 97% and the percentage of calls completed between HM physicians and PCPs to 93% through the use of a standardized discharge communication process coupled with a basic EHR messaging functionality. The results of this study may be of interest for further testing and adaptation for any institution with an electronic healthcare system.
Disclosure: Nothing to report.
- , , . Passing the clinical baton: 6 principles to guide the hospitalist. Am J Med. 2001;111(9B):36S–39S.
- , , , , . Evaluating communication between pediatric primary care physicians and hospitalists. Clin Pediatr. 2011;50(10):923–928.
- , , , , , . Hospitalist handoffs: a systematic review and task force recommendations. J Hosp Med. 2009;4(7):433–440.
- , , , , . Handoff strategies in settings with high consequences for failure: lessons for health care operations. Int J Qual Health Care. 2004;16(2):125–132.
- Agency for Healthcare Research and Quality. Patient safety primers: handoffs and signouts. Available at: http://www.psnet.ahrq.gov/primer.aspx?primerID=9. Accessed March 19, 2014.
- , , , , . We need to talk: primary care provider communication at discharge in the era of a shared electronic medical record. J Hosp Med. 2015;10(5):307–310.
- , , . Failure mode and effects analysis: a novel approach to avoiding dangerous medication errors and accidents. Hosp Pharm. 1994;29:319–330.
- , , , . Using health care Failure Mode and Effect Analysis: the VA National Center for Patient Safety's prospective risk analysis system. Jt Comm J Qual Improv. 2002;28:248–267, 209.
- . Statistical quality control methods in infection control and hospital epidemiology, Part II: Chart use, statistical properties, and research issues. Infect Control Hosp Epidemiol. 1998;19(4):265–283.
- . Statistical quality control methods in infection control and hospital epidemiology, part I: Introduction and basic theory. Infect Control Hosp Epidemiol. 1998;19(3):194–214.
- , , . Statistical process control as a tool for research and healthcare improvement. Qual Saf Health Care. 2003;12(6):458–464.
- . The Improvement Guide: A Practical Approach to Enhancing Organizational +Performance. 2nd ed. San Francisco, CA: Jossey‐Bass; 2009.
- , . The Health Care Data Guide: Learning From Data for Improvement. 1st ed. San Francisco, CA: Jossey‐Bass; 2011.
- , . The initial hospital discharge note: send out with the patient or post? Health Trends. 1984;16(2):48.
- , . Which type of hospital discharge report reaches general practitioners most quickly? BMJ. 1989;298(6670):362–363.
- , . The application of a computer data base system to the generation of hospital discharge summaries. Obstet Gynecol. 1989;73(5 pt 1):803–807.
- . Hospital discharge medication: is seven days supply sufficient? Public Health. 1991;105(3):243–247.
- , , , et al. Electronic communication between providers of primary and secondary care. BMJ. 1992;305(6861):1068–1070.
- , , . Communication of discharge information for elderly patients in hospital. Ulster Med J. 1992;61(1):56–58.
- , , , , . A quality use of medicines program for continuity of care in therapeutics from hospital to community. Med J Aust. 2002;177(1):32–34.
- , , , , , . Pediatric hospitalists collaborate to improve timeliness of discharge communication. Hosp Pediatr. 2013;3(3):258–265.
Timely and reliable communication of important data between hospital‐based physicians and primary care physicians is critical for prevention of medical adverse events.[1, 2] Extrapolation from high‐performance organizations outside of medicine suggests that verbal communication is an important component of patient handoffs.[3, 4] Though the Joint Commission does not mandate verbal communication during handoffs per se, stipulating instead that handoff participants have an opportunity to ask and respond to questions,[5] there is some evidence that primary care providers prefer verbal handoffs at least for certain patients such as those with medical complexity.[6] Verbal communication offers the receiver the opportunity to ask questions, but in practice, 2‐way verbal communication is often difficult to achieve at hospital discharge.
At our institution, hospital medicine (HM) physicians serve as the primary inpatient providers for nearly 90% of all general pediatric admissions. When the HM service was established, primary care physicians (PCPs) and HM physicians together agreed upon an expectation for verbal, physician‐to‐physician communication at the time of discharge. Discharge communication is provided by either residents or attendings depending on the facility. A telephone operator service called Physician Priority Link (PPL) was made available to facilitate this communication. The PPL service is staffed 24/7 by operators whose only responsibilities are to connect providers inside and outside the institution. By utilizing this service, PCPs could respond in a nonemergent fashion to discharge phone calls.
Over the last several years, PCPs have observed high variation in the reliability of discharge communication phone calls. A review of PPL phone records in 2009 showed that only 52% of HM discharges had a record of a call initiated to the PCP on the day of discharge. The overall goal of this improvement project was to improve the completion of verbal handoffs from HM physicians (residents or attendings) to PCPs. The specific aim of the project was to increase the proportion of completed verbal handoffs from on‐call residents or attendings to PCPs within 24 hours of discharge to more than 90% within 18 months.
METHODS
Human Subjects Protection
Our project was undertaken in accordance with institutional review board (IRB) policy on systems improvement work and did not require formal IRB review.
Setting
This study included all patients admitted to the HM service at an academic children's hospital and its satellite campus.
Planning the Intervention
The project was championed by physicians on the HM service and supported by a chief resident, PPL administrators, and 2 information technology analysts.
At the onset of the project, the team mapped the process for completing a discharge call to the PCPs, conducted a modified failure mode and effects analysis,[7, 8] and examined the key drivers used to prioritize interventions (Figure 1). Through the modified failure modes effect analysis, the team was able to identify system issues that led to unsuccessful communication: failure of call initiation, absence of an identified PCP, long wait times on hold, failure of PCP to call back, and failure of the call to be documented. These failure modes informed the key drivers to achieving the study aim. Figure 2 depicts the final key drivers, which were revised through testing and learning.
Interventions Targeting Key Stakeholder Buy‐in
To improve resident buy‐in and participation, the purpose and goals of the projects were discussed at resident morning report and during monthly team meetings by the pediatric chief resident on our improvement team. Resident physicians were interested in participating to reduce interruptions during daily rounds and to improve interactions with PCPs. The PPL staff was interested in standardizing the discharge call process to reduce confusion in identifying the appropriate contact when PCPs called residents back to discuss discharges. PCPs were interested in ensuring good communication at discharge, and individual PCPs were engaged through person‐to‐person contact by 1 of the HM physician champions.
Interventions to Standardization the Communication Process
To facilitate initiation of calls to PCPs at hospital discharge, the improvement team created a standard process using the PPL service (Figure 3). All patients discharged from the HM service were included in the process. Discharging physicians (who were usually but not always residents, depending on the facility), were instructed to call the PPL operator at the time of discharge. The PPL operator would then page the patient's PCP. It was the responsibility of the discharging physician to identify a PCP prior to discharge. Instances where no PCP was identified were counted as process failures because no phone call could be made. The expectation for the PCPs was that they would return the page within 20 minutes. PPL operators would then page back to the discharging physician to connect the 2 parties with the expectation that the discharging physician respond within 2 to 4 minutes to the PPL operator's page. Standardization of all calls through PPL allowed efficient tracking of incomplete calls and operators to reattempt calls that were not completed. This process also shifted the burden of following up on incomplete calls to PPL. The use of PPL to make the connection also allowed the physician to complete other work while awaiting a call back from the PCP.
Leveraging the Electronic Health Record for Process Initiation
To ensure reliable initiation of the discharge communication pathway, the improvement team introduced changes to the electronic health record (HER) (EpicCare Inpatient; Epic Systems Corp., Verona, WI), which generated a message to PPL operators whenever a discharge order was entered for an HM patient. The message contained the patient's name, medical record number, discharge date, discharging physician, and PCP name and phone number. A checklist was implemented by PPL to ensure that duplicate phone calls were not made. To initiate communication, the operator contacted the resident via text page to ensure they were ready to initiate the call. If the resident was ready to place a call, the operator then generated a phone call to the PCP. When the PCP returned the call, the operator connected the HM resident with the PCP for the handoff.
As the project progressed, several adaptations were made to address newly identified failure modes. To address confusion among PPL operators about which resident physicians should take discharge phone calls after the discharging resident was no longer available (for example, after a shift change), primary responsibility for discharge phone calls was reassigned to the daily on‐call resident rather than the resident who wrote the discharge order. Because the on‐call residents carry a single pager, the pager number listed on the automated discharge notification to PPL would never change and would always reach the appropriate team member. Second, to address the anticipated increase in interruption of resident workflow by calls back from PCPs, particularly during rounds, operators accessed information on pending discharge phone calls in batches at times of increased resident availability to minimize hold times for PCPs and work interruptions for the discharging physicians. Batch times were 1 pm and 4 pm to allow for completion of morning rounds, resident conference at noon, and patient‐care activities during the afternoon. Calls initiated after 4 pm were dispatched at the time of the discharge, and calls initiated after 10 pm were deferred to the following day.
Transparency of Data
Throughout the study, weekly failure data were generated from the EHR and emailed to improvement team members, enabling them to focus on near real‐time feedback of data to create a visible and more reliable system. With the standardization of all discharge calls directed to the PPL operators, the team was able to create a call record linked to the patient's medical record number. Team‐specific and overall results for the 5 HM resident teams were displayed weekly on a run chart in the resident conference room. As improvements in call initiation were demonstrated, completion rate data were also shared every several months with the attending hospitalists during a regularly scheduled divisional conference. This transparency of data gave the improvement team the opportunity to provide individual feedback to residents and attendings about failures. The weekly review of failure data allowed team leaders to learn from failures, identify knowledge gaps, and ensure accountability with the HM physicians.
Planning the Study of the Intervention
Data were collected prospectively from July 2011 to March 2014. A weekly list of patients discharged from the HM service was extracted from the EHR and compared to electronic call logs collected by PPL on the day of discharge. A standard sample size of 30 calls was audited separately by PPL and 1 of the physician leads to verify that the patients were discharged from the HM service and validate the percentage of completed and initiated calls.
The percentage of calls initiated within 24 hours of discharge was tracked as a process measure and served as the initial focus of improvement efforts. Our primary outcome measure was the percentage of calls completed to the PCP by the HM physician within 24 hours of discharge.
Methods of Evaluation and Analysis
We used improvement science methods and run charts to determine the percentage of patients discharged from the HM service with a call initiated to the PCP and completed within 24 hours of discharge. Data on calls initiated within 24 hours of discharge were plotted on a run chart to examine the impact of interventions over time. Once interventions targeted at call initiation had been implemented, we began tracking our primary outcome measure. A new run chart was created documenting the percentage of calls completed. For both metrics, the centerline was adjusted using established rules for special cause variation in run charts.[9, 10, 11, 12, 13]
RESULTS
From July 2011 to March 2014, there were 6313 discharges from the HM service. The process measure (percentage of calls initiated) improved from 50% to 97% after 4 interventions (Figure 4). Data for the outcome measure (percentage of calls completed) were collected starting in August 2012, shortly after linking the EHR discharge order to the discharge call. Over the first 8 weeks, our median was 80%, which increased to a median of 93% (Figure 5). These results were sustained for 18 months.
Several key interventions were identified that were critical to achievement of our goal. Standardization of the communication process through PPL was temporally associated with a shift in the median rate of call initiation from 52% to 72%. Use of the discharge order to initiate discharge communication was associated with an increase from 72% to 97%. Finally, the percentage of completed verbal handoffs increased to more than 93% following batching of phone calls to PCPs at specific times during the day.
DISCUSSION
We used improvement and reliability science methods to implement a successful process for improving verbal handoffs from HM physicians to PCPs within 24 hours of discharge to 93%. This result has been sustained for 18 months.
Utilization of the PPL call center for flexible call facilitation along with support for data analysis and leveraging the EHR to automate the process increased reliability, leading to rapid improvement. Prior to mandating the use of PPL to connect discharging physicians with PCPs, the exact rate of successful handoffs in our institution was not known. We do know, however, that only 52% of calls were initiated, so clearly a large gap was present prior to our improvement work. Data collection from the PPL system was automated so that accurate, timely, and sustainable data could be provided, greatly aiding improvement efforts. Flexibility in call‐back timing was also crucial, because coordinating the availability of PCPs and discharging physicians is often challenging. The EHR‐initiated process for discharge communication was a key intervention, and improvement of our process measure to 97% performance was associated with this implementation. Two final interventions: (1) assignment of responsibility for communication to a team pager held by a designated resident and (2) batching of calls to specific times streamlined the EHR‐initiated process and were associated with achievement of our main outcome goal of >90% completed verbal communication.
There are several reports of successful interventions to improve receipt or content of discharge summaries by PCPs following hospital discharge available in the literature.[14, 15, 16, 17, 18, 19, 20] Recently, Shen et al. reported on the success of a multisite improvement collaborative involving pediatric hospitalist programs at community hospitals whose aim was to improve the timely documentation of communication directed at PCPs.[21] In their report, all 7 hospital sites that participated in the collaborative for more than 4 months were able to demonstrate substantial improvement in documentation of some form of communication directed at PCPs (whether by e‐mail, fax, or telephone call), from a baseline of approximately 50% to more than 90%. A limitation of their study was that they were unable to document whether PCPs had received any information or by what method. A recent survey of PCPs by Sheu et al. indicated that for many discharges, information in addition to that present in the EHR was desirable to ensure a safe transition of care.[6] Two‐way communication, such as with a phone call, allows for senders to verify information receipt and for receivers to ask questions to ensure complete information. To our knowledge, there have been no previous reports describing processes for improving verbal communication between hospitalist services and PCPs at discharge.
It may be that use of the call system allowed PCPs to return phone calls regarding discharges at convenient stopping points in their day while allowing discharging physicians to initiate a call without having to wait on hold. Interestingly, though we anticipated the need for additional PPL resources during the course of this improvement, the final process was efficient enough that PPL did not require additional staffing to accommodate the higher call volume.
A key insight during our implementation was that relying on the EHR to initiate every discharge communication created disruption of resident workflow due to disregard of patient, resident, and PCP factors. This was reflected by the improvement in call initiation (our process measure) following this intervention, whereas at the same time call completion (our outcome measure) remained below goal. To achieve our goal of completing verbal communication required a process that was highly reliable yet flexible enough to allow discharging physicians to complete the call in the unpredictable environment of inpatient care. Ultimately, this was achieved by allowing discharging physicians to initiate the process when convenient, and allowing for the EHR‐initiated process to function as a backup strategy to identify and mitigate failures of initiation.
An important limitation of our study was the lack of PCPs on the improvement team, likely making the success of the project more difficult than it might have been. For example, during the study we did not measure the time PCPs spent on hold or how many reattempts were needed to complete the communication loop. Immediately following the completion of our study, it became apparent that physicians returning calls for our own institution's primary care clinic were experiencing regular workflow interruptions and occasional hold times more than 20 minutes, necessitating ongoing further work to determine the root causes and solutions to these problems. Though this work is ongoing, average PCP hold times measured from a sample of call reviews in 2013 to 2014 was 3 minutes and 15 seconds.
This study has several other limitations. We were unable to account for phone calls to PCPs initiated outside of the new process. It may be that PCPs were called more than 52% of the time at baseline due to noncompliance with the new protocol. Also, we only have data for call completion starting after implementation of the link between the discharge order and the discharge phone call, making the baseline appear artificially high and precluding any analysis of how earlier interventions affected our outcome metric. Communication with PCPs should ideally occur prior to discharge. An important limitation of our process is that calls could occur several hours after discharge between an on‐call resident and an on‐call outpatient physician rather than between the PCP and the discharging resident, limiting appropriate information exchange. Though verbal discharge communication is a desirable goal for many reasons, the current project did not focus on the quality of the call or the information that was transmitted to the PCP. Additionally, direct attending‐to‐attending communication may be valuable with medically or socially complex discharges, but we did not have a process to facilitate this. We also did not measure what effect our new process had on outcomes such as quality of patient and family transition from hospital or physician satisfaction. The existence of programs similar to our PPL subspecialty referral line may be limited to large institutions. However, it should be noted that although some internal resource reallocation was necessary within PPL, no actual staffing increases were required despite a large increase in call volume. It may be that any hospital operator system could be adapted for this purpose with modest additional resources. Finally, although our EHR system is widely utilized, there are many competing systems in the market, and our intervention required utilization of EHR capabilities that may not be present in all systems. However, our EHR intervention utilized existing functionality and did not require modification of the system.
This project focused on discharge phone calls to primary care physicians for patients hospitalized on the hospital medicine service. Because communication with the PCP should ideally occur prior to discharge, future work will include identifying a more proximal trigger than the discharge order to which to link the EHR trigger for discharge communication. Other next steps to improve handoff effectiveness and optimize the efficiency of our process include identifying essential information that should be transmitted to the primary care physician at the time of the phone call, developing processes to ensure communication of this information, measuring PCP satisfaction with this communication, and measuring the impact on patient outcomes. Finally, though expert opinion indicates that verbal handoffs may have safety advantages over nonverbal handoffs, studies comparing the safety and efficacy of verbal versus nonverbal handoffs at patient discharge are lacking. Studies establishing the relative efficacy and safety of verbal versus nonverbal handoffs at hospital discharge are needed. Knowledge gained from these activities could inform future projects centered on the spread of the process to other hospital services and/or other hospitals.
CONCLUSION
We increased the percentage of calls initiated to PCPs at patient discharge from 52% to 97% and the percentage of calls completed between HM physicians and PCPs to 93% through the use of a standardized discharge communication process coupled with a basic EHR messaging functionality. The results of this study may be of interest for further testing and adaptation for any institution with an electronic healthcare system.
Disclosure: Nothing to report.
- , , . Passing the clinical baton: 6 principles to guide the hospitalist. Am J Med. 2001;111(9B):36S–39S.
- , , , , . Evaluating communication between pediatric primary care physicians and hospitalists. Clin Pediatr. 2011;50(10):923–928.
- , , , , , . Hospitalist handoffs: a systematic review and task force recommendations. J Hosp Med. 2009;4(7):433–440.
- , , , , . Handoff strategies in settings with high consequences for failure: lessons for health care operations. Int J Qual Health Care. 2004;16(2):125–132.
- Agency for Healthcare Research and Quality. Patient safety primers: handoffs and signouts. Available at: http://www.psnet.ahrq.gov/primer.aspx?primerID=9. Accessed March 19, 2014.
- , , , , . We need to talk: primary care provider communication at discharge in the era of a shared electronic medical record. J Hosp Med. 2015;10(5):307–310.
- , , . Failure mode and effects analysis: a novel approach to avoiding dangerous medication errors and accidents. Hosp Pharm. 1994;29:319–330.
- , , , . Using health care Failure Mode and Effect Analysis: the VA National Center for Patient Safety's prospective risk analysis system. Jt Comm J Qual Improv. 2002;28:248–267, 209.
- . Statistical quality control methods in infection control and hospital epidemiology, Part II: Chart use, statistical properties, and research issues. Infect Control Hosp Epidemiol. 1998;19(4):265–283.
- . Statistical quality control methods in infection control and hospital epidemiology, part I: Introduction and basic theory. Infect Control Hosp Epidemiol. 1998;19(3):194–214.
- , , . Statistical process control as a tool for research and healthcare improvement. Qual Saf Health Care. 2003;12(6):458–464.
- . The Improvement Guide: A Practical Approach to Enhancing Organizational +Performance. 2nd ed. San Francisco, CA: Jossey‐Bass; 2009.
- , . The Health Care Data Guide: Learning From Data for Improvement. 1st ed. San Francisco, CA: Jossey‐Bass; 2011.
- , . The initial hospital discharge note: send out with the patient or post? Health Trends. 1984;16(2):48.
- , . Which type of hospital discharge report reaches general practitioners most quickly? BMJ. 1989;298(6670):362–363.
- , . The application of a computer data base system to the generation of hospital discharge summaries. Obstet Gynecol. 1989;73(5 pt 1):803–807.
- . Hospital discharge medication: is seven days supply sufficient? Public Health. 1991;105(3):243–247.
- , , , et al. Electronic communication between providers of primary and secondary care. BMJ. 1992;305(6861):1068–1070.
- , , . Communication of discharge information for elderly patients in hospital. Ulster Med J. 1992;61(1):56–58.
- , , , , . A quality use of medicines program for continuity of care in therapeutics from hospital to community. Med J Aust. 2002;177(1):32–34.
- , , , , , . Pediatric hospitalists collaborate to improve timeliness of discharge communication. Hosp Pediatr. 2013;3(3):258–265.
© 2015 Society of Hospital Medicine
Pneumonia Guideline Therapy Outcomes
Community‐acquired pneumonia (CAP) is a common and serious infection in children. With more than 150,000 children requiring hospitalization annually, CAP is the fifth most prevalent and the second most costly diagnosis of all pediatric hospitalizations in the United States.[1, 2, 3]
In August 2011, the Pediatric Infectious Diseases Society (PIDS) and the Infectious Diseases Society of America (IDSA) published an evidence‐based guideline for the management of CAP in children. This guideline recommended that fully immunized children without underlying complications who require hospitalization receive an aminopenicillin as first‐line antibiotic therapy.[4] Additionally, the guideline recommends empirically adding a macrolide to an aminopenicillin when atypical pneumonia is a diagnostic consideration.
This recommendation was a substantial departure from practice for hospitals nationwide, as a multicenter study of children's hospitals (20052010) demonstrated that <10% of patients diagnosed with CAP received aminopenicillins as empiric therapy.[5] Since publication of the PIDS/IDSA guidelines, the use of aminopenicillins has increased significantly across institutions, but the majority of hospitalized patients still receive broad‐spectrum cephalosporin therapy for CAP.[6]
At baseline, 30% of patients hospitalized with CAP received guideline‐recommended antibiotic therapy at our institution. Through the use of quality‐improvement methods, the proportion of patients receiving guideline‐recommended therapy increased to 100%.[7] The objective of this study was to ensure that there were not unintended negative consequences to guideline implementation. Specifically, we sought to identify changes in length of stay (LOS), hospital costs, and treatment failures associated with use of guideline‐recommended antibiotic therapy for children hospitalized with uncomplicated CAP.
METHODS
Study Design and Study Population
This retrospective cohort study included children age 3 months to 18 years, hospitalized with CAP, between May 2, 2011 and July 30, 2012, at Cincinnati Children's Hospital Medical Center (CCHMC), a 512‐bed free‐standing children's hospital. The CCHMC Institutional Review Board approved this study with a waiver of informed consent.
Patients were eligible for inclusion if they were admitted to the hospital for inpatient or observation level care with a primary or secondary International Classification of Disease, 9th Revision discharge diagnosis code of pneumonia (480.02, 480.89, 481, 482.0, 482.30‐2, 482.41‐2, 482.83, 482.8990, 483.8, 484.3, 485, 486, 487.0) or effusion/empyema (510.0, 510.9, 511.01, 511.89, 513).[8] Patients with complex chronic conditions[9] were excluded. Medical records of eligible patients (n=260) were reviewed by 2 members of the study team to ensure that patients fell into the purview of the guideline. Patients who did not receive antibiotics (n=11) or for whom there was documented concern for aspiration (n=1) were excluded. Additionally, patients with immunodeficiency (n=1) or who had not received age‐appropriate vaccinations (n=2), and patients who required intensive care unit admission on presentation (n=17) or who had a complicated pneumonia, defined by presence of moderate or large pleural effusion at time of admission (n=8), were also excluded.[7] Finally, for patients with multiple pneumonia admissions, only the index visit was included; subsequent visits occurring within 30 days of discharge were considered readmissions.
Treatment Measure
The primary exposure of interest was empiric antibiotic therapy upon hospital admission. Antibiotic therapy was classified as guideline recommended or nonguideline recommended. Guideline‐recommended therapy was defined as follows:
- For children without drug allergies: ampicillin (200 mg/kg/day intravenously) or amoxicillin (90 mg/kg/day orally);
- For children with penicillin allergy: ceftriaxone (50100 mg/kg/day intravenously or intramuscularly) or cefdinir (14 mg/kg/day orally);
- For children with penicillin and cephalosporin allergy: clindamycin (40 mg/kg/day orally or intravenously); and
- Or azithromycin (10 mg/kg/day orally or intravenously on day 1) in combination with antibiotic category 1 or 2 or 3 above.
Outcome Measures
The primary outcomes examined were hospital LOS, total cost of hospitalization, and inpatient pharmacy costs. LOS was measured in hours and defined as the difference in time between departure from and arrival to the inpatient unit. Total cost of index hospitalization included both direct and indirect costs, obtained from the Centers for Medicare & Medicaid Services' Relative Value Units data for Current Procedural Terminology codes.[10]
Secondary outcomes included broadening of antibiotic therapy during the hospital course, pneumonia‐related emergency department (ED) revisits within 30 days, and pneumonia‐related inpatient readmissions within 30 days. Broadening of antibiotic therapy was defined as addition of a second antibiotic (eg, adding azithromycin on day 3 of hospitalization) or change in empiric antibiotic to a class with broader antimicrobial activity (eg, ampicillin to ceftriaxone) at any time during hospitalization. As our study population included only patients with uncomplicated pneumonia at the time of admission, this outcome was used to capture possible treatment failure. ED revisits and inpatient readmissions were reviewed by 3 investigators to identify pneumonia‐related visits. To encompass all possible treatment failures, all respiratory‐related complaints (eg, wheezing, respiratory distress) were considered as pneumonia‐related. Disagreements were resolved by group discussion.
Covariates
Severity of illness on presentation was evaluated using the Emergency Severity Index version 4,[11] abnormal vital signs on presentation (as defined by Pediatric Advanced Life Support age‐specific criteria[12]), and need for oxygen in the first 24 hours of hospitalization. Supplemental oxygen is administered for saturations <91% per protocol at our institution. The patient's highest Pediatric Early Warning Scale score[13] during hospitalization was used as a proxy for disease severity. Exam findings on presentation (eg, increased respiratory effort, rales, wheezing) were determined through chart review. Laboratory tests and radiologic imaging variables included complete blood cell count, blood culture, chest radiograph, chest ultrasound, and chest computed tomography. Abnormal white blood cell count was defined as <5000 or >15,000 cells/mL, the defined reference range for the CCHMC clinical laboratory.
Data Analysis
Continuous variables were described using median and interquartile range (IQR) and compared across groups using Wilcoxon rank sum test due to non‐normal distributions. Categorical variables were described by counts and frequencies and compared using the 2 test.
Multivariable linear regression analysis was performed to assess the independent effect of receipt of empiric guideline‐recommended antibiotic therapy on outcomes of LOS and costs while adjusting for covariates. As LOS and costs were non‐normally distributed, we logarithmically transformed these values to use as the dependent variables in our models. The resulting coefficients were back‐transformed to reflect the percent change in LOS and costs incurred between subjects who received empiric guideline therapy compared with those who did not.[14] Covariates were chosen a priori due to their clinical and biological relevance to the outcomes of LOS (eg, wheezing on presentation and need for supplemental oxygen), total cost of hospitalization (eg, LOS and need for repeat imaging), and inpatient pharmacy costs (eg, LOS and wheezing on presentation) (Table 1).
| Characteristic | Overall Cohort, n=220 | Guideline Therapy, n=166 | Nonguideline Therapy, n=54 | P Value |
|---|---|---|---|---|
| ||||
| Age, y, median (IQR) | 2.9 (1.36.3) | 2.5 (1.35.2) | 5.6 (2.38.8) | <0.01* |
| Male, no. (%) | 122 (55.5%) | 89 (53.6%) | 33 (61.1%) | 0.34 |
| Emergency Severity Index, no. (%) | 0.11 | |||
| 2 | 90 (40.9%) | 73 (44.0%) | 17 (31.5%) | |
| 3 | 116 (52.7%) | 85 (51.2%) | 31 (57.4%) | |
| 4 | 14 (6.4%) | 8 (4.8%) | 6 (11.1%) | |
| Abnormal vital signs on presentation, no. (%) | ||||
| Fever | 99 (45.0%) | 80 (48.2%) | 19 (35.2%) | 0.10 |
| Tachycardia | 100 (45.5%) | 76 (45.8%) | 24 (44.4%) | 0.86 |
| Tachypnea | 124 (56.4%) | 100 (60.2%) | 24 (44.4%) | 0.04* |
| Hypotension | 0 | 0 | 0 | |
| Hypoxia | 27 (12.3%) | 24 (14.5%) | 3 (5.6%) | 0.08 |
| Physical exam on presentation, no. (%) | ||||
| Increased respiratory effort | 146 (66.4%) | 111 (66.9%) | 35 (64.8%) | 0.78 |
| Distressed | 110 (50.0%) | 86 (51.8%) | 24 (44.4%) | 0.35 |
| Retraction | 103 (46.8%) | 81 (48.8%) | 22 (40.7%) | 0.30 |
| Grunting | 17 (7.7%) | 14 (8.4%) | 3 (5.6%) | 0.49 |
| Nasal flaring | 19 (8.6%) | 17 (10.2%) | 2 (3.7%) | 0.14 |
| Rales | 135 (61.4%) | 99 (59.6%) | 36 (66.7%) | 0.36 |
| Wheeze | 91 (41.4%) | 66 (39.8%) | 25 (46.3%) | 0.40 |
| Decreased breath sounds | 89 (40.5%) | 65 (39.2%) | 24 (44.4%) | 0.49 |
| Dehydration | 21 (9.6%) | 13 (7.8%) | 8 (14.8%) | 0.13 |
| PEWS 5 during admission, no. (%) | 43 (19.6%) | 34 (20.5%) | 9 (16.7%) | 0.54 |
| Oxygen requirement in first 24 hours, no. (%) | 114 (51.8%) | 90 (53.6%) | 24 (46.2%) | 0.35 |
| Complete blood count obtained, no. (%) | 99 (45.0%) | 72 (43.4%) | 27 (50.0%) | 0.40 |
| Abnormal white blood cell count | 35 (35.7%) | 23 (32.4%) | 12 (44.4%) | 0.27 |
| Blood culture obtained, no. (%) | 104 (47.3%) | 80 (48.2%) | 24 (44.4%) | 0.63 |
| Positive | 2 (1.9%) | 1 (1.3%) | 1 (4.2%) | 0.36 |
| Chest radiograph available, no. (%) | 214 (97.3%) | 161 (97.0%) | 53 (98.2%) | 0.65 |
| Infiltrate | 178 (83.2%) | 139 (86.3%) | 39 (73.6%) | 0.03* |
| Bilateral | 29 (16.3%) | 20 (14.4%) | 9 (23.1%) | 0.19 |
| Multilobar | 46 (25.8%) | 33 (23.7%) | 13 (33.3%) | 0.23 |
| Effusion | 24 (11.2%) | 16 (9.9%) | 8 (15.1%) | 0.30 |
| Additional imaging, no. (%) | ||||
| Repeat chest radiograph | 26 (11.8%) | 17 (10.2%) | 9 (16.7%) | 0.20 |
| Chest ultrasound | 4 (1.8%) | 3 (1.8%) | 1 (1.9%) | 0.98 |
| Chest CT | 2 (0.9%) | 1 (0.6%) | 1 (1.9%) | 0.40 |
| Antibiotic, no. (%) | <0.01* | |||
| Aminopenicillin | 140 (63.6%) | 140 (84.3%) | 0 (0%) | |
| Third‐generation cephalosporin | 37 (16.8%) | 8 (4.8%) | 29 (53.7%) | |
| Macrolide monotherapy | 18 (8.2%) | 0 (0%) | 18 (33.3%) | |
| Clindamycin | 2 (0.9%) | 1 (0.6%) | 1 (1.9%) | |
| Levofloxacin | 1 (0.5%) | 0 (0%) | 1 (1.9%) | |
| Aminopenicillin+macrolide | 16 (7.3%) | 16 (9.6%) | 0 (0%) | |
| Cephalosporin+macrolide | 6 (2.7%) | 1 (0.6%) | 5 (9.3%) | |
Secondary outcomes of broadened antibiotic therapy, ED revisits, and hospital readmissions were assessed using the Fisher exact test. Due to the small number of events, we were unable to evaluate these associations in models adjusted for potential confounders.
All analyses were performed with SAS version 9.3 (SAS Institute, Cary, NC), and P values <0.05 were considered significant.
RESULTS
Of the 220 unique patients included, 122 (55%) were male. The median age was 2.9 years (IQR: 1.36.3 years). Empiric guideline‐recommended therapy was prescribed to 168 (76%) patients (Table 1). Aminopenicillins were the most common guideline‐recommended therapy, accounting for 84% of guideline‐recommended antibiotics. An additional 10% of patients received the guideline‐recommended combination therapy with an aminopenicillin and a macrolide. Nonguideline‐recommended therapy included third‐generation cephalosporin antibiotics (54%) and macrolide monotherapy (33%).
Those who received empiric guideline‐recommended antibiotic therapy were similar to those who received nonguideline‐recommended therapy with respect to sex, Emergency Severity Index, physical exam findings on presentation, oxygen requirement in the first 24 hours, abnormal laboratory findings, presence of effusion on chest radiograph, and need for additional imaging (Table 1). However, patients in the guideline‐recommended therapy group were significantly younger (median 2.5 years vs 5.6 years, P0.01), more likely to have elevated respiratory rate on presentation (60.2% vs 44.4%, P=0.04), and more likely to have an infiltrate on chest radiograph (86.3% vs 73.6%, P=0.03) (Table 1). Patients who received nonguideline‐recommended macrolide monotherapy had a median age of 7.4 years (IQR: 5.89.8 years).
Median hospital LOS for the total cohort was 1.3 days (IQR: 0.91.9 days) (Table 2). There were no differences in LOS between patients who received and did not receive guideline‐recommended therapy in the unadjusted or the adjusted model (Table 3).
| Outcome | Guideline Therapy, n=166 | Nonguideline Therapy, n=54 | P Value |
|---|---|---|---|
| |||
| Length of stay, d, median (IQR) | 1.3 (0.91.9) | 1.3 (0.92.0) | 0.74 |
| Total costs, median, (IQR) | $4118 ($2,647$6,004) | $4045 ($2,829$6,200) | 0.44 |
| Pharmacy total costs, median, (IQR) | $84 ($40$179) | $106 ($58$217) | 0.12 |
| Broadened therapy, no. (%) | 10 (6.0%) | 4 (7.4%) | 0.75 |
| Emergency department revisit, no. (%) | 7 (4.2%) | 2 (3.7%) | 1.00 |
| Readmission, no. (%) | 1 (0.6%) | 1 (1.9%) | 0.43 |
| Outcome | Unadjusted Coefficient (95% CI) | Adjusted Coefficient (95% CI) | Adjusted % Change in Outcome (95% CI)* |
|---|---|---|---|
| |||
| Length of stay | 0.06 (0.27 to 0.15) | 0.06 (0.25 to 0.12) | 5.8 (22.1 to 12.8) |
| Total costs | 0.18 (0.40 to 0.04) | 0.11 (0.32 to 0.09) | 10.9 (27.4 to 9.4) |
| Pharmacy total costs | 0.44 (0.46 to 0.02) | 0.16 (0.57 to 0.24) | 14.8 (43.4 to 27.1) |
Median total costs of the index hospitalization for the total cohort were $4097 (IQR: $2657$6054), with median inpatient pharmacy costs of $92 (IQR: $40$183) (Table 2). There were no differences in total or inpatient pharmacy costs for patients who received guideline‐recommended therapy compared with those who did not in unadjusted or adjusted analyses. Fourteen patients (6.4%) had antibiotic therapy broadened during hospitalization, 10 were initially prescribed guideline‐recommended therapy, and 4 were initially prescribed nonguideline‐recommended therapy (Table 4).
| Initial Therapy | Reasons for Antibiotic Change Identified From Chart Review |
|---|---|
| Guideline=10 | Ampicillin to ceftriaxone: |
| 1 patient with clinical worsening | |
| 1 patient with coincident urinary tract infection due to resistant organism | |
| 4 patients without evidence of clinical worsening or documentation of rationale | |
| Addition of a macrolide: | |
| 3 patients without evidence of clinical worsening or documentation of rationale | |
| Addition of clindamycin: | |
| 1 patient with clinical worsening | |
| Nonguideline=4 | Ceftriaxone to clindamycin: |
| 1 patient with clinical worsening | |
| Addition of a macrolide: | |
| 1 patient with clinical worsening | |
| 1 patients without evidence of clinical worsening or documentation of rationale | |
| Addition of clindamycin: | |
| 1 patient with clinical worsening |
Of the 9 pneumonia‐related ED revisits within 30 days of discharge, 7 occurred in patients prescribed empiric guideline‐recommended therapy (Table 5). No ED revisit resulted in hospital readmission or antibiotic change related to pneumonia. Two ED revisits resulted in new antibiotic prescriptions for diagnoses other than pneumonia.
| Revisit | Initial Therapy | Day Postdischarge | Clinical Symptoms at Return Visit | Clinical Diagnosis | Antibiotic Prescription |
|---|---|---|---|---|---|
| |||||
| ED | Guideline | 3 | Poor oral intake and fever | Pneumonia | Continued prior antibiotic |
| ED | Guideline | 8 | Recurrent cough and fever | Resolving pneumonia | Continued prior antibiotic |
| ED | Guideline | 13 | Follow‐up | Resolved pneumonia | No further antibiotic |
| ED | Guideline | 16 | Increased work of breathing | Reactive airway disease | No antibiotic |
| ED | Guideline | 20 | Persistent cough | Viral illness | No antibiotic |
| ED | Guideline | 22 | Recurrent cough and congestion | Sinusitis | Augmentin |
| ED | Guideline | 26 | Increased work of breathing | Reactive airway disease | No antibiotic |
| ED | Nonguideline | 16 | Recurrent fever | Acute otitis media | Amoxicillin |
| ED | Nonguideline | 20 | Recurrent cough and fever | Viral illness | No antibiotic |
| Admission | Guideline | 3 | Increased work of breathing | Pneumonia | IV ampicillin |
| Admission | Nonguideline | 9 | Refusal to take oral clindamycin | Pneumonia | IV clindamycin |
Two patients were readmitted for a pneumonia‐related illness within 30 days of discharge; 1 had received guideline‐recommended therapy (Table 5). Both patients were directly admitted to the inpatient ward without an associated ED visit. Antibiotic class was not changed for either patient upon readmission, despite the decision to convert to intravenous form.
DISCUSSION
In this retrospective cohort study, patients who received empiric guideline‐recommended antibiotic therapy on admission for CAP had no difference in LOS, total cost of hospitalization, or inpatient pharmacy costs compared with those who received therapy that varied from guideline recommendations. Our study suggests that prescribing narrow‐spectrum therapy and, in some circumstances, combination therapy, as recommended by the 2011 PIDS/IDSA pneumonia guideline, did not result in negative unintended consequences.
In our study, children receiving guideline‐recommended therapy were younger, more likely to have elevated respiratory rate on presentation, and more likely to have an infiltrate on chest radiograph. We hypothesize the age difference is a reflection of common use of nonguideline macrolide monotherapy in the older, school‐age child, as macrolides are commonly used for coverage of Mycoplasma pneumonia in older children with CAP.[15] Children receiving macrolide monotherapy were older than those receiving guideline‐recommended therapy (median age of 7.4 years and 2.5 years, respectively). We also hypothesize that some providers may prescribe macrolide monotherapy to children deemed less ill than expected for CAP (eg, normal percutaneous oxygen saturation). This hypothesis is supported by the finding that 60% of patients who had a normal respiratory rate and received nonguideline therapy were prescribed macrolide monotherapy. We did control for the characteristics that varied between the two treatment groups in our models to eliminate potential confounding.
One prior study evaluated the effects of guideline implementation in CAP. In evaluation of a clinical practice guideline that recommended ampicillin as first‐line therapy for CAP, no significant difference was found following guideline introduction in the number of treatment failures (defined as the need to broaden therapy or development of complicated pneumonia within 48 hours or 30‐day inpatient readmission).[16] Our study builds on these findings by directly comparing outcomes between recipients of guideline and nonguideline therapy, which was not done in the prestudy or poststudy design of prior work.[16] We believe that classifying patients based on empiric therapy received rather than timing of guideline introduction thoroughly examines the effect of following guideline recommendations. Additionally, outcomes other than treatment failures were examined in our study including LOS, costs, and ED revisits.
Our results are similar to other observational studies that compared narrow‐ and broad‐spectrum antibiotics for children hospitalized with CAP. Using administrative data, Williams et al. found no significant difference in LOS or cost between narrow‐ and broad‐spectrum intravenous antibiotic recipients ages 6 months to 18 years at 43 children's hospitals.[17] Queen et al. compared narrow‐ and broad‐spectrum antibiotic therapy for children ages 2 months to 18 years at 4 children's hospitals.[18] Differences in average daily cost were not significant, but children who received narrow‐spectrum antibiotics had a significantly shorter LOS. Finally, an observational study of 319 Israeli children <2 years of age found no significant difference in duration of oxygen requirement, LOS, or need for change in antibiotic therapy between the 66 children prescribed aminopenicillins and the 253 children prescribed cefuroxime.[19] These studies suggest that prescribing narrow‐spectrum antimicrobial therapy, as per the guideline recommendations, results in similar outcomes to broad‐spectrum antimicrobial therapy.
Our study adds to prior studies that compared narrow‐ and broad‐spectrum therapy by comparing outcomes associated with guideline‐recommended therapy to nonguideline therapy. We considered antibiotic therapy as guideline recommended if appropriately chosen per the guideline, not just by simple classification of antibiotic. For example, the use of a cephalosporin in a patient with aminopenicillin allergy was considered guideline‐recommended therapy. We chose to classify the exposure of empiric antibiotic therapy in this manner to reflect true clinical application of the guideline, as not all children are able to receive aminopenicillins. Additionally, as our study stemmed from our prior improvement work aimed at increasing guideline adherent therapy,[7] we have a higher frequency of narrow‐spectrum antibiotic use than prior studies. In our study, almost two‐thirds of patients received narrow‐spectrum therapy, whereas narrow‐spectrum use in prior studies ranged from 10% to 33%.[17, 18, 19] Finally, we were able to confirm the diagnosis of pneumonia via medical record review and to adjust for severity of illness using clinical variables including vital signs, physical exam findings, and laboratory and radiologic study results.
This study must be interpreted in the context of several limitations. First, our study population was defined through discharge diagnosis codes, and therefore dependent on the accuracy of coding. However, we minimized potential for misclassification through use of a previously validated approach to identify patients with CAP and through medical record review to confirm the diagnosis. Second, we may be unable to detect very small differences in outcomes given limited power, specifically for outcomes of LOS, ED revisits, hospital readmissions, and need to broaden antibiotic therapy. Third, residual confounding may be present. Although we controlled for many clinical variables in our analyses, antibiotic prescribing practices may be influenced by unmeasured factors. The potential of system level confounding is mitigated by standardized care for patients with CAP at our institution. Prior system‐level changes using quality‐improvement science have resulted in a high level of adherence with guideline‐recommended antimicrobials as well as standardized medical discharge criteria.[7, 20] Additionally, nonmedical factors may influence LOS, limiting its use as an outcome measure. This limitation was minimized in our study by standardizing medical discharge criteria. Prior work at our institution demonstrated that the majority of patients, including those with CAP, were discharged within 2 hours of meeting medical discharge criteria.[20] Fourth, discharged patients who experienced adverse outcomes may have received care at a nearby adult emergency department or at their pediatrician's office. Although these events would not have been captured in our electronic health record, serious complications due to treatment failure (eg, empyema) would require hospitalization. As our hospital is the only children's hospital in the Greater Cincinnati metropolitan area, these patents would receive care at our institution. Therefore, any misclassification of revisits or readmissions is likely to be minimal. Finally, study patients were admitted to a large tertiary academic children's hospital, warranting further investigation to determine if these findings can be translated to smaller community settings.
In conclusion, receipt of guideline‐recommended antibiotic therapy for patients hospitalized with CAP was not associated with increases in LOS, total costs of hospitalization, or inpatient pharmacy costs. Our findings highlight the importance of changing antibiotic prescribing practices to reflect guideline recommendations, as there was no evidence of negative unintended consequences with our local practice change.
Acknowledgments
Disclosures: Dr. Ambroggio and Dr. Thomson were supported by funds from the NRSA T32HP10027‐14. Dr. Shah was supported by funds from NIAID K01A173729. The authors report no conflicts of interest.
- , , , , , . Ambulatory visit rates and antibiotic prescribing for children with pneumonia, 1994–2007. Pediatrics. 2011;127(3):411–418.
- , , , , . National hospitalization trends for pediatric pneumonia and associated complications. Pediatrics. 2010;126(2):204–213.
- , , , et al. Prioritization of comparative effectiveness research topics in hospital pediatrics. Arch Pediatr Adolesc Med. 2012;166(12):1155–1164.
- , , , et al. The management of community‐acquired pneumonia in infants and children older than 3 months of age: clinical practice guidelines by the Pediatric Infectious Diseases Society and the Infectious Diseases Society of America. Clin Infect Dis. 2011;53(7):e25–e76.
- , , , et al. Variability in processes of care and outcomes among children hospitalized with community‐acquired pneumonia. Pediatr Infect Dis J. 2012;31(10):1036–1041.
- , , , et al. Impact of IDSA/PIDS guidelines on treatment of community‐acquired pneumonia in hospitalized children. Clin Infect Dis. 2014;58(6):834–838.
- , , , et al. Quality improvement methods increase appropriate antibiotic prescribing for childhood pneumonia. Pediatrics. 2013;131(5):e1623–e1631.
- , , , et al. Identifying pediatric community‐acquired pneumonia hospitalizations: accuracy of administrative billing codes. JAMA Pediatr. 2013;167(9):851–858.
- , , , , , . Deaths attributed to pediatric complex chronic conditions: national trends and implications for supportive care services. Pediatrics. 2001;107(6):E99.
- Centers for Medicare 2011.
- , , , et al. Pediatric advanced life support: 2010 American Heart Association guidelines for cardiopulmonary resuscitation and emergency cardiovascular care. Pediatrics. 2010;126(5):e1361–e1399.
- , , , , . Prospective evaluation of a pediatric inpatient early warning scoring system. J Spec Pediatr Nurs. 2009;14(2):79–85.
- , , , . Regression Methods in Biostatistics: Linear, Logistic, Survival, and Repeated Measures Models. New York, NY: Springer; 2005.
- , , , , . Treatment of mycoplasma pneumonia: a systematic review. Pediatrics. 2014;133(6):1081–1090.
- , , , , , . Impact of a guideline on management of children hospitalized with community‐acquired pneumonia. Pediatrics. 2012;129(3):e597–e604.
- , , , et al. Narrow vs broad‐spectrum antimicrobial therapy for children hospitalized with pneumonia. Pediatrics. 2013;132(5):e1141–e1148.
- , , , et al. Comparative effectiveness of empiric antibiotics for community‐acquired pneumonia. Pediatrics. 2014;133(1):e23–e29.
- , , , et al. Antibiotic treatment of children with community‐acquired pneumonia: comparison of penicillin or ampicillin versus cefuroxime. Pediatr Pulmonol. 2013;48(1):52–58.
- , , , et al. Using quality improvement to optimise paediatric discharge efficiency. BMJ Qual Saf. 2014;23(5):428–436.
Community‐acquired pneumonia (CAP) is a common and serious infection in children. With more than 150,000 children requiring hospitalization annually, CAP is the fifth most prevalent and the second most costly diagnosis of all pediatric hospitalizations in the United States.[1, 2, 3]
In August 2011, the Pediatric Infectious Diseases Society (PIDS) and the Infectious Diseases Society of America (IDSA) published an evidence‐based guideline for the management of CAP in children. This guideline recommended that fully immunized children without underlying complications who require hospitalization receive an aminopenicillin as first‐line antibiotic therapy.[4] Additionally, the guideline recommends empirically adding a macrolide to an aminopenicillin when atypical pneumonia is a diagnostic consideration.
This recommendation was a substantial departure from practice for hospitals nationwide, as a multicenter study of children's hospitals (20052010) demonstrated that <10% of patients diagnosed with CAP received aminopenicillins as empiric therapy.[5] Since publication of the PIDS/IDSA guidelines, the use of aminopenicillins has increased significantly across institutions, but the majority of hospitalized patients still receive broad‐spectrum cephalosporin therapy for CAP.[6]
At baseline, 30% of patients hospitalized with CAP received guideline‐recommended antibiotic therapy at our institution. Through the use of quality‐improvement methods, the proportion of patients receiving guideline‐recommended therapy increased to 100%.[7] The objective of this study was to ensure that there were not unintended negative consequences to guideline implementation. Specifically, we sought to identify changes in length of stay (LOS), hospital costs, and treatment failures associated with use of guideline‐recommended antibiotic therapy for children hospitalized with uncomplicated CAP.
METHODS
Study Design and Study Population
This retrospective cohort study included children age 3 months to 18 years, hospitalized with CAP, between May 2, 2011 and July 30, 2012, at Cincinnati Children's Hospital Medical Center (CCHMC), a 512‐bed free‐standing children's hospital. The CCHMC Institutional Review Board approved this study with a waiver of informed consent.
Patients were eligible for inclusion if they were admitted to the hospital for inpatient or observation level care with a primary or secondary International Classification of Disease, 9th Revision discharge diagnosis code of pneumonia (480.02, 480.89, 481, 482.0, 482.30‐2, 482.41‐2, 482.83, 482.8990, 483.8, 484.3, 485, 486, 487.0) or effusion/empyema (510.0, 510.9, 511.01, 511.89, 513).[8] Patients with complex chronic conditions[9] were excluded. Medical records of eligible patients (n=260) were reviewed by 2 members of the study team to ensure that patients fell into the purview of the guideline. Patients who did not receive antibiotics (n=11) or for whom there was documented concern for aspiration (n=1) were excluded. Additionally, patients with immunodeficiency (n=1) or who had not received age‐appropriate vaccinations (n=2), and patients who required intensive care unit admission on presentation (n=17) or who had a complicated pneumonia, defined by presence of moderate or large pleural effusion at time of admission (n=8), were also excluded.[7] Finally, for patients with multiple pneumonia admissions, only the index visit was included; subsequent visits occurring within 30 days of discharge were considered readmissions.
Treatment Measure
The primary exposure of interest was empiric antibiotic therapy upon hospital admission. Antibiotic therapy was classified as guideline recommended or nonguideline recommended. Guideline‐recommended therapy was defined as follows:
- For children without drug allergies: ampicillin (200 mg/kg/day intravenously) or amoxicillin (90 mg/kg/day orally);
- For children with penicillin allergy: ceftriaxone (50100 mg/kg/day intravenously or intramuscularly) or cefdinir (14 mg/kg/day orally);
- For children with penicillin and cephalosporin allergy: clindamycin (40 mg/kg/day orally or intravenously); and
- Or azithromycin (10 mg/kg/day orally or intravenously on day 1) in combination with antibiotic category 1 or 2 or 3 above.
Outcome Measures
The primary outcomes examined were hospital LOS, total cost of hospitalization, and inpatient pharmacy costs. LOS was measured in hours and defined as the difference in time between departure from and arrival to the inpatient unit. Total cost of index hospitalization included both direct and indirect costs, obtained from the Centers for Medicare & Medicaid Services' Relative Value Units data for Current Procedural Terminology codes.[10]
Secondary outcomes included broadening of antibiotic therapy during the hospital course, pneumonia‐related emergency department (ED) revisits within 30 days, and pneumonia‐related inpatient readmissions within 30 days. Broadening of antibiotic therapy was defined as addition of a second antibiotic (eg, adding azithromycin on day 3 of hospitalization) or change in empiric antibiotic to a class with broader antimicrobial activity (eg, ampicillin to ceftriaxone) at any time during hospitalization. As our study population included only patients with uncomplicated pneumonia at the time of admission, this outcome was used to capture possible treatment failure. ED revisits and inpatient readmissions were reviewed by 3 investigators to identify pneumonia‐related visits. To encompass all possible treatment failures, all respiratory‐related complaints (eg, wheezing, respiratory distress) were considered as pneumonia‐related. Disagreements were resolved by group discussion.
Covariates
Severity of illness on presentation was evaluated using the Emergency Severity Index version 4,[11] abnormal vital signs on presentation (as defined by Pediatric Advanced Life Support age‐specific criteria[12]), and need for oxygen in the first 24 hours of hospitalization. Supplemental oxygen is administered for saturations <91% per protocol at our institution. The patient's highest Pediatric Early Warning Scale score[13] during hospitalization was used as a proxy for disease severity. Exam findings on presentation (eg, increased respiratory effort, rales, wheezing) were determined through chart review. Laboratory tests and radiologic imaging variables included complete blood cell count, blood culture, chest radiograph, chest ultrasound, and chest computed tomography. Abnormal white blood cell count was defined as <5000 or >15,000 cells/mL, the defined reference range for the CCHMC clinical laboratory.
Data Analysis
Continuous variables were described using median and interquartile range (IQR) and compared across groups using Wilcoxon rank sum test due to non‐normal distributions. Categorical variables were described by counts and frequencies and compared using the 2 test.
Multivariable linear regression analysis was performed to assess the independent effect of receipt of empiric guideline‐recommended antibiotic therapy on outcomes of LOS and costs while adjusting for covariates. As LOS and costs were non‐normally distributed, we logarithmically transformed these values to use as the dependent variables in our models. The resulting coefficients were back‐transformed to reflect the percent change in LOS and costs incurred between subjects who received empiric guideline therapy compared with those who did not.[14] Covariates were chosen a priori due to their clinical and biological relevance to the outcomes of LOS (eg, wheezing on presentation and need for supplemental oxygen), total cost of hospitalization (eg, LOS and need for repeat imaging), and inpatient pharmacy costs (eg, LOS and wheezing on presentation) (Table 1).
| Characteristic | Overall Cohort, n=220 | Guideline Therapy, n=166 | Nonguideline Therapy, n=54 | P Value |
|---|---|---|---|---|
| ||||
| Age, y, median (IQR) | 2.9 (1.36.3) | 2.5 (1.35.2) | 5.6 (2.38.8) | <0.01* |
| Male, no. (%) | 122 (55.5%) | 89 (53.6%) | 33 (61.1%) | 0.34 |
| Emergency Severity Index, no. (%) | 0.11 | |||
| 2 | 90 (40.9%) | 73 (44.0%) | 17 (31.5%) | |
| 3 | 116 (52.7%) | 85 (51.2%) | 31 (57.4%) | |
| 4 | 14 (6.4%) | 8 (4.8%) | 6 (11.1%) | |
| Abnormal vital signs on presentation, no. (%) | ||||
| Fever | 99 (45.0%) | 80 (48.2%) | 19 (35.2%) | 0.10 |
| Tachycardia | 100 (45.5%) | 76 (45.8%) | 24 (44.4%) | 0.86 |
| Tachypnea | 124 (56.4%) | 100 (60.2%) | 24 (44.4%) | 0.04* |
| Hypotension | 0 | 0 | 0 | |
| Hypoxia | 27 (12.3%) | 24 (14.5%) | 3 (5.6%) | 0.08 |
| Physical exam on presentation, no. (%) | ||||
| Increased respiratory effort | 146 (66.4%) | 111 (66.9%) | 35 (64.8%) | 0.78 |
| Distressed | 110 (50.0%) | 86 (51.8%) | 24 (44.4%) | 0.35 |
| Retraction | 103 (46.8%) | 81 (48.8%) | 22 (40.7%) | 0.30 |
| Grunting | 17 (7.7%) | 14 (8.4%) | 3 (5.6%) | 0.49 |
| Nasal flaring | 19 (8.6%) | 17 (10.2%) | 2 (3.7%) | 0.14 |
| Rales | 135 (61.4%) | 99 (59.6%) | 36 (66.7%) | 0.36 |
| Wheeze | 91 (41.4%) | 66 (39.8%) | 25 (46.3%) | 0.40 |
| Decreased breath sounds | 89 (40.5%) | 65 (39.2%) | 24 (44.4%) | 0.49 |
| Dehydration | 21 (9.6%) | 13 (7.8%) | 8 (14.8%) | 0.13 |
| PEWS 5 during admission, no. (%) | 43 (19.6%) | 34 (20.5%) | 9 (16.7%) | 0.54 |
| Oxygen requirement in first 24 hours, no. (%) | 114 (51.8%) | 90 (53.6%) | 24 (46.2%) | 0.35 |
| Complete blood count obtained, no. (%) | 99 (45.0%) | 72 (43.4%) | 27 (50.0%) | 0.40 |
| Abnormal white blood cell count | 35 (35.7%) | 23 (32.4%) | 12 (44.4%) | 0.27 |
| Blood culture obtained, no. (%) | 104 (47.3%) | 80 (48.2%) | 24 (44.4%) | 0.63 |
| Positive | 2 (1.9%) | 1 (1.3%) | 1 (4.2%) | 0.36 |
| Chest radiograph available, no. (%) | 214 (97.3%) | 161 (97.0%) | 53 (98.2%) | 0.65 |
| Infiltrate | 178 (83.2%) | 139 (86.3%) | 39 (73.6%) | 0.03* |
| Bilateral | 29 (16.3%) | 20 (14.4%) | 9 (23.1%) | 0.19 |
| Multilobar | 46 (25.8%) | 33 (23.7%) | 13 (33.3%) | 0.23 |
| Effusion | 24 (11.2%) | 16 (9.9%) | 8 (15.1%) | 0.30 |
| Additional imaging, no. (%) | ||||
| Repeat chest radiograph | 26 (11.8%) | 17 (10.2%) | 9 (16.7%) | 0.20 |
| Chest ultrasound | 4 (1.8%) | 3 (1.8%) | 1 (1.9%) | 0.98 |
| Chest CT | 2 (0.9%) | 1 (0.6%) | 1 (1.9%) | 0.40 |
| Antibiotic, no. (%) | <0.01* | |||
| Aminopenicillin | 140 (63.6%) | 140 (84.3%) | 0 (0%) | |
| Third‐generation cephalosporin | 37 (16.8%) | 8 (4.8%) | 29 (53.7%) | |
| Macrolide monotherapy | 18 (8.2%) | 0 (0%) | 18 (33.3%) | |
| Clindamycin | 2 (0.9%) | 1 (0.6%) | 1 (1.9%) | |
| Levofloxacin | 1 (0.5%) | 0 (0%) | 1 (1.9%) | |
| Aminopenicillin+macrolide | 16 (7.3%) | 16 (9.6%) | 0 (0%) | |
| Cephalosporin+macrolide | 6 (2.7%) | 1 (0.6%) | 5 (9.3%) | |
Secondary outcomes of broadened antibiotic therapy, ED revisits, and hospital readmissions were assessed using the Fisher exact test. Due to the small number of events, we were unable to evaluate these associations in models adjusted for potential confounders.
All analyses were performed with SAS version 9.3 (SAS Institute, Cary, NC), and P values <0.05 were considered significant.
RESULTS
Of the 220 unique patients included, 122 (55%) were male. The median age was 2.9 years (IQR: 1.36.3 years). Empiric guideline‐recommended therapy was prescribed to 168 (76%) patients (Table 1). Aminopenicillins were the most common guideline‐recommended therapy, accounting for 84% of guideline‐recommended antibiotics. An additional 10% of patients received the guideline‐recommended combination therapy with an aminopenicillin and a macrolide. Nonguideline‐recommended therapy included third‐generation cephalosporin antibiotics (54%) and macrolide monotherapy (33%).
Those who received empiric guideline‐recommended antibiotic therapy were similar to those who received nonguideline‐recommended therapy with respect to sex, Emergency Severity Index, physical exam findings on presentation, oxygen requirement in the first 24 hours, abnormal laboratory findings, presence of effusion on chest radiograph, and need for additional imaging (Table 1). However, patients in the guideline‐recommended therapy group were significantly younger (median 2.5 years vs 5.6 years, P0.01), more likely to have elevated respiratory rate on presentation (60.2% vs 44.4%, P=0.04), and more likely to have an infiltrate on chest radiograph (86.3% vs 73.6%, P=0.03) (Table 1). Patients who received nonguideline‐recommended macrolide monotherapy had a median age of 7.4 years (IQR: 5.89.8 years).
Median hospital LOS for the total cohort was 1.3 days (IQR: 0.91.9 days) (Table 2). There were no differences in LOS between patients who received and did not receive guideline‐recommended therapy in the unadjusted or the adjusted model (Table 3).
| Outcome | Guideline Therapy, n=166 | Nonguideline Therapy, n=54 | P Value |
|---|---|---|---|
| |||
| Length of stay, d, median (IQR) | 1.3 (0.91.9) | 1.3 (0.92.0) | 0.74 |
| Total costs, median, (IQR) | $4118 ($2,647$6,004) | $4045 ($2,829$6,200) | 0.44 |
| Pharmacy total costs, median, (IQR) | $84 ($40$179) | $106 ($58$217) | 0.12 |
| Broadened therapy, no. (%) | 10 (6.0%) | 4 (7.4%) | 0.75 |
| Emergency department revisit, no. (%) | 7 (4.2%) | 2 (3.7%) | 1.00 |
| Readmission, no. (%) | 1 (0.6%) | 1 (1.9%) | 0.43 |
| Outcome | Unadjusted Coefficient (95% CI) | Adjusted Coefficient (95% CI) | Adjusted % Change in Outcome (95% CI)* |
|---|---|---|---|
| |||
| Length of stay | 0.06 (0.27 to 0.15) | 0.06 (0.25 to 0.12) | 5.8 (22.1 to 12.8) |
| Total costs | 0.18 (0.40 to 0.04) | 0.11 (0.32 to 0.09) | 10.9 (27.4 to 9.4) |
| Pharmacy total costs | 0.44 (0.46 to 0.02) | 0.16 (0.57 to 0.24) | 14.8 (43.4 to 27.1) |
Median total costs of the index hospitalization for the total cohort were $4097 (IQR: $2657$6054), with median inpatient pharmacy costs of $92 (IQR: $40$183) (Table 2). There were no differences in total or inpatient pharmacy costs for patients who received guideline‐recommended therapy compared with those who did not in unadjusted or adjusted analyses. Fourteen patients (6.4%) had antibiotic therapy broadened during hospitalization, 10 were initially prescribed guideline‐recommended therapy, and 4 were initially prescribed nonguideline‐recommended therapy (Table 4).
| Initial Therapy | Reasons for Antibiotic Change Identified From Chart Review |
|---|---|
| Guideline=10 | Ampicillin to ceftriaxone: |
| 1 patient with clinical worsening | |
| 1 patient with coincident urinary tract infection due to resistant organism | |
| 4 patients without evidence of clinical worsening or documentation of rationale | |
| Addition of a macrolide: | |
| 3 patients without evidence of clinical worsening or documentation of rationale | |
| Addition of clindamycin: | |
| 1 patient with clinical worsening | |
| Nonguideline=4 | Ceftriaxone to clindamycin: |
| 1 patient with clinical worsening | |
| Addition of a macrolide: | |
| 1 patient with clinical worsening | |
| 1 patients without evidence of clinical worsening or documentation of rationale | |
| Addition of clindamycin: | |
| 1 patient with clinical worsening |
Of the 9 pneumonia‐related ED revisits within 30 days of discharge, 7 occurred in patients prescribed empiric guideline‐recommended therapy (Table 5). No ED revisit resulted in hospital readmission or antibiotic change related to pneumonia. Two ED revisits resulted in new antibiotic prescriptions for diagnoses other than pneumonia.
| Revisit | Initial Therapy | Day Postdischarge | Clinical Symptoms at Return Visit | Clinical Diagnosis | Antibiotic Prescription |
|---|---|---|---|---|---|
| |||||
| ED | Guideline | 3 | Poor oral intake and fever | Pneumonia | Continued prior antibiotic |
| ED | Guideline | 8 | Recurrent cough and fever | Resolving pneumonia | Continued prior antibiotic |
| ED | Guideline | 13 | Follow‐up | Resolved pneumonia | No further antibiotic |
| ED | Guideline | 16 | Increased work of breathing | Reactive airway disease | No antibiotic |
| ED | Guideline | 20 | Persistent cough | Viral illness | No antibiotic |
| ED | Guideline | 22 | Recurrent cough and congestion | Sinusitis | Augmentin |
| ED | Guideline | 26 | Increased work of breathing | Reactive airway disease | No antibiotic |
| ED | Nonguideline | 16 | Recurrent fever | Acute otitis media | Amoxicillin |
| ED | Nonguideline | 20 | Recurrent cough and fever | Viral illness | No antibiotic |
| Admission | Guideline | 3 | Increased work of breathing | Pneumonia | IV ampicillin |
| Admission | Nonguideline | 9 | Refusal to take oral clindamycin | Pneumonia | IV clindamycin |
Two patients were readmitted for a pneumonia‐related illness within 30 days of discharge; 1 had received guideline‐recommended therapy (Table 5). Both patients were directly admitted to the inpatient ward without an associated ED visit. Antibiotic class was not changed for either patient upon readmission, despite the decision to convert to intravenous form.
DISCUSSION
In this retrospective cohort study, patients who received empiric guideline‐recommended antibiotic therapy on admission for CAP had no difference in LOS, total cost of hospitalization, or inpatient pharmacy costs compared with those who received therapy that varied from guideline recommendations. Our study suggests that prescribing narrow‐spectrum therapy and, in some circumstances, combination therapy, as recommended by the 2011 PIDS/IDSA pneumonia guideline, did not result in negative unintended consequences.
In our study, children receiving guideline‐recommended therapy were younger, more likely to have elevated respiratory rate on presentation, and more likely to have an infiltrate on chest radiograph. We hypothesize the age difference is a reflection of common use of nonguideline macrolide monotherapy in the older, school‐age child, as macrolides are commonly used for coverage of Mycoplasma pneumonia in older children with CAP.[15] Children receiving macrolide monotherapy were older than those receiving guideline‐recommended therapy (median age of 7.4 years and 2.5 years, respectively). We also hypothesize that some providers may prescribe macrolide monotherapy to children deemed less ill than expected for CAP (eg, normal percutaneous oxygen saturation). This hypothesis is supported by the finding that 60% of patients who had a normal respiratory rate and received nonguideline therapy were prescribed macrolide monotherapy. We did control for the characteristics that varied between the two treatment groups in our models to eliminate potential confounding.
One prior study evaluated the effects of guideline implementation in CAP. In evaluation of a clinical practice guideline that recommended ampicillin as first‐line therapy for CAP, no significant difference was found following guideline introduction in the number of treatment failures (defined as the need to broaden therapy or development of complicated pneumonia within 48 hours or 30‐day inpatient readmission).[16] Our study builds on these findings by directly comparing outcomes between recipients of guideline and nonguideline therapy, which was not done in the prestudy or poststudy design of prior work.[16] We believe that classifying patients based on empiric therapy received rather than timing of guideline introduction thoroughly examines the effect of following guideline recommendations. Additionally, outcomes other than treatment failures were examined in our study including LOS, costs, and ED revisits.
Our results are similar to other observational studies that compared narrow‐ and broad‐spectrum antibiotics for children hospitalized with CAP. Using administrative data, Williams et al. found no significant difference in LOS or cost between narrow‐ and broad‐spectrum intravenous antibiotic recipients ages 6 months to 18 years at 43 children's hospitals.[17] Queen et al. compared narrow‐ and broad‐spectrum antibiotic therapy for children ages 2 months to 18 years at 4 children's hospitals.[18] Differences in average daily cost were not significant, but children who received narrow‐spectrum antibiotics had a significantly shorter LOS. Finally, an observational study of 319 Israeli children <2 years of age found no significant difference in duration of oxygen requirement, LOS, or need for change in antibiotic therapy between the 66 children prescribed aminopenicillins and the 253 children prescribed cefuroxime.[19] These studies suggest that prescribing narrow‐spectrum antimicrobial therapy, as per the guideline recommendations, results in similar outcomes to broad‐spectrum antimicrobial therapy.
Our study adds to prior studies that compared narrow‐ and broad‐spectrum therapy by comparing outcomes associated with guideline‐recommended therapy to nonguideline therapy. We considered antibiotic therapy as guideline recommended if appropriately chosen per the guideline, not just by simple classification of antibiotic. For example, the use of a cephalosporin in a patient with aminopenicillin allergy was considered guideline‐recommended therapy. We chose to classify the exposure of empiric antibiotic therapy in this manner to reflect true clinical application of the guideline, as not all children are able to receive aminopenicillins. Additionally, as our study stemmed from our prior improvement work aimed at increasing guideline adherent therapy,[7] we have a higher frequency of narrow‐spectrum antibiotic use than prior studies. In our study, almost two‐thirds of patients received narrow‐spectrum therapy, whereas narrow‐spectrum use in prior studies ranged from 10% to 33%.[17, 18, 19] Finally, we were able to confirm the diagnosis of pneumonia via medical record review and to adjust for severity of illness using clinical variables including vital signs, physical exam findings, and laboratory and radiologic study results.
This study must be interpreted in the context of several limitations. First, our study population was defined through discharge diagnosis codes, and therefore dependent on the accuracy of coding. However, we minimized potential for misclassification through use of a previously validated approach to identify patients with CAP and through medical record review to confirm the diagnosis. Second, we may be unable to detect very small differences in outcomes given limited power, specifically for outcomes of LOS, ED revisits, hospital readmissions, and need to broaden antibiotic therapy. Third, residual confounding may be present. Although we controlled for many clinical variables in our analyses, antibiotic prescribing practices may be influenced by unmeasured factors. The potential of system level confounding is mitigated by standardized care for patients with CAP at our institution. Prior system‐level changes using quality‐improvement science have resulted in a high level of adherence with guideline‐recommended antimicrobials as well as standardized medical discharge criteria.[7, 20] Additionally, nonmedical factors may influence LOS, limiting its use as an outcome measure. This limitation was minimized in our study by standardizing medical discharge criteria. Prior work at our institution demonstrated that the majority of patients, including those with CAP, were discharged within 2 hours of meeting medical discharge criteria.[20] Fourth, discharged patients who experienced adverse outcomes may have received care at a nearby adult emergency department or at their pediatrician's office. Although these events would not have been captured in our electronic health record, serious complications due to treatment failure (eg, empyema) would require hospitalization. As our hospital is the only children's hospital in the Greater Cincinnati metropolitan area, these patents would receive care at our institution. Therefore, any misclassification of revisits or readmissions is likely to be minimal. Finally, study patients were admitted to a large tertiary academic children's hospital, warranting further investigation to determine if these findings can be translated to smaller community settings.
In conclusion, receipt of guideline‐recommended antibiotic therapy for patients hospitalized with CAP was not associated with increases in LOS, total costs of hospitalization, or inpatient pharmacy costs. Our findings highlight the importance of changing antibiotic prescribing practices to reflect guideline recommendations, as there was no evidence of negative unintended consequences with our local practice change.
Acknowledgments
Disclosures: Dr. Ambroggio and Dr. Thomson were supported by funds from the NRSA T32HP10027‐14. Dr. Shah was supported by funds from NIAID K01A173729. The authors report no conflicts of interest.
- , , , , , . Ambulatory visit rates and antibiotic prescribing for children with pneumonia, 1994–2007. Pediatrics. 2011;127(3):411–418.
- , , , , . National hospitalization trends for pediatric pneumonia and associated complications. Pediatrics. 2010;126(2):204–213.
- , , , et al. Prioritization of comparative effectiveness research topics in hospital pediatrics. Arch Pediatr Adolesc Med. 2012;166(12):1155–1164.
- , , , et al. The management of community‐acquired pneumonia in infants and children older than 3 months of age: clinical practice guidelines by the Pediatric Infectious Diseases Society and the Infectious Diseases Society of America. Clin Infect Dis. 2011;53(7):e25–e76.
- , , , et al. Variability in processes of care and outcomes among children hospitalized with community‐acquired pneumonia. Pediatr Infect Dis J. 2012;31(10):1036–1041.
- , , , et al. Impact of IDSA/PIDS guidelines on treatment of community‐acquired pneumonia in hospitalized children. Clin Infect Dis. 2014;58(6):834–838.
- , , , et al. Quality improvement methods increase appropriate antibiotic prescribing for childhood pneumonia. Pediatrics. 2013;131(5):e1623–e1631.
- , , , et al. Identifying pediatric community‐acquired pneumonia hospitalizations: accuracy of administrative billing codes. JAMA Pediatr. 2013;167(9):851–858.
- , , , , , . Deaths attributed to pediatric complex chronic conditions: national trends and implications for supportive care services. Pediatrics. 2001;107(6):E99.
- Centers for Medicare 2011.
- , , , et al. Pediatric advanced life support: 2010 American Heart Association guidelines for cardiopulmonary resuscitation and emergency cardiovascular care. Pediatrics. 2010;126(5):e1361–e1399.
- , , , , . Prospective evaluation of a pediatric inpatient early warning scoring system. J Spec Pediatr Nurs. 2009;14(2):79–85.
- , , , . Regression Methods in Biostatistics: Linear, Logistic, Survival, and Repeated Measures Models. New York, NY: Springer; 2005.
- , , , , . Treatment of mycoplasma pneumonia: a systematic review. Pediatrics. 2014;133(6):1081–1090.
- , , , , , . Impact of a guideline on management of children hospitalized with community‐acquired pneumonia. Pediatrics. 2012;129(3):e597–e604.
- , , , et al. Narrow vs broad‐spectrum antimicrobial therapy for children hospitalized with pneumonia. Pediatrics. 2013;132(5):e1141–e1148.
- , , , et al. Comparative effectiveness of empiric antibiotics for community‐acquired pneumonia. Pediatrics. 2014;133(1):e23–e29.
- , , , et al. Antibiotic treatment of children with community‐acquired pneumonia: comparison of penicillin or ampicillin versus cefuroxime. Pediatr Pulmonol. 2013;48(1):52–58.
- , , , et al. Using quality improvement to optimise paediatric discharge efficiency. BMJ Qual Saf. 2014;23(5):428–436.
© 2014 Society of Hospital Medicine
Face Sheet and Provider Identification
Acute illness requiring hospitalization can be overwhelming for children and their families who are coping with illness and the synthesis of information from a variety of healthcare providers.[1] Patient and family centeredness is endorsed by the Institute of Medicine and the American Academy of Pediatrics[2, 3] as central to quality healthcare. In academic institutions, the presence of medical students and residents adds to the number of providers families encounter. In July 2011, the Accreditation Council for Graduate Medical Education implemented new duty hour restrictions, limiting first year residents to a maximum of 16 hour shifts.[4] Consequently, caregivers and patients may be in contact with more healthcare providers; this fractured care may confuse patients and caregivers, and increase dissatisfaction with care.[5]
The primary objective of our study was to determine the effect of a face sheet tool on the percentage of medical team members correctly identified by caregivers. The secondary objective was to determine the effect of a face sheet tool on the evaluation and satisfaction rating of the medical team by caregivers. We hypothesized that caregivers who receive the face sheet tool will correctly identify a greater percentage of team members by name and role and have higher overall satisfaction with their hospital stay.
METHODS
We performed a prospective controlled study on 2 general pediatric units at Cincinnati Children's Hospital Medical Center (CCHMC). Patients on the intervention unit received the face sheet tool, whereas the concurrent control unit maintained usual procedures. Both units have 24 beds and care for general pediatric patients primarily covered by 4 resident teams and the hospital medicine faculty. Two paired resident teams composed of 2 senior residents, 3 to 4 interns, and 4 medical students primarily admit to each general pediatric unit. Team members rotate through day and night shifts. All employees and rotating students are required to wear the hospital issued identification badge that includes their names, photos, credentials, and role. The study was conducted from November 1, 2011 to November 30, 2011.
Included patients were admitted to the study units by the usual protocol at our hospital, in which nurse patient‐flow coordinators determine bed assignments. We excluded families whose children had an inpatient hospital stay of <12 hours and families who did not speak English. All patient families scheduled to be discharged later in the day on weekday mornings from the 2 study units were approached for study participation. Families were not compensated for their participation.
A face sheet tool, which is a sheet of paper with pictures and names of the intervention team attendings, senior residents, interns, and medical students as well as a description of team member roles, was distributed to patients and their caregivers. The face sheet tools were created using Microsoft Publisher (Microsoft Corp., Redmond, WA). Neither families nor providers were blinded to the intervention, and the residents assumed responsibility for introducing the face sheet tool to families.
For our primary outcome measure, the research coordinator asked participating caregivers to match provider photographs with names and roles by placing laminated pictures backed with Velcro tape in the appropriate position on a laminated poster sheet. Initially, we collected overall accuracy of identification by name and role. In the second week, we began collecting specific data on the attending physician.
The satisfaction survey consisted of the American Board of Internal Medicine (ABIM) patient satisfaction questionnaire, composed of 10, 5‐point Likert scale questions,[6, 7] and an overall rating of hospital question, On a scale from 1 to 10, with 1 being the worst possible hospital and 10 being the best possible hospital, what number would you rate this hospital? from the Hospital Consumer Assessment of Health Plans Survey.[8] Questions were asked aloud and families responded to the questions orally. A written list was also provided to families. We collected data on length of stay (LOS) at the time of outcome assessment as well as previous hospitalizations.
Data Analysis
Differences between the intervention and control groups for relationship of survey respondent to child, prior hospitalization, and LOS were evaluated using the Fisher exact, 2, and 2‐sample t test, respectively. Hospital LOS was log‐transformed prior to analysis. The effect of the face sheet tool was evaluated by analyzing the differences between the intervention and control groups in the proportion of correctly identified names and roles using the Wilcoxon rank sum test and using the Fisher exact test for attending identification. Skewed Likert scale satisfaction ratings and overall hospital ratings were dichotomized at the highest score possible and analyzed using the 2 test. An analysis adjusting for prior hospitalization and LOS was done using generalized linear models, with a Poisson link for the number of correctly identified names/roles and an offset for the number of names/roles given.
Our research was reviewed by the CCHMC institutional review board and deemed exempt.
RESULTS
A total of 96 families were approached for enrollment (50 in the intervention and 46 in the control). Of these, 86 families agreed to participate. Three families in the intervention group did not receive the face sheet tool and were excluded from analysis, leaving an analytic cohort of 83 (41 in intervention and 42 in control). Attending recognition by role was collected from 54 families (28 in intervention group and 26 in control group) and by name from 34 families (15 in intervention group and 19 in control group). Table 1 displays characteristics of each group. Among the 83 study participants, LOS at time of outcome assessment ranged from 0.4 to 12.0 days, and the number of medical team members that cared for these patients ranged from 3 to 14.
| Intervention, n=41 | Control, n=42 | P Valuea | |
|---|---|---|---|
| |||
| Relationship to patient | 0.67 | ||
| Mother | 33 (80%) | 35 (83%) | |
| Father | 5 (12%) | 6 (14%) | |
| Grandmother/legal guardian | 3 (7%) | 1 (2%) | |
| Prior hospitalization, yes | 12 (29%) | 24 (57%) | 0.01 |
| Length of stay (days) | 1.07 (0.861.34) | 1.32 (1.051.67) | 0.20 |
Families in the intervention group had a higher percentage of correctly identified members of the medical team by name and role as compared to the control group (Table 2). These findings remained significant after adjusting for LOS and prior hospitalization. In addition, in a subset of families with attending data available, more families accurately identified attending name and attending role in the intervention as compared to control group.
| Intervention | Control | P Valuea | |
|---|---|---|---|
| |||
| Medical team, proportion correctly identified: | N=41 | N=41 | |
| Medical team names | 25% (14, 58) | 11% (0, 25) | <0.01b |
| Medical team roles | 50% (37, 67) | 25% (12, 44) | <0.01b |
| Attending, correctly identified: | |||
| Attending's name | N=15 | N=19 | |
| 14 (93%), | 10 (53%), | 0.02c | |
| Attending's role | N=28 | N=26 | |
| 26 (93%) | 16 (62%) | 0.01 | |
| Patient satisfaction, best possible score for: | N=41 | N=42 | |
| Q1: Telling you everything, being truthful | 21 (51%) | 21 (50%) | 0.91 |
| Q2: Greeting you warmly, being friendly | 26 (63%) | 25 (60%) | 0.72 |
| Q3: Treating you like you're on the same level | 29 (71%) | 25 (60%) | 0.28 |
| Q4: Letting you tell your story, listening | 27 (66%) | 23 (55%) | 0.30 |
| Q5: Showing interest in you as a person | 26 (63%) | 23 (55%) | 0.42 |
| Q6: Warning your child during the physical exam | 21 (51%) | 21 (50%) | 0.91 |
| Q7: Discussing options, asking your opinion | 20 (49%) | 17 (40%) | 0.45 |
| Q8: Encouraging questions, answering clearly | 23 (56%) | 19 (45%) | 0.32 |
| Q9: Explaining what you need to know | 22 (54%) | 18 (43%) | 0.32 |
| Q10: Using words you can understand | 26 (63%) | 18 (43%) | 0.06 |
| Overall hospital rating | 27 (66%) | 26 (62%) | 0.71 |
No significant differences were noted between the groups when comparing all individual ABIM survey question scores or the overall hospital satisfaction rating (Table 2). Scores in both intervention and control groups were high in all categories.
DISCUSSION
Caregivers given the face sheet tool were better able to identify medical team members by name and role than caregivers in the control group. Previous studies have shown similar results.[9, 10] Families encountered a large number of providers (median of 8) during stays that were on average quite brief (median LOS of 23.6 hours). Despite the significant increase in caregivers' ability to identify providers, the effect was modest.
Our findings add to prior work on face sheet tools in pediatrics and internal medicine.[9, 10, 11] Our study occurred after the residency duty hour restrictions. We described the high number of providers that families encounter in this context. It is the first study to our knowledge to quantify the number of providers that families encounter after these changes and to report on how well families can identify these clinicians by name and role. Unlike other studies, satisfaction scores were not improved.[9] Potential reasons for this include: (1) caregiver knowledge of 2 to 4 key members of the team and not the whole team may be the primary driver of satisfaction, (2) caregiver activation or empowerment may be a more responsive measure than overall satisfaction, and (3) our satisfaction measures may have ceiling effects and/or be elevated in both groups by social desirability bias.
Our study highlights the need for further investigation of quality outcomes associated with residency work hour changes.[12, 13, 14] Specifically, exposure to large numbers of providers may hinder families from accurately identifying those entrusted with the care of their loved one. Of note, our research coordinator needed to present as many as 14 provider pictures to 1 family with a hospital stay of <24 hours. Large numbers of providers may create challenges in building rapport, ensuring effective communication and developing trust with families. We chose to evaluate identification of each team member by caregivers; our findings are suggestive of the need for alternative strategies. A more valuable intervention might target identification of key team members (eg, attending, primary intern, primary senior resident). A policy statement regarding transitions of care recommended the establishment of mechanisms to ensure patients and their families know who is responsible for their care.[15] Efforts toward achieving this goal are essential.
This study has several limitations. The study was completed at a single institution, and thus generalizability may be limited. Although the intervention and control units have similar characteristics, randomization did not occur at the patient level. The control group had significantly more patients who had greater than 1 admission compared to the intervention group. Patients enrolled in the study were from a weekday convenience sample; therefore, potential differences in results based on weekend admissions were unable to be assessed. The exclusion of nonEnglish‐speaking families could limit generalizability to this population. Social desirability bias may have elevated the scores in both groups. Providers tasked with the responsibility of introducing the face sheet tool to families did so in a nonstandardized way and may have interacted differently with families compared to the control team. Finally, our project's aim was focused on the effect of a face sheet tool on the identification and satisfaction rating of the medical team by caregivers. Truly family‐centered care would include efforts to improve families' knowledge of and satisfaction with all members of the healthcare team.
A photo‐based face sheet tool helped caregivers better identify their child's care providers by name and role in the hospital. Satisfaction scores were similar in both groups.
Acknowledgements
The authors thank the Pediatric Research in Inpatient Settings network, and specifically Drs. Karen Wilson and Samir Shah, for their assistance during a workshop at the Pediatric Hospital Medicine 2012 meeting in July 2012, during which a first draft of this manuscript was produced.
Disclosure: Nothing to report.
- , , , , . A child's admission to hospital: a qualitative study examining the experiences of parents. Intensive Care Med. 2005;31(9):1248–1254.
- Committee on Quality of Health Care in America. Institute of Medicine. Crossing the Quality Chasm: A New Health System for the 21st Century. Washington, DC: National Academy Press; 2001.
- Committee on Hospital Care and Institute for Patient‐ and Family‐Centered Care. Patient‐ and family‐centered care and the pediatrician's role. Pediatrics. 2012;129(2):394–404.
- , , . The new recommendations on duty hours from the ACGME Task Force. N Engl J Med. 2010;363(2):e3.
- , , , . Parental responses to involvement in rounds on a pediatric inpatient unit at a teaching hospital: a qualitative study. Acad Med. 2008;83(3):292–297.
- PSQ Project Co‐Investigators. Final Report on the Patient Satisfaction Questionnaire Project. Philadelphia, PA: American Board of Internal Medicine; 1989.
- , , , et al. Effect of multisource feedback on resident communication skills and professionalism: a randomized controlled trial. Arch Pediatr Adolesc Med. 2007;161(1):44–49.
- , , , , . Development, implementation, and public reporting of the HCAHPS survey. Med Care Res Rev. 2010;67(1):27–37.
- , , , . PHACES (Photographs of Academic Clinicians and Their Educational Status): a tool to improve delivery of family‐centered care. Acad Pediatr. 2010;10(2):138–145.
- , , , et al. Improving inpatients' identification of their doctors: use of FACE cards. Jt Comm J Qual Patient Saf. 2009;35(12):613–619.
- , . “Don't call me ‘mom’: how parents want to be greeted by their pediatrician. Clin Pediatr. 2009;48(7):720–722.
- , , , , , . Better rested, but more stressed? Evidence of the effects of resident work hour restrictions. Acad Pediatr. 2012;12(4):335–343.
- , , , et al. Pediatric residents' perspectives on reducing work hours and lengthening residency: a national survey. Pediatrics. 2012;130(1):99–107.
- , , , . Inpatient staffing within pediatric residency programs: work hour restrictions and the evolving role of the pediatric hospitalist. J Hosp Med. 2012;7(4):299–303.
- , , , et al. Transitions of Care Consensus policy statement: American College of Physicians, Society of General Internal Medicine, Society of Hospital Medicine, American Geriatrics Society, American College of Emergency Physicians, and Society for Academic Emergency Medicine. J Hosp Med. 2009;4(6):364–370.
Acute illness requiring hospitalization can be overwhelming for children and their families who are coping with illness and the synthesis of information from a variety of healthcare providers.[1] Patient and family centeredness is endorsed by the Institute of Medicine and the American Academy of Pediatrics[2, 3] as central to quality healthcare. In academic institutions, the presence of medical students and residents adds to the number of providers families encounter. In July 2011, the Accreditation Council for Graduate Medical Education implemented new duty hour restrictions, limiting first year residents to a maximum of 16 hour shifts.[4] Consequently, caregivers and patients may be in contact with more healthcare providers; this fractured care may confuse patients and caregivers, and increase dissatisfaction with care.[5]
The primary objective of our study was to determine the effect of a face sheet tool on the percentage of medical team members correctly identified by caregivers. The secondary objective was to determine the effect of a face sheet tool on the evaluation and satisfaction rating of the medical team by caregivers. We hypothesized that caregivers who receive the face sheet tool will correctly identify a greater percentage of team members by name and role and have higher overall satisfaction with their hospital stay.
METHODS
We performed a prospective controlled study on 2 general pediatric units at Cincinnati Children's Hospital Medical Center (CCHMC). Patients on the intervention unit received the face sheet tool, whereas the concurrent control unit maintained usual procedures. Both units have 24 beds and care for general pediatric patients primarily covered by 4 resident teams and the hospital medicine faculty. Two paired resident teams composed of 2 senior residents, 3 to 4 interns, and 4 medical students primarily admit to each general pediatric unit. Team members rotate through day and night shifts. All employees and rotating students are required to wear the hospital issued identification badge that includes their names, photos, credentials, and role. The study was conducted from November 1, 2011 to November 30, 2011.
Included patients were admitted to the study units by the usual protocol at our hospital, in which nurse patient‐flow coordinators determine bed assignments. We excluded families whose children had an inpatient hospital stay of <12 hours and families who did not speak English. All patient families scheduled to be discharged later in the day on weekday mornings from the 2 study units were approached for study participation. Families were not compensated for their participation.
A face sheet tool, which is a sheet of paper with pictures and names of the intervention team attendings, senior residents, interns, and medical students as well as a description of team member roles, was distributed to patients and their caregivers. The face sheet tools were created using Microsoft Publisher (Microsoft Corp., Redmond, WA). Neither families nor providers were blinded to the intervention, and the residents assumed responsibility for introducing the face sheet tool to families.
For our primary outcome measure, the research coordinator asked participating caregivers to match provider photographs with names and roles by placing laminated pictures backed with Velcro tape in the appropriate position on a laminated poster sheet. Initially, we collected overall accuracy of identification by name and role. In the second week, we began collecting specific data on the attending physician.
The satisfaction survey consisted of the American Board of Internal Medicine (ABIM) patient satisfaction questionnaire, composed of 10, 5‐point Likert scale questions,[6, 7] and an overall rating of hospital question, On a scale from 1 to 10, with 1 being the worst possible hospital and 10 being the best possible hospital, what number would you rate this hospital? from the Hospital Consumer Assessment of Health Plans Survey.[8] Questions were asked aloud and families responded to the questions orally. A written list was also provided to families. We collected data on length of stay (LOS) at the time of outcome assessment as well as previous hospitalizations.
Data Analysis
Differences between the intervention and control groups for relationship of survey respondent to child, prior hospitalization, and LOS were evaluated using the Fisher exact, 2, and 2‐sample t test, respectively. Hospital LOS was log‐transformed prior to analysis. The effect of the face sheet tool was evaluated by analyzing the differences between the intervention and control groups in the proportion of correctly identified names and roles using the Wilcoxon rank sum test and using the Fisher exact test for attending identification. Skewed Likert scale satisfaction ratings and overall hospital ratings were dichotomized at the highest score possible and analyzed using the 2 test. An analysis adjusting for prior hospitalization and LOS was done using generalized linear models, with a Poisson link for the number of correctly identified names/roles and an offset for the number of names/roles given.
Our research was reviewed by the CCHMC institutional review board and deemed exempt.
RESULTS
A total of 96 families were approached for enrollment (50 in the intervention and 46 in the control). Of these, 86 families agreed to participate. Three families in the intervention group did not receive the face sheet tool and were excluded from analysis, leaving an analytic cohort of 83 (41 in intervention and 42 in control). Attending recognition by role was collected from 54 families (28 in intervention group and 26 in control group) and by name from 34 families (15 in intervention group and 19 in control group). Table 1 displays characteristics of each group. Among the 83 study participants, LOS at time of outcome assessment ranged from 0.4 to 12.0 days, and the number of medical team members that cared for these patients ranged from 3 to 14.
| Intervention, n=41 | Control, n=42 | P Valuea | |
|---|---|---|---|
| |||
| Relationship to patient | 0.67 | ||
| Mother | 33 (80%) | 35 (83%) | |
| Father | 5 (12%) | 6 (14%) | |
| Grandmother/legal guardian | 3 (7%) | 1 (2%) | |
| Prior hospitalization, yes | 12 (29%) | 24 (57%) | 0.01 |
| Length of stay (days) | 1.07 (0.861.34) | 1.32 (1.051.67) | 0.20 |
Families in the intervention group had a higher percentage of correctly identified members of the medical team by name and role as compared to the control group (Table 2). These findings remained significant after adjusting for LOS and prior hospitalization. In addition, in a subset of families with attending data available, more families accurately identified attending name and attending role in the intervention as compared to control group.
| Intervention | Control | P Valuea | |
|---|---|---|---|
| |||
| Medical team, proportion correctly identified: | N=41 | N=41 | |
| Medical team names | 25% (14, 58) | 11% (0, 25) | <0.01b |
| Medical team roles | 50% (37, 67) | 25% (12, 44) | <0.01b |
| Attending, correctly identified: | |||
| Attending's name | N=15 | N=19 | |
| 14 (93%), | 10 (53%), | 0.02c | |
| Attending's role | N=28 | N=26 | |
| 26 (93%) | 16 (62%) | 0.01 | |
| Patient satisfaction, best possible score for: | N=41 | N=42 | |
| Q1: Telling you everything, being truthful | 21 (51%) | 21 (50%) | 0.91 |
| Q2: Greeting you warmly, being friendly | 26 (63%) | 25 (60%) | 0.72 |
| Q3: Treating you like you're on the same level | 29 (71%) | 25 (60%) | 0.28 |
| Q4: Letting you tell your story, listening | 27 (66%) | 23 (55%) | 0.30 |
| Q5: Showing interest in you as a person | 26 (63%) | 23 (55%) | 0.42 |
| Q6: Warning your child during the physical exam | 21 (51%) | 21 (50%) | 0.91 |
| Q7: Discussing options, asking your opinion | 20 (49%) | 17 (40%) | 0.45 |
| Q8: Encouraging questions, answering clearly | 23 (56%) | 19 (45%) | 0.32 |
| Q9: Explaining what you need to know | 22 (54%) | 18 (43%) | 0.32 |
| Q10: Using words you can understand | 26 (63%) | 18 (43%) | 0.06 |
| Overall hospital rating | 27 (66%) | 26 (62%) | 0.71 |
No significant differences were noted between the groups when comparing all individual ABIM survey question scores or the overall hospital satisfaction rating (Table 2). Scores in both intervention and control groups were high in all categories.
DISCUSSION
Caregivers given the face sheet tool were better able to identify medical team members by name and role than caregivers in the control group. Previous studies have shown similar results.[9, 10] Families encountered a large number of providers (median of 8) during stays that were on average quite brief (median LOS of 23.6 hours). Despite the significant increase in caregivers' ability to identify providers, the effect was modest.
Our findings add to prior work on face sheet tools in pediatrics and internal medicine.[9, 10, 11] Our study occurred after the residency duty hour restrictions. We described the high number of providers that families encounter in this context. It is the first study to our knowledge to quantify the number of providers that families encounter after these changes and to report on how well families can identify these clinicians by name and role. Unlike other studies, satisfaction scores were not improved.[9] Potential reasons for this include: (1) caregiver knowledge of 2 to 4 key members of the team and not the whole team may be the primary driver of satisfaction, (2) caregiver activation or empowerment may be a more responsive measure than overall satisfaction, and (3) our satisfaction measures may have ceiling effects and/or be elevated in both groups by social desirability bias.
Our study highlights the need for further investigation of quality outcomes associated with residency work hour changes.[12, 13, 14] Specifically, exposure to large numbers of providers may hinder families from accurately identifying those entrusted with the care of their loved one. Of note, our research coordinator needed to present as many as 14 provider pictures to 1 family with a hospital stay of <24 hours. Large numbers of providers may create challenges in building rapport, ensuring effective communication and developing trust with families. We chose to evaluate identification of each team member by caregivers; our findings are suggestive of the need for alternative strategies. A more valuable intervention might target identification of key team members (eg, attending, primary intern, primary senior resident). A policy statement regarding transitions of care recommended the establishment of mechanisms to ensure patients and their families know who is responsible for their care.[15] Efforts toward achieving this goal are essential.
This study has several limitations. The study was completed at a single institution, and thus generalizability may be limited. Although the intervention and control units have similar characteristics, randomization did not occur at the patient level. The control group had significantly more patients who had greater than 1 admission compared to the intervention group. Patients enrolled in the study were from a weekday convenience sample; therefore, potential differences in results based on weekend admissions were unable to be assessed. The exclusion of nonEnglish‐speaking families could limit generalizability to this population. Social desirability bias may have elevated the scores in both groups. Providers tasked with the responsibility of introducing the face sheet tool to families did so in a nonstandardized way and may have interacted differently with families compared to the control team. Finally, our project's aim was focused on the effect of a face sheet tool on the identification and satisfaction rating of the medical team by caregivers. Truly family‐centered care would include efforts to improve families' knowledge of and satisfaction with all members of the healthcare team.
A photo‐based face sheet tool helped caregivers better identify their child's care providers by name and role in the hospital. Satisfaction scores were similar in both groups.
Acknowledgements
The authors thank the Pediatric Research in Inpatient Settings network, and specifically Drs. Karen Wilson and Samir Shah, for their assistance during a workshop at the Pediatric Hospital Medicine 2012 meeting in July 2012, during which a first draft of this manuscript was produced.
Disclosure: Nothing to report.
- , , , , . A child's admission to hospital: a qualitative study examining the experiences of parents. Intensive Care Med. 2005;31(9):1248–1254.
- Committee on Quality of Health Care in America. Institute of Medicine. Crossing the Quality Chasm: A New Health System for the 21st Century. Washington, DC: National Academy Press; 2001.
- Committee on Hospital Care and Institute for Patient‐ and Family‐Centered Care. Patient‐ and family‐centered care and the pediatrician's role. Pediatrics. 2012;129(2):394–404.
- , , . The new recommendations on duty hours from the ACGME Task Force. N Engl J Med. 2010;363(2):e3.
- , , , . Parental responses to involvement in rounds on a pediatric inpatient unit at a teaching hospital: a qualitative study. Acad Med. 2008;83(3):292–297.
- PSQ Project Co‐Investigators. Final Report on the Patient Satisfaction Questionnaire Project. Philadelphia, PA: American Board of Internal Medicine; 1989.
- , , , et al. Effect of multisource feedback on resident communication skills and professionalism: a randomized controlled trial. Arch Pediatr Adolesc Med. 2007;161(1):44–49.
- , , , , . Development, implementation, and public reporting of the HCAHPS survey. Med Care Res Rev. 2010;67(1):27–37.
- , , , . PHACES (Photographs of Academic Clinicians and Their Educational Status): a tool to improve delivery of family‐centered care. Acad Pediatr. 2010;10(2):138–145.
- , , , et al. Improving inpatients' identification of their doctors: use of FACE cards. Jt Comm J Qual Patient Saf. 2009;35(12):613–619.
- , . “Don't call me ‘mom’: how parents want to be greeted by their pediatrician. Clin Pediatr. 2009;48(7):720–722.
- , , , , , . Better rested, but more stressed? Evidence of the effects of resident work hour restrictions. Acad Pediatr. 2012;12(4):335–343.
- , , , et al. Pediatric residents' perspectives on reducing work hours and lengthening residency: a national survey. Pediatrics. 2012;130(1):99–107.
- , , , . Inpatient staffing within pediatric residency programs: work hour restrictions and the evolving role of the pediatric hospitalist. J Hosp Med. 2012;7(4):299–303.
- , , , et al. Transitions of Care Consensus policy statement: American College of Physicians, Society of General Internal Medicine, Society of Hospital Medicine, American Geriatrics Society, American College of Emergency Physicians, and Society for Academic Emergency Medicine. J Hosp Med. 2009;4(6):364–370.