User login
Factors Associated With COVID-19 Disease Severity in US Children and Adolescents
The COVID-19 pandemic has led to more than 40 million infections and more than 650,000 deaths in the United States alone.1 Morbidity and mortality have disproportionately affected older adults.2-4 However, acute infection and delayed effects, such as multisystem inflammatory syndrome in children (MIS-C), occur and can lead to severe complications, hospitalization, and death in pediatric patients.5,6 Due to higher clinical disease prevalence and morbidity in the adult population, we have learned much about the clinical factors associated with severe adult COVID-19 disease.5,7-9 Such clinical factors include older age, concurrent comorbidities, smoke exposure, and Black race or Hispanic ethnicity, among others.5,7-10 However, there is a paucity of data on severe COVID-19 disease in pediatric patients.5,11,12 In addition, most immunization strategies and pharmacologic treatments for COVID-19 have not been evaluated or approved for use in children.13 To guide targeted prevention and treatment strategies, there is a critical need to identify children and adolescents—who are among the most vulnerable patient populations—at high risk for severe disease.
Identifying the clinical factors associated with severe COVID-19 disease will help with prioritizing and allocating vaccines when they are approved for use in patients younger than 12 years.
METHODS
Study Design
We conducted a multicenter retrospective cohort study of patients presenting for care at pediatric hospitals that report data to the Pediatric Health Information System (PHIS) database. The PHIS administrative database includes billing and utilization data from 45 US tertiary care hospitals affiliated with the Children’s Hospital Association (Lenexa, Kansas). Data quality and reliability are ensured through a joint validation effort between the Children’s Hospital Association and participating hospitals. Hospitals submit discharge data, including demographics, diagnoses, and procedures using International Classification of Diseases, 10th Revision (ICD-10) codes, along with daily detailed information on pharmacy, location of care, and other services.
Study Population
Patients 30 days to 18 years of age discharged from the emergency department (ED) or inpatient setting with a primary diagnosis of COVID-19 (ICD-10 codes U.071 and U.072) between April 1, 2020, and September 30, 2020, were eligible for inclusion.14 In a prior study, the positive predictive value of an ICD-10–coded diagnosis of COVID-19 among hospitalized pediatric patients was 95.5%, compared with reverse transcription polymerase reaction results or presence of MIS-C.15 The diagnostic code for COVID-19 (ICD-10-CM) also had a high sensitivity (98.0%) in the hospitalized population.16 Acknowledging the increasing practice of screening patients upon admission, and in an attempt to minimize potential misclassification, we did not include encounters with secondary diagnoses of COVID-19 in our primary analyses. Pediatric patients with surgical diagnoses and neonates who never left the hospital were also excluded.
Factors Associated With Severe COVID-19 Disease
Exposures of interest were determined a priori based on current evidence in the literature and included patient age (0-4 years, 5-11 years, and 12-18 years), sex, race and ethnicity (non-Hispanic White, non-Hispanic Black, Hispanic, Asian, other non-White race [defined as Pacific Islander, Native American, or other]), payor type, cardiovascular complex chronic conditions (CCC), neuromuscular CCC, obesity/type 2 diabetes mellitus (DM), pulmonary CCC, asthma (defined using ICD-10 codes17), and immunocompromised CCC
Pediatric Complications and Conditions Associated With COVID-19
Based on current evidence and expert opinion of study members, associated diagnoses and complications co-occurring with a COVID-19 diagnosis were defined a priori and identified through ICD-10 codes (Appendix Table 1). These included acute kidney injury, acute liver injury, aseptic meningitis, asthma exacerbation, bronchiolitis, cerebral infarction, croup, encephalitis, encephalopathy, infant fever, febrile seizure, gastroenteritis/dehydration, Kawasaki disease/MIS-C, myocarditis/pericarditis, pneumonia, lung effusion or empyema, respiratory failure, sepsis, nonfebrile seizure, pancreatitis, sickle cell complications, and thrombotic complications.
Outcomes
COVID-19 severity outcomes were assessed as follows: (1) mild = ED discharge; (2) moderate = inpatient admission; (3) severe = intensive care unit (ICU) admission without mechanical ventilation, shock, or death; and (4) very severe = ICU admission with mechanical ventilation, shock, or death.19 This ordinal ranking system did not violate the proportional odds assumption. Potential reasons for admission to the ICU without mechanical ventilation, shock, or death include, but are not limited to, need for noninvasive ventilation, vital sign instability, dysrhythmias, respiratory insufficiency, or complications arising from concurrent conditions (eg, thrombotic events, need for continuous albuterol therapy). We examined several secondary, hospital-based outcomes, including associated diagnoses and complications, all-cause 30-day healthcare reutilization (ED visit or rehospitalization), length of stay (LOS), and ICU LOS.
Statistical Analysis
Demographic characteristics were summarized using frequencies and percentages for categorical variables and geometric means with SD and medians with interquartile ranges (IQR) for continuous variables, as appropriate. Factors associated with hospitalization (encompassing severity levels 2-4) vs ED discharge (severity level 1) were assessed using logistic regression. Factors associated with increasing severity among hospitalized pediatric patients (severity levels 2, 3, and 4) were assessed using ordinal logistic regression. Covariates in these analyses included race and ethnicity, age, sex, payor, cardiovascular CCC, neurologic/neuromuscular CCC, obesity/type 2 DM, pulmonary CCC, asthma, and immunocompromised CCC. Adjusted odds ratios (aOR) and corresponding 95% CI for each risk factor were generated using generalized linear mixed effects models and random intercepts for each hospital. Given the potential for diagnostic misclassification of pediatric patients with COVID-19 based on primary vs secondary diagnoses, we performed sensitivity analyses defining the study population as those with a primary diagnosis of COVID-19 and those with a secondary diagnosis of COVID-19 plus a concurrent primary diagnosis of a condition associated with COVID-19 (Appendix Table 1).
All analyses were performed using SAS version 9.4 (SAS Institute, Inc), and P < .05 was considered statistically significant. The Institutional Review Board at Vanderbilt University Medical Center determined that this study of de-identified data did not meet the criteria for human subjects research.
RESULTS
Study Population
A total of 19,976 encounters were included in the study. Of those, 15,913 (79.7%) were discharged from the ED and 4063 (20.3%) were hospitalized (Table 1). The most common race/ethnicity was Hispanic (9741, 48.8%), followed by non-Hispanic White (4217, 21.1%). Reference race/ethnicity data for the overall 2019 PHIS population can be found in Appendix Table 2.

The severity distribution among the hospitalized population was moderate (3222, 79.3%), severe (431, 11.3%), and very severe (380, 9.4%). The frequency of COVID-19 diagnoses increased late in the study period (Figure). Among those hospitalized, the median LOS for the index admission was 2 days (IQR, 1-4), while among those admitted to the ICU, the median LOS was 3 days (IQR, 2-5).

Overall, 10.1% (n = 2020) of the study population had an all-cause repeat encounter (ie, subsequent ED encounter or hospitalization) within 30 days following the index discharge. Repeat encounters were more frequent among patients hospitalized than among those discharged from the ED (Appendix Table 3).
Prevalence of Conditions and Complications Associated With COVID-19
Overall, 3257 (16.3%) patients had one or more co-occurring diagnoses categorized as a COVID-19–associated condition or complication. The most frequent diagnoses included lower respiratory tract disease (pneumonia, lung effusion, or empyema; n = 1415, 7.1%), gastroenteritis/dehydration (n = 1068, 5.3%), respiratory failure (n = 731, 3.7%), febrile infant (n = 413, 2.1%), and nonfebrile seizure (n = 425, 2.1%). Aside from nonfebrile seizure, neurological complications were less frequent and included febrile seizure (n = 155, 0.8%), encephalopathy (n = 63, 0.3%), aseptic meningitis (n = 16, 0.1%), encephalitis (n = 11, 0.1%), and cerebral infarction (n = 6, <0.1%). Kawasaki disease and MIS-C comprised 1.7% (n = 346) of diagnoses. Thrombotic complications occurred in 0.1% (n = 13) of patients. Overall, these conditions and complications associated with COVID-19 were more frequent in hospitalized patients than in those discharged from the ED (P < .001) (Table 2).

Factors Associated With COVID-19 Disease Severity
Compared to pediatric patients with COVID-19 discharged from the ED, factors associated with increased odds of hospitalization included private payor insurance; obesity/type 2 DM; asthma; and cardiovascular, immunocompromised, neurologic/neuromuscular, and pulmonary CCCs (Table 3). Factors associated with decreased risk of hospitalization included Black race or Hispanic ethnicity compared with White race; female sex; and age 5 to 11 years and age 12 to 17 years (vs age 0-4 years). Among children and adolescents hospitalized with COVID-19, factors associated with greater disease severity included Black or other non-White race; age 5 to 11 years; age 12 to 17 years; obesity/type 2 DM; immunocompromised conditions; and cardiovascular, neurologic/neuromuscular, and pulmonary CCCs (Table 3).

Sensitivity Analysis
We performed a sensitivity analysis that expanded the study population to include those with a secondary diagnosis of COVID-19 plus a diagnosis of a COVID-19–associated condition or complication. Analyses using the expanded population (N = 21,247) were similar to the primary analyses (Appendix Table 4 and Appendix Table 5).
DISCUSSION
In this large multicenter study evaluating COVID-19 disease severity in more than 19,000 patients presenting for emergency care at US pediatric hospitals, approximately 20% were hospitalized, and among those hospitalized almost a quarter required ICU care. Clinical risk factors associated with increased risk of hospitalization include private payor status and selected comorbidities (obesity/type 2 DM; asthma; and cardiovascular, pulmonary, immunocompromised, neurologic/neuromuscular CCCs), while those associated with decreased risk of hospitalization include older age, female sex, and Black race or Hispanic ethnicity. Factors associated with severe disease among hospitalized pediatric patients include Black or other non-White race, school age (≥5 years), and certain chronic conditions (cardiovascular disease, obesity/type 2 DM, neurologic or neuromuscular disease). Sixteen percent of patients had a concurrent diagnosis for a condition or complication associated with COVID-19.
While the study population (ie, children and adolescents presenting to the ED) represents a small fraction of children and adolescents in the community with SARS-CoV-2 infection, the results provide important insight into factors of severe COVID-19 in the pediatric population. A report from France suggested ventilatory or hemodynamic support or death were independently associated with older age (≥10 years), elevated C-reactive protein, and hypoxemia.12 An Italian study found that younger age (0-4 years) was associated with less severe disease, while preexisting conditions were more likely in patients with severe disease.11 A single-center case series of 50 patients (aged ≤21 years) hospitalized at a children’s hospital in New York City found respiratory failure (n = 9) was more common in children older than 1 year, patients with elevated inflammatory markers, and patients with obesity.20
Our study confirms several factors for severe COVID-19 found in these studies, including older age,11,12,20 obesity,20 and preexisting conditions.11 Our findings also expand on these reports, including identification of factors associated with hospitalization. Given the rate of 30-day re-encounters among pediatric patients with COVID-19 (10.1%), identifying risk factors for hospitalization may aid ED providers in determining optimal disposition (eg, home, hospital admission, ICU). We also identified specific comorbidities associated with more severe disease in those hospitalized with COVID-19, such as cardiovascular disease, obesity/type 2 DM, and pulmonary, neurologic, or neuromuscular conditions. We also found that asthma increased the risk for hospitalization but not more severe disease among those hospitalized. This latter finding also aligns with recent single-center studies,21,22 whereas a Turkish study of pediatric patients aged 0 to 18 years found no association between asthma and COVID-19 hospitalizations.23We also examined payor type and racial/ethnic factors in our analysis. In 2019, patients who identified as Black or Hispanic comprised 52.3% of all encounters and 40.7% of hospitalizations recorded in the PHIS database. During the same year, encounters for influenza among Black or Hispanic pediatric patients comprised 58.7% of all influenza diagnoses and 47.0% of pediatric influenza hospitalizations (Appendix Table 2). In this study, patients who identified as Black or Hispanic race represented a disproportionately large share of patients presenting to children’s hospitals (68.5%) and of those hospitalized (60.8%). Hispanic ethnicity, in particular, represented a disproportionate share of patients seeking care for COVID-19 compared to the overall PHIS population (47.7% and 27.1%, respectively). After accounting for other factors, we found Black and other non-White race—but not of Hispanic ethnicity—were independently associated with more disease severity among those hospitalized. This contrasts with findings from a recent adult study by Yehia et al,24 who found (after adjusting for other clinical factors) no significant difference in mortality between Black patients and White patients among adults hospitalized due to COVID-19. It also contrasts with a recent large population-based UK study wherein pediatric patients identifying as Asian, but not Black or mixed race or ethnicity, had an increased risk of hospital admission and admission to the ICU compared to children identifying as White. Children identifying as Black or mixed race had longer hospital admissions.25 However, as the authors of the study note, residual confounders and ascertainment bias due to differences in COVID testing may have influenced these findings.
Our findings of differences in hospitalization and disease severity among those hospitalized by race and ethnicity should be interpreted carefully. These may reflect a constellation of factors that are difficult to measure, including differences in healthcare access, inequalities in care (including hospital admission inequalities), and implicit bias—all of which may reflect structural racism. For example, it is possible that children who identify as Black or Hispanic have different access to care compared to children who identify as White, and this may affect disease severity on presentation.2 Alternatively, it is possible that White pediatric patients are more likely to be hospitalized as compared to non-White pediatric patients with similar illness severity. Our finding that pediatric patients who identify as Hispanic or Black had a lower risk of hospitalization should be also interpreted carefully, as this may reflect higher utilization of the ED for SARS-CoV-2 testing, increased use of nonemergency services among those without access to primary care, or systematic differences in provider decision-making among this segment of the population.2 Further study is needed to determine specific drivers for racial and ethnic differences in healthcare utilization in children and adolescents with COVID-19.26
Complications and co-occurring diagnoses in adults with COVID-19 are well documented.27-30 However, there is little information to date on the co-occurring diagnoses and complications associated with COVID-19 in children and adolescents. We found that complications and co-occurring conditions occurred in 16.3% of the study population, with the most frequent conditions including known complications of viral infections such as pneumonia, respiratory failure, and seizures. Acute kidney and liver injury, as well as thrombotic complications, occurred less commonly than in adults.26-29 Interestingly, neurologic complications were also uncommon compared to adult reports8,31 and less frequent than in other viral illnesses in children and adolescents. For example, neurologic complications occur in approximately 7.5% of children and adolescents hospitalized with influenza.32
Limitations of the present study include the retrospective design, as well as incomplete patient-level clinical data in the PHIS database. The PHIS database only includes children’s hospitals, which may limit the generalizability of findings to community hospitals. We also excluded newborns, and our findings may not be generalizable to this population. We only included children and adolescents with a primary diagnosis of COVID-19, which has the potential for misclassification in cases where COVID-19 was a secondary diagnosis. However, results of our sensitivity analysis, which incorporated secondary diagnoses of COVID-19, were consistent with findings from our main analyses. Our study was designed to examine associations between certain prespecified factors and COVID-19 severity among pediatric patients who visited the ED or were admitted to the hospital during the COVID-19 pandemic. Thus, our findings must be interpreted in light of these considerations and may not be generalizable outside the ED or hospital setting. For example, it could be that some segments of the population utilized ED resources for testing, whereas others avoided the ED and other healthcare settings for fear of exposure to SARS-CoV-2. We also relied on diagnosis codes to identify concurrent diagnoses, as well as mechanical ventilation in our very severe outcome cohort, which resulted in this classification for some of these diagnoses. Despite these limitations, our findings represent an important step in understanding the risk factors associated with severe clinical COVID-19 disease in pediatric patients.
Our findings may inform future research and clinical interventions. Future studies on antiviral therapies and immune modulators targeting SARS-CoV-2 infection in children and adolescents should focus on high-risk populations, such as those identified in the study, as these patients are most likely to benefit from therapeutic interventions. Similarly, vaccine-development efforts may benefit from additional evaluation in high-risk populations, some of which may have altered immune responses. Furthermore, with increasing vaccination among adults and changes in recommendations, societal mitigation efforts (eg, masking, physical distancing) will diminish. Continued vigilance and COVID-19–mitigation efforts among high-risk children, for whom vaccines are not yet available, are critical during this transition.
CONCLUSION
Among children with COVID-19 who received care at children’s hospitals and EDs, 20% were hospitalized, and, of those, 21% were admitted to the ICU. Older children and adolescent patients had a lower risk of hospitalization; however, when hospitalized, they had greater illness severity. Those with selected comorbidities (eg, cardiovascular, obesity/type 2 DM, pulmonary and neurologic or neuromuscular disease) had both increased odds of hospitalization and in-hospital illness severity. While there were observed differences in COVID-19 severity by race and ethnicity, additional research is needed to clarify the drivers of such disparities. These factors should be considered when prioritizing mitigation strategies to prevent infection (eg, remote learning, avoidance of group activities, prioritization of COVID-19 vaccine when approved for children aged <12 years).
1. Centers for Disease Control and Prevention. COVID data tracker. Accessed September 9, 2021. https://covid.cdc.gov/covid-data-tracker/#datatracker-home
2. Levy C, Basmaci R, Bensaid P, et al. Changes in reverse transcription polymerase chain reaction-positive severe acute respiratory syndrome coronavirus 2 rates in adults and children according to the epidemic stages. Pediatr Infect Dis J. 2020;39(11):e369-e372. https://doi.org/10.1097/inf.0000000000002861
3. Gudbjartsson DF, Helgason A, Jonsson H, et al. Spread of SARS-CoV-2 in the Icelandic population. N Engl J Med. 2020;382(24):2302-2315. https://doi.org/10.1056/nejmoa2006100
4. Garg S, Kim L, Whitaker M, et al. Hospitalization rates and characteristics of patients hospitalized with laboratory-confirmed coronavirus disease 2019 - COVID-NET, 14 States, March 1-30, 2020. MMWR Morb Mortal Wkly Rep. 2020;69(15):458-464. https://doi.org/10.15585/mmwr.mm6915e3
5. Castagnoli R, Votto M, Licari A, et al. Severe acute respiratory syndrome coronavirus 2 (SARS-CoV-2) infection in children and adolescents: a systematic review. JAMA Pediatr. 2020;174(9):882-889. https://doi.org/10.1001/jamapediatrics.2020.1467
6. Feldstein LR, Rose EB, Horwitz SM, et al; Overcoming COVID-19 Investigators; CDC COVID-19 Response Team. Multisystem inflammatory syndrome in U.S. children and adolescents. N Engl J Med. 2020;383(4):334-346. https://doi.org/10.1056/nejmoa2021680
7. Magro B, Zuccaro V, Novelli L, et al. Predicting in-hospital mortality from coronavirus disease 2019: a simple validated app for clinical use. PLoS One. 2021;16(1):e0245281. https://doi.org/10.1371/journal.pone.0245281
8. Helms J, Kremer S, Merdji H, et al. Neurologic features in severe SARS-CoV-2 infection. N Engl J Med. 2020;382(23):2268-2270. https://doi.org/10.1056/nejmc2008597
9. Severe Covid GWAS Group; Ellinghaus D, Degenhardt F, Bujanda L, et al. Genomewide association study of severe Covid-19 with respiratory failure. N Engl J Med. 2020;383(16):1522-1534.
10. Kabarriti R, Brodin NP, Maron MI, et al. association of race and ethnicity with comorbidities and survival among patients with COVID-19 at an urban medical center in New York. JAMA Netw Open. 2020;3(9):e2019795. https://doi.org/10.1001/jamanetworkopen.2020.19795
11. Bellino S, Punzo O, Rota MC, et al; COVID-19 Working Group. COVID-19 disease severity risk factors for pediatric patients in Italy. Pediatrics. 2020;146(4):e2020009399. https://doi.org/10.1542/peds.2020-009399
12. Ouldali N, Yang DD, Madhi F, et al; investigator group of the PANDOR study. Factors associated with severe SARS-CoV-2 infection. Pediatrics. 2020;147(3):e2020023432. https://doi.org/10.1542/peds.2020-023432
13. Castells MC, Phillips EJ. Maintaining safety with SARS-CoV-2 vaccines. N Engl J Med. 2021;384(7):643-649. https://doi.org/10.1056/nejmra2035343
14. Antoon JW, Williams DJ, Thurm C, et al. The COVID-19 pandemic and changes in healthcare utilization for pediatric respiratory and nonrespiratory illnesses in the United States. J Hosp Med. 2021;16(5):294-297. https://doi.org/10.12788/jhm.3608
15. Blatz AM, David MZ, Otto WR, Luan X, Gerber JS. Validation of International Classification of Disease-10 code for identifying children hospitalized with coronavirus disease-2019. J Pediatric Infect Dis Soc. 2020;10(4):547-548. https://doi.org/10.1093/jpids/piaa140
16. Kadri SS, Gundrum J, Warner S, et al. Uptake and accuracy of the diagnosis code for COVID-19 among US hospitalizations. JAMA. 2020;324(24):2553-2554. https://doi.org/10.1001/jama.2020.20323
17. Kaiser SV, Rodean J, Bekmezian A, et al; Pediatric Research in Inpatient Settings (PRIS) Network. Effectiveness of pediatric asthma pathways for hospitalized children: a multicenter, national analysis. J Pediatr. 2018;197:165-171.e162. https://doi.org/10.1016/j.jpeds.2018.01.084
18. Feudtner C, Feinstein JA, Zhong W, Hall M, Dai D. Pediatric complex chronic conditions classification system version 2: updated for ICD-10 and complex medical technology dependence and transplantation. BMC Pediatr. 2014;14:199. https://doi.org/10.1186/1471-2431-14-199.
19. Williams DJ, Zhu Y, Grijalva CG, et al. Predicting severe pneumonia outcomes in children. Pediatrics. 2016;138(4):e20161019. https://doi.org/10.1542/peds.2016-1019
20. Zachariah P, Johnson CL, Halabi KC, et al. Epidemiology, clinical features, and disease severity in patients with coronavirus disease 2019 (COVID-19) in a children’s hospital in New York City, New York. JAMA Pediatr. 2020;174(10):e202430. https://doi.org/10.1001/jamapediatrics.2020.2430
21. DeBiasi RL, Song X, Delaney M, et al. Severe coronavirus disease-2019 in children and young adults in the Washington, DC, metropolitan region. J Pediatr. 2020;223:199-203.e191. https://doi.org/10.1016/j.jpeds.2020.05.007
22. Lovinsky-Desir S, Deshpande DR, De A, et al. Asthma among hospitalized patients with COVID-19 and related outcomes. J Allergy Clin Immunol. 2020;146(5):1027-1034.e1024. https://doi.org/10.1016/j.jaci.2020.07.026
23. Beken B, Ozturk GK, Aygun FD, Aydogmus C, Akar HH. Asthma and allergic diseases are not risk factors for hospitalization in children with coronavirus disease 2019. Ann Allergy Asthma Immunol. 2021;126(5):569-575. https://doi.org/10.1016/j.anai.2021.01.018
24. Yehia BR, Winegar A, Fogel R, et al. Association of race with mortality among patients hospitalized with coronavirus disease 2019 (COVID-19) at 92 US hospitals. JAMA Netw Open. 2020;3(8):e2018039. https://doi.org/10.1001/jamanetworkopen.2020.18039
25. Saatci D, Ranger TA, Garriga C, et al. Association between race and COVID-19 outcomes among 2.6 million children in England. JAMA Pediatr. 2021;e211685. https://doi.org/10.1001/jamapediatrics.2021.1685
26. Lopez L, 3rd, Hart LH, 3rd, Katz MH. Racial and ethnic health disparities related to COVID-19. JAMA. 2021;325(8):719-720. https://doi.org/10.1001/jama.2020.26443
27. Altunok ES, Alkan M, Kamat S, et al. Clinical characteristics of adult patients hospitalized with laboratory-confirmed COVID-19 pneumonia. J Infect Chemother. 2020. https://doi.org/10.1016/j.jiac.2020.10.020
28. Ali H, Daoud A, Mohamed MM, et al. Survival rate in acute kidney injury superimposed COVID-19 patients: a systematic review and meta-analysis. Ren Fail. 2020;42(1):393-397. https://doi.org/10.1080/0886022x.2020.1756323
29. Anirvan P, Bharali P, Gogoi M, Thuluvath PJ, Singh SP, Satapathy SK. Liver injury in COVID-19: the hepatic aspect of the respiratory syndrome - what we know so far. World J Hepatol. 2020;12(12):1182-1197. https://doi.org/10.4254/wjh.v12.i12.1182
30. Moschonas IC, Tselepis AD. SARS-CoV-2 infection and thrombotic complications: a narrative review. J Thromb Thrombolysis. 2021;52(1):111-123. https://doi.org/10.1007/s11239-020-02374-3
31. Lee MH, Perl DP, Nair G, et al. Microvascular injury in the brains of patients with Covid-19. N Engl J Med. 2020;384(5):481-483. https://doi.org/10.1056/nejmc2033369
32. Antoon JW, Hall M, Herndon A, et al. Prevalence, risk factors, and outcomes of influenza-associated neurological Complications in Children. J Pediatr. 2021;S0022-3476(21)00657-0. https://doi.org/10.1016/j.jpeds.2021.06.075
The COVID-19 pandemic has led to more than 40 million infections and more than 650,000 deaths in the United States alone.1 Morbidity and mortality have disproportionately affected older adults.2-4 However, acute infection and delayed effects, such as multisystem inflammatory syndrome in children (MIS-C), occur and can lead to severe complications, hospitalization, and death in pediatric patients.5,6 Due to higher clinical disease prevalence and morbidity in the adult population, we have learned much about the clinical factors associated with severe adult COVID-19 disease.5,7-9 Such clinical factors include older age, concurrent comorbidities, smoke exposure, and Black race or Hispanic ethnicity, among others.5,7-10 However, there is a paucity of data on severe COVID-19 disease in pediatric patients.5,11,12 In addition, most immunization strategies and pharmacologic treatments for COVID-19 have not been evaluated or approved for use in children.13 To guide targeted prevention and treatment strategies, there is a critical need to identify children and adolescents—who are among the most vulnerable patient populations—at high risk for severe disease.
Identifying the clinical factors associated with severe COVID-19 disease will help with prioritizing and allocating vaccines when they are approved for use in patients younger than 12 years.
METHODS
Study Design
We conducted a multicenter retrospective cohort study of patients presenting for care at pediatric hospitals that report data to the Pediatric Health Information System (PHIS) database. The PHIS administrative database includes billing and utilization data from 45 US tertiary care hospitals affiliated with the Children’s Hospital Association (Lenexa, Kansas). Data quality and reliability are ensured through a joint validation effort between the Children’s Hospital Association and participating hospitals. Hospitals submit discharge data, including demographics, diagnoses, and procedures using International Classification of Diseases, 10th Revision (ICD-10) codes, along with daily detailed information on pharmacy, location of care, and other services.
Study Population
Patients 30 days to 18 years of age discharged from the emergency department (ED) or inpatient setting with a primary diagnosis of COVID-19 (ICD-10 codes U.071 and U.072) between April 1, 2020, and September 30, 2020, were eligible for inclusion.14 In a prior study, the positive predictive value of an ICD-10–coded diagnosis of COVID-19 among hospitalized pediatric patients was 95.5%, compared with reverse transcription polymerase reaction results or presence of MIS-C.15 The diagnostic code for COVID-19 (ICD-10-CM) also had a high sensitivity (98.0%) in the hospitalized population.16 Acknowledging the increasing practice of screening patients upon admission, and in an attempt to minimize potential misclassification, we did not include encounters with secondary diagnoses of COVID-19 in our primary analyses. Pediatric patients with surgical diagnoses and neonates who never left the hospital were also excluded.
Factors Associated With Severe COVID-19 Disease
Exposures of interest were determined a priori based on current evidence in the literature and included patient age (0-4 years, 5-11 years, and 12-18 years), sex, race and ethnicity (non-Hispanic White, non-Hispanic Black, Hispanic, Asian, other non-White race [defined as Pacific Islander, Native American, or other]), payor type, cardiovascular complex chronic conditions (CCC), neuromuscular CCC, obesity/type 2 diabetes mellitus (DM), pulmonary CCC, asthma (defined using ICD-10 codes17), and immunocompromised CCC
Pediatric Complications and Conditions Associated With COVID-19
Based on current evidence and expert opinion of study members, associated diagnoses and complications co-occurring with a COVID-19 diagnosis were defined a priori and identified through ICD-10 codes (Appendix Table 1). These included acute kidney injury, acute liver injury, aseptic meningitis, asthma exacerbation, bronchiolitis, cerebral infarction, croup, encephalitis, encephalopathy, infant fever, febrile seizure, gastroenteritis/dehydration, Kawasaki disease/MIS-C, myocarditis/pericarditis, pneumonia, lung effusion or empyema, respiratory failure, sepsis, nonfebrile seizure, pancreatitis, sickle cell complications, and thrombotic complications.
Outcomes
COVID-19 severity outcomes were assessed as follows: (1) mild = ED discharge; (2) moderate = inpatient admission; (3) severe = intensive care unit (ICU) admission without mechanical ventilation, shock, or death; and (4) very severe = ICU admission with mechanical ventilation, shock, or death.19 This ordinal ranking system did not violate the proportional odds assumption. Potential reasons for admission to the ICU without mechanical ventilation, shock, or death include, but are not limited to, need for noninvasive ventilation, vital sign instability, dysrhythmias, respiratory insufficiency, or complications arising from concurrent conditions (eg, thrombotic events, need for continuous albuterol therapy). We examined several secondary, hospital-based outcomes, including associated diagnoses and complications, all-cause 30-day healthcare reutilization (ED visit or rehospitalization), length of stay (LOS), and ICU LOS.
Statistical Analysis
Demographic characteristics were summarized using frequencies and percentages for categorical variables and geometric means with SD and medians with interquartile ranges (IQR) for continuous variables, as appropriate. Factors associated with hospitalization (encompassing severity levels 2-4) vs ED discharge (severity level 1) were assessed using logistic regression. Factors associated with increasing severity among hospitalized pediatric patients (severity levels 2, 3, and 4) were assessed using ordinal logistic regression. Covariates in these analyses included race and ethnicity, age, sex, payor, cardiovascular CCC, neurologic/neuromuscular CCC, obesity/type 2 DM, pulmonary CCC, asthma, and immunocompromised CCC. Adjusted odds ratios (aOR) and corresponding 95% CI for each risk factor were generated using generalized linear mixed effects models and random intercepts for each hospital. Given the potential for diagnostic misclassification of pediatric patients with COVID-19 based on primary vs secondary diagnoses, we performed sensitivity analyses defining the study population as those with a primary diagnosis of COVID-19 and those with a secondary diagnosis of COVID-19 plus a concurrent primary diagnosis of a condition associated with COVID-19 (Appendix Table 1).
All analyses were performed using SAS version 9.4 (SAS Institute, Inc), and P < .05 was considered statistically significant. The Institutional Review Board at Vanderbilt University Medical Center determined that this study of de-identified data did not meet the criteria for human subjects research.
RESULTS
Study Population
A total of 19,976 encounters were included in the study. Of those, 15,913 (79.7%) were discharged from the ED and 4063 (20.3%) were hospitalized (Table 1). The most common race/ethnicity was Hispanic (9741, 48.8%), followed by non-Hispanic White (4217, 21.1%). Reference race/ethnicity data for the overall 2019 PHIS population can be found in Appendix Table 2.
The severity distribution among the hospitalized population was moderate (3222, 79.3%), severe (431, 11.3%), and very severe (380, 9.4%). The frequency of COVID-19 diagnoses increased late in the study period (Figure). Among those hospitalized, the median LOS for the index admission was 2 days (IQR, 1-4), while among those admitted to the ICU, the median LOS was 3 days (IQR, 2-5).
Overall, 10.1% (n = 2020) of the study population had an all-cause repeat encounter (ie, subsequent ED encounter or hospitalization) within 30 days following the index discharge. Repeat encounters were more frequent among patients hospitalized than among those discharged from the ED (Appendix Table 3).
Prevalence of Conditions and Complications Associated With COVID-19
Overall, 3257 (16.3%) patients had one or more co-occurring diagnoses categorized as a COVID-19–associated condition or complication. The most frequent diagnoses included lower respiratory tract disease (pneumonia, lung effusion, or empyema; n = 1415, 7.1%), gastroenteritis/dehydration (n = 1068, 5.3%), respiratory failure (n = 731, 3.7%), febrile infant (n = 413, 2.1%), and nonfebrile seizure (n = 425, 2.1%). Aside from nonfebrile seizure, neurological complications were less frequent and included febrile seizure (n = 155, 0.8%), encephalopathy (n = 63, 0.3%), aseptic meningitis (n = 16, 0.1%), encephalitis (n = 11, 0.1%), and cerebral infarction (n = 6, <0.1%). Kawasaki disease and MIS-C comprised 1.7% (n = 346) of diagnoses. Thrombotic complications occurred in 0.1% (n = 13) of patients. Overall, these conditions and complications associated with COVID-19 were more frequent in hospitalized patients than in those discharged from the ED (P < .001) (Table 2).
Factors Associated With COVID-19 Disease Severity
Compared to pediatric patients with COVID-19 discharged from the ED, factors associated with increased odds of hospitalization included private payor insurance; obesity/type 2 DM; asthma; and cardiovascular, immunocompromised, neurologic/neuromuscular, and pulmonary CCCs (Table 3). Factors associated with decreased risk of hospitalization included Black race or Hispanic ethnicity compared with White race; female sex; and age 5 to 11 years and age 12 to 17 years (vs age 0-4 years). Among children and adolescents hospitalized with COVID-19, factors associated with greater disease severity included Black or other non-White race; age 5 to 11 years; age 12 to 17 years; obesity/type 2 DM; immunocompromised conditions; and cardiovascular, neurologic/neuromuscular, and pulmonary CCCs (Table 3).
Sensitivity Analysis
We performed a sensitivity analysis that expanded the study population to include those with a secondary diagnosis of COVID-19 plus a diagnosis of a COVID-19–associated condition or complication. Analyses using the expanded population (N = 21,247) were similar to the primary analyses (Appendix Table 4 and Appendix Table 5).
DISCUSSION
In this large multicenter study evaluating COVID-19 disease severity in more than 19,000 patients presenting for emergency care at US pediatric hospitals, approximately 20% were hospitalized, and among those hospitalized almost a quarter required ICU care. Clinical risk factors associated with increased risk of hospitalization include private payor status and selected comorbidities (obesity/type 2 DM; asthma; and cardiovascular, pulmonary, immunocompromised, neurologic/neuromuscular CCCs), while those associated with decreased risk of hospitalization include older age, female sex, and Black race or Hispanic ethnicity. Factors associated with severe disease among hospitalized pediatric patients include Black or other non-White race, school age (≥5 years), and certain chronic conditions (cardiovascular disease, obesity/type 2 DM, neurologic or neuromuscular disease). Sixteen percent of patients had a concurrent diagnosis for a condition or complication associated with COVID-19.
While the study population (ie, children and adolescents presenting to the ED) represents a small fraction of children and adolescents in the community with SARS-CoV-2 infection, the results provide important insight into factors of severe COVID-19 in the pediatric population. A report from France suggested ventilatory or hemodynamic support or death were independently associated with older age (≥10 years), elevated C-reactive protein, and hypoxemia.12 An Italian study found that younger age (0-4 years) was associated with less severe disease, while preexisting conditions were more likely in patients with severe disease.11 A single-center case series of 50 patients (aged ≤21 years) hospitalized at a children’s hospital in New York City found respiratory failure (n = 9) was more common in children older than 1 year, patients with elevated inflammatory markers, and patients with obesity.20
Our study confirms several factors for severe COVID-19 found in these studies, including older age,11,12,20 obesity,20 and preexisting conditions.11 Our findings also expand on these reports, including identification of factors associated with hospitalization. Given the rate of 30-day re-encounters among pediatric patients with COVID-19 (10.1%), identifying risk factors for hospitalization may aid ED providers in determining optimal disposition (eg, home, hospital admission, ICU). We also identified specific comorbidities associated with more severe disease in those hospitalized with COVID-19, such as cardiovascular disease, obesity/type 2 DM, and pulmonary, neurologic, or neuromuscular conditions. We also found that asthma increased the risk for hospitalization but not more severe disease among those hospitalized. This latter finding also aligns with recent single-center studies,21,22 whereas a Turkish study of pediatric patients aged 0 to 18 years found no association between asthma and COVID-19 hospitalizations.23We also examined payor type and racial/ethnic factors in our analysis. In 2019, patients who identified as Black or Hispanic comprised 52.3% of all encounters and 40.7% of hospitalizations recorded in the PHIS database. During the same year, encounters for influenza among Black or Hispanic pediatric patients comprised 58.7% of all influenza diagnoses and 47.0% of pediatric influenza hospitalizations (Appendix Table 2). In this study, patients who identified as Black or Hispanic race represented a disproportionately large share of patients presenting to children’s hospitals (68.5%) and of those hospitalized (60.8%). Hispanic ethnicity, in particular, represented a disproportionate share of patients seeking care for COVID-19 compared to the overall PHIS population (47.7% and 27.1%, respectively). After accounting for other factors, we found Black and other non-White race—but not of Hispanic ethnicity—were independently associated with more disease severity among those hospitalized. This contrasts with findings from a recent adult study by Yehia et al,24 who found (after adjusting for other clinical factors) no significant difference in mortality between Black patients and White patients among adults hospitalized due to COVID-19. It also contrasts with a recent large population-based UK study wherein pediatric patients identifying as Asian, but not Black or mixed race or ethnicity, had an increased risk of hospital admission and admission to the ICU compared to children identifying as White. Children identifying as Black or mixed race had longer hospital admissions.25 However, as the authors of the study note, residual confounders and ascertainment bias due to differences in COVID testing may have influenced these findings.
Our findings of differences in hospitalization and disease severity among those hospitalized by race and ethnicity should be interpreted carefully. These may reflect a constellation of factors that are difficult to measure, including differences in healthcare access, inequalities in care (including hospital admission inequalities), and implicit bias—all of which may reflect structural racism. For example, it is possible that children who identify as Black or Hispanic have different access to care compared to children who identify as White, and this may affect disease severity on presentation.2 Alternatively, it is possible that White pediatric patients are more likely to be hospitalized as compared to non-White pediatric patients with similar illness severity. Our finding that pediatric patients who identify as Hispanic or Black had a lower risk of hospitalization should be also interpreted carefully, as this may reflect higher utilization of the ED for SARS-CoV-2 testing, increased use of nonemergency services among those without access to primary care, or systematic differences in provider decision-making among this segment of the population.2 Further study is needed to determine specific drivers for racial and ethnic differences in healthcare utilization in children and adolescents with COVID-19.26
Complications and co-occurring diagnoses in adults with COVID-19 are well documented.27-30 However, there is little information to date on the co-occurring diagnoses and complications associated with COVID-19 in children and adolescents. We found that complications and co-occurring conditions occurred in 16.3% of the study population, with the most frequent conditions including known complications of viral infections such as pneumonia, respiratory failure, and seizures. Acute kidney and liver injury, as well as thrombotic complications, occurred less commonly than in adults.26-29 Interestingly, neurologic complications were also uncommon compared to adult reports8,31 and less frequent than in other viral illnesses in children and adolescents. For example, neurologic complications occur in approximately 7.5% of children and adolescents hospitalized with influenza.32
Limitations of the present study include the retrospective design, as well as incomplete patient-level clinical data in the PHIS database. The PHIS database only includes children’s hospitals, which may limit the generalizability of findings to community hospitals. We also excluded newborns, and our findings may not be generalizable to this population. We only included children and adolescents with a primary diagnosis of COVID-19, which has the potential for misclassification in cases where COVID-19 was a secondary diagnosis. However, results of our sensitivity analysis, which incorporated secondary diagnoses of COVID-19, were consistent with findings from our main analyses. Our study was designed to examine associations between certain prespecified factors and COVID-19 severity among pediatric patients who visited the ED or were admitted to the hospital during the COVID-19 pandemic. Thus, our findings must be interpreted in light of these considerations and may not be generalizable outside the ED or hospital setting. For example, it could be that some segments of the population utilized ED resources for testing, whereas others avoided the ED and other healthcare settings for fear of exposure to SARS-CoV-2. We also relied on diagnosis codes to identify concurrent diagnoses, as well as mechanical ventilation in our very severe outcome cohort, which resulted in this classification for some of these diagnoses. Despite these limitations, our findings represent an important step in understanding the risk factors associated with severe clinical COVID-19 disease in pediatric patients.
Our findings may inform future research and clinical interventions. Future studies on antiviral therapies and immune modulators targeting SARS-CoV-2 infection in children and adolescents should focus on high-risk populations, such as those identified in the study, as these patients are most likely to benefit from therapeutic interventions. Similarly, vaccine-development efforts may benefit from additional evaluation in high-risk populations, some of which may have altered immune responses. Furthermore, with increasing vaccination among adults and changes in recommendations, societal mitigation efforts (eg, masking, physical distancing) will diminish. Continued vigilance and COVID-19–mitigation efforts among high-risk children, for whom vaccines are not yet available, are critical during this transition.
CONCLUSION
Among children with COVID-19 who received care at children’s hospitals and EDs, 20% were hospitalized, and, of those, 21% were admitted to the ICU. Older children and adolescent patients had a lower risk of hospitalization; however, when hospitalized, they had greater illness severity. Those with selected comorbidities (eg, cardiovascular, obesity/type 2 DM, pulmonary and neurologic or neuromuscular disease) had both increased odds of hospitalization and in-hospital illness severity. While there were observed differences in COVID-19 severity by race and ethnicity, additional research is needed to clarify the drivers of such disparities. These factors should be considered when prioritizing mitigation strategies to prevent infection (eg, remote learning, avoidance of group activities, prioritization of COVID-19 vaccine when approved for children aged <12 years).
1. Centers for Disease Control and Prevention. COVID data tracker. Accessed September 9, 2021. https://covid.cdc.gov/covid-data-tracker/#datatracker-home
2. Levy C, Basmaci R, Bensaid P, et al. Changes in reverse transcription polymerase chain reaction-positive severe acute respiratory syndrome coronavirus 2 rates in adults and children according to the epidemic stages. Pediatr Infect Dis J. 2020;39(11):e369-e372. https://doi.org/10.1097/inf.0000000000002861
3. Gudbjartsson DF, Helgason A, Jonsson H, et al. Spread of SARS-CoV-2 in the Icelandic population. N Engl J Med. 2020;382(24):2302-2315. https://doi.org/10.1056/nejmoa2006100
4. Garg S, Kim L, Whitaker M, et al. Hospitalization rates and characteristics of patients hospitalized with laboratory-confirmed coronavirus disease 2019 - COVID-NET, 14 States, March 1-30, 2020. MMWR Morb Mortal Wkly Rep. 2020;69(15):458-464. https://doi.org/10.15585/mmwr.mm6915e3
5. Castagnoli R, Votto M, Licari A, et al. Severe acute respiratory syndrome coronavirus 2 (SARS-CoV-2) infection in children and adolescents: a systematic review. JAMA Pediatr. 2020;174(9):882-889. https://doi.org/10.1001/jamapediatrics.2020.1467
6. Feldstein LR, Rose EB, Horwitz SM, et al; Overcoming COVID-19 Investigators; CDC COVID-19 Response Team. Multisystem inflammatory syndrome in U.S. children and adolescents. N Engl J Med. 2020;383(4):334-346. https://doi.org/10.1056/nejmoa2021680
7. Magro B, Zuccaro V, Novelli L, et al. Predicting in-hospital mortality from coronavirus disease 2019: a simple validated app for clinical use. PLoS One. 2021;16(1):e0245281. https://doi.org/10.1371/journal.pone.0245281
8. Helms J, Kremer S, Merdji H, et al. Neurologic features in severe SARS-CoV-2 infection. N Engl J Med. 2020;382(23):2268-2270. https://doi.org/10.1056/nejmc2008597
9. Severe Covid GWAS Group; Ellinghaus D, Degenhardt F, Bujanda L, et al. Genomewide association study of severe Covid-19 with respiratory failure. N Engl J Med. 2020;383(16):1522-1534.
10. Kabarriti R, Brodin NP, Maron MI, et al. association of race and ethnicity with comorbidities and survival among patients with COVID-19 at an urban medical center in New York. JAMA Netw Open. 2020;3(9):e2019795. https://doi.org/10.1001/jamanetworkopen.2020.19795
11. Bellino S, Punzo O, Rota MC, et al; COVID-19 Working Group. COVID-19 disease severity risk factors for pediatric patients in Italy. Pediatrics. 2020;146(4):e2020009399. https://doi.org/10.1542/peds.2020-009399
12. Ouldali N, Yang DD, Madhi F, et al; investigator group of the PANDOR study. Factors associated with severe SARS-CoV-2 infection. Pediatrics. 2020;147(3):e2020023432. https://doi.org/10.1542/peds.2020-023432
13. Castells MC, Phillips EJ. Maintaining safety with SARS-CoV-2 vaccines. N Engl J Med. 2021;384(7):643-649. https://doi.org/10.1056/nejmra2035343
14. Antoon JW, Williams DJ, Thurm C, et al. The COVID-19 pandemic and changes in healthcare utilization for pediatric respiratory and nonrespiratory illnesses in the United States. J Hosp Med. 2021;16(5):294-297. https://doi.org/10.12788/jhm.3608
15. Blatz AM, David MZ, Otto WR, Luan X, Gerber JS. Validation of International Classification of Disease-10 code for identifying children hospitalized with coronavirus disease-2019. J Pediatric Infect Dis Soc. 2020;10(4):547-548. https://doi.org/10.1093/jpids/piaa140
16. Kadri SS, Gundrum J, Warner S, et al. Uptake and accuracy of the diagnosis code for COVID-19 among US hospitalizations. JAMA. 2020;324(24):2553-2554. https://doi.org/10.1001/jama.2020.20323
17. Kaiser SV, Rodean J, Bekmezian A, et al; Pediatric Research in Inpatient Settings (PRIS) Network. Effectiveness of pediatric asthma pathways for hospitalized children: a multicenter, national analysis. J Pediatr. 2018;197:165-171.e162. https://doi.org/10.1016/j.jpeds.2018.01.084
18. Feudtner C, Feinstein JA, Zhong W, Hall M, Dai D. Pediatric complex chronic conditions classification system version 2: updated for ICD-10 and complex medical technology dependence and transplantation. BMC Pediatr. 2014;14:199. https://doi.org/10.1186/1471-2431-14-199.
19. Williams DJ, Zhu Y, Grijalva CG, et al. Predicting severe pneumonia outcomes in children. Pediatrics. 2016;138(4):e20161019. https://doi.org/10.1542/peds.2016-1019
20. Zachariah P, Johnson CL, Halabi KC, et al. Epidemiology, clinical features, and disease severity in patients with coronavirus disease 2019 (COVID-19) in a children’s hospital in New York City, New York. JAMA Pediatr. 2020;174(10):e202430. https://doi.org/10.1001/jamapediatrics.2020.2430
21. DeBiasi RL, Song X, Delaney M, et al. Severe coronavirus disease-2019 in children and young adults in the Washington, DC, metropolitan region. J Pediatr. 2020;223:199-203.e191. https://doi.org/10.1016/j.jpeds.2020.05.007
22. Lovinsky-Desir S, Deshpande DR, De A, et al. Asthma among hospitalized patients with COVID-19 and related outcomes. J Allergy Clin Immunol. 2020;146(5):1027-1034.e1024. https://doi.org/10.1016/j.jaci.2020.07.026
23. Beken B, Ozturk GK, Aygun FD, Aydogmus C, Akar HH. Asthma and allergic diseases are not risk factors for hospitalization in children with coronavirus disease 2019. Ann Allergy Asthma Immunol. 2021;126(5):569-575. https://doi.org/10.1016/j.anai.2021.01.018
24. Yehia BR, Winegar A, Fogel R, et al. Association of race with mortality among patients hospitalized with coronavirus disease 2019 (COVID-19) at 92 US hospitals. JAMA Netw Open. 2020;3(8):e2018039. https://doi.org/10.1001/jamanetworkopen.2020.18039
25. Saatci D, Ranger TA, Garriga C, et al. Association between race and COVID-19 outcomes among 2.6 million children in England. JAMA Pediatr. 2021;e211685. https://doi.org/10.1001/jamapediatrics.2021.1685
26. Lopez L, 3rd, Hart LH, 3rd, Katz MH. Racial and ethnic health disparities related to COVID-19. JAMA. 2021;325(8):719-720. https://doi.org/10.1001/jama.2020.26443
27. Altunok ES, Alkan M, Kamat S, et al. Clinical characteristics of adult patients hospitalized with laboratory-confirmed COVID-19 pneumonia. J Infect Chemother. 2020. https://doi.org/10.1016/j.jiac.2020.10.020
28. Ali H, Daoud A, Mohamed MM, et al. Survival rate in acute kidney injury superimposed COVID-19 patients: a systematic review and meta-analysis. Ren Fail. 2020;42(1):393-397. https://doi.org/10.1080/0886022x.2020.1756323
29. Anirvan P, Bharali P, Gogoi M, Thuluvath PJ, Singh SP, Satapathy SK. Liver injury in COVID-19: the hepatic aspect of the respiratory syndrome - what we know so far. World J Hepatol. 2020;12(12):1182-1197. https://doi.org/10.4254/wjh.v12.i12.1182
30. Moschonas IC, Tselepis AD. SARS-CoV-2 infection and thrombotic complications: a narrative review. J Thromb Thrombolysis. 2021;52(1):111-123. https://doi.org/10.1007/s11239-020-02374-3
31. Lee MH, Perl DP, Nair G, et al. Microvascular injury in the brains of patients with Covid-19. N Engl J Med. 2020;384(5):481-483. https://doi.org/10.1056/nejmc2033369
32. Antoon JW, Hall M, Herndon A, et al. Prevalence, risk factors, and outcomes of influenza-associated neurological Complications in Children. J Pediatr. 2021;S0022-3476(21)00657-0. https://doi.org/10.1016/j.jpeds.2021.06.075
© 2021 Society of Hospital Medicine
Healthcare Encounter and Financial Impact of COVID-19 on Children’s Hospitals
To benefit patients and the public health of their communities, children’s hospitals across the United States prepared for and responded to COVID-19 by conserving personal protective equipment, suspending noncritical in-person healthcare encounters (including outpatient visits and elective surgeries), and implementing socially distanced essential care.1,2 These measures were promptly instituted during a time of both substantial uncertainty about the pandemic’s behavior in children—including its severity and duration—and extreme variation in local and state governments’ responses to the pandemic.
Congruent with other healthcare institutions, children’s hospitals calibrated their clinical operations to the evolving nature of the pandemic, prioritizing the safety of patients and staff while striving to maintain financial viability in the setting of increased costs and decreased revenue. In some cases, children’s hospitals aided adult hospitals and health systems by admitting young and middle-aged adult patients and by centralizing all pediatric patients requiring intensive care within a region. These efforts occurred while many children’s hospitals remained the sole source of specialized pediatric care, including care for rare complex health problems.
As the COVID-19 pandemic continues, there is a critical need to assess how the initial phase of the pandemic affected healthcare encounters and related finances in children’s hospitals. Understanding these trends will position children’s hospitals to project and prepare for subsequent COVID-19 surges, as well as future related public health crises that necessitate widespread social distancing. Therefore, we compared year-over-year trends in healthcare encounters and hospital charges across US children’s hospitals before and during the COVID-19 pandemic, focusing on the beginning of COVID-19 in the United States, which was defined as February through June 2020.
METHODS
This is a retrospective analysis of 26 children’s hospitals (22 freestanding, 4 nonfreestanding) from all US regions (12 South, 7 Midwest, 5 West, 2 Northeast) contributing encounter and financial data to the PROSPECT database (Children’s Hospital Association, Lenexa, Kansas) from February 1 to June 30 in both 2019 (before COVID-19) and 2020 (during COVID-19). In response to COVID-19, hospitals participating in PROSPECT increased the efficiency of data centralization and reporting in 2020 during the period February 1 to June 30 to expedite analysis and dissemination of findings.
The main outcome measures were the percentage of change in weekly encounters (inpatient bed-days, emergency department [ED] visits, and surgeries) and inflation-adjusted charges (categorized as inpatient care and outpatient care, such as ambulatory surgery, clinics, and ED visits) before vs during COVID-19.
RESULTS


Charges that accrued from February 1 to June 30 were lower in 2020 by a median 23.6% (IQR, –28.7% to –19.1%) per children’s hospital than they were in 2019, corresponding to a median decrease of $276.3 million (IQR, $404.0-$126.0 million) in charges per hospital (Table). Forty percent of this decrease was attributable to decreased charges resulting from fewer inpatient healthcare encounters.
DISCUSSION
These findings beg the question of how well children’s hospitals are positioned to weather a recurrent surge in COVID-19. Because the severity of illness of COVID-19 has been lower to date in the pediatric vs adult populations, an increase in COVID-19-related visits to EDs and admissions to offset the decreased resource use of other pediatric healthcare problems is not anticipated. Existing hospital financial reserves as well as federal aid from the Coronavirus Aid, Relief, and Economic Security Act that helped mitigate the initial encounter and financial losses during the beginning of COVID-19 may not be readily available over time.4,5 Certainly, the findings from the current study support continued lobbying for additional state and federal funds allocated through future relief packages to children’s hospitals.
Additional approaches to financial solvency in children’s hospitals during the sustained COVID-19 pandemic include addressing surgical backlogs and sharing best practices for safe and sustained reopening of clinical operations and financial practices across institutions. Although the PROSPECT database does not contain information on the types of surgeries present within this backlog, our experiences suggest that both same-day and inpatient elective surgeries have been affected, especially lengthy procedures (eg, spinal fusion for neuromuscular scoliosis). Spread and scale of feasible and efficient solutions to reengineer and expand patient capacities and throughput for operating rooms, postanesthesia recovery areas, and intensive care and floor units are needed. Enhanced analytics that accurately predict postoperative length of hospital stay, coupled with early recovery after surgery clinical protocols, could help optimize hospital bed management. Effective ways to convert hospital rooms from single to double occupancy, to manage family visitation, and to proactively test asymptomatic patients, family, and hospital staff will mitigate continued COVID-19 penetration through children’s hospitals.
One important limitation of the current study is the measurement of hospitals’ charges. The charge data were not positioned to comprehensively measure each hospital’s financial state during the COVID-19 pandemic. However, the decrease in hospital charges reported by the children’s hospitals in the current study is comparable with the financial losses reported for many adult hospitals during the pandemic.6,7
CONCLUSION
Children’s hospitals’ ability to serve the nation’s pediatric patients depends on the success of the hospitals’ plans to manage current and future COVID-19 surges and to reopen and recover from the surges that have passed. Additional investigation is needed to identify best operational and financial practices among children’s hospitals that have enabled them to endure the COVID-19 pandemic.
1. COVID-19: ways to prepare your children’s hospital now. Children’s Hospital Association. March 12, 2020. Accessed June 30, 2020. https://www.childrenshospitals.org/Newsroom/Childrens-Hospitals-Today/Articles/2020/03/COVID-19-11-Ways-to-Prepare-Your-Hospital-Now
2. Chopra V, Toner E, Waldhorn R, Washer L. How should U.S. hospitals prepare for coronavirus disease 2019 (COVID-19)? Ann Intern Med. 2020;172(9):621-622. https://doi.org/10.7326/m20-0907
3. Oseran AS, Nash D, Kim C, et al. Changes in hospital admissions for urgent conditions during COVID-19 pandemic. Am J Manag Care. 2020;26(8):327-328. https://doi.org/10.37765/ajmc.2020.43837
4. Coronavirus Aid, Relief, and Economic Security Act or the CARES Act. 15 USC Chapter 116 (2020). Pub L No. 116-36, 134 Stat 281. https://www.congress.gov/bill/116th-congress/house-bill/748
5. The Coronavirus Aid, Relief, and Economic Security (CARES) Act Provider Relief Fund: general information. US Department of Health & Human Services. June 25, 2020. Accessed June 30, 2020. https://www.hhs.gov/coronavirus/cares-act-provider-relief-fund/general-information/index.html
6. Hospitals and health systems face unprecedented financial pressures due to COVID-19. American Hospital Association. May 2020. Accessed July 13, 2020. https://www.aha.org/system/files/media/file/2020/05/aha-covid19-financial-impact-0520-FINAL.pdf
7. Birkmeyer J, Barnato A, Birkmeyer N, Bessler R, Skinner J. The impact of the COVID-19 pandemic on hospital admissions in the United States. Health Aff (Millwood). 2020;39(11):2010-2017. https://doi.org/10.1377/hlthaff.2020.00980
To benefit patients and the public health of their communities, children’s hospitals across the United States prepared for and responded to COVID-19 by conserving personal protective equipment, suspending noncritical in-person healthcare encounters (including outpatient visits and elective surgeries), and implementing socially distanced essential care.1,2 These measures were promptly instituted during a time of both substantial uncertainty about the pandemic’s behavior in children—including its severity and duration—and extreme variation in local and state governments’ responses to the pandemic.
Congruent with other healthcare institutions, children’s hospitals calibrated their clinical operations to the evolving nature of the pandemic, prioritizing the safety of patients and staff while striving to maintain financial viability in the setting of increased costs and decreased revenue. In some cases, children’s hospitals aided adult hospitals and health systems by admitting young and middle-aged adult patients and by centralizing all pediatric patients requiring intensive care within a region. These efforts occurred while many children’s hospitals remained the sole source of specialized pediatric care, including care for rare complex health problems.
As the COVID-19 pandemic continues, there is a critical need to assess how the initial phase of the pandemic affected healthcare encounters and related finances in children’s hospitals. Understanding these trends will position children’s hospitals to project and prepare for subsequent COVID-19 surges, as well as future related public health crises that necessitate widespread social distancing. Therefore, we compared year-over-year trends in healthcare encounters and hospital charges across US children’s hospitals before and during the COVID-19 pandemic, focusing on the beginning of COVID-19 in the United States, which was defined as February through June 2020.
METHODS
This is a retrospective analysis of 26 children’s hospitals (22 freestanding, 4 nonfreestanding) from all US regions (12 South, 7 Midwest, 5 West, 2 Northeast) contributing encounter and financial data to the PROSPECT database (Children’s Hospital Association, Lenexa, Kansas) from February 1 to June 30 in both 2019 (before COVID-19) and 2020 (during COVID-19). In response to COVID-19, hospitals participating in PROSPECT increased the efficiency of data centralization and reporting in 2020 during the period February 1 to June 30 to expedite analysis and dissemination of findings.
The main outcome measures were the percentage of change in weekly encounters (inpatient bed-days, emergency department [ED] visits, and surgeries) and inflation-adjusted charges (categorized as inpatient care and outpatient care, such as ambulatory surgery, clinics, and ED visits) before vs during COVID-19.
RESULTS
Charges that accrued from February 1 to June 30 were lower in 2020 by a median 23.6% (IQR, –28.7% to –19.1%) per children’s hospital than they were in 2019, corresponding to a median decrease of $276.3 million (IQR, $404.0-$126.0 million) in charges per hospital (Table). Forty percent of this decrease was attributable to decreased charges resulting from fewer inpatient healthcare encounters.
DISCUSSION
These findings beg the question of how well children’s hospitals are positioned to weather a recurrent surge in COVID-19. Because the severity of illness of COVID-19 has been lower to date in the pediatric vs adult populations, an increase in COVID-19-related visits to EDs and admissions to offset the decreased resource use of other pediatric healthcare problems is not anticipated. Existing hospital financial reserves as well as federal aid from the Coronavirus Aid, Relief, and Economic Security Act that helped mitigate the initial encounter and financial losses during the beginning of COVID-19 may not be readily available over time.4,5 Certainly, the findings from the current study support continued lobbying for additional state and federal funds allocated through future relief packages to children’s hospitals.
Additional approaches to financial solvency in children’s hospitals during the sustained COVID-19 pandemic include addressing surgical backlogs and sharing best practices for safe and sustained reopening of clinical operations and financial practices across institutions. Although the PROSPECT database does not contain information on the types of surgeries present within this backlog, our experiences suggest that both same-day and inpatient elective surgeries have been affected, especially lengthy procedures (eg, spinal fusion for neuromuscular scoliosis). Spread and scale of feasible and efficient solutions to reengineer and expand patient capacities and throughput for operating rooms, postanesthesia recovery areas, and intensive care and floor units are needed. Enhanced analytics that accurately predict postoperative length of hospital stay, coupled with early recovery after surgery clinical protocols, could help optimize hospital bed management. Effective ways to convert hospital rooms from single to double occupancy, to manage family visitation, and to proactively test asymptomatic patients, family, and hospital staff will mitigate continued COVID-19 penetration through children’s hospitals.
One important limitation of the current study is the measurement of hospitals’ charges. The charge data were not positioned to comprehensively measure each hospital’s financial state during the COVID-19 pandemic. However, the decrease in hospital charges reported by the children’s hospitals in the current study is comparable with the financial losses reported for many adult hospitals during the pandemic.6,7
CONCLUSION
Children’s hospitals’ ability to serve the nation’s pediatric patients depends on the success of the hospitals’ plans to manage current and future COVID-19 surges and to reopen and recover from the surges that have passed. Additional investigation is needed to identify best operational and financial practices among children’s hospitals that have enabled them to endure the COVID-19 pandemic.
1. COVID-19: ways to prepare your children’s hospital now. Children’s Hospital Association. March 12, 2020. Accessed June 30, 2020. https://www.childrenshospitals.org/Newsroom/Childrens-Hospitals-Today/Articles/2020/03/COVID-19-11-Ways-to-Prepare-Your-Hospital-Now
2. Chopra V, Toner E, Waldhorn R, Washer L. How should U.S. hospitals prepare for coronavirus disease 2019 (COVID-19)? Ann Intern Med. 2020;172(9):621-622. https://doi.org/10.7326/m20-0907
3. Oseran AS, Nash D, Kim C, et al. Changes in hospital admissions for urgent conditions during COVID-19 pandemic. Am J Manag Care. 2020;26(8):327-328. https://doi.org/10.37765/ajmc.2020.43837
4. Coronavirus Aid, Relief, and Economic Security Act or the CARES Act. 15 USC Chapter 116 (2020). Pub L No. 116-36, 134 Stat 281. https://www.congress.gov/bill/116th-congress/house-bill/748
5. The Coronavirus Aid, Relief, and Economic Security (CARES) Act Provider Relief Fund: general information. US Department of Health & Human Services. June 25, 2020. Accessed June 30, 2020. https://www.hhs.gov/coronavirus/cares-act-provider-relief-fund/general-information/index.html
6. Hospitals and health systems face unprecedented financial pressures due to COVID-19. American Hospital Association. May 2020. Accessed July 13, 2020. https://www.aha.org/system/files/media/file/2020/05/aha-covid19-financial-impact-0520-FINAL.pdf
7. Birkmeyer J, Barnato A, Birkmeyer N, Bessler R, Skinner J. The impact of the COVID-19 pandemic on hospital admissions in the United States. Health Aff (Millwood). 2020;39(11):2010-2017. https://doi.org/10.1377/hlthaff.2020.00980
© 2021 Society of Hospital Medicine
The COVID-19 Pandemic and Changes in Healthcare Utilization for Pediatric Respiratory and Nonrespiratory Illnesses in the United States
In the United States, respiratory illnesses are the most common cause of emergency department (ED) visits and hospitalizations in children.1 In response to the ongoing COVID-19 pandemic, several public health interventions, including school and business closures, stay-at-home orders, and mask mandates, were implemented to limit transmission of SARS-CoV-2.2,3 Studies have shown that children can contribute to the spread of SARS-CoV-2 infections, especially within households.4-6 Recent data suggest that COVID-19, and the associated public health measures enacted to slow its spread, may have affected the transmission of other respiratory pathogens.7 Similarly, the pandemic has likely affected healthcare utilization for nonrespiratory illnesses through adoption of social distancing recommendations, suspension and delays in nonemergent elective care, avoidance of healthcare settings, and the effect of decreased respiratory disease on exacerbation of chronic illness.8 The objective of this study was to examine associations between the COVID-19 pandemic and healthcare utilization for pediatric respiratory and nonrespiratory illnesses at US pediatric hospitals.
METHODS
Study Design
This is a multicenter, cross-sectional study of encounters at 44 pediatric hospitals that reported data to the Pediatric Health Information System (PHIS) database maintained by the Children’s Hospital Association (Lenexa, Kansas).
Study Population
Children 2 months to 18 years of age discharged from ED or inpatient settings with a nonsurgical diagnosis from January 1 to September 30 over a 4-year period (2017-2020) were included.
Exposure
The primary exposure was the 2020 COVID-19 pandemic time, divided into three periods: pre-COVID-19 (January-February 2020, the period prior to the pandemic in the United States), early COVID-19 (March-April 2020, coinciding with the first reported US pediatric case of COVID-19 on March 2, 2020), and COVID-19 (May-September 2020, marked by the implementation of at least two of the following containment measures in every US state: stay-at-home/shelter orders, school closures, nonessential business closures, restaurant closures, or prohibition of gatherings of more than 10 people).2
Outcomes
Statistical Analysis
Categorical variables were summarized using frequencies and percentages and compared using chi-square tests. Continuous variables were summarized as median and interquartile range (IQR) and compared using Wilcoxon rank sum tests. Weekly observed-to-expected (O:E) ratios were calculated for each hospital by dividing the number of observed respiratory illness and nonrespiratory illness encounters in a given week in 2020 (observed) by the average number of encounters for that same week during 2017-2019 (expected). O:E ratios were then aggregated over the three COVID-19 study periods, and 95% confidence intervals were established around mean O:E ratios across individual hospitals. Outcomes were then stratified by respiratory illness subgroups, geographic region, and age. Additional details can be found in the Supplemental Methods in the Appendix.
RESULTS
Study Population
A total of 9,051,980 encounters were included in the study, 6,811,799 with nonrespiratory illnesses and 2,240,181 with respiratory illnesses. Median age was 5 years (IQR, 1-11 years), and 52.7% of the population was male (Appendix Table 2 and Appendix Table 3).
Respiratory vs Nonrespiratory Illness During the COVID-19 Pandemic
Over the study period, fewer respiratory and nonrespiratory illness encounters were observed than expected, with a larger decrease in respiratory illness encounters (Table, Appendix Table 4). 

Respiratory Subgroup Analyses
The O:E ratio decreased for all respiratory subgroups over the study period (Table, Appendix Table 4). There were significant differences in specific respiratory subgroups, including asthma, bronchiolitis, croup, influenza, and pneumonia (Appendix Figure 1A). Temporal trends in respiratory encounters were consistent across hospital settings, ages, and geographic regions (Appendix Figure 1B-D). When comparing the with and without COVID-19 subgroups in the “other respiratory illnesses” cohort, other respiratory illness without COVID-19 decreased and remained lower than expected over the rest of the study period, while other respiratory illness with COVID-19 increased markedly during the summer months and declined thereafter (Appendix Figure 2).
All age groups had reductions in respiratory illness encounters during the early COVID-19 and COVID-19 periods, although the decline was less pronounced in the 12- to 17-year-old group (Appendix Figure 1B). Similarly, while all age groups experienced increases in encounters for respiratory illnesses during the summer months, only children in the 12- to 17-year-old group experienced increases beyond pre-COVID-19 levels. Importantly, this increase in respiratory encounters was largely driven by COVID-19 diagnoses (Appendix Figure 3). The trend in nonrespiratory illness encounters stratified by age is shown in Appendix Figure 4.
When patients were stratified by hospital setting, there were no differences between those hospitalized and those discharged from the ED (Appendix Figure 1C). Patterns in respiratory illnesses by geographic location were qualitatively similar until the beginning of the summer 2020, after which geographical variation became more evident (Appendix Figure 1D).
DISCUSSION
In this large, multicenter study evaluating ED visits and hospitalizations for respiratory and nonrespiratory illnesses at US pediatric hospitals during the 2020 COVID-19 pandemic, we found a significant and substantial decrease in healthcare encounters for respiratory illnesses. A rapid and marked decline in encounters for respiratory illness in a relatively short period of time (March 12-April 2) was observed across all hospitals and US regions. Declines were consistent across common respiratory illnesses. More modest, yet still substantial, declines were also observed for nonrespiratory illnesses.
There are likely multiple underlying reasons for the observed reductions. Social distancing measures almost certainly played an important role in interrupting respiratory infection transmission. Rapid reduction in influenza transmission during the early COVID-19 period has been attributed to social distancing measures,3 and influenza transmission in children decreases with school closures.9 It is also possible that some families delayed seeking care at hospitals due to COVID-19, leading to less frequent encounters but more severe illness. The similar decrease in O:E ratio for ED visits and hospitalizations, however, is inconsistent with this explanation.
We also found relative differences in changes in encounters for respiratory illness by age. Adolescents’ levels of respiratory healthcare use declined less and recovered at a faster rate than those of younger children, returning to pre-COVID-19 levels by the end of the study period. The reason for this age differential is likely multifaceted. Infections, such as bronchiolitis and pneumonia, are more likely to be a source of respiratory illness in younger than in older children. It is also likely that disproportionate relaxation of social distancing measures among adolescents, who are known to have a stronger pattern of social interaction, contributed to the faster rise in respiratory illness–related encounters in this age group.11 Adolescents have been reported to be more susceptible to, and more likely to transmit, SARS-CoV-2 compared to younger age groups.12 More modest, albeit similar, age-based changes were observed in encounters for nonrespiratory illnesses
Emerging evidence suggests that school-age children may play an important role in SARS-CoV-2 transmission in the community.4,14 Our finding that, compared to younger children, adolescents had significantly fewer reductions in respiratory illness encounters is concerning. These findings suggest that community-based efforts to help prevent respiratory illnesses, especially COVID-19, should focus on adolescents, who are most likely to maintain social interactions and transmit respiratory infections in the school setting and their households.
This study is limited by the inclusion of only tertiary care children’s hospitals, which may not be nationally representative, and the inability to assess the precise timing of when specific public health interventions were introduced. Moreover, previous studies suggest that social distancing behaviors may have changed even before formal recommendations were enacted.15 Future studies should investigate the local impact of state- and municipality-specific mandates on the burden of COVID-19 and other respiratory illnesses.
The COVID-19 pandemic was associated with substantial reductions in encounters for respiratory diseases, and also with more modest but still sizable reductions in encounters for nonrespiratory diseases. These reductions varied by age. Encounters among adolescents declined less and returned to previous levels faster compared with those of younger children.
ACKNOWLEDGMENT
This publication is dedicated to the memory of our coauthor, Dr. Michael Bendel-Stenzel. Dr. Bendel-Stenzel was dedicated to bettering the lives of children and advancing our knowledge of pediatrics through his research.
1. Leyenaar JK, Ralston SL, Shieh MS, Pekow PS, Mangione-Smith R, Lindenauer PK. Epidemiology of pediatric hospitalizations at general hospitals and freestanding children’s hospitals in the United States. J Hosp Med. 2016;11(11):743-749. https://doi.org/10.1002/jhm.2624
2. Auger KA, Shah SS, Richardson T, et al. Association between statewide school closure and COVID-19 incidence and mortality in the US. JAMA. 2020;324(9):859-870. https://doi.org/10.1001/jama.2020.14348
3. Wiese AD, Everson J, Grijalva CG. Social distancing measures: evidence of interruption of seasonal influenza activity and early lessons of the SARS-CoV-2 pandemic. Clin Infect Dis. Published online June 20, 2020. https://doi.org/10.1093/cid/ciaa834
4. Grijalva CG, Rolfes MA, Zhu Y, et al. Transmission of SARS-COV-2 infections in households - Tennessee and Wisconsin, April-September 2020. MMWR Morb Mortal Wkly Rep. 2020;69(44):1631-1634. https://doi.org/10.15585/mmwr.mm6944e1
5. Worby CJ, Chaves SS, Wallinga J, Lipsitch M, Finelli L, Goldstein E. On the relative role of different age groups in influenza epidemics. Epidemics. 2015;13:10-16. https://doi.org/10.1016/j.epidem.2015.04.003
6. Zimmerman KO, Akinboyo IC, Brookhart MA, et al. Incidence and secondary transmission of SARS-CoV-2 infections in schools. Pediatrics. Published online January 8, 2021. https://doi.org/10.1542/peds.2020-048090
7. Hatoun J, Correa ET, Donahue SMA, Vernacchio L. Social distancing for COVID-19 and diagnoses of other infectious diseases in children. Pediatrics. 2020;146(4):e2020006460. https://doi.org/10.1542/peds.2020-006460
8. Chaiyachati BH, Agawu A, Zorc JJ, Balamuth F. Trends in pediatric emergency department utilization after institution of coronavirus disease-19 mandatory social distancing. J Pediatr. 2020;226:274-277.e1. https://doi.org/10.1016/j.jpeds.2020.07.048
9. Luca G, Kerckhove KV, Coletti P, et al. The impact of regular school closure on seasonal influenza epidemics: a data-driven spatial transmission model for Belgium. BMC Infect Dis. 2018;18(1):29. https://doi.org/10.1186/s12879-017-2934-3
10. Taquechel K, Diwadkar AR, Sayed S, et al. Pediatric asthma healthcare utilization, viral testing, and air pollution changes during the COVID-19 pandemic. J Allergy Clin Immunol Pract. 2020;8(10):3378-3387.e11. https://doi.org/10.1016/j.jaip.2020.07.057
11. Park YJ, Choe YJ, Park O, et al. Contact tracing during coronavirus disease outbreak, South Korea, 2020. Emerg Infect Dis. 2020;26(10):2465-2468. https://doi.org/10.3201/eid2610.201315
12. Davies NG, Klepac P, Liu Y, et al. Age-dependent effects in the transmission and control of COVID-19 epidemics. Nat Med. 2020;26(8):1205-1211. https://doi.org/10.1038/s41591-020-0962-9
13. Hill RM, Rufino K, Kurian S, Saxena J, Saxena K, Williams L. Suicide ideation and attempts in a pediatric emergency department before and during COVID-19. Pediatrics. Published online December 16, 2020. https://doi.org/10.1542/peds.2020-029280
14. Flasche S, Edmunds WJ. The role of schools and school-aged children in SARS-CoV-2 transmission. Lancet Infect Dis. Published online December 8, 2020. https://doi.org/10.1016/S1473-3099(20)30927-0
15. Sehra ST, George M, Wiebe DJ, Fundin S, Baker JF. Cell phone activity in categories of places and associations with growth in cases of COVID-19 in the US. JAMA Intern Med. Published online August 31, 2020. https://doi.org/10.1001/jamainternmed.2020.4288
In the United States, respiratory illnesses are the most common cause of emergency department (ED) visits and hospitalizations in children.1 In response to the ongoing COVID-19 pandemic, several public health interventions, including school and business closures, stay-at-home orders, and mask mandates, were implemented to limit transmission of SARS-CoV-2.2,3 Studies have shown that children can contribute to the spread of SARS-CoV-2 infections, especially within households.4-6 Recent data suggest that COVID-19, and the associated public health measures enacted to slow its spread, may have affected the transmission of other respiratory pathogens.7 Similarly, the pandemic has likely affected healthcare utilization for nonrespiratory illnesses through adoption of social distancing recommendations, suspension and delays in nonemergent elective care, avoidance of healthcare settings, and the effect of decreased respiratory disease on exacerbation of chronic illness.8 The objective of this study was to examine associations between the COVID-19 pandemic and healthcare utilization for pediatric respiratory and nonrespiratory illnesses at US pediatric hospitals.
METHODS
Study Design
This is a multicenter, cross-sectional study of encounters at 44 pediatric hospitals that reported data to the Pediatric Health Information System (PHIS) database maintained by the Children’s Hospital Association (Lenexa, Kansas).
Study Population
Children 2 months to 18 years of age discharged from ED or inpatient settings with a nonsurgical diagnosis from January 1 to September 30 over a 4-year period (2017-2020) were included.
Exposure
The primary exposure was the 2020 COVID-19 pandemic time, divided into three periods: pre-COVID-19 (January-February 2020, the period prior to the pandemic in the United States), early COVID-19 (March-April 2020, coinciding with the first reported US pediatric case of COVID-19 on March 2, 2020), and COVID-19 (May-September 2020, marked by the implementation of at least two of the following containment measures in every US state: stay-at-home/shelter orders, school closures, nonessential business closures, restaurant closures, or prohibition of gatherings of more than 10 people).2
Outcomes
Statistical Analysis
Categorical variables were summarized using frequencies and percentages and compared using chi-square tests. Continuous variables were summarized as median and interquartile range (IQR) and compared using Wilcoxon rank sum tests. Weekly observed-to-expected (O:E) ratios were calculated for each hospital by dividing the number of observed respiratory illness and nonrespiratory illness encounters in a given week in 2020 (observed) by the average number of encounters for that same week during 2017-2019 (expected). O:E ratios were then aggregated over the three COVID-19 study periods, and 95% confidence intervals were established around mean O:E ratios across individual hospitals. Outcomes were then stratified by respiratory illness subgroups, geographic region, and age. Additional details can be found in the Supplemental Methods in the Appendix.
RESULTS
Study Population
A total of 9,051,980 encounters were included in the study, 6,811,799 with nonrespiratory illnesses and 2,240,181 with respiratory illnesses. Median age was 5 years (IQR, 1-11 years), and 52.7% of the population was male (Appendix Table 2 and Appendix Table 3).
Respiratory vs Nonrespiratory Illness During the COVID-19 Pandemic
Over the study period, fewer respiratory and nonrespiratory illness encounters were observed than expected, with a larger decrease in respiratory illness encounters (Table, Appendix Table 4).
Respiratory Subgroup Analyses
The O:E ratio decreased for all respiratory subgroups over the study period (Table, Appendix Table 4). There were significant differences in specific respiratory subgroups, including asthma, bronchiolitis, croup, influenza, and pneumonia (Appendix Figure 1A). Temporal trends in respiratory encounters were consistent across hospital settings, ages, and geographic regions (Appendix Figure 1B-D). When comparing the with and without COVID-19 subgroups in the “other respiratory illnesses” cohort, other respiratory illness without COVID-19 decreased and remained lower than expected over the rest of the study period, while other respiratory illness with COVID-19 increased markedly during the summer months and declined thereafter (Appendix Figure 2).
All age groups had reductions in respiratory illness encounters during the early COVID-19 and COVID-19 periods, although the decline was less pronounced in the 12- to 17-year-old group (Appendix Figure 1B). Similarly, while all age groups experienced increases in encounters for respiratory illnesses during the summer months, only children in the 12- to 17-year-old group experienced increases beyond pre-COVID-19 levels. Importantly, this increase in respiratory encounters was largely driven by COVID-19 diagnoses (Appendix Figure 3). The trend in nonrespiratory illness encounters stratified by age is shown in Appendix Figure 4.
When patients were stratified by hospital setting, there were no differences between those hospitalized and those discharged from the ED (Appendix Figure 1C). Patterns in respiratory illnesses by geographic location were qualitatively similar until the beginning of the summer 2020, after which geographical variation became more evident (Appendix Figure 1D).
DISCUSSION
In this large, multicenter study evaluating ED visits and hospitalizations for respiratory and nonrespiratory illnesses at US pediatric hospitals during the 2020 COVID-19 pandemic, we found a significant and substantial decrease in healthcare encounters for respiratory illnesses. A rapid and marked decline in encounters for respiratory illness in a relatively short period of time (March 12-April 2) was observed across all hospitals and US regions. Declines were consistent across common respiratory illnesses. More modest, yet still substantial, declines were also observed for nonrespiratory illnesses.
There are likely multiple underlying reasons for the observed reductions. Social distancing measures almost certainly played an important role in interrupting respiratory infection transmission. Rapid reduction in influenza transmission during the early COVID-19 period has been attributed to social distancing measures,3 and influenza transmission in children decreases with school closures.9 It is also possible that some families delayed seeking care at hospitals due to COVID-19, leading to less frequent encounters but more severe illness. The similar decrease in O:E ratio for ED visits and hospitalizations, however, is inconsistent with this explanation.
We also found relative differences in changes in encounters for respiratory illness by age. Adolescents’ levels of respiratory healthcare use declined less and recovered at a faster rate than those of younger children, returning to pre-COVID-19 levels by the end of the study period. The reason for this age differential is likely multifaceted. Infections, such as bronchiolitis and pneumonia, are more likely to be a source of respiratory illness in younger than in older children. It is also likely that disproportionate relaxation of social distancing measures among adolescents, who are known to have a stronger pattern of social interaction, contributed to the faster rise in respiratory illness–related encounters in this age group.11 Adolescents have been reported to be more susceptible to, and more likely to transmit, SARS-CoV-2 compared to younger age groups.12 More modest, albeit similar, age-based changes were observed in encounters for nonrespiratory illnesses
Emerging evidence suggests that school-age children may play an important role in SARS-CoV-2 transmission in the community.4,14 Our finding that, compared to younger children, adolescents had significantly fewer reductions in respiratory illness encounters is concerning. These findings suggest that community-based efforts to help prevent respiratory illnesses, especially COVID-19, should focus on adolescents, who are most likely to maintain social interactions and transmit respiratory infections in the school setting and their households.
This study is limited by the inclusion of only tertiary care children’s hospitals, which may not be nationally representative, and the inability to assess the precise timing of when specific public health interventions were introduced. Moreover, previous studies suggest that social distancing behaviors may have changed even before formal recommendations were enacted.15 Future studies should investigate the local impact of state- and municipality-specific mandates on the burden of COVID-19 and other respiratory illnesses.
The COVID-19 pandemic was associated with substantial reductions in encounters for respiratory diseases, and also with more modest but still sizable reductions in encounters for nonrespiratory diseases. These reductions varied by age. Encounters among adolescents declined less and returned to previous levels faster compared with those of younger children.
ACKNOWLEDGMENT
This publication is dedicated to the memory of our coauthor, Dr. Michael Bendel-Stenzel. Dr. Bendel-Stenzel was dedicated to bettering the lives of children and advancing our knowledge of pediatrics through his research.
1. Leyenaar JK, Ralston SL, Shieh MS, Pekow PS, Mangione-Smith R, Lindenauer PK. Epidemiology of pediatric hospitalizations at general hospitals and freestanding children’s hospitals in the United States. J Hosp Med. 2016;11(11):743-749. https://doi.org/10.1002/jhm.2624
2. Auger KA, Shah SS, Richardson T, et al. Association between statewide school closure and COVID-19 incidence and mortality in the US. JAMA. 2020;324(9):859-870. https://doi.org/10.1001/jama.2020.14348
3. Wiese AD, Everson J, Grijalva CG. Social distancing measures: evidence of interruption of seasonal influenza activity and early lessons of the SARS-CoV-2 pandemic. Clin Infect Dis. Published online June 20, 2020. https://doi.org/10.1093/cid/ciaa834
4. Grijalva CG, Rolfes MA, Zhu Y, et al. Transmission of SARS-COV-2 infections in households - Tennessee and Wisconsin, April-September 2020. MMWR Morb Mortal Wkly Rep. 2020;69(44):1631-1634. https://doi.org/10.15585/mmwr.mm6944e1
5. Worby CJ, Chaves SS, Wallinga J, Lipsitch M, Finelli L, Goldstein E. On the relative role of different age groups in influenza epidemics. Epidemics. 2015;13:10-16. https://doi.org/10.1016/j.epidem.2015.04.003
6. Zimmerman KO, Akinboyo IC, Brookhart MA, et al. Incidence and secondary transmission of SARS-CoV-2 infections in schools. Pediatrics. Published online January 8, 2021. https://doi.org/10.1542/peds.2020-048090
7. Hatoun J, Correa ET, Donahue SMA, Vernacchio L. Social distancing for COVID-19 and diagnoses of other infectious diseases in children. Pediatrics. 2020;146(4):e2020006460. https://doi.org/10.1542/peds.2020-006460
8. Chaiyachati BH, Agawu A, Zorc JJ, Balamuth F. Trends in pediatric emergency department utilization after institution of coronavirus disease-19 mandatory social distancing. J Pediatr. 2020;226:274-277.e1. https://doi.org/10.1016/j.jpeds.2020.07.048
9. Luca G, Kerckhove KV, Coletti P, et al. The impact of regular school closure on seasonal influenza epidemics: a data-driven spatial transmission model for Belgium. BMC Infect Dis. 2018;18(1):29. https://doi.org/10.1186/s12879-017-2934-3
10. Taquechel K, Diwadkar AR, Sayed S, et al. Pediatric asthma healthcare utilization, viral testing, and air pollution changes during the COVID-19 pandemic. J Allergy Clin Immunol Pract. 2020;8(10):3378-3387.e11. https://doi.org/10.1016/j.jaip.2020.07.057
11. Park YJ, Choe YJ, Park O, et al. Contact tracing during coronavirus disease outbreak, South Korea, 2020. Emerg Infect Dis. 2020;26(10):2465-2468. https://doi.org/10.3201/eid2610.201315
12. Davies NG, Klepac P, Liu Y, et al. Age-dependent effects in the transmission and control of COVID-19 epidemics. Nat Med. 2020;26(8):1205-1211. https://doi.org/10.1038/s41591-020-0962-9
13. Hill RM, Rufino K, Kurian S, Saxena J, Saxena K, Williams L. Suicide ideation and attempts in a pediatric emergency department before and during COVID-19. Pediatrics. Published online December 16, 2020. https://doi.org/10.1542/peds.2020-029280
14. Flasche S, Edmunds WJ. The role of schools and school-aged children in SARS-CoV-2 transmission. Lancet Infect Dis. Published online December 8, 2020. https://doi.org/10.1016/S1473-3099(20)30927-0
15. Sehra ST, George M, Wiebe DJ, Fundin S, Baker JF. Cell phone activity in categories of places and associations with growth in cases of COVID-19 in the US. JAMA Intern Med. Published online August 31, 2020. https://doi.org/10.1001/jamainternmed.2020.4288
© 2021 Society of Hospital Medicine
Febrile Infant Diagnosis Code Accuracy
Fever is one of the most common reasons for emergency department (ED) evaluation of infants under 90 days of age.[1] Up to 10% to 20% of febrile young infants will have a serious bacterial infection (SBI),[2, 3, 4] but infants with SBI are difficult to distinguish from those without SBI based upon symptoms and physical examination findings alone.[5] Previously developed clinical prediction algorithms can help to identify febrile infants at low risk for SBI, but differ in age range as well as recommendations for testing and empiric treatment.[6, 7, 8] Consequently, there is widespread variation in management of febrile young infants at US children's hospitals,[9, 10, 11] and defining optimal management strategies remains an important issue in pediatric healthcare.[12] Administrative datasets are convenient and inexpensive, and can be used to evaluate practice variation, trends, and outcomes of a large, diverse group of patients within and across institutions.[9, 10] Accurately identifying febrile infants evaluated for suspected SBI in administrative databases would facilitate comparative effectiveness research, quality improvement initiatives, and institutional benchmarking.
Prior studies have validated the accuracy of administrative billing codes for identification of other common childhood illnesses, including urinary tract infection (UTI)[13] and pneumonia.[14] The accuracy of International Classification of Diseases, Ninth Revision (ICD‐9) diagnosis codes in identifying febrile young infants evaluated for SBI is not known. Reliance on administrative ICD‐9 diagnosis codes for patient identification can lead to misclassification of patients due to variable database quality, the validity of the diagnosis codes being utilized, and hospital coding practices.[15] Additionally, fever is a symptom and not a specific diagnosis. If a particular bacterial or viral diagnosis is established (eg, enterovirus meningitis), a discharge diagnosis of fever may not be attributed to the patient encounter. Thus, evaluating the performance characteristics and capture of clinical outcomes of different combinations of ICD‐9 diagnosis codes for identifying febrile infants is necessary for both the conduct and interpretation of studies that utilize administrative databases. The primary objective of this investigation was to identify the most accurate ICD‐9 coding strategies for the identification of febrile infants aged <90 days using administrative data. We also sought to evaluate capture of clinically important outcomes across identification strategies.
METHODS
Study Design and Setting
For this multicenter retrospective study, we used the Pediatric Health Information System (PHIS) database to identify infants <90 days of age[16] who presented between July 1, 2012 and June 30, 2013 to 1 of 8 EDs. We assessed performance characteristics of ICD‐9 diagnosis code case‐identification algorithms by comparing ICD‐9 code combinations to a fever reference standard determined by medical record review. The institutional review board at each participating site approved the study protocol.
Data Source
Data were obtained from 2 sources: the PHIS database and medical record review. We used the PHIS database to identify eligible patients by ICD‐9 diagnosis codes; patient encounters were randomly selected using a random number generator. The PHIS database contains demographic, diagnosis, and billing data from 44 hospitals affiliated with the Children's Hospital Association (Overland Park, Kansas) and represents 85% of freestanding children's hospitals in the United States.[17] Data are deidentified; encrypted unique patient identifiers permit tracking of patients across visits within a site.[18] The Children's Hospital Association and participating hospitals jointly assure the quality and integrity of the data.[19]
For each patient encounter identified in the PHIS database, detailed medical record review was performed by trained investigators at each of the 8 study sites (see Supporting Information, Appendix, in the online version of this article). A standardized data collection instrument was pilot tested by all investigators prior to use. Data were collected and managed using the Research Electronic Data Capture (REDCap) tool hosted at Boston Children's Hospital.[20]
Exclusions
Using PHIS data, prior to medical record review we excluded infants with a complex chronic condition as defined previously[21] and those transferred from another institution, as these infants may warrant a nonstandard evaluation and/or may have incomplete data.
ICD‐9 Diagnosis Code Groups
In the PHIS database, all patients discharged from the hospital (including hospitalized patients as well as patients discharged from the ED) receive 1 or more ICD‐9 discharge diagnosis codes. These diagnosis codes are ascribed after discharge from the hospital, or for ED patients, after ED discharge. Additionally, patients may receive an admission diagnosis, which reflects the diagnosis ascribed at the time of ED discharge or transfer to the inpatient unit.
We reviewed medical records of infants selected from the following ICD‐9 diagnosis code groups (Figure 1): (1) discharge diagnosis code of fever (780.6 [fever and other physiologic disturbances of temperature regulation], 778.4 [other disturbances of temperature regulation of newborn], 780.60 [fever, unspecified], or 780.61 [fever presenting with conditions classified elsewhere])[9, 10] regardless of the presence of admission diagnosis of fever or diagnosis of serious infection, (2) admission diagnosis code of fever without associated discharge diagnosis code of fever,[10] (3) discharge diagnosis code of serious infection determined a priori (see Supporting Information, Appendix, in the online version of this article) without discharge or admission diagnosis code of fever, and (4) infants without any diagnosis code of fever or serious infection.

Medical records reviewed in each of the 4 ICD‐9 diagnosis code groups were randomly selected from the overall set of ED encounters in the population of infants <90 days of age evaluated during the study period. Twenty‐five percent population sampling was used for 3 of the ICD‐9 diagnosis code groups, whereas 5% sampling was used for the no fever/no serious infection code group. The number of medical records reviewed in each ICD‐9 diagnosis code group was proportional to the distribution of ICD‐9 codes across the entire population of infants <90 days of age. These records were distributed equally across sites (228 records per site), except for 1 site that does not assign admission diagnoses (201 records).
Investigators were blinded to ICD‐9 diagnosis code groups during medical record review. Infants with multiple visits during the study period were eligible to be included more than once if the visits occurred more than 3 days apart. For infants with more than 1 ED visit on a particular calendar day, investigators were instructed to review the initial visit.
For each encounter, we also abstracted demographic characteristics (gender, race/ethnicity), insurance status, hospital region (using US Census categories[22]), and season from the PHIS database.
Reference Standard
The presence of fever was determined by medical record review. We defined fever as any documented temperature 100.4F (38.0C) at home or in the ED.[16]
ICD‐9 Code Case‐Identification Algorithms
Using the aforementioned ICD‐9 diagnosis code groups individually and in combination, the following 4 case‐identification algorithms, determined from prior study or group consensus, were compared to the reference standard: (1) ICD‐9 discharge diagnosis code of fever,[9] (2) ICD‐9 admission or discharge diagnosis code of fever,[10, 11] (3) ICD‐9 discharge diagnosis code of fever or serious infection, and (4) ICD‐9 discharge or admission diagnosis code of fever or serious infection. Algorithms were compared overall, separately for discharged and hospitalized infants, and across 3 distinct age groups (28 days, 2956 days, and 5789 days).
Patient‐Level Outcomes
To compare differences in outcomes by case‐identification algorithm, from the PHIS database we abstracted hospitalization rates, rates of UTI/pyelonephritis,[13] bacteremia/sepsis, and bacterial meningitis.[19] Severe outcomes were defined as intensive care unit admission, mechanical ventilation, central line placement, receipt of extracorporeal membrane oxygenation, or death. We assessed hospital length of stay for admitted infants and 3‐day revisits,[23, 24] and revisits resulting in hospitalization for infants discharged from the ED at the index visit. Patients billed for observation care were classified as being hospitalized.[25, 26]
Data Analysis
Accuracy of the 4 case‐identification algorithms (compared with the reference standard) was calculated using sensitivity, specificity, negative predictive value (NPV), and positive predictive value (PPV), along with 95% confidence interval (CI). Prior to analysis, a 5‐fold weighting factor was applied to the no fever/no serious infection group to account for the differential sampling used for this group (5% vs 25% for the other 3 ICD‐9 diagnosis code groups). This weighting was done to approximate the true prevalence of each ICD‐9 code group within the larger population, so that an accurate rate of false negatives (infants with fever who had neither a diagnosis of fever nor serious infection) could be calculated.
We described continuous variables using median and interquartile range or range values and categorical variables using frequencies with 95% CIs. We compared categorical variables using a 2 test. We determined statistical significance as a 2‐tailed P value <0.05. Statistical analyses were performed using SAS version 9.3 (SAS Institute, Cary, NC).
RESULTS
Study Patients
During the 1‐year study period, 23,753 ED encounters for infants <90 days of age were identified in the PHIS database at the 8 participating sites. Of these infant encounters, 2166 (9.2%) were excluded (1658 infants who had a complex chronic condition and 508 transferred into the ED), leaving 21,587 infants available for selection. After applying our sampling strategy, we identified 1797 encounters for medical record review. Seven encounters from 3 hospitals with missing medical records were excluded, resulting in a final cohort of 1790 encounters (Figure 1). Among included infants, 552 (30.8%) were 28 days, 743 (41.5%) were 29 to 56 days, and 495 (27.8%) were 57 to 89 days of age; 737 (41.2%) infants were hospitalized. Patients differed in age, race, payer, and season across ICD‐9 diagnosis code groups (see Supporting Information, Table 1, in the online version of this article).
| ICD‐9 Diagnosis Code Algorithm | Overall | |||
|---|---|---|---|---|
| Sensitivity, % (95% CI) | Specificity, % (95% CI) | Negative Predictive Value, % (95% CI) | Positive Predictive Value, % (95% CI) | |
| ||||
| Discharge diagnosis of fever | 53.2 (50.056.4) | 98.2 (97.898.6) | 90.8 (90.091.6) | 86.1 (83.388.9) |
| Hospitalized | 47.3 (43.151.5) | 97.7 (96.998.5) | 80.6 (78.682.6) | 90.2 (86.893.6) |
| Discharged from ED | 61.4 (56.666.2) | 98.4 (98.098.8) | 95.4 (94.796.1) | 82.1 (77.786.5) |
| Discharge or admission diagnosis of Fever | 71.1 (68.274.0) | 97.7 (97.398.1) | 94.1 (93.494.8) | 86.9 (84.589.3) |
| Hospitalized | 72.5 (68.876.2) | 97.1 (96.298.0) | 88.8 (87.190.5) | 91.7 (89.194.3) |
| Discharged from ED | 69.2 (64.773.7) | 98.0 (97.598.5) | 96.3 (95.796.9) | 80.8 (76.685.0) |
| Discharge diagnosis of fever or serious infection | 63.7 (60.666.8) | 96.5 (96.097.0) | 92.6 (91.893.4) | 79.6 (76.782.5) |
| Hospitalized | 63.9 (59.967.9) | 92.5 (91.094.0) | 85.1 (83.287.0) | 79.1 (75.382.9) |
| Discharged from ED | 63.4 (58.768.1) | 98.1 (97.698.6) | 95.6 (94.996.3) | 80.2 (75.884.6) |
| Discharge or admission diagnosis of fever or serious infection | 76.6 (73.979.3) | 96.2 (95.696.8) | 95.1 (94.595.7) | 81.0 (78.483.6) |
| Hospitalized | 80.8 (77.584.1) | 92.1 (90.693.6) | 91.5 (89.993.1) | 82.1 (78.985.3) |
| Discharged from ED | 71.0 (66.575.5) | 97.7 (97.298.2) | 96.5 (95.997.1) | 79.4 (75.283.6) |
Among the 1790 patient encounters reviewed, a total of 766 infants (42.8%) met the reference standard definition for fever in the cohort. An additional 47 infants had abnormal temperature reported (documentation of tactile fever, history of fever without a specific temperature described, or hypothermia) but were classified as having no fever by the reference standard.
ICD‐9 Code Case‐Identification Algorithm Performance
Compared with the reference standard, the 4 case‐identification algorithms demonstrated specificity of 96.2% to 98.2% but lower sensitivity overall (Figure 2). Discharge diagnosis of fever alone demonstrated the lowest sensitivity. The algorithm of discharge or admission diagnosis of fever resulted in increased sensitivity and the highest PPV of all 4 algorithms (86.9%, 95% CI: 84.5‐89.3). Addition of serious infection codes to this algorithm resulted in a marginal increase in sensitivity and a similar decrease in PPV (Table 1). When limited to hospitalized infants, specificity was highest for the case‐identification algorithm of discharge diagnosis of fever and similarly high for discharge or admission diagnosis of fever; sensitivity was highest for the algorithm of discharge or admission diagnosis of fever or diagnosis of serious infection. For infants discharged from the ED, algorithm specificity was 97.7% to 98.4%, with lower sensitivity for all 4 algorithms (Table 1). Inclusion of the 47 infants with abnormal temperature as fever did not materially change algorithm performance (data not shown).
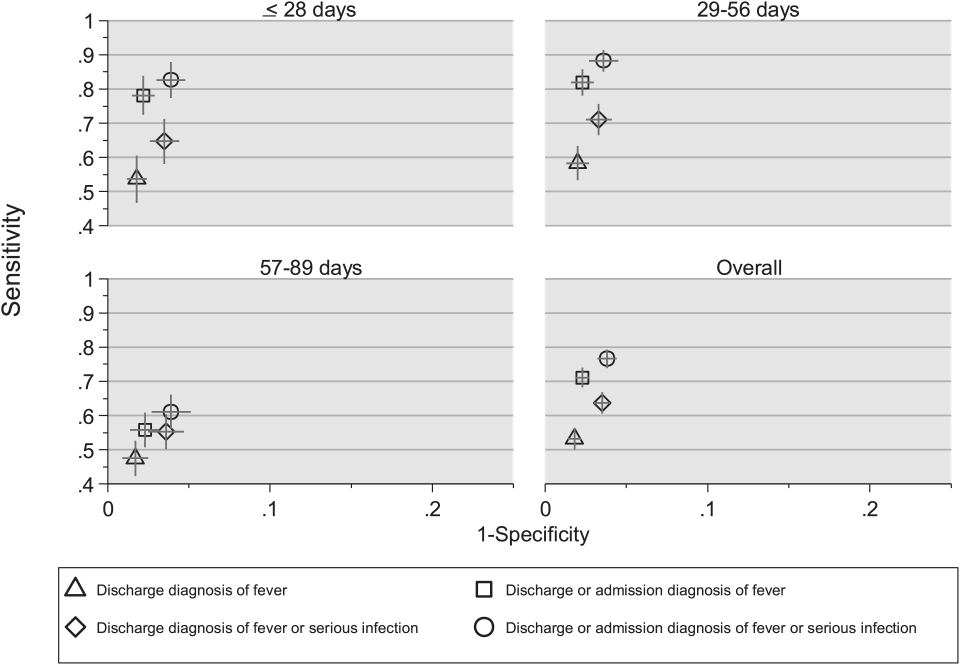
Across all 3 age groups (28 days, 2956 days, and 5789 days), the 4 case‐identification algorithms demonstrated specificity >96%, whereas algorithm sensitivity was highest in the 29‐ to 56‐days‐old age group and lowest among infants 57 to 89 days old across all 4 algorithms (Figure 2). Similar to the overall cohort, an algorithm of discharge or admission diagnosis of fever demonstrated specificity of nearly 98% in all age groups; addition of serious infection codes to this algorithm increased sensitivity, highest in the 29‐ to 56‐days‐old age group (Figure 2; see also Supporting Information, Table 2, in the online version of this article).
| ICD‐9 Diagnosis Code Algorithm | Sensitivity, Median % (Range) | Specificity, Median % (Range) | Negative Predictive Value, Median % (Range) | Positive Predictive Value, Median % (Range) |
|---|---|---|---|---|
| ||||
| Discharge diagnosis of fever | 56.2 (34.681.0) | 98.3 (96.499.1) | 92.1 (83.297.4) | 87.7 (74.093.2) |
| Discharge or Admission diagnosis of Fever | 76.7 (51.385.0) | 97.8 (96.298.7) | 95.6 (86.997.4) | 87.4 (80.092.9) |
| Discharge diagnosis of fever or serious infection | 68.3 (44.287.3) | 96.5 (95.498.0) | 93.6 (85.298.2) | 78.3 (74.289.0) |
| Discharge or admission diagnosis of fever or serious infection | 83.1 (58.390.7) | 95.8 (95.498.0) | 96.5 (88.598.2) | 79.1 (77.490.4) |
Across the 8 study sites, median specificity was 95.8% to 98.3% for the 4 algorithms, with little interhospital variability; however, algorithm sensitivity varied widely by site. Median PPV was highest for discharge diagnosis of fever alone at 87.7% but ranged from 74.0% to 93.2% across sites. Median PPV for an algorithm of discharge or admission diagnosis of fever was similar (87.4%) but with less variation by site (range 80.0%92.9%) (Table 2).
Outcomes by ICD‐9 Diagnosis Code Group and Case‐Identification Algorithm
When compared with discharge diagnosis of fever, adding admission diagnosis of fever captured a higher proportion of hospitalized infants with SBIs (UTI/pyelonephritis, bacteremia/sepsis, or bacterial meningitis). However, median hospital length of stay, severe outcomes, and 3‐day revisits and revisits with hospitalization did not materially differ when including infants with admission diagnosis of fever in addition to discharge diagnosis of fever. Addition of infants with a diagnosis code for serious infection substantially increased the number of infants with SBIs and severe outcomes but did not capture additional 3‐day revisits (Table 3). There were no additional cases of SBI in the no fever/no serious illness diagnosis code group.
| ICD‐9 Diagnosis Code Algorithm | Outcome | 3‐Day Revisit, % (95% CI) | 3‐Day Revisit With Hospitalization, % (95% CI) | |||
|---|---|---|---|---|---|---|
| Hospitalized, % (95% CI) | UTI/Pyelonephritis, Bacteremia/Sepsis, or Bacterial Meningitis, % (95% CI) | Severe Outcome, % (95% CI)* | Length of Stay in Days, Median (IQR) | |||
| ||||||
| Discharge diagnosis of fever | 44.3 (40.348.4) | 3.3 (1.84.7) | 1.4 (0.42.3) | 3 (23) | 11.7 (8.215.2) | 5.9 (3.38.4) |
| Discharge or admission diagnosis of fever | 52.4 (48.955.9) | 6.1 (4.47.8) | 1.9 (1.02.9) | 3 (23) | 10.9 (7.714.1) | 5.4 (3.17.8) |
| Discharge diagnosis of fever or serious infection | 54.0 (50.457.5) | 15.3 (12.717.8) | 3.8 (2.55.2) | 3 (24) | 11.0 (7.714.2) | 5.5 (3.17.9) |
| Discharge or admission diagnosis of fever or serious infection | 56.5 (53.259.7) | 12.9 (10.715.1) | 3.6 (2.44.8) | 3 (24) | 10.3 (7.313.3) | 5.2 (3.07.4) |
Among infants who met the reference standard for fever but did not have a discharge or admission diagnosis of fever (false negatives), 11.8% had a diagnosis of SBI. Overall, 43.2% of febrile infants (and 84.4% of hospitalized infants) with SBI did not have an ICD‐9 discharge or admission diagnosis of fever. Addition of ICD‐9 diagnosis codes of serious infection to the algorithm of discharge or admission diagnosis of fever captured all additional SBIs, and no false negativeinfants missed with this algorithm had an SBI.
DISCUSSION
We described the performance of 4 ICD‐9 diagnosis code case‐identification algorithms for the identification of febrile young infants <90 days of age at US children's hospitals. Although the specificity was high across algorithms and institutions, the sensitivity was relatively low, particularly for discharge diagnosis of fever, and varied by institution. Given the high specificity, ICD‐9 diagnosis code case‐identification algorithms for fever reliably identify febrile infants using administrative data with low rates of inclusion of infants without fever. However, underidentification of patients, particularly those more prone to SBIs and severe outcomes depending on the algorithm utilized, can impact interpretation of comparative effectiveness studies or the quality of care delivered by an institution.
ICD‐9 discharge diagnosis codes are frequently used to identify pediatric patients across a variety of administrative databases, diseases, and symptoms.[19, 27, 28, 29, 30, 31] Although discharge diagnosis of fever is highly specific, sensitivity is substantially lower than other case‐identification algorithms we studied, particularly for hospitalized infants. This may be due to a fever code sometimes being omitted in favor of a more specific diagnosis (eg, bacteremia) prior to hospital discharge. Therefore, case identification relying only on ICD‐9 discharge diagnosis codes for fever may under‐report clinically important SBI or severe outcomes as demonstrated in our study. This is in contrast to ICD‐9 diagnosis code identification strategies for childhood UTI and pneumonia, which largely have higher sensitivity but lower specificity than fever codes.[13, 14]
Admission diagnosis of fever is important for febrile infants as they may not have an explicit diagnosis at the time of disposition from the ED. Addition of admission diagnosis of fever to an algorithm relying on discharge diagnosis code alone increased sensitivity without a demonstrable reduction in specificity and PPV, likely due to capture of infants with a fever diagnosis at presentation before a specific infection was identified. Although using an algorithm of discharge or admission diagnosis of fever captured a higher percentage of hospitalized febrile infants with SBIs, sensitivity was only 71% overall with this algorithm, and 43% of febrile infants with SBI would still have been missed. Importantly, though, addition of various ICD‐9 codes for serious infection to this algorithm resulted in capture of all febrile infants with SBI and should be used as a sensitivity analysis.
The test characteristics of diagnosis codes were highest in the 29‐ to 56‐days‐old age group. Given the differing low‐risk criteria[6, 7, 8] and lack of best practice guidelines[16] in this age group, the use of administrative data may allow for the comparison of testing and treatment strategies across a large cohort of febrile infants aged 29 to 56 days. However, individual hospital coding practices may affect algorithm performance, in particular sensitivity, which varied substantially by hospital. This variation in algorithm sensitivity may impact comparisons of outcomes across institutions. Therefore, when conducting studies of febrile infants using administrative data, sensitivity analyses or use of chart review should be considered to augment the use of ICD‐9 code‐based identification strategies, particularly for comparative benchmarking and outcomes studies. These additional analyses are particularly important for studies of febrile infants >56 days of age, in whom the sensitivity of diagnosis codes is particularly low. We speculate that the lower sensitivity in older febrile infants may relate to a lack of consensus on the clinical significance of fever in this age group and the varying management strategies employed.[10]
Strengths of this study include the assessment of ICD‐9 code algorithms across multiple institutions for identification of fever in young infants, and the patterns of our findings remained robust when comparing median performance characteristics of the algorithms across hospitals to our overall findings. We were also able to accurately estimate PPV and NPV using a case‐identification strategy weighted to the actual population sizes. Although sensitivity and specificity are the primary measures of test performance, predictive values are highly informative for investigators using administrative data. Additionally, our findings may inform public health efforts including disease surveillance, assessment of seasonal variation, and identification and monitoring of healthcare‐associated infections among febrile infants.
Our study has limitations. We did not review all identified records, which raises the possibility that our evaluated cohort may not be representative of the entire febrile infant population. We attempted to mitigate this possibility by using a random sampling strategy for our population selection that was weighted to the actual population sizes. Second, we identified serious infections using ICD‐9 diagnosis codes determined by group consensus, which may not capture all serious infection codes that identify febrile infants whose fever code was omitted. Third, 47 infants had abnormal temperature that did not meet our reference standard criteria for fever and were included in the no fever group. Although there may be disagreement regarding what constitutes a fever, we used a widely accepted reference standard to define fever.[16] Further, inclusion of these 47 infants as fever did not materially change algorithm performance. Last, our study was conducted at 8 large tertiary‐care children's hospitals, and our results may not be generalizable to other children's hospitals and community‐based hospitals.
CONCLUSIONS
Studies of febrile young infants that rely on ICD‐9 discharge diagnosis code of fever for case ascertainment have high specificity but low sensitivity for the identification of febrile infants, particularly among hospitalized patients. A case‐identification strategy that includes discharge or admission diagnosis of fever demonstrated higher sensitivity, and should be considered for studies of febrile infants using administrative data. However, additional strategies such as incorporation of ICD‐9 codes for serious infection should be used when comparing outcomes across institutions.
Acknowledgements
The Febrile Young Infant Research Collaborative includes the following additional collaborators who are acknowledged for their work on this study: Erica DiLeo, MA, Department of Medical Education and Research, Danbury Hospital, Danbury, Connecticut; Janet Flores, BS, Division of Emergency Medicine, Ann and Robert H. Lurie Children's Hospital of Chicago, Chicago, Illinois.
Disclosures: This project funded in part by The Gerber Foundation Novice Researcher Award, (Ref No. 1827‐3835). Dr. Fran Balamuth received career development support from the National Institutes of Health (NHLBI K12‐HL109009). Funders were not involved in the design or conduct of the study; collection, management, analysis, or interpretation of the data; or preparation, review, or approval of the manuscript. The authors have no conflicts of interest relevant to this article to disclose.
- . The prevalence of serious bacterial infections by age in febrile infants during the first 3 months of life. Pediatr Ann. 1993;22:462–466.
- , , . Performance of low‐risk criteria in the evaluation of young infants with fever: review of the literature. Pediatrics. 2010;125:228–233.
- , , , , , . A week‐by‐week analysis of the low‐risk criteria for serious bacterial infection in febrile neonates. Arch Dis Child. 2009;94:287–292.
- , , , et al. Is 15 days an appropriate cut‐off age for considering serious bacterial infection in the management of febrile infants? Pediatr Infect Dis J. 2012;31:455–458.
- , , . Failure of infant observation scales in detecting serious illness in febrile, 4‐ to 8‐week‐old infants. Pediatrics. 1990;85:1040–1043.
- , , . Outpatient management without antibiotics of fever in selected infants. N Engl J Med. 1993;329:1437–1441.
- , , . Identifying febrile infants at risk for a serious bacterial infection. J Pediatr. 1993;123:489–490.
- , , , et al. Febrile infants at low risk for serious bacterial infection—an appraisal of the Rochester criteria and implications for management. Febrile Infant Collaborative Study Group. Pediatrics. 1994;94:390–396.
- , , , et al. Management of febrile neonates in US pediatric emergency departments. Pediatrics. 2014;133:187–195.
- , , , et al. Variation in care of the febrile young infant <90 days in US pediatric emergency departments. Pediatrics. 2014;134:667–677.
- , , , et al. Association of clinical practice guidelines with emergency department management of febrile infants ≤56 days of age. J Hosp Med. 2015;10:358–365.
- , , , et al. Diagnosis and management of febrile infants (0‐3 months). Evid Rep Technol Assess (Full Rep). 2012;(205):1–297.
- , , , et al. Accuracy of administrative billing codes to detect urinary tract infection hospitalizations. Pediatrics. 2011;128:323–330.
- , , , et al. Identifying pediatric community‐acquired pneumonia hospitalizations: accuracy of administrative billing codes. JAMA Pediatr. 2013;167:851–858.
- , , , , , . Development and use of reporting guidelines for assessing the quality of validation studies of health administrative data. J Clin Epidemiol. 2011;64:821–829.
- American College of Emergency Physicians Clinical Policies Committee; American College of Emergency Physicians Clinical Policies Subcommittee on Pediatric Fever. Clinical policy for children younger than three years presenting to the emergency department with fever. Ann Emerg Med. 2003;42:530–545.
- , , , , , . Variation in occult injury screening for children with suspected abuse in selected US children's hospitals. Pediatrics. 2012;130:853–860.
- . Achieving data quality. How data from a pediatric health information system earns the trust of its users. J AHIMA. 2004;75:22–26.
- , , , . Corticosteroids and mortality in children with bacterial meningitis. JAMA. 2008;299:2048–2055.
- , , , , , . Research electronic data capture (REDCap)—a metadata‐driven methodology and workflow process for providing translational research informatics support. J Biomed Inform. 2009;42:377–381.
- , , , , , . Deaths attributed to pediatric complex chronic conditions: national trends and implications for supportive care services. Pediatrics. 2001;107:E99.
- US Census Bureau. Geographic terms and concepts—census divisions and census regions. Available at: https://www.census.gov/geo/reference/gtc/gtc_census_divreg.html. Accessed October 20, 2014.
- , , , . Initial emergency department diagnosis and return visits: risk versus perception. Ann Emerg Med. 1998;32:569–573.
- , , , , . A national depiction of children with return visits to the emergency department within 72 hours, 2001–2007. Pediatr Emerg Care. 2012;28:606–610.
- , , , et al. Pediatric observation status: are we overlooking a growing population in children's hospitals? J Hosp Med. 2012;7:530–536.
- , , , et al. Differences in designations of observation care in US freestanding children's hospitals: are they virtual or real? J Hosp Med. 2012;7:287–293.
- , , , , . Trends in the management of viral meningitis at United States children's hospitals. Pediatrics. 2013;131:670–676.
- , , , et al. Impact of increasing ondansetron use on clinical outcomes in children with gastroenteritis. JAMA Pediatr. 2014;168:321–329.
- , , , , . Race, otitis media, and antibiotic selection. Pediatrics. 2014;134:1059–1066.
- , , , et al. Establishing benchmarks for the hospitalized care of children with asthma, bronchiolitis, and pneumonia. Pediatrics. 2014;134:555–562.
- , , , , . Diagnostic testing and treatment of pediatric headache in the emergency department. J Pediatr. 2013;163:1634–1637.
Fever is one of the most common reasons for emergency department (ED) evaluation of infants under 90 days of age.[1] Up to 10% to 20% of febrile young infants will have a serious bacterial infection (SBI),[2, 3, 4] but infants with SBI are difficult to distinguish from those without SBI based upon symptoms and physical examination findings alone.[5] Previously developed clinical prediction algorithms can help to identify febrile infants at low risk for SBI, but differ in age range as well as recommendations for testing and empiric treatment.[6, 7, 8] Consequently, there is widespread variation in management of febrile young infants at US children's hospitals,[9, 10, 11] and defining optimal management strategies remains an important issue in pediatric healthcare.[12] Administrative datasets are convenient and inexpensive, and can be used to evaluate practice variation, trends, and outcomes of a large, diverse group of patients within and across institutions.[9, 10] Accurately identifying febrile infants evaluated for suspected SBI in administrative databases would facilitate comparative effectiveness research, quality improvement initiatives, and institutional benchmarking.
Prior studies have validated the accuracy of administrative billing codes for identification of other common childhood illnesses, including urinary tract infection (UTI)[13] and pneumonia.[14] The accuracy of International Classification of Diseases, Ninth Revision (ICD‐9) diagnosis codes in identifying febrile young infants evaluated for SBI is not known. Reliance on administrative ICD‐9 diagnosis codes for patient identification can lead to misclassification of patients due to variable database quality, the validity of the diagnosis codes being utilized, and hospital coding practices.[15] Additionally, fever is a symptom and not a specific diagnosis. If a particular bacterial or viral diagnosis is established (eg, enterovirus meningitis), a discharge diagnosis of fever may not be attributed to the patient encounter. Thus, evaluating the performance characteristics and capture of clinical outcomes of different combinations of ICD‐9 diagnosis codes for identifying febrile infants is necessary for both the conduct and interpretation of studies that utilize administrative databases. The primary objective of this investigation was to identify the most accurate ICD‐9 coding strategies for the identification of febrile infants aged <90 days using administrative data. We also sought to evaluate capture of clinically important outcomes across identification strategies.
METHODS
Study Design and Setting
For this multicenter retrospective study, we used the Pediatric Health Information System (PHIS) database to identify infants <90 days of age[16] who presented between July 1, 2012 and June 30, 2013 to 1 of 8 EDs. We assessed performance characteristics of ICD‐9 diagnosis code case‐identification algorithms by comparing ICD‐9 code combinations to a fever reference standard determined by medical record review. The institutional review board at each participating site approved the study protocol.
Data Source
Data were obtained from 2 sources: the PHIS database and medical record review. We used the PHIS database to identify eligible patients by ICD‐9 diagnosis codes; patient encounters were randomly selected using a random number generator. The PHIS database contains demographic, diagnosis, and billing data from 44 hospitals affiliated with the Children's Hospital Association (Overland Park, Kansas) and represents 85% of freestanding children's hospitals in the United States.[17] Data are deidentified; encrypted unique patient identifiers permit tracking of patients across visits within a site.[18] The Children's Hospital Association and participating hospitals jointly assure the quality and integrity of the data.[19]
For each patient encounter identified in the PHIS database, detailed medical record review was performed by trained investigators at each of the 8 study sites (see Supporting Information, Appendix, in the online version of this article). A standardized data collection instrument was pilot tested by all investigators prior to use. Data were collected and managed using the Research Electronic Data Capture (REDCap) tool hosted at Boston Children's Hospital.[20]
Exclusions
Using PHIS data, prior to medical record review we excluded infants with a complex chronic condition as defined previously[21] and those transferred from another institution, as these infants may warrant a nonstandard evaluation and/or may have incomplete data.
ICD‐9 Diagnosis Code Groups
In the PHIS database, all patients discharged from the hospital (including hospitalized patients as well as patients discharged from the ED) receive 1 or more ICD‐9 discharge diagnosis codes. These diagnosis codes are ascribed after discharge from the hospital, or for ED patients, after ED discharge. Additionally, patients may receive an admission diagnosis, which reflects the diagnosis ascribed at the time of ED discharge or transfer to the inpatient unit.
We reviewed medical records of infants selected from the following ICD‐9 diagnosis code groups (Figure 1): (1) discharge diagnosis code of fever (780.6 [fever and other physiologic disturbances of temperature regulation], 778.4 [other disturbances of temperature regulation of newborn], 780.60 [fever, unspecified], or 780.61 [fever presenting with conditions classified elsewhere])[9, 10] regardless of the presence of admission diagnosis of fever or diagnosis of serious infection, (2) admission diagnosis code of fever without associated discharge diagnosis code of fever,[10] (3) discharge diagnosis code of serious infection determined a priori (see Supporting Information, Appendix, in the online version of this article) without discharge or admission diagnosis code of fever, and (4) infants without any diagnosis code of fever or serious infection.
Medical records reviewed in each of the 4 ICD‐9 diagnosis code groups were randomly selected from the overall set of ED encounters in the population of infants <90 days of age evaluated during the study period. Twenty‐five percent population sampling was used for 3 of the ICD‐9 diagnosis code groups, whereas 5% sampling was used for the no fever/no serious infection code group. The number of medical records reviewed in each ICD‐9 diagnosis code group was proportional to the distribution of ICD‐9 codes across the entire population of infants <90 days of age. These records were distributed equally across sites (228 records per site), except for 1 site that does not assign admission diagnoses (201 records).
Investigators were blinded to ICD‐9 diagnosis code groups during medical record review. Infants with multiple visits during the study period were eligible to be included more than once if the visits occurred more than 3 days apart. For infants with more than 1 ED visit on a particular calendar day, investigators were instructed to review the initial visit.
For each encounter, we also abstracted demographic characteristics (gender, race/ethnicity), insurance status, hospital region (using US Census categories[22]), and season from the PHIS database.
Reference Standard
The presence of fever was determined by medical record review. We defined fever as any documented temperature 100.4F (38.0C) at home or in the ED.[16]
ICD‐9 Code Case‐Identification Algorithms
Using the aforementioned ICD‐9 diagnosis code groups individually and in combination, the following 4 case‐identification algorithms, determined from prior study or group consensus, were compared to the reference standard: (1) ICD‐9 discharge diagnosis code of fever,[9] (2) ICD‐9 admission or discharge diagnosis code of fever,[10, 11] (3) ICD‐9 discharge diagnosis code of fever or serious infection, and (4) ICD‐9 discharge or admission diagnosis code of fever or serious infection. Algorithms were compared overall, separately for discharged and hospitalized infants, and across 3 distinct age groups (28 days, 2956 days, and 5789 days).
Patient‐Level Outcomes
To compare differences in outcomes by case‐identification algorithm, from the PHIS database we abstracted hospitalization rates, rates of UTI/pyelonephritis,[13] bacteremia/sepsis, and bacterial meningitis.[19] Severe outcomes were defined as intensive care unit admission, mechanical ventilation, central line placement, receipt of extracorporeal membrane oxygenation, or death. We assessed hospital length of stay for admitted infants and 3‐day revisits,[23, 24] and revisits resulting in hospitalization for infants discharged from the ED at the index visit. Patients billed for observation care were classified as being hospitalized.[25, 26]
Data Analysis
Accuracy of the 4 case‐identification algorithms (compared with the reference standard) was calculated using sensitivity, specificity, negative predictive value (NPV), and positive predictive value (PPV), along with 95% confidence interval (CI). Prior to analysis, a 5‐fold weighting factor was applied to the no fever/no serious infection group to account for the differential sampling used for this group (5% vs 25% for the other 3 ICD‐9 diagnosis code groups). This weighting was done to approximate the true prevalence of each ICD‐9 code group within the larger population, so that an accurate rate of false negatives (infants with fever who had neither a diagnosis of fever nor serious infection) could be calculated.
We described continuous variables using median and interquartile range or range values and categorical variables using frequencies with 95% CIs. We compared categorical variables using a 2 test. We determined statistical significance as a 2‐tailed P value <0.05. Statistical analyses were performed using SAS version 9.3 (SAS Institute, Cary, NC).
RESULTS
Study Patients
During the 1‐year study period, 23,753 ED encounters for infants <90 days of age were identified in the PHIS database at the 8 participating sites. Of these infant encounters, 2166 (9.2%) were excluded (1658 infants who had a complex chronic condition and 508 transferred into the ED), leaving 21,587 infants available for selection. After applying our sampling strategy, we identified 1797 encounters for medical record review. Seven encounters from 3 hospitals with missing medical records were excluded, resulting in a final cohort of 1790 encounters (Figure 1). Among included infants, 552 (30.8%) were 28 days, 743 (41.5%) were 29 to 56 days, and 495 (27.8%) were 57 to 89 days of age; 737 (41.2%) infants were hospitalized. Patients differed in age, race, payer, and season across ICD‐9 diagnosis code groups (see Supporting Information, Table 1, in the online version of this article).
| ICD‐9 Diagnosis Code Algorithm | Overall | |||
|---|---|---|---|---|
| Sensitivity, % (95% CI) | Specificity, % (95% CI) | Negative Predictive Value, % (95% CI) | Positive Predictive Value, % (95% CI) | |
| ||||
| Discharge diagnosis of fever | 53.2 (50.056.4) | 98.2 (97.898.6) | 90.8 (90.091.6) | 86.1 (83.388.9) |
| Hospitalized | 47.3 (43.151.5) | 97.7 (96.998.5) | 80.6 (78.682.6) | 90.2 (86.893.6) |
| Discharged from ED | 61.4 (56.666.2) | 98.4 (98.098.8) | 95.4 (94.796.1) | 82.1 (77.786.5) |
| Discharge or admission diagnosis of Fever | 71.1 (68.274.0) | 97.7 (97.398.1) | 94.1 (93.494.8) | 86.9 (84.589.3) |
| Hospitalized | 72.5 (68.876.2) | 97.1 (96.298.0) | 88.8 (87.190.5) | 91.7 (89.194.3) |
| Discharged from ED | 69.2 (64.773.7) | 98.0 (97.598.5) | 96.3 (95.796.9) | 80.8 (76.685.0) |
| Discharge diagnosis of fever or serious infection | 63.7 (60.666.8) | 96.5 (96.097.0) | 92.6 (91.893.4) | 79.6 (76.782.5) |
| Hospitalized | 63.9 (59.967.9) | 92.5 (91.094.0) | 85.1 (83.287.0) | 79.1 (75.382.9) |
| Discharged from ED | 63.4 (58.768.1) | 98.1 (97.698.6) | 95.6 (94.996.3) | 80.2 (75.884.6) |
| Discharge or admission diagnosis of fever or serious infection | 76.6 (73.979.3) | 96.2 (95.696.8) | 95.1 (94.595.7) | 81.0 (78.483.6) |
| Hospitalized | 80.8 (77.584.1) | 92.1 (90.693.6) | 91.5 (89.993.1) | 82.1 (78.985.3) |
| Discharged from ED | 71.0 (66.575.5) | 97.7 (97.298.2) | 96.5 (95.997.1) | 79.4 (75.283.6) |
Among the 1790 patient encounters reviewed, a total of 766 infants (42.8%) met the reference standard definition for fever in the cohort. An additional 47 infants had abnormal temperature reported (documentation of tactile fever, history of fever without a specific temperature described, or hypothermia) but were classified as having no fever by the reference standard.
ICD‐9 Code Case‐Identification Algorithm Performance
Compared with the reference standard, the 4 case‐identification algorithms demonstrated specificity of 96.2% to 98.2% but lower sensitivity overall (Figure 2). Discharge diagnosis of fever alone demonstrated the lowest sensitivity. The algorithm of discharge or admission diagnosis of fever resulted in increased sensitivity and the highest PPV of all 4 algorithms (86.9%, 95% CI: 84.5‐89.3). Addition of serious infection codes to this algorithm resulted in a marginal increase in sensitivity and a similar decrease in PPV (Table 1). When limited to hospitalized infants, specificity was highest for the case‐identification algorithm of discharge diagnosis of fever and similarly high for discharge or admission diagnosis of fever; sensitivity was highest for the algorithm of discharge or admission diagnosis of fever or diagnosis of serious infection. For infants discharged from the ED, algorithm specificity was 97.7% to 98.4%, with lower sensitivity for all 4 algorithms (Table 1). Inclusion of the 47 infants with abnormal temperature as fever did not materially change algorithm performance (data not shown).
Across all 3 age groups (28 days, 2956 days, and 5789 days), the 4 case‐identification algorithms demonstrated specificity >96%, whereas algorithm sensitivity was highest in the 29‐ to 56‐days‐old age group and lowest among infants 57 to 89 days old across all 4 algorithms (Figure 2). Similar to the overall cohort, an algorithm of discharge or admission diagnosis of fever demonstrated specificity of nearly 98% in all age groups; addition of serious infection codes to this algorithm increased sensitivity, highest in the 29‐ to 56‐days‐old age group (Figure 2; see also Supporting Information, Table 2, in the online version of this article).
| ICD‐9 Diagnosis Code Algorithm | Sensitivity, Median % (Range) | Specificity, Median % (Range) | Negative Predictive Value, Median % (Range) | Positive Predictive Value, Median % (Range) |
|---|---|---|---|---|
| ||||
| Discharge diagnosis of fever | 56.2 (34.681.0) | 98.3 (96.499.1) | 92.1 (83.297.4) | 87.7 (74.093.2) |
| Discharge or Admission diagnosis of Fever | 76.7 (51.385.0) | 97.8 (96.298.7) | 95.6 (86.997.4) | 87.4 (80.092.9) |
| Discharge diagnosis of fever or serious infection | 68.3 (44.287.3) | 96.5 (95.498.0) | 93.6 (85.298.2) | 78.3 (74.289.0) |
| Discharge or admission diagnosis of fever or serious infection | 83.1 (58.390.7) | 95.8 (95.498.0) | 96.5 (88.598.2) | 79.1 (77.490.4) |
Across the 8 study sites, median specificity was 95.8% to 98.3% for the 4 algorithms, with little interhospital variability; however, algorithm sensitivity varied widely by site. Median PPV was highest for discharge diagnosis of fever alone at 87.7% but ranged from 74.0% to 93.2% across sites. Median PPV for an algorithm of discharge or admission diagnosis of fever was similar (87.4%) but with less variation by site (range 80.0%92.9%) (Table 2).
Outcomes by ICD‐9 Diagnosis Code Group and Case‐Identification Algorithm
When compared with discharge diagnosis of fever, adding admission diagnosis of fever captured a higher proportion of hospitalized infants with SBIs (UTI/pyelonephritis, bacteremia/sepsis, or bacterial meningitis). However, median hospital length of stay, severe outcomes, and 3‐day revisits and revisits with hospitalization did not materially differ when including infants with admission diagnosis of fever in addition to discharge diagnosis of fever. Addition of infants with a diagnosis code for serious infection substantially increased the number of infants with SBIs and severe outcomes but did not capture additional 3‐day revisits (Table 3). There were no additional cases of SBI in the no fever/no serious illness diagnosis code group.
| ICD‐9 Diagnosis Code Algorithm | Outcome | 3‐Day Revisit, % (95% CI) | 3‐Day Revisit With Hospitalization, % (95% CI) | |||
|---|---|---|---|---|---|---|
| Hospitalized, % (95% CI) | UTI/Pyelonephritis, Bacteremia/Sepsis, or Bacterial Meningitis, % (95% CI) | Severe Outcome, % (95% CI)* | Length of Stay in Days, Median (IQR) | |||
| ||||||
| Discharge diagnosis of fever | 44.3 (40.348.4) | 3.3 (1.84.7) | 1.4 (0.42.3) | 3 (23) | 11.7 (8.215.2) | 5.9 (3.38.4) |
| Discharge or admission diagnosis of fever | 52.4 (48.955.9) | 6.1 (4.47.8) | 1.9 (1.02.9) | 3 (23) | 10.9 (7.714.1) | 5.4 (3.17.8) |
| Discharge diagnosis of fever or serious infection | 54.0 (50.457.5) | 15.3 (12.717.8) | 3.8 (2.55.2) | 3 (24) | 11.0 (7.714.2) | 5.5 (3.17.9) |
| Discharge or admission diagnosis of fever or serious infection | 56.5 (53.259.7) | 12.9 (10.715.1) | 3.6 (2.44.8) | 3 (24) | 10.3 (7.313.3) | 5.2 (3.07.4) |
Among infants who met the reference standard for fever but did not have a discharge or admission diagnosis of fever (false negatives), 11.8% had a diagnosis of SBI. Overall, 43.2% of febrile infants (and 84.4% of hospitalized infants) with SBI did not have an ICD‐9 discharge or admission diagnosis of fever. Addition of ICD‐9 diagnosis codes of serious infection to the algorithm of discharge or admission diagnosis of fever captured all additional SBIs, and no false negativeinfants missed with this algorithm had an SBI.
DISCUSSION
We described the performance of 4 ICD‐9 diagnosis code case‐identification algorithms for the identification of febrile young infants <90 days of age at US children's hospitals. Although the specificity was high across algorithms and institutions, the sensitivity was relatively low, particularly for discharge diagnosis of fever, and varied by institution. Given the high specificity, ICD‐9 diagnosis code case‐identification algorithms for fever reliably identify febrile infants using administrative data with low rates of inclusion of infants without fever. However, underidentification of patients, particularly those more prone to SBIs and severe outcomes depending on the algorithm utilized, can impact interpretation of comparative effectiveness studies or the quality of care delivered by an institution.
ICD‐9 discharge diagnosis codes are frequently used to identify pediatric patients across a variety of administrative databases, diseases, and symptoms.[19, 27, 28, 29, 30, 31] Although discharge diagnosis of fever is highly specific, sensitivity is substantially lower than other case‐identification algorithms we studied, particularly for hospitalized infants. This may be due to a fever code sometimes being omitted in favor of a more specific diagnosis (eg, bacteremia) prior to hospital discharge. Therefore, case identification relying only on ICD‐9 discharge diagnosis codes for fever may under‐report clinically important SBI or severe outcomes as demonstrated in our study. This is in contrast to ICD‐9 diagnosis code identification strategies for childhood UTI and pneumonia, which largely have higher sensitivity but lower specificity than fever codes.[13, 14]
Admission diagnosis of fever is important for febrile infants as they may not have an explicit diagnosis at the time of disposition from the ED. Addition of admission diagnosis of fever to an algorithm relying on discharge diagnosis code alone increased sensitivity without a demonstrable reduction in specificity and PPV, likely due to capture of infants with a fever diagnosis at presentation before a specific infection was identified. Although using an algorithm of discharge or admission diagnosis of fever captured a higher percentage of hospitalized febrile infants with SBIs, sensitivity was only 71% overall with this algorithm, and 43% of febrile infants with SBI would still have been missed. Importantly, though, addition of various ICD‐9 codes for serious infection to this algorithm resulted in capture of all febrile infants with SBI and should be used as a sensitivity analysis.
The test characteristics of diagnosis codes were highest in the 29‐ to 56‐days‐old age group. Given the differing low‐risk criteria[6, 7, 8] and lack of best practice guidelines[16] in this age group, the use of administrative data may allow for the comparison of testing and treatment strategies across a large cohort of febrile infants aged 29 to 56 days. However, individual hospital coding practices may affect algorithm performance, in particular sensitivity, which varied substantially by hospital. This variation in algorithm sensitivity may impact comparisons of outcomes across institutions. Therefore, when conducting studies of febrile infants using administrative data, sensitivity analyses or use of chart review should be considered to augment the use of ICD‐9 code‐based identification strategies, particularly for comparative benchmarking and outcomes studies. These additional analyses are particularly important for studies of febrile infants >56 days of age, in whom the sensitivity of diagnosis codes is particularly low. We speculate that the lower sensitivity in older febrile infants may relate to a lack of consensus on the clinical significance of fever in this age group and the varying management strategies employed.[10]
Strengths of this study include the assessment of ICD‐9 code algorithms across multiple institutions for identification of fever in young infants, and the patterns of our findings remained robust when comparing median performance characteristics of the algorithms across hospitals to our overall findings. We were also able to accurately estimate PPV and NPV using a case‐identification strategy weighted to the actual population sizes. Although sensitivity and specificity are the primary measures of test performance, predictive values are highly informative for investigators using administrative data. Additionally, our findings may inform public health efforts including disease surveillance, assessment of seasonal variation, and identification and monitoring of healthcare‐associated infections among febrile infants.
Our study has limitations. We did not review all identified records, which raises the possibility that our evaluated cohort may not be representative of the entire febrile infant population. We attempted to mitigate this possibility by using a random sampling strategy for our population selection that was weighted to the actual population sizes. Second, we identified serious infections using ICD‐9 diagnosis codes determined by group consensus, which may not capture all serious infection codes that identify febrile infants whose fever code was omitted. Third, 47 infants had abnormal temperature that did not meet our reference standard criteria for fever and were included in the no fever group. Although there may be disagreement regarding what constitutes a fever, we used a widely accepted reference standard to define fever.[16] Further, inclusion of these 47 infants as fever did not materially change algorithm performance. Last, our study was conducted at 8 large tertiary‐care children's hospitals, and our results may not be generalizable to other children's hospitals and community‐based hospitals.
CONCLUSIONS
Studies of febrile young infants that rely on ICD‐9 discharge diagnosis code of fever for case ascertainment have high specificity but low sensitivity for the identification of febrile infants, particularly among hospitalized patients. A case‐identification strategy that includes discharge or admission diagnosis of fever demonstrated higher sensitivity, and should be considered for studies of febrile infants using administrative data. However, additional strategies such as incorporation of ICD‐9 codes for serious infection should be used when comparing outcomes across institutions.
Acknowledgements
The Febrile Young Infant Research Collaborative includes the following additional collaborators who are acknowledged for their work on this study: Erica DiLeo, MA, Department of Medical Education and Research, Danbury Hospital, Danbury, Connecticut; Janet Flores, BS, Division of Emergency Medicine, Ann and Robert H. Lurie Children's Hospital of Chicago, Chicago, Illinois.
Disclosures: This project funded in part by The Gerber Foundation Novice Researcher Award, (Ref No. 1827‐3835). Dr. Fran Balamuth received career development support from the National Institutes of Health (NHLBI K12‐HL109009). Funders were not involved in the design or conduct of the study; collection, management, analysis, or interpretation of the data; or preparation, review, or approval of the manuscript. The authors have no conflicts of interest relevant to this article to disclose.
- . The prevalence of serious bacterial infections by age in febrile infants during the first 3 months of life. Pediatr Ann. 1993;22:462–466.
- , , . Performance of low‐risk criteria in the evaluation of young infants with fever: review of the literature. Pediatrics. 2010;125:228–233.
- , , , , , . A week‐by‐week analysis of the low‐risk criteria for serious bacterial infection in febrile neonates. Arch Dis Child. 2009;94:287–292.
- , , , et al. Is 15 days an appropriate cut‐off age for considering serious bacterial infection in the management of febrile infants? Pediatr Infect Dis J. 2012;31:455–458.
- , , . Failure of infant observation scales in detecting serious illness in febrile, 4‐ to 8‐week‐old infants. Pediatrics. 1990;85:1040–1043.
- , , . Outpatient management without antibiotics of fever in selected infants. N Engl J Med. 1993;329:1437–1441.
- , , . Identifying febrile infants at risk for a serious bacterial infection. J Pediatr. 1993;123:489–490.
- , , , et al. Febrile infants at low risk for serious bacterial infection—an appraisal of the Rochester criteria and implications for management. Febrile Infant Collaborative Study Group. Pediatrics. 1994;94:390–396.
- , , , et al. Management of febrile neonates in US pediatric emergency departments. Pediatrics. 2014;133:187–195.
- , , , et al. Variation in care of the febrile young infant <90 days in US pediatric emergency departments. Pediatrics. 2014;134:667–677.
- , , , et al. Association of clinical practice guidelines with emergency department management of febrile infants ≤56 days of age. J Hosp Med. 2015;10:358–365.
- , , , et al. Diagnosis and management of febrile infants (0‐3 months). Evid Rep Technol Assess (Full Rep). 2012;(205):1–297.
- , , , et al. Accuracy of administrative billing codes to detect urinary tract infection hospitalizations. Pediatrics. 2011;128:323–330.
- , , , et al. Identifying pediatric community‐acquired pneumonia hospitalizations: accuracy of administrative billing codes. JAMA Pediatr. 2013;167:851–858.
- , , , , , . Development and use of reporting guidelines for assessing the quality of validation studies of health administrative data. J Clin Epidemiol. 2011;64:821–829.
- American College of Emergency Physicians Clinical Policies Committee; American College of Emergency Physicians Clinical Policies Subcommittee on Pediatric Fever. Clinical policy for children younger than three years presenting to the emergency department with fever. Ann Emerg Med. 2003;42:530–545.
- , , , , , . Variation in occult injury screening for children with suspected abuse in selected US children's hospitals. Pediatrics. 2012;130:853–860.
- . Achieving data quality. How data from a pediatric health information system earns the trust of its users. J AHIMA. 2004;75:22–26.
- , , , . Corticosteroids and mortality in children with bacterial meningitis. JAMA. 2008;299:2048–2055.
- , , , , , . Research electronic data capture (REDCap)—a metadata‐driven methodology and workflow process for providing translational research informatics support. J Biomed Inform. 2009;42:377–381.
- , , , , , . Deaths attributed to pediatric complex chronic conditions: national trends and implications for supportive care services. Pediatrics. 2001;107:E99.
- US Census Bureau. Geographic terms and concepts—census divisions and census regions. Available at: https://www.census.gov/geo/reference/gtc/gtc_census_divreg.html. Accessed October 20, 2014.
- , , , . Initial emergency department diagnosis and return visits: risk versus perception. Ann Emerg Med. 1998;32:569–573.
- , , , , . A national depiction of children with return visits to the emergency department within 72 hours, 2001–2007. Pediatr Emerg Care. 2012;28:606–610.
- , , , et al. Pediatric observation status: are we overlooking a growing population in children's hospitals? J Hosp Med. 2012;7:530–536.
- , , , et al. Differences in designations of observation care in US freestanding children's hospitals: are they virtual or real? J Hosp Med. 2012;7:287–293.
- , , , , . Trends in the management of viral meningitis at United States children's hospitals. Pediatrics. 2013;131:670–676.
- , , , et al. Impact of increasing ondansetron use on clinical outcomes in children with gastroenteritis. JAMA Pediatr. 2014;168:321–329.
- , , , , . Race, otitis media, and antibiotic selection. Pediatrics. 2014;134:1059–1066.
- , , , et al. Establishing benchmarks for the hospitalized care of children with asthma, bronchiolitis, and pneumonia. Pediatrics. 2014;134:555–562.
- , , , , . Diagnostic testing and treatment of pediatric headache in the emergency department. J Pediatr. 2013;163:1634–1637.
© 2015 Society of Hospital Medicine
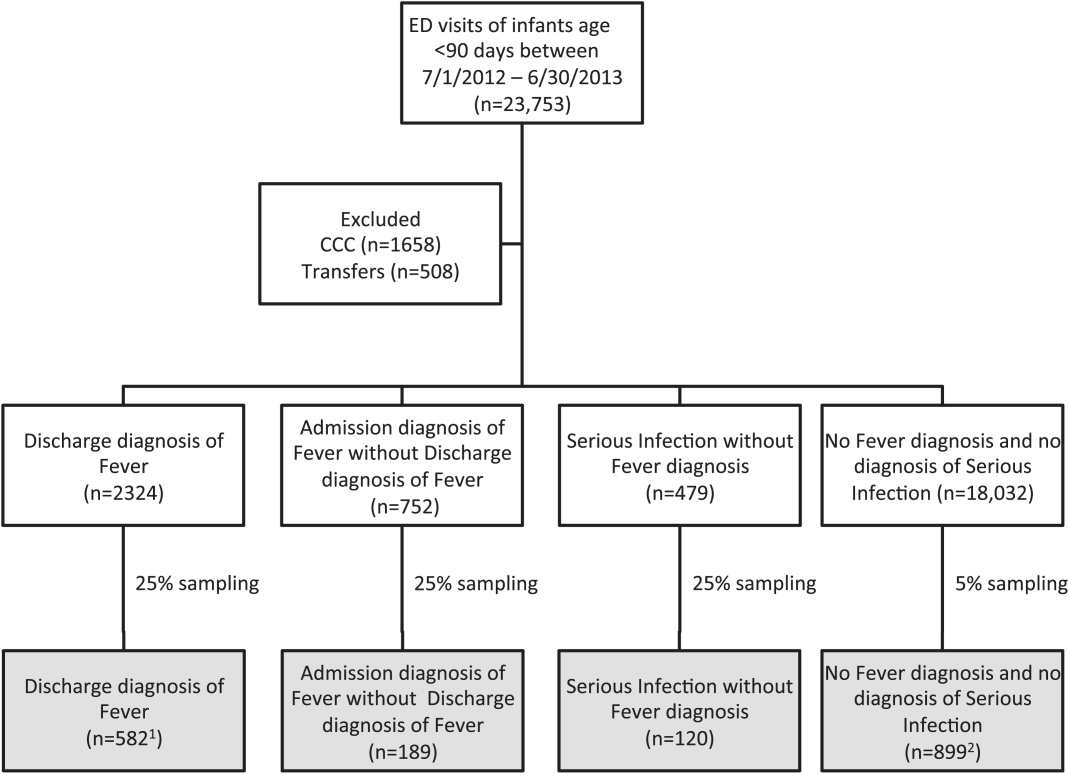
Febrile Infant CPGs
Febrile young infants are at high risk for serious bacterial infection (SBI) with reported rates of 8.5% to 12%, even higher in neonates 28 days of age.[1, 2, 3] As a result, febrile infants often undergo extensive diagnostic evaluation consisting of a combination of urine, blood, and cerebrospinal fluid (CSF) testing.[4, 5, 6] Several clinical prediction algorithms use this diagnostic testing to identify febrile infants at low risk for SBI, but they differ with respect to age range, recommended testing, antibiotic administration, and threshold for hospitalization.[4, 5, 6] Additionally, the optimal management strategy for this population has not been defined.[7] Consequently, laboratory testing, antibiotic use, and hospitalization for febrile young infants vary widely among hospitals.[8, 9, 10]
Clinical practice guidelines (CPGs) are designed to implement evidence‐based care and reduce practice variability, with the goal of improving quality of care and optimizing costs.[11] Implementation of a CPG for management of febrile young infants in the Intermountain Healthcare System was associated with greater adherence to evidence‐based care and lower costs.[12] However, when strong evidence is lacking, different interpretations of febrile infant risk classification incorporated into local CPGs may be a major driver of the across‐hospital practice variation observed in prior studies.[8, 9] Understanding sources of variability as well as determining the association of CPGs with clinicians' practice patterns can help identify quality improvement opportunities, either through national benchmarking or local efforts.
Our primary objectives were to compare (1) recommendations of pediatric emergency departmentbased institutional CPGs for febrile young infants and (2) rates of urine, blood, CSF testing, hospitalization, and ceftriaxone use at emergency department (ED) discharge based upon CPG presence and the specific CPG recommendations. Our secondary objectives were to describe the association of CPGs with healthcare costs and return visits for SBI.
METHODS
Study Design
We used the Pediatric Health Information System (PHIS) to identify febrile infants 56 days of age who presented to the ED between January 1, 2013 and December 31, 2013. We also surveyed ED providers at participating PHIS hospitals. Informed consent was obtained from survey respondents. The institutional review board at Boston Children's Hospital approved the study protocol.
Clinical Practice Guideline Survey
We sent an electronic survey to medical directors or division directors at 37 pediatric EDs to determine whether their ED utilized a CPG for the management of the febrile young infant in 2013. If no response was received after the second attempt, we queried ED fellowship directors or other ED attending physicians at nonresponding hospitals. Survey items included the presence of a febrile young infant CPG, and if present, the year of implementation, ages targeted, and CPG content. As applicable, respondents were asked to share their CPG and/or provide the specific CPG recommendations.
We collected and managed survey data using the Research Electronic Data Capture (REDCap) electronic data capture tools hosted at Boston Children's Hospital. REDCap is a secure, Web‐based application designed to support data capture for research studies.[13]
Data Source
The PHIS database contains administrative data from 44 US children's hospitals. These hospitals, affiliated with the Children's Hospital Association, represent 85% of freestanding US children's hospitals.[14] Encrypted patient identifiers permit tracking of patients across encounters.[15] Data quality and integrity are assured jointly by the Children's Hospital Association and participating hospitals.[16] For this study, 7 hospitals were excluded due to incomplete ED data or known data‐quality issues.[17]
Patients
We identified study infants using the following International Classification of Diseases, 9th Revision (ICD‐9) admission or discharge diagnosis codes for fever as defined previously[8, 9]: 780.6, 778.4, 780.60, or 780.61. We excluded infants with a complex chronic condition[18] and those transferred from another institution, as these infants may warrant a nonstandard evaluation and/or may have incomplete data. For infants with >1 ED visit for fever during the study period, repeat visits within 3 days of an index visit were considered a revisit for the same episode of illness; visits >3 days following an index visit were considered as a new index visit.
Study Definitions
From the PHIS database, we abstracted demographic characteristics (gender, race/ethnicity), insurance status, and region where the hospital was located (using US Census categories[19]). Billing codes were used to assess whether urine, blood, and CSF testing (as defined previously[9]) were performed during the ED evaluation. To account for ED visits that spanned the midnight hour, for hospitalized patients we considered any testing or treatment occurring on the initial or second hospital day to be performed in the ED; billing code data in PHIS are based upon calendar day and do not distinguish testing performed in the ED versus inpatient setting.[8, 9] Patients billed for observation care were classified as being hospitalized.[20, 21]
We identified the presence of an SBI using ICD‐9 diagnosis codes for the following infections as described previously[9]: urinary tract infection or pyelonephritis,[22] bacteremia or sepsis, bacterial meningitis,[16] pneumonia,[23] or bacterial enteritis. To assess return visits for SBI that required inpatient management, we defined an ED revisit for an SBI as a return visit within 3 days of ED discharge[24, 25] that resulted in hospitalization with an associated ICD‐9 discharge diagnosis code for an SBI.
Hospitals charges in PHIS database were adjusted for hospital location by using the Centers for Medicare and Medicaid Services price/wage index. Costs were estimated by applying hospital‐level cost‐to‐charge ratios to charge data.[26]
Measured Exposures
The primary exposure was the presence of an ED‐based CPG for management of the febrile young infant aged 28 days and 29 to 56 days; 56 days was used as the upper age limit as all of the CPGs included infants up to this age or beyond. Six institutions utilized CPGs with different thresholds to define the age categories (eg, dichotomized at 27 or 30 days); these CPGs were classified into the aforementioned age groups to permit comparisons across standardized age groups. We classified institutions based on the presence of a CPG. To assess differences in the application of low‐risk criteria, the CPGs were further classified a priori based upon specific recommendations around laboratory testing and hospitalization, as well as ceftriaxone use for infants aged 29 to 56 days discharged from the ED. CPGs were categorized based upon whether testing, hospitalization, and ceftriaxone use were: (1) recommended for all patients, (2) recommended only if patients were classified as high risk (absence of low‐risk criteria), (3) recommended against, or (4) recommended to consider at clinician discretion.
Outcome Measures
Measured outcomes were performance of urine, blood, CSF testing, and hospitalization rate, as well as rate of ceftriaxone use for discharged infants aged 29 to 56 days, 3‐day revisits for SBI, and costs per visit, which included hospitalization costs for admitted patients.
Data Analysis
We described continuous variables using median and interquartile range or range values and categorical variables using frequencies. We compared medians using Wilcoxon rank sum and categorical variables using a [2] test. We compared rates of testing, hospitalization, ceftriaxone use, and 3‐day revisits for SBI based on the presence of a CPG, and when present, the specific CPG recommendations. Costs per visit were compared between institutions with and without CPGs and assessed separately for admitted and discharged patients. To adjust for potential confounders and clustering of patients within hospitals, we used generalized estimating equations with logistic regression to generate adjusted odd ratios (aORs) and 95% confidence intervals (CIs). Models were adjusted for geographic region, payer, race, and gender. Statistical analyses were performed by using SAS version 9.3 (SAS Institute, Cary, NC). We determined statistical significance as a 2‐tailed P value <0.05.
Febrile infants with bronchiolitis or a history of prematurity may be managed differently from full‐term febrile young infants without bronchiolitis.[6, 27] Therefore, we performed a subgroup analysis after exclusion of infants with an ICD‐9 discharge diagnosis code for bronchiolitis (466.11 and 466.19)[28] or prematurity (765).
Because our study included ED encounters in 2013, we repeated our analyses after exclusion of hospitals with CPGs implemented during the 2013 calendar year.
RESULTS
CPG by Institution
Thirty‐three (89.2%) of the 37 EDs surveyed completed the questionnaire. Overall, 21 (63.6%) of the 33 EDs had a CPG; 15 (45.5%) had a CPG for all infants 56 days of age, 5 (15.2%) had a CPG for infants 28 days only, and 1 (3.0%) had a CPG for infants 29 to 56 days but not 28 days of age (Figure 1). Seventeen EDs had an established CPG prior to 2013, and 4 hospitals implemented a CPG during the 2013 calendar year, 2 with CPGs for neonates 28 days and 2 with CPGs for both 28 days and 29 to 56 days of age. Hospitals with CPGs were more likely to be located in the Northeast and West regions of the United States and provide care to a higher proportion of non‐Hispanic white patients, as well as those with commercial insurance (Table 1).
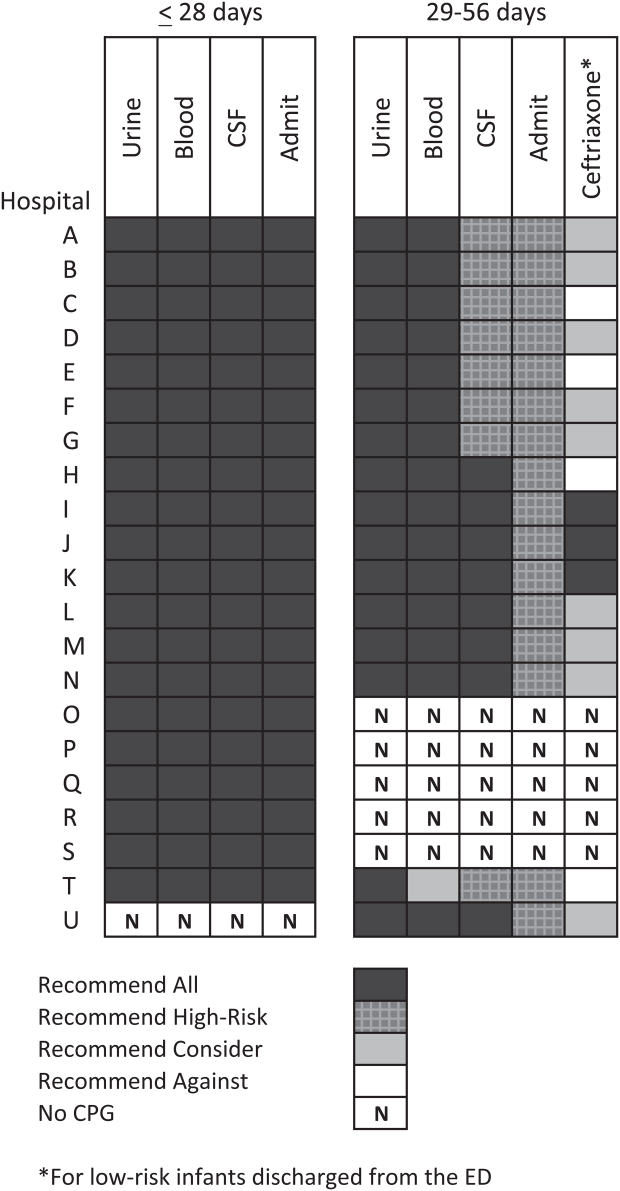
| Characteristic | 28 Days | 2956 Days | ||||
|---|---|---|---|---|---|---|
| No CPG, n=996, N (%) | CPG, n=2,149, N (%) | P Value | No CPG, n=2,460, N (%) | CPG, n=3,772, N (%) | P Value | |
| ||||||
| Race | ||||||
| Non‐Hispanic white | 325 (32.6) | 996 (46.3) | 867 (35.2) | 1,728 (45.8) | ||
| Non‐Hispanic black | 248 (24.9) | 381 (17.7) | 593 (24.1) | 670 (17.8) | ||
| Hispanic | 243 (24.4) | 531 (24.7) | 655 (26.6) | 986 (26.1) | ||
| Asian | 28 (2.8) | 78 (3.6) | 40 (1.6) | 122 (3.2) | ||
| Other Race | 152 (15.3) | 163 (7.6) | <0.001 | 305 (12.4) | 266 (7.1) | <0.001 |
| Gender | ||||||
| Female | 435 (43.7) | 926 (43.1) | 0.76 | 1,067 (43.4) | 1,714 (45.4) | 0.22 |
| Payer | ||||||
| Commercial | 243 (24.4) | 738 (34.3) | 554 (22.5) | 1,202 (31.9) | ||
| Government | 664 (66.7) | 1,269 (59.1) | 1,798 (73.1) | 2,342 (62.1) | ||
| Other payer | 89 (8.9) | 142 (6.6) | <0.001 | 108 (4.4) | 228 (6.0) | <0.001 |
| Region | ||||||
| Northeast | 39 (3.9) | 245 (11.4) | 77 (3.1) | 572 (15.2) | ||
| South | 648 (65.1) | 915 (42.6) | 1,662 (67.6) | 1,462 (38.8) | ||
| Midwest | 271 (27.2) | 462 (21.5) | 506 (20.6) | 851 (22.6) | ||
| West | 38 (3.8) | 527 (24.5) | <0.001 | 215 (8.7) | 887 (23.5) | <0.001 |
| Serious bacterial infection | ||||||
| Overall* | 131 (13.2) | 242 (11.3) | 0.14 | 191 (7.8) | 237 (6.3) | 0.03 |
| UTI/pyelonephritis | 73 (7.3) | 153 (7.1) | 103 (4.2) | 154 (4.1) | ||
| Bacteremia/sepsis | 56 (5.6) | 91 (4.2) | 78 (3.2) | 61 (1.6) | ||
| Bacterial meningitis | 15 (1.5) | 15 (0.7) | 4 (0.2) | 14 (0.4) | ||
| Age, d, median (IQR) | 18 (11, 24) | 18 (11, 23) | 0.67 | 46 (37, 53) | 45 (37, 53) | 0.11 |
All 20 CPGs for the febrile young infant 28 days of age recommended urine, blood, CSF testing, and hospitalization for all infants (Figure 1). Of the 16 hospitals with CPGs for febrile infants aged 29 to 56 days, all recommended urine and blood testing for all patients, except for 1 CPG, which recommended consideration of blood testing but not to obtain routinely. Hospitals varied in recommendations for CSF testing among infants aged 29 to 56 days: 8 (50%) recommended CSF testing in all patients and 8 (50%) recommended CSF testing only if the patient was high risk per defined criteria (based on history, physical examination, urine, and blood testing). In all 16 CPGs, hospitalization was recommended only for high‐risk infants. For low‐risk infants aged 2956 days being discharged from the ED, 3 hospitals recommended ceftriaxone for all, 9 recommended consideration of ceftriaxone, and 4 recommended against antibiotics (Figure 1).
Study Patients
During the study period, there were 10,415 infants 56 days old with a diagnosis of fever at the 33 participating hospitals. After exclusion of 635 (6.1%) infants with a complex chronic condition and 445 (4.3%) transferred from another institution (including 42 with a complex chronic condition), 9377 infants remained in our study cohort. Approximately one‐third of the cohort was 28 days of age and two‐thirds aged 29 to 56 days. The overall SBI rate was 8.5% but varied by age (11.9% in infants 28 days and 6.9% in infants 29 to 56 days of age) (Table 1).
CPGs and Use of Diagnostic Testing, Hospitalization Rates, Ceftriaxone Use, and Revisits for SBI
For infants 28 days of age, the presence of a CPG was not associated with urine, blood, CSF testing, or hospitalization after multivariable adjustment (Table 2). Among infants aged 29 to 56 days, urine testing did not differ based on the presence of a CPG, whereas blood testing was performed less often at the 1 hospital whose CPG recommended to consider, but not routinely obtain, testing (aOR: 0.4, 95% CI: 0.3‐0.7, P=0.001). Compared to hospitals without a CPG, CSF testing was performed less often at hospitals with CPG recommendations to only obtain CSF if high risk (aOR: 0.5, 95% CI: 0.3‐0.8, P=0.002). However, the odds of hospitalization did not differ at institutions with and without a febrile infant CPG (aOR: 0.7, 95% CI: 0.5‐1.1, P=0.10). For infants aged 29 to 56 days discharged from the ED, ceftriaxone was administered more often at hospitals with CPGs that recommended ceftriaxone for all discharged patients (aOR: 4.6, 95% CI: 2.39.3, P<0.001) and less often at hospitals whose CPGs recommended against antibiotics (aOR: 0.3, 95% CI: 0.1‐0.9, P=0.03) (Table 3). Our findings were similar in the subgroup of infants without bronchiolitis or prematurity (see Supporting Tables 1 and 2 in the online version of this article). After exclusion of hospitals with a CPG implemented during the 2013 calendar year (4 hospitals excluded in the 28 days age group and 2 hospitals excluded in the 29 to 56 days age group), infants aged 29 to 56 days cared for at a hospital with a CPG experienced a lower odds of hospitalization (aOR: 0.7, 95% CI: 0.4‐0.98, P=0.04). Otherwise, our findings in both age groups did not materially differ from the main analyses.
| Testing/Hospitalization | No. of Hospitals | No. of Patients | % Received* | aOR (95% CI) | P Value |
|---|---|---|---|---|---|
| |||||
| Laboratory testing | |||||
| Urine testing | |||||
| No CPG | 13 | 996 | 75.6 | Ref | |
| CPG: recommend for all | 20 | 2,149 | 80.7 | 1.2 (0.9‐1.7) | 0.22 |
| Blood testing | |||||
| No CPG | 13 | 996 | 76.9 | Ref | |
| CPG: recommend for all | 20 | 2,149 | 81.8 | 1.2 (0.9‐1.7) | 0.25 |
| CSF testing‖ | |||||
| No CPG | 13 | 996 | 71.0 | Ref | |
| CPG: recommend for all | 20 | 2,149 | 77.5 | 1.3 (1.01.7) | 0.08 |
| Disposition | |||||
| Hospitalization | |||||
| No CPG | 13 | 996 | 75.4 | Ref | |
| CPG: recommend for all | 20 | 2,149 | 81.6 | 1.2 (0.9‐1.8) | 0.26 |
| Testing/Hospitalization | No. of Hospitals | No. of Patients | % Received* | aOR (95% CI) | P Value |
|---|---|---|---|---|---|
| |||||
| Laboratory resting | |||||
| Urine testing | |||||
| No CPG | 17 | 2,460 | 81.1 | Ref | |
| CPG: recommend for all | 16 | 3,772 | 82.1 | 0.9 (0.7‐1.4) | 0.76 |
| Blood testing | |||||
| No CPG | 17 | 2,460 | 79.4 | Ref | |
| CPG: recommend for all | 15 | 3,628 | 82.6 | 1.1 (0.7‐1.6) | 0.70 |
| CPG: recommend consider | 1 | 144 | 62.5 | 0.4 (0.3‐0.7) | 0.001 |
| CSF testing‖ | |||||
| No CPG | 17 | 2,460 | 46.3 | Ref | |
| CPG: recommend for all | 8 | 1,517 | 70.3 | 1.3 (0.9‐1.9) | 0.11 |
| CPG: recommend if high‐risk | 8 | 2,255 | 39.9 | 0.5 (0.3‐0.8) | 0.002 |
| Disposition | |||||
| Hospitalization | |||||
| No CPG | 17 | 2,460 | 47.0 | Ref | |
| CPG: recommend if high‐risk | 16 | 3,772 | 42.0 | 0.7 (0.5‐1.1) | 0.10 |
| Ceftriaxone if discharged | |||||
| No CPG | 17 | 1,304 | 11.7 | Ref | |
| CPG: recommend against | 4 | 313 | 10.9 | 0.3 (0.1‐0.9) | 0.03 |
| CPG: recommend consider | 9 | 1,567 | 14.4 | 1.5 (0.9‐2.4) | 0.09 |
| CPG: recommend for all | 3 | 306 | 64.1 | 4.6 (2.39.3) | < 0.001 |
Three‐day revisits for SBI were similarly low at hospitals with and without CPGs among infants 28 days (1.5% vs 0.8%, P=0.44) and 29 to 56 days of age (1.4% vs 1.1%, P=0.44) and did not differ after exclusion of hospitals with a CPG implemented in 2013.
CPGs and Costs
Among infants 28 days of age, costs per visit did not differ for admitted and discharged patients based on CPG presence. The presence of an ED febrile infant CPG was associated with higher costs for both admitted and discharged infants 29 to 56 days of age (Table 4). The cost analysis did not significantly differ after exclusion of hospitals with CPGs implemented in 2013.
| 28 Days, Cost, Median (IQR) | 29 to 56 Days, Cost, Median (IQR) | |||||
|---|---|---|---|---|---|---|
| No CPG | CPG | P Value | No CPG | CPG | P Value | |
| ||||||
| Admitted | $4,979 ($3,408$6,607) [n=751] | $4,715 ($3,472$6,526) [n=1,753] | 0.79 | $3,756 ($2,725$5,041) [n=1,156] | $3,923 ($3,077$5,243) [n=1,586] | <0.001 |
| Discharged | $298 ($166$510) [n=245] | $231 ($160$464) [n=396] | 0.10 | $681($398$982) [n=1,304)] | $764 ($412$1,100) [n=2,186] | <0.001 |
DISCUSSION
We described the content and association of CPGs with management of the febrile infant 56 days of age across a large sample of children's hospitals. Nearly two‐thirds of included pediatric EDs have a CPG for the management of young febrile infants. Management of febrile infants 28 days was uniform, with a majority hospitalized after urine, blood, and CSF testing regardless of the presence of a CPG. In contrast, CPGs for infants 29 to 56 days of age varied in their recommendations for CSF testing as well as ceftriaxone use for infants discharged from the ED. Consequently, we observed considerable hospital variability in CSF testing and ceftriaxone use for discharged infants, which correlates with variation in the presence and content of CPGs. Institutional CPGs may be a source of the across‐hospital variation in care of febrile young infants observed in prior study.[9]
Febrile infants 28 days of age are at particularly high risk for SBI, with a prevalence of nearly 20% or higher.[2, 3, 29] The high prevalence of SBI, combined with the inherent difficulty in distinguishing neonates with and without SBI,[2, 30] has resulted in uniform CPG recommendations to perform the full‐sepsis workup in this young age group. Similar to prior studies,[8, 9] we observed that most febrile infants 28 days undergo the full sepsis evaluation, including CSF testing, and are hospitalized regardless of the presence of a CPG.
However, given the conflicting recommendations for febrile infants 29 to 56 days of age,[4, 5, 6] the optimal management strategy is less certain.[7] The Rochester, Philadelphia, and Boston criteria, 3 published models to identify infants at low risk for SBI, primarily differ in their recommendations for CSF testing and ceftriaxone use in this age group.[4, 5, 6] Half of the CPGs recommended CSF testing for all febrile infants, and half recommended CSF testing only if the infant was high risk. Institutional guidelines that recommended selective CSF testing for febrile infants aged 29 to 56 days were associated with lower rates of CSF testing. Furthermore, ceftriaxone use varied based on CPG recommendations for low‐risk infants discharged from the ED. Therefore, the influence of febrile infant CPGs mainly relates to the limiting of CSF testing and targeted ceftriaxone use in low‐risk infants. As the rate of return visits for SBI is low across hospitals, future study should assess outcomes at hospitals with CPGs recommending selective CSF testing. Of note, infants 29 to 56 days of age were less likely to be hospitalized when cared for at a hospital with an established CPG prior to 2013 without increase in 3‐day revisits for SBI. This finding may indicate that longer duration of CPG implementation is associated with lower rates of hospitalization for low‐risk infants; this finding merits further study.
The presence of a CPG was not associated with lower costs for febrile infants in either age group. Although individual healthcare systems have achieved lower costs with CPG implementation,[12] the mere presence of a CPG is not associated with lower costs when assessed across institutions. Higher costs for admitted and discharged infants 29 to 56 days of age in the presence of a CPG likely reflects the higher rate of CSF testing at hospitals whose CPGs recommend testing for all febrile infants, as well as inpatient management strategies for hospitalized infants not captured in our study. Future investigation should include an assessment of the cost‐effectiveness of the various testing and treatment strategies employed for the febrile young infant.
Our study has several limitations. First, the validity of ICD‐9 diagnosis codes for identifying young infants with fever is not well established, and thus our study is subject to misclassification bias. To minimize missed patients, we included infants with either an ICD‐9 admission or discharge diagnosis of fever; however, utilization of diagnosis codes for patient identification may have resulted in undercapture of infants with a measured temperature of 38.0C. It is also possible that some patients who did not undergo testing were misclassified as having a fever or had temperatures below standard thresholds to prompt diagnostic testing. This is a potential reason that testing was not performed in 100% of infants, even at hospitals with CPGs that recommended testing for all patients. Additionally, some febrile infants diagnosed with SBI may not have an associated ICD‐9 diagnosis code for fever. Although the overall SBI rate observed in our study was similar to prior studies,[4, 31] the rate in neonates 28 days of age was lower than reported in recent investigations,[2, 3] which may indicate inclusion of a higher proportion of low‐risk febrile infants. With the exception of bronchiolitis, we also did not assess diagnostic testing in the presence of other identified sources of infection such as herpes simplex virus.
Second, we were unable to assess the presence or absence of a CPG at the 4 excluded EDs that did not respond to the survey or the institutions excluded for data‐quality issues. However, included and excluded hospitals did not differ in region or annual ED volume (data not shown).
Third, although we classified hospitals based upon the presence and content of CPGs, we were unable to fully evaluate adherence to the CPG at each site.
Last, though PHIS hospitals represent 85% of freestanding children's hospitals, many febrile infants are hospitalized at non‐PHIS institutions; our results may not be generalizable to care provided at nonchildren's hospitals.
CONCLUSIONS
Management of febrile neonates 28 days of age does not vary based on CPG presence. However, CPGs for the febrile infant aged 29 to 56 days vary in recommendations for CSF testing as well as ceftriaxone use for low‐risk patients, which significantly contributes to practice variation and healthcare costs across institutions.
Acknowledgements
The Febrile Young Infant Research Collaborative includes the following additional investigators who are acknowledged for their work on this study: Kao‐Ping Chua, MD, Harvard PhD Program in Health Policy, Harvard University, Cambridge, Massachusetts, and Division of Emergency Medicine, Department of Pediatrics, Boston Children's Hospital, Boston, Massachusetts; Elana A. Feldman, BA, University of Washington School of Medicine, Seattle, Washington; and Katie L. Hayes, BS, Division of Emergency Medicine, Department of Pediatrics, The Children's Hospital of Philadelphia, Philadelphia, Pennsylvania.
Disclosures
This project was funded in part by The Gerber Foundation Novice Researcher Award (Ref #18273835). Dr. Fran Balamuth received career development support from the National Institutes of Health (NHLBI K12‐HL109009). Funders were not involved in design or conduct of the study; collection, management, analysis, or interpretation of the data; preparation, review, or approval of the manuscript. The authors have no financial relationships relevant to this article to disclose. No payment was received for the production of this article. The authors have no conflicts of interest relevant to this article to disclose.
- , , . Performance of low‐risk criteria in the evaluation of young infants with fever: review of the literature. Pediatrics. 2010;125:228–233.
- , , , , , . A week‐by‐week analysis of the low‐risk criteria for serious bacterial infection in febrile neonates. Arch Dis Child. 2009;94:287–292.
- , , , et al. Is 15 days an appropriate cut‐off age for considering serious bacterial infection in the management of febrile infants? Pediatr Infect Dis J. 2012;31:455–458.
- , , . Outpatient management without antibiotics of fever in selected infants. N Engl J Med. 1993;329:1437–1441.
- , , . Identifying febrile infants at risk for a serious bacterial infection. J Pediatr. 1993;123:489–490.
- , , , et al. Febrile infants at low risk for serious bacterial infection—an appraisal of the Rochester criteria and implications for management. Febrile Infant Collaborative Study Group. Pediatrics. 1994;94:390–396.
- American College of Emergency Physicians Clinical Policies Committee; American College of Emergency Physicians Clinical Policies Subcommittee on Pediatric Fever. Clinical policy for children younger than three years presenting to the emergency department with fever. Ann Emerg Med. 2003;42:530–545.
- , , , et al. Management of febrile neonates in US pediatric emergency departments. Pediatrics. 2014;133:187–195.
- , , , et al. Variation in care of the febrile young infant <90 days in US pediatric emergency departments. Pediatrics. 2014;134:667–677.
- , , , , . Fever survey highlights significant variations in how infants aged ≤60 days are evaluated and underline the need for guidelines. Acta Paediatr. 2014;103:379–385.
- . Evidence‐based guidelines and critical pathways for quality improvement. Pediatrics. 1999;103:225–232.
- , , , et al. Costs and infant outcomes after implementation of a care process model for febrile infants. Pediatrics. 2012;130:e16–e24.
- , , , , , . Research electronic data capture (REDCap)—a metadata‐driven methodology and workflow process for providing translational research informatics support. J Biomed Inform. 2009;42:377–381.
- , , , , , . Variation in occult injury screening for children with suspected abuse in selected US children's hospitals. Pediatrics. 2012;130:853–860.
- . Achieving data quality. How data from a pediatric health information system earns the trust of its users. J AHIMA. 2004;75:22–26.
- , , , . Corticosteroids and mortality in children with bacterial meningitis. JAMA. 2008;299:2048–2055.
- , , , et al. Variation in resource utilization across a national sample of pediatric emergency departments. J Pediatr. 2013;163:230–236.
- , , , , , . Deaths attributed to pediatric complex chronic conditions: national trends and implications for supportive care services. Pediatrics. 2001;107:E99.
- US Census Bureau. Geographic terms and concepts—census divisions and census regions. Available at: https://www.census.gov/geo/reference/gtc/gtc_census_divreg.html. Accessed September 10, 2014.
- , , , et al. Pediatric observation status: are we overlooking a growing population in children's hospitals? J Hosp Med. 2012;7:530–536.
- , , , et al. Differences in designations of observation care in US freestanding children's hospitals: are they virtual or real? J Hosp Med. 2012;7:287–293.
- , , , et al. Accuracy of administrative billing codes to detect urinary tract infection hospitalizations. Pediatrics. 2011;128:323–330.
- , , , et al. Identifying pediatric community‐acquired pneumonia hospitalizations: accuracy of administrative billing codes. JAMA Pediatr. 2013;167:851–858.
- , , , . Initial emergency department diagnosis and return visits: risk versus perception. Ann Emerg Med. 1998;32:569–573.
- , , , , . A national depiction of children with return visits to the emergency department within 72 hours, 2001–2007. Pediatr Emerg Care. 2012;28:606–610.
- Healthcare Cost and Utilization Project. Cost‐to‐charge ratio files. Available at: http://www.hcup‐us.ahrq.gov/db/state/costtocharge.jsp. Accessed September 11, 2014.
- , , , et al. Risk of serious bacterial infection in young febrile infants with respiratory syncytial virus infections. Pediatrics. 2004;113:1728–1734.
- , , , et al. Establishing benchmarks for the hospitalized care of children with asthma, bronchiolitis, and pneumonia. Pediatrics. 2014;134:555–562.
- , , , , , . Well appearing young infants with fever without known source in the emergency department: are lumbar punctures always necessary? Eur J Emerg Med. 2010;17:167–169.
- , . Unpredictability of serious bacterial illness in febrile infants from birth to 1 month of age. Arch Pediatr Adolesc Med. 1999;153:508–511.
- , , , et al. Management and outcomes of care of fever in early infancy. JAMA. 2004;291:1203–1212.
Febrile young infants are at high risk for serious bacterial infection (SBI) with reported rates of 8.5% to 12%, even higher in neonates 28 days of age.[1, 2, 3] As a result, febrile infants often undergo extensive diagnostic evaluation consisting of a combination of urine, blood, and cerebrospinal fluid (CSF) testing.[4, 5, 6] Several clinical prediction algorithms use this diagnostic testing to identify febrile infants at low risk for SBI, but they differ with respect to age range, recommended testing, antibiotic administration, and threshold for hospitalization.[4, 5, 6] Additionally, the optimal management strategy for this population has not been defined.[7] Consequently, laboratory testing, antibiotic use, and hospitalization for febrile young infants vary widely among hospitals.[8, 9, 10]
Clinical practice guidelines (CPGs) are designed to implement evidence‐based care and reduce practice variability, with the goal of improving quality of care and optimizing costs.[11] Implementation of a CPG for management of febrile young infants in the Intermountain Healthcare System was associated with greater adherence to evidence‐based care and lower costs.[12] However, when strong evidence is lacking, different interpretations of febrile infant risk classification incorporated into local CPGs may be a major driver of the across‐hospital practice variation observed in prior studies.[8, 9] Understanding sources of variability as well as determining the association of CPGs with clinicians' practice patterns can help identify quality improvement opportunities, either through national benchmarking or local efforts.
Our primary objectives were to compare (1) recommendations of pediatric emergency departmentbased institutional CPGs for febrile young infants and (2) rates of urine, blood, CSF testing, hospitalization, and ceftriaxone use at emergency department (ED) discharge based upon CPG presence and the specific CPG recommendations. Our secondary objectives were to describe the association of CPGs with healthcare costs and return visits for SBI.
METHODS
Study Design
We used the Pediatric Health Information System (PHIS) to identify febrile infants 56 days of age who presented to the ED between January 1, 2013 and December 31, 2013. We also surveyed ED providers at participating PHIS hospitals. Informed consent was obtained from survey respondents. The institutional review board at Boston Children's Hospital approved the study protocol.
Clinical Practice Guideline Survey
We sent an electronic survey to medical directors or division directors at 37 pediatric EDs to determine whether their ED utilized a CPG for the management of the febrile young infant in 2013. If no response was received after the second attempt, we queried ED fellowship directors or other ED attending physicians at nonresponding hospitals. Survey items included the presence of a febrile young infant CPG, and if present, the year of implementation, ages targeted, and CPG content. As applicable, respondents were asked to share their CPG and/or provide the specific CPG recommendations.
We collected and managed survey data using the Research Electronic Data Capture (REDCap) electronic data capture tools hosted at Boston Children's Hospital. REDCap is a secure, Web‐based application designed to support data capture for research studies.[13]
Data Source
The PHIS database contains administrative data from 44 US children's hospitals. These hospitals, affiliated with the Children's Hospital Association, represent 85% of freestanding US children's hospitals.[14] Encrypted patient identifiers permit tracking of patients across encounters.[15] Data quality and integrity are assured jointly by the Children's Hospital Association and participating hospitals.[16] For this study, 7 hospitals were excluded due to incomplete ED data or known data‐quality issues.[17]
Patients
We identified study infants using the following International Classification of Diseases, 9th Revision (ICD‐9) admission or discharge diagnosis codes for fever as defined previously[8, 9]: 780.6, 778.4, 780.60, or 780.61. We excluded infants with a complex chronic condition[18] and those transferred from another institution, as these infants may warrant a nonstandard evaluation and/or may have incomplete data. For infants with >1 ED visit for fever during the study period, repeat visits within 3 days of an index visit were considered a revisit for the same episode of illness; visits >3 days following an index visit were considered as a new index visit.
Study Definitions
From the PHIS database, we abstracted demographic characteristics (gender, race/ethnicity), insurance status, and region where the hospital was located (using US Census categories[19]). Billing codes were used to assess whether urine, blood, and CSF testing (as defined previously[9]) were performed during the ED evaluation. To account for ED visits that spanned the midnight hour, for hospitalized patients we considered any testing or treatment occurring on the initial or second hospital day to be performed in the ED; billing code data in PHIS are based upon calendar day and do not distinguish testing performed in the ED versus inpatient setting.[8, 9] Patients billed for observation care were classified as being hospitalized.[20, 21]
We identified the presence of an SBI using ICD‐9 diagnosis codes for the following infections as described previously[9]: urinary tract infection or pyelonephritis,[22] bacteremia or sepsis, bacterial meningitis,[16] pneumonia,[23] or bacterial enteritis. To assess return visits for SBI that required inpatient management, we defined an ED revisit for an SBI as a return visit within 3 days of ED discharge[24, 25] that resulted in hospitalization with an associated ICD‐9 discharge diagnosis code for an SBI.
Hospitals charges in PHIS database were adjusted for hospital location by using the Centers for Medicare and Medicaid Services price/wage index. Costs were estimated by applying hospital‐level cost‐to‐charge ratios to charge data.[26]
Measured Exposures
The primary exposure was the presence of an ED‐based CPG for management of the febrile young infant aged 28 days and 29 to 56 days; 56 days was used as the upper age limit as all of the CPGs included infants up to this age or beyond. Six institutions utilized CPGs with different thresholds to define the age categories (eg, dichotomized at 27 or 30 days); these CPGs were classified into the aforementioned age groups to permit comparisons across standardized age groups. We classified institutions based on the presence of a CPG. To assess differences in the application of low‐risk criteria, the CPGs were further classified a priori based upon specific recommendations around laboratory testing and hospitalization, as well as ceftriaxone use for infants aged 29 to 56 days discharged from the ED. CPGs were categorized based upon whether testing, hospitalization, and ceftriaxone use were: (1) recommended for all patients, (2) recommended only if patients were classified as high risk (absence of low‐risk criteria), (3) recommended against, or (4) recommended to consider at clinician discretion.
Outcome Measures
Measured outcomes were performance of urine, blood, CSF testing, and hospitalization rate, as well as rate of ceftriaxone use for discharged infants aged 29 to 56 days, 3‐day revisits for SBI, and costs per visit, which included hospitalization costs for admitted patients.
Data Analysis
We described continuous variables using median and interquartile range or range values and categorical variables using frequencies. We compared medians using Wilcoxon rank sum and categorical variables using a [2] test. We compared rates of testing, hospitalization, ceftriaxone use, and 3‐day revisits for SBI based on the presence of a CPG, and when present, the specific CPG recommendations. Costs per visit were compared between institutions with and without CPGs and assessed separately for admitted and discharged patients. To adjust for potential confounders and clustering of patients within hospitals, we used generalized estimating equations with logistic regression to generate adjusted odd ratios (aORs) and 95% confidence intervals (CIs). Models were adjusted for geographic region, payer, race, and gender. Statistical analyses were performed by using SAS version 9.3 (SAS Institute, Cary, NC). We determined statistical significance as a 2‐tailed P value <0.05.
Febrile infants with bronchiolitis or a history of prematurity may be managed differently from full‐term febrile young infants without bronchiolitis.[6, 27] Therefore, we performed a subgroup analysis after exclusion of infants with an ICD‐9 discharge diagnosis code for bronchiolitis (466.11 and 466.19)[28] or prematurity (765).
Because our study included ED encounters in 2013, we repeated our analyses after exclusion of hospitals with CPGs implemented during the 2013 calendar year.
RESULTS
CPG by Institution
Thirty‐three (89.2%) of the 37 EDs surveyed completed the questionnaire. Overall, 21 (63.6%) of the 33 EDs had a CPG; 15 (45.5%) had a CPG for all infants 56 days of age, 5 (15.2%) had a CPG for infants 28 days only, and 1 (3.0%) had a CPG for infants 29 to 56 days but not 28 days of age (Figure 1). Seventeen EDs had an established CPG prior to 2013, and 4 hospitals implemented a CPG during the 2013 calendar year, 2 with CPGs for neonates 28 days and 2 with CPGs for both 28 days and 29 to 56 days of age. Hospitals with CPGs were more likely to be located in the Northeast and West regions of the United States and provide care to a higher proportion of non‐Hispanic white patients, as well as those with commercial insurance (Table 1).
| Characteristic | 28 Days | 2956 Days | ||||
|---|---|---|---|---|---|---|
| No CPG, n=996, N (%) | CPG, n=2,149, N (%) | P Value | No CPG, n=2,460, N (%) | CPG, n=3,772, N (%) | P Value | |
| ||||||
| Race | ||||||
| Non‐Hispanic white | 325 (32.6) | 996 (46.3) | 867 (35.2) | 1,728 (45.8) | ||
| Non‐Hispanic black | 248 (24.9) | 381 (17.7) | 593 (24.1) | 670 (17.8) | ||
| Hispanic | 243 (24.4) | 531 (24.7) | 655 (26.6) | 986 (26.1) | ||
| Asian | 28 (2.8) | 78 (3.6) | 40 (1.6) | 122 (3.2) | ||
| Other Race | 152 (15.3) | 163 (7.6) | <0.001 | 305 (12.4) | 266 (7.1) | <0.001 |
| Gender | ||||||
| Female | 435 (43.7) | 926 (43.1) | 0.76 | 1,067 (43.4) | 1,714 (45.4) | 0.22 |
| Payer | ||||||
| Commercial | 243 (24.4) | 738 (34.3) | 554 (22.5) | 1,202 (31.9) | ||
| Government | 664 (66.7) | 1,269 (59.1) | 1,798 (73.1) | 2,342 (62.1) | ||
| Other payer | 89 (8.9) | 142 (6.6) | <0.001 | 108 (4.4) | 228 (6.0) | <0.001 |
| Region | ||||||
| Northeast | 39 (3.9) | 245 (11.4) | 77 (3.1) | 572 (15.2) | ||
| South | 648 (65.1) | 915 (42.6) | 1,662 (67.6) | 1,462 (38.8) | ||
| Midwest | 271 (27.2) | 462 (21.5) | 506 (20.6) | 851 (22.6) | ||
| West | 38 (3.8) | 527 (24.5) | <0.001 | 215 (8.7) | 887 (23.5) | <0.001 |
| Serious bacterial infection | ||||||
| Overall* | 131 (13.2) | 242 (11.3) | 0.14 | 191 (7.8) | 237 (6.3) | 0.03 |
| UTI/pyelonephritis | 73 (7.3) | 153 (7.1) | 103 (4.2) | 154 (4.1) | ||
| Bacteremia/sepsis | 56 (5.6) | 91 (4.2) | 78 (3.2) | 61 (1.6) | ||
| Bacterial meningitis | 15 (1.5) | 15 (0.7) | 4 (0.2) | 14 (0.4) | ||
| Age, d, median (IQR) | 18 (11, 24) | 18 (11, 23) | 0.67 | 46 (37, 53) | 45 (37, 53) | 0.11 |
All 20 CPGs for the febrile young infant 28 days of age recommended urine, blood, CSF testing, and hospitalization for all infants (Figure 1). Of the 16 hospitals with CPGs for febrile infants aged 29 to 56 days, all recommended urine and blood testing for all patients, except for 1 CPG, which recommended consideration of blood testing but not to obtain routinely. Hospitals varied in recommendations for CSF testing among infants aged 29 to 56 days: 8 (50%) recommended CSF testing in all patients and 8 (50%) recommended CSF testing only if the patient was high risk per defined criteria (based on history, physical examination, urine, and blood testing). In all 16 CPGs, hospitalization was recommended only for high‐risk infants. For low‐risk infants aged 2956 days being discharged from the ED, 3 hospitals recommended ceftriaxone for all, 9 recommended consideration of ceftriaxone, and 4 recommended against antibiotics (Figure 1).
Study Patients
During the study period, there were 10,415 infants 56 days old with a diagnosis of fever at the 33 participating hospitals. After exclusion of 635 (6.1%) infants with a complex chronic condition and 445 (4.3%) transferred from another institution (including 42 with a complex chronic condition), 9377 infants remained in our study cohort. Approximately one‐third of the cohort was 28 days of age and two‐thirds aged 29 to 56 days. The overall SBI rate was 8.5% but varied by age (11.9% in infants 28 days and 6.9% in infants 29 to 56 days of age) (Table 1).
CPGs and Use of Diagnostic Testing, Hospitalization Rates, Ceftriaxone Use, and Revisits for SBI
For infants 28 days of age, the presence of a CPG was not associated with urine, blood, CSF testing, or hospitalization after multivariable adjustment (Table 2). Among infants aged 29 to 56 days, urine testing did not differ based on the presence of a CPG, whereas blood testing was performed less often at the 1 hospital whose CPG recommended to consider, but not routinely obtain, testing (aOR: 0.4, 95% CI: 0.3‐0.7, P=0.001). Compared to hospitals without a CPG, CSF testing was performed less often at hospitals with CPG recommendations to only obtain CSF if high risk (aOR: 0.5, 95% CI: 0.3‐0.8, P=0.002). However, the odds of hospitalization did not differ at institutions with and without a febrile infant CPG (aOR: 0.7, 95% CI: 0.5‐1.1, P=0.10). For infants aged 29 to 56 days discharged from the ED, ceftriaxone was administered more often at hospitals with CPGs that recommended ceftriaxone for all discharged patients (aOR: 4.6, 95% CI: 2.39.3, P<0.001) and less often at hospitals whose CPGs recommended against antibiotics (aOR: 0.3, 95% CI: 0.1‐0.9, P=0.03) (Table 3). Our findings were similar in the subgroup of infants without bronchiolitis or prematurity (see Supporting Tables 1 and 2 in the online version of this article). After exclusion of hospitals with a CPG implemented during the 2013 calendar year (4 hospitals excluded in the 28 days age group and 2 hospitals excluded in the 29 to 56 days age group), infants aged 29 to 56 days cared for at a hospital with a CPG experienced a lower odds of hospitalization (aOR: 0.7, 95% CI: 0.4‐0.98, P=0.04). Otherwise, our findings in both age groups did not materially differ from the main analyses.
| Testing/Hospitalization | No. of Hospitals | No. of Patients | % Received* | aOR (95% CI) | P Value |
|---|---|---|---|---|---|
| |||||
| Laboratory testing | |||||
| Urine testing | |||||
| No CPG | 13 | 996 | 75.6 | Ref | |
| CPG: recommend for all | 20 | 2,149 | 80.7 | 1.2 (0.9‐1.7) | 0.22 |
| Blood testing | |||||
| No CPG | 13 | 996 | 76.9 | Ref | |
| CPG: recommend for all | 20 | 2,149 | 81.8 | 1.2 (0.9‐1.7) | 0.25 |
| CSF testing‖ | |||||
| No CPG | 13 | 996 | 71.0 | Ref | |
| CPG: recommend for all | 20 | 2,149 | 77.5 | 1.3 (1.01.7) | 0.08 |
| Disposition | |||||
| Hospitalization | |||||
| No CPG | 13 | 996 | 75.4 | Ref | |
| CPG: recommend for all | 20 | 2,149 | 81.6 | 1.2 (0.9‐1.8) | 0.26 |
| Testing/Hospitalization | No. of Hospitals | No. of Patients | % Received* | aOR (95% CI) | P Value |
|---|---|---|---|---|---|
| |||||
| Laboratory resting | |||||
| Urine testing | |||||
| No CPG | 17 | 2,460 | 81.1 | Ref | |
| CPG: recommend for all | 16 | 3,772 | 82.1 | 0.9 (0.7‐1.4) | 0.76 |
| Blood testing | |||||
| No CPG | 17 | 2,460 | 79.4 | Ref | |
| CPG: recommend for all | 15 | 3,628 | 82.6 | 1.1 (0.7‐1.6) | 0.70 |
| CPG: recommend consider | 1 | 144 | 62.5 | 0.4 (0.3‐0.7) | 0.001 |
| CSF testing‖ | |||||
| No CPG | 17 | 2,460 | 46.3 | Ref | |
| CPG: recommend for all | 8 | 1,517 | 70.3 | 1.3 (0.9‐1.9) | 0.11 |
| CPG: recommend if high‐risk | 8 | 2,255 | 39.9 | 0.5 (0.3‐0.8) | 0.002 |
| Disposition | |||||
| Hospitalization | |||||
| No CPG | 17 | 2,460 | 47.0 | Ref | |
| CPG: recommend if high‐risk | 16 | 3,772 | 42.0 | 0.7 (0.5‐1.1) | 0.10 |
| Ceftriaxone if discharged | |||||
| No CPG | 17 | 1,304 | 11.7 | Ref | |
| CPG: recommend against | 4 | 313 | 10.9 | 0.3 (0.1‐0.9) | 0.03 |
| CPG: recommend consider | 9 | 1,567 | 14.4 | 1.5 (0.9‐2.4) | 0.09 |
| CPG: recommend for all | 3 | 306 | 64.1 | 4.6 (2.39.3) | < 0.001 |
Three‐day revisits for SBI were similarly low at hospitals with and without CPGs among infants 28 days (1.5% vs 0.8%, P=0.44) and 29 to 56 days of age (1.4% vs 1.1%, P=0.44) and did not differ after exclusion of hospitals with a CPG implemented in 2013.
CPGs and Costs
Among infants 28 days of age, costs per visit did not differ for admitted and discharged patients based on CPG presence. The presence of an ED febrile infant CPG was associated with higher costs for both admitted and discharged infants 29 to 56 days of age (Table 4). The cost analysis did not significantly differ after exclusion of hospitals with CPGs implemented in 2013.
| 28 Days, Cost, Median (IQR) | 29 to 56 Days, Cost, Median (IQR) | |||||
|---|---|---|---|---|---|---|
| No CPG | CPG | P Value | No CPG | CPG | P Value | |
| ||||||
| Admitted | $4,979 ($3,408$6,607) [n=751] | $4,715 ($3,472$6,526) [n=1,753] | 0.79 | $3,756 ($2,725$5,041) [n=1,156] | $3,923 ($3,077$5,243) [n=1,586] | <0.001 |
| Discharged | $298 ($166$510) [n=245] | $231 ($160$464) [n=396] | 0.10 | $681($398$982) [n=1,304)] | $764 ($412$1,100) [n=2,186] | <0.001 |
DISCUSSION
We described the content and association of CPGs with management of the febrile infant 56 days of age across a large sample of children's hospitals. Nearly two‐thirds of included pediatric EDs have a CPG for the management of young febrile infants. Management of febrile infants 28 days was uniform, with a majority hospitalized after urine, blood, and CSF testing regardless of the presence of a CPG. In contrast, CPGs for infants 29 to 56 days of age varied in their recommendations for CSF testing as well as ceftriaxone use for infants discharged from the ED. Consequently, we observed considerable hospital variability in CSF testing and ceftriaxone use for discharged infants, which correlates with variation in the presence and content of CPGs. Institutional CPGs may be a source of the across‐hospital variation in care of febrile young infants observed in prior study.[9]
Febrile infants 28 days of age are at particularly high risk for SBI, with a prevalence of nearly 20% or higher.[2, 3, 29] The high prevalence of SBI, combined with the inherent difficulty in distinguishing neonates with and without SBI,[2, 30] has resulted in uniform CPG recommendations to perform the full‐sepsis workup in this young age group. Similar to prior studies,[8, 9] we observed that most febrile infants 28 days undergo the full sepsis evaluation, including CSF testing, and are hospitalized regardless of the presence of a CPG.
However, given the conflicting recommendations for febrile infants 29 to 56 days of age,[4, 5, 6] the optimal management strategy is less certain.[7] The Rochester, Philadelphia, and Boston criteria, 3 published models to identify infants at low risk for SBI, primarily differ in their recommendations for CSF testing and ceftriaxone use in this age group.[4, 5, 6] Half of the CPGs recommended CSF testing for all febrile infants, and half recommended CSF testing only if the infant was high risk. Institutional guidelines that recommended selective CSF testing for febrile infants aged 29 to 56 days were associated with lower rates of CSF testing. Furthermore, ceftriaxone use varied based on CPG recommendations for low‐risk infants discharged from the ED. Therefore, the influence of febrile infant CPGs mainly relates to the limiting of CSF testing and targeted ceftriaxone use in low‐risk infants. As the rate of return visits for SBI is low across hospitals, future study should assess outcomes at hospitals with CPGs recommending selective CSF testing. Of note, infants 29 to 56 days of age were less likely to be hospitalized when cared for at a hospital with an established CPG prior to 2013 without increase in 3‐day revisits for SBI. This finding may indicate that longer duration of CPG implementation is associated with lower rates of hospitalization for low‐risk infants; this finding merits further study.
The presence of a CPG was not associated with lower costs for febrile infants in either age group. Although individual healthcare systems have achieved lower costs with CPG implementation,[12] the mere presence of a CPG is not associated with lower costs when assessed across institutions. Higher costs for admitted and discharged infants 29 to 56 days of age in the presence of a CPG likely reflects the higher rate of CSF testing at hospitals whose CPGs recommend testing for all febrile infants, as well as inpatient management strategies for hospitalized infants not captured in our study. Future investigation should include an assessment of the cost‐effectiveness of the various testing and treatment strategies employed for the febrile young infant.
Our study has several limitations. First, the validity of ICD‐9 diagnosis codes for identifying young infants with fever is not well established, and thus our study is subject to misclassification bias. To minimize missed patients, we included infants with either an ICD‐9 admission or discharge diagnosis of fever; however, utilization of diagnosis codes for patient identification may have resulted in undercapture of infants with a measured temperature of 38.0C. It is also possible that some patients who did not undergo testing were misclassified as having a fever or had temperatures below standard thresholds to prompt diagnostic testing. This is a potential reason that testing was not performed in 100% of infants, even at hospitals with CPGs that recommended testing for all patients. Additionally, some febrile infants diagnosed with SBI may not have an associated ICD‐9 diagnosis code for fever. Although the overall SBI rate observed in our study was similar to prior studies,[4, 31] the rate in neonates 28 days of age was lower than reported in recent investigations,[2, 3] which may indicate inclusion of a higher proportion of low‐risk febrile infants. With the exception of bronchiolitis, we also did not assess diagnostic testing in the presence of other identified sources of infection such as herpes simplex virus.
Second, we were unable to assess the presence or absence of a CPG at the 4 excluded EDs that did not respond to the survey or the institutions excluded for data‐quality issues. However, included and excluded hospitals did not differ in region or annual ED volume (data not shown).
Third, although we classified hospitals based upon the presence and content of CPGs, we were unable to fully evaluate adherence to the CPG at each site.
Last, though PHIS hospitals represent 85% of freestanding children's hospitals, many febrile infants are hospitalized at non‐PHIS institutions; our results may not be generalizable to care provided at nonchildren's hospitals.
CONCLUSIONS
Management of febrile neonates 28 days of age does not vary based on CPG presence. However, CPGs for the febrile infant aged 29 to 56 days vary in recommendations for CSF testing as well as ceftriaxone use for low‐risk patients, which significantly contributes to practice variation and healthcare costs across institutions.
Acknowledgements
The Febrile Young Infant Research Collaborative includes the following additional investigators who are acknowledged for their work on this study: Kao‐Ping Chua, MD, Harvard PhD Program in Health Policy, Harvard University, Cambridge, Massachusetts, and Division of Emergency Medicine, Department of Pediatrics, Boston Children's Hospital, Boston, Massachusetts; Elana A. Feldman, BA, University of Washington School of Medicine, Seattle, Washington; and Katie L. Hayes, BS, Division of Emergency Medicine, Department of Pediatrics, The Children's Hospital of Philadelphia, Philadelphia, Pennsylvania.
Disclosures
This project was funded in part by The Gerber Foundation Novice Researcher Award (Ref #18273835). Dr. Fran Balamuth received career development support from the National Institutes of Health (NHLBI K12‐HL109009). Funders were not involved in design or conduct of the study; collection, management, analysis, or interpretation of the data; preparation, review, or approval of the manuscript. The authors have no financial relationships relevant to this article to disclose. No payment was received for the production of this article. The authors have no conflicts of interest relevant to this article to disclose.
- , , . Performance of low‐risk criteria in the evaluation of young infants with fever: review of the literature. Pediatrics. 2010;125:228–233.
- , , , , , . A week‐by‐week analysis of the low‐risk criteria for serious bacterial infection in febrile neonates. Arch Dis Child. 2009;94:287–292.
- , , , et al. Is 15 days an appropriate cut‐off age for considering serious bacterial infection in the management of febrile infants? Pediatr Infect Dis J. 2012;31:455–458.
- , , . Outpatient management without antibiotics of fever in selected infants. N Engl J Med. 1993;329:1437–1441.
- , , . Identifying febrile infants at risk for a serious bacterial infection. J Pediatr. 1993;123:489–490.
- , , , et al. Febrile infants at low risk for serious bacterial infection—an appraisal of the Rochester criteria and implications for management. Febrile Infant Collaborative Study Group. Pediatrics. 1994;94:390–396.
- American College of Emergency Physicians Clinical Policies Committee; American College of Emergency Physicians Clinical Policies Subcommittee on Pediatric Fever. Clinical policy for children younger than three years presenting to the emergency department with fever. Ann Emerg Med. 2003;42:530–545.
- , , , et al. Management of febrile neonates in US pediatric emergency departments. Pediatrics. 2014;133:187–195.
- , , , et al. Variation in care of the febrile young infant <90 days in US pediatric emergency departments. Pediatrics. 2014;134:667–677.
- , , , , . Fever survey highlights significant variations in how infants aged ≤60 days are evaluated and underline the need for guidelines. Acta Paediatr. 2014;103:379–385.
- . Evidence‐based guidelines and critical pathways for quality improvement. Pediatrics. 1999;103:225–232.
- , , , et al. Costs and infant outcomes after implementation of a care process model for febrile infants. Pediatrics. 2012;130:e16–e24.
- , , , , , . Research electronic data capture (REDCap)—a metadata‐driven methodology and workflow process for providing translational research informatics support. J Biomed Inform. 2009;42:377–381.
- , , , , , . Variation in occult injury screening for children with suspected abuse in selected US children's hospitals. Pediatrics. 2012;130:853–860.
- . Achieving data quality. How data from a pediatric health information system earns the trust of its users. J AHIMA. 2004;75:22–26.
- , , , . Corticosteroids and mortality in children with bacterial meningitis. JAMA. 2008;299:2048–2055.
- , , , et al. Variation in resource utilization across a national sample of pediatric emergency departments. J Pediatr. 2013;163:230–236.
- , , , , , . Deaths attributed to pediatric complex chronic conditions: national trends and implications for supportive care services. Pediatrics. 2001;107:E99.
- US Census Bureau. Geographic terms and concepts—census divisions and census regions. Available at: https://www.census.gov/geo/reference/gtc/gtc_census_divreg.html. Accessed September 10, 2014.
- , , , et al. Pediatric observation status: are we overlooking a growing population in children's hospitals? J Hosp Med. 2012;7:530–536.
- , , , et al. Differences in designations of observation care in US freestanding children's hospitals: are they virtual or real? J Hosp Med. 2012;7:287–293.
- , , , et al. Accuracy of administrative billing codes to detect urinary tract infection hospitalizations. Pediatrics. 2011;128:323–330.
- , , , et al. Identifying pediatric community‐acquired pneumonia hospitalizations: accuracy of administrative billing codes. JAMA Pediatr. 2013;167:851–858.
- , , , . Initial emergency department diagnosis and return visits: risk versus perception. Ann Emerg Med. 1998;32:569–573.
- , , , , . A national depiction of children with return visits to the emergency department within 72 hours, 2001–2007. Pediatr Emerg Care. 2012;28:606–610.
- Healthcare Cost and Utilization Project. Cost‐to‐charge ratio files. Available at: http://www.hcup‐us.ahrq.gov/db/state/costtocharge.jsp. Accessed September 11, 2014.
- , , , et al. Risk of serious bacterial infection in young febrile infants with respiratory syncytial virus infections. Pediatrics. 2004;113:1728–1734.
- , , , et al. Establishing benchmarks for the hospitalized care of children with asthma, bronchiolitis, and pneumonia. Pediatrics. 2014;134:555–562.
- , , , , , . Well appearing young infants with fever without known source in the emergency department: are lumbar punctures always necessary? Eur J Emerg Med. 2010;17:167–169.
- , . Unpredictability of serious bacterial illness in febrile infants from birth to 1 month of age. Arch Pediatr Adolesc Med. 1999;153:508–511.
- , , , et al. Management and outcomes of care of fever in early infancy. JAMA. 2004;291:1203–1212.
© 2015 Society of Hospital Medicine
