User login
Healthcare Encounter and Financial Impact of COVID-19 on Children’s Hospitals
To benefit patients and the public health of their communities, children’s hospitals across the United States prepared for and responded to COVID-19 by conserving personal protective equipment, suspending noncritical in-person healthcare encounters (including outpatient visits and elective surgeries), and implementing socially distanced essential care.1,2 These measures were promptly instituted during a time of both substantial uncertainty about the pandemic’s behavior in children—including its severity and duration—and extreme variation in local and state governments’ responses to the pandemic.
Congruent with other healthcare institutions, children’s hospitals calibrated their clinical operations to the evolving nature of the pandemic, prioritizing the safety of patients and staff while striving to maintain financial viability in the setting of increased costs and decreased revenue. In some cases, children’s hospitals aided adult hospitals and health systems by admitting young and middle-aged adult patients and by centralizing all pediatric patients requiring intensive care within a region. These efforts occurred while many children’s hospitals remained the sole source of specialized pediatric care, including care for rare complex health problems.
As the COVID-19 pandemic continues, there is a critical need to assess how the initial phase of the pandemic affected healthcare encounters and related finances in children’s hospitals. Understanding these trends will position children’s hospitals to project and prepare for subsequent COVID-19 surges, as well as future related public health crises that necessitate widespread social distancing. Therefore, we compared year-over-year trends in healthcare encounters and hospital charges across US children’s hospitals before and during the COVID-19 pandemic, focusing on the beginning of COVID-19 in the United States, which was defined as February through June 2020.
METHODS
This is a retrospective analysis of 26 children’s hospitals (22 freestanding, 4 nonfreestanding) from all US regions (12 South, 7 Midwest, 5 West, 2 Northeast) contributing encounter and financial data to the PROSPECT database (Children’s Hospital Association, Lenexa, Kansas) from February 1 to June 30 in both 2019 (before COVID-19) and 2020 (during COVID-19). In response to COVID-19, hospitals participating in PROSPECT increased the efficiency of data centralization and reporting in 2020 during the period February 1 to June 30 to expedite analysis and dissemination of findings.
The main outcome measures were the percentage of change in weekly encounters (inpatient bed-days, emergency department [ED] visits, and surgeries) and inflation-adjusted charges (categorized as inpatient care and outpatient care, such as ambulatory surgery, clinics, and ED visits) before vs during COVID-19.
RESULTS


Charges that accrued from February 1 to June 30 were lower in 2020 by a median 23.6% (IQR, –28.7% to –19.1%) per children’s hospital than they were in 2019, corresponding to a median decrease of $276.3 million (IQR, $404.0-$126.0 million) in charges per hospital (Table). Forty percent of this decrease was attributable to decreased charges resulting from fewer inpatient healthcare encounters.
DISCUSSION
These findings beg the question of how well children’s hospitals are positioned to weather a recurrent surge in COVID-19. Because the severity of illness of COVID-19 has been lower to date in the pediatric vs adult populations, an increase in COVID-19-related visits to EDs and admissions to offset the decreased resource use of other pediatric healthcare problems is not anticipated. Existing hospital financial reserves as well as federal aid from the Coronavirus Aid, Relief, and Economic Security Act that helped mitigate the initial encounter and financial losses during the beginning of COVID-19 may not be readily available over time.4,5 Certainly, the findings from the current study support continued lobbying for additional state and federal funds allocated through future relief packages to children’s hospitals.
Additional approaches to financial solvency in children’s hospitals during the sustained COVID-19 pandemic include addressing surgical backlogs and sharing best practices for safe and sustained reopening of clinical operations and financial practices across institutions. Although the PROSPECT database does not contain information on the types of surgeries present within this backlog, our experiences suggest that both same-day and inpatient elective surgeries have been affected, especially lengthy procedures (eg, spinal fusion for neuromuscular scoliosis). Spread and scale of feasible and efficient solutions to reengineer and expand patient capacities and throughput for operating rooms, postanesthesia recovery areas, and intensive care and floor units are needed. Enhanced analytics that accurately predict postoperative length of hospital stay, coupled with early recovery after surgery clinical protocols, could help optimize hospital bed management. Effective ways to convert hospital rooms from single to double occupancy, to manage family visitation, and to proactively test asymptomatic patients, family, and hospital staff will mitigate continued COVID-19 penetration through children’s hospitals.
One important limitation of the current study is the measurement of hospitals’ charges. The charge data were not positioned to comprehensively measure each hospital’s financial state during the COVID-19 pandemic. However, the decrease in hospital charges reported by the children’s hospitals in the current study is comparable with the financial losses reported for many adult hospitals during the pandemic.6,7
CONCLUSION
Children’s hospitals’ ability to serve the nation’s pediatric patients depends on the success of the hospitals’ plans to manage current and future COVID-19 surges and to reopen and recover from the surges that have passed. Additional investigation is needed to identify best operational and financial practices among children’s hospitals that have enabled them to endure the COVID-19 pandemic.
1. COVID-19: ways to prepare your children’s hospital now. Children’s Hospital Association. March 12, 2020. Accessed June 30, 2020. https://www.childrenshospitals.org/Newsroom/Childrens-Hospitals-Today/Articles/2020/03/COVID-19-11-Ways-to-Prepare-Your-Hospital-Now
2. Chopra V, Toner E, Waldhorn R, Washer L. How should U.S. hospitals prepare for coronavirus disease 2019 (COVID-19)? Ann Intern Med. 2020;172(9):621-622. https://doi.org/10.7326/m20-0907
3. Oseran AS, Nash D, Kim C, et al. Changes in hospital admissions for urgent conditions during COVID-19 pandemic. Am J Manag Care. 2020;26(8):327-328. https://doi.org/10.37765/ajmc.2020.43837
4. Coronavirus Aid, Relief, and Economic Security Act or the CARES Act. 15 USC Chapter 116 (2020). Pub L No. 116-36, 134 Stat 281. https://www.congress.gov/bill/116th-congress/house-bill/748
5. The Coronavirus Aid, Relief, and Economic Security (CARES) Act Provider Relief Fund: general information. US Department of Health & Human Services. June 25, 2020. Accessed June 30, 2020. https://www.hhs.gov/coronavirus/cares-act-provider-relief-fund/general-information/index.html
6. Hospitals and health systems face unprecedented financial pressures due to COVID-19. American Hospital Association. May 2020. Accessed July 13, 2020. https://www.aha.org/system/files/media/file/2020/05/aha-covid19-financial-impact-0520-FINAL.pdf
7. Birkmeyer J, Barnato A, Birkmeyer N, Bessler R, Skinner J. The impact of the COVID-19 pandemic on hospital admissions in the United States. Health Aff (Millwood). 2020;39(11):2010-2017. https://doi.org/10.1377/hlthaff.2020.00980
To benefit patients and the public health of their communities, children’s hospitals across the United States prepared for and responded to COVID-19 by conserving personal protective equipment, suspending noncritical in-person healthcare encounters (including outpatient visits and elective surgeries), and implementing socially distanced essential care.1,2 These measures were promptly instituted during a time of both substantial uncertainty about the pandemic’s behavior in children—including its severity and duration—and extreme variation in local and state governments’ responses to the pandemic.
Congruent with other healthcare institutions, children’s hospitals calibrated their clinical operations to the evolving nature of the pandemic, prioritizing the safety of patients and staff while striving to maintain financial viability in the setting of increased costs and decreased revenue. In some cases, children’s hospitals aided adult hospitals and health systems by admitting young and middle-aged adult patients and by centralizing all pediatric patients requiring intensive care within a region. These efforts occurred while many children’s hospitals remained the sole source of specialized pediatric care, including care for rare complex health problems.
As the COVID-19 pandemic continues, there is a critical need to assess how the initial phase of the pandemic affected healthcare encounters and related finances in children’s hospitals. Understanding these trends will position children’s hospitals to project and prepare for subsequent COVID-19 surges, as well as future related public health crises that necessitate widespread social distancing. Therefore, we compared year-over-year trends in healthcare encounters and hospital charges across US children’s hospitals before and during the COVID-19 pandemic, focusing on the beginning of COVID-19 in the United States, which was defined as February through June 2020.
METHODS
This is a retrospective analysis of 26 children’s hospitals (22 freestanding, 4 nonfreestanding) from all US regions (12 South, 7 Midwest, 5 West, 2 Northeast) contributing encounter and financial data to the PROSPECT database (Children’s Hospital Association, Lenexa, Kansas) from February 1 to June 30 in both 2019 (before COVID-19) and 2020 (during COVID-19). In response to COVID-19, hospitals participating in PROSPECT increased the efficiency of data centralization and reporting in 2020 during the period February 1 to June 30 to expedite analysis and dissemination of findings.
The main outcome measures were the percentage of change in weekly encounters (inpatient bed-days, emergency department [ED] visits, and surgeries) and inflation-adjusted charges (categorized as inpatient care and outpatient care, such as ambulatory surgery, clinics, and ED visits) before vs during COVID-19.
RESULTS
Charges that accrued from February 1 to June 30 were lower in 2020 by a median 23.6% (IQR, –28.7% to –19.1%) per children’s hospital than they were in 2019, corresponding to a median decrease of $276.3 million (IQR, $404.0-$126.0 million) in charges per hospital (Table). Forty percent of this decrease was attributable to decreased charges resulting from fewer inpatient healthcare encounters.
DISCUSSION
These findings beg the question of how well children’s hospitals are positioned to weather a recurrent surge in COVID-19. Because the severity of illness of COVID-19 has been lower to date in the pediatric vs adult populations, an increase in COVID-19-related visits to EDs and admissions to offset the decreased resource use of other pediatric healthcare problems is not anticipated. Existing hospital financial reserves as well as federal aid from the Coronavirus Aid, Relief, and Economic Security Act that helped mitigate the initial encounter and financial losses during the beginning of COVID-19 may not be readily available over time.4,5 Certainly, the findings from the current study support continued lobbying for additional state and federal funds allocated through future relief packages to children’s hospitals.
Additional approaches to financial solvency in children’s hospitals during the sustained COVID-19 pandemic include addressing surgical backlogs and sharing best practices for safe and sustained reopening of clinical operations and financial practices across institutions. Although the PROSPECT database does not contain information on the types of surgeries present within this backlog, our experiences suggest that both same-day and inpatient elective surgeries have been affected, especially lengthy procedures (eg, spinal fusion for neuromuscular scoliosis). Spread and scale of feasible and efficient solutions to reengineer and expand patient capacities and throughput for operating rooms, postanesthesia recovery areas, and intensive care and floor units are needed. Enhanced analytics that accurately predict postoperative length of hospital stay, coupled with early recovery after surgery clinical protocols, could help optimize hospital bed management. Effective ways to convert hospital rooms from single to double occupancy, to manage family visitation, and to proactively test asymptomatic patients, family, and hospital staff will mitigate continued COVID-19 penetration through children’s hospitals.
One important limitation of the current study is the measurement of hospitals’ charges. The charge data were not positioned to comprehensively measure each hospital’s financial state during the COVID-19 pandemic. However, the decrease in hospital charges reported by the children’s hospitals in the current study is comparable with the financial losses reported for many adult hospitals during the pandemic.6,7
CONCLUSION
Children’s hospitals’ ability to serve the nation’s pediatric patients depends on the success of the hospitals’ plans to manage current and future COVID-19 surges and to reopen and recover from the surges that have passed. Additional investigation is needed to identify best operational and financial practices among children’s hospitals that have enabled them to endure the COVID-19 pandemic.
1. COVID-19: ways to prepare your children’s hospital now. Children’s Hospital Association. March 12, 2020. Accessed June 30, 2020. https://www.childrenshospitals.org/Newsroom/Childrens-Hospitals-Today/Articles/2020/03/COVID-19-11-Ways-to-Prepare-Your-Hospital-Now
2. Chopra V, Toner E, Waldhorn R, Washer L. How should U.S. hospitals prepare for coronavirus disease 2019 (COVID-19)? Ann Intern Med. 2020;172(9):621-622. https://doi.org/10.7326/m20-0907
3. Oseran AS, Nash D, Kim C, et al. Changes in hospital admissions for urgent conditions during COVID-19 pandemic. Am J Manag Care. 2020;26(8):327-328. https://doi.org/10.37765/ajmc.2020.43837
4. Coronavirus Aid, Relief, and Economic Security Act or the CARES Act. 15 USC Chapter 116 (2020). Pub L No. 116-36, 134 Stat 281. https://www.congress.gov/bill/116th-congress/house-bill/748
5. The Coronavirus Aid, Relief, and Economic Security (CARES) Act Provider Relief Fund: general information. US Department of Health & Human Services. June 25, 2020. Accessed June 30, 2020. https://www.hhs.gov/coronavirus/cares-act-provider-relief-fund/general-information/index.html
6. Hospitals and health systems face unprecedented financial pressures due to COVID-19. American Hospital Association. May 2020. Accessed July 13, 2020. https://www.aha.org/system/files/media/file/2020/05/aha-covid19-financial-impact-0520-FINAL.pdf
7. Birkmeyer J, Barnato A, Birkmeyer N, Bessler R, Skinner J. The impact of the COVID-19 pandemic on hospital admissions in the United States. Health Aff (Millwood). 2020;39(11):2010-2017. https://doi.org/10.1377/hlthaff.2020.00980
© 2021 Society of Hospital Medicine
Readmissions Following Hospitalization for Infection in Children With or Without Medical Complexity
Hospitalizations for infections are common in children, with respiratory illnesses, including pneumonia and bronchiolitis, among the most prevalent indications for hospitalization.1,2 Infections are also among the most frequent indications for all-cause readmissions and for potentially preventable readmissions in children.3-5 Beyond hospital resource use, infection hospitalizations and readmissions represent a considerable cause of life disruption for patients and their families.6,7 While emerging evidence supports shortened durations of parenteral antibiotics before transitioning to oral therapy for some infections (eg, pyelonephritis, osteomyelitis),8-10 other infections may require extended treatment courses for weeks. The risk of adverse outcomes (eg, complications of medical treatment, readmission risk) and burdens placed on patients and their families may therefore differ across infection types and extend well beyond the immediate hospitalization.
Although infections are common and pediatric providers are expected to have proficiency in managing infections, substantial variation in the management of common pediatric infections exists and is associated with adverse hospitalization outcomes, including increased readmission risk and healthcare costs.11-18 Potentially avoidable resource use associated with hospital readmission from infection has led to adoption of hospital-level readmission metrics as indicators of the quality of healthcare delivery. For example, the Pediatric Quality Measures Program, established by the Children’s Health Insurance Program Reauthorization Act of 2009, has prioritized measurement of readmissions following hospitalization for lower respiratory tract infection.19 With government agencies increasingly using readmission metrics to assess quality of healthcare delivery, developing metrics that focus on these resource-intensive conditions is essential.
Because infections are a common and costly indication for hospital resource use and because substantial variation in management has been observed, promoting a broader understanding of infection-specific readmission rates is important for prioritizing readmission-reduction opportunities in children. This study’s objectives were the following: (1) to describe the prevalence and characteristics of infection hospitalizations in children and their associated readmissions and (2) to estimate the number of readmissions avoided and costs saved if all hospitals achieved the 10th percentile of the hospitals’ risk-adjusted readmission rate (ie, readmission benchmark).
METHODS
Study Design and Data Source
We performed a retrospective cohort analysis using the 2014 Agency for Healthcare Research and Quality (AHRQ) Nationwide Readmissions Database (NRD).20 The 2014 NRD is an administrative database that contains information on inpatient stays from January 1, 2014, to December 31, 2014, for all payers and allows for weighted national estimates of readmissions for all US individuals. Data within NRD are aggregated from 22 geographically diverse states representing approximately one-half of the US population. NRD contains deidentified patient-level data with unique verified patient identifiers to track individuals within and across hospitals in a state. However, AHRQ guidelines specify that NRD cannot be used for reporting hospital-specific readmission rates. Thus, for the current study, the Inpatient Essentials (Children’s Hospital Association), or IE, database was used to measure hospital-level readmission rates and to distinguish benchmark readmission rates for individual infection diagnoses.21 The IE database is composed of 90 children’s hospitals distributed throughout all regions of the United States. The inclusion of free-standing children’s hospitals and children’s hospitals within adult hospitals allows for comparisons and benchmarking across hospitals on multiple metrics, including readmissions.
Study Population
Children 0 to 17 years of age with a primary diagnosis at the index admission for infection between January 1, 2014, and November 30, 2014, were included. The end date of November 30, 2014, allowed for a full 30-day readmission window for all index admissions. We excluded index admissions that resulted in transfer to another acute care hospital or in-hospital mortality. Additionally, we excluded index admissions of children who had hematologic or immunologic conditions, malignancy, or history of bone marrow and solid-organ transplant, using the classification system for complex chronic conditions (CCCs) from Feudtner et al.22 Due to the high likelihood of immunosuppression in patients with these conditions, children may have nuanced experiences with illness severity, trajectory, and treatment associated with infection that place them at increased risk for nonpreventable readmission.
Main Exposure
The main exposure was infection type during the index admission. Condition-specific index admissions were identified using AHRQ’s Clinical Classifications Software (CCS) categories.23 CCS is a classification schema that categorizes the greater than 14,000 International Classification of Diseases, Ninth Revision, Clinical Modification (ICD-9-CM) diagnosis codes and 3,900 ICD-9-CM procedure codes into clinically meaningful categories of 295 diagnosis (including mental health codes and E-codes) and 231 procedural groupings. Twenty-two groupings indicative of infection were distinguished and used for the current study. Examples of infections included aspiration pneumonia, pneumonia, bronchiolitis, and sexually transmitted infection. We combined related CCS categories when possible for ease of interpretation and presentation of data (Appendix Table 1).
Main Outcome Measure
The main outcome measure was 30-day hospital readmission. Readmission was defined as all-cause, unplanned admission within 30 days following discharge from a preceding hospitalization. Planned hospital readmissions were identified and excluded using methods from AHRQ’s Pediatric All-Condition Readmission Measure.24 We defined a same-cause return as a return with the same CCS infection category as the index admission. Costs associated with readmissions were estimated from charges using hospital-specific cost-to-charge ratios provided with NRD.
Patient Demographic and Clinical Characteristics
Patient demographic characteristics included age at index admission (<1 year, 1-5 years, 6-9 years, 10-14 years, and 15-18 years), sex, payer (ie, government, private, other), and discharge disposition (ie, routine, home health, other). We assessed all patients for medical complexity, as defined by the presence of at least one CCC, and we reported the categories of CCCs by organ system involved.22 Otherwise, patients were identified as without medical complexity.
Statistical Analysis
We summarized continuous variables with medians and interquartile ranges and categorical variables with frequencies and percentages. To develop benchmark readmission rates for each infection type, we used generalized linear mixed models with random intercepts for each hospital in the IE database. For each infection type, the benchmark readmission rate was defined as the 10th percentile of hospitals’ risk-adjusted readmission rates. The 10th percentile was chosen to identify the best performing 10% of hospitals (ie, hospitals with the lowest readmission rates). Because children with medical complexity account for a large proportion of hospital resource use and are at high risk for readmission,4,25 we developed benchmarks stratified by presence/absence of a CCC (ie, with complexity vs without complexity). Models were adjusted for severity of illness using the Hospitalization Resource Intensity Score for Kids (H-RISK),26 a scoring system that assigns relative weights for each All Patient Refined Diagnosis-Related Group (3M Corporation) and severity of illness level, and each hospital’s risk-adjusted readmission rate was determined.
With use of weights to achieve national estimates of index admissions and readmissions, we determined the number of potentially avoidable readmissions by calculating the number of readmissions observed in the NRD that would not occur if all hospitals achieved readmission rates equal to the 10th percentile. Avoidable costs were estimated by multiplying the number of potentially avoidable readmissions by the mean cost of a readmission for infections of that type. Estimates of avoidable readmissions and costs were stratified by medical complexity. In addition to describing estimates at the 10th percentile benchmark, we similarly developed estimates of potentially avoidable readmissions and avoidable costs for the 5th and 25th percentiles, which are presented within Appendix Table 2 (children without complexity) and Appendix Table 3 (children with complexity).
All statistical analyses were performed using SAS version 9.4 (SAS Institute), and P values <.001 were considered statistically significant due to the large sample size. The Office of Research Integrity at Children’s Mercy Hospital deemed this study exempt from institutional board review.
RESULTS
Characteristics of the Study Population
The study included 380,067 index admissions for infection and an accompanying 18,469 unplanned all-cause readmissions over the 30 days following discharge (readmission rate, 4.9%; Table 1). Children ages 1 to 5 years accounted for the largest percentage (32.9%) of index hospitalizations, followed by infants younger than 1 year (30.3%). The readmission rate by age group was highest for infants younger than 1 year, compared with rates among all other age groups (5.6% among infants < 1 year vs 4.4%-4.7% for other age groups; P < .001). In the overall cohort, 16.2% of admissions included patients with a CCC. Children with medical complexity had higher readmission rates than those without medical complexity (no CCC, 3.2%; 1 CCC, 9.2%; 2+ CCCs, 18.9%). A greater percentage of children experiencing a readmission had government insurance (63.0% vs 59.2%; P < .001) and received home health nursing (10.1% vs 2.7%; P < .001) following the index encounter.

Children Without Complexity
Index Admissions and 30-day Readmissions
Among patients without medical complexity, index admissions occurred most frequently for pneumonia (n = 54,717), bronchiolitis (n = 53,959), and appendicitis (n = 45,036) (Figure 1). The median length of stay (LOS) for index admissions ranged from 1 to 5 days (Table 2), with septic arthritis and osteomyelitis having the longest median LOS at 5 (IQR, 3-7) days.

Thirty-day readmission rates varied substantially by infection at the index admission (range, 1.5% for sexually transmitted infection to 8.6% for peritonitis) (Figure 1). The median LOS for 30-day readmissions varied from 2 to 7 days (Table 2), while the median number of days to readmission varied substantially by infection type (range, 4 days for bacterial infection [site unspecified] to 24 days for sexually transmitted infections). Among the top five indications for admission for children without complexity, 14.9% to 52.8% of readmissions were for the same cause as the index admission; however, many additional returns were likely related to the index admission (Appendix Table 4). For example, among other return reasons, an additional 992 (61.7%) readmissions following appendicitis hospitalizations were for complications of surgical procedures or medical care, peritonitis, intestinal obstruction, and abdominal pain.

Impact of Achieving Readmission Benchmarks
Among children without complexity, readmission benchmarks (ie, the 10th percentile of readmission rates across hospitals) ranged from 0% to 26.7% (Figure 2). An estimated 54.7% of readmissions (n = 5,507) could potentially be reduced if hospitals achieved infection-specific benchmark readmission rates, which could result in an estimated $44.5 million in savings. Pneumonia, bronchiolitis, gastroenteritis, and upper respiratory tract infections were among conditions with the greatest potential reductions in readmissions and costs if a 10th percentile benchmark was achieved.

Children With Medical Complexity
Index Admissions and 30-day Readmissions
Among patients with complexity, index admissions occurred most frequently for pneumonia (n = 14,344), bronchiolitis (n = 8,618), and upper respiratory tract infection (n = 6,407) (Figure 1). The median LOS for index admissions ranged from 1 to 9 days (Table 2), with septicemia and CNS infections having the longest median LOS at 9 days.
Thirty-day readmission rates varied substantially by the type of infection at the index admission (range, 0% for sexually transmitted infection to 21.6% for aspiration pneumonia) (Figure 1). The median LOS for 30-day readmissions varied from 2 to 14 days (Table 2), and the median number of days to readmission varied substantially by infection type (range, 6 days for tonsillitis to 23 days for other infection). Among the top five indications for admission for medically complex children, 8% to 40.4% of readmissions were for the same cause as the index admission (Appendix Table 4). As with the children without complexity, additional returns were likely related to the index admission.
Impact of Achieving Readmission Benchmarks
Among children with medical complexity, readmission benchmarks ranged from 0% to 30.3% (Figure 2). An estimated 42.6% of readmissions (n = 3,576) could potentially be reduced if hospitals achieved infection-specific benchmark readmission rates, which could result in an estimated $70.8 million in savings. Pneumonia, bronchiolitis, septicemia, and upper respiratory tract infections were among conditions with the greatest potential reductions in readmissions and costs if the benchmarks were achieved.
DISCUSSION
The current study uncovered new findings regarding unplanned readmissions following index infection hospitalizations for children. In particular, readmission rates and time to readmission varied substantially by infection subtype. The study also identified priority infections and unique considerations for children with CCCs, all of which may help maximize the value of readmission metrics aimed at advancing hospital quality and reducing costs for infection hospitalizations in children. If all hospitals achieved the readmission rates of the best performing hospitals, 42.6% to 54.7% fewer readmissions could be realized with associated cost savings.
Nationally, studies have reported 30-day, all-cause unplanned readmission rates of 6.2% to 10.3%.5,27 In our current study we observed an overall readmission rate of 4.9% across all infectious conditions; however, readmission rates varied substantially by condition, with upper and lower respiratory tract infections, septicemia, and gastroenteritis among infections with the greatest number of potentially avoidable readmissions based on achievement of readmission benchmarks. Currently, pediatric-specific all-cause and lower respiratory tract infection readmission metrics have been developed with the aim of improving quality of care and reducing healthcare expenditures.28 Future readmission studies and metrics may prioritize conditions such as septicemia, gastroenteritis, and other respiratory tract infections. Our current study demonstrated that many readmissions following infection hospitalizations were associated with the same CCS category or within a related CCS category (eg, complications of surgical procedures or medical care, appendicitis, peritonitis, intestinal obstruction, and abdominal pain constituted the top five indications for readmission for appendicitis, whereas respiratory illnesses constituted the top five indications for readmissions for pneumonia). While this current study cannot clarify this relationship further, and the “avoidability” of unplanned readmissions is debated,29-31 our findings suggest that future investigations might focus on identifying whether condition-specific interventions during the index admission could mitigate some readmissions.
While the LOS of the index admission and the readmission were similar for most infection subtypes, we observed substantial variability in the temporal risk for readmission by infection subtype. Our observations complement studies exploring the timing of readmissions for other pediatric conditions.32-34 In particular, our findings further highlight that the composition and interaction of factors influencing infection readmissions may vary by condition. Infections represent a diverse group of conditions, with treatment courses that vary in need for parenteral antibiotics, ability to tailor treatment based on organism and susceptibilities, and length of treatment. While treatment for some infections may be accomplished, or nearly accomplished, prior to discharge, other infections (eg, osteomyelitis) may require prolonged treatment, shifting the burden of management and monitoring to patients and their families, which along with the timeliness and adequacy of outpatient follow-up, may modify an individual’s readmission risk. Consequently, a “one-size fits all” approach to discharge counseling may not be successful across all conditions. Our study lays the groundwork for how these temporal relationships may be used by clinicians to counsel families regarding the likely readmission timeframe, based on infection, and to establish follow-up appointments ahead of the infection-specific “readmission window,” which may allow outpatient providers to intervene when readmission risk is greatest.
Consistent with prior literature, children with medical complexity in our study had increased frequency of 30-day, all-cause unplanned readmissions and LOS, compared with peers who did not have complexity.5 Readmission rates following hospitalizations for aspiration pneumonia were comparable to those reported by Thompson et al in their study examining rates of pneumonia in children with neurologic impairment.35 In our current study, nearly 96% of readmissions following aspiration pneumonia hospitalizations were for children with medical complexity, and more than 58% of these readmissions were for aspiration pneumonia or respiratory illness. Future investigations should seek to explore factors contributing to readmissions in children with medical complexity and to evaluate whether interventions such as postdischarge coaching or discharge bundles could assist with reductions in healthcare resource use.36,37
Despite a lack of clear association between readmissions and quality of care for children,38 readmissions rates continue to be used as a quality measure for hospitalized patients. Within our present study, we found that achieving benchmark readmission rates for infection hospitalizations could lead to substantial reductions in readmissions; however, these reductions were seen across this relatively similar group of infection diagnoses, and hospitals may face greater challenges when attempting to achieve a 10th percentile readmission benchmark across a more expansive set of diagnoses. Despite these challenges, understanding the intricacies of readmissions may lead to improved readmission metrics and the systematic identification of avoidable readmissions, the goal of which is to enhance the quality of healthcare for hospitalized children.
Our findings should be interpreted in the context of several limitations. We defined our readmission benchmark at the 10th percentile using the IE database. Because an estimated 70% of hospitalizations for children occur within general hospitals,39 we believe that our use of the IE database allowed for increased generalizability, though the broadening of our findings to nonacademic hospital settings may be less reliable. While we describe the 10th percentile readmission benchmark here, alternative benchmarks would result in different estimates of avoidable readmissions and associated readmission costs (Appendix Tables 2 and 3). The IE and NRD databases do not distinguish intensive care use. We tried to address this limitation through model adjustments using H-RISK, which is particularly helpful for adjusting for NICU admissions through use of the 27 All Patient Refined Diagnosis-Related Groups for neonatal conditions. Additionally, the NRD uses state-level data to derive national estimates and is not equipped to measure readmissions to hospitals in a different state, distinguish patient deaths occurring after discharge, or to examine the specific indication for readmission (ie, unable to assess if the readmission is related to a complication of the treatment plan, progression of the illness course, or for an unrelated reason). While sociodemographic and socioeconomic factors may affect readmissions, the NRD does not contain information on patients’ race/ethnicity, family/social attributes, or postdischarge follow-up health services, which are known to influence the need for readmission.
Despite these limitations, this study highlights future areas for research and potential opportunities for reducing readmission following infection hospitalizations. First, identifying hospital- and systems-based factors that contribute to readmission reductions at the best-performing hospitals may identify opportunities for hospitals with the highest readmission rates to achieve the rates of the best-performing hospitals. Second, conditions such as upper and lower respiratory tract infections, along with septicemia and gastroenteritis, may serve as prime targets for future investigation based on the estimated number of avoidable readmissions and potential cost savings associated with these conditions. Finally, future investigations that explore discharge counseling and follow-up tailored to the infection-specific temporal risk and patient complexity may identify opportunities for further readmission reductions.
CONCLUSION
Our study provides a broad look at readmissions following infection hospitalizations and highlights substantial variation in readmissions based on infection type. To improve hospital resource use for infections, future preventive measures could prioritize children with complex chronic conditions and those with specific diagnoses (eg, upper and lower respiratory tract infections).
Disclaimer
This information or content and conclusions are those of the authors and should not be construed as the official position or policy of, nor should any endorsements be inferred by, NIH or the US government.
1. Keren R, Luan X, Localio R, et al; Pediatric Research in Inpatient Settings (PRIS) Network. Prioritization of comparative effectiveness research topics in hospital pediatrics. Arch Pediatr Adolesc Med. 2012;166(12):1155-1164. https://doi.org/10.1001/archpediatrics.2012.1266
2. Van Horne B, Netherton E, Helton J, Fu M, Greeley C. The scope and trends of pediatric hospitalizations in Texas, 2004-2010. Hosp Pediatr. 2015;5(7):390-398. https://doi.org/10.1542/hpeds.2014-0105
3. Neuman MI, Hall M, Gay JC, et al. Readmissions among children previously hospitalized with pneumonia. Pediatrics. 2014;134(1):100-109. https://doi.org/10.1542/peds.2014-0331
4. Gay JC, Hain PD, Grantham JA, Saville BR. Epidemiology of 15-day readmissions to a children’s hospital. Pediatrics. 2011;127(6):e1505-e1512. https://doi.org/10.1542/peds.2010-1737
5. Berry JG, Toomey SL, Zaslavsky AM, et al. Pediatric readmission prevalence and variability across hospitals. JAMA. 2013;309(4):372-380. https://doi.org/10.1001/jama.2012.188351
6. Shudy M, de Almeida ML, Ly S, et al. Impact of pediatric critical illness and injury on families: a systematic literature review. Pediatrics. 2006;118(suppl 3):S203-S218. https://doi.org/10.1542/peds.2006-0951b
7. Rennick JE, Johnston CC, Dougherty G, Platt R, Ritchie JA. Children’s psychological responses after critical illness and exposure to invasive technology. J Dev Behav Pediatr. 2002;23(3):133-144. https://doi.org/10.1097/00004703-200206000-00002
8. Michael M, Hodson EM, Craig JC, Martin S, Moyer VA. Short versus standard duration oral antibiotic therapy for acute urinary tract infection in children. Cochrane Database Syst Rev. 2003;(1):CD003966. https://doi.org/10.1002/14651858.cd003966
9. Greenberg D, Givon-Lavi N, Sadaka Y, Ben-Shimol S, Bar-Ziv J, Dagan R. Short-course antibiotic treatment for community-acquired alveolar pneumonia in ambulatory children: a double-blind, randomized, placebo-controlled trial. Pediatr Infect Dis J. 2014;33(2):136-142. https://doi.org/10.1097/inf.0000000000000023
10. Keren R, Shah SS, Srivastava R, et al; Pediatric Research in Inpatient Settings Network. Comparative effectiveness of intravenous vs oral antibiotics for postdischarge treatment of acute osteomyelitis in children. JAMA Pediatr. 2015;169(2):120-128. https://doi.org/10.1001/jamapediatrics.2014.2822
11. Markham JL, Hall M, Bettenhausen JL, Myers AL, Puls HT, McCulloh RJ. Variation in care and clinical outcomes in children hospitalized with orbital cellulitis. Hosp Pediatr. 2018;8(1):28-35. https://doi.org/10.1542/hpeds.2017-0040
12. Neubauer HC, Hall M, Wallace SS, Cruz AT, Queen MA, Foradori DM, Aronson PL, Markham JL, Nead JA, Hester GZ, McCulloh RJ, Lopez MA. Variation in diagnostic test use and associated outcomes in staphylococcal scalded skin syndrome at children’s hospitals. Hosp Pediatr. 2018;8(9):530-537. https://doi.org/10.1542/hpeds.2018-0032
13. Aronson PL, Thurm C, Alpern ER, et al; Febrile Young Infant Research Collaborative. Variation in care of the febrile young infant <90 days in US pediatric emergency departments. Pediatrics. 2014;134(4):667-677. https://doi.org/10.1542/peds.2014-1382
14. Florin TA, French B, Zorc JJ, Alpern ER, Shah SS. Variation in emergency department diagnostic testing and disposition outcomes in pneumonia. Pediatrics. 2013;132(2):237-244. https://doi.org/10.1542/peds.2013-0179
15. Brogan TV, Hall M, Williams DJ, et al. Variability in processes of care and outcomes among children hospitalized with community-acquired pneumonia. Pediatr Infect Dis J. 2012;31(10):1036-1041. https://doi.org/10.1097/inf.0b013e31825f2b10
16. Leyenaar JK, Lagu T, Shieh MS, Pekow PS, Lindenauer PK. Variation in resource utilization for the management of uncomplicated community-acquired pneumonia across community and children’s hospitals. J Pediatr. 2014;165(3):585-591. https://doi.org/10.1016/j.jpeds.2014.04.062
17. Knapp JF, Simon SD, Sharma V. Variation and trends in ED use of radiographs for asthma, bronchiolitis, and croup in children. Pediatrics. 2013;132(2):245-252. https://doi.org/10.1542/peds.2012-2830
18. Rice-Townsend S, Barnes JN, Hall M, Baxter JL, Rangel SJ. Variation in practice and resource utilization associated with the diagnosis and management of appendicitis at freestanding children’s hospitals: implications for value-based comparative analysis. Ann Surg. 2014;259(6):1228-1234. https://doi.org/10.1097/SLA.0000000000000246
19. Pediatric Quality Measures Program (PQMP). Agency for Healthcare Research and Quality. Accessed March 1, 2019. https://www.ahrq.gov/pqmp/index.html
20. NRD Database Documentation. Accessed June 1, 2019. https://www.hcup-us.ahrq.gov/db/nation/nrd/nrddbdocumentation.jsp
21. Inpatient Essentials. Children’s Hospitals Association. Accessed August 1, 2018. https://www.childrenshospitals.org/Programs-and-Services/Data-Analytics-and-Research/Pediatric-Analytic-Solutions/Inpatient-Essentials
22. Feudtner C, Feinstein JA, Zhong W, Hall M, Dai D. Pediatric complex chronic conditions classification system version 2: updated for ICD-10 and complex medical technology dependence and transplantation. BMC Pediatr. 2014;14:199. https://doi.org/10.1186/1471-2431-14-199
23. Clinical Classifications Software (CCS) for ICD-9-CM. Healthcare Cost and Utilization Project. March 2017. Accessed August 2, 2018. https://www.hcup-us.ahrq.gov/toolssoftware/ccs/ccs.jsp
24. NQF: Quality Positioning System. National Quality Forum. Accessed September 3, 2018. http://www.qualityforum.org/QPS/QPSTool.aspx
25. Berry JG, Ash AS, Cohen E, Hasan F, Feudtner C, Hall M. Contributions of children with multiple chronic conditions to pediatric hospitalizations in the United States: a retrospective cohort analysis. Hosp Pediatr. 2017;7(7):365-372. https://doi.org/10.1542/hpeds.2016-0179
26. Richardson T, Rodean J, Harris M, Berry J, Gay JC, Hall M. Development of Hospitalization Resource Intensity Scores for Kids (H-RISK) and comparison across pediatric populations. J Hosp Med. 2018;13(9):602-608. https://doi.org/10.12788/jhm.2948
27. Auger KA, Mueller EL, Weinberg SH, et al. A validated method for identifying unplanned pediatric readmission. J Pediatr. 2016;170:105-12.e122. https://doi.org/10.1016/j.jpeds.2015.11.051
28. NQF: Pediatric Measures Final Report. National Quality Forum. June 2016. Accessed January 24, 2019. https://www.qualityforum.org/Publications/2016/06/Pediatric_Measures_Final_Report.aspx
29. Hain PD, Gay JC, Berutti TW, Whitney GM, Wang W, Saville BR. Preventability of early readmissions at a children’s hospital. Pediatrics. 2013;131(1):e171-e181. https://doi.org/10.1542/peds.2012-0820
30. Toomey SL, Peltz A, Loren S, et al. Potentially preventable 30-day hospital readmissions at a children’s hospital. Pediatrics. 2016;138(2):e20154182. https://doi.org/10.1542/peds.2015-4182
31. Jonas JA, Devon EP, Ronan JC, et al. Determining preventability of pediatric readmissions using fault tree analysis. J Hosp Med. 2016;11(5):329-335. https://doi.org/10.1002/jhm.2555
32. Bucholz EM, Gay JC, Hall M, Harris M, Berry JG. Timing and causes of common pediatric readmissions. J Pediatr. 2018;200:240-248.e1. https://doi.org/10.1016/j.jpeds.2018.04.044
33. Morse RB, Hall M, Fieldston ES, et al. Children’s hospitals with shorter lengths of stay do not have higher readmission rates. J Pediatr. 2013;163(4):1034-8.e1. https://doi.org/10.1016/j.jpeds.2013.03.083
34. Kenyon CC, Melvin PR, Chiang VW, Elliott MN, Schuster MA, Berry JG. Rehospitalization for childhood asthma: timing, variation, and opportunities for intervention. J Pediatr. 2014;164(2):300-305. https://doi.org/10.1016/j.jpeds.2013.10.003
35. Thomson J, Hall M, Ambroggio L, et al. Aspiration and non-aspiration pneumonia in hospitalized children with neurologic impairment. Pediatrics. 2016;137(2):e20151612. https://doi.org/10.1542/peds.2015-1612
36. Coller RJ, Klitzner TS, Lerner CF, et al. Complex Care hospital use and postdischarge coaching: a randomized controlled trial. Pediatrics. 2018;142(2):e20174278. https://doi.org/10.1542/peds.2017-4278
37. Stephens JR, Kimple KS, Steiner MJ, Berry JG. Discharge interventions and modifiable risk factors for preventing hospital readmissions in children with medical complexity. Rev Recent Clin Trials. 2017;12(4):290-297. https://doi.org/10.2174/1574887112666170816144455
38. Bardach NS, Vittinghoff E, Asteria-Peñaloza R, et al. Measuring hospital quality using pediatric readmission and revisit rates. Pediatrics. 2013;132(3):429-436. https://doi.org/10.1542/peds.2012-3527
39. Leyenaar JK, Ralston SL, Shieh MS, Pekow PS, Mangione-Smith R, Lindenauer PK. Epidemiology of pediatric hospitalizations at general hospitals and freestanding children’s hospitals in the United States. J Hosp Med. 2016;11(11):743-749. https://doi.org/10.1002/jhm.2624
Hospitalizations for infections are common in children, with respiratory illnesses, including pneumonia and bronchiolitis, among the most prevalent indications for hospitalization.1,2 Infections are also among the most frequent indications for all-cause readmissions and for potentially preventable readmissions in children.3-5 Beyond hospital resource use, infection hospitalizations and readmissions represent a considerable cause of life disruption for patients and their families.6,7 While emerging evidence supports shortened durations of parenteral antibiotics before transitioning to oral therapy for some infections (eg, pyelonephritis, osteomyelitis),8-10 other infections may require extended treatment courses for weeks. The risk of adverse outcomes (eg, complications of medical treatment, readmission risk) and burdens placed on patients and their families may therefore differ across infection types and extend well beyond the immediate hospitalization.
Although infections are common and pediatric providers are expected to have proficiency in managing infections, substantial variation in the management of common pediatric infections exists and is associated with adverse hospitalization outcomes, including increased readmission risk and healthcare costs.11-18 Potentially avoidable resource use associated with hospital readmission from infection has led to adoption of hospital-level readmission metrics as indicators of the quality of healthcare delivery. For example, the Pediatric Quality Measures Program, established by the Children’s Health Insurance Program Reauthorization Act of 2009, has prioritized measurement of readmissions following hospitalization for lower respiratory tract infection.19 With government agencies increasingly using readmission metrics to assess quality of healthcare delivery, developing metrics that focus on these resource-intensive conditions is essential.
Because infections are a common and costly indication for hospital resource use and because substantial variation in management has been observed, promoting a broader understanding of infection-specific readmission rates is important for prioritizing readmission-reduction opportunities in children. This study’s objectives were the following: (1) to describe the prevalence and characteristics of infection hospitalizations in children and their associated readmissions and (2) to estimate the number of readmissions avoided and costs saved if all hospitals achieved the 10th percentile of the hospitals’ risk-adjusted readmission rate (ie, readmission benchmark).
METHODS
Study Design and Data Source
We performed a retrospective cohort analysis using the 2014 Agency for Healthcare Research and Quality (AHRQ) Nationwide Readmissions Database (NRD).20 The 2014 NRD is an administrative database that contains information on inpatient stays from January 1, 2014, to December 31, 2014, for all payers and allows for weighted national estimates of readmissions for all US individuals. Data within NRD are aggregated from 22 geographically diverse states representing approximately one-half of the US population. NRD contains deidentified patient-level data with unique verified patient identifiers to track individuals within and across hospitals in a state. However, AHRQ guidelines specify that NRD cannot be used for reporting hospital-specific readmission rates. Thus, for the current study, the Inpatient Essentials (Children’s Hospital Association), or IE, database was used to measure hospital-level readmission rates and to distinguish benchmark readmission rates for individual infection diagnoses.21 The IE database is composed of 90 children’s hospitals distributed throughout all regions of the United States. The inclusion of free-standing children’s hospitals and children’s hospitals within adult hospitals allows for comparisons and benchmarking across hospitals on multiple metrics, including readmissions.
Study Population
Children 0 to 17 years of age with a primary diagnosis at the index admission for infection between January 1, 2014, and November 30, 2014, were included. The end date of November 30, 2014, allowed for a full 30-day readmission window for all index admissions. We excluded index admissions that resulted in transfer to another acute care hospital or in-hospital mortality. Additionally, we excluded index admissions of children who had hematologic or immunologic conditions, malignancy, or history of bone marrow and solid-organ transplant, using the classification system for complex chronic conditions (CCCs) from Feudtner et al.22 Due to the high likelihood of immunosuppression in patients with these conditions, children may have nuanced experiences with illness severity, trajectory, and treatment associated with infection that place them at increased risk for nonpreventable readmission.
Main Exposure
The main exposure was infection type during the index admission. Condition-specific index admissions were identified using AHRQ’s Clinical Classifications Software (CCS) categories.23 CCS is a classification schema that categorizes the greater than 14,000 International Classification of Diseases, Ninth Revision, Clinical Modification (ICD-9-CM) diagnosis codes and 3,900 ICD-9-CM procedure codes into clinically meaningful categories of 295 diagnosis (including mental health codes and E-codes) and 231 procedural groupings. Twenty-two groupings indicative of infection were distinguished and used for the current study. Examples of infections included aspiration pneumonia, pneumonia, bronchiolitis, and sexually transmitted infection. We combined related CCS categories when possible for ease of interpretation and presentation of data (Appendix Table 1).
Main Outcome Measure
The main outcome measure was 30-day hospital readmission. Readmission was defined as all-cause, unplanned admission within 30 days following discharge from a preceding hospitalization. Planned hospital readmissions were identified and excluded using methods from AHRQ’s Pediatric All-Condition Readmission Measure.24 We defined a same-cause return as a return with the same CCS infection category as the index admission. Costs associated with readmissions were estimated from charges using hospital-specific cost-to-charge ratios provided with NRD.
Patient Demographic and Clinical Characteristics
Patient demographic characteristics included age at index admission (<1 year, 1-5 years, 6-9 years, 10-14 years, and 15-18 years), sex, payer (ie, government, private, other), and discharge disposition (ie, routine, home health, other). We assessed all patients for medical complexity, as defined by the presence of at least one CCC, and we reported the categories of CCCs by organ system involved.22 Otherwise, patients were identified as without medical complexity.
Statistical Analysis
We summarized continuous variables with medians and interquartile ranges and categorical variables with frequencies and percentages. To develop benchmark readmission rates for each infection type, we used generalized linear mixed models with random intercepts for each hospital in the IE database. For each infection type, the benchmark readmission rate was defined as the 10th percentile of hospitals’ risk-adjusted readmission rates. The 10th percentile was chosen to identify the best performing 10% of hospitals (ie, hospitals with the lowest readmission rates). Because children with medical complexity account for a large proportion of hospital resource use and are at high risk for readmission,4,25 we developed benchmarks stratified by presence/absence of a CCC (ie, with complexity vs without complexity). Models were adjusted for severity of illness using the Hospitalization Resource Intensity Score for Kids (H-RISK),26 a scoring system that assigns relative weights for each All Patient Refined Diagnosis-Related Group (3M Corporation) and severity of illness level, and each hospital’s risk-adjusted readmission rate was determined.
With use of weights to achieve national estimates of index admissions and readmissions, we determined the number of potentially avoidable readmissions by calculating the number of readmissions observed in the NRD that would not occur if all hospitals achieved readmission rates equal to the 10th percentile. Avoidable costs were estimated by multiplying the number of potentially avoidable readmissions by the mean cost of a readmission for infections of that type. Estimates of avoidable readmissions and costs were stratified by medical complexity. In addition to describing estimates at the 10th percentile benchmark, we similarly developed estimates of potentially avoidable readmissions and avoidable costs for the 5th and 25th percentiles, which are presented within Appendix Table 2 (children without complexity) and Appendix Table 3 (children with complexity).
All statistical analyses were performed using SAS version 9.4 (SAS Institute), and P values <.001 were considered statistically significant due to the large sample size. The Office of Research Integrity at Children’s Mercy Hospital deemed this study exempt from institutional board review.
RESULTS
Characteristics of the Study Population
The study included 380,067 index admissions for infection and an accompanying 18,469 unplanned all-cause readmissions over the 30 days following discharge (readmission rate, 4.9%; Table 1). Children ages 1 to 5 years accounted for the largest percentage (32.9%) of index hospitalizations, followed by infants younger than 1 year (30.3%). The readmission rate by age group was highest for infants younger than 1 year, compared with rates among all other age groups (5.6% among infants < 1 year vs 4.4%-4.7% for other age groups; P < .001). In the overall cohort, 16.2% of admissions included patients with a CCC. Children with medical complexity had higher readmission rates than those without medical complexity (no CCC, 3.2%; 1 CCC, 9.2%; 2+ CCCs, 18.9%). A greater percentage of children experiencing a readmission had government insurance (63.0% vs 59.2%; P < .001) and received home health nursing (10.1% vs 2.7%; P < .001) following the index encounter.
Children Without Complexity
Index Admissions and 30-day Readmissions
Among patients without medical complexity, index admissions occurred most frequently for pneumonia (n = 54,717), bronchiolitis (n = 53,959), and appendicitis (n = 45,036) (Figure 1). The median length of stay (LOS) for index admissions ranged from 1 to 5 days (Table 2), with septic arthritis and osteomyelitis having the longest median LOS at 5 (IQR, 3-7) days.
Thirty-day readmission rates varied substantially by infection at the index admission (range, 1.5% for sexually transmitted infection to 8.6% for peritonitis) (Figure 1). The median LOS for 30-day readmissions varied from 2 to 7 days (Table 2), while the median number of days to readmission varied substantially by infection type (range, 4 days for bacterial infection [site unspecified] to 24 days for sexually transmitted infections). Among the top five indications for admission for children without complexity, 14.9% to 52.8% of readmissions were for the same cause as the index admission; however, many additional returns were likely related to the index admission (Appendix Table 4). For example, among other return reasons, an additional 992 (61.7%) readmissions following appendicitis hospitalizations were for complications of surgical procedures or medical care, peritonitis, intestinal obstruction, and abdominal pain.
Impact of Achieving Readmission Benchmarks
Among children without complexity, readmission benchmarks (ie, the 10th percentile of readmission rates across hospitals) ranged from 0% to 26.7% (Figure 2). An estimated 54.7% of readmissions (n = 5,507) could potentially be reduced if hospitals achieved infection-specific benchmark readmission rates, which could result in an estimated $44.5 million in savings. Pneumonia, bronchiolitis, gastroenteritis, and upper respiratory tract infections were among conditions with the greatest potential reductions in readmissions and costs if a 10th percentile benchmark was achieved.
Children With Medical Complexity
Index Admissions and 30-day Readmissions
Among patients with complexity, index admissions occurred most frequently for pneumonia (n = 14,344), bronchiolitis (n = 8,618), and upper respiratory tract infection (n = 6,407) (Figure 1). The median LOS for index admissions ranged from 1 to 9 days (Table 2), with septicemia and CNS infections having the longest median LOS at 9 days.
Thirty-day readmission rates varied substantially by the type of infection at the index admission (range, 0% for sexually transmitted infection to 21.6% for aspiration pneumonia) (Figure 1). The median LOS for 30-day readmissions varied from 2 to 14 days (Table 2), and the median number of days to readmission varied substantially by infection type (range, 6 days for tonsillitis to 23 days for other infection). Among the top five indications for admission for medically complex children, 8% to 40.4% of readmissions were for the same cause as the index admission (Appendix Table 4). As with the children without complexity, additional returns were likely related to the index admission.
Impact of Achieving Readmission Benchmarks
Among children with medical complexity, readmission benchmarks ranged from 0% to 30.3% (Figure 2). An estimated 42.6% of readmissions (n = 3,576) could potentially be reduced if hospitals achieved infection-specific benchmark readmission rates, which could result in an estimated $70.8 million in savings. Pneumonia, bronchiolitis, septicemia, and upper respiratory tract infections were among conditions with the greatest potential reductions in readmissions and costs if the benchmarks were achieved.
DISCUSSION
The current study uncovered new findings regarding unplanned readmissions following index infection hospitalizations for children. In particular, readmission rates and time to readmission varied substantially by infection subtype. The study also identified priority infections and unique considerations for children with CCCs, all of which may help maximize the value of readmission metrics aimed at advancing hospital quality and reducing costs for infection hospitalizations in children. If all hospitals achieved the readmission rates of the best performing hospitals, 42.6% to 54.7% fewer readmissions could be realized with associated cost savings.
Nationally, studies have reported 30-day, all-cause unplanned readmission rates of 6.2% to 10.3%.5,27 In our current study we observed an overall readmission rate of 4.9% across all infectious conditions; however, readmission rates varied substantially by condition, with upper and lower respiratory tract infections, septicemia, and gastroenteritis among infections with the greatest number of potentially avoidable readmissions based on achievement of readmission benchmarks. Currently, pediatric-specific all-cause and lower respiratory tract infection readmission metrics have been developed with the aim of improving quality of care and reducing healthcare expenditures.28 Future readmission studies and metrics may prioritize conditions such as septicemia, gastroenteritis, and other respiratory tract infections. Our current study demonstrated that many readmissions following infection hospitalizations were associated with the same CCS category or within a related CCS category (eg, complications of surgical procedures or medical care, appendicitis, peritonitis, intestinal obstruction, and abdominal pain constituted the top five indications for readmission for appendicitis, whereas respiratory illnesses constituted the top five indications for readmissions for pneumonia). While this current study cannot clarify this relationship further, and the “avoidability” of unplanned readmissions is debated,29-31 our findings suggest that future investigations might focus on identifying whether condition-specific interventions during the index admission could mitigate some readmissions.
While the LOS of the index admission and the readmission were similar for most infection subtypes, we observed substantial variability in the temporal risk for readmission by infection subtype. Our observations complement studies exploring the timing of readmissions for other pediatric conditions.32-34 In particular, our findings further highlight that the composition and interaction of factors influencing infection readmissions may vary by condition. Infections represent a diverse group of conditions, with treatment courses that vary in need for parenteral antibiotics, ability to tailor treatment based on organism and susceptibilities, and length of treatment. While treatment for some infections may be accomplished, or nearly accomplished, prior to discharge, other infections (eg, osteomyelitis) may require prolonged treatment, shifting the burden of management and monitoring to patients and their families, which along with the timeliness and adequacy of outpatient follow-up, may modify an individual’s readmission risk. Consequently, a “one-size fits all” approach to discharge counseling may not be successful across all conditions. Our study lays the groundwork for how these temporal relationships may be used by clinicians to counsel families regarding the likely readmission timeframe, based on infection, and to establish follow-up appointments ahead of the infection-specific “readmission window,” which may allow outpatient providers to intervene when readmission risk is greatest.
Consistent with prior literature, children with medical complexity in our study had increased frequency of 30-day, all-cause unplanned readmissions and LOS, compared with peers who did not have complexity.5 Readmission rates following hospitalizations for aspiration pneumonia were comparable to those reported by Thompson et al in their study examining rates of pneumonia in children with neurologic impairment.35 In our current study, nearly 96% of readmissions following aspiration pneumonia hospitalizations were for children with medical complexity, and more than 58% of these readmissions were for aspiration pneumonia or respiratory illness. Future investigations should seek to explore factors contributing to readmissions in children with medical complexity and to evaluate whether interventions such as postdischarge coaching or discharge bundles could assist with reductions in healthcare resource use.36,37
Despite a lack of clear association between readmissions and quality of care for children,38 readmissions rates continue to be used as a quality measure for hospitalized patients. Within our present study, we found that achieving benchmark readmission rates for infection hospitalizations could lead to substantial reductions in readmissions; however, these reductions were seen across this relatively similar group of infection diagnoses, and hospitals may face greater challenges when attempting to achieve a 10th percentile readmission benchmark across a more expansive set of diagnoses. Despite these challenges, understanding the intricacies of readmissions may lead to improved readmission metrics and the systematic identification of avoidable readmissions, the goal of which is to enhance the quality of healthcare for hospitalized children.
Our findings should be interpreted in the context of several limitations. We defined our readmission benchmark at the 10th percentile using the IE database. Because an estimated 70% of hospitalizations for children occur within general hospitals,39 we believe that our use of the IE database allowed for increased generalizability, though the broadening of our findings to nonacademic hospital settings may be less reliable. While we describe the 10th percentile readmission benchmark here, alternative benchmarks would result in different estimates of avoidable readmissions and associated readmission costs (Appendix Tables 2 and 3). The IE and NRD databases do not distinguish intensive care use. We tried to address this limitation through model adjustments using H-RISK, which is particularly helpful for adjusting for NICU admissions through use of the 27 All Patient Refined Diagnosis-Related Groups for neonatal conditions. Additionally, the NRD uses state-level data to derive national estimates and is not equipped to measure readmissions to hospitals in a different state, distinguish patient deaths occurring after discharge, or to examine the specific indication for readmission (ie, unable to assess if the readmission is related to a complication of the treatment plan, progression of the illness course, or for an unrelated reason). While sociodemographic and socioeconomic factors may affect readmissions, the NRD does not contain information on patients’ race/ethnicity, family/social attributes, or postdischarge follow-up health services, which are known to influence the need for readmission.
Despite these limitations, this study highlights future areas for research and potential opportunities for reducing readmission following infection hospitalizations. First, identifying hospital- and systems-based factors that contribute to readmission reductions at the best-performing hospitals may identify opportunities for hospitals with the highest readmission rates to achieve the rates of the best-performing hospitals. Second, conditions such as upper and lower respiratory tract infections, along with septicemia and gastroenteritis, may serve as prime targets for future investigation based on the estimated number of avoidable readmissions and potential cost savings associated with these conditions. Finally, future investigations that explore discharge counseling and follow-up tailored to the infection-specific temporal risk and patient complexity may identify opportunities for further readmission reductions.
CONCLUSION
Our study provides a broad look at readmissions following infection hospitalizations and highlights substantial variation in readmissions based on infection type. To improve hospital resource use for infections, future preventive measures could prioritize children with complex chronic conditions and those with specific diagnoses (eg, upper and lower respiratory tract infections).
Disclaimer
This information or content and conclusions are those of the authors and should not be construed as the official position or policy of, nor should any endorsements be inferred by, NIH or the US government.
1. Keren R, Luan X, Localio R, et al; Pediatric Research in Inpatient Settings (PRIS) Network. Prioritization of comparative effectiveness research topics in hospital pediatrics. Arch Pediatr Adolesc Med. 2012;166(12):1155-1164. https://doi.org/10.1001/archpediatrics.2012.1266
2. Van Horne B, Netherton E, Helton J, Fu M, Greeley C. The scope and trends of pediatric hospitalizations in Texas, 2004-2010. Hosp Pediatr. 2015;5(7):390-398. https://doi.org/10.1542/hpeds.2014-0105
3. Neuman MI, Hall M, Gay JC, et al. Readmissions among children previously hospitalized with pneumonia. Pediatrics. 2014;134(1):100-109. https://doi.org/10.1542/peds.2014-0331
4. Gay JC, Hain PD, Grantham JA, Saville BR. Epidemiology of 15-day readmissions to a children’s hospital. Pediatrics. 2011;127(6):e1505-e1512. https://doi.org/10.1542/peds.2010-1737
5. Berry JG, Toomey SL, Zaslavsky AM, et al. Pediatric readmission prevalence and variability across hospitals. JAMA. 2013;309(4):372-380. https://doi.org/10.1001/jama.2012.188351
6. Shudy M, de Almeida ML, Ly S, et al. Impact of pediatric critical illness and injury on families: a systematic literature review. Pediatrics. 2006;118(suppl 3):S203-S218. https://doi.org/10.1542/peds.2006-0951b
7. Rennick JE, Johnston CC, Dougherty G, Platt R, Ritchie JA. Children’s psychological responses after critical illness and exposure to invasive technology. J Dev Behav Pediatr. 2002;23(3):133-144. https://doi.org/10.1097/00004703-200206000-00002
8. Michael M, Hodson EM, Craig JC, Martin S, Moyer VA. Short versus standard duration oral antibiotic therapy for acute urinary tract infection in children. Cochrane Database Syst Rev. 2003;(1):CD003966. https://doi.org/10.1002/14651858.cd003966
9. Greenberg D, Givon-Lavi N, Sadaka Y, Ben-Shimol S, Bar-Ziv J, Dagan R. Short-course antibiotic treatment for community-acquired alveolar pneumonia in ambulatory children: a double-blind, randomized, placebo-controlled trial. Pediatr Infect Dis J. 2014;33(2):136-142. https://doi.org/10.1097/inf.0000000000000023
10. Keren R, Shah SS, Srivastava R, et al; Pediatric Research in Inpatient Settings Network. Comparative effectiveness of intravenous vs oral antibiotics for postdischarge treatment of acute osteomyelitis in children. JAMA Pediatr. 2015;169(2):120-128. https://doi.org/10.1001/jamapediatrics.2014.2822
11. Markham JL, Hall M, Bettenhausen JL, Myers AL, Puls HT, McCulloh RJ. Variation in care and clinical outcomes in children hospitalized with orbital cellulitis. Hosp Pediatr. 2018;8(1):28-35. https://doi.org/10.1542/hpeds.2017-0040
12. Neubauer HC, Hall M, Wallace SS, Cruz AT, Queen MA, Foradori DM, Aronson PL, Markham JL, Nead JA, Hester GZ, McCulloh RJ, Lopez MA. Variation in diagnostic test use and associated outcomes in staphylococcal scalded skin syndrome at children’s hospitals. Hosp Pediatr. 2018;8(9):530-537. https://doi.org/10.1542/hpeds.2018-0032
13. Aronson PL, Thurm C, Alpern ER, et al; Febrile Young Infant Research Collaborative. Variation in care of the febrile young infant <90 days in US pediatric emergency departments. Pediatrics. 2014;134(4):667-677. https://doi.org/10.1542/peds.2014-1382
14. Florin TA, French B, Zorc JJ, Alpern ER, Shah SS. Variation in emergency department diagnostic testing and disposition outcomes in pneumonia. Pediatrics. 2013;132(2):237-244. https://doi.org/10.1542/peds.2013-0179
15. Brogan TV, Hall M, Williams DJ, et al. Variability in processes of care and outcomes among children hospitalized with community-acquired pneumonia. Pediatr Infect Dis J. 2012;31(10):1036-1041. https://doi.org/10.1097/inf.0b013e31825f2b10
16. Leyenaar JK, Lagu T, Shieh MS, Pekow PS, Lindenauer PK. Variation in resource utilization for the management of uncomplicated community-acquired pneumonia across community and children’s hospitals. J Pediatr. 2014;165(3):585-591. https://doi.org/10.1016/j.jpeds.2014.04.062
17. Knapp JF, Simon SD, Sharma V. Variation and trends in ED use of radiographs for asthma, bronchiolitis, and croup in children. Pediatrics. 2013;132(2):245-252. https://doi.org/10.1542/peds.2012-2830
18. Rice-Townsend S, Barnes JN, Hall M, Baxter JL, Rangel SJ. Variation in practice and resource utilization associated with the diagnosis and management of appendicitis at freestanding children’s hospitals: implications for value-based comparative analysis. Ann Surg. 2014;259(6):1228-1234. https://doi.org/10.1097/SLA.0000000000000246
19. Pediatric Quality Measures Program (PQMP). Agency for Healthcare Research and Quality. Accessed March 1, 2019. https://www.ahrq.gov/pqmp/index.html
20. NRD Database Documentation. Accessed June 1, 2019. https://www.hcup-us.ahrq.gov/db/nation/nrd/nrddbdocumentation.jsp
21. Inpatient Essentials. Children’s Hospitals Association. Accessed August 1, 2018. https://www.childrenshospitals.org/Programs-and-Services/Data-Analytics-and-Research/Pediatric-Analytic-Solutions/Inpatient-Essentials
22. Feudtner C, Feinstein JA, Zhong W, Hall M, Dai D. Pediatric complex chronic conditions classification system version 2: updated for ICD-10 and complex medical technology dependence and transplantation. BMC Pediatr. 2014;14:199. https://doi.org/10.1186/1471-2431-14-199
23. Clinical Classifications Software (CCS) for ICD-9-CM. Healthcare Cost and Utilization Project. March 2017. Accessed August 2, 2018. https://www.hcup-us.ahrq.gov/toolssoftware/ccs/ccs.jsp
24. NQF: Quality Positioning System. National Quality Forum. Accessed September 3, 2018. http://www.qualityforum.org/QPS/QPSTool.aspx
25. Berry JG, Ash AS, Cohen E, Hasan F, Feudtner C, Hall M. Contributions of children with multiple chronic conditions to pediatric hospitalizations in the United States: a retrospective cohort analysis. Hosp Pediatr. 2017;7(7):365-372. https://doi.org/10.1542/hpeds.2016-0179
26. Richardson T, Rodean J, Harris M, Berry J, Gay JC, Hall M. Development of Hospitalization Resource Intensity Scores for Kids (H-RISK) and comparison across pediatric populations. J Hosp Med. 2018;13(9):602-608. https://doi.org/10.12788/jhm.2948
27. Auger KA, Mueller EL, Weinberg SH, et al. A validated method for identifying unplanned pediatric readmission. J Pediatr. 2016;170:105-12.e122. https://doi.org/10.1016/j.jpeds.2015.11.051
28. NQF: Pediatric Measures Final Report. National Quality Forum. June 2016. Accessed January 24, 2019. https://www.qualityforum.org/Publications/2016/06/Pediatric_Measures_Final_Report.aspx
29. Hain PD, Gay JC, Berutti TW, Whitney GM, Wang W, Saville BR. Preventability of early readmissions at a children’s hospital. Pediatrics. 2013;131(1):e171-e181. https://doi.org/10.1542/peds.2012-0820
30. Toomey SL, Peltz A, Loren S, et al. Potentially preventable 30-day hospital readmissions at a children’s hospital. Pediatrics. 2016;138(2):e20154182. https://doi.org/10.1542/peds.2015-4182
31. Jonas JA, Devon EP, Ronan JC, et al. Determining preventability of pediatric readmissions using fault tree analysis. J Hosp Med. 2016;11(5):329-335. https://doi.org/10.1002/jhm.2555
32. Bucholz EM, Gay JC, Hall M, Harris M, Berry JG. Timing and causes of common pediatric readmissions. J Pediatr. 2018;200:240-248.e1. https://doi.org/10.1016/j.jpeds.2018.04.044
33. Morse RB, Hall M, Fieldston ES, et al. Children’s hospitals with shorter lengths of stay do not have higher readmission rates. J Pediatr. 2013;163(4):1034-8.e1. https://doi.org/10.1016/j.jpeds.2013.03.083
34. Kenyon CC, Melvin PR, Chiang VW, Elliott MN, Schuster MA, Berry JG. Rehospitalization for childhood asthma: timing, variation, and opportunities for intervention. J Pediatr. 2014;164(2):300-305. https://doi.org/10.1016/j.jpeds.2013.10.003
35. Thomson J, Hall M, Ambroggio L, et al. Aspiration and non-aspiration pneumonia in hospitalized children with neurologic impairment. Pediatrics. 2016;137(2):e20151612. https://doi.org/10.1542/peds.2015-1612
36. Coller RJ, Klitzner TS, Lerner CF, et al. Complex Care hospital use and postdischarge coaching: a randomized controlled trial. Pediatrics. 2018;142(2):e20174278. https://doi.org/10.1542/peds.2017-4278
37. Stephens JR, Kimple KS, Steiner MJ, Berry JG. Discharge interventions and modifiable risk factors for preventing hospital readmissions in children with medical complexity. Rev Recent Clin Trials. 2017;12(4):290-297. https://doi.org/10.2174/1574887112666170816144455
38. Bardach NS, Vittinghoff E, Asteria-Peñaloza R, et al. Measuring hospital quality using pediatric readmission and revisit rates. Pediatrics. 2013;132(3):429-436. https://doi.org/10.1542/peds.2012-3527
39. Leyenaar JK, Ralston SL, Shieh MS, Pekow PS, Mangione-Smith R, Lindenauer PK. Epidemiology of pediatric hospitalizations at general hospitals and freestanding children’s hospitals in the United States. J Hosp Med. 2016;11(11):743-749. https://doi.org/10.1002/jhm.2624
© 2021 Society of Hospital Medicine
Antibiotics for Aspiration Pneumonia in Neurologically Impaired Children
Neurologic impairment (NI) encompasses static and progressive diseases of the central and/or peripheral nervous systems that result in functional and intellectual impairments.1 While a variety of neurologic diseases are responsible for NI (eg, hypoxic-ischemic encephalopathy, muscular dystrophy), consequences of these diseases extend beyond neurologic manifestations.1 These children are at an increased risk for aspiration of oral and gastric contents given their common comorbidities of dysphagia, gastroesophageal reflux, impaired cough, and respiratory muscle weakness.2 While aspiration may manifest as a self-resolving pneumonitis, the presence of oral or enteric bacteria in aspirated material may result in the development of bacterial pneumonia. Children with NI hospitalized with aspiration pneumonia have higher complication rates, longer and costlier hospitalizations, and higher readmission rates when compared with children with nonaspiration pneumonia.3
While pediatric aspiration pneumonia is commonly attributed to anaerobic bacteria, this is largely based on extrapolation from epidemiologic studies that were conducted in past decades.4-8 A single randomized controlled trial found that penicillin and clindamycin, antimicrobials with similar antimicrobial activity against anaerobes, to be equally effective.9 However, the recent literature emphasizes the polymicrobial nature of aspiration pneumonia in adults, with the common isolation of Gram-negative enteric bacteria.10 Further, while Pseudomonas aeruginosa is often identified in respiratory cultures from children with NI and chronic respiratory insufficiency,11,12 the significance of P. aeruginosa in lower airways remains unclear.
We designed this study to compare hospital outcomes associated with the most commonly prescribed empiric antimicrobial therapies for aspiration pneumonia in children with NI.
MATERIALS AND METHODS
Study Design and Data Source
This multicenter, retrospective cohort study used the Pediatric Health Information System (PHIS) database. PHIS, an administrative database of 50 not-for-profit tertiary care pediatric hospitals, contains data regarding patient demographics, diagnoses and procedures, and daily billed resource utilization, including laboratory and imaging studies. Data quality and reliability are assured through the Children’s Hospital Association (CHA; Lenexa, Kansas) and participating hospitals. Due to incomplete data through the study period and data quality issues, six hospitals were excluded.
STUDY POPULATION
Inclusion Criteria
Children 1-18 years of age who were discharged between July 1, 2007 and June 30, 2015 were included if they had a NI diagnosis,1 a principal diagnosis indicative of aspiration pneumonia (507.x),3,13,14 and received antibiotics in the first two calendar days of admission. NI was determined using previously defined International Classification of Diseases, Ninth Revision-Clinical Modification (ICD-9-CM) diagnosis codes.1 We only included children who received antibiotics in the first two calendar days of admission to minimize the likelihood of including children admitted for other reasons who acquired aspiration pneumonia after hospitalization. For children with multiple hospitalizations, one admission was randomly selected for inclusion to minimize weighting results toward repeat visits.
Exclusion Criteria
Children transferred from another hospital were excluded as records from their initial presentation, including treatment and outcomes, were not available. We also excluded children with tracheostomy15,16 or chronic ventilator dependence,17 those with a diagnosis of human immunodeficiency virus or tuberculosis, and children who received chemotherapy during hospitalization given expected differences in etiology, treatment, and outcomes.18
Exposure
The primary exposure was antibiotic therapy received in the first two days of admission. Antibiotics were classified by their antimicrobial spectra of activity as defined by The Sanford Guide to Antimicrobial Therapy19 against the most commonly recognized pathogens of aspiration pneumonia: anaerobes, Gram-negatives, and P. aeruginosa (Appendix Table 1).10,20 For example, penicillin G and clindamycin were among the antibiotics classified as providing anaerobic coverage alone, whereas ceftriaxone was classified as providing Gram-negative coverage alone and ampicillin-sulbactam or as combination therapy with clindamycin and ceftriaxone were classified as providing anaerobic and Gram-negative coverage. Piperacillin-tazobactam and meropenem were classified as providing anaerobic, Gram-negative, and P. aeruginosa coverage. We excluded antibiotics that do not provide coverage against anaerobes, Gram-negative, or P. aeruginosa (eg, ampicillin, azithromycin) or that provide coverage against Gram-negative and P. aeruginosa, but not anaerobes (eg, cefepime, tobramycin), as these therapies were prescribed for <5% of the cohort. We chose not to examine the coverage for Streptococcus pneumonia or Staphylococcus aureus as antibiotics included in this analysis covered these bacteria for 99.9% of our cohort.
OUTCOMES
Outcomes included acute respiratory failure during hospitalization, intensive care unit (ICU) transfer, and hospital length of stay (LOS). Acute respiratory failure during hospitalization was defined as the presence of Clinical Transaction Classification (CTC) or ICD-9 procedure code for noninvasive or invasive mechanical ventilation on day two or later of hospitalization, with or without the need for respiratory support on day 0 or day 1 (Appendix Table 2). Given the variability in hospital policies that may drive ICU admission criteria for complex patients, our outcome of ICU transfer was defined as the requirement for ICU level care on day two or later of hospitalization without ICU admission. Acute respiratory failure and ICU care occurring within the first two hospital days were not classified as outcomes because these early events likely reflect illness severity at presentation rather than outcomes attributable to treatment failure; these were included as markers of severity in the models.
Patient Demographics and Clinical Characteristics
Demographic and clinical characteristics that might influence antibiotic choice and/or hospital outcomes were assessed. Clinical characteristics included complex chronic conditions,21-23 medical technology assistance,24 performance of diagnostic testing, and markers of severe illness on presentation. Diagnostic testing included bacterial cultures (blood, respiratory, urine) and chest radiograph performance in the first two days of hospitalization. Results of diagnostic testing are not available in the PHIS. Illness severity on presentation included acute respiratory failure, pleural drainage, receipt of vasoactive agents, and transfusion of blood products in the first two days of hospitalization (Appendix Table 2).17,25,26
STASTICAL ANALYSIS
Continuous data were described with median and interquartile ranges (IQR) due to nonnormal distribution. Categorical data were described with frequencies and percentages. Patient demographics, clinical characteristics, and hospital outcomes were stratified by empiric antimicrobial coverage and compared using chi-square and Kruskal–Wallis tests as appropriate.
Generalized linear mixed-effects models with random hospital intercepts were derived to assess the independent effect of antimicrobial spectra of activity on outcomes of acute respiratory failure, ICU transfer, and LOS while adjusting for important differences in demographic and clinical characteristics. LOS had a nonnormal distribution. Thus, we used an exponential distribution. Covariates were chosen a priori given the clinical and biological relevance to exposure and outcomes—age, presence of complex chronic condition diagnoses, the number of complex chronic conditions, technology dependence, the performance of diagnostic tests on presentation, and illness severity on presentation. ICU admission was included as a covariate in acute respiratory failure and LOS outcome models. The results of the model for acute respiratory failure and ICU transfer are presented as adjusted odds ratios (OR) with a 95% CI. LOS results are presented as adjusted rate ratios (RR) with 95% CI.
All analyses were performed with SAS 9.3 (SAS Institute, Cary, North Carolina). P values <.05 were considered statistically significant. Cincinnati Children’s Hospital Medical Center Institutional Review Board considered this deidentified dataset study as not human subjects research.
RESULTS
Study Cohort
At the 44 hospitals included, 4,812 children with NI hospitalized with the diagnosis of aspiration pneumonia met the eligibility criteria. However, 79 received antibiotics with the spectra of activity not examined, leaving 4,733 children in our final analysis (Appendix Figure). Demographic and clinical characteristics of the study cohort are shown in Table 1. Median age was five years (interquartile range [IQR]: 2-11 years). Most subjects were male (53.9%), non-Hispanic white (47.9%), and publicly insured (63.6%). There was a slight variation in the distribution of admissions across seasons (spring 31.6%, summer 19.2%, fall 21.3%, and winter 27.9%). One-third of children had four or more comorbid CCCs (complex chronic conditions; 34.2%). The three most common nonneurologic CCC diagnosis categories were gastrointestinal (63.1%), congenital and/or genetic defects (36.9%), and respiratory (8.9%). Assistance with medical technologies was also common (82%)—particularly gastrointestinal (63.1%) and neurologic/neuromuscular (9.8%) technologies. The vast majority of children (92.5%) had either a chest radiograph (90.5%), respiratory viral study (33.7%), or respiratory culture (10.0%) obtained on presentation. A minority required noninvasive or invasive respiratory support (25.4%), vasoactive agents (8.9%), blood products (1.2%), or pleural drainage (0.3%) in the first two hospital days.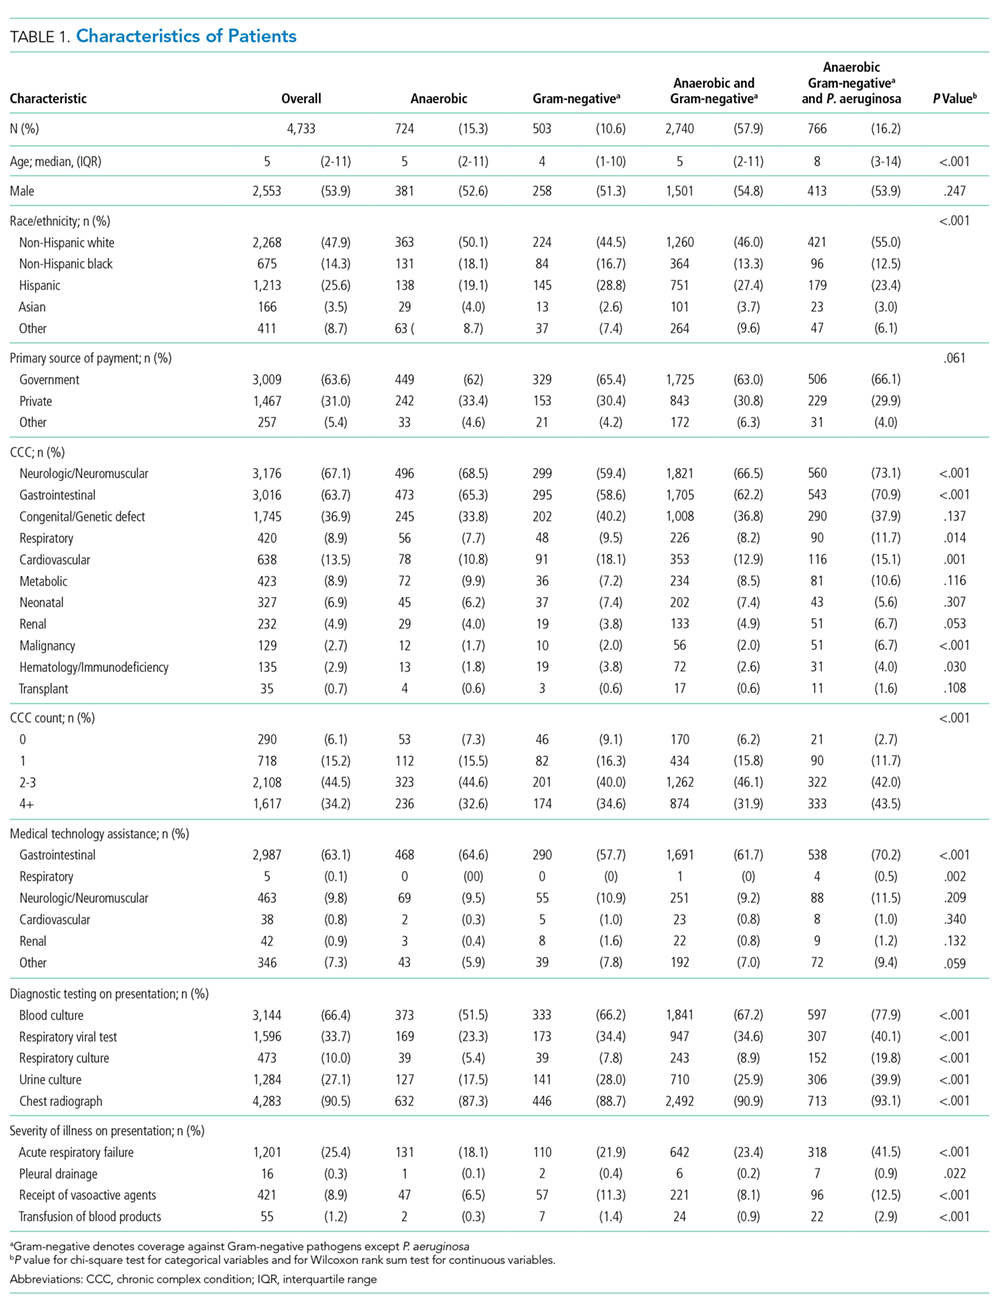
Spectrum of Antimicrobial Coverage
Most children (57.9%) received anaerobic and Gram-negative coverage; 16.2% received anaerobic, Gram-negative and P. aeruginosa coverage; 15.3% received anaerobic coverage alone; and 10.6% received Gram-negative coverage alone. Empiric antimicrobial coverage varied substantially across hospitals: anaerobic coverage was prescribed for 0%-44% of patients; Gram-negative coverage was prescribed for 3%-26% of patients; anaerobic and Gram-negative coverage was prescribed for 25%-90% of patients; and anaerobic, Gram-negative, and P. aeruginosa coverage was prescribed for 0%-65% of patients (Figure 1).
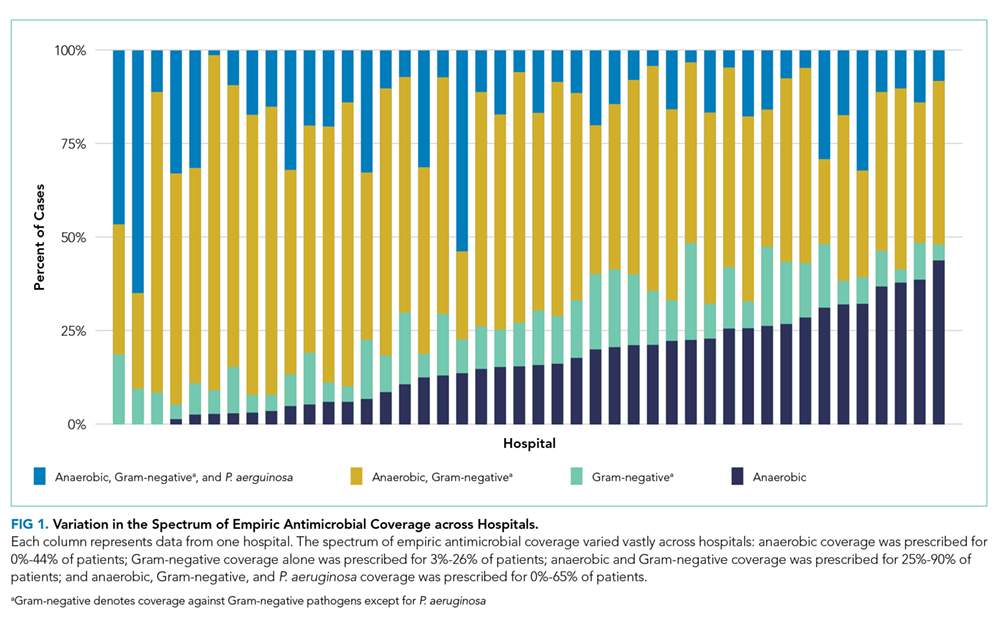
Outcomes
Acute Respiratory Failure
One-quarter (25.4%) of patients had acute respiratory failure on presentation; 22.5% required respiratory support (continued from presentation or were new) on day two or later of hospitalization (Table 2). In the adjusted analysis, children receiving Gram-negative coverage alone had two-fold greater odds (OR 2.15, 95% CI: 1.41-3.27) and children receiving anaerobic and Gram-negative coverage had 1.6-fold greater odds (OR 1.65, 95% CI: 1.19-2.28), of respiratory failure during hospitalization compared with those receiving anaerobic coverage alone (Figure 2). Odds of respiratory failure during hospitalization did not significantly differ for children receiving anaerobic, Gram-negative, and P. aeruginosa coverage compared with those receiving anaerobic coverage alone.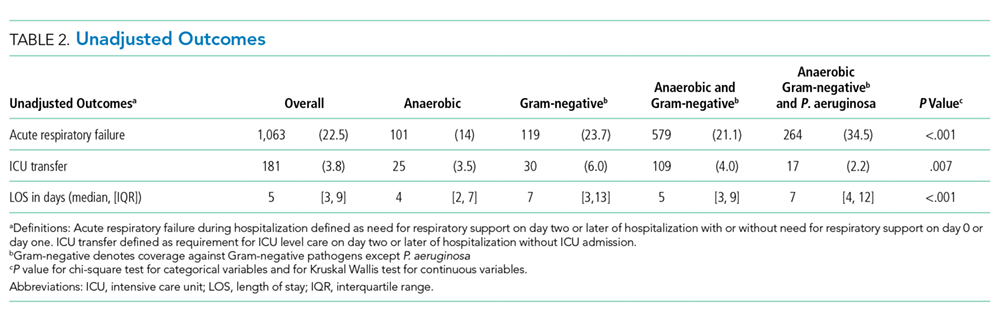
ICU Transfer
Nearly thirty percent (29.0%) of children required ICU admission, with an additional 3.8% requiring ICU transfer following admission (Table 2). In the multivariable analysis, the odds of an ICU transfer were greater for children receiving Gram-negative coverage alone (OR 1.80, 95% CI: 1.03-3.14) compared with those receiving anaerobic coverage alone. There was no statistical difference in ICU transfer for those receiving anaerobic and Gram-negative coverage (with or without P. aeruginosa coverage) compared with those receiving anaerobic coverage alone (Figure 2).
Length of Stay
Median hospital LOS for the total cohort was five days (IQR: 3-9 days; Table 2). In the multivariable analysis, children receiving Gram-negative coverage alone had a longer LOS (RR 1.28; 95% CI: 1.16-1.41) compared with those receiving anaerobic coverage alone, whereas children receiving anaerobic, Gram-negative, and P. aeruginosa coverage had a shorter LOS (RR 0.83; 95% CI: 0.76-0.90) than those receiving anaerobic coverage alone (Figure 2). There was no statistical difference in the LOS between children receiving anaerobic and Gram-negative coverage and those receiving anaerobic coverage alone.
DISCUSSION
In this multicenter study of children with NI hospitalized with aspiration pneumonia, we found substantial variation in empiric antimicrobial coverage for children with aspiration pneumonia. When comparing outcomes across groups, children who received anaerobic and Gram-negative coverage had outcomes similar to children who received anaerobic therapy alone. However, children who did not receive anaerobic coverage (ie, Gram-negative coverage alone) had worse outcomes, most notably a greater than two-fold increase in the odds of experiencing acute respiratory failure during hospitalization when compared with children receiving anaerobic therapy. These findings support prior literature that has highlighted the importance of anaerobic therapy in the treatment of aspiration pneumonia. The benefit of antibiotics targeting Gram-negative organisms, in addition to anaerobes, remains uncertain.
The variability in empiric antimicrobial coverage likely reflects the paucity of available information on oral and/or enteric bacteria required to identify them as causative organisms in aspiration pneumonia. In part, this problem is due to the difficulty in obtaining adequate sputum for culture from pediatric patients.27 While it may be more feasible to obtain tracheal aspirates for respiratory culture in children with a tracheostomy, interpretation of culture results remains challenging because the lower airways of children with tracheostomy are commonly colonized with bacterial pathogens.28 Thus, physicians are often left to choose empiric antimicrobial coverage with inadequate supporting evidence.29 Although the polymicrobial nature of aspiration pneumonia is well recognized in adult and pediatric literature,10,30 it is less clear which organisms are of pathological significance and require treatment.
The treatment standard for aspiration pneumonia has long included anaerobic therapy.29 The worse outcomes of children not receiving anaerobic therapy (ie, Gram-negative coverage alone) compared with children who received anaerobic therapy support the continued importance of anaerobic therapy in the treatment of aspiration pneumonia for hospitalized children with NI. The role of antibiotics covering Gram-negative organisms is less clear. Recent studies suggest the role of anaerobes is overemphasized in the etiology and treatment of aspiration pneumonia.10,29,31-38 Multiple studies on aspiration pneumonia bacteriology in hospitalized adults have demonstrated a predominance of Gram-negative organisms (ranging from 37%-71% of isolates identified on respiratory culture) and a relative scarcity of anaerobes (ranging from 0%-16% of isolates).31-37 A prospective study of 50 children hospitalized with clinical and radiographic evidence of pneumonia with known aspiration risk (eg, neuromuscular disease or dysphagia) found that ~80% of 163 bacterial isolates were Gram-negative.38 However, this study included repeat cultures from the same children, and thus, may overestimate the prevalence of Gram-negative organisms. In our study, children who received both anaerobic and Gram-negative therapy had no differences in ICU transfer or LOS but did experience higher odds of acute respiratory failure. As these results may be due to unmeasured confounding, future studies should further explore the necessity of Gram-negative coverage in addition to anaerobic coverage in this population.
While these recent studies may seem to suggest that anaerobic coverage is not necessary for aspiration pneumonia, there are important limitations worth noting. First, these studies used a variety of sampling techniques. While organisms grown from samples obtained via bronchoalveolar lavage31-34,36 are likely pathogenic, those grown from tracheal or oral samples obtained via percutaneous transtracheal aspiration,34 a protected specimen brush,34,36,37 or expectorated sputum35,38 may not represent lower airway organisms. Second, anaerobic cultures were not obtained in all studies.31,34,38 Anaerobic organisms are difficult to isolate using traditional clinical specimen collection techniques and aerobic culture media.18 Furthermore, anaerobes are not easily recovered from lung infections after the receipt of antibiotic therapy.39 Details regarding pretreatment, which are largely lacking from these studies, are necessary to interpret the relative scarcity of anaerobes on respiratory culture. Finally, caution should be taken when extrapolating the results of studies focused on the etiology and treatment of aspiration pneumonia in elderly adults to children. Our results, particularly in the context of the limitation of these more recent studies, suggest that the role of anaerobes has been underestimated.
Recent studies examining populations of children with cerebral palsy and/or tracheostomy have emphasized the high rates of carriage and infection rates with Gram-negative and drug-resistant bacteria; in particular, P. aeruginosa accounts for 50%-72% of pathogenic bacteria.11,12,38,40
Our multicenter observational study has several limitations. We used diagnosis codes to identify patients with aspiration pneumonia. As validated clinical criteria for the diagnosis of aspiration pneumonia do not exist, clinicians may assign a diagnosis of and treatment for aspiration pneumonia by subjective suspicion based on a child’s severe NI or illness severity on presentation leading to selection bias. Although administrative data are not able to verify pneumonia type with absolute certainty, we previously demonstrated that the differences in the outcomes of children with aspiration and nonaspiration pneumonia diagnosis codes persist after accounting for the complexity that might influence the diagnosis.3
Frthermore, we were unable to account for laboratory, microbiology, or radiology test results, and other management practices (eg, frequency of airway clearance, previous antimicrobial therapy) that may influence outcomes. Future studies should certainly include an examination of the concordance of the antibiotics prescribed with causative organisms, as this undoubtedly affects patient outcomes. Other outcomes are important to examine (eg, time to return to respiratory baseline), but we were unable to do so, given the lack of clinical detail in our database. We randomly selected a single hospitalization for children with multiple admissions; alternative methods could have different results. Although children with NI predominately use children’s hospitals,1 results may not be generalizable.
CONCLUSION
These findings support prior literature that has highlighted the important role anaerobic therapy plays in the treatment of aspiration pneumonia in children with NI. In light of the limitations of our study design, we believe that rigorous clinical trials comparing anaerobic with anaerobic and Gram-negative therapy are an important and necessary next step to determine the optimal treatment for aspiration pneumonia in this population.
Disclosures
The authors do not have any financial relationships relevant to this article to disclose.
Funding
Dr. Thomson was supported by the Agency for Healthcare Research and Quality (AHRQ) under award number K08HS025138. Dr. Ambroggio was supported by the National Institute for Allergy and Infectious Diseases (NIAID) under award number K01AI125413. The content is solely the responsibility of the authors and does not necessarily represent the official views of the AHRQ or NIAID.
1. Berry JG, Poduri A, Bonkowsky JL, et al. Trends in resource utilization by children with neurological impairment in the United States inpatient health care system: a repeat cross-sectional study. PLoS Med. 2012;9(1):e1001158. https://doi.org/10.1371/journal.pmed.1001158.
2. Seddon PC, Khan Y. Respiratory problems in children with neurological impairment. Arch Dis Child. 2003;88(1):75-78. https://doi.org/10.1136/adc.88.1.75.
3. Thomson J, Hall M, Ambroggio L, et al. Aspiration and non-aspiration pneumonia in hospitalized children with neurologic impairment. Pediatrics. 2016;137(2):e20151612. https://doi.org/10.1542/peds.2015-1612.
4. Brook I. Anaerobic pulmonary infections in children. Pediatr Emerg Care. 2004;20(9):636-640. https://doi.org/10.1097/01.pec.0000139751.63624.0b.
5. Bartlett JG, Gorbach SL. Treatment of aspiration pneumonia and primary lung abscess. Penicillin G vs clindamycin. JAMA. 1975;234(9):935-937. https://doi.org/10.1001/jamadermatol.2017.0297.
6. Bartlett JG, Gorbach SL, Finegold SM. The bacteriology of aspiration pneumonia. Am J Med. 1974;56(2):202-207. https://doi.org/10.1016/0002-9343(74)90598-1.
7. Lode H. Microbiological and clinical aspects of aspiration pneumonia. J Antimicrob Chemother. 1988;21:83-90. https://doi.org/10.1093/jac/21.suppl_c.83.
8. Brook I. Treatment of aspiration or tracheostomy-associated pneumonia in neurologically impaired children: effect of antimicrobials effective against anaerobic bacteria. Int J Pediatr Otorhinolaryngol. 1996;35(2):171-177. https://doi.org/10.1016/0165-5876(96)01332-8.
9. Jacobson SJ, Griffiths K, Diamond S, et al. A randomized controlled trial of penicillin vs clindamycin for the treatment of aspiration pneumonia in children. Arch Pediatr Adolesc Med. 1997;151(7):701-704. https://doi.org/10.1001/archpedi.1997.02170440063011.
10. DiBardino DM, Wunderink RG. Aspiration pneumonia: a review of modern trends. J Crit Care. 2015;30(1):40-48. https://doi.org/10.1016/j.jcrc.2014.07.011.
11. Gerdung CA, Tsang A, Yasseen AS, 3rd, Armstrong K, McMillan HJ, Kovesi T. Association between chronic aspiration and chronic airway infection with Pseudomonas aeruginosa and other Gram-negative bacteria in children with cerebral palsy. Lung. 2016;194(2):307-314. https://doi.org/10.1007/s00408-016-9856-5.
12. Thorburn K, Jardine M, Taylor N, Reilly N, Sarginson RE, van Saene HK. Antibiotic-resistant bacteria and infection in children with cerebral palsy requiring mechanical ventilation. Pedr Crit Care Med. 2009;10(2):222-226. https://doi.org/10.1097/PCC.0b013e31819368ac.
13. Lanspa MJ, Jones BE, Brown SM, Dean NC. Mortality, morbidity, and disease severity of patients with aspiration pneumonia. J Hosp Med. 2013;8(2):83-90. https://doi.org/10.1002/jhm.1996.
14. Lanspa MJ, Peyrani P, Wiemken T, Wilson EL, Ramirez JA, Dean NC. Characteristics associated with clinician diagnosis of aspiration pneumonia: a descriptive study of afflicted patients and their outcomes. J Hosp Med. 2015;10(2):90-96. https://doi.org/10.1002/jhm.2280.
15. Berry JG, Graham RJ, Roberson DW, et al. Patient characteristics associated with in-hospital mortality in children following tracheotomy. Arch Dis Child. 2010;95(9):703-710.
16. Berry JG, Graham DA, Graham RJ, et al. Predictors of clinical outcomes and hospital resource use of children after tracheotomy. Pediatrics. 2009;124(2):563-572. https://doi.org/10.1136/adc.2009.180836.
17. Balamuth F, Weiss SL, Hall M, et al. Identifying pediatric severe sepsis and septic shock: Accuracy of diagnosis codes. J Pediatr. 2015;167(6):1295-1300 e1294. https://doi.org/10.1016/j.jpeds.2015.09.027.
18. American Academy of Pediatrics., Pickering LK, American Academy of Pediatrics. Committee on Infectious Diseases. In: Red book : 2012 report of the Committee on Infectious Diseases. 29th ed. Elk Grove Village: American Academy of Pediatrics; 2012.
19. Gilbert DN. The Sanford Guide to Antimicrobial Therapy 2014. 44th ed. Sperryville: Antimicrobial Therapy, Inc; 2011.
20. Marik PE. Aspiration pneumonitis and aspiration pneumonia. N Engl J Med. 2001;344(9):665-671. https://doi.org/10.1056/NEJM200103013440908.
21. Feudtner C, Feinstein JA, Zhong W, Hall M, Dai D. Pediatric complex chronic conditions classification system version 2: updated for ICD-10 and complex medical technology dependence and transplantation. BMC Pediatrics. 2014;14:199. https://doi.org/10.1186/1471-2431-14-199.
22. Feudtner C, Hays RM, Haynes G, Geyer JR, Neff JM, Koepsell TD. Deaths attributed to pediatric complex chronic conditions: national trends and implications for supportive care services. Pediatrics. 2001;107(6):E99. https://doi.org/10.1542/peds.107.6.e99.
23. Feinstein JA, Russell S, DeWitt PE, Feudtner C, Dai D, Bennett TD. R package for pediatric complex chronic condition classification. JAMA Pediatr. 2018;172(6):596-598. https://doi.org/10.1001/jamapediatrics.2018.0256.
24. Berry JG, Hall DE, Kuo DZ, Cohen E, Agrawal R, Feudtner C, Hall M, Kueser J, Kaplan W, Neff J. Hospital utilization and characteristics of patients experiencing recurrent readmissions within children’s hospitals. JAMA. 2011;305(7):682-690. https://doi.org/10.1001/jama.2011.122.
25. Shah SS, Hall M, Newland JG, et al. Comparative effectiveness of pleural drainage procedures for the treatment of complicated pneumonia in childhood. J Hosp Med. 2011;6(5):256-263. https://doi.org/10.1002/jhm.872.
26. Child Health Corporation of America. CTC™ 2010 Code Structure: Module 5 Clinical Services. 2010 January 4; Available at https://sharepoint.chca.com/CHCAForums/PerformanceImprovement/PHIS/Reference Library/CTC Resources/Forms/AllItems.aspx Version: Modified.
27. Bradley JS, Byington CL, Shah SS, et al. The management of community-acquired pneumonia in infants and children older than 3 months of age: clinical practice guidelines by the Pediatric Infectious Diseases Society and the Infectious Diseases Society of America. Clin Infect Dis. 2011;53(7):e25-76. https://doi.org/10.1093/cid/cir531.
28. Brook I. Bacterial colonization, tracheobronchitis, and pneumonia following tracheostomy and long-term intubation in pediatric patients. Chest. 1979;76(4):420-424.
29. Waybright RA, Coolidge W, Johnson TJ. Treatment of clinical aspiration: a reappraisal. Am J Health Syst Pharm. 2013;70(15):1291-1300. https://doi.org/10.2146/ajhp120319.
30. Brook I, Finegold SM. Bacteriology of aspiration pneumonia in children. Pediatrics. 1980;65(6):1115-1120.
31. Wei C, Cheng Z, Zhang L, Yang J. Microbiology and prognostic factors of hospital- and community-acquired aspiration pneumonia in respiratory intensive care unit. Am J Infect Control. 2013;41(10):880-884. https://doi.org/10.1016/j.ajic.2013.01.007.
32. El-Solh AA, Pietrantoni C, Bhat A, et al. Microbiology of severe aspiration pneumonia in institutionalized elderly. Am J Respir Crit Care Med. 2003;167(12):1650-1654. https://doi.org/10.1164/rccm.200212-1543OC.
33. Tokuyasu H, Harada T, Watanabe E, et al. Effectiveness of meropenem for the treatment of aspiration pneumonia in elderly patients. Intern Med. 2009;48(3):129-135. https://doi.org/10.2169/internalmedicine.48.1308.
34. Ott SR, Allewelt M, Lorenz J, Reimnitz P, Lode H, German Lung Abscess Study Group. Moxifloxacin vs ampicillin/sulbactam in aspiration pneumonia and primary lung abscess. Infection. 2008;36(1):23-30. https://doi.org/10.1007/s15010-007-7043-6.
35. Kadowaki M, Demura Y, Mizuno S, et al. Reappraisal of clindamycin IV monotherapy for treatment of mild-to-moderate aspiration pneumonia in elderly patients. Chest. 2005;127(4):1276-1282. https://doi.org/10.1016/j.chest.2017.05.019.
36. Marik PE, Careau P. The role of anaerobes in patients with ventilator-associated pneumonia and aspiration pneumonia: a prospective study. Chest. 1999;115(1):178-183. https://doi.org/10.1378/chest.115.1.178.
37. Mier L, Dreyfuss D, Darchy B, et al. Is penicillin G an adequate initial treatment for aspiration pneumonia? A prospective evaluation using a protected specimen brush and quantitative cultures. Intensive Care Med. 1993;19(5):279-284. https://doi.org/10.1007/bf01690548.
38. Ashkenazi-Hoffnung L, Ari A, Bilavsky E, Scheuerman O, Amir J, Prais D. Pseudomonas aeruginosa identified as a key pathogen in hospitalised children with aspiration pneumonia and a high aspiration risk. Acta Paediatr. 2016;105(12):e588-e592. https://doi.org/10.1111/apa.13523.
39. Bartlett JG, Gorbach SL, Tally FP, Finegold SM. Bacteriology and treatment of primary lung abscess. Am Rev Respir Dis. 1974;109(5):510-518. https://doi.org/10.1164/arrd.1974.109.5.510.
40. Russell CJ, Simon TD, Mamey MR, Newth CJL, Neely MN. Pseudomonas aeruginosa and post-tracheotomy bacterial respiratory tract infection readmissions. Pediatr Pulmonol. 2017;52(9):1212-1218. https://doi.org/10.1002/ppul.23716.
41. Russell CJ, Mamey MR, Koh JY, Schrager SM, Neely MN, Wu S. Length of stay and hospital revisit after bacterial tracheostomy-associated respiratory tract infection hospitalizations. Hosp Pediatr. Hosp Pediatr. 2018;8(2):72-80. https://doi.org/10.1542/hpeds.2017-0106.
42. Russell CJ, Mack WJ, Schrager SM, Wu S. Care variations and outcomes for children hospitalized with bacterial tracheostomy-associated respiratory infections. Hosp Pediatr. 2017;7(1):16-23. https://doi.org/10.1542/hpeds.2016-0104.
Neurologic impairment (NI) encompasses static and progressive diseases of the central and/or peripheral nervous systems that result in functional and intellectual impairments.1 While a variety of neurologic diseases are responsible for NI (eg, hypoxic-ischemic encephalopathy, muscular dystrophy), consequences of these diseases extend beyond neurologic manifestations.1 These children are at an increased risk for aspiration of oral and gastric contents given their common comorbidities of dysphagia, gastroesophageal reflux, impaired cough, and respiratory muscle weakness.2 While aspiration may manifest as a self-resolving pneumonitis, the presence of oral or enteric bacteria in aspirated material may result in the development of bacterial pneumonia. Children with NI hospitalized with aspiration pneumonia have higher complication rates, longer and costlier hospitalizations, and higher readmission rates when compared with children with nonaspiration pneumonia.3
While pediatric aspiration pneumonia is commonly attributed to anaerobic bacteria, this is largely based on extrapolation from epidemiologic studies that were conducted in past decades.4-8 A single randomized controlled trial found that penicillin and clindamycin, antimicrobials with similar antimicrobial activity against anaerobes, to be equally effective.9 However, the recent literature emphasizes the polymicrobial nature of aspiration pneumonia in adults, with the common isolation of Gram-negative enteric bacteria.10 Further, while Pseudomonas aeruginosa is often identified in respiratory cultures from children with NI and chronic respiratory insufficiency,11,12 the significance of P. aeruginosa in lower airways remains unclear.
We designed this study to compare hospital outcomes associated with the most commonly prescribed empiric antimicrobial therapies for aspiration pneumonia in children with NI.
MATERIALS AND METHODS
Study Design and Data Source
This multicenter, retrospective cohort study used the Pediatric Health Information System (PHIS) database. PHIS, an administrative database of 50 not-for-profit tertiary care pediatric hospitals, contains data regarding patient demographics, diagnoses and procedures, and daily billed resource utilization, including laboratory and imaging studies. Data quality and reliability are assured through the Children’s Hospital Association (CHA; Lenexa, Kansas) and participating hospitals. Due to incomplete data through the study period and data quality issues, six hospitals were excluded.
STUDY POPULATION
Inclusion Criteria
Children 1-18 years of age who were discharged between July 1, 2007 and June 30, 2015 were included if they had a NI diagnosis,1 a principal diagnosis indicative of aspiration pneumonia (507.x),3,13,14 and received antibiotics in the first two calendar days of admission. NI was determined using previously defined International Classification of Diseases, Ninth Revision-Clinical Modification (ICD-9-CM) diagnosis codes.1 We only included children who received antibiotics in the first two calendar days of admission to minimize the likelihood of including children admitted for other reasons who acquired aspiration pneumonia after hospitalization. For children with multiple hospitalizations, one admission was randomly selected for inclusion to minimize weighting results toward repeat visits.
Exclusion Criteria
Children transferred from another hospital were excluded as records from their initial presentation, including treatment and outcomes, were not available. We also excluded children with tracheostomy15,16 or chronic ventilator dependence,17 those with a diagnosis of human immunodeficiency virus or tuberculosis, and children who received chemotherapy during hospitalization given expected differences in etiology, treatment, and outcomes.18
Exposure
The primary exposure was antibiotic therapy received in the first two days of admission. Antibiotics were classified by their antimicrobial spectra of activity as defined by The Sanford Guide to Antimicrobial Therapy19 against the most commonly recognized pathogens of aspiration pneumonia: anaerobes, Gram-negatives, and P. aeruginosa (Appendix Table 1).10,20 For example, penicillin G and clindamycin were among the antibiotics classified as providing anaerobic coverage alone, whereas ceftriaxone was classified as providing Gram-negative coverage alone and ampicillin-sulbactam or as combination therapy with clindamycin and ceftriaxone were classified as providing anaerobic and Gram-negative coverage. Piperacillin-tazobactam and meropenem were classified as providing anaerobic, Gram-negative, and P. aeruginosa coverage. We excluded antibiotics that do not provide coverage against anaerobes, Gram-negative, or P. aeruginosa (eg, ampicillin, azithromycin) or that provide coverage against Gram-negative and P. aeruginosa, but not anaerobes (eg, cefepime, tobramycin), as these therapies were prescribed for <5% of the cohort. We chose not to examine the coverage for Streptococcus pneumonia or Staphylococcus aureus as antibiotics included in this analysis covered these bacteria for 99.9% of our cohort.
OUTCOMES
Outcomes included acute respiratory failure during hospitalization, intensive care unit (ICU) transfer, and hospital length of stay (LOS). Acute respiratory failure during hospitalization was defined as the presence of Clinical Transaction Classification (CTC) or ICD-9 procedure code for noninvasive or invasive mechanical ventilation on day two or later of hospitalization, with or without the need for respiratory support on day 0 or day 1 (Appendix Table 2). Given the variability in hospital policies that may drive ICU admission criteria for complex patients, our outcome of ICU transfer was defined as the requirement for ICU level care on day two or later of hospitalization without ICU admission. Acute respiratory failure and ICU care occurring within the first two hospital days were not classified as outcomes because these early events likely reflect illness severity at presentation rather than outcomes attributable to treatment failure; these were included as markers of severity in the models.
Patient Demographics and Clinical Characteristics
Demographic and clinical characteristics that might influence antibiotic choice and/or hospital outcomes were assessed. Clinical characteristics included complex chronic conditions,21-23 medical technology assistance,24 performance of diagnostic testing, and markers of severe illness on presentation. Diagnostic testing included bacterial cultures (blood, respiratory, urine) and chest radiograph performance in the first two days of hospitalization. Results of diagnostic testing are not available in the PHIS. Illness severity on presentation included acute respiratory failure, pleural drainage, receipt of vasoactive agents, and transfusion of blood products in the first two days of hospitalization (Appendix Table 2).17,25,26
STASTICAL ANALYSIS
Continuous data were described with median and interquartile ranges (IQR) due to nonnormal distribution. Categorical data were described with frequencies and percentages. Patient demographics, clinical characteristics, and hospital outcomes were stratified by empiric antimicrobial coverage and compared using chi-square and Kruskal–Wallis tests as appropriate.
Generalized linear mixed-effects models with random hospital intercepts were derived to assess the independent effect of antimicrobial spectra of activity on outcomes of acute respiratory failure, ICU transfer, and LOS while adjusting for important differences in demographic and clinical characteristics. LOS had a nonnormal distribution. Thus, we used an exponential distribution. Covariates were chosen a priori given the clinical and biological relevance to exposure and outcomes—age, presence of complex chronic condition diagnoses, the number of complex chronic conditions, technology dependence, the performance of diagnostic tests on presentation, and illness severity on presentation. ICU admission was included as a covariate in acute respiratory failure and LOS outcome models. The results of the model for acute respiratory failure and ICU transfer are presented as adjusted odds ratios (OR) with a 95% CI. LOS results are presented as adjusted rate ratios (RR) with 95% CI.
All analyses were performed with SAS 9.3 (SAS Institute, Cary, North Carolina). P values <.05 were considered statistically significant. Cincinnati Children’s Hospital Medical Center Institutional Review Board considered this deidentified dataset study as not human subjects research.
RESULTS
Study Cohort
At the 44 hospitals included, 4,812 children with NI hospitalized with the diagnosis of aspiration pneumonia met the eligibility criteria. However, 79 received antibiotics with the spectra of activity not examined, leaving 4,733 children in our final analysis (Appendix Figure). Demographic and clinical characteristics of the study cohort are shown in Table 1. Median age was five years (interquartile range [IQR]: 2-11 years). Most subjects were male (53.9%), non-Hispanic white (47.9%), and publicly insured (63.6%). There was a slight variation in the distribution of admissions across seasons (spring 31.6%, summer 19.2%, fall 21.3%, and winter 27.9%). One-third of children had four or more comorbid CCCs (complex chronic conditions; 34.2%). The three most common nonneurologic CCC diagnosis categories were gastrointestinal (63.1%), congenital and/or genetic defects (36.9%), and respiratory (8.9%). Assistance with medical technologies was also common (82%)—particularly gastrointestinal (63.1%) and neurologic/neuromuscular (9.8%) technologies. The vast majority of children (92.5%) had either a chest radiograph (90.5%), respiratory viral study (33.7%), or respiratory culture (10.0%) obtained on presentation. A minority required noninvasive or invasive respiratory support (25.4%), vasoactive agents (8.9%), blood products (1.2%), or pleural drainage (0.3%) in the first two hospital days.
Spectrum of Antimicrobial Coverage
Most children (57.9%) received anaerobic and Gram-negative coverage; 16.2% received anaerobic, Gram-negative and P. aeruginosa coverage; 15.3% received anaerobic coverage alone; and 10.6% received Gram-negative coverage alone. Empiric antimicrobial coverage varied substantially across hospitals: anaerobic coverage was prescribed for 0%-44% of patients; Gram-negative coverage was prescribed for 3%-26% of patients; anaerobic and Gram-negative coverage was prescribed for 25%-90% of patients; and anaerobic, Gram-negative, and P. aeruginosa coverage was prescribed for 0%-65% of patients (Figure 1).
Outcomes
Acute Respiratory Failure
One-quarter (25.4%) of patients had acute respiratory failure on presentation; 22.5% required respiratory support (continued from presentation or were new) on day two or later of hospitalization (Table 2). In the adjusted analysis, children receiving Gram-negative coverage alone had two-fold greater odds (OR 2.15, 95% CI: 1.41-3.27) and children receiving anaerobic and Gram-negative coverage had 1.6-fold greater odds (OR 1.65, 95% CI: 1.19-2.28), of respiratory failure during hospitalization compared with those receiving anaerobic coverage alone (Figure 2). Odds of respiratory failure during hospitalization did not significantly differ for children receiving anaerobic, Gram-negative, and P. aeruginosa coverage compared with those receiving anaerobic coverage alone.
ICU Transfer
Nearly thirty percent (29.0%) of children required ICU admission, with an additional 3.8% requiring ICU transfer following admission (Table 2). In the multivariable analysis, the odds of an ICU transfer were greater for children receiving Gram-negative coverage alone (OR 1.80, 95% CI: 1.03-3.14) compared with those receiving anaerobic coverage alone. There was no statistical difference in ICU transfer for those receiving anaerobic and Gram-negative coverage (with or without P. aeruginosa coverage) compared with those receiving anaerobic coverage alone (Figure 2).
Length of Stay
Median hospital LOS for the total cohort was five days (IQR: 3-9 days; Table 2). In the multivariable analysis, children receiving Gram-negative coverage alone had a longer LOS (RR 1.28; 95% CI: 1.16-1.41) compared with those receiving anaerobic coverage alone, whereas children receiving anaerobic, Gram-negative, and P. aeruginosa coverage had a shorter LOS (RR 0.83; 95% CI: 0.76-0.90) than those receiving anaerobic coverage alone (Figure 2). There was no statistical difference in the LOS between children receiving anaerobic and Gram-negative coverage and those receiving anaerobic coverage alone.
DISCUSSION
In this multicenter study of children with NI hospitalized with aspiration pneumonia, we found substantial variation in empiric antimicrobial coverage for children with aspiration pneumonia. When comparing outcomes across groups, children who received anaerobic and Gram-negative coverage had outcomes similar to children who received anaerobic therapy alone. However, children who did not receive anaerobic coverage (ie, Gram-negative coverage alone) had worse outcomes, most notably a greater than two-fold increase in the odds of experiencing acute respiratory failure during hospitalization when compared with children receiving anaerobic therapy. These findings support prior literature that has highlighted the importance of anaerobic therapy in the treatment of aspiration pneumonia. The benefit of antibiotics targeting Gram-negative organisms, in addition to anaerobes, remains uncertain.
The variability in empiric antimicrobial coverage likely reflects the paucity of available information on oral and/or enteric bacteria required to identify them as causative organisms in aspiration pneumonia. In part, this problem is due to the difficulty in obtaining adequate sputum for culture from pediatric patients.27 While it may be more feasible to obtain tracheal aspirates for respiratory culture in children with a tracheostomy, interpretation of culture results remains challenging because the lower airways of children with tracheostomy are commonly colonized with bacterial pathogens.28 Thus, physicians are often left to choose empiric antimicrobial coverage with inadequate supporting evidence.29 Although the polymicrobial nature of aspiration pneumonia is well recognized in adult and pediatric literature,10,30 it is less clear which organisms are of pathological significance and require treatment.
The treatment standard for aspiration pneumonia has long included anaerobic therapy.29 The worse outcomes of children not receiving anaerobic therapy (ie, Gram-negative coverage alone) compared with children who received anaerobic therapy support the continued importance of anaerobic therapy in the treatment of aspiration pneumonia for hospitalized children with NI. The role of antibiotics covering Gram-negative organisms is less clear. Recent studies suggest the role of anaerobes is overemphasized in the etiology and treatment of aspiration pneumonia.10,29,31-38 Multiple studies on aspiration pneumonia bacteriology in hospitalized adults have demonstrated a predominance of Gram-negative organisms (ranging from 37%-71% of isolates identified on respiratory culture) and a relative scarcity of anaerobes (ranging from 0%-16% of isolates).31-37 A prospective study of 50 children hospitalized with clinical and radiographic evidence of pneumonia with known aspiration risk (eg, neuromuscular disease or dysphagia) found that ~80% of 163 bacterial isolates were Gram-negative.38 However, this study included repeat cultures from the same children, and thus, may overestimate the prevalence of Gram-negative organisms. In our study, children who received both anaerobic and Gram-negative therapy had no differences in ICU transfer or LOS but did experience higher odds of acute respiratory failure. As these results may be due to unmeasured confounding, future studies should further explore the necessity of Gram-negative coverage in addition to anaerobic coverage in this population.
While these recent studies may seem to suggest that anaerobic coverage is not necessary for aspiration pneumonia, there are important limitations worth noting. First, these studies used a variety of sampling techniques. While organisms grown from samples obtained via bronchoalveolar lavage31-34,36 are likely pathogenic, those grown from tracheal or oral samples obtained via percutaneous transtracheal aspiration,34 a protected specimen brush,34,36,37 or expectorated sputum35,38 may not represent lower airway organisms. Second, anaerobic cultures were not obtained in all studies.31,34,38 Anaerobic organisms are difficult to isolate using traditional clinical specimen collection techniques and aerobic culture media.18 Furthermore, anaerobes are not easily recovered from lung infections after the receipt of antibiotic therapy.39 Details regarding pretreatment, which are largely lacking from these studies, are necessary to interpret the relative scarcity of anaerobes on respiratory culture. Finally, caution should be taken when extrapolating the results of studies focused on the etiology and treatment of aspiration pneumonia in elderly adults to children. Our results, particularly in the context of the limitation of these more recent studies, suggest that the role of anaerobes has been underestimated.
Recent studies examining populations of children with cerebral palsy and/or tracheostomy have emphasized the high rates of carriage and infection rates with Gram-negative and drug-resistant bacteria; in particular, P. aeruginosa accounts for 50%-72% of pathogenic bacteria.11,12,38,40
Our multicenter observational study has several limitations. We used diagnosis codes to identify patients with aspiration pneumonia. As validated clinical criteria for the diagnosis of aspiration pneumonia do not exist, clinicians may assign a diagnosis of and treatment for aspiration pneumonia by subjective suspicion based on a child’s severe NI or illness severity on presentation leading to selection bias. Although administrative data are not able to verify pneumonia type with absolute certainty, we previously demonstrated that the differences in the outcomes of children with aspiration and nonaspiration pneumonia diagnosis codes persist after accounting for the complexity that might influence the diagnosis.3
Frthermore, we were unable to account for laboratory, microbiology, or radiology test results, and other management practices (eg, frequency of airway clearance, previous antimicrobial therapy) that may influence outcomes. Future studies should certainly include an examination of the concordance of the antibiotics prescribed with causative organisms, as this undoubtedly affects patient outcomes. Other outcomes are important to examine (eg, time to return to respiratory baseline), but we were unable to do so, given the lack of clinical detail in our database. We randomly selected a single hospitalization for children with multiple admissions; alternative methods could have different results. Although children with NI predominately use children’s hospitals,1 results may not be generalizable.
CONCLUSION
These findings support prior literature that has highlighted the important role anaerobic therapy plays in the treatment of aspiration pneumonia in children with NI. In light of the limitations of our study design, we believe that rigorous clinical trials comparing anaerobic with anaerobic and Gram-negative therapy are an important and necessary next step to determine the optimal treatment for aspiration pneumonia in this population.
Disclosures
The authors do not have any financial relationships relevant to this article to disclose.
Funding
Dr. Thomson was supported by the Agency for Healthcare Research and Quality (AHRQ) under award number K08HS025138. Dr. Ambroggio was supported by the National Institute for Allergy and Infectious Diseases (NIAID) under award number K01AI125413. The content is solely the responsibility of the authors and does not necessarily represent the official views of the AHRQ or NIAID.
1. Berry JG, Poduri A, Bonkowsky JL, et al. Trends in resource utilization by children with neurological impairment in the United States inpatient health care system: a repeat cross-sectional study. PLoS Med. 2012;9(1):e1001158. https://doi.org/10.1371/journal.pmed.1001158.
2. Seddon PC, Khan Y. Respiratory problems in children with neurological impairment. Arch Dis Child. 2003;88(1):75-78. https://doi.org/10.1136/adc.88.1.75.
3. Thomson J, Hall M, Ambroggio L, et al. Aspiration and non-aspiration pneumonia in hospitalized children with neurologic impairment. Pediatrics. 2016;137(2):e20151612. https://doi.org/10.1542/peds.2015-1612.
4. Brook I. Anaerobic pulmonary infections in children. Pediatr Emerg Care. 2004;20(9):636-640. https://doi.org/10.1097/01.pec.0000139751.63624.0b.
5. Bartlett JG, Gorbach SL. Treatment of aspiration pneumonia and primary lung abscess. Penicillin G vs clindamycin. JAMA. 1975;234(9):935-937. https://doi.org/10.1001/jamadermatol.2017.0297.
6. Bartlett JG, Gorbach SL, Finegold SM. The bacteriology of aspiration pneumonia. Am J Med. 1974;56(2):202-207. https://doi.org/10.1016/0002-9343(74)90598-1.
7. Lode H. Microbiological and clinical aspects of aspiration pneumonia. J Antimicrob Chemother. 1988;21:83-90. https://doi.org/10.1093/jac/21.suppl_c.83.
8. Brook I. Treatment of aspiration or tracheostomy-associated pneumonia in neurologically impaired children: effect of antimicrobials effective against anaerobic bacteria. Int J Pediatr Otorhinolaryngol. 1996;35(2):171-177. https://doi.org/10.1016/0165-5876(96)01332-8.
9. Jacobson SJ, Griffiths K, Diamond S, et al. A randomized controlled trial of penicillin vs clindamycin for the treatment of aspiration pneumonia in children. Arch Pediatr Adolesc Med. 1997;151(7):701-704. https://doi.org/10.1001/archpedi.1997.02170440063011.
10. DiBardino DM, Wunderink RG. Aspiration pneumonia: a review of modern trends. J Crit Care. 2015;30(1):40-48. https://doi.org/10.1016/j.jcrc.2014.07.011.
11. Gerdung CA, Tsang A, Yasseen AS, 3rd, Armstrong K, McMillan HJ, Kovesi T. Association between chronic aspiration and chronic airway infection with Pseudomonas aeruginosa and other Gram-negative bacteria in children with cerebral palsy. Lung. 2016;194(2):307-314. https://doi.org/10.1007/s00408-016-9856-5.
12. Thorburn K, Jardine M, Taylor N, Reilly N, Sarginson RE, van Saene HK. Antibiotic-resistant bacteria and infection in children with cerebral palsy requiring mechanical ventilation. Pedr Crit Care Med. 2009;10(2):222-226. https://doi.org/10.1097/PCC.0b013e31819368ac.
13. Lanspa MJ, Jones BE, Brown SM, Dean NC. Mortality, morbidity, and disease severity of patients with aspiration pneumonia. J Hosp Med. 2013;8(2):83-90. https://doi.org/10.1002/jhm.1996.
14. Lanspa MJ, Peyrani P, Wiemken T, Wilson EL, Ramirez JA, Dean NC. Characteristics associated with clinician diagnosis of aspiration pneumonia: a descriptive study of afflicted patients and their outcomes. J Hosp Med. 2015;10(2):90-96. https://doi.org/10.1002/jhm.2280.
15. Berry JG, Graham RJ, Roberson DW, et al. Patient characteristics associated with in-hospital mortality in children following tracheotomy. Arch Dis Child. 2010;95(9):703-710.
16. Berry JG, Graham DA, Graham RJ, et al. Predictors of clinical outcomes and hospital resource use of children after tracheotomy. Pediatrics. 2009;124(2):563-572. https://doi.org/10.1136/adc.2009.180836.
17. Balamuth F, Weiss SL, Hall M, et al. Identifying pediatric severe sepsis and septic shock: Accuracy of diagnosis codes. J Pediatr. 2015;167(6):1295-1300 e1294. https://doi.org/10.1016/j.jpeds.2015.09.027.
18. American Academy of Pediatrics., Pickering LK, American Academy of Pediatrics. Committee on Infectious Diseases. In: Red book : 2012 report of the Committee on Infectious Diseases. 29th ed. Elk Grove Village: American Academy of Pediatrics; 2012.
19. Gilbert DN. The Sanford Guide to Antimicrobial Therapy 2014. 44th ed. Sperryville: Antimicrobial Therapy, Inc; 2011.
20. Marik PE. Aspiration pneumonitis and aspiration pneumonia. N Engl J Med. 2001;344(9):665-671. https://doi.org/10.1056/NEJM200103013440908.
21. Feudtner C, Feinstein JA, Zhong W, Hall M, Dai D. Pediatric complex chronic conditions classification system version 2: updated for ICD-10 and complex medical technology dependence and transplantation. BMC Pediatrics. 2014;14:199. https://doi.org/10.1186/1471-2431-14-199.
22. Feudtner C, Hays RM, Haynes G, Geyer JR, Neff JM, Koepsell TD. Deaths attributed to pediatric complex chronic conditions: national trends and implications for supportive care services. Pediatrics. 2001;107(6):E99. https://doi.org/10.1542/peds.107.6.e99.
23. Feinstein JA, Russell S, DeWitt PE, Feudtner C, Dai D, Bennett TD. R package for pediatric complex chronic condition classification. JAMA Pediatr. 2018;172(6):596-598. https://doi.org/10.1001/jamapediatrics.2018.0256.
24. Berry JG, Hall DE, Kuo DZ, Cohen E, Agrawal R, Feudtner C, Hall M, Kueser J, Kaplan W, Neff J. Hospital utilization and characteristics of patients experiencing recurrent readmissions within children’s hospitals. JAMA. 2011;305(7):682-690. https://doi.org/10.1001/jama.2011.122.
25. Shah SS, Hall M, Newland JG, et al. Comparative effectiveness of pleural drainage procedures for the treatment of complicated pneumonia in childhood. J Hosp Med. 2011;6(5):256-263. https://doi.org/10.1002/jhm.872.
26. Child Health Corporation of America. CTC™ 2010 Code Structure: Module 5 Clinical Services. 2010 January 4; Available at https://sharepoint.chca.com/CHCAForums/PerformanceImprovement/PHIS/Reference Library/CTC Resources/Forms/AllItems.aspx Version: Modified.
27. Bradley JS, Byington CL, Shah SS, et al. The management of community-acquired pneumonia in infants and children older than 3 months of age: clinical practice guidelines by the Pediatric Infectious Diseases Society and the Infectious Diseases Society of America. Clin Infect Dis. 2011;53(7):e25-76. https://doi.org/10.1093/cid/cir531.
28. Brook I. Bacterial colonization, tracheobronchitis, and pneumonia following tracheostomy and long-term intubation in pediatric patients. Chest. 1979;76(4):420-424.
29. Waybright RA, Coolidge W, Johnson TJ. Treatment of clinical aspiration: a reappraisal. Am J Health Syst Pharm. 2013;70(15):1291-1300. https://doi.org/10.2146/ajhp120319.
30. Brook I, Finegold SM. Bacteriology of aspiration pneumonia in children. Pediatrics. 1980;65(6):1115-1120.
31. Wei C, Cheng Z, Zhang L, Yang J. Microbiology and prognostic factors of hospital- and community-acquired aspiration pneumonia in respiratory intensive care unit. Am J Infect Control. 2013;41(10):880-884. https://doi.org/10.1016/j.ajic.2013.01.007.
32. El-Solh AA, Pietrantoni C, Bhat A, et al. Microbiology of severe aspiration pneumonia in institutionalized elderly. Am J Respir Crit Care Med. 2003;167(12):1650-1654. https://doi.org/10.1164/rccm.200212-1543OC.
33. Tokuyasu H, Harada T, Watanabe E, et al. Effectiveness of meropenem for the treatment of aspiration pneumonia in elderly patients. Intern Med. 2009;48(3):129-135. https://doi.org/10.2169/internalmedicine.48.1308.
34. Ott SR, Allewelt M, Lorenz J, Reimnitz P, Lode H, German Lung Abscess Study Group. Moxifloxacin vs ampicillin/sulbactam in aspiration pneumonia and primary lung abscess. Infection. 2008;36(1):23-30. https://doi.org/10.1007/s15010-007-7043-6.
35. Kadowaki M, Demura Y, Mizuno S, et al. Reappraisal of clindamycin IV monotherapy for treatment of mild-to-moderate aspiration pneumonia in elderly patients. Chest. 2005;127(4):1276-1282. https://doi.org/10.1016/j.chest.2017.05.019.
36. Marik PE, Careau P. The role of anaerobes in patients with ventilator-associated pneumonia and aspiration pneumonia: a prospective study. Chest. 1999;115(1):178-183. https://doi.org/10.1378/chest.115.1.178.
37. Mier L, Dreyfuss D, Darchy B, et al. Is penicillin G an adequate initial treatment for aspiration pneumonia? A prospective evaluation using a protected specimen brush and quantitative cultures. Intensive Care Med. 1993;19(5):279-284. https://doi.org/10.1007/bf01690548.
38. Ashkenazi-Hoffnung L, Ari A, Bilavsky E, Scheuerman O, Amir J, Prais D. Pseudomonas aeruginosa identified as a key pathogen in hospitalised children with aspiration pneumonia and a high aspiration risk. Acta Paediatr. 2016;105(12):e588-e592. https://doi.org/10.1111/apa.13523.
39. Bartlett JG, Gorbach SL, Tally FP, Finegold SM. Bacteriology and treatment of primary lung abscess. Am Rev Respir Dis. 1974;109(5):510-518. https://doi.org/10.1164/arrd.1974.109.5.510.
40. Russell CJ, Simon TD, Mamey MR, Newth CJL, Neely MN. Pseudomonas aeruginosa and post-tracheotomy bacterial respiratory tract infection readmissions. Pediatr Pulmonol. 2017;52(9):1212-1218. https://doi.org/10.1002/ppul.23716.
41. Russell CJ, Mamey MR, Koh JY, Schrager SM, Neely MN, Wu S. Length of stay and hospital revisit after bacterial tracheostomy-associated respiratory tract infection hospitalizations. Hosp Pediatr. Hosp Pediatr. 2018;8(2):72-80. https://doi.org/10.1542/hpeds.2017-0106.
42. Russell CJ, Mack WJ, Schrager SM, Wu S. Care variations and outcomes for children hospitalized with bacterial tracheostomy-associated respiratory infections. Hosp Pediatr. 2017;7(1):16-23. https://doi.org/10.1542/hpeds.2016-0104.
© 2019 Society of Hospital Medicine