User login
Readmissions Following Hospitalization for Infection in Children With or Without Medical Complexity
Hospitalizations for infections are common in children, with respiratory illnesses, including pneumonia and bronchiolitis, among the most prevalent indications for hospitalization.1,2 Infections are also among the most frequent indications for all-cause readmissions and for potentially preventable readmissions in children.3-5 Beyond hospital resource use, infection hospitalizations and readmissions represent a considerable cause of life disruption for patients and their families.6,7 While emerging evidence supports shortened durations of parenteral antibiotics before transitioning to oral therapy for some infections (eg, pyelonephritis, osteomyelitis),8-10 other infections may require extended treatment courses for weeks. The risk of adverse outcomes (eg, complications of medical treatment, readmission risk) and burdens placed on patients and their families may therefore differ across infection types and extend well beyond the immediate hospitalization.
Although infections are common and pediatric providers are expected to have proficiency in managing infections, substantial variation in the management of common pediatric infections exists and is associated with adverse hospitalization outcomes, including increased readmission risk and healthcare costs.11-18 Potentially avoidable resource use associated with hospital readmission from infection has led to adoption of hospital-level readmission metrics as indicators of the quality of healthcare delivery. For example, the Pediatric Quality Measures Program, established by the Children’s Health Insurance Program Reauthorization Act of 2009, has prioritized measurement of readmissions following hospitalization for lower respiratory tract infection.19 With government agencies increasingly using readmission metrics to assess quality of healthcare delivery, developing metrics that focus on these resource-intensive conditions is essential.
Because infections are a common and costly indication for hospital resource use and because substantial variation in management has been observed, promoting a broader understanding of infection-specific readmission rates is important for prioritizing readmission-reduction opportunities in children. This study’s objectives were the following: (1) to describe the prevalence and characteristics of infection hospitalizations in children and their associated readmissions and (2) to estimate the number of readmissions avoided and costs saved if all hospitals achieved the 10th percentile of the hospitals’ risk-adjusted readmission rate (ie, readmission benchmark).
METHODS
Study Design and Data Source
We performed a retrospective cohort analysis using the 2014 Agency for Healthcare Research and Quality (AHRQ) Nationwide Readmissions Database (NRD).20 The 2014 NRD is an administrative database that contains information on inpatient stays from January 1, 2014, to December 31, 2014, for all payers and allows for weighted national estimates of readmissions for all US individuals. Data within NRD are aggregated from 22 geographically diverse states representing approximately one-half of the US population. NRD contains deidentified patient-level data with unique verified patient identifiers to track individuals within and across hospitals in a state. However, AHRQ guidelines specify that NRD cannot be used for reporting hospital-specific readmission rates. Thus, for the current study, the Inpatient Essentials (Children’s Hospital Association), or IE, database was used to measure hospital-level readmission rates and to distinguish benchmark readmission rates for individual infection diagnoses.21 The IE database is composed of 90 children’s hospitals distributed throughout all regions of the United States. The inclusion of free-standing children’s hospitals and children’s hospitals within adult hospitals allows for comparisons and benchmarking across hospitals on multiple metrics, including readmissions.
Study Population
Children 0 to 17 years of age with a primary diagnosis at the index admission for infection between January 1, 2014, and November 30, 2014, were included. The end date of November 30, 2014, allowed for a full 30-day readmission window for all index admissions. We excluded index admissions that resulted in transfer to another acute care hospital or in-hospital mortality. Additionally, we excluded index admissions of children who had hematologic or immunologic conditions, malignancy, or history of bone marrow and solid-organ transplant, using the classification system for complex chronic conditions (CCCs) from Feudtner et al.22 Due to the high likelihood of immunosuppression in patients with these conditions, children may have nuanced experiences with illness severity, trajectory, and treatment associated with infection that place them at increased risk for nonpreventable readmission.
Main Exposure
The main exposure was infection type during the index admission. Condition-specific index admissions were identified using AHRQ’s Clinical Classifications Software (CCS) categories.23 CCS is a classification schema that categorizes the greater than 14,000 International Classification of Diseases, Ninth Revision, Clinical Modification (ICD-9-CM) diagnosis codes and 3,900 ICD-9-CM procedure codes into clinically meaningful categories of 295 diagnosis (including mental health codes and E-codes) and 231 procedural groupings. Twenty-two groupings indicative of infection were distinguished and used for the current study. Examples of infections included aspiration pneumonia, pneumonia, bronchiolitis, and sexually transmitted infection. We combined related CCS categories when possible for ease of interpretation and presentation of data (Appendix Table 1).
Main Outcome Measure
The main outcome measure was 30-day hospital readmission. Readmission was defined as all-cause, unplanned admission within 30 days following discharge from a preceding hospitalization. Planned hospital readmissions were identified and excluded using methods from AHRQ’s Pediatric All-Condition Readmission Measure.24 We defined a same-cause return as a return with the same CCS infection category as the index admission. Costs associated with readmissions were estimated from charges using hospital-specific cost-to-charge ratios provided with NRD.
Patient Demographic and Clinical Characteristics
Patient demographic characteristics included age at index admission (<1 year, 1-5 years, 6-9 years, 10-14 years, and 15-18 years), sex, payer (ie, government, private, other), and discharge disposition (ie, routine, home health, other). We assessed all patients for medical complexity, as defined by the presence of at least one CCC, and we reported the categories of CCCs by organ system involved.22 Otherwise, patients were identified as without medical complexity.
Statistical Analysis
We summarized continuous variables with medians and interquartile ranges and categorical variables with frequencies and percentages. To develop benchmark readmission rates for each infection type, we used generalized linear mixed models with random intercepts for each hospital in the IE database. For each infection type, the benchmark readmission rate was defined as the 10th percentile of hospitals’ risk-adjusted readmission rates. The 10th percentile was chosen to identify the best performing 10% of hospitals (ie, hospitals with the lowest readmission rates). Because children with medical complexity account for a large proportion of hospital resource use and are at high risk for readmission,4,25 we developed benchmarks stratified by presence/absence of a CCC (ie, with complexity vs without complexity). Models were adjusted for severity of illness using the Hospitalization Resource Intensity Score for Kids (H-RISK),26 a scoring system that assigns relative weights for each All Patient Refined Diagnosis-Related Group (3M Corporation) and severity of illness level, and each hospital’s risk-adjusted readmission rate was determined.
With use of weights to achieve national estimates of index admissions and readmissions, we determined the number of potentially avoidable readmissions by calculating the number of readmissions observed in the NRD that would not occur if all hospitals achieved readmission rates equal to the 10th percentile. Avoidable costs were estimated by multiplying the number of potentially avoidable readmissions by the mean cost of a readmission for infections of that type. Estimates of avoidable readmissions and costs were stratified by medical complexity. In addition to describing estimates at the 10th percentile benchmark, we similarly developed estimates of potentially avoidable readmissions and avoidable costs for the 5th and 25th percentiles, which are presented within Appendix Table 2 (children without complexity) and Appendix Table 3 (children with complexity).
All statistical analyses were performed using SAS version 9.4 (SAS Institute), and P values <.001 were considered statistically significant due to the large sample size. The Office of Research Integrity at Children’s Mercy Hospital deemed this study exempt from institutional board review.
RESULTS
Characteristics of the Study Population
The study included 380,067 index admissions for infection and an accompanying 18,469 unplanned all-cause readmissions over the 30 days following discharge (readmission rate, 4.9%; Table 1). Children ages 1 to 5 years accounted for the largest percentage (32.9%) of index hospitalizations, followed by infants younger than 1 year (30.3%). The readmission rate by age group was highest for infants younger than 1 year, compared with rates among all other age groups (5.6% among infants < 1 year vs 4.4%-4.7% for other age groups; P < .001). In the overall cohort, 16.2% of admissions included patients with a CCC. Children with medical complexity had higher readmission rates than those without medical complexity (no CCC, 3.2%; 1 CCC, 9.2%; 2+ CCCs, 18.9%). A greater percentage of children experiencing a readmission had government insurance (63.0% vs 59.2%; P < .001) and received home health nursing (10.1% vs 2.7%; P < .001) following the index encounter.

Children Without Complexity
Index Admissions and 30-day Readmissions
Among patients without medical complexity, index admissions occurred most frequently for pneumonia (n = 54,717), bronchiolitis (n = 53,959), and appendicitis (n = 45,036) (Figure 1). The median length of stay (LOS) for index admissions ranged from 1 to 5 days (Table 2), with septic arthritis and osteomyelitis having the longest median LOS at 5 (IQR, 3-7) days.

Thirty-day readmission rates varied substantially by infection at the index admission (range, 1.5% for sexually transmitted infection to 8.6% for peritonitis) (Figure 1). The median LOS for 30-day readmissions varied from 2 to 7 days (Table 2), while the median number of days to readmission varied substantially by infection type (range, 4 days for bacterial infection [site unspecified] to 24 days for sexually transmitted infections). Among the top five indications for admission for children without complexity, 14.9% to 52.8% of readmissions were for the same cause as the index admission; however, many additional returns were likely related to the index admission (Appendix Table 4). For example, among other return reasons, an additional 992 (61.7%) readmissions following appendicitis hospitalizations were for complications of surgical procedures or medical care, peritonitis, intestinal obstruction, and abdominal pain.

Impact of Achieving Readmission Benchmarks
Among children without complexity, readmission benchmarks (ie, the 10th percentile of readmission rates across hospitals) ranged from 0% to 26.7% (Figure 2). An estimated 54.7% of readmissions (n = 5,507) could potentially be reduced if hospitals achieved infection-specific benchmark readmission rates, which could result in an estimated $44.5 million in savings. Pneumonia, bronchiolitis, gastroenteritis, and upper respiratory tract infections were among conditions with the greatest potential reductions in readmissions and costs if a 10th percentile benchmark was achieved.

Children With Medical Complexity
Index Admissions and 30-day Readmissions
Among patients with complexity, index admissions occurred most frequently for pneumonia (n = 14,344), bronchiolitis (n = 8,618), and upper respiratory tract infection (n = 6,407) (Figure 1). The median LOS for index admissions ranged from 1 to 9 days (Table 2), with septicemia and CNS infections having the longest median LOS at 9 days.
Thirty-day readmission rates varied substantially by the type of infection at the index admission (range, 0% for sexually transmitted infection to 21.6% for aspiration pneumonia) (Figure 1). The median LOS for 30-day readmissions varied from 2 to 14 days (Table 2), and the median number of days to readmission varied substantially by infection type (range, 6 days for tonsillitis to 23 days for other infection). Among the top five indications for admission for medically complex children, 8% to 40.4% of readmissions were for the same cause as the index admission (Appendix Table 4). As with the children without complexity, additional returns were likely related to the index admission.
Impact of Achieving Readmission Benchmarks
Among children with medical complexity, readmission benchmarks ranged from 0% to 30.3% (Figure 2). An estimated 42.6% of readmissions (n = 3,576) could potentially be reduced if hospitals achieved infection-specific benchmark readmission rates, which could result in an estimated $70.8 million in savings. Pneumonia, bronchiolitis, septicemia, and upper respiratory tract infections were among conditions with the greatest potential reductions in readmissions and costs if the benchmarks were achieved.
DISCUSSION
The current study uncovered new findings regarding unplanned readmissions following index infection hospitalizations for children. In particular, readmission rates and time to readmission varied substantially by infection subtype. The study also identified priority infections and unique considerations for children with CCCs, all of which may help maximize the value of readmission metrics aimed at advancing hospital quality and reducing costs for infection hospitalizations in children. If all hospitals achieved the readmission rates of the best performing hospitals, 42.6% to 54.7% fewer readmissions could be realized with associated cost savings.
Nationally, studies have reported 30-day, all-cause unplanned readmission rates of 6.2% to 10.3%.5,27 In our current study we observed an overall readmission rate of 4.9% across all infectious conditions; however, readmission rates varied substantially by condition, with upper and lower respiratory tract infections, septicemia, and gastroenteritis among infections with the greatest number of potentially avoidable readmissions based on achievement of readmission benchmarks. Currently, pediatric-specific all-cause and lower respiratory tract infection readmission metrics have been developed with the aim of improving quality of care and reducing healthcare expenditures.28 Future readmission studies and metrics may prioritize conditions such as septicemia, gastroenteritis, and other respiratory tract infections. Our current study demonstrated that many readmissions following infection hospitalizations were associated with the same CCS category or within a related CCS category (eg, complications of surgical procedures or medical care, appendicitis, peritonitis, intestinal obstruction, and abdominal pain constituted the top five indications for readmission for appendicitis, whereas respiratory illnesses constituted the top five indications for readmissions for pneumonia). While this current study cannot clarify this relationship further, and the “avoidability” of unplanned readmissions is debated,29-31 our findings suggest that future investigations might focus on identifying whether condition-specific interventions during the index admission could mitigate some readmissions.
While the LOS of the index admission and the readmission were similar for most infection subtypes, we observed substantial variability in the temporal risk for readmission by infection subtype. Our observations complement studies exploring the timing of readmissions for other pediatric conditions.32-34 In particular, our findings further highlight that the composition and interaction of factors influencing infection readmissions may vary by condition. Infections represent a diverse group of conditions, with treatment courses that vary in need for parenteral antibiotics, ability to tailor treatment based on organism and susceptibilities, and length of treatment. While treatment for some infections may be accomplished, or nearly accomplished, prior to discharge, other infections (eg, osteomyelitis) may require prolonged treatment, shifting the burden of management and monitoring to patients and their families, which along with the timeliness and adequacy of outpatient follow-up, may modify an individual’s readmission risk. Consequently, a “one-size fits all” approach to discharge counseling may not be successful across all conditions. Our study lays the groundwork for how these temporal relationships may be used by clinicians to counsel families regarding the likely readmission timeframe, based on infection, and to establish follow-up appointments ahead of the infection-specific “readmission window,” which may allow outpatient providers to intervene when readmission risk is greatest.
Consistent with prior literature, children with medical complexity in our study had increased frequency of 30-day, all-cause unplanned readmissions and LOS, compared with peers who did not have complexity.5 Readmission rates following hospitalizations for aspiration pneumonia were comparable to those reported by Thompson et al in their study examining rates of pneumonia in children with neurologic impairment.35 In our current study, nearly 96% of readmissions following aspiration pneumonia hospitalizations were for children with medical complexity, and more than 58% of these readmissions were for aspiration pneumonia or respiratory illness. Future investigations should seek to explore factors contributing to readmissions in children with medical complexity and to evaluate whether interventions such as postdischarge coaching or discharge bundles could assist with reductions in healthcare resource use.36,37
Despite a lack of clear association between readmissions and quality of care for children,38 readmissions rates continue to be used as a quality measure for hospitalized patients. Within our present study, we found that achieving benchmark readmission rates for infection hospitalizations could lead to substantial reductions in readmissions; however, these reductions were seen across this relatively similar group of infection diagnoses, and hospitals may face greater challenges when attempting to achieve a 10th percentile readmission benchmark across a more expansive set of diagnoses. Despite these challenges, understanding the intricacies of readmissions may lead to improved readmission metrics and the systematic identification of avoidable readmissions, the goal of which is to enhance the quality of healthcare for hospitalized children.
Our findings should be interpreted in the context of several limitations. We defined our readmission benchmark at the 10th percentile using the IE database. Because an estimated 70% of hospitalizations for children occur within general hospitals,39 we believe that our use of the IE database allowed for increased generalizability, though the broadening of our findings to nonacademic hospital settings may be less reliable. While we describe the 10th percentile readmission benchmark here, alternative benchmarks would result in different estimates of avoidable readmissions and associated readmission costs (Appendix Tables 2 and 3). The IE and NRD databases do not distinguish intensive care use. We tried to address this limitation through model adjustments using H-RISK, which is particularly helpful for adjusting for NICU admissions through use of the 27 All Patient Refined Diagnosis-Related Groups for neonatal conditions. Additionally, the NRD uses state-level data to derive national estimates and is not equipped to measure readmissions to hospitals in a different state, distinguish patient deaths occurring after discharge, or to examine the specific indication for readmission (ie, unable to assess if the readmission is related to a complication of the treatment plan, progression of the illness course, or for an unrelated reason). While sociodemographic and socioeconomic factors may affect readmissions, the NRD does not contain information on patients’ race/ethnicity, family/social attributes, or postdischarge follow-up health services, which are known to influence the need for readmission.
Despite these limitations, this study highlights future areas for research and potential opportunities for reducing readmission following infection hospitalizations. First, identifying hospital- and systems-based factors that contribute to readmission reductions at the best-performing hospitals may identify opportunities for hospitals with the highest readmission rates to achieve the rates of the best-performing hospitals. Second, conditions such as upper and lower respiratory tract infections, along with septicemia and gastroenteritis, may serve as prime targets for future investigation based on the estimated number of avoidable readmissions and potential cost savings associated with these conditions. Finally, future investigations that explore discharge counseling and follow-up tailored to the infection-specific temporal risk and patient complexity may identify opportunities for further readmission reductions.
CONCLUSION
Our study provides a broad look at readmissions following infection hospitalizations and highlights substantial variation in readmissions based on infection type. To improve hospital resource use for infections, future preventive measures could prioritize children with complex chronic conditions and those with specific diagnoses (eg, upper and lower respiratory tract infections).
Disclaimer
This information or content and conclusions are those of the authors and should not be construed as the official position or policy of, nor should any endorsements be inferred by, NIH or the US government.
1. Keren R, Luan X, Localio R, et al; Pediatric Research in Inpatient Settings (PRIS) Network. Prioritization of comparative effectiveness research topics in hospital pediatrics. Arch Pediatr Adolesc Med. 2012;166(12):1155-1164. https://doi.org/10.1001/archpediatrics.2012.1266
2. Van Horne B, Netherton E, Helton J, Fu M, Greeley C. The scope and trends of pediatric hospitalizations in Texas, 2004-2010. Hosp Pediatr. 2015;5(7):390-398. https://doi.org/10.1542/hpeds.2014-0105
3. Neuman MI, Hall M, Gay JC, et al. Readmissions among children previously hospitalized with pneumonia. Pediatrics. 2014;134(1):100-109. https://doi.org/10.1542/peds.2014-0331
4. Gay JC, Hain PD, Grantham JA, Saville BR. Epidemiology of 15-day readmissions to a children’s hospital. Pediatrics. 2011;127(6):e1505-e1512. https://doi.org/10.1542/peds.2010-1737
5. Berry JG, Toomey SL, Zaslavsky AM, et al. Pediatric readmission prevalence and variability across hospitals. JAMA. 2013;309(4):372-380. https://doi.org/10.1001/jama.2012.188351
6. Shudy M, de Almeida ML, Ly S, et al. Impact of pediatric critical illness and injury on families: a systematic literature review. Pediatrics. 2006;118(suppl 3):S203-S218. https://doi.org/10.1542/peds.2006-0951b
7. Rennick JE, Johnston CC, Dougherty G, Platt R, Ritchie JA. Children’s psychological responses after critical illness and exposure to invasive technology. J Dev Behav Pediatr. 2002;23(3):133-144. https://doi.org/10.1097/00004703-200206000-00002
8. Michael M, Hodson EM, Craig JC, Martin S, Moyer VA. Short versus standard duration oral antibiotic therapy for acute urinary tract infection in children. Cochrane Database Syst Rev. 2003;(1):CD003966. https://doi.org/10.1002/14651858.cd003966
9. Greenberg D, Givon-Lavi N, Sadaka Y, Ben-Shimol S, Bar-Ziv J, Dagan R. Short-course antibiotic treatment for community-acquired alveolar pneumonia in ambulatory children: a double-blind, randomized, placebo-controlled trial. Pediatr Infect Dis J. 2014;33(2):136-142. https://doi.org/10.1097/inf.0000000000000023
10. Keren R, Shah SS, Srivastava R, et al; Pediatric Research in Inpatient Settings Network. Comparative effectiveness of intravenous vs oral antibiotics for postdischarge treatment of acute osteomyelitis in children. JAMA Pediatr. 2015;169(2):120-128. https://doi.org/10.1001/jamapediatrics.2014.2822
11. Markham JL, Hall M, Bettenhausen JL, Myers AL, Puls HT, McCulloh RJ. Variation in care and clinical outcomes in children hospitalized with orbital cellulitis. Hosp Pediatr. 2018;8(1):28-35. https://doi.org/10.1542/hpeds.2017-0040
12. Neubauer HC, Hall M, Wallace SS, Cruz AT, Queen MA, Foradori DM, Aronson PL, Markham JL, Nead JA, Hester GZ, McCulloh RJ, Lopez MA. Variation in diagnostic test use and associated outcomes in staphylococcal scalded skin syndrome at children’s hospitals. Hosp Pediatr. 2018;8(9):530-537. https://doi.org/10.1542/hpeds.2018-0032
13. Aronson PL, Thurm C, Alpern ER, et al; Febrile Young Infant Research Collaborative. Variation in care of the febrile young infant <90 days in US pediatric emergency departments. Pediatrics. 2014;134(4):667-677. https://doi.org/10.1542/peds.2014-1382
14. Florin TA, French B, Zorc JJ, Alpern ER, Shah SS. Variation in emergency department diagnostic testing and disposition outcomes in pneumonia. Pediatrics. 2013;132(2):237-244. https://doi.org/10.1542/peds.2013-0179
15. Brogan TV, Hall M, Williams DJ, et al. Variability in processes of care and outcomes among children hospitalized with community-acquired pneumonia. Pediatr Infect Dis J. 2012;31(10):1036-1041. https://doi.org/10.1097/inf.0b013e31825f2b10
16. Leyenaar JK, Lagu T, Shieh MS, Pekow PS, Lindenauer PK. Variation in resource utilization for the management of uncomplicated community-acquired pneumonia across community and children’s hospitals. J Pediatr. 2014;165(3):585-591. https://doi.org/10.1016/j.jpeds.2014.04.062
17. Knapp JF, Simon SD, Sharma V. Variation and trends in ED use of radiographs for asthma, bronchiolitis, and croup in children. Pediatrics. 2013;132(2):245-252. https://doi.org/10.1542/peds.2012-2830
18. Rice-Townsend S, Barnes JN, Hall M, Baxter JL, Rangel SJ. Variation in practice and resource utilization associated with the diagnosis and management of appendicitis at freestanding children’s hospitals: implications for value-based comparative analysis. Ann Surg. 2014;259(6):1228-1234. https://doi.org/10.1097/SLA.0000000000000246
19. Pediatric Quality Measures Program (PQMP). Agency for Healthcare Research and Quality. Accessed March 1, 2019. https://www.ahrq.gov/pqmp/index.html
20. NRD Database Documentation. Accessed June 1, 2019. https://www.hcup-us.ahrq.gov/db/nation/nrd/nrddbdocumentation.jsp
21. Inpatient Essentials. Children’s Hospitals Association. Accessed August 1, 2018. https://www.childrenshospitals.org/Programs-and-Services/Data-Analytics-and-Research/Pediatric-Analytic-Solutions/Inpatient-Essentials
22. Feudtner C, Feinstein JA, Zhong W, Hall M, Dai D. Pediatric complex chronic conditions classification system version 2: updated for ICD-10 and complex medical technology dependence and transplantation. BMC Pediatr. 2014;14:199. https://doi.org/10.1186/1471-2431-14-199
23. Clinical Classifications Software (CCS) for ICD-9-CM. Healthcare Cost and Utilization Project. March 2017. Accessed August 2, 2018. https://www.hcup-us.ahrq.gov/toolssoftware/ccs/ccs.jsp
24. NQF: Quality Positioning System. National Quality Forum. Accessed September 3, 2018. http://www.qualityforum.org/QPS/QPSTool.aspx
25. Berry JG, Ash AS, Cohen E, Hasan F, Feudtner C, Hall M. Contributions of children with multiple chronic conditions to pediatric hospitalizations in the United States: a retrospective cohort analysis. Hosp Pediatr. 2017;7(7):365-372. https://doi.org/10.1542/hpeds.2016-0179
26. Richardson T, Rodean J, Harris M, Berry J, Gay JC, Hall M. Development of Hospitalization Resource Intensity Scores for Kids (H-RISK) and comparison across pediatric populations. J Hosp Med. 2018;13(9):602-608. https://doi.org/10.12788/jhm.2948
27. Auger KA, Mueller EL, Weinberg SH, et al. A validated method for identifying unplanned pediatric readmission. J Pediatr. 2016;170:105-12.e122. https://doi.org/10.1016/j.jpeds.2015.11.051
28. NQF: Pediatric Measures Final Report. National Quality Forum. June 2016. Accessed January 24, 2019. https://www.qualityforum.org/Publications/2016/06/Pediatric_Measures_Final_Report.aspx
29. Hain PD, Gay JC, Berutti TW, Whitney GM, Wang W, Saville BR. Preventability of early readmissions at a children’s hospital. Pediatrics. 2013;131(1):e171-e181. https://doi.org/10.1542/peds.2012-0820
30. Toomey SL, Peltz A, Loren S, et al. Potentially preventable 30-day hospital readmissions at a children’s hospital. Pediatrics. 2016;138(2):e20154182. https://doi.org/10.1542/peds.2015-4182
31. Jonas JA, Devon EP, Ronan JC, et al. Determining preventability of pediatric readmissions using fault tree analysis. J Hosp Med. 2016;11(5):329-335. https://doi.org/10.1002/jhm.2555
32. Bucholz EM, Gay JC, Hall M, Harris M, Berry JG. Timing and causes of common pediatric readmissions. J Pediatr. 2018;200:240-248.e1. https://doi.org/10.1016/j.jpeds.2018.04.044
33. Morse RB, Hall M, Fieldston ES, et al. Children’s hospitals with shorter lengths of stay do not have higher readmission rates. J Pediatr. 2013;163(4):1034-8.e1. https://doi.org/10.1016/j.jpeds.2013.03.083
34. Kenyon CC, Melvin PR, Chiang VW, Elliott MN, Schuster MA, Berry JG. Rehospitalization for childhood asthma: timing, variation, and opportunities for intervention. J Pediatr. 2014;164(2):300-305. https://doi.org/10.1016/j.jpeds.2013.10.003
35. Thomson J, Hall M, Ambroggio L, et al. Aspiration and non-aspiration pneumonia in hospitalized children with neurologic impairment. Pediatrics. 2016;137(2):e20151612. https://doi.org/10.1542/peds.2015-1612
36. Coller RJ, Klitzner TS, Lerner CF, et al. Complex Care hospital use and postdischarge coaching: a randomized controlled trial. Pediatrics. 2018;142(2):e20174278. https://doi.org/10.1542/peds.2017-4278
37. Stephens JR, Kimple KS, Steiner MJ, Berry JG. Discharge interventions and modifiable risk factors for preventing hospital readmissions in children with medical complexity. Rev Recent Clin Trials. 2017;12(4):290-297. https://doi.org/10.2174/1574887112666170816144455
38. Bardach NS, Vittinghoff E, Asteria-Peñaloza R, et al. Measuring hospital quality using pediatric readmission and revisit rates. Pediatrics. 2013;132(3):429-436. https://doi.org/10.1542/peds.2012-3527
39. Leyenaar JK, Ralston SL, Shieh MS, Pekow PS, Mangione-Smith R, Lindenauer PK. Epidemiology of pediatric hospitalizations at general hospitals and freestanding children’s hospitals in the United States. J Hosp Med. 2016;11(11):743-749. https://doi.org/10.1002/jhm.2624
Hospitalizations for infections are common in children, with respiratory illnesses, including pneumonia and bronchiolitis, among the most prevalent indications for hospitalization.1,2 Infections are also among the most frequent indications for all-cause readmissions and for potentially preventable readmissions in children.3-5 Beyond hospital resource use, infection hospitalizations and readmissions represent a considerable cause of life disruption for patients and their families.6,7 While emerging evidence supports shortened durations of parenteral antibiotics before transitioning to oral therapy for some infections (eg, pyelonephritis, osteomyelitis),8-10 other infections may require extended treatment courses for weeks. The risk of adverse outcomes (eg, complications of medical treatment, readmission risk) and burdens placed on patients and their families may therefore differ across infection types and extend well beyond the immediate hospitalization.
Although infections are common and pediatric providers are expected to have proficiency in managing infections, substantial variation in the management of common pediatric infections exists and is associated with adverse hospitalization outcomes, including increased readmission risk and healthcare costs.11-18 Potentially avoidable resource use associated with hospital readmission from infection has led to adoption of hospital-level readmission metrics as indicators of the quality of healthcare delivery. For example, the Pediatric Quality Measures Program, established by the Children’s Health Insurance Program Reauthorization Act of 2009, has prioritized measurement of readmissions following hospitalization for lower respiratory tract infection.19 With government agencies increasingly using readmission metrics to assess quality of healthcare delivery, developing metrics that focus on these resource-intensive conditions is essential.
Because infections are a common and costly indication for hospital resource use and because substantial variation in management has been observed, promoting a broader understanding of infection-specific readmission rates is important for prioritizing readmission-reduction opportunities in children. This study’s objectives were the following: (1) to describe the prevalence and characteristics of infection hospitalizations in children and their associated readmissions and (2) to estimate the number of readmissions avoided and costs saved if all hospitals achieved the 10th percentile of the hospitals’ risk-adjusted readmission rate (ie, readmission benchmark).
METHODS
Study Design and Data Source
We performed a retrospective cohort analysis using the 2014 Agency for Healthcare Research and Quality (AHRQ) Nationwide Readmissions Database (NRD).20 The 2014 NRD is an administrative database that contains information on inpatient stays from January 1, 2014, to December 31, 2014, for all payers and allows for weighted national estimates of readmissions for all US individuals. Data within NRD are aggregated from 22 geographically diverse states representing approximately one-half of the US population. NRD contains deidentified patient-level data with unique verified patient identifiers to track individuals within and across hospitals in a state. However, AHRQ guidelines specify that NRD cannot be used for reporting hospital-specific readmission rates. Thus, for the current study, the Inpatient Essentials (Children’s Hospital Association), or IE, database was used to measure hospital-level readmission rates and to distinguish benchmark readmission rates for individual infection diagnoses.21 The IE database is composed of 90 children’s hospitals distributed throughout all regions of the United States. The inclusion of free-standing children’s hospitals and children’s hospitals within adult hospitals allows for comparisons and benchmarking across hospitals on multiple metrics, including readmissions.
Study Population
Children 0 to 17 years of age with a primary diagnosis at the index admission for infection between January 1, 2014, and November 30, 2014, were included. The end date of November 30, 2014, allowed for a full 30-day readmission window for all index admissions. We excluded index admissions that resulted in transfer to another acute care hospital or in-hospital mortality. Additionally, we excluded index admissions of children who had hematologic or immunologic conditions, malignancy, or history of bone marrow and solid-organ transplant, using the classification system for complex chronic conditions (CCCs) from Feudtner et al.22 Due to the high likelihood of immunosuppression in patients with these conditions, children may have nuanced experiences with illness severity, trajectory, and treatment associated with infection that place them at increased risk for nonpreventable readmission.
Main Exposure
The main exposure was infection type during the index admission. Condition-specific index admissions were identified using AHRQ’s Clinical Classifications Software (CCS) categories.23 CCS is a classification schema that categorizes the greater than 14,000 International Classification of Diseases, Ninth Revision, Clinical Modification (ICD-9-CM) diagnosis codes and 3,900 ICD-9-CM procedure codes into clinically meaningful categories of 295 diagnosis (including mental health codes and E-codes) and 231 procedural groupings. Twenty-two groupings indicative of infection were distinguished and used for the current study. Examples of infections included aspiration pneumonia, pneumonia, bronchiolitis, and sexually transmitted infection. We combined related CCS categories when possible for ease of interpretation and presentation of data (Appendix Table 1).
Main Outcome Measure
The main outcome measure was 30-day hospital readmission. Readmission was defined as all-cause, unplanned admission within 30 days following discharge from a preceding hospitalization. Planned hospital readmissions were identified and excluded using methods from AHRQ’s Pediatric All-Condition Readmission Measure.24 We defined a same-cause return as a return with the same CCS infection category as the index admission. Costs associated with readmissions were estimated from charges using hospital-specific cost-to-charge ratios provided with NRD.
Patient Demographic and Clinical Characteristics
Patient demographic characteristics included age at index admission (<1 year, 1-5 years, 6-9 years, 10-14 years, and 15-18 years), sex, payer (ie, government, private, other), and discharge disposition (ie, routine, home health, other). We assessed all patients for medical complexity, as defined by the presence of at least one CCC, and we reported the categories of CCCs by organ system involved.22 Otherwise, patients were identified as without medical complexity.
Statistical Analysis
We summarized continuous variables with medians and interquartile ranges and categorical variables with frequencies and percentages. To develop benchmark readmission rates for each infection type, we used generalized linear mixed models with random intercepts for each hospital in the IE database. For each infection type, the benchmark readmission rate was defined as the 10th percentile of hospitals’ risk-adjusted readmission rates. The 10th percentile was chosen to identify the best performing 10% of hospitals (ie, hospitals with the lowest readmission rates). Because children with medical complexity account for a large proportion of hospital resource use and are at high risk for readmission,4,25 we developed benchmarks stratified by presence/absence of a CCC (ie, with complexity vs without complexity). Models were adjusted for severity of illness using the Hospitalization Resource Intensity Score for Kids (H-RISK),26 a scoring system that assigns relative weights for each All Patient Refined Diagnosis-Related Group (3M Corporation) and severity of illness level, and each hospital’s risk-adjusted readmission rate was determined.
With use of weights to achieve national estimates of index admissions and readmissions, we determined the number of potentially avoidable readmissions by calculating the number of readmissions observed in the NRD that would not occur if all hospitals achieved readmission rates equal to the 10th percentile. Avoidable costs were estimated by multiplying the number of potentially avoidable readmissions by the mean cost of a readmission for infections of that type. Estimates of avoidable readmissions and costs were stratified by medical complexity. In addition to describing estimates at the 10th percentile benchmark, we similarly developed estimates of potentially avoidable readmissions and avoidable costs for the 5th and 25th percentiles, which are presented within Appendix Table 2 (children without complexity) and Appendix Table 3 (children with complexity).
All statistical analyses were performed using SAS version 9.4 (SAS Institute), and P values <.001 were considered statistically significant due to the large sample size. The Office of Research Integrity at Children’s Mercy Hospital deemed this study exempt from institutional board review.
RESULTS
Characteristics of the Study Population
The study included 380,067 index admissions for infection and an accompanying 18,469 unplanned all-cause readmissions over the 30 days following discharge (readmission rate, 4.9%; Table 1). Children ages 1 to 5 years accounted for the largest percentage (32.9%) of index hospitalizations, followed by infants younger than 1 year (30.3%). The readmission rate by age group was highest for infants younger than 1 year, compared with rates among all other age groups (5.6% among infants < 1 year vs 4.4%-4.7% for other age groups; P < .001). In the overall cohort, 16.2% of admissions included patients with a CCC. Children with medical complexity had higher readmission rates than those without medical complexity (no CCC, 3.2%; 1 CCC, 9.2%; 2+ CCCs, 18.9%). A greater percentage of children experiencing a readmission had government insurance (63.0% vs 59.2%; P < .001) and received home health nursing (10.1% vs 2.7%; P < .001) following the index encounter.
Children Without Complexity
Index Admissions and 30-day Readmissions
Among patients without medical complexity, index admissions occurred most frequently for pneumonia (n = 54,717), bronchiolitis (n = 53,959), and appendicitis (n = 45,036) (Figure 1). The median length of stay (LOS) for index admissions ranged from 1 to 5 days (Table 2), with septic arthritis and osteomyelitis having the longest median LOS at 5 (IQR, 3-7) days.
Thirty-day readmission rates varied substantially by infection at the index admission (range, 1.5% for sexually transmitted infection to 8.6% for peritonitis) (Figure 1). The median LOS for 30-day readmissions varied from 2 to 7 days (Table 2), while the median number of days to readmission varied substantially by infection type (range, 4 days for bacterial infection [site unspecified] to 24 days for sexually transmitted infections). Among the top five indications for admission for children without complexity, 14.9% to 52.8% of readmissions were for the same cause as the index admission; however, many additional returns were likely related to the index admission (Appendix Table 4). For example, among other return reasons, an additional 992 (61.7%) readmissions following appendicitis hospitalizations were for complications of surgical procedures or medical care, peritonitis, intestinal obstruction, and abdominal pain.
Impact of Achieving Readmission Benchmarks
Among children without complexity, readmission benchmarks (ie, the 10th percentile of readmission rates across hospitals) ranged from 0% to 26.7% (Figure 2). An estimated 54.7% of readmissions (n = 5,507) could potentially be reduced if hospitals achieved infection-specific benchmark readmission rates, which could result in an estimated $44.5 million in savings. Pneumonia, bronchiolitis, gastroenteritis, and upper respiratory tract infections were among conditions with the greatest potential reductions in readmissions and costs if a 10th percentile benchmark was achieved.
Children With Medical Complexity
Index Admissions and 30-day Readmissions
Among patients with complexity, index admissions occurred most frequently for pneumonia (n = 14,344), bronchiolitis (n = 8,618), and upper respiratory tract infection (n = 6,407) (Figure 1). The median LOS for index admissions ranged from 1 to 9 days (Table 2), with septicemia and CNS infections having the longest median LOS at 9 days.
Thirty-day readmission rates varied substantially by the type of infection at the index admission (range, 0% for sexually transmitted infection to 21.6% for aspiration pneumonia) (Figure 1). The median LOS for 30-day readmissions varied from 2 to 14 days (Table 2), and the median number of days to readmission varied substantially by infection type (range, 6 days for tonsillitis to 23 days for other infection). Among the top five indications for admission for medically complex children, 8% to 40.4% of readmissions were for the same cause as the index admission (Appendix Table 4). As with the children without complexity, additional returns were likely related to the index admission.
Impact of Achieving Readmission Benchmarks
Among children with medical complexity, readmission benchmarks ranged from 0% to 30.3% (Figure 2). An estimated 42.6% of readmissions (n = 3,576) could potentially be reduced if hospitals achieved infection-specific benchmark readmission rates, which could result in an estimated $70.8 million in savings. Pneumonia, bronchiolitis, septicemia, and upper respiratory tract infections were among conditions with the greatest potential reductions in readmissions and costs if the benchmarks were achieved.
DISCUSSION
The current study uncovered new findings regarding unplanned readmissions following index infection hospitalizations for children. In particular, readmission rates and time to readmission varied substantially by infection subtype. The study also identified priority infections and unique considerations for children with CCCs, all of which may help maximize the value of readmission metrics aimed at advancing hospital quality and reducing costs for infection hospitalizations in children. If all hospitals achieved the readmission rates of the best performing hospitals, 42.6% to 54.7% fewer readmissions could be realized with associated cost savings.
Nationally, studies have reported 30-day, all-cause unplanned readmission rates of 6.2% to 10.3%.5,27 In our current study we observed an overall readmission rate of 4.9% across all infectious conditions; however, readmission rates varied substantially by condition, with upper and lower respiratory tract infections, septicemia, and gastroenteritis among infections with the greatest number of potentially avoidable readmissions based on achievement of readmission benchmarks. Currently, pediatric-specific all-cause and lower respiratory tract infection readmission metrics have been developed with the aim of improving quality of care and reducing healthcare expenditures.28 Future readmission studies and metrics may prioritize conditions such as septicemia, gastroenteritis, and other respiratory tract infections. Our current study demonstrated that many readmissions following infection hospitalizations were associated with the same CCS category or within a related CCS category (eg, complications of surgical procedures or medical care, appendicitis, peritonitis, intestinal obstruction, and abdominal pain constituted the top five indications for readmission for appendicitis, whereas respiratory illnesses constituted the top five indications for readmissions for pneumonia). While this current study cannot clarify this relationship further, and the “avoidability” of unplanned readmissions is debated,29-31 our findings suggest that future investigations might focus on identifying whether condition-specific interventions during the index admission could mitigate some readmissions.
While the LOS of the index admission and the readmission were similar for most infection subtypes, we observed substantial variability in the temporal risk for readmission by infection subtype. Our observations complement studies exploring the timing of readmissions for other pediatric conditions.32-34 In particular, our findings further highlight that the composition and interaction of factors influencing infection readmissions may vary by condition. Infections represent a diverse group of conditions, with treatment courses that vary in need for parenteral antibiotics, ability to tailor treatment based on organism and susceptibilities, and length of treatment. While treatment for some infections may be accomplished, or nearly accomplished, prior to discharge, other infections (eg, osteomyelitis) may require prolonged treatment, shifting the burden of management and monitoring to patients and their families, which along with the timeliness and adequacy of outpatient follow-up, may modify an individual’s readmission risk. Consequently, a “one-size fits all” approach to discharge counseling may not be successful across all conditions. Our study lays the groundwork for how these temporal relationships may be used by clinicians to counsel families regarding the likely readmission timeframe, based on infection, and to establish follow-up appointments ahead of the infection-specific “readmission window,” which may allow outpatient providers to intervene when readmission risk is greatest.
Consistent with prior literature, children with medical complexity in our study had increased frequency of 30-day, all-cause unplanned readmissions and LOS, compared with peers who did not have complexity.5 Readmission rates following hospitalizations for aspiration pneumonia were comparable to those reported by Thompson et al in their study examining rates of pneumonia in children with neurologic impairment.35 In our current study, nearly 96% of readmissions following aspiration pneumonia hospitalizations were for children with medical complexity, and more than 58% of these readmissions were for aspiration pneumonia or respiratory illness. Future investigations should seek to explore factors contributing to readmissions in children with medical complexity and to evaluate whether interventions such as postdischarge coaching or discharge bundles could assist with reductions in healthcare resource use.36,37
Despite a lack of clear association between readmissions and quality of care for children,38 readmissions rates continue to be used as a quality measure for hospitalized patients. Within our present study, we found that achieving benchmark readmission rates for infection hospitalizations could lead to substantial reductions in readmissions; however, these reductions were seen across this relatively similar group of infection diagnoses, and hospitals may face greater challenges when attempting to achieve a 10th percentile readmission benchmark across a more expansive set of diagnoses. Despite these challenges, understanding the intricacies of readmissions may lead to improved readmission metrics and the systematic identification of avoidable readmissions, the goal of which is to enhance the quality of healthcare for hospitalized children.
Our findings should be interpreted in the context of several limitations. We defined our readmission benchmark at the 10th percentile using the IE database. Because an estimated 70% of hospitalizations for children occur within general hospitals,39 we believe that our use of the IE database allowed for increased generalizability, though the broadening of our findings to nonacademic hospital settings may be less reliable. While we describe the 10th percentile readmission benchmark here, alternative benchmarks would result in different estimates of avoidable readmissions and associated readmission costs (Appendix Tables 2 and 3). The IE and NRD databases do not distinguish intensive care use. We tried to address this limitation through model adjustments using H-RISK, which is particularly helpful for adjusting for NICU admissions through use of the 27 All Patient Refined Diagnosis-Related Groups for neonatal conditions. Additionally, the NRD uses state-level data to derive national estimates and is not equipped to measure readmissions to hospitals in a different state, distinguish patient deaths occurring after discharge, or to examine the specific indication for readmission (ie, unable to assess if the readmission is related to a complication of the treatment plan, progression of the illness course, or for an unrelated reason). While sociodemographic and socioeconomic factors may affect readmissions, the NRD does not contain information on patients’ race/ethnicity, family/social attributes, or postdischarge follow-up health services, which are known to influence the need for readmission.
Despite these limitations, this study highlights future areas for research and potential opportunities for reducing readmission following infection hospitalizations. First, identifying hospital- and systems-based factors that contribute to readmission reductions at the best-performing hospitals may identify opportunities for hospitals with the highest readmission rates to achieve the rates of the best-performing hospitals. Second, conditions such as upper and lower respiratory tract infections, along with septicemia and gastroenteritis, may serve as prime targets for future investigation based on the estimated number of avoidable readmissions and potential cost savings associated with these conditions. Finally, future investigations that explore discharge counseling and follow-up tailored to the infection-specific temporal risk and patient complexity may identify opportunities for further readmission reductions.
CONCLUSION
Our study provides a broad look at readmissions following infection hospitalizations and highlights substantial variation in readmissions based on infection type. To improve hospital resource use for infections, future preventive measures could prioritize children with complex chronic conditions and those with specific diagnoses (eg, upper and lower respiratory tract infections).
Disclaimer
This information or content and conclusions are those of the authors and should not be construed as the official position or policy of, nor should any endorsements be inferred by, NIH or the US government.
1. Keren R, Luan X, Localio R, et al; Pediatric Research in Inpatient Settings (PRIS) Network. Prioritization of comparative effectiveness research topics in hospital pediatrics. Arch Pediatr Adolesc Med. 2012;166(12):1155-1164. https://doi.org/10.1001/archpediatrics.2012.1266
2. Van Horne B, Netherton E, Helton J, Fu M, Greeley C. The scope and trends of pediatric hospitalizations in Texas, 2004-2010. Hosp Pediatr. 2015;5(7):390-398. https://doi.org/10.1542/hpeds.2014-0105
3. Neuman MI, Hall M, Gay JC, et al. Readmissions among children previously hospitalized with pneumonia. Pediatrics. 2014;134(1):100-109. https://doi.org/10.1542/peds.2014-0331
4. Gay JC, Hain PD, Grantham JA, Saville BR. Epidemiology of 15-day readmissions to a children’s hospital. Pediatrics. 2011;127(6):e1505-e1512. https://doi.org/10.1542/peds.2010-1737
5. Berry JG, Toomey SL, Zaslavsky AM, et al. Pediatric readmission prevalence and variability across hospitals. JAMA. 2013;309(4):372-380. https://doi.org/10.1001/jama.2012.188351
6. Shudy M, de Almeida ML, Ly S, et al. Impact of pediatric critical illness and injury on families: a systematic literature review. Pediatrics. 2006;118(suppl 3):S203-S218. https://doi.org/10.1542/peds.2006-0951b
7. Rennick JE, Johnston CC, Dougherty G, Platt R, Ritchie JA. Children’s psychological responses after critical illness and exposure to invasive technology. J Dev Behav Pediatr. 2002;23(3):133-144. https://doi.org/10.1097/00004703-200206000-00002
8. Michael M, Hodson EM, Craig JC, Martin S, Moyer VA. Short versus standard duration oral antibiotic therapy for acute urinary tract infection in children. Cochrane Database Syst Rev. 2003;(1):CD003966. https://doi.org/10.1002/14651858.cd003966
9. Greenberg D, Givon-Lavi N, Sadaka Y, Ben-Shimol S, Bar-Ziv J, Dagan R. Short-course antibiotic treatment for community-acquired alveolar pneumonia in ambulatory children: a double-blind, randomized, placebo-controlled trial. Pediatr Infect Dis J. 2014;33(2):136-142. https://doi.org/10.1097/inf.0000000000000023
10. Keren R, Shah SS, Srivastava R, et al; Pediatric Research in Inpatient Settings Network. Comparative effectiveness of intravenous vs oral antibiotics for postdischarge treatment of acute osteomyelitis in children. JAMA Pediatr. 2015;169(2):120-128. https://doi.org/10.1001/jamapediatrics.2014.2822
11. Markham JL, Hall M, Bettenhausen JL, Myers AL, Puls HT, McCulloh RJ. Variation in care and clinical outcomes in children hospitalized with orbital cellulitis. Hosp Pediatr. 2018;8(1):28-35. https://doi.org/10.1542/hpeds.2017-0040
12. Neubauer HC, Hall M, Wallace SS, Cruz AT, Queen MA, Foradori DM, Aronson PL, Markham JL, Nead JA, Hester GZ, McCulloh RJ, Lopez MA. Variation in diagnostic test use and associated outcomes in staphylococcal scalded skin syndrome at children’s hospitals. Hosp Pediatr. 2018;8(9):530-537. https://doi.org/10.1542/hpeds.2018-0032
13. Aronson PL, Thurm C, Alpern ER, et al; Febrile Young Infant Research Collaborative. Variation in care of the febrile young infant <90 days in US pediatric emergency departments. Pediatrics. 2014;134(4):667-677. https://doi.org/10.1542/peds.2014-1382
14. Florin TA, French B, Zorc JJ, Alpern ER, Shah SS. Variation in emergency department diagnostic testing and disposition outcomes in pneumonia. Pediatrics. 2013;132(2):237-244. https://doi.org/10.1542/peds.2013-0179
15. Brogan TV, Hall M, Williams DJ, et al. Variability in processes of care and outcomes among children hospitalized with community-acquired pneumonia. Pediatr Infect Dis J. 2012;31(10):1036-1041. https://doi.org/10.1097/inf.0b013e31825f2b10
16. Leyenaar JK, Lagu T, Shieh MS, Pekow PS, Lindenauer PK. Variation in resource utilization for the management of uncomplicated community-acquired pneumonia across community and children’s hospitals. J Pediatr. 2014;165(3):585-591. https://doi.org/10.1016/j.jpeds.2014.04.062
17. Knapp JF, Simon SD, Sharma V. Variation and trends in ED use of radiographs for asthma, bronchiolitis, and croup in children. Pediatrics. 2013;132(2):245-252. https://doi.org/10.1542/peds.2012-2830
18. Rice-Townsend S, Barnes JN, Hall M, Baxter JL, Rangel SJ. Variation in practice and resource utilization associated with the diagnosis and management of appendicitis at freestanding children’s hospitals: implications for value-based comparative analysis. Ann Surg. 2014;259(6):1228-1234. https://doi.org/10.1097/SLA.0000000000000246
19. Pediatric Quality Measures Program (PQMP). Agency for Healthcare Research and Quality. Accessed March 1, 2019. https://www.ahrq.gov/pqmp/index.html
20. NRD Database Documentation. Accessed June 1, 2019. https://www.hcup-us.ahrq.gov/db/nation/nrd/nrddbdocumentation.jsp
21. Inpatient Essentials. Children’s Hospitals Association. Accessed August 1, 2018. https://www.childrenshospitals.org/Programs-and-Services/Data-Analytics-and-Research/Pediatric-Analytic-Solutions/Inpatient-Essentials
22. Feudtner C, Feinstein JA, Zhong W, Hall M, Dai D. Pediatric complex chronic conditions classification system version 2: updated for ICD-10 and complex medical technology dependence and transplantation. BMC Pediatr. 2014;14:199. https://doi.org/10.1186/1471-2431-14-199
23. Clinical Classifications Software (CCS) for ICD-9-CM. Healthcare Cost and Utilization Project. March 2017. Accessed August 2, 2018. https://www.hcup-us.ahrq.gov/toolssoftware/ccs/ccs.jsp
24. NQF: Quality Positioning System. National Quality Forum. Accessed September 3, 2018. http://www.qualityforum.org/QPS/QPSTool.aspx
25. Berry JG, Ash AS, Cohen E, Hasan F, Feudtner C, Hall M. Contributions of children with multiple chronic conditions to pediatric hospitalizations in the United States: a retrospective cohort analysis. Hosp Pediatr. 2017;7(7):365-372. https://doi.org/10.1542/hpeds.2016-0179
26. Richardson T, Rodean J, Harris M, Berry J, Gay JC, Hall M. Development of Hospitalization Resource Intensity Scores for Kids (H-RISK) and comparison across pediatric populations. J Hosp Med. 2018;13(9):602-608. https://doi.org/10.12788/jhm.2948
27. Auger KA, Mueller EL, Weinberg SH, et al. A validated method for identifying unplanned pediatric readmission. J Pediatr. 2016;170:105-12.e122. https://doi.org/10.1016/j.jpeds.2015.11.051
28. NQF: Pediatric Measures Final Report. National Quality Forum. June 2016. Accessed January 24, 2019. https://www.qualityforum.org/Publications/2016/06/Pediatric_Measures_Final_Report.aspx
29. Hain PD, Gay JC, Berutti TW, Whitney GM, Wang W, Saville BR. Preventability of early readmissions at a children’s hospital. Pediatrics. 2013;131(1):e171-e181. https://doi.org/10.1542/peds.2012-0820
30. Toomey SL, Peltz A, Loren S, et al. Potentially preventable 30-day hospital readmissions at a children’s hospital. Pediatrics. 2016;138(2):e20154182. https://doi.org/10.1542/peds.2015-4182
31. Jonas JA, Devon EP, Ronan JC, et al. Determining preventability of pediatric readmissions using fault tree analysis. J Hosp Med. 2016;11(5):329-335. https://doi.org/10.1002/jhm.2555
32. Bucholz EM, Gay JC, Hall M, Harris M, Berry JG. Timing and causes of common pediatric readmissions. J Pediatr. 2018;200:240-248.e1. https://doi.org/10.1016/j.jpeds.2018.04.044
33. Morse RB, Hall M, Fieldston ES, et al. Children’s hospitals with shorter lengths of stay do not have higher readmission rates. J Pediatr. 2013;163(4):1034-8.e1. https://doi.org/10.1016/j.jpeds.2013.03.083
34. Kenyon CC, Melvin PR, Chiang VW, Elliott MN, Schuster MA, Berry JG. Rehospitalization for childhood asthma: timing, variation, and opportunities for intervention. J Pediatr. 2014;164(2):300-305. https://doi.org/10.1016/j.jpeds.2013.10.003
35. Thomson J, Hall M, Ambroggio L, et al. Aspiration and non-aspiration pneumonia in hospitalized children with neurologic impairment. Pediatrics. 2016;137(2):e20151612. https://doi.org/10.1542/peds.2015-1612
36. Coller RJ, Klitzner TS, Lerner CF, et al. Complex Care hospital use and postdischarge coaching: a randomized controlled trial. Pediatrics. 2018;142(2):e20174278. https://doi.org/10.1542/peds.2017-4278
37. Stephens JR, Kimple KS, Steiner MJ, Berry JG. Discharge interventions and modifiable risk factors for preventing hospital readmissions in children with medical complexity. Rev Recent Clin Trials. 2017;12(4):290-297. https://doi.org/10.2174/1574887112666170816144455
38. Bardach NS, Vittinghoff E, Asteria-Peñaloza R, et al. Measuring hospital quality using pediatric readmission and revisit rates. Pediatrics. 2013;132(3):429-436. https://doi.org/10.1542/peds.2012-3527
39. Leyenaar JK, Ralston SL, Shieh MS, Pekow PS, Mangione-Smith R, Lindenauer PK. Epidemiology of pediatric hospitalizations at general hospitals and freestanding children’s hospitals in the United States. J Hosp Med. 2016;11(11):743-749. https://doi.org/10.1002/jhm.2624
© 2021 Society of Hospital Medicine
Opportunities for Stewardship in the Transition From Intravenous to Enteral Antibiotics in Hospitalized Pediatric Patients
Bacterial infections are a common reason for pediatric hospital admissions in the United States.1 Antibiotics are the mainstay of treatment, and whether to administer them intravenously (IV) or enterally is an important and, at times, challenging decision. Not all hospitalized patients with infections require IV antibiotics, and safe, effective early transitions to enteral therapy have been described for numerous infections.2-7 However, guidelines describing the ideal initial route of antibiotic administration and when to transition to oral therapy are lacking.5,7,8 This lack of high-quality evidence-based guidance may contribute to overuse of IV antibiotics for many hospitalized pediatric patients, even when safe and effective enteral options exist.9
Significant costs and harms are associated with the use of IV antibiotics. In particular, studies have demonstrated longer length of stay (LOS), increased costs, and worsened pain or anxiety related to complications (eg, phlebitis, extravasation injury, thrombosis, catheter-associated bloodstream infections) associated with IV antibiotics.3,4,10-13 Earlier transition to enteral therapy, however, can mitigate these increased risks and costs.
The Centers for Disease Control and Prevention lists the transition from IV to oral antibiotics as a key stewardship intervention for improving antibiotic use.14 The Infectious Diseases Society of America (IDSA) antibiotic stewardship program guidelines strongly recommend the timely conversion from IV to oral antibiotics, stating that efforts focusing on this transition should be integrated into routine practice.15 There are a few metrics in the literature to measure this intervention, but none is universally used, and a modified delphi process could not reach consensus on IV-to-oral transition metrics.16
Few studies describe the opportunity to transition to enteral antibiotics in hospitalized patients with common bacterial infections or explore variation across hospitals. It is critical to understand current practice of antibiotic administration in order to identify opportunities to optimize patient outcomes and promote high-value care. Furthermore, few studies have evaluated the feasibility of IV-to-oral transition metrics using an administrative database. Thus, the aims of this study were to (1) determine opportunities to transition from IV to enteral antibiotics for pediatric patients hospitalized with common bacterial infections based on their ability to tolerate other enteral medications, (2) describe variation in transition practices among children’s hospitals, and (3) evaluate the feasibility of novel IV-to-oral transition metrics using an administrative database to inform stewardship efforts.
METHODS
Study Design and Setting
This multicenter, retrospective cohort study used data from the Pediatric Health Information System (PHIS), an administrative and billing database containing encounter-level data from 52 tertiary care pediatric hospitals across the United States affiliated with the Children’s Hospital Association (Lenexa, Kansas). Hospitals submit encounter-level data, including demographics, medications, and diagnoses based on International Classification of Disease, Tenth Revision, Clinical Modification (ICD-10-CM) codes. Data were de-identified at the time of submission, and data quality and reliability were assured by joint efforts between the Children’s Hospital Association and participating hospitals.
Study Population
This study included pediatric patients aged 60 days to 18 years who were hospitalized (inpatient or observation status) at one of the participating hospitals between January 1, 2017, and December 31, 2018, for one of the following seven common bacterial infections: community-acquired pneumonia (CAP), neck infection (superficial and deep), periorbital/orbital infection, urinary tract infection (UTI), osteomyelitis, septic arthritis, or skin and soft tissue infection (SSTI). The diagnosis cohorts were defined based on ICD-10-CM discharge diagnoses adapted from previous studies (Appendix Table 1).3,17-23 To define a cohort of generally healthy pediatric patients with an acute infection, we excluded patients hospitalized in the intensive care unit, patients with nonhome discharges, and patients with complex chronic conditions.24 We also excluded hospitals with incomplete data during the study period (n=1). The Institutional Review Board at Cincinnati Children’s Hospital Medical Center determined this study to be non–human-subjects research.
Outcomes
The primary outcomes were the number of opportunity days and the percent of days with opportunity to transition from IV to enteral therapy. Opportunity days, or days in which there was a potential opportunity to transition from IV to enteral antibiotics, were defined as days patients received only IV antibiotic doses and at least one enteral nonantibiotic medication, suggesting an ability to take enteral medications.13 We excluded days patients received IV antibiotics for which there was no enteral alternative (eg, vancomycin, Appendix Table 2). When measuring opportunity, to be conservative (ie, to underestimate rather than overestimate opportunity), we did not count as an opportunity day any day in which patients received both IV and enteral antibiotics. Percent opportunity, or the percent of days patients received antibiotics in which there was potential opportunity to transition from IV to enteral antibiotics, was defined as the number of opportunity days divided by number of inpatient days patients received enteral antibiotics or IV antibiotics with at least one enteral nonantibiotic medication (antibiotic days). Similar to opportunity days, antibiotic days excluded days patients were on IV antibiotics for which there was no enteral alternative. Based on our definition, a lower percent opportunity indicates that a hospital is using enteral antibiotics earlier during the hospitalization (earlier transition), while a higher percent opportunity represents later enteral antibiotic use (later transition).
Statistical Analysis
Demographic and clinical characteristics were summarized by diagnosis with descriptive statistics, including frequency with percentage, mean with standard deviation, and median with interquartile range (IQR). For each diagnosis, we evaluated aggregate opportunity days (sum of opportunity days among all hospitals), opportunity days per encounter, and aggregate percent opportunity using frequencies, mean with standard deviation, and percentages, respectively. We also calculated aggregate opportunity days for diagnosis-antibiotic combinations. To visually show variation in the percent opportunity across hospitals, we displayed the percent opportunity on a heat map, and evaluated percent opportunity across hospitals using chi-square tests. To compare the variability in the percent opportunity across and within hospitals, we used a generalized linear model with two fixed effects (hospital and diagnosis), and parsed the variability using the sum of squares. We performed a sensitivity analysis and excluded days that patients received antiemetic medications (eg, ondansetron, granisetron, prochlorperazine, promethazine), as these suggest potential intolerance of enteral medications. All statistical analyses were performed using SAS v.9.4 (SAS Institute Inc, Cary, North Carolina) and GraphPad Prism 8.0 (GraphPad Software Inc., San Diego, California), and P values < .05 were considered statistically significant.
RESULTS
During the 2-year study period, 100,103 hospitalizations met our inclusion criteria across 51 hospitals and seven diagnosis categories (Table 1). Diagnosis cohorts ranged in size from 1,462 encounters for septic arthritis to 35,665 encounters for neck infections. Overall, we identified 88,522 aggregate opportunity days on which there was an opportunity to switch from IV to enteral treatment in the majority of participants (percent opportunity, 57%).

Opportunity by Diagnosis
The number of opportunity days (aggregate and mean per encounter) and percent opportunity varied by diagnosis (Table 2). The aggregate number of opportunity days ranged from 3,693 in patients with septic arthritis to 25,359 in patients with SSTI, and mean opportunity days per encounter ranged from 0.9 in CAP to 2.8 in septic arthritis. Percent opportunity was highest for septic arthritis at 72.7% and lowest for CAP at 39.7%.

Variation in Opportunity Among Hospitals
The variation in the percent opportunity across hospitals was statistically significant for all diagnoses (Figure). Within hospitals, we observed similar practice patterns across diagnoses. For example, hospitals with a higher percent opportunity for one diagnosis tended to have higher percent opportunity for the other diagnoses (as noted in the top portion of the Figure), and those with lower percent opportunity for one diagnosis tended to also have lower percent opportunity for the other diagnoses studied (as noted in the bottom portion of the Figure). When evaluating variability in the percent opportunity, 45% of the variability was attributable to the hospital-effect and 35% to the diagnosis; the remainder was unexplained variability. Sensitivity analysis excluding days when patients received an antiemetic medication yielded no differences in our results.

Opportunity by Antibiotic
The aggregate number of opportunity days varied by antibiotic (Table 3). Intravenous antibiotics with the largest number of opportunity days included clindamycin (44,293), ceftriaxone (23,896), and ampicillin-sulbactam (15,484). Antibiotic-diagnosis combinations with the largest number of opportunity days for each diagnosis included ceftriaxone and ampicillin in CAP; clindamycin in cellulitis, SSTI, and neck infections; ceftriaxone in UTI; and cefazolin in osteomyelitis and septic arthritis.

DISCUSSION
In this multicenter study of pediatric patients hospitalized with common bacterial infections, there was the potential to transition from IV to enteral treatment in over half of the antibiotic days. The degree of opportunity varied by infection, antibiotic, and hospital. Antibiotics with a large aggregate number of opportunity days for enteral transition included clindamycin, which has excellent bioavailability; and ampicillin and ampicillin-sulbactam, which can achieve pharmacodynamic targets with oral equivalents.25-29 The across-hospital variation for a given diagnosis suggests that certain hospitals have strategies in place which permit an earlier transition to enteral antibiotics compared to other institutions in which there were likely missed opportunities to do so. This variability is likely due to limited evidence, emphasizing the need for robust studies to better understand the optimal initial antibiotic route and transition time. Our findings highlight the need for, and large potential impact of, stewardship efforts to promote earlier transition for specific drug targets. This study also demonstrates the feasibility of obtaining two metrics—percent opportunity and opportunity days—from administrative databases to inform stewardship efforts within and across hospitals.
Opportunity days and percent opportunity varied among diagnoses. The variation in aggregate opportunity days was largely a reflection of the number of encounters: Diagnoses such as SSTI, neck infections, and CAP had a large number of both aggregate opportunity days and encounters. The range of opportunity days per encounter (0.9-2.5) suggests potential missed opportunities to transition to enteral antibiotics across all diagnoses (Table 2). The higher opportunity days per encounter in osteomyelitis and septic arthritis may be related to longer LOS and higher percent opportunity. Percent opportunity likely varied among diagnoses due to differences in admission and discharge readiness criteria, diagnostic evaluation, frequency of antibiotic administration, and evidence on the optimal route of initial antibiotics and when to transition to oral formulations. For example, we hypothesize that certain diagnoses, such as osteomyelitis and septic arthritis, have admission and discharge readiness criteria directly tied to the perceived need for IV antibiotics, which may limit in-hospital days on enteral antibiotics and explain the high percent opportunity that we observed. The high percent opportunity seen in musculoskeletal infections also may be due to delays in initiating targeted treatment until culture results were available. Encounters for CAP had the lowest percent opportunity; we hypothesize that this is because admission and discharge readiness may be determined by factors other than the need for IV antibiotics (eg, need for supplemental oxygen), which may increase days on enteral antibiotics and lead to a lower percent opportunity.30
Urinary tract infection encounters had a high percent opportunity. As with musculoskeletal infection, this may be related to delays in initiating targeted treatment until culture results became available. Another reason for the high percent opportunity in UTI could be the common use of ceftriaxone, which, dosed every 24 hours, likely reduced the opportunity to transition to enteral antibiotics. There is strong evidence demonstrating no difference in outcomes based on antibiotic routes for UTI, and we would expect this to result in a low percent opportunity.2,31 While the observed high opportunity in UTI may relate to an initial unknown diagnosis or concern for systemic infection, this highlights potential opportunities for quality improvement initiatives to promote empiric oral antibiotics in clinically stable patients hospitalized with suspected UTI.
There was substantial variation in percent opportunity across hospitals for a given diagnosis, with less variation across diagnoses for a given hospital. Variation across hospitals but consistency within individual hospitals suggests that some hospitals may promote earlier transition from IV to enteral antibiotics as standard practice for all diagnoses, while other hospitals continue IV antibiotics for the entire hospitalization, highlighting potential missed opportunities at some institutions. While emerging data suggest that traditional long durations of IV antibiotics are not necessary for many infections, the limited evidence on the optimal time to switch to oral antibiotics may have influenced this variation.2-7 Many guidelines recommend initial IV antibiotics for hospitalized pediatric patients, but there are few studies comparing IV and enteral therapy.2,5,9 Limited evidence leaves significant room for hospital culture, antibiotic stewardship efforts, reimbursement considerations, and/or hospital workflow to influence transition timing and overall opportunity at individual hospitals.7,8,32-34 These findings emphasize the importance of research to identify optimal transition time and comparative effectiveness studies to evaluate whether initial IV antibiotics are truly needed for mild—and even severe—disease presentations. Since many patients are admitted for the perceived need for IV antibiotics, earlier use of enteral antibiotics could reduce rates of hospitalizations, LOS, healthcare costs, and resource utilization.
Antibiotics with a high number of opportunity days included clindamycin, ceftriaxone, ampicillin-sublactam, and ampicillin. Our findings are consistent with another study which found that most bioavailable drugs, including clindamycin, were administered via the IV route and accounted for a large number of antibiotic days.35 The Infectious Diseases Society of America recommends that hospitals promote earlier transition to oral formulations for highly bioavailable drugs.7 Given the high bioavailability of clindamycin, its common use in high-frequency encounters such as SSTI and neck infections, and the fact that it accounted for a large number of opportunity days, quality improvement initiatives promoting earlier transition to oral clindamycin could have a large impact across health systems.25,26 Additionally, although beta-lactam antibiotics such as amoxicillin and amoxicillin-sulbactam are not highly bioavailable, oral dosing can achieve sufficient serum concentrations to reach pharmacodynamic targets for common clinical indications; this could be an important quality improvement initiative.27-29 Several single-site studies have successfully implemented quality improvement initiatives to promote earlier IV-to-enteral transition, with resulting reductions in costs and no adverse events noted, highlighting the feasibility and impact of such efforts.13,36-38
This study also demonstrates the feasibility of collecting two metrics (percent opportunity and opportunity days) from administrative databases to inform IV-to-oral transition benchmarking and stewardship efforts. While there are several metrics in the literature for evaluating antibiotic transition (eg, days of IV or oral therapy, percentage of antibiotics given via the oral route, time to switch from IV to oral, and acceptance rate of suggested changes to antibiotic route), none are universally used or agreed upon.15,16,39 The opportunity metrics used in this study have several strengths, including the feasibility of obtaining them from existing databases and the ability to account for intake of other enteral medications; the latter is not evaluated in other metrics. These opportunity metrics can be used together to identify the percent of time in which there is opportunity to transition and total number of days to understand the full extent of potential opportunity for future interventions. As demonstrated in this study, these metrics can be measured by diagnosis, antibiotic, or diagnosis-antibiotic combination, and they can be used to evaluate stewardship efforts at a single institution over time or compare efforts across hospitals.
These findings should be interpreted in the context of important limitations. First, we attempted to characterize potential opportunity to transition to enteral medications based on a patient’s ability to tolerate nonenteral medications. However, there are other factors that could limit the opportunity to transition that we could not account for with an administrative dataset, including the use of antibiotics prior to admission, disease progression, severity of illness, and malabsorptive concerns. Thus, though we may have overestimated the true opportunity to transition to enteral antibiotics, it is unlikely that this would account for all of the variation in transition times that we observed across hospitals. Second, while our study required patients to have one of seven types of infection, we did not exclude any additional infectious diagnoses (eg, concurrent bacteremia, Clostridioides difficile, otitis media) that could have driven the choice of antibiotic type and modality. Although emerging evidence is supporting earlier transitions to oral therapy, bacteremia is typically treated with IV antibiotics; this may have led to an overestimation of true opportunity.40 “Clostridioides” difficile and otitis media are typically treated with enteral therapy; concurrent infections such as these may have led to an underestimation of opportunity given the fact that, based on our definition, the days on which patients received both IV and enteral antibiotics were not counted as opportunity days. Third, because PHIS uses billing days to capture medication use, we were unable to distinguish transitions that occurred early in the day vs those that took place later in the day. This could have led to an underestimation of percent opportunity, particularly for diagnoses with a short LOS; it also likely led to an underestimation of the variability observed across hospitals. Fourth, because we used an administrative dataset, we are unable to understand reasoning behind transitioning time from IV to oral antibiotics, as well as provider, patient, and institutional level factors that influenced these decisions.
CONCLUSION
Children hospitalized with bacterial infections often receive IV antibiotics, and the timing of transition from IV to enteral antibiotics varies significantly across hospitals. Further research is needed to compare the effectiveness of IV and enteral antibiotics and better define criteria for transition to enteral therapy. We identified ample opportunities for quality improvement initiatives to promote earlier transition, which have the potential to reduce healthcare utilization and promote optimal patient-directed high-value care.
1. Keren R, Luan X, Localio R, et al. Prioritization of comparative effectiveness research topics in hospital pediatrics. Arch Pediatr Adolesc Med. 2012;166(12):1155-1164. https://doi.org/10.1001/archpediatrics.2012.1266
2. McMullan BJ, Andresen D, Blyth CC, et al. Antibiotic duration and timing of the switch from intravenous to oral route for bacterial infections in children: systematic review and guidelines. Lancet Infect Dis. 2016;16(8):e139-e152. https://doi.org/10.1016/S1473-3099(16)30024-X
3. Keren R, Shah SS, Srivastava R, et al; for the Pediatric Research Inpatient Settings Network. Comparative effectiveness of intravenous vs oral antibiotics for postdischarge treatment of acute osteomyelitis in children. JAMA Pediatr. 2015;169(2):120-128. https://doi.org/10.1001/jamapediatrics.2014.2822
4. Shah SS, Srivastava R, Wu S, et al. Intravenous versus oral antibiotics for postdischarge treatment of complicated pneumonia. Pediatrics. 2016;138(6):e201692. https://doi.org/10.1542/peds.2016-1692
5. Li HK, Agweyu A, English M, Bejon P. An unsupported preference for intravenous antibiotics. PLoS Med. 2015;12(5):e1001825. https://dx.doi.org/10.1371%2Fjournal.pmed.1001825
6. Dellit TH, Owens RC, McGowan JE Jr, et al; Infectious Diseases Society of America; Society for Healthcare Epidemiology of America. Infectious Diseases Society of America and the Society for Healthcare Epidemiology of America guidelines for developing an institutional program to enhance antimicrobial stewardship. Clin Infect Dis. 2007;44(2):159-177. https://doi.org/10.1086/510393
7. Bradley JS, Byington CL, Shah SS, et al; Pediatric Infectious Diseases Society and the Infectious Diseases Society of America. Management of community-acquired pneumonia (CAP) in infants and children older than 3 months of age: clinical practice guidelines by the Pediatric Infectious Diseases Society and the Infectious Diseases Society of America. Clin Infect Dis. 2011;53(7):e25-e76. https://doi.org/10.1542/peds.2011-2385
8. Septimus EJ, Owens RC Jr. Need and potential of antimicrobial stewardship in community hospitals. Clin Infect Dis. 2011;53 Suppl 1:S8-S14. https://doi.org/10.1093/cid/cir363
9. Schroeder AR, Ralston SL. Intravenous antibiotic durations for common bacterial infections in children: when is enough? J Hosp Med. 2014;9(9):604-609. https://doi.org/10.1002/jhm.2239
10. Christensen EW, Spaulding AB, Pomputius WF, Grapentine SP. Effects of hospital practice patterns for antibiotic administration for pneumonia on hospital lengths of stay and costs. J Pediatric Infect Dis Soc. 2019;8(2):115-121. https://doi.org/10.1093/jpids/piy003
11. van Zanten AR, Engelfriet PM, van Dillen K, van Veen M, Nuijten MJ, Polderman KH. Importance of nondrug costs of intravenous antibiotic therapy. Crit Care. 2003;7(6):R184-R190. https://doi.org/10.1186/cc2388
12. Ruebner R, Keren R, Coffin S, Chu J, Horn D, Zaoutis TE. Complications of central venous catheters used for the treatment of acute hematogenous osteomyelitis. Pediatrics. 2006;117(4):1210-1215. https://doi.org/10.1542/peds.2005-1465
13. Girdwood SCT, Sellas MN, Courter JD, et al. Improving the transition of intravenous to enteral antibiotics in pediatric patients with pneumonia or skin and soft tissue infections. J Hosp Med. 2020;15(1):10-15. https://doi.org/10.12788/jhm.3253
14. Core Elements of Hospital Antibiotic Stewardship Programs. Centers for Disease Control and Prevention. Published 2019. Accessed May 30, 2020. https://www.cdc.gov/antibiotic-use/core-elements/hospital.html
15. Barlam TF, Cosgrove SE, Abbo LM, et al. Implementing an antibiotic stewardship program: guidelines by the Infectious Diseases Society of America and the Society for Healthcare Epidemiology of America. Clin Infect Dis. 2016;62(10):e51-e77. https://doi.org/10.1093/cid/ciw118
16. Science M, Timberlake K, Morris A, Read S, Le Saux N; Groupe Antibiothérapie en Pédiatrie Canada Alliance for Stewardship of Antimicrobials in Pediatrics (GAP Can ASAP). Quality metrics for antimicrobial stewardship programs. Pediatrics. 2019;143(4):e20182372. https://doi.org/10.1542/peds.2018-2372
17. Tchou MJ, Hall M, Shah SS, et al; Pediatric Research in Inpatient Settings (PRIS) Network. Patterns of electrolyte testing at children’s hospitals for common inpatient diagnoses. Pediatrics. 2019;144(1):e20181644. https://doi.org/10.1542/peds.2018-1644
18. Florin TA, French B, Zorc JJ, Alpern ER, Shah SS. Variation in emergency department diagnostic testing and disposition outcomes in pneumonia. Pediatrics. 2013;132(2):237-244. https://doi.org/10.1542/peds.2013-0179
19. Desai S, Shah SS, Hall M, Richardson TE, Thomson JE; Pediatric Research in Inpatient Settings (PRIS) Network. Imaging strategies and outcomes in children hospitalized with cervical lymphadenitis. J Hosp Med. 2020;15(4):197-203. https://doi.org/10.12788/jhm.3333
20. Markham JL, Hall M, Bettenhausen JL, Myers AL, Puls HT, McCulloh RJ. Variation in care and clinical outcomes in children hospitalized with orbital cellulitis. Hosp Pediatr. 2018;8(1):28-35. https://doi.org/10.1542/hpeds.2017-0040
21. Tieder JS, Hall M, Auger KA, et al. Accuracy of administrative billing codes to detect urinary tract infection hospitalizations. Pediatrics. 2011;128(2):323-330. https://doi.org/10.1542/peds.2010-2064
22. Singh JA, Yu S. The burden of septic arthritis on the U.S. inpatient care: a national study. PLoS One. 2017;12(8):e0182577. https://doi.org/10.1371/journal.pone.0182577
23. Foradori DM, Lopez MA, Hall M, et al. Invasive bacterial infections in infants younger than 60 days with skin and soft tissue infections. Pediatr Emerg Care. 2018. https://doi.org/10.1097/pec.0000000000001584
24. Feudtner C, Feinstein JA, Zhong W, Hall M, Dai D. Pediatric complex chronic conditions classification system version 2: updated for ICD-10 and complex medical technology dependence and transplantation. BMC Pediatr. 2014;14:199. https://doi.org/10.1186/1471-2431-14-199
25. Arancibia A, Icarte A, González C, Morasso I. Dose-dependent bioavailability of amoxycillin. Int J Clin Pharmacol Ther Toxicol. 1988;26(6):300-303.
26. Grayson ML, Cosgrove S, Crowe S, et al. Kucers’ the Use of Antibiotics: A Clinical Review of Antibacterial, Antifungal, Antiparasitic, and Antiviral Drugs. 7th ed. CRC Press; 2018.
27. Downes KJ, Hahn A, Wiles J, Courter JD, Inks AA. Dose optimisation of antibiotics in children: application of pharmacokinetics/pharmacodynamics in pediatrics’. Int J Antimicrob Agents. 2014;43(3):223-230. https://doi.org/10.1016/j.ijantimicag.2013.11.006
28. Gras-Le Guen C, Boscher C, Godon N, et al. Therapeutic amoxicillin levels achieved with oral administration in term neonates. Eur J Clin Pharmacol. 2007;63(7):657-662. https://doi.org/10.1007/s00228-007-0307-3
29. Sanchez Navarro A. New formulations of amoxicillin/clavulanic acid: a pharmacokinetic and pharmacodynamic review. Clin Pharmacokinet. 2005;44(11):1097-1115. https://doi.org/10.2165/00003088-200544110-00001
30. Fine MJ, Hough LJ, Medsger AR, et al. The hospital admission decision for patients with community-acquired pneumonia. Results from the pneumonia Patient Outcomes Research Team cohort study. Arch Intern Med. 1997;157(1):36-44. https://doi.org/10.1001/archinte.1997.00440220040006
31. Pohl A. Modes of administration of antibiotics for symptomatic severe urinary tract infections. Cochrane Database Syst Rev. 2007(4):CD003237. https://doi.org/10.1002/14651858.cd003237.pub2
32. Nageswaran S, Woods CR, Benjamin DK Jr, Givner LB, Shetty AK. Orbital cellulitis in children. Pediatr Infect Dis J. 2006;25(8):695-699. https://doi.org/10.1097/01.inf.0000227820.36036.f1
33. Al-Nammari S, Roberton B, Ferguson C. Towards evidence based emergency medicine: best BETs from the Manchester Royal Infirmary. Should a child with preseptal periorbital cellulitis be treated with intravenous or oral antibiotics? Emerg Med J. 2007;24(2):128-129. https://doi.org/10.1136/emj.2006.045245
34. Vieira F, Allen SM, Stocks RMS, Thompson JW. Deep neck infection. Otolaryngol Clin North Am. 2008;41(3):459-483, vii. https://doi.org/10.1016/j.otc.2008.01.002
35. Smith M, Shah S, Kronman M, Patel S, Thurm C, Hersh AL. Route of administration for highly orally bioavailable antibiotics. Open Forum Infect Dis. 2017;4(Suppl 1):S498-S499. https://doi.org/10.1093/ofid/ofx163.1291
36. Brady PW, Brinkman WB, Simmons JM, et al. Oral antibiotics at discharge for children with acute osteomyelitis: a rapid cycle improvement project. BMJ Qual Saf. 2014;23(6):499-507. https://doi.org/10.1136/bmjqs-2013-002179
37. Berrevoets MAH, Pot JHLW, Houterman AE, et al. An electronic trigger tool to optimise intravenous to oral antibiotic switch: a controlled, interrupted time series study. Antimicrob Resist Infect Control. 2017;6:81. https://doi.org/10.1186/s13756-017-0239-3
38. Fischer MA, Solomon DH, Teich JM, Avorn J. Conversion from intravenous to oral medications: assessment of a computerized intervention for hospitalized patients. Arch Intern Med. 2003;163(21):2585-2589. https://doi.org/10.1001/archinte.163.21.2585
39. Public Health Ontario. Antimicrobial stewardship programs metric examples. Published 2017. Accessed June 1, 2020. https://www.publichealthontario.ca/-/media/documents/A/2017/asp-metrics-examples.pdf?la=en
40. Desai S, Aronson PL, Shabanova V, et al; Febrile Young Infant Research Collaborative. Parenteral antibiotic therapy duration in young infants with bacteremic urinary tract infections. Pediatrics. 2019;144(3):e20183844. https://doi.org/10.1542/peds.2018-3844
Bacterial infections are a common reason for pediatric hospital admissions in the United States.1 Antibiotics are the mainstay of treatment, and whether to administer them intravenously (IV) or enterally is an important and, at times, challenging decision. Not all hospitalized patients with infections require IV antibiotics, and safe, effective early transitions to enteral therapy have been described for numerous infections.2-7 However, guidelines describing the ideal initial route of antibiotic administration and when to transition to oral therapy are lacking.5,7,8 This lack of high-quality evidence-based guidance may contribute to overuse of IV antibiotics for many hospitalized pediatric patients, even when safe and effective enteral options exist.9
Significant costs and harms are associated with the use of IV antibiotics. In particular, studies have demonstrated longer length of stay (LOS), increased costs, and worsened pain or anxiety related to complications (eg, phlebitis, extravasation injury, thrombosis, catheter-associated bloodstream infections) associated with IV antibiotics.3,4,10-13 Earlier transition to enteral therapy, however, can mitigate these increased risks and costs.
The Centers for Disease Control and Prevention lists the transition from IV to oral antibiotics as a key stewardship intervention for improving antibiotic use.14 The Infectious Diseases Society of America (IDSA) antibiotic stewardship program guidelines strongly recommend the timely conversion from IV to oral antibiotics, stating that efforts focusing on this transition should be integrated into routine practice.15 There are a few metrics in the literature to measure this intervention, but none is universally used, and a modified delphi process could not reach consensus on IV-to-oral transition metrics.16
Few studies describe the opportunity to transition to enteral antibiotics in hospitalized patients with common bacterial infections or explore variation across hospitals. It is critical to understand current practice of antibiotic administration in order to identify opportunities to optimize patient outcomes and promote high-value care. Furthermore, few studies have evaluated the feasibility of IV-to-oral transition metrics using an administrative database. Thus, the aims of this study were to (1) determine opportunities to transition from IV to enteral antibiotics for pediatric patients hospitalized with common bacterial infections based on their ability to tolerate other enteral medications, (2) describe variation in transition practices among children’s hospitals, and (3) evaluate the feasibility of novel IV-to-oral transition metrics using an administrative database to inform stewardship efforts.
METHODS
Study Design and Setting
This multicenter, retrospective cohort study used data from the Pediatric Health Information System (PHIS), an administrative and billing database containing encounter-level data from 52 tertiary care pediatric hospitals across the United States affiliated with the Children’s Hospital Association (Lenexa, Kansas). Hospitals submit encounter-level data, including demographics, medications, and diagnoses based on International Classification of Disease, Tenth Revision, Clinical Modification (ICD-10-CM) codes. Data were de-identified at the time of submission, and data quality and reliability were assured by joint efforts between the Children’s Hospital Association and participating hospitals.
Study Population
This study included pediatric patients aged 60 days to 18 years who were hospitalized (inpatient or observation status) at one of the participating hospitals between January 1, 2017, and December 31, 2018, for one of the following seven common bacterial infections: community-acquired pneumonia (CAP), neck infection (superficial and deep), periorbital/orbital infection, urinary tract infection (UTI), osteomyelitis, septic arthritis, or skin and soft tissue infection (SSTI). The diagnosis cohorts were defined based on ICD-10-CM discharge diagnoses adapted from previous studies (Appendix Table 1).3,17-23 To define a cohort of generally healthy pediatric patients with an acute infection, we excluded patients hospitalized in the intensive care unit, patients with nonhome discharges, and patients with complex chronic conditions.24 We also excluded hospitals with incomplete data during the study period (n=1). The Institutional Review Board at Cincinnati Children’s Hospital Medical Center determined this study to be non–human-subjects research.
Outcomes
The primary outcomes were the number of opportunity days and the percent of days with opportunity to transition from IV to enteral therapy. Opportunity days, or days in which there was a potential opportunity to transition from IV to enteral antibiotics, were defined as days patients received only IV antibiotic doses and at least one enteral nonantibiotic medication, suggesting an ability to take enteral medications.13 We excluded days patients received IV antibiotics for which there was no enteral alternative (eg, vancomycin, Appendix Table 2). When measuring opportunity, to be conservative (ie, to underestimate rather than overestimate opportunity), we did not count as an opportunity day any day in which patients received both IV and enteral antibiotics. Percent opportunity, or the percent of days patients received antibiotics in which there was potential opportunity to transition from IV to enteral antibiotics, was defined as the number of opportunity days divided by number of inpatient days patients received enteral antibiotics or IV antibiotics with at least one enteral nonantibiotic medication (antibiotic days). Similar to opportunity days, antibiotic days excluded days patients were on IV antibiotics for which there was no enteral alternative. Based on our definition, a lower percent opportunity indicates that a hospital is using enteral antibiotics earlier during the hospitalization (earlier transition), while a higher percent opportunity represents later enteral antibiotic use (later transition).
Statistical Analysis
Demographic and clinical characteristics were summarized by diagnosis with descriptive statistics, including frequency with percentage, mean with standard deviation, and median with interquartile range (IQR). For each diagnosis, we evaluated aggregate opportunity days (sum of opportunity days among all hospitals), opportunity days per encounter, and aggregate percent opportunity using frequencies, mean with standard deviation, and percentages, respectively. We also calculated aggregate opportunity days for diagnosis-antibiotic combinations. To visually show variation in the percent opportunity across hospitals, we displayed the percent opportunity on a heat map, and evaluated percent opportunity across hospitals using chi-square tests. To compare the variability in the percent opportunity across and within hospitals, we used a generalized linear model with two fixed effects (hospital and diagnosis), and parsed the variability using the sum of squares. We performed a sensitivity analysis and excluded days that patients received antiemetic medications (eg, ondansetron, granisetron, prochlorperazine, promethazine), as these suggest potential intolerance of enteral medications. All statistical analyses were performed using SAS v.9.4 (SAS Institute Inc, Cary, North Carolina) and GraphPad Prism 8.0 (GraphPad Software Inc., San Diego, California), and P values < .05 were considered statistically significant.
RESULTS
During the 2-year study period, 100,103 hospitalizations met our inclusion criteria across 51 hospitals and seven diagnosis categories (Table 1). Diagnosis cohorts ranged in size from 1,462 encounters for septic arthritis to 35,665 encounters for neck infections. Overall, we identified 88,522 aggregate opportunity days on which there was an opportunity to switch from IV to enteral treatment in the majority of participants (percent opportunity, 57%).
Opportunity by Diagnosis
The number of opportunity days (aggregate and mean per encounter) and percent opportunity varied by diagnosis (Table 2). The aggregate number of opportunity days ranged from 3,693 in patients with septic arthritis to 25,359 in patients with SSTI, and mean opportunity days per encounter ranged from 0.9 in CAP to 2.8 in septic arthritis. Percent opportunity was highest for septic arthritis at 72.7% and lowest for CAP at 39.7%.
Variation in Opportunity Among Hospitals
The variation in the percent opportunity across hospitals was statistically significant for all diagnoses (Figure). Within hospitals, we observed similar practice patterns across diagnoses. For example, hospitals with a higher percent opportunity for one diagnosis tended to have higher percent opportunity for the other diagnoses (as noted in the top portion of the Figure), and those with lower percent opportunity for one diagnosis tended to also have lower percent opportunity for the other diagnoses studied (as noted in the bottom portion of the Figure). When evaluating variability in the percent opportunity, 45% of the variability was attributable to the hospital-effect and 35% to the diagnosis; the remainder was unexplained variability. Sensitivity analysis excluding days when patients received an antiemetic medication yielded no differences in our results.
Opportunity by Antibiotic
The aggregate number of opportunity days varied by antibiotic (Table 3). Intravenous antibiotics with the largest number of opportunity days included clindamycin (44,293), ceftriaxone (23,896), and ampicillin-sulbactam (15,484). Antibiotic-diagnosis combinations with the largest number of opportunity days for each diagnosis included ceftriaxone and ampicillin in CAP; clindamycin in cellulitis, SSTI, and neck infections; ceftriaxone in UTI; and cefazolin in osteomyelitis and septic arthritis.
DISCUSSION
In this multicenter study of pediatric patients hospitalized with common bacterial infections, there was the potential to transition from IV to enteral treatment in over half of the antibiotic days. The degree of opportunity varied by infection, antibiotic, and hospital. Antibiotics with a large aggregate number of opportunity days for enteral transition included clindamycin, which has excellent bioavailability; and ampicillin and ampicillin-sulbactam, which can achieve pharmacodynamic targets with oral equivalents.25-29 The across-hospital variation for a given diagnosis suggests that certain hospitals have strategies in place which permit an earlier transition to enteral antibiotics compared to other institutions in which there were likely missed opportunities to do so. This variability is likely due to limited evidence, emphasizing the need for robust studies to better understand the optimal initial antibiotic route and transition time. Our findings highlight the need for, and large potential impact of, stewardship efforts to promote earlier transition for specific drug targets. This study also demonstrates the feasibility of obtaining two metrics—percent opportunity and opportunity days—from administrative databases to inform stewardship efforts within and across hospitals.
Opportunity days and percent opportunity varied among diagnoses. The variation in aggregate opportunity days was largely a reflection of the number of encounters: Diagnoses such as SSTI, neck infections, and CAP had a large number of both aggregate opportunity days and encounters. The range of opportunity days per encounter (0.9-2.5) suggests potential missed opportunities to transition to enteral antibiotics across all diagnoses (Table 2). The higher opportunity days per encounter in osteomyelitis and septic arthritis may be related to longer LOS and higher percent opportunity. Percent opportunity likely varied among diagnoses due to differences in admission and discharge readiness criteria, diagnostic evaluation, frequency of antibiotic administration, and evidence on the optimal route of initial antibiotics and when to transition to oral formulations. For example, we hypothesize that certain diagnoses, such as osteomyelitis and septic arthritis, have admission and discharge readiness criteria directly tied to the perceived need for IV antibiotics, which may limit in-hospital days on enteral antibiotics and explain the high percent opportunity that we observed. The high percent opportunity seen in musculoskeletal infections also may be due to delays in initiating targeted treatment until culture results were available. Encounters for CAP had the lowest percent opportunity; we hypothesize that this is because admission and discharge readiness may be determined by factors other than the need for IV antibiotics (eg, need for supplemental oxygen), which may increase days on enteral antibiotics and lead to a lower percent opportunity.30
Urinary tract infection encounters had a high percent opportunity. As with musculoskeletal infection, this may be related to delays in initiating targeted treatment until culture results became available. Another reason for the high percent opportunity in UTI could be the common use of ceftriaxone, which, dosed every 24 hours, likely reduced the opportunity to transition to enteral antibiotics. There is strong evidence demonstrating no difference in outcomes based on antibiotic routes for UTI, and we would expect this to result in a low percent opportunity.2,31 While the observed high opportunity in UTI may relate to an initial unknown diagnosis or concern for systemic infection, this highlights potential opportunities for quality improvement initiatives to promote empiric oral antibiotics in clinically stable patients hospitalized with suspected UTI.
There was substantial variation in percent opportunity across hospitals for a given diagnosis, with less variation across diagnoses for a given hospital. Variation across hospitals but consistency within individual hospitals suggests that some hospitals may promote earlier transition from IV to enteral antibiotics as standard practice for all diagnoses, while other hospitals continue IV antibiotics for the entire hospitalization, highlighting potential missed opportunities at some institutions. While emerging data suggest that traditional long durations of IV antibiotics are not necessary for many infections, the limited evidence on the optimal time to switch to oral antibiotics may have influenced this variation.2-7 Many guidelines recommend initial IV antibiotics for hospitalized pediatric patients, but there are few studies comparing IV and enteral therapy.2,5,9 Limited evidence leaves significant room for hospital culture, antibiotic stewardship efforts, reimbursement considerations, and/or hospital workflow to influence transition timing and overall opportunity at individual hospitals.7,8,32-34 These findings emphasize the importance of research to identify optimal transition time and comparative effectiveness studies to evaluate whether initial IV antibiotics are truly needed for mild—and even severe—disease presentations. Since many patients are admitted for the perceived need for IV antibiotics, earlier use of enteral antibiotics could reduce rates of hospitalizations, LOS, healthcare costs, and resource utilization.
Antibiotics with a high number of opportunity days included clindamycin, ceftriaxone, ampicillin-sublactam, and ampicillin. Our findings are consistent with another study which found that most bioavailable drugs, including clindamycin, were administered via the IV route and accounted for a large number of antibiotic days.35 The Infectious Diseases Society of America recommends that hospitals promote earlier transition to oral formulations for highly bioavailable drugs.7 Given the high bioavailability of clindamycin, its common use in high-frequency encounters such as SSTI and neck infections, and the fact that it accounted for a large number of opportunity days, quality improvement initiatives promoting earlier transition to oral clindamycin could have a large impact across health systems.25,26 Additionally, although beta-lactam antibiotics such as amoxicillin and amoxicillin-sulbactam are not highly bioavailable, oral dosing can achieve sufficient serum concentrations to reach pharmacodynamic targets for common clinical indications; this could be an important quality improvement initiative.27-29 Several single-site studies have successfully implemented quality improvement initiatives to promote earlier IV-to-enteral transition, with resulting reductions in costs and no adverse events noted, highlighting the feasibility and impact of such efforts.13,36-38
This study also demonstrates the feasibility of collecting two metrics (percent opportunity and opportunity days) from administrative databases to inform IV-to-oral transition benchmarking and stewardship efforts. While there are several metrics in the literature for evaluating antibiotic transition (eg, days of IV or oral therapy, percentage of antibiotics given via the oral route, time to switch from IV to oral, and acceptance rate of suggested changes to antibiotic route), none are universally used or agreed upon.15,16,39 The opportunity metrics used in this study have several strengths, including the feasibility of obtaining them from existing databases and the ability to account for intake of other enteral medications; the latter is not evaluated in other metrics. These opportunity metrics can be used together to identify the percent of time in which there is opportunity to transition and total number of days to understand the full extent of potential opportunity for future interventions. As demonstrated in this study, these metrics can be measured by diagnosis, antibiotic, or diagnosis-antibiotic combination, and they can be used to evaluate stewardship efforts at a single institution over time or compare efforts across hospitals.
These findings should be interpreted in the context of important limitations. First, we attempted to characterize potential opportunity to transition to enteral medications based on a patient’s ability to tolerate nonenteral medications. However, there are other factors that could limit the opportunity to transition that we could not account for with an administrative dataset, including the use of antibiotics prior to admission, disease progression, severity of illness, and malabsorptive concerns. Thus, though we may have overestimated the true opportunity to transition to enteral antibiotics, it is unlikely that this would account for all of the variation in transition times that we observed across hospitals. Second, while our study required patients to have one of seven types of infection, we did not exclude any additional infectious diagnoses (eg, concurrent bacteremia, Clostridioides difficile, otitis media) that could have driven the choice of antibiotic type and modality. Although emerging evidence is supporting earlier transitions to oral therapy, bacteremia is typically treated with IV antibiotics; this may have led to an overestimation of true opportunity.40 “Clostridioides” difficile and otitis media are typically treated with enteral therapy; concurrent infections such as these may have led to an underestimation of opportunity given the fact that, based on our definition, the days on which patients received both IV and enteral antibiotics were not counted as opportunity days. Third, because PHIS uses billing days to capture medication use, we were unable to distinguish transitions that occurred early in the day vs those that took place later in the day. This could have led to an underestimation of percent opportunity, particularly for diagnoses with a short LOS; it also likely led to an underestimation of the variability observed across hospitals. Fourth, because we used an administrative dataset, we are unable to understand reasoning behind transitioning time from IV to oral antibiotics, as well as provider, patient, and institutional level factors that influenced these decisions.
CONCLUSION
Children hospitalized with bacterial infections often receive IV antibiotics, and the timing of transition from IV to enteral antibiotics varies significantly across hospitals. Further research is needed to compare the effectiveness of IV and enteral antibiotics and better define criteria for transition to enteral therapy. We identified ample opportunities for quality improvement initiatives to promote earlier transition, which have the potential to reduce healthcare utilization and promote optimal patient-directed high-value care.
1. Keren R, Luan X, Localio R, et al. Prioritization of comparative effectiveness research topics in hospital pediatrics. Arch Pediatr Adolesc Med. 2012;166(12):1155-1164. https://doi.org/10.1001/archpediatrics.2012.1266
2. McMullan BJ, Andresen D, Blyth CC, et al. Antibiotic duration and timing of the switch from intravenous to oral route for bacterial infections in children: systematic review and guidelines. Lancet Infect Dis. 2016;16(8):e139-e152. https://doi.org/10.1016/S1473-3099(16)30024-X
3. Keren R, Shah SS, Srivastava R, et al; for the Pediatric Research Inpatient Settings Network. Comparative effectiveness of intravenous vs oral antibiotics for postdischarge treatment of acute osteomyelitis in children. JAMA Pediatr. 2015;169(2):120-128. https://doi.org/10.1001/jamapediatrics.2014.2822
4. Shah SS, Srivastava R, Wu S, et al. Intravenous versus oral antibiotics for postdischarge treatment of complicated pneumonia. Pediatrics. 2016;138(6):e201692. https://doi.org/10.1542/peds.2016-1692
5. Li HK, Agweyu A, English M, Bejon P. An unsupported preference for intravenous antibiotics. PLoS Med. 2015;12(5):e1001825. https://dx.doi.org/10.1371%2Fjournal.pmed.1001825
6. Dellit TH, Owens RC, McGowan JE Jr, et al; Infectious Diseases Society of America; Society for Healthcare Epidemiology of America. Infectious Diseases Society of America and the Society for Healthcare Epidemiology of America guidelines for developing an institutional program to enhance antimicrobial stewardship. Clin Infect Dis. 2007;44(2):159-177. https://doi.org/10.1086/510393
7. Bradley JS, Byington CL, Shah SS, et al; Pediatric Infectious Diseases Society and the Infectious Diseases Society of America. Management of community-acquired pneumonia (CAP) in infants and children older than 3 months of age: clinical practice guidelines by the Pediatric Infectious Diseases Society and the Infectious Diseases Society of America. Clin Infect Dis. 2011;53(7):e25-e76. https://doi.org/10.1542/peds.2011-2385
8. Septimus EJ, Owens RC Jr. Need and potential of antimicrobial stewardship in community hospitals. Clin Infect Dis. 2011;53 Suppl 1:S8-S14. https://doi.org/10.1093/cid/cir363
9. Schroeder AR, Ralston SL. Intravenous antibiotic durations for common bacterial infections in children: when is enough? J Hosp Med. 2014;9(9):604-609. https://doi.org/10.1002/jhm.2239
10. Christensen EW, Spaulding AB, Pomputius WF, Grapentine SP. Effects of hospital practice patterns for antibiotic administration for pneumonia on hospital lengths of stay and costs. J Pediatric Infect Dis Soc. 2019;8(2):115-121. https://doi.org/10.1093/jpids/piy003
11. van Zanten AR, Engelfriet PM, van Dillen K, van Veen M, Nuijten MJ, Polderman KH. Importance of nondrug costs of intravenous antibiotic therapy. Crit Care. 2003;7(6):R184-R190. https://doi.org/10.1186/cc2388
12. Ruebner R, Keren R, Coffin S, Chu J, Horn D, Zaoutis TE. Complications of central venous catheters used for the treatment of acute hematogenous osteomyelitis. Pediatrics. 2006;117(4):1210-1215. https://doi.org/10.1542/peds.2005-1465
13. Girdwood SCT, Sellas MN, Courter JD, et al. Improving the transition of intravenous to enteral antibiotics in pediatric patients with pneumonia or skin and soft tissue infections. J Hosp Med. 2020;15(1):10-15. https://doi.org/10.12788/jhm.3253
14. Core Elements of Hospital Antibiotic Stewardship Programs. Centers for Disease Control and Prevention. Published 2019. Accessed May 30, 2020. https://www.cdc.gov/antibiotic-use/core-elements/hospital.html
15. Barlam TF, Cosgrove SE, Abbo LM, et al. Implementing an antibiotic stewardship program: guidelines by the Infectious Diseases Society of America and the Society for Healthcare Epidemiology of America. Clin Infect Dis. 2016;62(10):e51-e77. https://doi.org/10.1093/cid/ciw118
16. Science M, Timberlake K, Morris A, Read S, Le Saux N; Groupe Antibiothérapie en Pédiatrie Canada Alliance for Stewardship of Antimicrobials in Pediatrics (GAP Can ASAP). Quality metrics for antimicrobial stewardship programs. Pediatrics. 2019;143(4):e20182372. https://doi.org/10.1542/peds.2018-2372
17. Tchou MJ, Hall M, Shah SS, et al; Pediatric Research in Inpatient Settings (PRIS) Network. Patterns of electrolyte testing at children’s hospitals for common inpatient diagnoses. Pediatrics. 2019;144(1):e20181644. https://doi.org/10.1542/peds.2018-1644
18. Florin TA, French B, Zorc JJ, Alpern ER, Shah SS. Variation in emergency department diagnostic testing and disposition outcomes in pneumonia. Pediatrics. 2013;132(2):237-244. https://doi.org/10.1542/peds.2013-0179
19. Desai S, Shah SS, Hall M, Richardson TE, Thomson JE; Pediatric Research in Inpatient Settings (PRIS) Network. Imaging strategies and outcomes in children hospitalized with cervical lymphadenitis. J Hosp Med. 2020;15(4):197-203. https://doi.org/10.12788/jhm.3333
20. Markham JL, Hall M, Bettenhausen JL, Myers AL, Puls HT, McCulloh RJ. Variation in care and clinical outcomes in children hospitalized with orbital cellulitis. Hosp Pediatr. 2018;8(1):28-35. https://doi.org/10.1542/hpeds.2017-0040
21. Tieder JS, Hall M, Auger KA, et al. Accuracy of administrative billing codes to detect urinary tract infection hospitalizations. Pediatrics. 2011;128(2):323-330. https://doi.org/10.1542/peds.2010-2064
22. Singh JA, Yu S. The burden of septic arthritis on the U.S. inpatient care: a national study. PLoS One. 2017;12(8):e0182577. https://doi.org/10.1371/journal.pone.0182577
23. Foradori DM, Lopez MA, Hall M, et al. Invasive bacterial infections in infants younger than 60 days with skin and soft tissue infections. Pediatr Emerg Care. 2018. https://doi.org/10.1097/pec.0000000000001584
24. Feudtner C, Feinstein JA, Zhong W, Hall M, Dai D. Pediatric complex chronic conditions classification system version 2: updated for ICD-10 and complex medical technology dependence and transplantation. BMC Pediatr. 2014;14:199. https://doi.org/10.1186/1471-2431-14-199
25. Arancibia A, Icarte A, González C, Morasso I. Dose-dependent bioavailability of amoxycillin. Int J Clin Pharmacol Ther Toxicol. 1988;26(6):300-303.
26. Grayson ML, Cosgrove S, Crowe S, et al. Kucers’ the Use of Antibiotics: A Clinical Review of Antibacterial, Antifungal, Antiparasitic, and Antiviral Drugs. 7th ed. CRC Press; 2018.
27. Downes KJ, Hahn A, Wiles J, Courter JD, Inks AA. Dose optimisation of antibiotics in children: application of pharmacokinetics/pharmacodynamics in pediatrics’. Int J Antimicrob Agents. 2014;43(3):223-230. https://doi.org/10.1016/j.ijantimicag.2013.11.006
28. Gras-Le Guen C, Boscher C, Godon N, et al. Therapeutic amoxicillin levels achieved with oral administration in term neonates. Eur J Clin Pharmacol. 2007;63(7):657-662. https://doi.org/10.1007/s00228-007-0307-3
29. Sanchez Navarro A. New formulations of amoxicillin/clavulanic acid: a pharmacokinetic and pharmacodynamic review. Clin Pharmacokinet. 2005;44(11):1097-1115. https://doi.org/10.2165/00003088-200544110-00001
30. Fine MJ, Hough LJ, Medsger AR, et al. The hospital admission decision for patients with community-acquired pneumonia. Results from the pneumonia Patient Outcomes Research Team cohort study. Arch Intern Med. 1997;157(1):36-44. https://doi.org/10.1001/archinte.1997.00440220040006
31. Pohl A. Modes of administration of antibiotics for symptomatic severe urinary tract infections. Cochrane Database Syst Rev. 2007(4):CD003237. https://doi.org/10.1002/14651858.cd003237.pub2
32. Nageswaran S, Woods CR, Benjamin DK Jr, Givner LB, Shetty AK. Orbital cellulitis in children. Pediatr Infect Dis J. 2006;25(8):695-699. https://doi.org/10.1097/01.inf.0000227820.36036.f1
33. Al-Nammari S, Roberton B, Ferguson C. Towards evidence based emergency medicine: best BETs from the Manchester Royal Infirmary. Should a child with preseptal periorbital cellulitis be treated with intravenous or oral antibiotics? Emerg Med J. 2007;24(2):128-129. https://doi.org/10.1136/emj.2006.045245
34. Vieira F, Allen SM, Stocks RMS, Thompson JW. Deep neck infection. Otolaryngol Clin North Am. 2008;41(3):459-483, vii. https://doi.org/10.1016/j.otc.2008.01.002
35. Smith M, Shah S, Kronman M, Patel S, Thurm C, Hersh AL. Route of administration for highly orally bioavailable antibiotics. Open Forum Infect Dis. 2017;4(Suppl 1):S498-S499. https://doi.org/10.1093/ofid/ofx163.1291
36. Brady PW, Brinkman WB, Simmons JM, et al. Oral antibiotics at discharge for children with acute osteomyelitis: a rapid cycle improvement project. BMJ Qual Saf. 2014;23(6):499-507. https://doi.org/10.1136/bmjqs-2013-002179
37. Berrevoets MAH, Pot JHLW, Houterman AE, et al. An electronic trigger tool to optimise intravenous to oral antibiotic switch: a controlled, interrupted time series study. Antimicrob Resist Infect Control. 2017;6:81. https://doi.org/10.1186/s13756-017-0239-3
38. Fischer MA, Solomon DH, Teich JM, Avorn J. Conversion from intravenous to oral medications: assessment of a computerized intervention for hospitalized patients. Arch Intern Med. 2003;163(21):2585-2589. https://doi.org/10.1001/archinte.163.21.2585
39. Public Health Ontario. Antimicrobial stewardship programs metric examples. Published 2017. Accessed June 1, 2020. https://www.publichealthontario.ca/-/media/documents/A/2017/asp-metrics-examples.pdf?la=en
40. Desai S, Aronson PL, Shabanova V, et al; Febrile Young Infant Research Collaborative. Parenteral antibiotic therapy duration in young infants with bacteremic urinary tract infections. Pediatrics. 2019;144(3):e20183844. https://doi.org/10.1542/peds.2018-3844
© 2021 Society of Hospital Medicine
Costs and Reimbursements for Mental Health Hospitalizations at Children’s Hospitals
Increasing numbers of children and adolescents are presenting to children’s hospitals with acute mental health crises requiring emergent or inpatient treatment.1-5 As a result, children’s hospitals are experiencing additional financial challenges because specialty mental health services are often reimbursed at lower rates than other medical services.6-9 Poor reimbursement has also been cited as a deterrent to the provision of mental health specialty care, including emergency mental health crisis services.10 The cumulative financial impact of recent trends in the provision of mental health crisis services at children’s hospitals, however, is unknown. We conducted this study to assess children’s hospitals’ costs, reimbursement, and net profits or losses when delivering inpatient mental health care.
METHODS
We conducted a retrospective cohort study of the Children’s Hospital Association’s Pediatric Health Information System (PHIS) and Revenue Management Program (RMP) databases. PHIS is an administrative and billing database that collects International Classification of Disease, 10th Revision (ICD-10) diagnoses, procedure codes, and hospital charges from encounters at 52 US children’s hospitals. Costs are estimated from charges using hospital-, year-, and department-specific cost-to-charge ratios. The RMP database is an add-on module to the PHIS database that captures reimbursement data submitted quarterly from 17 participating hospitals based on actual reimbursement amounts collected for each encounter.
Among the 17 participating hospitals, we included all medical (ie, not surgical or intensive care) encounters during calendar year 2017 for children older than 6 years. We stratified encounters into three diagnosis types: primary mental health diagnosis,5 suicide attempt,11 or other medical hospitalizations. We separated suicide attempts since these encounters often require care for both mental health concerns and medical complications. Eating disorders were excluded because these programs at children’s hospitals primarily focus on medical complications, require complex multispecialty support, have significantly longer hospitalizations and made up a small volume of overall mental health hospitalizations.
We stratified all analyses by inpatient or observation encounter and determined the proportion of encounters and hospital days attributed to primary mental health, suicide attempt, and other medical conditions at each hospital. One of the 17 children’s hospitals does not use observation status billing, so the observation encounters dataset includes 16 hospitals.
We summarized patients’ demographic and clinical characteristics using frequencies and percentages, comparing across diagnosis groups using chi-square tests. We calculated mean cost per day as (total cost) ÷ (total length of stay [LOS]), reimbursement per day as (total reimbursement) ÷ (total LOS) for each hospital and patient group, and margin per day as (reimbursement per day) – (cost per day). We then determined the total margin difference of caring for mental health vs caring for other medical encounters as ([margin per day for mental health] – [margin per day other medical]) × (number of mental health days). Similarly, we calculated the total margin loss for suicide attempts vs other medical encounters. After calculating profits and losses at individual hospitals, we summed total annual profits and losses to calculate cumulative annual differences. We summarized these profits and losses across all hospitals with medians and interquartile ranges (IQR).
This study of deidentified administrative data was approved by the Internal Review Board at Vanderbilt University as non-human subjects research. All statistical analyses were performed using SAS v.9.4 (SAS Institute, Cary, North Carolina), and P values < .05 were considered statistically significant.
RESULTS
Study Population
Across the 17 included children’s hospitals, there were 8,521 (7.6%) mental health encounters, 3,247 (2.9%) suicide attempt encounters, and 99,937 (89.5%) other medical encounters. LOS was significantly longer for mental health hospitalizations than for suicide attempts and for other medical hospitalizations.
Hospital Characteristics
All 17 free-standing children’s hospitals in the study had an inpatient behavioral health/psychiatric consultation service, and 7 of the 17 had an inpatient behavioral health/psychiatric unit. The total number of discharges for mental health, suicide attempt, and other medical conditions per year varied (range, 2,868-13,214) across the hospitals.
Hospital Daily Profits and Losses for Mental Health, Suicide Attempt, and Other Medical Admissions
For inpatient status mental health hospitalizations, the median margin was $376/day (IQR, $23-$618). For inpatient status suicide attempt hospitalizations, the median margin was $685/day (IQR, $3-$1,117), and for other medical hospitalizations the median margin was $603/day (IQR, $240-$991). With regard to observation status admissions, mental health hospitalizations had a median margin of –$453/day (IQR, –$806 to $362), suicide attempts of –$103/day (IQR, –$639 to $264), and other medical conditions of $353/day (IQR, –$616 to $658; Figure).
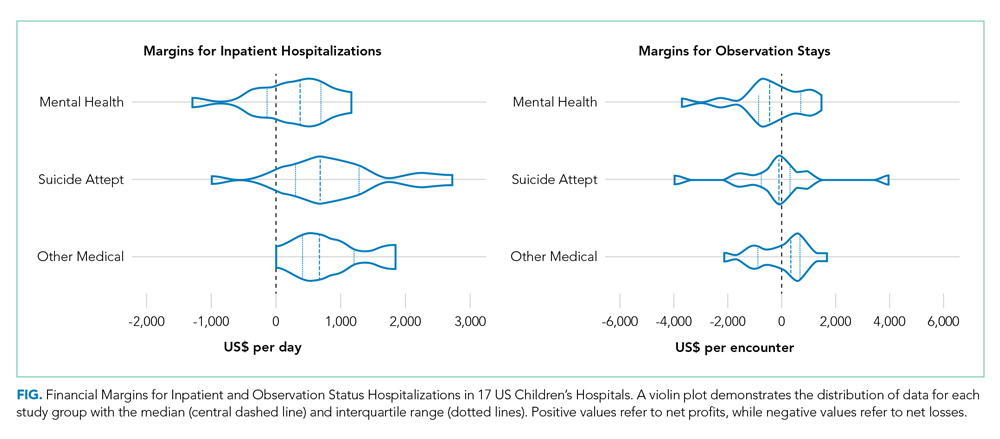
Hospital Annual Profits and Losses for Mental Health and Suicide Attempt Admissions, Compared With Other Medical Admissions
The Table shows daily and annual profits and losses for inpatient and observation status. The total annual loss across all hospitals for mental health and suicide attempt hospitalizations, compared with other medical hospitalizations, including both inpatient and observation status, was –$26,658,255 when taking both profits and losses into account. For the seven hospitals with net profits for mental health and suicide attempt hospitalizations, compared with other medical hospitalizations, the median net profit for combined inpatient and observation status encounters was $119,361 (IQR, $82,818-$195,543), and the total net profit was $5,872,665. For the 10 hospitals with net losses for mental health and suicide attempt hospitalizations, compared with other medical hospitalizations, the median net loss for combined inpatient and observation status was –$2,169,357 (IQR, –$4,034,085 to –$511,755), and the total net loss was –$27,419,379.

DISCUSSION
Hospitalizations for mental health disorders and suicide attempts accounted for 10.5% of hospitalizations at 17 US children’s hospitals in 2017. Overall, mental health and suicide attempt hospitalizations had lower financial margins than did other medical hospitalizations, and they accounted for a total margin loss of more than $26 million across 17 hospitals. Seven hospitals generated a profit for mental health and suicide attempt admissions; 10 hospitals reported losses. Only three hospitals generated a higher net profit for mental health admissions than for other medical admissions. More hospitals had net profits for inpatient status mental health and suicide attempt admissions than for observation status mental health and suicide attempt admissions.
For a minority of children’s hospitals, mental health hospitalizations had higher profit margins than for other medical hospitalizations. This raises questions about patient outcomes and the type of care models employed. One potential explanation is that these hospitals have negotiated favorable agreements with payers. Another possibility could be variations in case-mix and payer mix. Certain mental health services, such as crisis response teams, social workers, and child life specialists, may also be funded from nonpayer sources, so estimates may not fully reflect the cost of providing mental health services. A worst-case view is that hospitals with higher profit margins are providing less or poorer care because of lower reimbursement.
Mental health and suicide attempt hospitalizations were associated with smaller margins but counterintuitively generally wider IQRs for cost. This might be related to variation in care models, but our study was not positioned to examine reasons for this variation. The relationship between reimbursement or margins and patient outcomes, as well as specific mechanisms which may drive costs and outcomes, are areas for future research.
Health insurance plays a crucial role in mental health care. In our study, hospitals were more likely to report positive margins from inpatient status mental health hospitalizations rather than from observation status ones. This is unsurprising because payments for observation status are generally lower than for inpatient status.12 Less is known about what influences billing and payment for inpatient versus observation at individual hospitals, particularly for mental health hospitalizations. In many cases, billing status is not strictly under the hospital’s control and may be determined by payers during or after the hospitalization. Significant variability in the percentage of patients billed as observation status and the impact of lower, often negative, margins for observation mental health encounters, will have a disproportionate effect on some hospitals. Future work could investigate how these differences may influence overall costs and delivery of care.
This study has several limitations that deserve attention. Costs reported are based on cost to charge ratios, which may generate imperfect estimates. Data was limited to 17 freestanding children’s hospitals, and our findings may not generalize to other hospitals. We also compared mental health and suicide attempt hospitalizations with “other medical” hospitalizations. This broad group contains certain medical conditions that may have higher or lower profit margins than average, and estimates of the margins could be over- or underestimated. We assumed that mental health and suicide attempt admissions were displacing admissions with non–mental health medical conditions (ie, not an empty bed). If those beds would otherwise be unoccupied, raw margins are better estimates of the financial impact than margin differences between mental health/suicide attempt and other medical hospitalizations.
CONCLUSION
Children’s hospitals are more likely to have significantly lower financial margins for mental health and suicide attempt hospitalizations than for other medical hospitalizations. Future work to investigate how quality of care is associated with reimbursement can help ensure that funding for children’s acute mental health care services is commensurate with resources required to provide high quality services.
Disclosures
The authors had no financial relationships relevant to this article to disclose.
Funding Source
Research reported in this publication was supported by the National Institute of Mental Health of the National Institutes of Health under Award Number K23MH115162 (Doupnik).
Disclaimer
The content is solely the responsibility of the authors and does not necessarily represent the official views of the National Institutes of Health.
1. Plemmons G, Hall M, Doupnik S, et al. Hospitalization for suicide ideation or attempt: 2008-2015. Pediatrics. 2018;141(6):e20172426. https://doi.org/10.1542/peds.2017-2426.
2. Perou R, Bitsko RH, Blumberg SJ, et al. Mental health surveillance among children--United States, 2005-2011. MMWR Suppl. 2013;62:1-35.
3. Mojtabai R, Olfson M, Han B. National trends in the prevalence and treatment of depression in adolescents and young adults. Pediatrics 2016;138(6):e20161878. https://doi.org/10.1542/peds.2016-1878.
4. Curtin SC, Warner M, Hedegaard H. Increase in suicide in the United States, 1999-2014. NCHS Data Brief. 2016;(241):1–8.
5. Zima BT, Rodean J, Hall M, Bardach NS, Coker TR, Berry JG. Psychiatric disorders and trends in resource use in pediatric hospitals. Pediatrics. 2016;138(5):e20160909. https://doi.org/10.1542/peds.2016-0909.
6. Bierenbaum ML, Katsikas S, Furr A, Carter BD. Factors associated with non-reimbursable activity on an inpatient pediatric consultation-liaison service. J Clin Psychol Med Settings. 2013;20:464-72. https://doi.org/10.1007/s10880-013-9371-2.
7. Bishop TF, Press MJ, Keyhani S, Pincus HA. Acceptance of insurance by psychiatrists and the implications for access to mental health care. JAMA Psychiatry. 2014;71:176-81. https://doi.org/10.1001/jamapsychiatry.2013.2862.
8. McAuliffe Lines M, Tynan WD, Angalet GB, Shroff Pendley J. Commentary: the use of health and behavior codes in pediatric psychology: where are we now? J Pediatr Psychol. 2012;37:486-90. https://doi.org/10.1093/jpepsy/jss045.
9. Drotar D. Introduction to the special section: pediatric psychologists’ experiences in obtaining reimbursement for the use of health and behavior codes. J Pediatr Psychol. 2012;37:479-85. https://doi.org/10.1093/jpepsy/jss065.
10. Komers AM. “Indiana children’s hospital shutters psychiatric unit.” Becker’s Hospital Review. 2019. https://www.beckershospitalreview.com/patient-flow/indiana-children-s-hospital-shutters-psychiatric-unit.html. Accessed August 28, 2019.
11. Hedegaard H, Schoenbaum M, Claassen C, Crosby A, Holland K, Proescholdbell S. Issues in developing a surveillance case definition for nonfatal suicide attempt and intentional self-harm using International Classification of Diseases, Tenth Revision, Clinical Modification (ICD-10-CM) coded data. Natl Health Stat Report. 2018;(108):1-19.
12. Fieldston ES, Shah SS, Hall M, et al. Resource utilization for observation-status stays at children’s hospitals. Pediatrics. 2013;131(6):1050-8. https://doi.org/10.1542/peds.2012-2494.
Increasing numbers of children and adolescents are presenting to children’s hospitals with acute mental health crises requiring emergent or inpatient treatment.1-5 As a result, children’s hospitals are experiencing additional financial challenges because specialty mental health services are often reimbursed at lower rates than other medical services.6-9 Poor reimbursement has also been cited as a deterrent to the provision of mental health specialty care, including emergency mental health crisis services.10 The cumulative financial impact of recent trends in the provision of mental health crisis services at children’s hospitals, however, is unknown. We conducted this study to assess children’s hospitals’ costs, reimbursement, and net profits or losses when delivering inpatient mental health care.
METHODS
We conducted a retrospective cohort study of the Children’s Hospital Association’s Pediatric Health Information System (PHIS) and Revenue Management Program (RMP) databases. PHIS is an administrative and billing database that collects International Classification of Disease, 10th Revision (ICD-10) diagnoses, procedure codes, and hospital charges from encounters at 52 US children’s hospitals. Costs are estimated from charges using hospital-, year-, and department-specific cost-to-charge ratios. The RMP database is an add-on module to the PHIS database that captures reimbursement data submitted quarterly from 17 participating hospitals based on actual reimbursement amounts collected for each encounter.
Among the 17 participating hospitals, we included all medical (ie, not surgical or intensive care) encounters during calendar year 2017 for children older than 6 years. We stratified encounters into three diagnosis types: primary mental health diagnosis,5 suicide attempt,11 or other medical hospitalizations. We separated suicide attempts since these encounters often require care for both mental health concerns and medical complications. Eating disorders were excluded because these programs at children’s hospitals primarily focus on medical complications, require complex multispecialty support, have significantly longer hospitalizations and made up a small volume of overall mental health hospitalizations.
We stratified all analyses by inpatient or observation encounter and determined the proportion of encounters and hospital days attributed to primary mental health, suicide attempt, and other medical conditions at each hospital. One of the 17 children’s hospitals does not use observation status billing, so the observation encounters dataset includes 16 hospitals.
We summarized patients’ demographic and clinical characteristics using frequencies and percentages, comparing across diagnosis groups using chi-square tests. We calculated mean cost per day as (total cost) ÷ (total length of stay [LOS]), reimbursement per day as (total reimbursement) ÷ (total LOS) for each hospital and patient group, and margin per day as (reimbursement per day) – (cost per day). We then determined the total margin difference of caring for mental health vs caring for other medical encounters as ([margin per day for mental health] – [margin per day other medical]) × (number of mental health days). Similarly, we calculated the total margin loss for suicide attempts vs other medical encounters. After calculating profits and losses at individual hospitals, we summed total annual profits and losses to calculate cumulative annual differences. We summarized these profits and losses across all hospitals with medians and interquartile ranges (IQR).
This study of deidentified administrative data was approved by the Internal Review Board at Vanderbilt University as non-human subjects research. All statistical analyses were performed using SAS v.9.4 (SAS Institute, Cary, North Carolina), and P values < .05 were considered statistically significant.
RESULTS
Study Population
Across the 17 included children’s hospitals, there were 8,521 (7.6%) mental health encounters, 3,247 (2.9%) suicide attempt encounters, and 99,937 (89.5%) other medical encounters. LOS was significantly longer for mental health hospitalizations than for suicide attempts and for other medical hospitalizations.
Hospital Characteristics
All 17 free-standing children’s hospitals in the study had an inpatient behavioral health/psychiatric consultation service, and 7 of the 17 had an inpatient behavioral health/psychiatric unit. The total number of discharges for mental health, suicide attempt, and other medical conditions per year varied (range, 2,868-13,214) across the hospitals.
Hospital Daily Profits and Losses for Mental Health, Suicide Attempt, and Other Medical Admissions
For inpatient status mental health hospitalizations, the median margin was $376/day (IQR, $23-$618). For inpatient status suicide attempt hospitalizations, the median margin was $685/day (IQR, $3-$1,117), and for other medical hospitalizations the median margin was $603/day (IQR, $240-$991). With regard to observation status admissions, mental health hospitalizations had a median margin of –$453/day (IQR, –$806 to $362), suicide attempts of –$103/day (IQR, –$639 to $264), and other medical conditions of $353/day (IQR, –$616 to $658; Figure).
Hospital Annual Profits and Losses for Mental Health and Suicide Attempt Admissions, Compared With Other Medical Admissions
The Table shows daily and annual profits and losses for inpatient and observation status. The total annual loss across all hospitals for mental health and suicide attempt hospitalizations, compared with other medical hospitalizations, including both inpatient and observation status, was –$26,658,255 when taking both profits and losses into account. For the seven hospitals with net profits for mental health and suicide attempt hospitalizations, compared with other medical hospitalizations, the median net profit for combined inpatient and observation status encounters was $119,361 (IQR, $82,818-$195,543), and the total net profit was $5,872,665. For the 10 hospitals with net losses for mental health and suicide attempt hospitalizations, compared with other medical hospitalizations, the median net loss for combined inpatient and observation status was –$2,169,357 (IQR, –$4,034,085 to –$511,755), and the total net loss was –$27,419,379.
DISCUSSION
Hospitalizations for mental health disorders and suicide attempts accounted for 10.5% of hospitalizations at 17 US children’s hospitals in 2017. Overall, mental health and suicide attempt hospitalizations had lower financial margins than did other medical hospitalizations, and they accounted for a total margin loss of more than $26 million across 17 hospitals. Seven hospitals generated a profit for mental health and suicide attempt admissions; 10 hospitals reported losses. Only three hospitals generated a higher net profit for mental health admissions than for other medical admissions. More hospitals had net profits for inpatient status mental health and suicide attempt admissions than for observation status mental health and suicide attempt admissions.
For a minority of children’s hospitals, mental health hospitalizations had higher profit margins than for other medical hospitalizations. This raises questions about patient outcomes and the type of care models employed. One potential explanation is that these hospitals have negotiated favorable agreements with payers. Another possibility could be variations in case-mix and payer mix. Certain mental health services, such as crisis response teams, social workers, and child life specialists, may also be funded from nonpayer sources, so estimates may not fully reflect the cost of providing mental health services. A worst-case view is that hospitals with higher profit margins are providing less or poorer care because of lower reimbursement.
Mental health and suicide attempt hospitalizations were associated with smaller margins but counterintuitively generally wider IQRs for cost. This might be related to variation in care models, but our study was not positioned to examine reasons for this variation. The relationship between reimbursement or margins and patient outcomes, as well as specific mechanisms which may drive costs and outcomes, are areas for future research.
Health insurance plays a crucial role in mental health care. In our study, hospitals were more likely to report positive margins from inpatient status mental health hospitalizations rather than from observation status ones. This is unsurprising because payments for observation status are generally lower than for inpatient status.12 Less is known about what influences billing and payment for inpatient versus observation at individual hospitals, particularly for mental health hospitalizations. In many cases, billing status is not strictly under the hospital’s control and may be determined by payers during or after the hospitalization. Significant variability in the percentage of patients billed as observation status and the impact of lower, often negative, margins for observation mental health encounters, will have a disproportionate effect on some hospitals. Future work could investigate how these differences may influence overall costs and delivery of care.
This study has several limitations that deserve attention. Costs reported are based on cost to charge ratios, which may generate imperfect estimates. Data was limited to 17 freestanding children’s hospitals, and our findings may not generalize to other hospitals. We also compared mental health and suicide attempt hospitalizations with “other medical” hospitalizations. This broad group contains certain medical conditions that may have higher or lower profit margins than average, and estimates of the margins could be over- or underestimated. We assumed that mental health and suicide attempt admissions were displacing admissions with non–mental health medical conditions (ie, not an empty bed). If those beds would otherwise be unoccupied, raw margins are better estimates of the financial impact than margin differences between mental health/suicide attempt and other medical hospitalizations.
CONCLUSION
Children’s hospitals are more likely to have significantly lower financial margins for mental health and suicide attempt hospitalizations than for other medical hospitalizations. Future work to investigate how quality of care is associated with reimbursement can help ensure that funding for children’s acute mental health care services is commensurate with resources required to provide high quality services.
Disclosures
The authors had no financial relationships relevant to this article to disclose.
Funding Source
Research reported in this publication was supported by the National Institute of Mental Health of the National Institutes of Health under Award Number K23MH115162 (Doupnik).
Disclaimer
The content is solely the responsibility of the authors and does not necessarily represent the official views of the National Institutes of Health.
1. Plemmons G, Hall M, Doupnik S, et al. Hospitalization for suicide ideation or attempt: 2008-2015. Pediatrics. 2018;141(6):e20172426. https://doi.org/10.1542/peds.2017-2426.
2. Perou R, Bitsko RH, Blumberg SJ, et al. Mental health surveillance among children--United States, 2005-2011. MMWR Suppl. 2013;62:1-35.
3. Mojtabai R, Olfson M, Han B. National trends in the prevalence and treatment of depression in adolescents and young adults. Pediatrics 2016;138(6):e20161878. https://doi.org/10.1542/peds.2016-1878.
4. Curtin SC, Warner M, Hedegaard H. Increase in suicide in the United States, 1999-2014. NCHS Data Brief. 2016;(241):1–8.
5. Zima BT, Rodean J, Hall M, Bardach NS, Coker TR, Berry JG. Psychiatric disorders and trends in resource use in pediatric hospitals. Pediatrics. 2016;138(5):e20160909. https://doi.org/10.1542/peds.2016-0909.
6. Bierenbaum ML, Katsikas S, Furr A, Carter BD. Factors associated with non-reimbursable activity on an inpatient pediatric consultation-liaison service. J Clin Psychol Med Settings. 2013;20:464-72. https://doi.org/10.1007/s10880-013-9371-2.
7. Bishop TF, Press MJ, Keyhani S, Pincus HA. Acceptance of insurance by psychiatrists and the implications for access to mental health care. JAMA Psychiatry. 2014;71:176-81. https://doi.org/10.1001/jamapsychiatry.2013.2862.
8. McAuliffe Lines M, Tynan WD, Angalet GB, Shroff Pendley J. Commentary: the use of health and behavior codes in pediatric psychology: where are we now? J Pediatr Psychol. 2012;37:486-90. https://doi.org/10.1093/jpepsy/jss045.
9. Drotar D. Introduction to the special section: pediatric psychologists’ experiences in obtaining reimbursement for the use of health and behavior codes. J Pediatr Psychol. 2012;37:479-85. https://doi.org/10.1093/jpepsy/jss065.
10. Komers AM. “Indiana children’s hospital shutters psychiatric unit.” Becker’s Hospital Review. 2019. https://www.beckershospitalreview.com/patient-flow/indiana-children-s-hospital-shutters-psychiatric-unit.html. Accessed August 28, 2019.
11. Hedegaard H, Schoenbaum M, Claassen C, Crosby A, Holland K, Proescholdbell S. Issues in developing a surveillance case definition for nonfatal suicide attempt and intentional self-harm using International Classification of Diseases, Tenth Revision, Clinical Modification (ICD-10-CM) coded data. Natl Health Stat Report. 2018;(108):1-19.
12. Fieldston ES, Shah SS, Hall M, et al. Resource utilization for observation-status stays at children’s hospitals. Pediatrics. 2013;131(6):1050-8. https://doi.org/10.1542/peds.2012-2494.
© 2020 Society of Hospital Medicine
Progress (?) Toward Reducing Pediatric Readmissions
Readmission rates have been used by payers to administer financial incentives or penalties to hospitals as a measure of quality. The Centers for Medicare and Medicaid Services (CMS) reduces payments to hospitals with excess readmissions for adult Medicare patients.1 Although the Medicare readmission penalties do not apply to children, several state Medicaid agencies have adopted policies to reduce reimbursement for hospitals with higher than expected readmission rates. These Medicaid programs often use potentially preventable readmission (PPR) rates calculated with proprietary software.2 As a result of these incentives and with a goal of improving care, many children’s hospitals have focused on reducing readmissions through participation in local, regional, and national collaboratives.3
Rates of unplanned readmissions in children are lower than in older adults, with all-cause 30-day pediatric readmission rates around 13%.4-7 Even so, as many as 30% of pediatric readmissions may be potentially preventable, with the most common transition failure involving a hospital factor, such as failure to recognize worsening clinical status prior to discharge.8 While readmission metrics are often judged across peer institutions, little is known about national trends over time. Therefore, we sought to examine readmission rates at children’s hospitals over a six-year timeframe to determine if progress has been made toward reducing readmissions.
METHODS
We utilized data from the Children’s Hospital Association Inpatient Essentials Database and included index hospitalizations from January 1, 2010 through June 30, 2016. This database contains demographic information, diagnosis and procedure codes, and All-Patient Refined Diagnosis-Related Groups (APR-DRGs; 3M Health Information Systems) to describe the principal reason for each hospitalization.9 We included 66 hospitals from 31 states plus the District of Columbia with complete data during the study period.
Seven-day all-cause (AC) readmission and PPR rates were calculated using the output from 3M potentially preventable readmission software (version 32). The PPR software utilizes a proprietary algorithm to designate potentially preventable readmissions based on diagnosis codes and the severity of illness (as measured by the APR-DRG severity of illness classification). We chose seven-day readmissions, as opposed to a longer window, as readmissions soon after discharge are more likely to be preventable8 and thus theoretically more amenable to prevention efforts. Quarterly rates were generated for each hospital and in aggregate across the population. We chose quarterly rates a priori to assess changes in rates without focusing on minor monthly fluctuations due to seasonal differences. We performed generalized linear mixed regression models with cluster adjustments at the hospital level to assess changes in readmission rates over time adjusted for case mix index, as admissions to children’s hospitals have increased in complexity over time.10,11 We operationalized the case mix index as an average of pediatric admissions’ relative weights at each hospital for the quarter.12 We assessed AC and PPR models separately. The average case mix index was a covariate in both regression models.
Finally, to determine if readmission reduction may be specific to particular conditions, we generated readmission rates for a select number of APR-DRGs. We focused on conditions with a very high percentage of AC readmissions classified as PPR (appendectomy, connective tissue disorders, ventricular shunt procedures, bronchiolitis, asthma, and sickle cell crisis) as well as those with a very low percentage of AC readmissions classified as PPR (gastrointestinal infections, hematologic disease, and bone marrow transplant [BMT]).5
RESULTS
We included 4.52 million admissions to the 66 included hospitals. Most hospitals (62%) were freestanding acute-care children’s hospitals. The hospitals were geographically diverse. Two-thirds had magnet status (Appendix Table 1). Appendix Table 2 displays patient/admission characteristics over time. Approximately 49% of children were non-Hispanic white, 19% were non-Hispanic black, and 19% were Hispanic. Half of the children were insured by Medicaid. These characteristics were stable over time, except case mix index, which increased during the study period (P = .04).
Across Diagnosis All-Cause and Potentially Preventable Readmission Rates
Over the study period, there were 227,378 AC seven-day readmissions (5.1% readmission rate), and 91,467 readmissions (40% of AC readmissions) were considered PPRs. Readmission rates did not vary over the study period (Figure, Panel A). The median AC seven-day readmission rate across all quarters was 5.1%, ranging from 4.3% to 5.3% (Figure, Panels A and B). The median seven-day PPR rate across all quarters was 2.5% and ranged from 2.1% to 2.5% (Figure, Panels A and C). When adjusted for case mix index, the AC rate increased slightly (on average 0.006% increase per quarter, P = .01) and PPR rates were unchanged over time (PPR model P = .14; Figure, Panel D).
Condition-Specific Readmission Rates
Of the condition-specific readmission rates, only the AC rate for BMT changed significantly, with a decrease of 0.1% per quarter, P = .048. None of the conditions had significant trends in increasing or decreasing readmission in PPR rates. Some conditions, including sickle cell and cerebrospinal fluid ventricular shunt procedures, had fluctuating readmission rates throughout the study period (Appendix Figure, Panels A-G).
DISCUSSION
Despite substantial national efforts to reduce pediatric readmissions,3 seven-day readmission rates at children’s hospitals have not decreased over six years. When individual conditions are examined, there are minor fluctuations of readmission rates over time but no clear trend of decreased readmission events.
Our results are contrary to findings in the Medicare population, where 30-day readmission rates have decreased over time.13,14 In these analyses, we focused on seven-day readmission, as earlier pediatric readmissions are more likely to be preventable. Importantly, the majority of our included hospitals (88%) participate in the Solutions for Patient Safety collaborative, which focuses on reducing seven-day readmissions. Thus, we are confident that a concerted effort to decrease readmission has been ongoing. Further, our findings are contrary to recent analyses indicating an increase in pediatric readmission rates using the pediatric all-condition readmission rate in the National Readmission Database.15 Our analyses are distinctly different in that they allow a focus on hospital-level performance in children’s hospitals. Although in our analyses the all-cause adjusted readmission rate did increase significantly over time (0.006% a quarter or 0.024% per year), this small increase is unlikely to be clinically relevant.
There are several potential reasons for the lack of change in pediatric readmission rates despite concerted efforts to decrease readmissions. First, pediatric readmissions across all conditions are relatively infrequent compared with adult readmission rates. Extrapolating from the largest pediatric study on readmission preventability,8 it is estimated that only two in 100 pediatric hospitalizations results in a PPR.16 Given the lack of robust pediatric readmission prediction tools, the ability to prospectively identify children at high risk for readmission and target interventions is challenging. Second, as we have previously described, children are readmitted after hospitalization for a wide variety of conditions.5 Medicare readmission penalties are leveraged on specific conditions; yet, Medicaid policies include all conditions. In pediatrics, successful interventions to reduce readmissions have focused on hospitalizations for specific conditions.17 In the only two large pediatric readmission reduction trials across multiple conditions, postdischarge homecare nursing contact did not reduce reutilization.18,19 It is challenging to decrease readmissions in heterogenous populations without a robust set of evidence-based interventions. Third, there are multiple ways to measure pediatric readmissions, and different institutions may focus on different methods. Given the proprietary nature and the reliance on retrospective administrative data, PPR rates cannot be assessed during admission and thus are not feasible as a real-time quality improvement outcome. Fourth, in contrast to other hospital quality metrics such as central line-associated bloodstream infections or catheter-associated urinary tract infection, the locus of control for readmission is not entirely within the purview of the hospital.
It is unclear what readmission rate in children is appropriate—or safe—and whether that level has already been met. National readmission prevention efforts may have collateral benefits such as improved communication, medication errors or adherence, and other important aspects of care during transitions. In this scenario, lower readmission rates may not reflect improved quality. Future research should focus on determining if and how readmission reduction efforts are helping to ease the transition to home. Alternatively, research should determine if there are better interventions to assist with transition challenges which should receive resources divested from failing readmission reduction efforts.
Using administrative data, we are limited in delineating truly preventable readmissions from nonpreventable readmissions. Nevertheless, we chose to focus on the PPR and AC metrics, as these are the most policy-relevant metrics. Additionally, we examined aggregate rates of readmission across a cohort of hospitals and did not assess for within-hospital changes in readmission rates. Thus, it is possible (and likely) that some hospitals saw improvements and others saw increases in readmission rates during the study period. We are unable to examine readmission rates at hospitals based on investment in readmission reduction efforts or individual state Medicaid reimbursement policies. Finally, we are unable to assess readmissions to other institutions; however, it is unlikely that readmissions to other hospitals have decreased significantly when readmissions to the discharging hospital have not changed.
Pediatric readmissions at children’s hospitals have not decreased in the past six years, despite widespread readmission reduction efforts. Readmission rates for individual conditions have fluctuated but have not decreased.
Disclosures
Dr. Auger reports grants from AHRQ, during the conduct of the study. Drs. Harris, Gay, Teufel, McLead, Neuman, Peltz, Morse, Del Beccaro, Simon, Argawal, and Fieldston have nothing to disclose. Dr. Shah is the Editor-in-Chief of the Journal of Hospital Medicine.
Funding
Dr. Auger’s research is funded by a K08 award from the Agency for Healthcare Research and Quality (1K08HS024735-01A).
1. Centers for Medicare & Medicaid Services. Readmissions Reduction Program (HRRP). https://www.cms.gov/Medicare/Medicare-Fee-for-Service-Payment/AcuteInpatientPPS/Readmissions-Reduction-Program.html. Accessed January 19, 2018.
2. 3M Health Information Systems. Potentially Preventable Readmissions Classification System: Methodology Overview. http://multimedia.3m.com/mws/media/1042610O/resources-and-references-his-2015.pdf. Accessed April 5, 2019.
3. Children’s Hospitals’ Solutions for Patient Safety. SPS prevention bundles: readmission. http://www.solutionsforpatientsafety.org/wp-content/uploads/SPS-Prevention-Bundles.pdf. Accessed January 11, 2017.
4. Berry JG, Toomey SL, Zaslavsky AM, et al. Pediatric readmission prevalence and variability across hospitals. JAMA. 2013;309(4):372-380. https://doi.org/10.1001/jama.2012.188351.
5. Gay JC, Agrawal R, Auger KA, et al. Rates and impact of potentially preventable readmissions at children’s hospitals. J Pediatr. 2015;166(3):613-619. https://doi.org/10.1016/j.jpeds.2014.10.052.
6. Auger KA, Teufel RJ, Harris JM, et al. Children’s hospital characteristics and readmission metrics. Pediatrics. 2017;139(2):e20161720. https://doi.org/10.1542/peds.2016-1720.
7. Joynt KE, Orav EJ, Jha AK. Thirty-day readmission rates for medicare beneficiaries by race and site of care. JAMA. 2011;305(7):675-681. https://doi.org/10.1001/jama.2011.123.
8. Toomey SL, Peltz A, Loren S, et al. Potentially preventable 30-day hospital readmissions at a children’s hospital. Pediatrics. 2016;138(2):e20154182. doi: 10.1542/peds.2015-4182.
9. Children’s Hospital Association. Pediatric analytic solutions. https://www.childrenshospitals.org/Programs-and-Services/Data-Analytics-and-Research/Pediatric-Analytic-Solutions. Accessed June 2, 2018.
10. Simon TD, Berry J, Feudtner C, et al. Children with complex chronic conditions in inpatient hospital settings in the United States. Pediatrics. 2010;126(4):647-655. https://doi.org/10.1542/peds.2009-3266.
11. Berry JG, Hall M, Hall DE, et al. Inpatient growth and resource use in 28 children’s hospitals: a longitudinal, multi-institutional study. JAMA Pediatr. 2013;167(2):170-177.https://doi.org/10.1001/jamapediatrics.2013.432.
12. Richardson T, Rodean J, Harris M, et al. Development of hospitalization resource intensity scores for kids (H-RISK) and comparison across pediatric populations. J Hosp Med. 2018;13(9):602-608. https://doi.org/10.12788/jhm.2948.
13. Zuckerman RB, Sheingold SH, Orav EJ, Ruhter J, Epstein AM. Readmissions, observation, and the hospital readmissions reduction program. N Engl J Med. 2016;374(16):1543-1551. https://doi.org/10.1056/NEJMsa1513024.
14. Desai NR, Ross JS, Kwon JY, et al. Association between hospital penalty status under the hospital readmission reduction program and readmission rates for target and nontarget conditions. JAMA. 2016;316(24):2647-2656. https://doi.org/10.1001/jama.2016.18533.
15. Bucholz EM, Toomey SL, Schuster MA. Trends in pediatric hospitalizations and readmissions: 2010-2016. Pediatrics. 2019;143(2):e20181958. https://doi.org/10.1542/peds.2018-1958.
16. Brittan M, Shah SS, Auger KA. Preventing pediatric readmissions: how does the hospital fit in? Pediatrics. 2016;138(2):e20161643. https://doi.org/10.1542/peds.2016-1643.
17. Auger KA, Kenyon CC, Feudtner C, Davis MM. Pediatric hospital discharge interventions to reduce subsequent utilization: a systematic review. J Hosp Med. 2014;9(4):251-260. https://doi.org/10.1002/jhm.2134.
18. Auger KA, Simmons JM, Tubbs-Cooley H, et al. Hospital to home outcomes (H2O) randomized trial of a post-discharge nurse home visit. Pediatrics. In press.
19. Auger KA, Shah SS, Tubbs-Cooley HL, et al. Effects of a 1-time nurse-led telephone call after pediatric discharge: the H2O II randomized clinical trial. JAMA Pediatr. 2018;172(9):e181482. https://doi.org/10.1001/jamapediatrics.2018.1482.
Readmission rates have been used by payers to administer financial incentives or penalties to hospitals as a measure of quality. The Centers for Medicare and Medicaid Services (CMS) reduces payments to hospitals with excess readmissions for adult Medicare patients.1 Although the Medicare readmission penalties do not apply to children, several state Medicaid agencies have adopted policies to reduce reimbursement for hospitals with higher than expected readmission rates. These Medicaid programs often use potentially preventable readmission (PPR) rates calculated with proprietary software.2 As a result of these incentives and with a goal of improving care, many children’s hospitals have focused on reducing readmissions through participation in local, regional, and national collaboratives.3
Rates of unplanned readmissions in children are lower than in older adults, with all-cause 30-day pediatric readmission rates around 13%.4-7 Even so, as many as 30% of pediatric readmissions may be potentially preventable, with the most common transition failure involving a hospital factor, such as failure to recognize worsening clinical status prior to discharge.8 While readmission metrics are often judged across peer institutions, little is known about national trends over time. Therefore, we sought to examine readmission rates at children’s hospitals over a six-year timeframe to determine if progress has been made toward reducing readmissions.
METHODS
We utilized data from the Children’s Hospital Association Inpatient Essentials Database and included index hospitalizations from January 1, 2010 through June 30, 2016. This database contains demographic information, diagnosis and procedure codes, and All-Patient Refined Diagnosis-Related Groups (APR-DRGs; 3M Health Information Systems) to describe the principal reason for each hospitalization.9 We included 66 hospitals from 31 states plus the District of Columbia with complete data during the study period.
Seven-day all-cause (AC) readmission and PPR rates were calculated using the output from 3M potentially preventable readmission software (version 32). The PPR software utilizes a proprietary algorithm to designate potentially preventable readmissions based on diagnosis codes and the severity of illness (as measured by the APR-DRG severity of illness classification). We chose seven-day readmissions, as opposed to a longer window, as readmissions soon after discharge are more likely to be preventable8 and thus theoretically more amenable to prevention efforts. Quarterly rates were generated for each hospital and in aggregate across the population. We chose quarterly rates a priori to assess changes in rates without focusing on minor monthly fluctuations due to seasonal differences. We performed generalized linear mixed regression models with cluster adjustments at the hospital level to assess changes in readmission rates over time adjusted for case mix index, as admissions to children’s hospitals have increased in complexity over time.10,11 We operationalized the case mix index as an average of pediatric admissions’ relative weights at each hospital for the quarter.12 We assessed AC and PPR models separately. The average case mix index was a covariate in both regression models.
Finally, to determine if readmission reduction may be specific to particular conditions, we generated readmission rates for a select number of APR-DRGs. We focused on conditions with a very high percentage of AC readmissions classified as PPR (appendectomy, connective tissue disorders, ventricular shunt procedures, bronchiolitis, asthma, and sickle cell crisis) as well as those with a very low percentage of AC readmissions classified as PPR (gastrointestinal infections, hematologic disease, and bone marrow transplant [BMT]).5
RESULTS
We included 4.52 million admissions to the 66 included hospitals. Most hospitals (62%) were freestanding acute-care children’s hospitals. The hospitals were geographically diverse. Two-thirds had magnet status (Appendix Table 1). Appendix Table 2 displays patient/admission characteristics over time. Approximately 49% of children were non-Hispanic white, 19% were non-Hispanic black, and 19% were Hispanic. Half of the children were insured by Medicaid. These characteristics were stable over time, except case mix index, which increased during the study period (P = .04).
Across Diagnosis All-Cause and Potentially Preventable Readmission Rates
Over the study period, there were 227,378 AC seven-day readmissions (5.1% readmission rate), and 91,467 readmissions (40% of AC readmissions) were considered PPRs. Readmission rates did not vary over the study period (Figure, Panel A). The median AC seven-day readmission rate across all quarters was 5.1%, ranging from 4.3% to 5.3% (Figure, Panels A and B). The median seven-day PPR rate across all quarters was 2.5% and ranged from 2.1% to 2.5% (Figure, Panels A and C). When adjusted for case mix index, the AC rate increased slightly (on average 0.006% increase per quarter, P = .01) and PPR rates were unchanged over time (PPR model P = .14; Figure, Panel D).
Condition-Specific Readmission Rates
Of the condition-specific readmission rates, only the AC rate for BMT changed significantly, with a decrease of 0.1% per quarter, P = .048. None of the conditions had significant trends in increasing or decreasing readmission in PPR rates. Some conditions, including sickle cell and cerebrospinal fluid ventricular shunt procedures, had fluctuating readmission rates throughout the study period (Appendix Figure, Panels A-G).
DISCUSSION
Despite substantial national efforts to reduce pediatric readmissions,3 seven-day readmission rates at children’s hospitals have not decreased over six years. When individual conditions are examined, there are minor fluctuations of readmission rates over time but no clear trend of decreased readmission events.
Our results are contrary to findings in the Medicare population, where 30-day readmission rates have decreased over time.13,14 In these analyses, we focused on seven-day readmission, as earlier pediatric readmissions are more likely to be preventable. Importantly, the majority of our included hospitals (88%) participate in the Solutions for Patient Safety collaborative, which focuses on reducing seven-day readmissions. Thus, we are confident that a concerted effort to decrease readmission has been ongoing. Further, our findings are contrary to recent analyses indicating an increase in pediatric readmission rates using the pediatric all-condition readmission rate in the National Readmission Database.15 Our analyses are distinctly different in that they allow a focus on hospital-level performance in children’s hospitals. Although in our analyses the all-cause adjusted readmission rate did increase significantly over time (0.006% a quarter or 0.024% per year), this small increase is unlikely to be clinically relevant.
There are several potential reasons for the lack of change in pediatric readmission rates despite concerted efforts to decrease readmissions. First, pediatric readmissions across all conditions are relatively infrequent compared with adult readmission rates. Extrapolating from the largest pediatric study on readmission preventability,8 it is estimated that only two in 100 pediatric hospitalizations results in a PPR.16 Given the lack of robust pediatric readmission prediction tools, the ability to prospectively identify children at high risk for readmission and target interventions is challenging. Second, as we have previously described, children are readmitted after hospitalization for a wide variety of conditions.5 Medicare readmission penalties are leveraged on specific conditions; yet, Medicaid policies include all conditions. In pediatrics, successful interventions to reduce readmissions have focused on hospitalizations for specific conditions.17 In the only two large pediatric readmission reduction trials across multiple conditions, postdischarge homecare nursing contact did not reduce reutilization.18,19 It is challenging to decrease readmissions in heterogenous populations without a robust set of evidence-based interventions. Third, there are multiple ways to measure pediatric readmissions, and different institutions may focus on different methods. Given the proprietary nature and the reliance on retrospective administrative data, PPR rates cannot be assessed during admission and thus are not feasible as a real-time quality improvement outcome. Fourth, in contrast to other hospital quality metrics such as central line-associated bloodstream infections or catheter-associated urinary tract infection, the locus of control for readmission is not entirely within the purview of the hospital.
It is unclear what readmission rate in children is appropriate—or safe—and whether that level has already been met. National readmission prevention efforts may have collateral benefits such as improved communication, medication errors or adherence, and other important aspects of care during transitions. In this scenario, lower readmission rates may not reflect improved quality. Future research should focus on determining if and how readmission reduction efforts are helping to ease the transition to home. Alternatively, research should determine if there are better interventions to assist with transition challenges which should receive resources divested from failing readmission reduction efforts.
Using administrative data, we are limited in delineating truly preventable readmissions from nonpreventable readmissions. Nevertheless, we chose to focus on the PPR and AC metrics, as these are the most policy-relevant metrics. Additionally, we examined aggregate rates of readmission across a cohort of hospitals and did not assess for within-hospital changes in readmission rates. Thus, it is possible (and likely) that some hospitals saw improvements and others saw increases in readmission rates during the study period. We are unable to examine readmission rates at hospitals based on investment in readmission reduction efforts or individual state Medicaid reimbursement policies. Finally, we are unable to assess readmissions to other institutions; however, it is unlikely that readmissions to other hospitals have decreased significantly when readmissions to the discharging hospital have not changed.
Pediatric readmissions at children’s hospitals have not decreased in the past six years, despite widespread readmission reduction efforts. Readmission rates for individual conditions have fluctuated but have not decreased.
Disclosures
Dr. Auger reports grants from AHRQ, during the conduct of the study. Drs. Harris, Gay, Teufel, McLead, Neuman, Peltz, Morse, Del Beccaro, Simon, Argawal, and Fieldston have nothing to disclose. Dr. Shah is the Editor-in-Chief of the Journal of Hospital Medicine.
Funding
Dr. Auger’s research is funded by a K08 award from the Agency for Healthcare Research and Quality (1K08HS024735-01A).
1. Centers for Medicare & Medicaid Services. Readmissions Reduction Program (HRRP). https://www.cms.gov/Medicare/Medicare-Fee-for-Service-Payment/AcuteInpatientPPS/Readmissions-Reduction-Program.html. Accessed January 19, 2018.
2. 3M Health Information Systems. Potentially Preventable Readmissions Classification System: Methodology Overview. http://multimedia.3m.com/mws/media/1042610O/resources-and-references-his-2015.pdf. Accessed April 5, 2019.
3. Children’s Hospitals’ Solutions for Patient Safety. SPS prevention bundles: readmission. http://www.solutionsforpatientsafety.org/wp-content/uploads/SPS-Prevention-Bundles.pdf. Accessed January 11, 2017.
4. Berry JG, Toomey SL, Zaslavsky AM, et al. Pediatric readmission prevalence and variability across hospitals. JAMA. 2013;309(4):372-380. https://doi.org/10.1001/jama.2012.188351.
5. Gay JC, Agrawal R, Auger KA, et al. Rates and impact of potentially preventable readmissions at children’s hospitals. J Pediatr. 2015;166(3):613-619. https://doi.org/10.1016/j.jpeds.2014.10.052.
6. Auger KA, Teufel RJ, Harris JM, et al. Children’s hospital characteristics and readmission metrics. Pediatrics. 2017;139(2):e20161720. https://doi.org/10.1542/peds.2016-1720.
7. Joynt KE, Orav EJ, Jha AK. Thirty-day readmission rates for medicare beneficiaries by race and site of care. JAMA. 2011;305(7):675-681. https://doi.org/10.1001/jama.2011.123.
8. Toomey SL, Peltz A, Loren S, et al. Potentially preventable 30-day hospital readmissions at a children’s hospital. Pediatrics. 2016;138(2):e20154182. doi: 10.1542/peds.2015-4182.
9. Children’s Hospital Association. Pediatric analytic solutions. https://www.childrenshospitals.org/Programs-and-Services/Data-Analytics-and-Research/Pediatric-Analytic-Solutions. Accessed June 2, 2018.
10. Simon TD, Berry J, Feudtner C, et al. Children with complex chronic conditions in inpatient hospital settings in the United States. Pediatrics. 2010;126(4):647-655. https://doi.org/10.1542/peds.2009-3266.
11. Berry JG, Hall M, Hall DE, et al. Inpatient growth and resource use in 28 children’s hospitals: a longitudinal, multi-institutional study. JAMA Pediatr. 2013;167(2):170-177.https://doi.org/10.1001/jamapediatrics.2013.432.
12. Richardson T, Rodean J, Harris M, et al. Development of hospitalization resource intensity scores for kids (H-RISK) and comparison across pediatric populations. J Hosp Med. 2018;13(9):602-608. https://doi.org/10.12788/jhm.2948.
13. Zuckerman RB, Sheingold SH, Orav EJ, Ruhter J, Epstein AM. Readmissions, observation, and the hospital readmissions reduction program. N Engl J Med. 2016;374(16):1543-1551. https://doi.org/10.1056/NEJMsa1513024.
14. Desai NR, Ross JS, Kwon JY, et al. Association between hospital penalty status under the hospital readmission reduction program and readmission rates for target and nontarget conditions. JAMA. 2016;316(24):2647-2656. https://doi.org/10.1001/jama.2016.18533.
15. Bucholz EM, Toomey SL, Schuster MA. Trends in pediatric hospitalizations and readmissions: 2010-2016. Pediatrics. 2019;143(2):e20181958. https://doi.org/10.1542/peds.2018-1958.
16. Brittan M, Shah SS, Auger KA. Preventing pediatric readmissions: how does the hospital fit in? Pediatrics. 2016;138(2):e20161643. https://doi.org/10.1542/peds.2016-1643.
17. Auger KA, Kenyon CC, Feudtner C, Davis MM. Pediatric hospital discharge interventions to reduce subsequent utilization: a systematic review. J Hosp Med. 2014;9(4):251-260. https://doi.org/10.1002/jhm.2134.
18. Auger KA, Simmons JM, Tubbs-Cooley H, et al. Hospital to home outcomes (H2O) randomized trial of a post-discharge nurse home visit. Pediatrics. In press.
19. Auger KA, Shah SS, Tubbs-Cooley HL, et al. Effects of a 1-time nurse-led telephone call after pediatric discharge: the H2O II randomized clinical trial. JAMA Pediatr. 2018;172(9):e181482. https://doi.org/10.1001/jamapediatrics.2018.1482.
© 2019 Society of Hospital Medicine