User login
Healthcare Encounter and Financial Impact of COVID-19 on Children’s Hospitals
To benefit patients and the public health of their communities, children’s hospitals across the United States prepared for and responded to COVID-19 by conserving personal protective equipment, suspending noncritical in-person healthcare encounters (including outpatient visits and elective surgeries), and implementing socially distanced essential care.1,2 These measures were promptly instituted during a time of both substantial uncertainty about the pandemic’s behavior in children—including its severity and duration—and extreme variation in local and state governments’ responses to the pandemic.
Congruent with other healthcare institutions, children’s hospitals calibrated their clinical operations to the evolving nature of the pandemic, prioritizing the safety of patients and staff while striving to maintain financial viability in the setting of increased costs and decreased revenue. In some cases, children’s hospitals aided adult hospitals and health systems by admitting young and middle-aged adult patients and by centralizing all pediatric patients requiring intensive care within a region. These efforts occurred while many children’s hospitals remained the sole source of specialized pediatric care, including care for rare complex health problems.
As the COVID-19 pandemic continues, there is a critical need to assess how the initial phase of the pandemic affected healthcare encounters and related finances in children’s hospitals. Understanding these trends will position children’s hospitals to project and prepare for subsequent COVID-19 surges, as well as future related public health crises that necessitate widespread social distancing. Therefore, we compared year-over-year trends in healthcare encounters and hospital charges across US children’s hospitals before and during the COVID-19 pandemic, focusing on the beginning of COVID-19 in the United States, which was defined as February through June 2020.
METHODS
This is a retrospective analysis of 26 children’s hospitals (22 freestanding, 4 nonfreestanding) from all US regions (12 South, 7 Midwest, 5 West, 2 Northeast) contributing encounter and financial data to the PROSPECT database (Children’s Hospital Association, Lenexa, Kansas) from February 1 to June 30 in both 2019 (before COVID-19) and 2020 (during COVID-19). In response to COVID-19, hospitals participating in PROSPECT increased the efficiency of data centralization and reporting in 2020 during the period February 1 to June 30 to expedite analysis and dissemination of findings.
The main outcome measures were the percentage of change in weekly encounters (inpatient bed-days, emergency department [ED] visits, and surgeries) and inflation-adjusted charges (categorized as inpatient care and outpatient care, such as ambulatory surgery, clinics, and ED visits) before vs during COVID-19.
RESULTS


Charges that accrued from February 1 to June 30 were lower in 2020 by a median 23.6% (IQR, –28.7% to –19.1%) per children’s hospital than they were in 2019, corresponding to a median decrease of $276.3 million (IQR, $404.0-$126.0 million) in charges per hospital (Table). Forty percent of this decrease was attributable to decreased charges resulting from fewer inpatient healthcare encounters.
DISCUSSION
These findings beg the question of how well children’s hospitals are positioned to weather a recurrent surge in COVID-19. Because the severity of illness of COVID-19 has been lower to date in the pediatric vs adult populations, an increase in COVID-19-related visits to EDs and admissions to offset the decreased resource use of other pediatric healthcare problems is not anticipated. Existing hospital financial reserves as well as federal aid from the Coronavirus Aid, Relief, and Economic Security Act that helped mitigate the initial encounter and financial losses during the beginning of COVID-19 may not be readily available over time.4,5 Certainly, the findings from the current study support continued lobbying for additional state and federal funds allocated through future relief packages to children’s hospitals.
Additional approaches to financial solvency in children’s hospitals during the sustained COVID-19 pandemic include addressing surgical backlogs and sharing best practices for safe and sustained reopening of clinical operations and financial practices across institutions. Although the PROSPECT database does not contain information on the types of surgeries present within this backlog, our experiences suggest that both same-day and inpatient elective surgeries have been affected, especially lengthy procedures (eg, spinal fusion for neuromuscular scoliosis). Spread and scale of feasible and efficient solutions to reengineer and expand patient capacities and throughput for operating rooms, postanesthesia recovery areas, and intensive care and floor units are needed. Enhanced analytics that accurately predict postoperative length of hospital stay, coupled with early recovery after surgery clinical protocols, could help optimize hospital bed management. Effective ways to convert hospital rooms from single to double occupancy, to manage family visitation, and to proactively test asymptomatic patients, family, and hospital staff will mitigate continued COVID-19 penetration through children’s hospitals.
One important limitation of the current study is the measurement of hospitals’ charges. The charge data were not positioned to comprehensively measure each hospital’s financial state during the COVID-19 pandemic. However, the decrease in hospital charges reported by the children’s hospitals in the current study is comparable with the financial losses reported for many adult hospitals during the pandemic.6,7
CONCLUSION
Children’s hospitals’ ability to serve the nation’s pediatric patients depends on the success of the hospitals’ plans to manage current and future COVID-19 surges and to reopen and recover from the surges that have passed. Additional investigation is needed to identify best operational and financial practices among children’s hospitals that have enabled them to endure the COVID-19 pandemic.
1. COVID-19: ways to prepare your children’s hospital now. Children’s Hospital Association. March 12, 2020. Accessed June 30, 2020. https://www.childrenshospitals.org/Newsroom/Childrens-Hospitals-Today/Articles/2020/03/COVID-19-11-Ways-to-Prepare-Your-Hospital-Now
2. Chopra V, Toner E, Waldhorn R, Washer L. How should U.S. hospitals prepare for coronavirus disease 2019 (COVID-19)? Ann Intern Med. 2020;172(9):621-622. https://doi.org/10.7326/m20-0907
3. Oseran AS, Nash D, Kim C, et al. Changes in hospital admissions for urgent conditions during COVID-19 pandemic. Am J Manag Care. 2020;26(8):327-328. https://doi.org/10.37765/ajmc.2020.43837
4. Coronavirus Aid, Relief, and Economic Security Act or the CARES Act. 15 USC Chapter 116 (2020). Pub L No. 116-36, 134 Stat 281. https://www.congress.gov/bill/116th-congress/house-bill/748
5. The Coronavirus Aid, Relief, and Economic Security (CARES) Act Provider Relief Fund: general information. US Department of Health & Human Services. June 25, 2020. Accessed June 30, 2020. https://www.hhs.gov/coronavirus/cares-act-provider-relief-fund/general-information/index.html
6. Hospitals and health systems face unprecedented financial pressures due to COVID-19. American Hospital Association. May 2020. Accessed July 13, 2020. https://www.aha.org/system/files/media/file/2020/05/aha-covid19-financial-impact-0520-FINAL.pdf
7. Birkmeyer J, Barnato A, Birkmeyer N, Bessler R, Skinner J. The impact of the COVID-19 pandemic on hospital admissions in the United States. Health Aff (Millwood). 2020;39(11):2010-2017. https://doi.org/10.1377/hlthaff.2020.00980
To benefit patients and the public health of their communities, children’s hospitals across the United States prepared for and responded to COVID-19 by conserving personal protective equipment, suspending noncritical in-person healthcare encounters (including outpatient visits and elective surgeries), and implementing socially distanced essential care.1,2 These measures were promptly instituted during a time of both substantial uncertainty about the pandemic’s behavior in children—including its severity and duration—and extreme variation in local and state governments’ responses to the pandemic.
Congruent with other healthcare institutions, children’s hospitals calibrated their clinical operations to the evolving nature of the pandemic, prioritizing the safety of patients and staff while striving to maintain financial viability in the setting of increased costs and decreased revenue. In some cases, children’s hospitals aided adult hospitals and health systems by admitting young and middle-aged adult patients and by centralizing all pediatric patients requiring intensive care within a region. These efforts occurred while many children’s hospitals remained the sole source of specialized pediatric care, including care for rare complex health problems.
As the COVID-19 pandemic continues, there is a critical need to assess how the initial phase of the pandemic affected healthcare encounters and related finances in children’s hospitals. Understanding these trends will position children’s hospitals to project and prepare for subsequent COVID-19 surges, as well as future related public health crises that necessitate widespread social distancing. Therefore, we compared year-over-year trends in healthcare encounters and hospital charges across US children’s hospitals before and during the COVID-19 pandemic, focusing on the beginning of COVID-19 in the United States, which was defined as February through June 2020.
METHODS
This is a retrospective analysis of 26 children’s hospitals (22 freestanding, 4 nonfreestanding) from all US regions (12 South, 7 Midwest, 5 West, 2 Northeast) contributing encounter and financial data to the PROSPECT database (Children’s Hospital Association, Lenexa, Kansas) from February 1 to June 30 in both 2019 (before COVID-19) and 2020 (during COVID-19). In response to COVID-19, hospitals participating in PROSPECT increased the efficiency of data centralization and reporting in 2020 during the period February 1 to June 30 to expedite analysis and dissemination of findings.
The main outcome measures were the percentage of change in weekly encounters (inpatient bed-days, emergency department [ED] visits, and surgeries) and inflation-adjusted charges (categorized as inpatient care and outpatient care, such as ambulatory surgery, clinics, and ED visits) before vs during COVID-19.
RESULTS
Charges that accrued from February 1 to June 30 were lower in 2020 by a median 23.6% (IQR, –28.7% to –19.1%) per children’s hospital than they were in 2019, corresponding to a median decrease of $276.3 million (IQR, $404.0-$126.0 million) in charges per hospital (Table). Forty percent of this decrease was attributable to decreased charges resulting from fewer inpatient healthcare encounters.
DISCUSSION
These findings beg the question of how well children’s hospitals are positioned to weather a recurrent surge in COVID-19. Because the severity of illness of COVID-19 has been lower to date in the pediatric vs adult populations, an increase in COVID-19-related visits to EDs and admissions to offset the decreased resource use of other pediatric healthcare problems is not anticipated. Existing hospital financial reserves as well as federal aid from the Coronavirus Aid, Relief, and Economic Security Act that helped mitigate the initial encounter and financial losses during the beginning of COVID-19 may not be readily available over time.4,5 Certainly, the findings from the current study support continued lobbying for additional state and federal funds allocated through future relief packages to children’s hospitals.
Additional approaches to financial solvency in children’s hospitals during the sustained COVID-19 pandemic include addressing surgical backlogs and sharing best practices for safe and sustained reopening of clinical operations and financial practices across institutions. Although the PROSPECT database does not contain information on the types of surgeries present within this backlog, our experiences suggest that both same-day and inpatient elective surgeries have been affected, especially lengthy procedures (eg, spinal fusion for neuromuscular scoliosis). Spread and scale of feasible and efficient solutions to reengineer and expand patient capacities and throughput for operating rooms, postanesthesia recovery areas, and intensive care and floor units are needed. Enhanced analytics that accurately predict postoperative length of hospital stay, coupled with early recovery after surgery clinical protocols, could help optimize hospital bed management. Effective ways to convert hospital rooms from single to double occupancy, to manage family visitation, and to proactively test asymptomatic patients, family, and hospital staff will mitigate continued COVID-19 penetration through children’s hospitals.
One important limitation of the current study is the measurement of hospitals’ charges. The charge data were not positioned to comprehensively measure each hospital’s financial state during the COVID-19 pandemic. However, the decrease in hospital charges reported by the children’s hospitals in the current study is comparable with the financial losses reported for many adult hospitals during the pandemic.6,7
CONCLUSION
Children’s hospitals’ ability to serve the nation’s pediatric patients depends on the success of the hospitals’ plans to manage current and future COVID-19 surges and to reopen and recover from the surges that have passed. Additional investigation is needed to identify best operational and financial practices among children’s hospitals that have enabled them to endure the COVID-19 pandemic.
1. COVID-19: ways to prepare your children’s hospital now. Children’s Hospital Association. March 12, 2020. Accessed June 30, 2020. https://www.childrenshospitals.org/Newsroom/Childrens-Hospitals-Today/Articles/2020/03/COVID-19-11-Ways-to-Prepare-Your-Hospital-Now
2. Chopra V, Toner E, Waldhorn R, Washer L. How should U.S. hospitals prepare for coronavirus disease 2019 (COVID-19)? Ann Intern Med. 2020;172(9):621-622. https://doi.org/10.7326/m20-0907
3. Oseran AS, Nash D, Kim C, et al. Changes in hospital admissions for urgent conditions during COVID-19 pandemic. Am J Manag Care. 2020;26(8):327-328. https://doi.org/10.37765/ajmc.2020.43837
4. Coronavirus Aid, Relief, and Economic Security Act or the CARES Act. 15 USC Chapter 116 (2020). Pub L No. 116-36, 134 Stat 281. https://www.congress.gov/bill/116th-congress/house-bill/748
5. The Coronavirus Aid, Relief, and Economic Security (CARES) Act Provider Relief Fund: general information. US Department of Health & Human Services. June 25, 2020. Accessed June 30, 2020. https://www.hhs.gov/coronavirus/cares-act-provider-relief-fund/general-information/index.html
6. Hospitals and health systems face unprecedented financial pressures due to COVID-19. American Hospital Association. May 2020. Accessed July 13, 2020. https://www.aha.org/system/files/media/file/2020/05/aha-covid19-financial-impact-0520-FINAL.pdf
7. Birkmeyer J, Barnato A, Birkmeyer N, Bessler R, Skinner J. The impact of the COVID-19 pandemic on hospital admissions in the United States. Health Aff (Millwood). 2020;39(11):2010-2017. https://doi.org/10.1377/hlthaff.2020.00980
© 2021 Society of Hospital Medicine
Performance of Pediatric Readmission Measures
Readmission rates are frequently used as a hospital quality metric, with use including payment incentive at the hospital level,1 specific condition quality measurement,2 balancing measures for quality improvement projects,3-5 transition success,6,7 and use in public hospital rankings.8 Currently, four methods are commonly used to evaluate pediatric readmissions, each with strengths and limitations, including the following (Appendix Table 1):
1. All-cause readmissions: A measure of any readmission within a given time period regardless of the reason for readmission.9
2. Unplanned readmission/time flag: A measure intended to identify unplanned readmissions. This measure relies on time designations within the electronic health record. The time between hospital registration and admission is calculated, and if the readmission is registered more than 24 hours prior to admission, the readmission is considered planned.10 Hereafter, this measure will be referred to as the time flag measure.
3. Pediatric all-condition readmission (PACR): A measure intended to identify unplanned readmission through the exclusion of certain procedures and diagnoses.11
4. Potentially preventable readmission (PPR): A method to identify preventable readmissions based on a proprietary algorithm developed by
While all four of these measures are used to assess quality, there is little known about these measures’ ability to exclude planned readmissions and identify only preventable pediatric readmission, which conceptually is most relevant to the quality of care. However, many of these measures were not intended to capture preventability, but instead capture the related issue of whether the readmission was planned. Therefore, we sought to evaluate the four readmission measures as they relate to both preventability and unplanned status as determined through medical record review with multidisciplinary care provider input.
METHODS
As part of a hospital-wide readmission reduction quality improvement collaborative at a free-standing tertiary care children’s hospital, clinicians from hospital medicine, cardiology, neonatology, and neurology teams reviewed 30-day readmissions using a standardized abstraction tool. All readmission events (observation or inpatient encounter) after any discharge (observation or inpatient encounter) from eligible units were reviewed; therefore, each hospitalization was a potential index hospitalization. We classified the preventability of each readmission with use of a previously described Likert scale with high interrater reliability.14 For these analyses, readmissions were considered preventable if the reviewing team rated them as either “more likely preventable” or “preventable in most circumstances.” Each readmission was also evaluated as planned or unplanned. Methods for readmission review and classification are in the Appendix.
We included all readmissions between July 2014 and June 2016. We compared the medical record review classifications with the assessments from each of the four measures of pediatric readmission. We calculated sensitivity and specificity for both outcomes (planned/unplanned and preventable/not preventable) for all four measures. For standardization of discussion, we categorized description of measure performance as “very poor” as less than 50%, “poor” between 50%-75%, “fair” as 75%-85%, “good” as 85%-90%, “very good” as 90%-95% and excellent as greater than 95%. We also calculated positive and negative predictive value (PPV and NPV) over plausible ranges of prevalence using the sensitivity and specificity of each comparison (Appendix).
Of note, certain exclusions are outlined by the PACR and PPR algorithms. The PACR evaluates only readmission events that occur in children younger than 18 years. The PPR algorithm does not assign preventability if either the index or readmission event is classified as an observation stay or if it is part of a larger chain of readmissions.
RESULTS
Among 30-day readmissions considered, 1,643 were eligible for medical record review; 1,125 reviews were completed by the clinical teams (68.5%). The median time to readmission was 7 days (interquartile range [IQR], 4-18). Most children were non-Hispanic White (71%) or Black (20%). The median age at hospitalization was 2.3 years (IQR 0.4-12.1). Most children had Medicaid (56%) or private (41%) insurance. Most of the reviews were performed in cardiology (43%) and hospital medicine (37%) with patients in neurology (13%) and neonatology (7%) constituting the remaining reviews. Uncontrolled advancement of chronic disease was the most common readmission category on medical record review (25.1%), followed by unrelated readmission (20.7%), scheduled readmission (20.4%), and progression of acute disease (16.6%) (Appendix Table 2).
Assessment of Preventable and Unplanned Readmissions
On multidisciplinary medical record review, most readmissions were classified as not preventable (84.5%). Specifically, 64% were not preventable and unplanned; 20% were deemed not preventable and planned. Only 15% were classified as unplanned and preventable and 1% as planned and preventable (Appendix Figure: Population A/B).
Matching Chart Review to the Four Algorithms
All 1,125 readmissions were assessed by the all-cause and time flag readmission measures (Appendix Figure: Population A/B). After applying algorithm exclusions (details in Appendix), only 804 of the 1,125 (71.5%) reviewed readmissions matched for PACR readmission comparison (Appendix Figure: Population C); 487 of the 1,125 (43.3%) of the reviewed readmissions matched for PPR comparison (Appendix Figure: Population D).
All-Cause
Because all-cause determines only if a readmission occurs, the measure is by definition 100% sensitive and 0% specific in both assessment of preventability and unplanned readmission (Table: Section A).

Time Flag
The time flag measure identified 80% (866/1,112) of the readmissions as unplanned. This measure had very good sensitivity but very poor specificity in identifying preventable readmissions, which corresponded to very poor PPV and good to excellent NPV. In terms of identifying unplanned readmissions, the time flag measure had excellent sensitivity and very good specificity, which corresponded to very good to excellent PPV and good to very good NPV (Table: Section B).
PACR
The PACR algorithm identified 75% (599/796) of readmissions as unplanned. The PACR has good sensitivity but very poor specificity in identifying preventable readmissions, which corresponded to very poor PPV and fair to very good NPV. In terms of identifying unplanned readmissions, the PACR had fair sensitivity but poor specificity, which corresponded to fair PPV and poor NPV (Table: Section C).
PPR
The PPR algorithm identified 53% (257/487) of admissions as potentially preventable. The PPR algorithm had poor sensitivity and specificity in identifying preventable readmissions, which corresponded to very poor PPV and fair to very good NPV. In terms of identifying unplanned readmissions, the PPR algorithm had poor sensitivity and fair specificity in identifying unplanned readmissions, which corresponded to fair to good PPV and very poor to poor NPV (Table: Section D).
Evaluation of Excluded Readmission Events
Because both the PACR and PPR had large numbers of algorithm exclusions, we describe the preventability and unplanned assessment of the excluded readmission events. Both algorithms excluded preventable events. Of the 321 readmissions excluded by the PACR algorithm, 13.4% were classified as preventable by chart review. Likewise, 14.9% of 638 readmissions excluded by PPR were classified as preventable by chart review.
DISCUSSION
The ability to accurately capture preventable pediatric readmission is a goal for hospital quality experts and health policymakers alike. Of the four commonly used readmission measures to assess readmission, only PPR is designed to focus on preventability. Unfortunately, none of these four measures is adequately sensitive or specific to identify preventable readmissions; all measures had very poor PPV for preventability. Of the four measures, the time flag measure had the best sensitivity, specificity, PPV, and NPV for identifying unplanned readmissions.
The overall percentage of unplanned readmissions identified by both the time flag and by PACR measures match the overall percentage of unplanned readmissions identified in chart review: The time flag measure identified 80% of admissions as unplanned versus 79% identified by chart review (Appendix Figure: Population A/B); PACR classified 75% as unplanned versus 81% identified by chart review for PACR-eligible readmissions (Appendix Figure: Population C). In contrast, the PPR algorithm classified many more readmissions as potentially preventable (53%) than were identified by chart review at only 16% (Appendix Figure: Population D). The PACR and PPR algorithms also exclude a significant number of readmissions that are unplanned and a smaller, but not trivial, number of readmissions that are preventable; these exclusions limit their accuracy.
The ability to apply these four measures in real time during a hospitalization varies by metric. Two of the measures, the all-cause and time flag, can be applied during a readmission event, which is appealing for quality improvement initiatives. These measures allow for notification of providers that a current hospitalization is a readmission event, which allows providers the opportunity to learn from these events as they occur (Appendix Table 1). While “unplanned” is not the same as “potentially preventable,” almost all potentially preventable readmissions are unplanned; therefore, accurately identifying unplanned readmissions is more beneficial than all-cause. Additionally, a low all-cause readmission rate can be indicative of poor access to scheduled procedures. Nevertheless, all-cause readmission is sometimes used to measure quality.1,8 While the time flag measure may be more useful for quality improvement initiatives and hospital providers, it relies on hospital registration time, which is not widely available in administrative data sources and, therefore, has limited usefulness to policymakers.
Both PACR and PPR require administrative claims analysis, which is appealing from a policy standpoint. However, the reliance on claims data means the inclusion/exclusion of events can occur only retrospectively, which limits the usefulness of these measures in learning and intervening in real time. When the two measures are compared, PACR offers better sensitivity and PPR offers better specificity with regard to identifying unplanned readmission. The PPR software overcalls preventable readmissions, identifying more readmissions as preventable than there actually are. Nevertheless, Medicaid in several states uses PPR for payment incentive.1,15-17 Given the poor performance of PPR in assessing both preventable and unplanned pediatric readmission, the use of this measure as a quality metric should be limited.
This study should be considered in the context of several limitations. Because the assessment of preventability was determined as part of a learning quality improvement collaborative and not as a planned research endeavor, not all readmission reviews were completed nor were other existent tools18 that allow for preventability assessment via more structured medical record review used. Second, we reviewed cases only from certain clinical services, which would limit generalizability of these findings to all pediatric admissions. However, given the low sensitivity and specificity of some of the metrics, we would not anticipate that the addition of other types of admissions would improve the sensitivity and specificity enough to ensure reliability. Third, while we relied on an established method to determine preventability, prior work has demonstrated that additional information gathered from families may change preventability.19 Finally, due to the exclusions required by the PPR and PACR algorithms, not all readmission events were reviewed. However, these exclusions reflect the actual specifications of use for both measures.
CONCLUSION
The PPR software has poor fidelity in identifying preventable and unplanned pediatric readmission; this finding has broad policy implications given how widely it is used by state Medicaid offices to assess financial penalties. Among the four pediatric readmission measures used, the time flag metric best identifies unplanned readmissions.
Disclosures
The authors have no conflicts of interest or financial relationships relevant to this article to disclose.
Funding
Dr Auger’s research is supported by a grant from the Agency for Healthcare Research and Quality (1K08HS204735-01A1). The project described was supported by the National Center for Advancing Translational Sciences of the National Institutes of Health, under Award Number 5UL1TR001425-04. The content is solely the responsibility of the authors and does not necessarily represent the official views of the NIH.
1. State Medicaid Payment Policies for Inpatient Hospital Services. Medicaid and CHIP Payment and Access Commission; December 2018. Accessed June 1, 2019. https://www.macpac.gov/publication/macpac-inpatient-hospital-payment-landscapes/
2. Mangione-Smith R, Zhou C, Williams DJ, et al. Pediatric Respiratory Illness Measurement System (PRIMES) scores and outcomes. Pediatrics. 2019;144(2):e20190242. https://doi.org/10.1542/peds.2019-0242
3. Biondi EA, McCulloh R, Staggs VS, et al. Reducing Variability in the Infant Sepsis Evaluation (REVISE): a national quality initiative. Pediatrics. 2019;144(3):e20182201. https://doi.org/10.1542/peds.2018-2201
4. Statile AM, Schondelmeyer AC, Thomson JE, et al. Improving discharge efficiency in medically complex pediatric patients. Pediatrics. 2016;138(2):e20153832. https://doi.org/10.1542/peds.2015-3832
5. White CM, Statile AM, White DL, et al. Using quality improvement to optimise paediatric discharge efficiency. BMJ Qual Saf. 2014;23(5):428-436. https://doi.org/10.1136/bmjqs-2013-002556
6. Auger KA, Simmons JM, Tubbs-Cooley HL, et al; H20 Trial Study Group. Postdischarge nurse home visits and reuse: the Hospital to Home Outcomes (H2O) trial. Pediatrics. 2018;142(1):e20173919. https://doi.org/10.1542/peds.2017-3919
7. Auger KA, Shah SS, Tubbs-Cooley HL, et al. Effects of a 1-time nurse-led telephone call after pediatric discharge: the H2O II randomized clinical trial. JAMA Pediatr. 2018;172(9):e181482. https://doi.org/10.1001/jamapediatrics.2018.1482
8. Olmsted MG, Powell R, Murphy J, Bell Denise, Stanley M, Sanchz R. Methodology: U.S. News & World Report Best Children’s Hospitals 2019-20. U.S. News & World Report; June 17, 2019. Accessed June 16, 2020. https://www.usnews.com/static/documents/health/best-hospitals/BCH_Methodology_2019-20.pdf
9. Bardach NS, Vittinghoff E, Asteria-Peñaloza R, et al. Measuring hospital quality using pediatric readmission and revisit rates. Pediatrics. 2013;132(3):429-436. https://doi.org/10.1542/peds.2012-3527
10. Auger KA, Mueller EL, Weinberg SH, et al. A validated method for identifying unplanned pediatric readmission. J Pediatr. 2016;170:105-12.e102. https://doi.org/10.1016/j.jpeds.2015.11.051
11. Readmissions-Content. Boston Children’s Hospital. Accessed April 8, 2019. http://www.childrenshospital.org/research-and-innovation/research/centers/center-of-excellence-for-pediatric-quality-measurement-cepqm/cepqm-measures/pediatric-readmissions/content
12. Gay JC, Agrawal R, Auger KA, et al. Rates and impact of potentially preventable readmissions at children’s hospitals. J Pediatr. 2015;166(3):613-9.e5. https://doi.org/10.1016/j.jpeds.2014.10.052
13. Auger KA, Teufel RJ, Harris JM, et al. Children’s hospital characteristics and readmission metrics. Pediatrics. 2017;139(2):e20161720. https://doi.org/10.1542/peds.2016-1720
14. Hain PD, Gay JC, Berutti TW, Whitney GM, Wang W, Saville BR. Preventability of early readmissions at a children’s hospital. Pediatrics. 2013;131(1):e171-e181. https://doi.org/10.1542/peds.2012-0820
15. Potentially Preventable Events. Texas Health and Human Services. Accessed May 19, 2019. https://hhs.texas.gov/about-hhs/process-improvement/medicaid-chip-quality-efficiency-improvement/potentially-preventable-events
16. Potentially Preventable Readmissions. New York State Department of Health. Accessed May 28, 2019. https://regs.health.ny.gov/sites/default/files/pdf/recently_adopted_regulations/2011-02-23_potentially_preventable_readmissions.pdf
17. Potentially Preventable Readmissions Policy. Illinois Department of Healthcare and Family Services. Accessed May 28, 2019. https://www.illinois.gov/hfs/SiteCollectionDocuments/PPR_Overview.pdf
18. Jonas JA, Devon EP, Ronan JC, et al. Determining preventability of pediatric readmissions using fault tree analysis. J Hosp Med. 2016;11(5):329-335. https://doi.org/10.1002/jhm.2555
19. Toomey SL, Peltz A, Loren S, et al. Potentially preventable 30-day hospital readmissions at a children’s hospital. Pediatrics. 2016;138(2):e20154182. https://doi.org/10.1542/peds.2015-4182
Readmission rates are frequently used as a hospital quality metric, with use including payment incentive at the hospital level,1 specific condition quality measurement,2 balancing measures for quality improvement projects,3-5 transition success,6,7 and use in public hospital rankings.8 Currently, four methods are commonly used to evaluate pediatric readmissions, each with strengths and limitations, including the following (Appendix Table 1):
1. All-cause readmissions: A measure of any readmission within a given time period regardless of the reason for readmission.9
2. Unplanned readmission/time flag: A measure intended to identify unplanned readmissions. This measure relies on time designations within the electronic health record. The time between hospital registration and admission is calculated, and if the readmission is registered more than 24 hours prior to admission, the readmission is considered planned.10 Hereafter, this measure will be referred to as the time flag measure.
3. Pediatric all-condition readmission (PACR): A measure intended to identify unplanned readmission through the exclusion of certain procedures and diagnoses.11
4. Potentially preventable readmission (PPR): A method to identify preventable readmissions based on a proprietary algorithm developed by
While all four of these measures are used to assess quality, there is little known about these measures’ ability to exclude planned readmissions and identify only preventable pediatric readmission, which conceptually is most relevant to the quality of care. However, many of these measures were not intended to capture preventability, but instead capture the related issue of whether the readmission was planned. Therefore, we sought to evaluate the four readmission measures as they relate to both preventability and unplanned status as determined through medical record review with multidisciplinary care provider input.
METHODS
As part of a hospital-wide readmission reduction quality improvement collaborative at a free-standing tertiary care children’s hospital, clinicians from hospital medicine, cardiology, neonatology, and neurology teams reviewed 30-day readmissions using a standardized abstraction tool. All readmission events (observation or inpatient encounter) after any discharge (observation or inpatient encounter) from eligible units were reviewed; therefore, each hospitalization was a potential index hospitalization. We classified the preventability of each readmission with use of a previously described Likert scale with high interrater reliability.14 For these analyses, readmissions were considered preventable if the reviewing team rated them as either “more likely preventable” or “preventable in most circumstances.” Each readmission was also evaluated as planned or unplanned. Methods for readmission review and classification are in the Appendix.
We included all readmissions between July 2014 and June 2016. We compared the medical record review classifications with the assessments from each of the four measures of pediatric readmission. We calculated sensitivity and specificity for both outcomes (planned/unplanned and preventable/not preventable) for all four measures. For standardization of discussion, we categorized description of measure performance as “very poor” as less than 50%, “poor” between 50%-75%, “fair” as 75%-85%, “good” as 85%-90%, “very good” as 90%-95% and excellent as greater than 95%. We also calculated positive and negative predictive value (PPV and NPV) over plausible ranges of prevalence using the sensitivity and specificity of each comparison (Appendix).
Of note, certain exclusions are outlined by the PACR and PPR algorithms. The PACR evaluates only readmission events that occur in children younger than 18 years. The PPR algorithm does not assign preventability if either the index or readmission event is classified as an observation stay or if it is part of a larger chain of readmissions.
RESULTS
Among 30-day readmissions considered, 1,643 were eligible for medical record review; 1,125 reviews were completed by the clinical teams (68.5%). The median time to readmission was 7 days (interquartile range [IQR], 4-18). Most children were non-Hispanic White (71%) or Black (20%). The median age at hospitalization was 2.3 years (IQR 0.4-12.1). Most children had Medicaid (56%) or private (41%) insurance. Most of the reviews were performed in cardiology (43%) and hospital medicine (37%) with patients in neurology (13%) and neonatology (7%) constituting the remaining reviews. Uncontrolled advancement of chronic disease was the most common readmission category on medical record review (25.1%), followed by unrelated readmission (20.7%), scheduled readmission (20.4%), and progression of acute disease (16.6%) (Appendix Table 2).
Assessment of Preventable and Unplanned Readmissions
On multidisciplinary medical record review, most readmissions were classified as not preventable (84.5%). Specifically, 64% were not preventable and unplanned; 20% were deemed not preventable and planned. Only 15% were classified as unplanned and preventable and 1% as planned and preventable (Appendix Figure: Population A/B).
Matching Chart Review to the Four Algorithms
All 1,125 readmissions were assessed by the all-cause and time flag readmission measures (Appendix Figure: Population A/B). After applying algorithm exclusions (details in Appendix), only 804 of the 1,125 (71.5%) reviewed readmissions matched for PACR readmission comparison (Appendix Figure: Population C); 487 of the 1,125 (43.3%) of the reviewed readmissions matched for PPR comparison (Appendix Figure: Population D).
All-Cause
Because all-cause determines only if a readmission occurs, the measure is by definition 100% sensitive and 0% specific in both assessment of preventability and unplanned readmission (Table: Section A).
Time Flag
The time flag measure identified 80% (866/1,112) of the readmissions as unplanned. This measure had very good sensitivity but very poor specificity in identifying preventable readmissions, which corresponded to very poor PPV and good to excellent NPV. In terms of identifying unplanned readmissions, the time flag measure had excellent sensitivity and very good specificity, which corresponded to very good to excellent PPV and good to very good NPV (Table: Section B).
PACR
The PACR algorithm identified 75% (599/796) of readmissions as unplanned. The PACR has good sensitivity but very poor specificity in identifying preventable readmissions, which corresponded to very poor PPV and fair to very good NPV. In terms of identifying unplanned readmissions, the PACR had fair sensitivity but poor specificity, which corresponded to fair PPV and poor NPV (Table: Section C).
PPR
The PPR algorithm identified 53% (257/487) of admissions as potentially preventable. The PPR algorithm had poor sensitivity and specificity in identifying preventable readmissions, which corresponded to very poor PPV and fair to very good NPV. In terms of identifying unplanned readmissions, the PPR algorithm had poor sensitivity and fair specificity in identifying unplanned readmissions, which corresponded to fair to good PPV and very poor to poor NPV (Table: Section D).
Evaluation of Excluded Readmission Events
Because both the PACR and PPR had large numbers of algorithm exclusions, we describe the preventability and unplanned assessment of the excluded readmission events. Both algorithms excluded preventable events. Of the 321 readmissions excluded by the PACR algorithm, 13.4% were classified as preventable by chart review. Likewise, 14.9% of 638 readmissions excluded by PPR were classified as preventable by chart review.
DISCUSSION
The ability to accurately capture preventable pediatric readmission is a goal for hospital quality experts and health policymakers alike. Of the four commonly used readmission measures to assess readmission, only PPR is designed to focus on preventability. Unfortunately, none of these four measures is adequately sensitive or specific to identify preventable readmissions; all measures had very poor PPV for preventability. Of the four measures, the time flag measure had the best sensitivity, specificity, PPV, and NPV for identifying unplanned readmissions.
The overall percentage of unplanned readmissions identified by both the time flag and by PACR measures match the overall percentage of unplanned readmissions identified in chart review: The time flag measure identified 80% of admissions as unplanned versus 79% identified by chart review (Appendix Figure: Population A/B); PACR classified 75% as unplanned versus 81% identified by chart review for PACR-eligible readmissions (Appendix Figure: Population C). In contrast, the PPR algorithm classified many more readmissions as potentially preventable (53%) than were identified by chart review at only 16% (Appendix Figure: Population D). The PACR and PPR algorithms also exclude a significant number of readmissions that are unplanned and a smaller, but not trivial, number of readmissions that are preventable; these exclusions limit their accuracy.
The ability to apply these four measures in real time during a hospitalization varies by metric. Two of the measures, the all-cause and time flag, can be applied during a readmission event, which is appealing for quality improvement initiatives. These measures allow for notification of providers that a current hospitalization is a readmission event, which allows providers the opportunity to learn from these events as they occur (Appendix Table 1). While “unplanned” is not the same as “potentially preventable,” almost all potentially preventable readmissions are unplanned; therefore, accurately identifying unplanned readmissions is more beneficial than all-cause. Additionally, a low all-cause readmission rate can be indicative of poor access to scheduled procedures. Nevertheless, all-cause readmission is sometimes used to measure quality.1,8 While the time flag measure may be more useful for quality improvement initiatives and hospital providers, it relies on hospital registration time, which is not widely available in administrative data sources and, therefore, has limited usefulness to policymakers.
Both PACR and PPR require administrative claims analysis, which is appealing from a policy standpoint. However, the reliance on claims data means the inclusion/exclusion of events can occur only retrospectively, which limits the usefulness of these measures in learning and intervening in real time. When the two measures are compared, PACR offers better sensitivity and PPR offers better specificity with regard to identifying unplanned readmission. The PPR software overcalls preventable readmissions, identifying more readmissions as preventable than there actually are. Nevertheless, Medicaid in several states uses PPR for payment incentive.1,15-17 Given the poor performance of PPR in assessing both preventable and unplanned pediatric readmission, the use of this measure as a quality metric should be limited.
This study should be considered in the context of several limitations. Because the assessment of preventability was determined as part of a learning quality improvement collaborative and not as a planned research endeavor, not all readmission reviews were completed nor were other existent tools18 that allow for preventability assessment via more structured medical record review used. Second, we reviewed cases only from certain clinical services, which would limit generalizability of these findings to all pediatric admissions. However, given the low sensitivity and specificity of some of the metrics, we would not anticipate that the addition of other types of admissions would improve the sensitivity and specificity enough to ensure reliability. Third, while we relied on an established method to determine preventability, prior work has demonstrated that additional information gathered from families may change preventability.19 Finally, due to the exclusions required by the PPR and PACR algorithms, not all readmission events were reviewed. However, these exclusions reflect the actual specifications of use for both measures.
CONCLUSION
The PPR software has poor fidelity in identifying preventable and unplanned pediatric readmission; this finding has broad policy implications given how widely it is used by state Medicaid offices to assess financial penalties. Among the four pediatric readmission measures used, the time flag metric best identifies unplanned readmissions.
Disclosures
The authors have no conflicts of interest or financial relationships relevant to this article to disclose.
Funding
Dr Auger’s research is supported by a grant from the Agency for Healthcare Research and Quality (1K08HS204735-01A1). The project described was supported by the National Center for Advancing Translational Sciences of the National Institutes of Health, under Award Number 5UL1TR001425-04. The content is solely the responsibility of the authors and does not necessarily represent the official views of the NIH.
1. State Medicaid Payment Policies for Inpatient Hospital Services. Medicaid and CHIP Payment and Access Commission; December 2018. Accessed June 1, 2019. https://www.macpac.gov/publication/macpac-inpatient-hospital-payment-landscapes/
2. Mangione-Smith R, Zhou C, Williams DJ, et al. Pediatric Respiratory Illness Measurement System (PRIMES) scores and outcomes. Pediatrics. 2019;144(2):e20190242. https://doi.org/10.1542/peds.2019-0242
3. Biondi EA, McCulloh R, Staggs VS, et al. Reducing Variability in the Infant Sepsis Evaluation (REVISE): a national quality initiative. Pediatrics. 2019;144(3):e20182201. https://doi.org/10.1542/peds.2018-2201
4. Statile AM, Schondelmeyer AC, Thomson JE, et al. Improving discharge efficiency in medically complex pediatric patients. Pediatrics. 2016;138(2):e20153832. https://doi.org/10.1542/peds.2015-3832
5. White CM, Statile AM, White DL, et al. Using quality improvement to optimise paediatric discharge efficiency. BMJ Qual Saf. 2014;23(5):428-436. https://doi.org/10.1136/bmjqs-2013-002556
6. Auger KA, Simmons JM, Tubbs-Cooley HL, et al; H20 Trial Study Group. Postdischarge nurse home visits and reuse: the Hospital to Home Outcomes (H2O) trial. Pediatrics. 2018;142(1):e20173919. https://doi.org/10.1542/peds.2017-3919
7. Auger KA, Shah SS, Tubbs-Cooley HL, et al. Effects of a 1-time nurse-led telephone call after pediatric discharge: the H2O II randomized clinical trial. JAMA Pediatr. 2018;172(9):e181482. https://doi.org/10.1001/jamapediatrics.2018.1482
8. Olmsted MG, Powell R, Murphy J, Bell Denise, Stanley M, Sanchz R. Methodology: U.S. News & World Report Best Children’s Hospitals 2019-20. U.S. News & World Report; June 17, 2019. Accessed June 16, 2020. https://www.usnews.com/static/documents/health/best-hospitals/BCH_Methodology_2019-20.pdf
9. Bardach NS, Vittinghoff E, Asteria-Peñaloza R, et al. Measuring hospital quality using pediatric readmission and revisit rates. Pediatrics. 2013;132(3):429-436. https://doi.org/10.1542/peds.2012-3527
10. Auger KA, Mueller EL, Weinberg SH, et al. A validated method for identifying unplanned pediatric readmission. J Pediatr. 2016;170:105-12.e102. https://doi.org/10.1016/j.jpeds.2015.11.051
11. Readmissions-Content. Boston Children’s Hospital. Accessed April 8, 2019. http://www.childrenshospital.org/research-and-innovation/research/centers/center-of-excellence-for-pediatric-quality-measurement-cepqm/cepqm-measures/pediatric-readmissions/content
12. Gay JC, Agrawal R, Auger KA, et al. Rates and impact of potentially preventable readmissions at children’s hospitals. J Pediatr. 2015;166(3):613-9.e5. https://doi.org/10.1016/j.jpeds.2014.10.052
13. Auger KA, Teufel RJ, Harris JM, et al. Children’s hospital characteristics and readmission metrics. Pediatrics. 2017;139(2):e20161720. https://doi.org/10.1542/peds.2016-1720
14. Hain PD, Gay JC, Berutti TW, Whitney GM, Wang W, Saville BR. Preventability of early readmissions at a children’s hospital. Pediatrics. 2013;131(1):e171-e181. https://doi.org/10.1542/peds.2012-0820
15. Potentially Preventable Events. Texas Health and Human Services. Accessed May 19, 2019. https://hhs.texas.gov/about-hhs/process-improvement/medicaid-chip-quality-efficiency-improvement/potentially-preventable-events
16. Potentially Preventable Readmissions. New York State Department of Health. Accessed May 28, 2019. https://regs.health.ny.gov/sites/default/files/pdf/recently_adopted_regulations/2011-02-23_potentially_preventable_readmissions.pdf
17. Potentially Preventable Readmissions Policy. Illinois Department of Healthcare and Family Services. Accessed May 28, 2019. https://www.illinois.gov/hfs/SiteCollectionDocuments/PPR_Overview.pdf
18. Jonas JA, Devon EP, Ronan JC, et al. Determining preventability of pediatric readmissions using fault tree analysis. J Hosp Med. 2016;11(5):329-335. https://doi.org/10.1002/jhm.2555
19. Toomey SL, Peltz A, Loren S, et al. Potentially preventable 30-day hospital readmissions at a children’s hospital. Pediatrics. 2016;138(2):e20154182. https://doi.org/10.1542/peds.2015-4182
© 2020 Society of Hospital Medicine
Effect of Parental Adverse Childhood Experiences and Resilience on a Child’s Healthcare Reutilization
Adverse Childhood Experiences, or ACEs, include exposure to abuse, neglect, or household dysfunction (eg, having a parent who is mentally ill) as a child.1 Exposure to ACEs affects health into adulthood, with a dose-response relationship between ACEs and a range of comorbidities.1 Adults with 6 or more ACEs have a 20-year shorter life expectancy than do those with no ACEs.1 Still, ACEs are static; once experienced, that experience cannot be undone. However, resilience, or positive adaptation in the context of adversity, can be protective, buffering the negative effects of ACEs.2,3 Protective factors that promote resilience include social capital, such as positive relationships with caregivers and peers.3
With their clear link to health outcomes across the life-course, there is a movement for pediatricians to screen children for ACEs4 and to develop strategies that promote resilience in children, parents, and families. However, screening a child for adversity has challenges because younger children may not have experienced an adverse exposure, or they may be unable to voice their experiences. Studies have demonstrated that parental adversity, or ACEs, may be a marker for childhood adversity.5,6 Biological models also support this potential intergenerational effect of ACEs. Chronic exposure to stress, including ACEs, results in elevated cortisol via a dysregulated hypothalamic-pituitary-adrenal axis, which results in chronic inflammation.7 This “toxic stress” is prolonged, severe in intensity, and can lead to epigenetic changes that may be passed on to the next generation.8,9
Hospitalization of an ill child, and the transition to home after that hospitalization, is a stressful event for children and families.10 This stress may be relevant to parents that have a history of a high rate of ACEs or a current low degree of resilience. Our previous work demonstrated that, in the inpatient setting, parents with high ACEs (≥4) or low resilience have increased coping difficulty 14 days after their child’s hospital discharge.11 Our objective here was to evaluate whether a parent’s ACEs and/or resilience would also be associated with that child’s likelihood of reutilization. We hypothesized that more parental ACEs and/or lower parental resilience would be associated with revisits the emergency room, urgent care, or hospital readmissions.
METHODS
Participants and Study Design
We conducted a prospective cohort study of parents of hospitalized children recruited from the “Hospital-to-Home Outcomes” Studies (H2O I and H2O II).12,13 H2O I and II were prospective, single-center, randomized controlled trials designed to determine the effectiveness of either a nurse-led transitional home visit (H2O I) or telephone call (H2O II) on 30-day unplanned healthcare reutilization. The trials and this study were approved by the Cincinnati Children’s Institutional Review Board. All parents provided written informed consent.
Details of H2O I and II recruitment and design have been described previously.12,13 Briefly, children were eligible for inclusion in either study if they were admitted to our institution’s general Hospital Medicine or the Hospital Medicine Complex Care Services; for H2O I, children hospitalized on the Neurology and Neurosurgery services were also eligible.12,13 Patients were excluded if they were discharged to a residential facility, if they lived outside the home healthcare nurse service area, if they were eligible for skilled home healthcare services (eg, intravenous antibiotics), or if the participating caregiver was non-English speaking.12,13 In H2O I, families were randomized either to receive a single nurse home visit within 96 hours of discharge or standard of care. In H2O II, families enrolled were randomized to receive a telephone call by a nurse within 96 hours of discharge or standard of care. As we have previously published, randomization in both trials successfully balanced the intervention and control arms with respect to key demographic characteristics.12,13 For the analyses presented here, we focused on a subset of caregivers 18 years and older whose children were enrolled in either H2O I or II between August 2015 and October 2016. In both H2O trials, face-to-face and paper-based questionnaires were completed by parents during the index hospitalization.
Outcome and Predictors
Our primary outcome was unanticipated healthcare reutilization defined as return to the emergency room, urgent care, or unplanned readmission within 30 days of hospital discharge, consistent with the H2O trials. This was measured using the primary institution’s administrative data supplemented by a utilization database shared across regional hospitals.14 Readmissions were identified as “unplanned” using a previously validated algorithm,15 and treated as a dichotomous yes/no variable.
Our primary predictors were parental ACEs and resilience (see Appendix Tables). The ACE questionnaire addresses abuse, neglect, and household dysfunction in the first 18 years of life.1 It is composed of 10 questions, each with a yes/no response.1 We defined parents as low (ACE 0), moderate (ACE 1-3), or high (ACE ≥4) risk a priori because previous literature has described poor outcomes in adults with 4 or more ACEs.16
Given the sensitive nature of the questions, respondents independently completed the ACE questionnaire on paper instead of via the face-to-face survey. Respondents returned the completed questionnaire to the research assistant in a sealed envelope. All families received educational information on relevant hospital and community-based resources (eg, social work).
Parental resilience was measured using the Brief Resilience Scale (BRS). The BRS is 6 items, each on a 5-point Likert scale. Responses were averaged, providing a total score of 1-5; higher scores are representative of higher resilience.17 We treated the BRS score as a continuous variable. BRS has been used in clinical settings; it has demonstrated positive correlation with social support and negative correlation with fatigue.17 Parents answered BRS questions during the index pediatric hospitalization in a face-to-face interview.
Parent and Child Characteristics
Parent and child sociodemographic variables were also obtained during the face-to-face interview. Parental variables included age, gender, educational attainment, household income, employment status, and financial and social strain.11 Educational attainment was analyzed in 2 categories—high school or less vs more than high school—because most discharge instructions are written at a high school reading level.18 Parents reported their annual household income in the following categories: <$15,000; $15,000-$29,999; $30,000-$44,999; $45,000-$59,999; $60,000-$89,999; $90,000-$119,999; ≥$120,000. Employment was dichotomized as not employed/student vs any employment. Financial and social strain were assessed using a series of 9 previously described questions.19 These questions assessed, via self-report, a family’s ability to make ends meet, ability to pay rent/mortgage or utilities, need to move in with others because of financial reasons, and ability to borrow money if needed, as well as home ownership and parental marital status.15,19 Strain questions were all dichotomous (yes/no, single/not single). A composite variable was then constructed that categorized those reporting no strain items, 1 to 2 items, 3 to 4 items, and 5 or more items.20
Child variables included race, ethnicity, age, primary care access,21 payer, and H2O treatment arm. Race categories were white/Caucasian, black/African American, American Indian or Alaskan Native, Asian or Pacific Islander, and other; ethnicity categories were Hispanic/Latino, non-Hispanic/Latino, and unknown. Given relatively low numbers of children reported to be Hispanic/Latino, we combined race and ethnicity into a single variable, categorized as non-Hispanic/white, non-Hispanic/black, and multiracial/Hispanic/other. Primary care access was assessed using the access subscale to the Parent’s Perception of Primary Care questionnaire. This includes assessment of a family’s ability to travel to their doctor, to see their doctor for routine or sick care, and to get help or advice on evenings or weekends. Scores were categorized as always adequate, almost always adequate, or sometimes/never adequate.21 Payer was dichotomized to private or public/self-pay.
Statistical Analyses
We examined the distribution of outcomes, predictors, and covariates. We compared sociodemographic characteristics of those respondents and nonrespondents to the ACE screen using the chi-square test for categorical variables or the t test for continuous variables. We used logistic regression to assess for associations between the independent variables of interest and reutilization, adjusting for potential confounders. To build our adjusted, multivariable model, we decided a priori to include child race/ethnicity, primary care access, financial and social strain, and trial treatment arm. We treated the H2O I control group as the referent group. Other covariates considered for inclusion were caregiver education, household income, employment, and payer. These were included in multivariable models if bivariate associations were significant at the P < .1 level. We assessed an ACE-by-resilience interaction term because we hypothesized that those with more ACEs and lower resilience may have more reutilization outcomes than parents with fewer ACEs and higher resilience. We also evaluated interaction terms between trial arm assignment and predictors to assess effects that may be introduced by the randomization. Predictors in the final logistic regression model were significant at the P < .05 level. Logistic regression assumption of little or no multicollinearity among the independent variables was verified in the final models. All analyses were performed with Stata v16 (Stata Corp, College Station, Texas).
RESULTS
There were a total of 1,787 parent-child dyads enrolled in the H2O I and II during the study period; 1,320 parents (74%) completed the ACE questionnaire and were included the analysis. Included parents were primarily female and employed, as well as educated beyond high school (Table 1). Overall, 64% reported one or more ACEs (range 0 to 9); 45% reported 1to 3, and 19% reported 4 or more ACEs. The most commonly reported ACEs were divorce (n = 573, 43%), exposure to alcoholism (n = 306, 23%), and exposure to mental illness (n = 281, 21%; Figure 1). Parents had a mean BRS score of 3.97 (range 1.17-5.00), with the distribution shown in Figure 2.

Of the 1,320 included patients, the average length of stay was 2.5 days, and 82% of hospitalizations were caused by acute medical issues (eg, bronchiolitis). A total of 211 children experienced a reutilization event within 30 days of discharge. In bivariate analysis, children with parents with 4 or more ACEs had a 2.02-times (95% CI 1.35-3.02) higher odds of experiencing a reutilization event than did those with parents reporting no ACEs. Parents with higher resilience scores had children with a lower odds of reutilization (odds ratio [OR] 0.77 95% CI 0.63-0.95).

In addition to our a priori variables, parental education, employment, and insurance met our significance threshold for inclusion in the multivariable model. The ACE-by-resilience interaction term was not significant and not included in the model. Similarly, there was no significant interaction between ACE and resilience and H2O treatment arm; the interaction terms were not included in the final adjusted model, but treatment arm assignment was kept as a covariate. A total of 1,292 children, out of the 1,320 respondents, remained in the final multivariable model; the excluded 28 had incomplete covariate data but were not otherwise different. In this final adjusted model, children with parents reporting 4 or more ACEs had a 1.69-times (95% CI 1.11-2.60) greater odds of reutilization than did those with parents reporting no ACEs (Table 2). Resilience failed to reach statistical significance in the adjusted model (OR 0.86, 95% CI 0.70-1.07).

DISCUSSION
We found that high-risk parents (4 or more ACEs) had children with an increased odds of healthcare reutilization, suggesting intergenerational effects of ACEs. We did not find a similar effect relating to parental resilience. We also did not find an interaction between parental ACEs and resilience, suggesting that a parent’s reported degree of resilience does not modify the effect of ACEs on reutilization risk.

Parental adversity may be a risk factor for a child’s unanticipated reutilization. We previously demonstrated that parents with 4 or more ACEs have more coping difficulty than a parent with no ACEs after a child’s hospitalization.11 It is possible that parents with high adversity may have poorer coping mechanisms when dealing with a stressful situation, such as a child’s hospitalization. This may have resulted in inequitable outcomes (eg, increased reutilization) for their children. Other studies have confirmed such an intergenerational effect of adversity, linking a parent’s ACEs with poor developmental, behavioral, and health outcomes in their children.6,22,23 O’Malley et al showed an association of parental ACEs to current adversities,24 such as insurance or housing concerns, that affect the entirety of the household, including children. In short, it appears that parental ACEs may be a compelling predictor of current childhood adversity.
Resilience buffers the negative effects of ACEs; however, we did not find significant associations between resilience and reutilization or an interaction between ACEs and resilience. The factors that may contribute to reutilization are complex. In our previous work, parental resilience was associated with coping difficulty after discharge; but again, did not interact with parental ACEs.11 Here, we suggest that while resilience may buffer the negative effects of ACEs, that buffering may not affect the likelihood of reutilization. It is also possible that the BRS tool is of less relevance on how one handles the stress of a child’s hospitalization. While the BRS is one measure of resilience, there are many other relevant constructs to resilience, such as connection to social supports, that also may also contribute to risk of reutilization.25
Reducing the stress of a hospitalization itself and promoting a safe transition from hospital to home is critical to improving child health outcomes. Our data here, and in our previous work, demonstrate that a history of adversity and one’s current coping ability may drive a parent’s response to a child’s hospitalization and affect their capacity to care for that child after hospital discharge.11 Additional in-hospital supports like child life, behavioral health, or pastoral care could reduce the stress of the hospitalization while also building positive coping mechanisms.26-29 A meta-analysis demonstrated that such coping interventions can help alleviate the stress of a hospitalization.30 Hill et al demonstrated successful stress reduction in parents of hospitalized children using a “Coping Kit for Parents.”31 Further studies are warranted to understand which interventions are most effective for children and families and whether they could be more effectively deployed if the inpatient team knew more about parental ACEs.
Screening for parental ACEs could help to identify patients at highest risk for a poor transition to home. Therefore, screening for parental adversity in clinical settings, including inpatient settings, may be relevant and valuable.32 Additionally, by recognizing the high prevalence of ACEs in an inpatient setting, hospitals and healthcare organizations could be motivated to develop and enact trauma-informed approaches. A trauma-informed care approach recognizes the intersection of trauma with health and social problems. With this recognition, care teams can more sensitively address the trauma as they provide relevant services.33 Trauma-informed care is a secondary public health prevention approach that would help team members identify the prevalence and effects of trauma via screening, recognize the signs of a maladaptive response to stress, and respond by integrating awareness of trauma into practice management.28,34 Both the National Academy of Medicine and the Agency for Healthcare Research and Quality have called for such a trauma-informed approach in primary care.35 In response, many healthcare organizations have developed trauma-informed practices to better address the needs of the populations they serve. For example, provider training on this approach has led to improved rapport in patient-provider relationships.36
Although ACE awareness is a component of trauma-informed care, there are still limitations of the original ACE questionnaire developed by Felitti et al. The existing tool is not inclusive of all adversities a parent or child may face. Moreover, its focus is on past exposures and experiences and not current health-related social needs (eg, food insecurity) which have known linkages with a range of health outcomes and health disparities.37 Additionally, the original ACE questionnaire was created as a population level tool and not as a screening tool. If used as a screening tool, providers may view the questions as too sensitive to ask, and parents may have difficulty responding to and understanding the relevance to their child’s care. Therefore, we suggest that more evidence is required to understand how to best adapt ACE questions into a screening processes that may be implemented in a medical setting.
More evidence is also needed to determine when and where such screening may be most useful. A primary care provider would be best equipped to screen caregivers for ACEs given their established relationship with parents and patients. Given the potential relevance of such information for inpatient care provision, information could then flow from primary care to the inpatient team. However, because not all patients have established primary care providers and only 4% of pediatricians screen for ACEs,38 it is important for inpatient medical teams to understand their role in identifying and addressing ACEs during hospital stays. Development of a screening tool, with input from all stakeholders—including parents—that is valid and feasible for use in a pediatric inpatient setting would be an important step forward. This tool should be paired with training in how to discuss these topics in a trauma-informed, nonjudgmental, empathic manner. We see this as a way in which providers can more effectively elicit an accurate response while simultaneously educating parents on the relevance of such sensitive topics during an acute hospital stay. We also recommend that screening should always be paired with response capabilities that connect those who screen positive with resources that could help them to navigate the stress experienced during and after a child’s hospitalization. Furthermore, communication with primary care providers about parents that screen positive should be integrated into the transition process.
This work has several limitations. First, our study was a part of randomized controlled trials conducted in one academic setting, which thereby limits generalizability. For example, we limited our cohort to those who were English-speaking patients only. This may bias our results because respondents with limited English proficiency may have different risk profiles than their English-speaking peers. In addition, the administration of the both the ACE and resilience questionnaires occurred during an acutely stressful period, which may influence how a parent responds to these questions. Also, both of the surveys are self-reported by parents, which may be susceptible to memory and response biases. Relatedly, we had a high number of nonrespondents, particularly to the ACE questionnaire. Our results are therefore only relevant to those who chose to respond and cannot be applied to nonrespondents. Further work assessing why one does or does not respond to such sensitive questions is an important area for future inquiry. Lastly, our cohort had limited medical complexity; future studies may consider links between parental ACEs (and resilience) and morbidity experienced by children with medical complexity.
CONCLUSION
Parents history of adversity is linked to their children’s unanticipated healthcare reutilization after a hospital discharge. Screening for parental stressors during a hospitalization may be an important first step to connecting parents and children to evidence-based interventions capable of mitigating the stress of hospitalization and promoting better, more seamless transitions from hospital to home.
Acknowledgments
Group Members: The following H2O members are nonauthor contributors: JoAnne Bachus, BSN, RN; Monica Borell, BSN, RN; Lenisa V Chang, MA, PhD; Patricia Crawford, RN; Sarah Ferris, BA; Jennifer Gold, BSN, RN; Judy A Heilman, BSN, RN; Jane C Khoury, PhD; Pierce Kuhnell, MS; Karen Lawley, BSN, RN; Margo Moore, MS, BSN, RN; Lynne O’Donnell, BSN, RN; Sarah Riddle, MD; Susan N Sherman, DPA; Angela M Statile, MD, MEd; Karen P Sullivan, BSN, RN; Heather Tubbs-Cooley, PhD, RN; Susan Wade-Murphy, MSN, RN; and Christine M White, MD, MAT.
The authors also thank David Keller, MD, for his guidance on the study.
Disclosures
The authors have no financial relationships or conflicts of interest relevant to this article to disclose.
Funding Source
Supported by funds from the Academic Pediatric Young Investigator Award (Dr A Shah) and the Patient-Centered Outcomes Research Institute Award (IHS-1306-0081, to Dr K Auger, Dr S Shah, Dr H Sucharew, Dr J Simmons), the National Institutes of Health (1K23AI112916, to Dr AF Beck), and the Agency for Healthcare Research and Quality (1K12HS026393-01, to Dr A Shah, K08-HS024735- 01A1, to Dr K Auger). Dr J Haney received Summer Undergraduate Research Fellowship funding through the Summer Undergraduate Research Fellowship at Cincinnati Children’s Hospital Medical Center.
Disclaimer
All statements in this report, including findings and conclusions, are solely those of the authors and do not necessarily represent the views of the Patient-Centered Outcomes Research Institute, its Board of Governors, or the Methodology Committee.
1. Felitti VJ, Anda RF, Nordenberg D, et al. Relationship of childhood abuse and household dysfunction to many of the leading causes of death in adults. The Adverse Childhood Experiences (ACE) Study. Am J Prev Med. 1998;14(4):245-258. https://doi.org/10.1016/s0749-3797(98)00017-8.
2. Bethell CD, Newacheck P, Hawes E, Halfon N. Adverse childhood experiences: assessing the impact on health and school engagement and the mitigating role of resilience. Health Aff. 2014;33(12):2106-2115. https://doi.org/10.1377/hlthaff.2014.0914.
3. Masten AS. Ordinary Magic. Resilience processes in development. Am Psychol. 2001;56(3):227-238. https://doi.org/10.1037//0003-066x.56.3.227.
4. Garner AS, Shonkoff JP, Committee on Psychosocial Aspects of C, et al. Early childhood adversity, toxic stress, and the role of the pediatrician: translating developmental science into lifelong health. Pediatrics. 2012;129(1):e224-231. https://doi.org/10.1542/peds.2011-2662.
5. Randell KA, O’Malley D, Dowd MD. Association of parental adverse childhood experiences and current child adversity. JAMA Pediatrics. 2015;169(8):786-787. https://doi.org/10.1001/jamapediatrics.2015.0269.
6. Le-Scherban F, Wang X, Boyle-Steed KH, Pachter LM. Intergenerational associations of parent adverse childhood experiences and child health outcomes. Pediatrics. 2018;141(6):e20174274. https://doi.org/10.1542/peds.2017-4274.
7. Johnson SB, Riley AW, Granger DA, Riis J. The science of early life toxic stress for pediatric practice and advocacy. Pediatrics. 2013;131(2):319-327. https://doi.org/10.1542/peds.2012-0469.
8. Roth TL, Lubin FD, Funk AJ, Sweatt JD. Lasting epigenetic influence of early-life adversity on the BDNF gene. Biol Psychiatry. 2009;65(9):760-769. https://doi.org/10.1016/j.biopsych.2008.11.028.
9. Garner AS, Forkey H, Szilagyi M. Translating developmental science to address childhood adversity. Acad Pediatr. 2015;15(5):493-502. https://doi.org/10.1016/j.acap.2015.05.010.
10. Weiss M, Johnson NL, Malin S, Jerofke T, Lang C, Sherburne E. Readiness for discharge in parents of hospitalized children. J Pediatr Nurs. 2008;23(4):282-295. https://doi.org/10.1016/j.pedn.2007.10.005.
11. Shah AN, Beck AF, Sucharew HJ, et al. Parental adverse childhood experiences and resilience on coping after discharge. Pediatrics. 2018;141(4):e20172127. https://doi.org/10.1542/peds.2017-2127.
12. Auger KA, Simmons JM, Tubbs-Cooley HL, et al. Postdischarge nurse home visits and reuse: The Hospital to Home Outcomes (H2O) Trial. Pediatrics. 2018;142(1):e20173919. https://doi.org/10.1542/peds.2017-3919.
13. Auger KA, Shah SS, Tubbs-Cooley HL, et al. Effects of a 1-time nurse-led telephone call after pediatric discharge: the H2O II randomized clinical trial. JAMA Pediatr. 2018;172(9):e181482. https://doi.org/10.1001/jamapediatrics.2018.1482.
14. TheHealthCollaborative. Healthbridge analytics. http://healthcollab.org/hbanalytics/. Accessed August 11, 2017.
15. Auger K, Mueller E, Weinberg S, et al. A validated method for identifying unplanned pediatric readmission. J Pediatr. 2016;170:105-12.e122. https://doi.org10.1016/j.jpeds.2015.11.051.
16. Felitti VJ. Belastungen in der Kindheit und Gesundheit im Erwachsenenalter: die Verwandlung von Gold in Blei [The relationship of adverse childhood experiences to adult health: turning gold into lead]. Z Psychosom Med Psychother. 2002;48(4):359-369. https://doi.org/10.13109/zptm.2002.48.4.359.
17. Smith BW, Dalen J, Wiggins K, Tooley E, Christopher P, Bernard J. The brief resilience scale: assessing the ability to bounce back. Int J Behav Med. 2008;15(3):194-200. https://doi.org/10.1080/10705500802222972.
18. Baker DW, Parker RM, Williams MV, Clark WS. Health literacy and the risk of hospital admission. J Gen Intern Med. 1998;13(12):791-798. https://doi.org/10.1046/j.1525-1497.1998.00242.x.
19. Auger KA, Kahn RS, Simmons JM, et al. Using address information to identify hardships reported by families of children hospitalized with asthma. Acad Pediatr. 2017;17(1):79-87. https://doi.org/10.1016/j.acap.2016.07.003.
20. Auger KA, Kahn RS, Davis MM, Simmons JM. Pediatric asthma readmission: asthma knowledge is not enough? J Pediatr. 2015;166(1):101-108. https://doi.org/10.1016/j.jpeds.2014.07.046.
21. Seid M, Varni JW, Bermudez LO, et al. Parents’ perceptions of primary care: measuring parents’ experiences of pediatric primary care quality. Pediatrics. 2001;108(2):264-270. https://doi:10.1542/peds.108.2.264.
22. Schickedanz A, Halfon N, Sastry N, Chung PJ. Parents’ adverse childhood experiences and their children’s behavioral health problems. Pediatrics. 2018;142(2). https://doi.org/10.1542/peds.2018-0023.
23. Folger AT, Eismann EA, Stephenson NB, et al. Parental adverse childhood experiences and offspring development at 2 years of age. Pediatrics. 2018;141(4):e20172826. https://doi.org/10.1542/peds.2017-2826.
24. O’Malley DM, Randell KA, Dowd MD. Family adversity and resilience measures in pediatric acute care settings. Public Health Nurs. 2016;33(1):3-10. https://doi.org/10.1111/phn.12246.
25. Masten AS. Resilience in developing systems: the promise of integrated approaches. Eur J Dev Psychol. 2016;13(3):297-312. https://doi.org/10.1080/17405629.2016.1147344.
26. Burns-Nader S, Hernandez-Reif M. Facilitating play for hospitalized children through child life services. Child Health Care. 2016;45(1):1-21. https://doi.org/10.1080/02739615.2014.948161.
27. Feudtner C, Haney J, Dimmers MA. Spiritual care needs of hospitalized children and their families: a national survey of pastoral care providers’ perceptions. Pediatrics. 2003;111(1):e67-e72. https://doi.org/10.1542/peds.111.1.e67.
28. Kazak AE, Schneider S, Didonato S, Pai AL. Family psychosocial risk screening guided by the Pediatric Psychosocial Preventative Health Model (PPPHM) using the Psychosocial Assessment Tool (PAT). Acta Oncol. 2015;54(5):574-580. https://doi.org/10.3109/0284186X.2014.995774.
29. Kodish I. Behavioral health care for children who are medically hospitalized. Pediatr Ann. 2018;47(8):e323-e327. https://doi.org/10.3928/19382359-20180705-01.
30. Doupnik SK, Hill D, Palakshappa D, et al. Parent coping support interventions during acute pediatric hospitalizations: a meta-analysis. Pediatrics. 2017;140(3). https://doi.org/10.1542/peds.2016-4171.
31. Hill DL, Carroll KW, Snyder KJG, et al. Development and pilot testing of a coping kit for parents of hospitalized children. Acad Pediatr. 2019;19(4):454-463. https://doi.org/10.1016/j.acap.2018.11.001.
32. Bronner MB, Peek N, Knoester H, Bos AP, Last BF, Grootenhuis MA. Course and predictors of posttraumatic stress disorder in parents after pediatric intensive care treatment of their child. J Pediatr Psychol. 2010;35(9):966-974. https://doi.org/10.1093/jpepsy/jsq004.
33. Bowen EA, Murshid NS. Trauma-informed social policy: a conceptual framework for policy analysis and advocacy. Am J Public Health. 2016;106(2):223-229. https://doi.org/10.2105/AJPH.2015.302970.
34. Substance Abuse and Mental Health Services Administration. SAMHSA’s Concept of Trauma and Guidance for a Trauma-Informed Approach. Rockville, MD: SAMHSA; 2014.
35. Machtinger EL, Cuca YP, Khanna N, Rose CD, Kimberg LS. From treatment to healing: the promise of trauma-informed primary care. Womens Health Issues. 2015;25(3):193-197. https://doi.org/10.1016/j.whi.2015.03.008.
36. Green BL, Saunders PA, Power E, et al. Trauma-informed medical care: patient response to a primary care provider communication training. J Loss Trauma . 2016;21(2):147-159. https://doi.org/10.1080/15325024.2015.1084854.
37. McKay S, Parente V. Health Disparities in the Hospitalized Child. Hosp Pediatr. 2019;9(5):317-325. https://doi.org/10.1542/hpeds.2018-0223.
38. Kerker BD, Storfer-Isser A, Szilagyi M, et al. Do pediatricians ask about adverse childhood experiences in pediatric primary care? Acad Pediatr. 2016;16(2):154-160. https://doi.org/10.1
Adverse Childhood Experiences, or ACEs, include exposure to abuse, neglect, or household dysfunction (eg, having a parent who is mentally ill) as a child.1 Exposure to ACEs affects health into adulthood, with a dose-response relationship between ACEs and a range of comorbidities.1 Adults with 6 or more ACEs have a 20-year shorter life expectancy than do those with no ACEs.1 Still, ACEs are static; once experienced, that experience cannot be undone. However, resilience, or positive adaptation in the context of adversity, can be protective, buffering the negative effects of ACEs.2,3 Protective factors that promote resilience include social capital, such as positive relationships with caregivers and peers.3
With their clear link to health outcomes across the life-course, there is a movement for pediatricians to screen children for ACEs4 and to develop strategies that promote resilience in children, parents, and families. However, screening a child for adversity has challenges because younger children may not have experienced an adverse exposure, or they may be unable to voice their experiences. Studies have demonstrated that parental adversity, or ACEs, may be a marker for childhood adversity.5,6 Biological models also support this potential intergenerational effect of ACEs. Chronic exposure to stress, including ACEs, results in elevated cortisol via a dysregulated hypothalamic-pituitary-adrenal axis, which results in chronic inflammation.7 This “toxic stress” is prolonged, severe in intensity, and can lead to epigenetic changes that may be passed on to the next generation.8,9
Hospitalization of an ill child, and the transition to home after that hospitalization, is a stressful event for children and families.10 This stress may be relevant to parents that have a history of a high rate of ACEs or a current low degree of resilience. Our previous work demonstrated that, in the inpatient setting, parents with high ACEs (≥4) or low resilience have increased coping difficulty 14 days after their child’s hospital discharge.11 Our objective here was to evaluate whether a parent’s ACEs and/or resilience would also be associated with that child’s likelihood of reutilization. We hypothesized that more parental ACEs and/or lower parental resilience would be associated with revisits the emergency room, urgent care, or hospital readmissions.
METHODS
Participants and Study Design
We conducted a prospective cohort study of parents of hospitalized children recruited from the “Hospital-to-Home Outcomes” Studies (H2O I and H2O II).12,13 H2O I and II were prospective, single-center, randomized controlled trials designed to determine the effectiveness of either a nurse-led transitional home visit (H2O I) or telephone call (H2O II) on 30-day unplanned healthcare reutilization. The trials and this study were approved by the Cincinnati Children’s Institutional Review Board. All parents provided written informed consent.
Details of H2O I and II recruitment and design have been described previously.12,13 Briefly, children were eligible for inclusion in either study if they were admitted to our institution’s general Hospital Medicine or the Hospital Medicine Complex Care Services; for H2O I, children hospitalized on the Neurology and Neurosurgery services were also eligible.12,13 Patients were excluded if they were discharged to a residential facility, if they lived outside the home healthcare nurse service area, if they were eligible for skilled home healthcare services (eg, intravenous antibiotics), or if the participating caregiver was non-English speaking.12,13 In H2O I, families were randomized either to receive a single nurse home visit within 96 hours of discharge or standard of care. In H2O II, families enrolled were randomized to receive a telephone call by a nurse within 96 hours of discharge or standard of care. As we have previously published, randomization in both trials successfully balanced the intervention and control arms with respect to key demographic characteristics.12,13 For the analyses presented here, we focused on a subset of caregivers 18 years and older whose children were enrolled in either H2O I or II between August 2015 and October 2016. In both H2O trials, face-to-face and paper-based questionnaires were completed by parents during the index hospitalization.
Outcome and Predictors
Our primary outcome was unanticipated healthcare reutilization defined as return to the emergency room, urgent care, or unplanned readmission within 30 days of hospital discharge, consistent with the H2O trials. This was measured using the primary institution’s administrative data supplemented by a utilization database shared across regional hospitals.14 Readmissions were identified as “unplanned” using a previously validated algorithm,15 and treated as a dichotomous yes/no variable.
Our primary predictors were parental ACEs and resilience (see Appendix Tables). The ACE questionnaire addresses abuse, neglect, and household dysfunction in the first 18 years of life.1 It is composed of 10 questions, each with a yes/no response.1 We defined parents as low (ACE 0), moderate (ACE 1-3), or high (ACE ≥4) risk a priori because previous literature has described poor outcomes in adults with 4 or more ACEs.16
Given the sensitive nature of the questions, respondents independently completed the ACE questionnaire on paper instead of via the face-to-face survey. Respondents returned the completed questionnaire to the research assistant in a sealed envelope. All families received educational information on relevant hospital and community-based resources (eg, social work).
Parental resilience was measured using the Brief Resilience Scale (BRS). The BRS is 6 items, each on a 5-point Likert scale. Responses were averaged, providing a total score of 1-5; higher scores are representative of higher resilience.17 We treated the BRS score as a continuous variable. BRS has been used in clinical settings; it has demonstrated positive correlation with social support and negative correlation with fatigue.17 Parents answered BRS questions during the index pediatric hospitalization in a face-to-face interview.
Parent and Child Characteristics
Parent and child sociodemographic variables were also obtained during the face-to-face interview. Parental variables included age, gender, educational attainment, household income, employment status, and financial and social strain.11 Educational attainment was analyzed in 2 categories—high school or less vs more than high school—because most discharge instructions are written at a high school reading level.18 Parents reported their annual household income in the following categories: <$15,000; $15,000-$29,999; $30,000-$44,999; $45,000-$59,999; $60,000-$89,999; $90,000-$119,999; ≥$120,000. Employment was dichotomized as not employed/student vs any employment. Financial and social strain were assessed using a series of 9 previously described questions.19 These questions assessed, via self-report, a family’s ability to make ends meet, ability to pay rent/mortgage or utilities, need to move in with others because of financial reasons, and ability to borrow money if needed, as well as home ownership and parental marital status.15,19 Strain questions were all dichotomous (yes/no, single/not single). A composite variable was then constructed that categorized those reporting no strain items, 1 to 2 items, 3 to 4 items, and 5 or more items.20
Child variables included race, ethnicity, age, primary care access,21 payer, and H2O treatment arm. Race categories were white/Caucasian, black/African American, American Indian or Alaskan Native, Asian or Pacific Islander, and other; ethnicity categories were Hispanic/Latino, non-Hispanic/Latino, and unknown. Given relatively low numbers of children reported to be Hispanic/Latino, we combined race and ethnicity into a single variable, categorized as non-Hispanic/white, non-Hispanic/black, and multiracial/Hispanic/other. Primary care access was assessed using the access subscale to the Parent’s Perception of Primary Care questionnaire. This includes assessment of a family’s ability to travel to their doctor, to see their doctor for routine or sick care, and to get help or advice on evenings or weekends. Scores were categorized as always adequate, almost always adequate, or sometimes/never adequate.21 Payer was dichotomized to private or public/self-pay.
Statistical Analyses
We examined the distribution of outcomes, predictors, and covariates. We compared sociodemographic characteristics of those respondents and nonrespondents to the ACE screen using the chi-square test for categorical variables or the t test for continuous variables. We used logistic regression to assess for associations between the independent variables of interest and reutilization, adjusting for potential confounders. To build our adjusted, multivariable model, we decided a priori to include child race/ethnicity, primary care access, financial and social strain, and trial treatment arm. We treated the H2O I control group as the referent group. Other covariates considered for inclusion were caregiver education, household income, employment, and payer. These were included in multivariable models if bivariate associations were significant at the P < .1 level. We assessed an ACE-by-resilience interaction term because we hypothesized that those with more ACEs and lower resilience may have more reutilization outcomes than parents with fewer ACEs and higher resilience. We also evaluated interaction terms between trial arm assignment and predictors to assess effects that may be introduced by the randomization. Predictors in the final logistic regression model were significant at the P < .05 level. Logistic regression assumption of little or no multicollinearity among the independent variables was verified in the final models. All analyses were performed with Stata v16 (Stata Corp, College Station, Texas).
RESULTS
There were a total of 1,787 parent-child dyads enrolled in the H2O I and II during the study period; 1,320 parents (74%) completed the ACE questionnaire and were included the analysis. Included parents were primarily female and employed, as well as educated beyond high school (Table 1). Overall, 64% reported one or more ACEs (range 0 to 9); 45% reported 1to 3, and 19% reported 4 or more ACEs. The most commonly reported ACEs were divorce (n = 573, 43%), exposure to alcoholism (n = 306, 23%), and exposure to mental illness (n = 281, 21%; Figure 1). Parents had a mean BRS score of 3.97 (range 1.17-5.00), with the distribution shown in Figure 2.
Of the 1,320 included patients, the average length of stay was 2.5 days, and 82% of hospitalizations were caused by acute medical issues (eg, bronchiolitis). A total of 211 children experienced a reutilization event within 30 days of discharge. In bivariate analysis, children with parents with 4 or more ACEs had a 2.02-times (95% CI 1.35-3.02) higher odds of experiencing a reutilization event than did those with parents reporting no ACEs. Parents with higher resilience scores had children with a lower odds of reutilization (odds ratio [OR] 0.77 95% CI 0.63-0.95).
In addition to our a priori variables, parental education, employment, and insurance met our significance threshold for inclusion in the multivariable model. The ACE-by-resilience interaction term was not significant and not included in the model. Similarly, there was no significant interaction between ACE and resilience and H2O treatment arm; the interaction terms were not included in the final adjusted model, but treatment arm assignment was kept as a covariate. A total of 1,292 children, out of the 1,320 respondents, remained in the final multivariable model; the excluded 28 had incomplete covariate data but were not otherwise different. In this final adjusted model, children with parents reporting 4 or more ACEs had a 1.69-times (95% CI 1.11-2.60) greater odds of reutilization than did those with parents reporting no ACEs (Table 2). Resilience failed to reach statistical significance in the adjusted model (OR 0.86, 95% CI 0.70-1.07).
DISCUSSION
We found that high-risk parents (4 or more ACEs) had children with an increased odds of healthcare reutilization, suggesting intergenerational effects of ACEs. We did not find a similar effect relating to parental resilience. We also did not find an interaction between parental ACEs and resilience, suggesting that a parent’s reported degree of resilience does not modify the effect of ACEs on reutilization risk.
Parental adversity may be a risk factor for a child’s unanticipated reutilization. We previously demonstrated that parents with 4 or more ACEs have more coping difficulty than a parent with no ACEs after a child’s hospitalization.11 It is possible that parents with high adversity may have poorer coping mechanisms when dealing with a stressful situation, such as a child’s hospitalization. This may have resulted in inequitable outcomes (eg, increased reutilization) for their children. Other studies have confirmed such an intergenerational effect of adversity, linking a parent’s ACEs with poor developmental, behavioral, and health outcomes in their children.6,22,23 O’Malley et al showed an association of parental ACEs to current adversities,24 such as insurance or housing concerns, that affect the entirety of the household, including children. In short, it appears that parental ACEs may be a compelling predictor of current childhood adversity.
Resilience buffers the negative effects of ACEs; however, we did not find significant associations between resilience and reutilization or an interaction between ACEs and resilience. The factors that may contribute to reutilization are complex. In our previous work, parental resilience was associated with coping difficulty after discharge; but again, did not interact with parental ACEs.11 Here, we suggest that while resilience may buffer the negative effects of ACEs, that buffering may not affect the likelihood of reutilization. It is also possible that the BRS tool is of less relevance on how one handles the stress of a child’s hospitalization. While the BRS is one measure of resilience, there are many other relevant constructs to resilience, such as connection to social supports, that also may also contribute to risk of reutilization.25
Reducing the stress of a hospitalization itself and promoting a safe transition from hospital to home is critical to improving child health outcomes. Our data here, and in our previous work, demonstrate that a history of adversity and one’s current coping ability may drive a parent’s response to a child’s hospitalization and affect their capacity to care for that child after hospital discharge.11 Additional in-hospital supports like child life, behavioral health, or pastoral care could reduce the stress of the hospitalization while also building positive coping mechanisms.26-29 A meta-analysis demonstrated that such coping interventions can help alleviate the stress of a hospitalization.30 Hill et al demonstrated successful stress reduction in parents of hospitalized children using a “Coping Kit for Parents.”31 Further studies are warranted to understand which interventions are most effective for children and families and whether they could be more effectively deployed if the inpatient team knew more about parental ACEs.
Screening for parental ACEs could help to identify patients at highest risk for a poor transition to home. Therefore, screening for parental adversity in clinical settings, including inpatient settings, may be relevant and valuable.32 Additionally, by recognizing the high prevalence of ACEs in an inpatient setting, hospitals and healthcare organizations could be motivated to develop and enact trauma-informed approaches. A trauma-informed care approach recognizes the intersection of trauma with health and social problems. With this recognition, care teams can more sensitively address the trauma as they provide relevant services.33 Trauma-informed care is a secondary public health prevention approach that would help team members identify the prevalence and effects of trauma via screening, recognize the signs of a maladaptive response to stress, and respond by integrating awareness of trauma into practice management.28,34 Both the National Academy of Medicine and the Agency for Healthcare Research and Quality have called for such a trauma-informed approach in primary care.35 In response, many healthcare organizations have developed trauma-informed practices to better address the needs of the populations they serve. For example, provider training on this approach has led to improved rapport in patient-provider relationships.36
Although ACE awareness is a component of trauma-informed care, there are still limitations of the original ACE questionnaire developed by Felitti et al. The existing tool is not inclusive of all adversities a parent or child may face. Moreover, its focus is on past exposures and experiences and not current health-related social needs (eg, food insecurity) which have known linkages with a range of health outcomes and health disparities.37 Additionally, the original ACE questionnaire was created as a population level tool and not as a screening tool. If used as a screening tool, providers may view the questions as too sensitive to ask, and parents may have difficulty responding to and understanding the relevance to their child’s care. Therefore, we suggest that more evidence is required to understand how to best adapt ACE questions into a screening processes that may be implemented in a medical setting.
More evidence is also needed to determine when and where such screening may be most useful. A primary care provider would be best equipped to screen caregivers for ACEs given their established relationship with parents and patients. Given the potential relevance of such information for inpatient care provision, information could then flow from primary care to the inpatient team. However, because not all patients have established primary care providers and only 4% of pediatricians screen for ACEs,38 it is important for inpatient medical teams to understand their role in identifying and addressing ACEs during hospital stays. Development of a screening tool, with input from all stakeholders—including parents—that is valid and feasible for use in a pediatric inpatient setting would be an important step forward. This tool should be paired with training in how to discuss these topics in a trauma-informed, nonjudgmental, empathic manner. We see this as a way in which providers can more effectively elicit an accurate response while simultaneously educating parents on the relevance of such sensitive topics during an acute hospital stay. We also recommend that screening should always be paired with response capabilities that connect those who screen positive with resources that could help them to navigate the stress experienced during and after a child’s hospitalization. Furthermore, communication with primary care providers about parents that screen positive should be integrated into the transition process.
This work has several limitations. First, our study was a part of randomized controlled trials conducted in one academic setting, which thereby limits generalizability. For example, we limited our cohort to those who were English-speaking patients only. This may bias our results because respondents with limited English proficiency may have different risk profiles than their English-speaking peers. In addition, the administration of the both the ACE and resilience questionnaires occurred during an acutely stressful period, which may influence how a parent responds to these questions. Also, both of the surveys are self-reported by parents, which may be susceptible to memory and response biases. Relatedly, we had a high number of nonrespondents, particularly to the ACE questionnaire. Our results are therefore only relevant to those who chose to respond and cannot be applied to nonrespondents. Further work assessing why one does or does not respond to such sensitive questions is an important area for future inquiry. Lastly, our cohort had limited medical complexity; future studies may consider links between parental ACEs (and resilience) and morbidity experienced by children with medical complexity.
CONCLUSION
Parents history of adversity is linked to their children’s unanticipated healthcare reutilization after a hospital discharge. Screening for parental stressors during a hospitalization may be an important first step to connecting parents and children to evidence-based interventions capable of mitigating the stress of hospitalization and promoting better, more seamless transitions from hospital to home.
Acknowledgments
Group Members: The following H2O members are nonauthor contributors: JoAnne Bachus, BSN, RN; Monica Borell, BSN, RN; Lenisa V Chang, MA, PhD; Patricia Crawford, RN; Sarah Ferris, BA; Jennifer Gold, BSN, RN; Judy A Heilman, BSN, RN; Jane C Khoury, PhD; Pierce Kuhnell, MS; Karen Lawley, BSN, RN; Margo Moore, MS, BSN, RN; Lynne O’Donnell, BSN, RN; Sarah Riddle, MD; Susan N Sherman, DPA; Angela M Statile, MD, MEd; Karen P Sullivan, BSN, RN; Heather Tubbs-Cooley, PhD, RN; Susan Wade-Murphy, MSN, RN; and Christine M White, MD, MAT.
The authors also thank David Keller, MD, for his guidance on the study.
Disclosures
The authors have no financial relationships or conflicts of interest relevant to this article to disclose.
Funding Source
Supported by funds from the Academic Pediatric Young Investigator Award (Dr A Shah) and the Patient-Centered Outcomes Research Institute Award (IHS-1306-0081, to Dr K Auger, Dr S Shah, Dr H Sucharew, Dr J Simmons), the National Institutes of Health (1K23AI112916, to Dr AF Beck), and the Agency for Healthcare Research and Quality (1K12HS026393-01, to Dr A Shah, K08-HS024735- 01A1, to Dr K Auger). Dr J Haney received Summer Undergraduate Research Fellowship funding through the Summer Undergraduate Research Fellowship at Cincinnati Children’s Hospital Medical Center.
Disclaimer
All statements in this report, including findings and conclusions, are solely those of the authors and do not necessarily represent the views of the Patient-Centered Outcomes Research Institute, its Board of Governors, or the Methodology Committee.
1. Felitti VJ, Anda RF, Nordenberg D, et al. Relationship of childhood abuse and household dysfunction to many of the leading causes of death in adults. The Adverse Childhood Experiences (ACE) Study. Am J Prev Med. 1998;14(4):245-258. https://doi.org/10.1016/s0749-3797(98)00017-8.
2. Bethell CD, Newacheck P, Hawes E, Halfon N. Adverse childhood experiences: assessing the impact on health and school engagement and the mitigating role of resilience. Health Aff. 2014;33(12):2106-2115. https://doi.org/10.1377/hlthaff.2014.0914.
3. Masten AS. Ordinary Magic. Resilience processes in development. Am Psychol. 2001;56(3):227-238. https://doi.org/10.1037//0003-066x.56.3.227.
4. Garner AS, Shonkoff JP, Committee on Psychosocial Aspects of C, et al. Early childhood adversity, toxic stress, and the role of the pediatrician: translating developmental science into lifelong health. Pediatrics. 2012;129(1):e224-231. https://doi.org/10.1542/peds.2011-2662.
5. Randell KA, O’Malley D, Dowd MD. Association of parental adverse childhood experiences and current child adversity. JAMA Pediatrics. 2015;169(8):786-787. https://doi.org/10.1001/jamapediatrics.2015.0269.
6. Le-Scherban F, Wang X, Boyle-Steed KH, Pachter LM. Intergenerational associations of parent adverse childhood experiences and child health outcomes. Pediatrics. 2018;141(6):e20174274. https://doi.org/10.1542/peds.2017-4274.
7. Johnson SB, Riley AW, Granger DA, Riis J. The science of early life toxic stress for pediatric practice and advocacy. Pediatrics. 2013;131(2):319-327. https://doi.org/10.1542/peds.2012-0469.
8. Roth TL, Lubin FD, Funk AJ, Sweatt JD. Lasting epigenetic influence of early-life adversity on the BDNF gene. Biol Psychiatry. 2009;65(9):760-769. https://doi.org/10.1016/j.biopsych.2008.11.028.
9. Garner AS, Forkey H, Szilagyi M. Translating developmental science to address childhood adversity. Acad Pediatr. 2015;15(5):493-502. https://doi.org/10.1016/j.acap.2015.05.010.
10. Weiss M, Johnson NL, Malin S, Jerofke T, Lang C, Sherburne E. Readiness for discharge in parents of hospitalized children. J Pediatr Nurs. 2008;23(4):282-295. https://doi.org/10.1016/j.pedn.2007.10.005.
11. Shah AN, Beck AF, Sucharew HJ, et al. Parental adverse childhood experiences and resilience on coping after discharge. Pediatrics. 2018;141(4):e20172127. https://doi.org/10.1542/peds.2017-2127.
12. Auger KA, Simmons JM, Tubbs-Cooley HL, et al. Postdischarge nurse home visits and reuse: The Hospital to Home Outcomes (H2O) Trial. Pediatrics. 2018;142(1):e20173919. https://doi.org/10.1542/peds.2017-3919.
13. Auger KA, Shah SS, Tubbs-Cooley HL, et al. Effects of a 1-time nurse-led telephone call after pediatric discharge: the H2O II randomized clinical trial. JAMA Pediatr. 2018;172(9):e181482. https://doi.org/10.1001/jamapediatrics.2018.1482.
14. TheHealthCollaborative. Healthbridge analytics. http://healthcollab.org/hbanalytics/. Accessed August 11, 2017.
15. Auger K, Mueller E, Weinberg S, et al. A validated method for identifying unplanned pediatric readmission. J Pediatr. 2016;170:105-12.e122. https://doi.org10.1016/j.jpeds.2015.11.051.
16. Felitti VJ. Belastungen in der Kindheit und Gesundheit im Erwachsenenalter: die Verwandlung von Gold in Blei [The relationship of adverse childhood experiences to adult health: turning gold into lead]. Z Psychosom Med Psychother. 2002;48(4):359-369. https://doi.org/10.13109/zptm.2002.48.4.359.
17. Smith BW, Dalen J, Wiggins K, Tooley E, Christopher P, Bernard J. The brief resilience scale: assessing the ability to bounce back. Int J Behav Med. 2008;15(3):194-200. https://doi.org/10.1080/10705500802222972.
18. Baker DW, Parker RM, Williams MV, Clark WS. Health literacy and the risk of hospital admission. J Gen Intern Med. 1998;13(12):791-798. https://doi.org/10.1046/j.1525-1497.1998.00242.x.
19. Auger KA, Kahn RS, Simmons JM, et al. Using address information to identify hardships reported by families of children hospitalized with asthma. Acad Pediatr. 2017;17(1):79-87. https://doi.org/10.1016/j.acap.2016.07.003.
20. Auger KA, Kahn RS, Davis MM, Simmons JM. Pediatric asthma readmission: asthma knowledge is not enough? J Pediatr. 2015;166(1):101-108. https://doi.org/10.1016/j.jpeds.2014.07.046.
21. Seid M, Varni JW, Bermudez LO, et al. Parents’ perceptions of primary care: measuring parents’ experiences of pediatric primary care quality. Pediatrics. 2001;108(2):264-270. https://doi:10.1542/peds.108.2.264.
22. Schickedanz A, Halfon N, Sastry N, Chung PJ. Parents’ adverse childhood experiences and their children’s behavioral health problems. Pediatrics. 2018;142(2). https://doi.org/10.1542/peds.2018-0023.
23. Folger AT, Eismann EA, Stephenson NB, et al. Parental adverse childhood experiences and offspring development at 2 years of age. Pediatrics. 2018;141(4):e20172826. https://doi.org/10.1542/peds.2017-2826.
24. O’Malley DM, Randell KA, Dowd MD. Family adversity and resilience measures in pediatric acute care settings. Public Health Nurs. 2016;33(1):3-10. https://doi.org/10.1111/phn.12246.
25. Masten AS. Resilience in developing systems: the promise of integrated approaches. Eur J Dev Psychol. 2016;13(3):297-312. https://doi.org/10.1080/17405629.2016.1147344.
26. Burns-Nader S, Hernandez-Reif M. Facilitating play for hospitalized children through child life services. Child Health Care. 2016;45(1):1-21. https://doi.org/10.1080/02739615.2014.948161.
27. Feudtner C, Haney J, Dimmers MA. Spiritual care needs of hospitalized children and their families: a national survey of pastoral care providers’ perceptions. Pediatrics. 2003;111(1):e67-e72. https://doi.org/10.1542/peds.111.1.e67.
28. Kazak AE, Schneider S, Didonato S, Pai AL. Family psychosocial risk screening guided by the Pediatric Psychosocial Preventative Health Model (PPPHM) using the Psychosocial Assessment Tool (PAT). Acta Oncol. 2015;54(5):574-580. https://doi.org/10.3109/0284186X.2014.995774.
29. Kodish I. Behavioral health care for children who are medically hospitalized. Pediatr Ann. 2018;47(8):e323-e327. https://doi.org/10.3928/19382359-20180705-01.
30. Doupnik SK, Hill D, Palakshappa D, et al. Parent coping support interventions during acute pediatric hospitalizations: a meta-analysis. Pediatrics. 2017;140(3). https://doi.org/10.1542/peds.2016-4171.
31. Hill DL, Carroll KW, Snyder KJG, et al. Development and pilot testing of a coping kit for parents of hospitalized children. Acad Pediatr. 2019;19(4):454-463. https://doi.org/10.1016/j.acap.2018.11.001.
32. Bronner MB, Peek N, Knoester H, Bos AP, Last BF, Grootenhuis MA. Course and predictors of posttraumatic stress disorder in parents after pediatric intensive care treatment of their child. J Pediatr Psychol. 2010;35(9):966-974. https://doi.org/10.1093/jpepsy/jsq004.
33. Bowen EA, Murshid NS. Trauma-informed social policy: a conceptual framework for policy analysis and advocacy. Am J Public Health. 2016;106(2):223-229. https://doi.org/10.2105/AJPH.2015.302970.
34. Substance Abuse and Mental Health Services Administration. SAMHSA’s Concept of Trauma and Guidance for a Trauma-Informed Approach. Rockville, MD: SAMHSA; 2014.
35. Machtinger EL, Cuca YP, Khanna N, Rose CD, Kimberg LS. From treatment to healing: the promise of trauma-informed primary care. Womens Health Issues. 2015;25(3):193-197. https://doi.org/10.1016/j.whi.2015.03.008.
36. Green BL, Saunders PA, Power E, et al. Trauma-informed medical care: patient response to a primary care provider communication training. J Loss Trauma . 2016;21(2):147-159. https://doi.org/10.1080/15325024.2015.1084854.
37. McKay S, Parente V. Health Disparities in the Hospitalized Child. Hosp Pediatr. 2019;9(5):317-325. https://doi.org/10.1542/hpeds.2018-0223.
38. Kerker BD, Storfer-Isser A, Szilagyi M, et al. Do pediatricians ask about adverse childhood experiences in pediatric primary care? Acad Pediatr. 2016;16(2):154-160. https://doi.org/10.1
© 2020 Society of Hospital Medicine
A Qualitative Study of Increased Pediatric Reutilization After a Postdischarge Home Nurse Visit
Readmission rates are used as metrics for care quality and reimbursement, with penalties applied to hospitals with higher than expected rates1 and up to 30% of pediatric readmissions deemed potentially preventable.2 There is a paucity of information on how to prevent pediatric readmissions,3 yet pediatric hospitals are tasked with implementing interventions for readmission reduction.
The Hospital to Home Outcomes (H2O) trial was a 2-arm, randomized controlled trial in which patients discharged from hospital medicine and neuroscience services at a single institution were randomized to receive a single home visit from a registered nurse (RN) within 96 hours of discharge.4 RNs completed a structured nurse visit designed specifically for the trial. Lists of “red flags” or warning signs associated with common diagnoses were provided to assist RNs in standardizing education about when to seek additional care. The hypothesis was that the postdischarge visits would result in lower reutilization rates (unplanned readmissions, emergency department [ED] visits, and urgent care visits).5
Unexpectedly, children randomized to receive the postdischarge nurse visit had higher rates of 30-day unplanned healthcare reutilization, with children randomly assigned to the intervention demonstrating higher odds of 30-day healthcare use (OR 1.33; 95% CI 1.003-1.76).4 We sought to understand perspectives on these unanticipated findings by obtaining input from relevant stakeholders. There were 2 goals for the qualitative analysis: first, to understand possible explanations of the increased reutilization finding; second, to elicit suggestions for improving the nurse visit intervention.
METHODS
We selected an in-depth qualitative approach, using interviews and focus groups to explore underlying explanations for the increase in 30-day unplanned healthcare reutilization among those randomized to receive the postdischarge nurse visit during the H2O trial.4 Input was sought from 4 stakeholder groups—parents, primary care physicians (PCPs), hospital medicine physicians, and home care RNs—in an effort to triangulate data sources and elicit rich and diverse opinions. Approval was obtained from the Institutional Review Board prior to conducting the study.
Recruitment
Parents
Because we conducted interviews approximately 1 year after the trial’s conclusion, we purposefully selected families who were enrolled in the latter portion of the H2O trial in order to enhance recall. Beginning with the last families in the study, we sequentially contacted families in reverse order. We contacted 10 families in each of 4 categories (intervention/reutilization, intervention/no reutilization, control/reutilization, control/no reutilization). A total of 3 attempts were made by telephone to contact each family. Participants received a grocery store gift card for participating in the study.
Primary Care Physicians
We conducted focus groups with a purposive sample of physicians recruited from 2 community practices and 1 hospital-owned practice.
Hospital Medicine Physicians
We conducted focus groups with a purposive sample of physicians from our Division of Hospital Medicine. There was a varying level of knowledge of the original trial; however, none of the participants were collaborators in the trial.
Home Care RNs
We conducted focus groups with a subset of RNs who were involved with trial visits. All RNs were members of the pediatric home care division associated with the hospital with specific training in caring for patients at home.
Data Collection
The study team designed question guides for each stakeholder group (Appendix 1). While questions were tailored for specific stakeholders, all guides included the following topics: benefits and challenges of nurse visits, suggestions for improving the intervention in future trials, and reactions to the trial results (once presented to participants). Only the results of the intention-to-treat (ITT) analysis were shared with stakeholders because ITT is considered the gold standard for trial analysis and allows easy understanding of the results.
A single investigator (A.L.) conducted parental interviews by telephone. Focus groups for PCPs, hospital medicine physicians, and RN groups were held at practice locations in private conference rooms and were conducted by trained moderators (S.N.S., A.L., and H.T.C.). Moderators probed responses to the open-ended questions to delve deeply into issues. The question guides were modified in an iterative fashion to include new concepts raised during interviews or focus groups. All interviews and focus groups were recorded and transcribed verbatim with all identifiable information redacted.
Data Analysis
During multiple cycles of inductive thematic analysis,6 we examined, discussed, interpreted, and organized responses to the open-ended questions,6,7 analyzing each stakeholder group separately. First, transcripts were shared with and reviewed by the entire multidisciplinary team (12 members) which included hospital medicine physicians, PCPs, home care nursing leaders, a nurse scientist, a parent representative, research coordinators, and a qualitative research methodologist. Second, team members convened to discuss overall concepts and ideas and created the preliminary coding frameworks. Third, a smaller subgroup (research coordinator [A.L]., hospital medicine physician [S.R.], parent representative [M.M.], and qualitative research methodologist [S.N.S.]), refined the unique coding framework for each stakeholder group and then independently applied codes to participant comments. This subgroup met regularly to reach consensus about the assigned codes and to further refine the codebooks. The codes were organized into major and minor themes based on recurring patterns in the data and the salience or emphasis given by participants. The subgroup’s work was reviewed and discussed on an ongoing basis by the entire multidisciplinary team. Triangulation of the data was achieved in multiple ways. The preliminary results were shared in several forums, and feedback was solicited and incorporated. Two of 4 members of the subgroup analytic team were not part of the trial planning or data collection, providing a potentially broader perspective. All coding decisions were maintained in an electronic database, and an audit trail was created to document codebook revisions.
RESULTS
A total of 33 parents participated in the interviews (intervention/readmit [8], intervention/no readmit [8], control/readmit [8], and control/no readmit [9]). Although we selected families from all 4 categories, we were not able to explore qualitative differences between these groups because of the relatively low numbers of participants. Parent data was very limited as interviews were brief and “control” parents had not received the intervention. Three focus groups were held with PCPs (7 participants in total), 2 focus groups were held with hospital medicine physicians (12 participants), and 2 focus groups were held with RNs (10 participants).
Goal 1: Explanation of Reutilization Rates
During interviews and focus groups, the results of the H2O trial were discussed, and stakeholders were asked to comment on potential explanations of the findings. 4 major themes and 5 minor themes emerged from analysis of the transcripts (summarized in Table 1).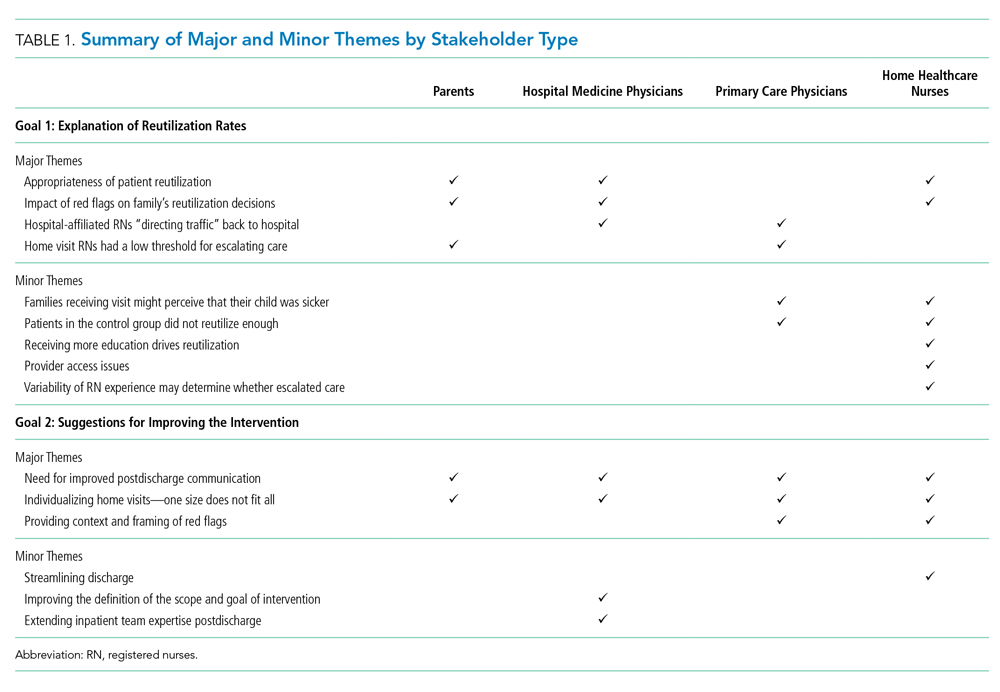
Theme 1: Appropriateness of Patient Reutilization
Hospital medicine physicians and home care RNs questioned whether the reutilization events were clinically indicated. RNs wondered whether children who reutilized the ED were also readmitted to the hospital; many perceived that if the child was ill enough to be readmitted, then the ED revisit was warranted (Table 2). Parents commented on parental decision-making and changes in clinical status of the child leading to reutilization (Table 2).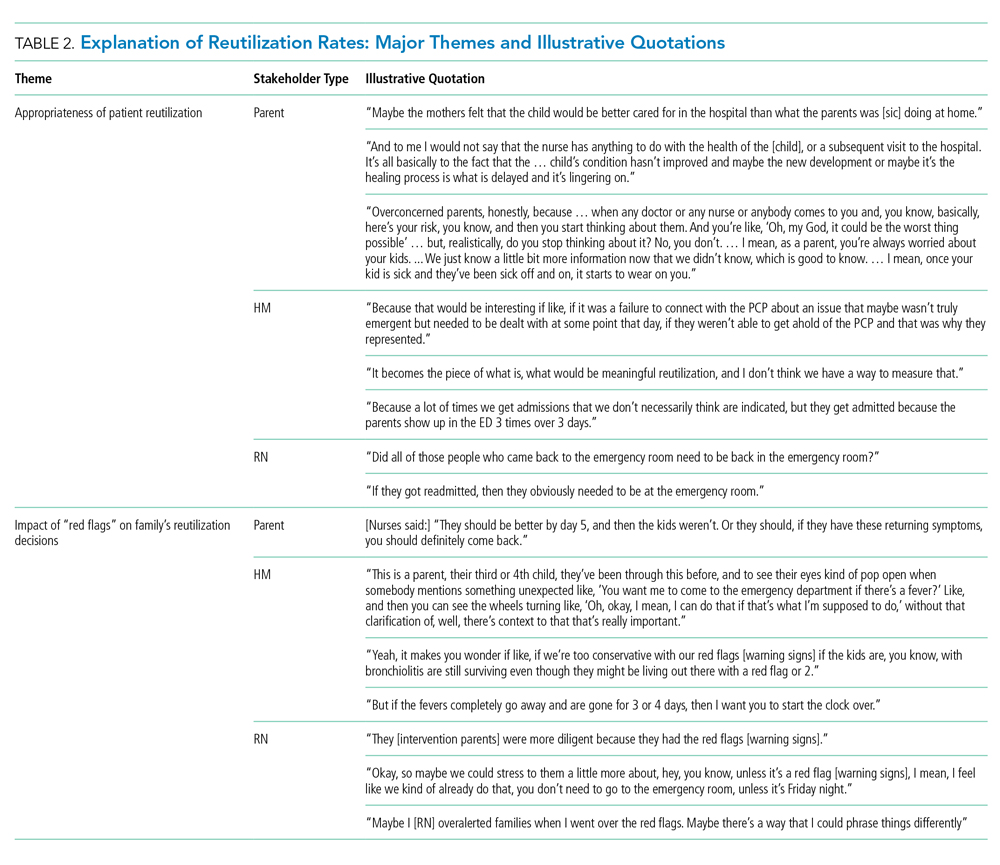
Theme 2: Impact of Red Flags/Warning Sign Instructions on Family’s Reutilization Decisions
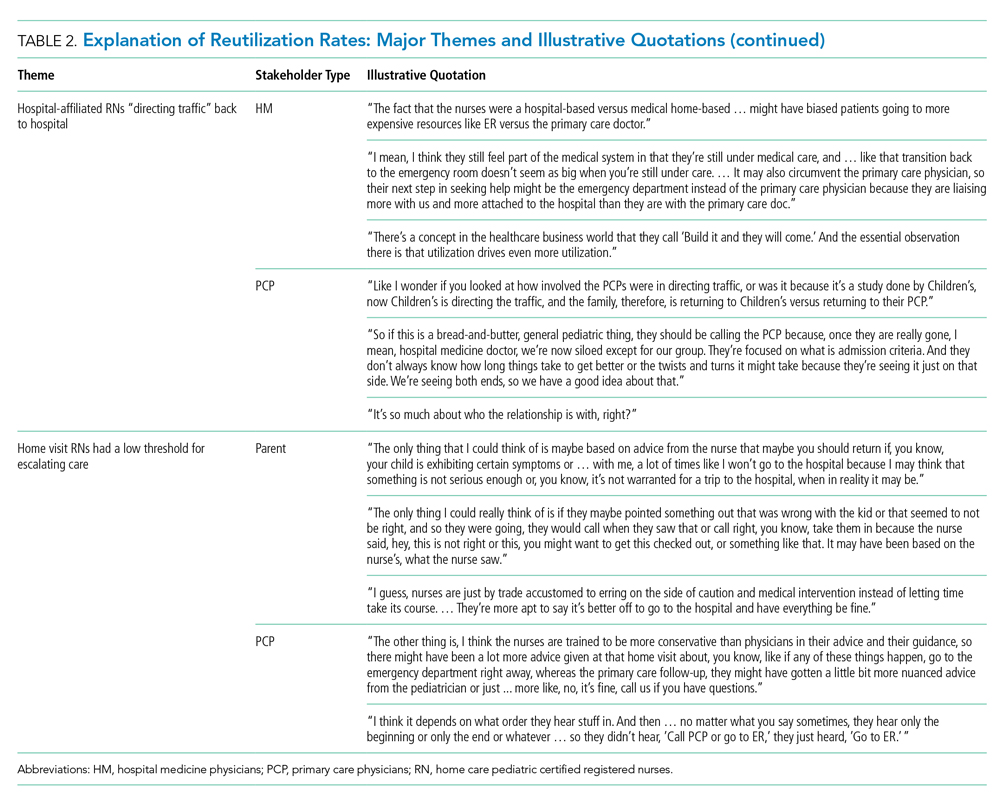
Theme 3: Hospital-Affiliated RNs “Directing Traffic” Back to Hospital
Both physician groups were concerned that, because the study was conducted by hospital-employed nurses, families might have been more likely to reaccess care at the hospital. Thus, the connection with the hospital was strengthened in the H2O model, potentially at the expense of the connection with PCPs. Physicians hypothesized that families might “still feel part of the medical system,” so families would return to the hospital if there was a problem. PCPs emphasized that there may have been straightforward situations that could have been handled appropriately in the outpatient office (Table 2).
Theme 4: Home Visit RNs Had a Low Threshold for Escalating Care
Parents and PCPs hypothesized that RNs are more conservative and, therefore, would have had a low threshold to refer back to the hospital if there were concerns in the home. One parent commented: “I guess, nurses are just by trade accustomed to erring on the side of caution and medical intervention instead of letting time take its course. … They’re more apt to say it’s better off to go to the hospital and have everything be fine” (Table 2).
Minor Themes
Participants also explained reutilization in ways that coalesced into 5 minor themes: (1) families receiving a visit might perceive that their child was sicker; (2) patients in the control group did not reutilize enough; (3) receiving more education on a child’s illness drives reutilization; (4) provider access issues; and (5) variability of RN experience may determine whether escalated care. Supportive quotations found in Appendix 2.
We directly asked parents if they would want a nurse home visit in the future after discussing the results of the study. Almost all of the parents in the intervention group and most of the parents in the control group were in favor of receiving a visit, even knowing that patients who had received a visit were more likely to reutilize care.
Goal 2: Suggestions for Improving Intervention Design
Three major themes and 3 minor themes were related to improving the design of the intervention (Table 1).
Theme 1: Need for Improved Postdischarge Communication
All stakeholder groups highlighted postdischarge communication as an area that could be improved. Parents were frustrated with regard to attempts to connect with inpatient physicians after discharge. PCPs suggested developing pathways for the RN to connect with the primary care office as opposed to the hospital. Hospital medicine physicians discussed a lack of consensus regarding patient ownership following discharge and were uncertain about what types of postdischarge symptoms PCPs would be comfortable managing. RNs described specific situations when they had difficulty contacting a physician to escalate care (Table 3).
Theme 2: Individualizing Home Visits—One Size Does Not Fit All
All stakeholder groups also encouraged “individualization” of home visits according to patient and family characteristics, diagnosis, and both timing and severity of illness. PCPs recommended visits only for certain diagnoses. Hospital medicine physicians voiced similar sentiments as the PCPs and added that worrisome family dynamics during a hospitalization, such as a lack of engagement with the medical team, might also warrant a visit. RNs suggested visits for those families with more concerns, for example, those with young children or children recovering from an acute respiratory illness (Table 3).
Theme 3: Providing Context for and Framing of Red Flags
Physicians and nurses suggested providing more context to “red flag” instructions and education. RNs emphasized that some families seemed to benefit from the opportunity to discuss their postdischarge concerns with a medical professional. Others appreciated concrete written instructions that spelled out how to respond in certain situations (Table 3).
Minor Themes
Three minor themes were revealed regarding intervention design improvement (Table 1): (1) streamlining the discharge process; (2) improving the definition of the scope and goal of intervention; and (3) extending inpatient team expertise post discharge. Supportive quotations can be found in Appendix 3.
DISCUSSION
When stakeholders were asked about why postdischarge RN visits led to increased postdischarge urgent healthcare visits, they questioned the appropriateness of the reutilization events, wondered about the lack of context for the warning signs that nurses provided families as part of the intervention, worried that families were encouraged to return to the hospital because of the ties of the trial to the hospital, and suggested that RNs had a low threshold to refer patients back to the hospital. When asked about how to design an improved nurse visit to better support families, stakeholders emphasized improving communication, individualizing the visit, and providing context around the red-flag discussion, enabling more nuanced instructions about how to respond to specific events.
A synthesis of themes suggests that potential drivers for increased utilization rates may lie in the design and goals of the initial project. The intervention was designed to support families and enhance education after discharge, with components derived from pretrial focus groups with families after a hospital discharge.8 The intervention was not designed to divert patients from the ED nor did it enhance access to the PCP. A second trial of the intervention adapted to a phone call also failed to decrease reutilization rates.9 Both physician stakeholder groups perceived that the intervention directed traffic back to the hospital because of the intervention design. Coupled with the perception that the red flags may have changed a family’s threshold for seeking care and/or that an RN may be more apt to refer back to care, this failure to push utilization to the primary care office may explain the unexpected trial results. Despite the stakeholders’ perception of enhanced connection back to the hospital as a result of the nurse visit, in analysis of visit referral patterns, a referral was made directly back to the ED in only 4 of the 651 trial visits (Tubbs-Cooley H, Riddle SR, Gold JM, et al.; under review. Pediatric clinical and social concerns identified by home visit nurses in the immediate postdischarge period 2020).
Both H2O trials demonstrated improved recall of red flags by parents who received the intervention, which may be important given the stakeholders’ perspectives that the red flags may not have been contextualized well enough. Yet neither trial demonstrated any differences in postdischarge coping or time to return to normal routine. In interviews with parents, despite the clearly stated results of increased reutilization, intervention parents endorsed a desire for a home visit in the future, raising the possibility that our outcome measures did not capture parents’ priorities adequately.
When asked to recommend design improvements of the intervention, 2 major themes (improvement in communication and individualization of visits) were discussed by all stakeholder groups, providing actionable information to modify or create new interventions. Focus groups with clinicians suggested that communication challenges may have influenced reutilization likelihood during the postdischarge period. RNs expressed uncertainty about who to call with problems or questions at the time of a home visit. This was compounded by difficulty reaching physicians. Both hospital medicine physicians and PCPs identified system challenges including questions of patient ownership, variable PCP practice communication preferences, and difficulty in identifying a partnered staff member (on either end of the inpatient-outpatient continuum) who was familiar with a specific patient. While the communication issues raised may reflect difficulties in our local healthcare system, there is broad evidence of postdischarge communication challenges. In adults, postdischarge communication failures between home health staff and physicians are associated with an increased risk of readmission.10 The real or perceived lack of communication between inpatient and outpatient providers can add to parental confusion post discharge.11 Although there have been efforts to improve the reliability of communication across this gulf,12,13 it is not clear whether changes to discharge communication could help to avoid pediatric reutilization events.14
The theme of individualization of the home nurse visit is consistent with evidence regarding the impact of focusing the intervention on patients with specific diagnoses or demographics. In adults, reduced reutilization associated with postdischarge home nurse visits has been described in specific populations such as patients with heart failure and chronic obstructive pulmonary disease.15 Impact of home nurse visits on patients within diagnosis-specific populations with certain demographics (such as advanced age) has also been described.16 In the pediatric population, readmission rates vary widely by diagnosis.17 A systematic review of interventions to reduce pediatric readmissions found increased impact of discharge interventions in specific populations (asthma, oncology, and NICU).3
Next steps may lie in interventions in targeted populations that function as part of a care continuum bridging the patient from the inpatient to the outpatient setting. A home nurse visit as part of this discharge structure may prove to have more impact on reducing reutilization. One population which accounts for a large proportion of readmissions and where there has been recent focus on discharge transition of care has been children with medical complexity.18 This group was largely excluded from the H2O trial. Postdischarge home nurse visits in this population have been found to be feasible and address many questions and problems, but the effect on readmission is less clear.19 Family priorities and preferences related to preparation for discharge, including family engagement, respect for discharge readiness, and goal of returning to normal routines, may be areas on which to focus with future interventions in this population.20 In summary, although widespread postdischarge interventions (home nurse visit4 and nurse telephone call9) have not been found to be effective, targeting interventions to specific populations by diagnosis or demographic factors may prove to be more effective in reducing pediatric reutilization.
There were several strengths to this study. This qualitative approach allowed us to elucidate potential explanations for the H2O trial results from multiple perspectives. The multidisciplinary composition of our analytic team and the use of an iterative process sparked diverse contributions in a dynamic, ongoing discussion and interpretation of our data.
This study should be considered in the context of several limitations. For families and RNs, there was a time lag between participation in the trial and participation in the qualitative study call or focus group which could lead to difficulty recalling details. Only families who received the intervention could give opinions on their experience of the nurse visit, while families in the control group were asked to hypothesize. Focus groups with hospital medicine physicians and PCPs were purposive samples, and complete demographic information of participants was not collected.
CONCLUSION
Key stakeholders reflecting on a postdischarge RN visit trial suggested multiple potential explanations for the unexpected increase in reutilization in children randomized to the intervention. Certain participants questioned whether all reutilization events were appropriate or necessary. Others expressed concerns that the H2O intervention lacked context and directed children back to the hospital instead of the PCP. Parents, PCPs, hospital medicine physicians, and RNs all suggested that future transition-focused interventions should enhance postdischarge communication, strengthen connection to the PCP, and be more effectively tailored to the needs of the individual patient and family.
Acknowledgments
Collaborators: H2O Trial Study Group: Joanne Bachus, BSN, RN, Department of Patient Services, Cincinnati Children’s Hospital Medical Center, Cincinnati, Ohio; Monica L Borell, BSN, RN, Department of Patient Services, Cincinnati Children’s Hospital Medical Center, Cincinnati, Ohio; Lenisa V Chang, MA, PhD; Patricia Crawford, RN, Department of Patient Services, Cincinnati Children’s Hospital Medical Center, Cincinnati, Ohio; Sarah A Ferris, BA, Division of Hospital Medicine, Cincinnati Children’s Hospital Medical Center, Cincinnati, Ohio; Judy A Heilman BSN, RN, Department of Patient Services, Cincinnati Children’s Hospital Medical Center, Cincinnati, Ohio; Jane C Khoury, PhD, Division of Biostatistics and Epidemiology, Cincinnati Children’s Hospital Medical Center, Cincinnati, Ohio; Karen Lawley, BSN, RN, Department of Patient Services, Cincinnati Children’s Hospital Medical Center, Cincinnati, Ohio; Lynne O’Donnell, BSN, RN, Department of Patient Services, Cincinnati Children’s Hospital Medical Center, Cincinnati, Ohio; Hadley S Sauers-Ford, MPH, Department of Pediatrics, UC Davis Health, Sacramento, California; Anita N Shah, DO, MPH, Division of Hospital Medicine, Cincinnati Children’s Hospital Medical Center, Cincinnati, Ohio; Lauren G Solan, MD, Med, University of Rochester, Rochester, New York; Heidi J Sucharew, PhD, Division of Biostatistics and Epidemiology, Cincinnati Children’s Hospital Medical Center, Cincinnati, Ohio; Karen P Sullivan, BSN, RN, Department of Patient Services, Cincinnati Children’s Hospital Medical Center, Cincinnati, Ohio; Christine M White, MD, MAT, Division of Hospital Medicine, Cincinnati Children’s Hospital Medical Center, Cincinnati, Ohio.
1. Auger KA, Simon TD, Cooperberg D, et al. Summary of STARNet: seamless transitions and (re)admissions network. Pediatrics. 2015;135(1):164-175. https://doi.org/10.1542/peds.2014-1887.
2. Toomey SL, Peltz A, Loren S, et al. Potentially preventable 30-day hospital readmissions at a Children’s Hospital. Pediatrics. 2016;138(2). https://doi.org/10.1542/peds.2015-4182.
3. Auger KA, Kenyon CC, Feudtner C, Davis MM. Pediatric hospital discharge interventions to reduce subsequent utilization: a systematic review. J Hosp Med. 2014;9(4):251-260. https://doi.org/10.1002/jhm.2134.
4. Auger KA, Simmons JM, Tubbs-Cooley HL, et al. Postdischarge nurse home visits and reuse: the Hospital to Home Outcomes (H2O) trial. Pediatrics. 2018;142(1). https://doi.org/10.1542/peds.2017-3919.
5. Tubbs-Cooley HL, Pickler RH, Simmons JM, et al. Testing a post-discharge nurse-led transitional home visit in acute care pediatrics: the Hospital-To-Home Outcomes (H2O) study protocol. J Adv Nurs. 2016;72(4):915-925. https://doi.org/10.1111/jan.12882.
6. Guest G. Collecting Qualitative Data: A Field Manual for Applied Research. Thousand Oaks, CA: SAGE Publications, Inc.; 2013.
7. Patton M. Qualitative Research and Evaluation Methods. 4th ed. Thousand Oaks, CA: SAGE Publications, Inc.; 2014.
8. Solan LG, Beck AF, Brunswick SA, et al. The family perspective on Hospital to Home Transitions: a qualitative study. Pediatrics. 2015;136(6):e1539-e1549. https://doi.org/10.1542/peds.2015-2098.
9. Auger KA, Shah SS, Tubbs-Cooley HL, et al. Effects of a 1-time nurse-led telephone call after pediatric discharge: the H2O II randomized clinical trial. JAMA Pediatr. 2018;172(9):e181482. https://doi.org/10.1001/jamapediatrics.2018.1482.
10. Pesko MF, Gerber LM, Peng TR, Press MJ. Home health care: nurse-physician communication, patient severity, and hospital readmission. Health Serv Res. 2018;53(2):1008-1024. https://doi.org/10.1111/1475-6773.12667.
11. Solan LG, Beck AF, Shardo SA, et al. Caregiver perspectives on communication during hospitalization at an academic pediatric institution: a qualitative study. J Hosp Med. 2018;13(5):304-311. https://doi.org/10.12788/jhm.2919.
12. Zackoff MW, Graham C, Warrick D, et al. Increasing PCP and hospital medicine physician verbal communication during hospital admissions. Hosp Pediatr. 2018;8(4):220-226. https://doi.org/10.1542/hpeds.2017-0119.
13. Mussman GM, Vossmeyer MT, Brady PW, et al. Improving the reliability of verbal communication between primary care physicians and pediatric hospitalists at hospital discharge. J Hosp Med. 2015;10(9):574-580. https://doi.org/10.1002/jhm.2392.
14. Coller RJ, Klitzner TS, Saenz AA, et al. Discharge handoff communication and pediatric readmissions. J Hosp Med. 2017;12(1):29-35. https://doi.org/10.1002/jhm.2670.
15. Yang F, Xiong ZF, Yang C, et al. Continuity of care to prevent readmissions for patients with chronic obstructive pulmonary disease: a systematic review and meta-analysis. COPD. 2017;14(2):251-261. https://doi.org/10.1080/15412555.2016.1256384.
16. Finlayson K, Chang AM, Courtney MD, et al. Transitional care interventions reduce unplanned hospital readmissions in high-risk older adults. BMC Health Serv Res. 2018;18(1):956. https://doi.org/10.1186/s12913-018-3771-9.
17. Berry JG, Toomey SL, Zaslavsky AM, et al. Pediatric readmission prevalence and variability across hospitals. JAMA. 2013;309(4):372-380. https://doi.org/10.1001/jama.2012.188351.
18. Coller RJ, Nelson BB, Sklansky DJ, et al. Preventing hospitalizations in children with medical complexity: a systematic review. Pediatrics. 2014;134(6):e1628-e1647. https://doi.org/10.1542/peds.2014-1956.
19. Wells S, O’Neill M, Rogers J, et al. Nursing-led home visits post-hospitalization for children with medical complexity. J Pediatr Nurs. 2017;34:10-16. https://doi.org/10.1016/j.pedn.2017.03.003.
20. Leyenaar JK, O’Brien ER, Leslie LK, Lindenauer PK, Mangione-Smith RM. Families’ priorities regarding hospital-to-home transitions for children with medical complexity. Pediatrics. 2017;139(1). https://doi.org/10.1542/peds.2016-1581.
Readmission rates are used as metrics for care quality and reimbursement, with penalties applied to hospitals with higher than expected rates1 and up to 30% of pediatric readmissions deemed potentially preventable.2 There is a paucity of information on how to prevent pediatric readmissions,3 yet pediatric hospitals are tasked with implementing interventions for readmission reduction.
The Hospital to Home Outcomes (H2O) trial was a 2-arm, randomized controlled trial in which patients discharged from hospital medicine and neuroscience services at a single institution were randomized to receive a single home visit from a registered nurse (RN) within 96 hours of discharge.4 RNs completed a structured nurse visit designed specifically for the trial. Lists of “red flags” or warning signs associated with common diagnoses were provided to assist RNs in standardizing education about when to seek additional care. The hypothesis was that the postdischarge visits would result in lower reutilization rates (unplanned readmissions, emergency department [ED] visits, and urgent care visits).5
Unexpectedly, children randomized to receive the postdischarge nurse visit had higher rates of 30-day unplanned healthcare reutilization, with children randomly assigned to the intervention demonstrating higher odds of 30-day healthcare use (OR 1.33; 95% CI 1.003-1.76).4 We sought to understand perspectives on these unanticipated findings by obtaining input from relevant stakeholders. There were 2 goals for the qualitative analysis: first, to understand possible explanations of the increased reutilization finding; second, to elicit suggestions for improving the nurse visit intervention.
METHODS
We selected an in-depth qualitative approach, using interviews and focus groups to explore underlying explanations for the increase in 30-day unplanned healthcare reutilization among those randomized to receive the postdischarge nurse visit during the H2O trial.4 Input was sought from 4 stakeholder groups—parents, primary care physicians (PCPs), hospital medicine physicians, and home care RNs—in an effort to triangulate data sources and elicit rich and diverse opinions. Approval was obtained from the Institutional Review Board prior to conducting the study.
Recruitment
Parents
Because we conducted interviews approximately 1 year after the trial’s conclusion, we purposefully selected families who were enrolled in the latter portion of the H2O trial in order to enhance recall. Beginning with the last families in the study, we sequentially contacted families in reverse order. We contacted 10 families in each of 4 categories (intervention/reutilization, intervention/no reutilization, control/reutilization, control/no reutilization). A total of 3 attempts were made by telephone to contact each family. Participants received a grocery store gift card for participating in the study.
Primary Care Physicians
We conducted focus groups with a purposive sample of physicians recruited from 2 community practices and 1 hospital-owned practice.
Hospital Medicine Physicians
We conducted focus groups with a purposive sample of physicians from our Division of Hospital Medicine. There was a varying level of knowledge of the original trial; however, none of the participants were collaborators in the trial.
Home Care RNs
We conducted focus groups with a subset of RNs who were involved with trial visits. All RNs were members of the pediatric home care division associated with the hospital with specific training in caring for patients at home.
Data Collection
The study team designed question guides for each stakeholder group (Appendix 1). While questions were tailored for specific stakeholders, all guides included the following topics: benefits and challenges of nurse visits, suggestions for improving the intervention in future trials, and reactions to the trial results (once presented to participants). Only the results of the intention-to-treat (ITT) analysis were shared with stakeholders because ITT is considered the gold standard for trial analysis and allows easy understanding of the results.
A single investigator (A.L.) conducted parental interviews by telephone. Focus groups for PCPs, hospital medicine physicians, and RN groups were held at practice locations in private conference rooms and were conducted by trained moderators (S.N.S., A.L., and H.T.C.). Moderators probed responses to the open-ended questions to delve deeply into issues. The question guides were modified in an iterative fashion to include new concepts raised during interviews or focus groups. All interviews and focus groups were recorded and transcribed verbatim with all identifiable information redacted.
Data Analysis
During multiple cycles of inductive thematic analysis,6 we examined, discussed, interpreted, and organized responses to the open-ended questions,6,7 analyzing each stakeholder group separately. First, transcripts were shared with and reviewed by the entire multidisciplinary team (12 members) which included hospital medicine physicians, PCPs, home care nursing leaders, a nurse scientist, a parent representative, research coordinators, and a qualitative research methodologist. Second, team members convened to discuss overall concepts and ideas and created the preliminary coding frameworks. Third, a smaller subgroup (research coordinator [A.L]., hospital medicine physician [S.R.], parent representative [M.M.], and qualitative research methodologist [S.N.S.]), refined the unique coding framework for each stakeholder group and then independently applied codes to participant comments. This subgroup met regularly to reach consensus about the assigned codes and to further refine the codebooks. The codes were organized into major and minor themes based on recurring patterns in the data and the salience or emphasis given by participants. The subgroup’s work was reviewed and discussed on an ongoing basis by the entire multidisciplinary team. Triangulation of the data was achieved in multiple ways. The preliminary results were shared in several forums, and feedback was solicited and incorporated. Two of 4 members of the subgroup analytic team were not part of the trial planning or data collection, providing a potentially broader perspective. All coding decisions were maintained in an electronic database, and an audit trail was created to document codebook revisions.
RESULTS
A total of 33 parents participated in the interviews (intervention/readmit [8], intervention/no readmit [8], control/readmit [8], and control/no readmit [9]). Although we selected families from all 4 categories, we were not able to explore qualitative differences between these groups because of the relatively low numbers of participants. Parent data was very limited as interviews were brief and “control” parents had not received the intervention. Three focus groups were held with PCPs (7 participants in total), 2 focus groups were held with hospital medicine physicians (12 participants), and 2 focus groups were held with RNs (10 participants).
Goal 1: Explanation of Reutilization Rates
During interviews and focus groups, the results of the H2O trial were discussed, and stakeholders were asked to comment on potential explanations of the findings. 4 major themes and 5 minor themes emerged from analysis of the transcripts (summarized in Table 1).
Theme 1: Appropriateness of Patient Reutilization
Hospital medicine physicians and home care RNs questioned whether the reutilization events were clinically indicated. RNs wondered whether children who reutilized the ED were also readmitted to the hospital; many perceived that if the child was ill enough to be readmitted, then the ED revisit was warranted (Table 2). Parents commented on parental decision-making and changes in clinical status of the child leading to reutilization (Table 2).
Theme 2: Impact of Red Flags/Warning Sign Instructions on Family’s Reutilization Decisions
Theme 3: Hospital-Affiliated RNs “Directing Traffic” Back to Hospital
Both physician groups were concerned that, because the study was conducted by hospital-employed nurses, families might have been more likely to reaccess care at the hospital. Thus, the connection with the hospital was strengthened in the H2O model, potentially at the expense of the connection with PCPs. Physicians hypothesized that families might “still feel part of the medical system,” so families would return to the hospital if there was a problem. PCPs emphasized that there may have been straightforward situations that could have been handled appropriately in the outpatient office (Table 2).
Theme 4: Home Visit RNs Had a Low Threshold for Escalating Care
Parents and PCPs hypothesized that RNs are more conservative and, therefore, would have had a low threshold to refer back to the hospital if there were concerns in the home. One parent commented: “I guess, nurses are just by trade accustomed to erring on the side of caution and medical intervention instead of letting time take its course. … They’re more apt to say it’s better off to go to the hospital and have everything be fine” (Table 2).
Minor Themes
Participants also explained reutilization in ways that coalesced into 5 minor themes: (1) families receiving a visit might perceive that their child was sicker; (2) patients in the control group did not reutilize enough; (3) receiving more education on a child’s illness drives reutilization; (4) provider access issues; and (5) variability of RN experience may determine whether escalated care. Supportive quotations found in Appendix 2.
We directly asked parents if they would want a nurse home visit in the future after discussing the results of the study. Almost all of the parents in the intervention group and most of the parents in the control group were in favor of receiving a visit, even knowing that patients who had received a visit were more likely to reutilize care.
Goal 2: Suggestions for Improving Intervention Design
Three major themes and 3 minor themes were related to improving the design of the intervention (Table 1).
Theme 1: Need for Improved Postdischarge Communication
All stakeholder groups highlighted postdischarge communication as an area that could be improved. Parents were frustrated with regard to attempts to connect with inpatient physicians after discharge. PCPs suggested developing pathways for the RN to connect with the primary care office as opposed to the hospital. Hospital medicine physicians discussed a lack of consensus regarding patient ownership following discharge and were uncertain about what types of postdischarge symptoms PCPs would be comfortable managing. RNs described specific situations when they had difficulty contacting a physician to escalate care (Table 3).
Theme 2: Individualizing Home Visits—One Size Does Not Fit All
All stakeholder groups also encouraged “individualization” of home visits according to patient and family characteristics, diagnosis, and both timing and severity of illness. PCPs recommended visits only for certain diagnoses. Hospital medicine physicians voiced similar sentiments as the PCPs and added that worrisome family dynamics during a hospitalization, such as a lack of engagement with the medical team, might also warrant a visit. RNs suggested visits for those families with more concerns, for example, those with young children or children recovering from an acute respiratory illness (Table 3).
Theme 3: Providing Context for and Framing of Red Flags
Physicians and nurses suggested providing more context to “red flag” instructions and education. RNs emphasized that some families seemed to benefit from the opportunity to discuss their postdischarge concerns with a medical professional. Others appreciated concrete written instructions that spelled out how to respond in certain situations (Table 3).
Minor Themes
Three minor themes were revealed regarding intervention design improvement (Table 1): (1) streamlining the discharge process; (2) improving the definition of the scope and goal of intervention; and (3) extending inpatient team expertise post discharge. Supportive quotations can be found in Appendix 3.
DISCUSSION
When stakeholders were asked about why postdischarge RN visits led to increased postdischarge urgent healthcare visits, they questioned the appropriateness of the reutilization events, wondered about the lack of context for the warning signs that nurses provided families as part of the intervention, worried that families were encouraged to return to the hospital because of the ties of the trial to the hospital, and suggested that RNs had a low threshold to refer patients back to the hospital. When asked about how to design an improved nurse visit to better support families, stakeholders emphasized improving communication, individualizing the visit, and providing context around the red-flag discussion, enabling more nuanced instructions about how to respond to specific events.
A synthesis of themes suggests that potential drivers for increased utilization rates may lie in the design and goals of the initial project. The intervention was designed to support families and enhance education after discharge, with components derived from pretrial focus groups with families after a hospital discharge.8 The intervention was not designed to divert patients from the ED nor did it enhance access to the PCP. A second trial of the intervention adapted to a phone call also failed to decrease reutilization rates.9 Both physician stakeholder groups perceived that the intervention directed traffic back to the hospital because of the intervention design. Coupled with the perception that the red flags may have changed a family’s threshold for seeking care and/or that an RN may be more apt to refer back to care, this failure to push utilization to the primary care office may explain the unexpected trial results. Despite the stakeholders’ perception of enhanced connection back to the hospital as a result of the nurse visit, in analysis of visit referral patterns, a referral was made directly back to the ED in only 4 of the 651 trial visits (Tubbs-Cooley H, Riddle SR, Gold JM, et al.; under review. Pediatric clinical and social concerns identified by home visit nurses in the immediate postdischarge period 2020).
Both H2O trials demonstrated improved recall of red flags by parents who received the intervention, which may be important given the stakeholders’ perspectives that the red flags may not have been contextualized well enough. Yet neither trial demonstrated any differences in postdischarge coping or time to return to normal routine. In interviews with parents, despite the clearly stated results of increased reutilization, intervention parents endorsed a desire for a home visit in the future, raising the possibility that our outcome measures did not capture parents’ priorities adequately.
When asked to recommend design improvements of the intervention, 2 major themes (improvement in communication and individualization of visits) were discussed by all stakeholder groups, providing actionable information to modify or create new interventions. Focus groups with clinicians suggested that communication challenges may have influenced reutilization likelihood during the postdischarge period. RNs expressed uncertainty about who to call with problems or questions at the time of a home visit. This was compounded by difficulty reaching physicians. Both hospital medicine physicians and PCPs identified system challenges including questions of patient ownership, variable PCP practice communication preferences, and difficulty in identifying a partnered staff member (on either end of the inpatient-outpatient continuum) who was familiar with a specific patient. While the communication issues raised may reflect difficulties in our local healthcare system, there is broad evidence of postdischarge communication challenges. In adults, postdischarge communication failures between home health staff and physicians are associated with an increased risk of readmission.10 The real or perceived lack of communication between inpatient and outpatient providers can add to parental confusion post discharge.11 Although there have been efforts to improve the reliability of communication across this gulf,12,13 it is not clear whether changes to discharge communication could help to avoid pediatric reutilization events.14
The theme of individualization of the home nurse visit is consistent with evidence regarding the impact of focusing the intervention on patients with specific diagnoses or demographics. In adults, reduced reutilization associated with postdischarge home nurse visits has been described in specific populations such as patients with heart failure and chronic obstructive pulmonary disease.15 Impact of home nurse visits on patients within diagnosis-specific populations with certain demographics (such as advanced age) has also been described.16 In the pediatric population, readmission rates vary widely by diagnosis.17 A systematic review of interventions to reduce pediatric readmissions found increased impact of discharge interventions in specific populations (asthma, oncology, and NICU).3
Next steps may lie in interventions in targeted populations that function as part of a care continuum bridging the patient from the inpatient to the outpatient setting. A home nurse visit as part of this discharge structure may prove to have more impact on reducing reutilization. One population which accounts for a large proportion of readmissions and where there has been recent focus on discharge transition of care has been children with medical complexity.18 This group was largely excluded from the H2O trial. Postdischarge home nurse visits in this population have been found to be feasible and address many questions and problems, but the effect on readmission is less clear.19 Family priorities and preferences related to preparation for discharge, including family engagement, respect for discharge readiness, and goal of returning to normal routines, may be areas on which to focus with future interventions in this population.20 In summary, although widespread postdischarge interventions (home nurse visit4 and nurse telephone call9) have not been found to be effective, targeting interventions to specific populations by diagnosis or demographic factors may prove to be more effective in reducing pediatric reutilization.
There were several strengths to this study. This qualitative approach allowed us to elucidate potential explanations for the H2O trial results from multiple perspectives. The multidisciplinary composition of our analytic team and the use of an iterative process sparked diverse contributions in a dynamic, ongoing discussion and interpretation of our data.
This study should be considered in the context of several limitations. For families and RNs, there was a time lag between participation in the trial and participation in the qualitative study call or focus group which could lead to difficulty recalling details. Only families who received the intervention could give opinions on their experience of the nurse visit, while families in the control group were asked to hypothesize. Focus groups with hospital medicine physicians and PCPs were purposive samples, and complete demographic information of participants was not collected.
CONCLUSION
Key stakeholders reflecting on a postdischarge RN visit trial suggested multiple potential explanations for the unexpected increase in reutilization in children randomized to the intervention. Certain participants questioned whether all reutilization events were appropriate or necessary. Others expressed concerns that the H2O intervention lacked context and directed children back to the hospital instead of the PCP. Parents, PCPs, hospital medicine physicians, and RNs all suggested that future transition-focused interventions should enhance postdischarge communication, strengthen connection to the PCP, and be more effectively tailored to the needs of the individual patient and family.
Acknowledgments
Collaborators: H2O Trial Study Group: Joanne Bachus, BSN, RN, Department of Patient Services, Cincinnati Children’s Hospital Medical Center, Cincinnati, Ohio; Monica L Borell, BSN, RN, Department of Patient Services, Cincinnati Children’s Hospital Medical Center, Cincinnati, Ohio; Lenisa V Chang, MA, PhD; Patricia Crawford, RN, Department of Patient Services, Cincinnati Children’s Hospital Medical Center, Cincinnati, Ohio; Sarah A Ferris, BA, Division of Hospital Medicine, Cincinnati Children’s Hospital Medical Center, Cincinnati, Ohio; Judy A Heilman BSN, RN, Department of Patient Services, Cincinnati Children’s Hospital Medical Center, Cincinnati, Ohio; Jane C Khoury, PhD, Division of Biostatistics and Epidemiology, Cincinnati Children’s Hospital Medical Center, Cincinnati, Ohio; Karen Lawley, BSN, RN, Department of Patient Services, Cincinnati Children’s Hospital Medical Center, Cincinnati, Ohio; Lynne O’Donnell, BSN, RN, Department of Patient Services, Cincinnati Children’s Hospital Medical Center, Cincinnati, Ohio; Hadley S Sauers-Ford, MPH, Department of Pediatrics, UC Davis Health, Sacramento, California; Anita N Shah, DO, MPH, Division of Hospital Medicine, Cincinnati Children’s Hospital Medical Center, Cincinnati, Ohio; Lauren G Solan, MD, Med, University of Rochester, Rochester, New York; Heidi J Sucharew, PhD, Division of Biostatistics and Epidemiology, Cincinnati Children’s Hospital Medical Center, Cincinnati, Ohio; Karen P Sullivan, BSN, RN, Department of Patient Services, Cincinnati Children’s Hospital Medical Center, Cincinnati, Ohio; Christine M White, MD, MAT, Division of Hospital Medicine, Cincinnati Children’s Hospital Medical Center, Cincinnati, Ohio.
1. Auger KA, Simon TD, Cooperberg D, et al. Summary of STARNet: seamless transitions and (re)admissions network. Pediatrics. 2015;135(1):164-175. https://doi.org/10.1542/peds.2014-1887.
2. Toomey SL, Peltz A, Loren S, et al. Potentially preventable 30-day hospital readmissions at a Children’s Hospital. Pediatrics. 2016;138(2). https://doi.org/10.1542/peds.2015-4182.
3. Auger KA, Kenyon CC, Feudtner C, Davis MM. Pediatric hospital discharge interventions to reduce subsequent utilization: a systematic review. J Hosp Med. 2014;9(4):251-260. https://doi.org/10.1002/jhm.2134.
4. Auger KA, Simmons JM, Tubbs-Cooley HL, et al. Postdischarge nurse home visits and reuse: the Hospital to Home Outcomes (H2O) trial. Pediatrics. 2018;142(1). https://doi.org/10.1542/peds.2017-3919.
5. Tubbs-Cooley HL, Pickler RH, Simmons JM, et al. Testing a post-discharge nurse-led transitional home visit in acute care pediatrics: the Hospital-To-Home Outcomes (H2O) study protocol. J Adv Nurs. 2016;72(4):915-925. https://doi.org/10.1111/jan.12882.
6. Guest G. Collecting Qualitative Data: A Field Manual for Applied Research. Thousand Oaks, CA: SAGE Publications, Inc.; 2013.
7. Patton M. Qualitative Research and Evaluation Methods. 4th ed. Thousand Oaks, CA: SAGE Publications, Inc.; 2014.
8. Solan LG, Beck AF, Brunswick SA, et al. The family perspective on Hospital to Home Transitions: a qualitative study. Pediatrics. 2015;136(6):e1539-e1549. https://doi.org/10.1542/peds.2015-2098.
9. Auger KA, Shah SS, Tubbs-Cooley HL, et al. Effects of a 1-time nurse-led telephone call after pediatric discharge: the H2O II randomized clinical trial. JAMA Pediatr. 2018;172(9):e181482. https://doi.org/10.1001/jamapediatrics.2018.1482.
10. Pesko MF, Gerber LM, Peng TR, Press MJ. Home health care: nurse-physician communication, patient severity, and hospital readmission. Health Serv Res. 2018;53(2):1008-1024. https://doi.org/10.1111/1475-6773.12667.
11. Solan LG, Beck AF, Shardo SA, et al. Caregiver perspectives on communication during hospitalization at an academic pediatric institution: a qualitative study. J Hosp Med. 2018;13(5):304-311. https://doi.org/10.12788/jhm.2919.
12. Zackoff MW, Graham C, Warrick D, et al. Increasing PCP and hospital medicine physician verbal communication during hospital admissions. Hosp Pediatr. 2018;8(4):220-226. https://doi.org/10.1542/hpeds.2017-0119.
13. Mussman GM, Vossmeyer MT, Brady PW, et al. Improving the reliability of verbal communication between primary care physicians and pediatric hospitalists at hospital discharge. J Hosp Med. 2015;10(9):574-580. https://doi.org/10.1002/jhm.2392.
14. Coller RJ, Klitzner TS, Saenz AA, et al. Discharge handoff communication and pediatric readmissions. J Hosp Med. 2017;12(1):29-35. https://doi.org/10.1002/jhm.2670.
15. Yang F, Xiong ZF, Yang C, et al. Continuity of care to prevent readmissions for patients with chronic obstructive pulmonary disease: a systematic review and meta-analysis. COPD. 2017;14(2):251-261. https://doi.org/10.1080/15412555.2016.1256384.
16. Finlayson K, Chang AM, Courtney MD, et al. Transitional care interventions reduce unplanned hospital readmissions in high-risk older adults. BMC Health Serv Res. 2018;18(1):956. https://doi.org/10.1186/s12913-018-3771-9.
17. Berry JG, Toomey SL, Zaslavsky AM, et al. Pediatric readmission prevalence and variability across hospitals. JAMA. 2013;309(4):372-380. https://doi.org/10.1001/jama.2012.188351.
18. Coller RJ, Nelson BB, Sklansky DJ, et al. Preventing hospitalizations in children with medical complexity: a systematic review. Pediatrics. 2014;134(6):e1628-e1647. https://doi.org/10.1542/peds.2014-1956.
19. Wells S, O’Neill M, Rogers J, et al. Nursing-led home visits post-hospitalization for children with medical complexity. J Pediatr Nurs. 2017;34:10-16. https://doi.org/10.1016/j.pedn.2017.03.003.
20. Leyenaar JK, O’Brien ER, Leslie LK, Lindenauer PK, Mangione-Smith RM. Families’ priorities regarding hospital-to-home transitions for children with medical complexity. Pediatrics. 2017;139(1). https://doi.org/10.1542/peds.2016-1581.
© 2020 Society of Hospital Medicine
Counting the Ways to Count Medications: The Challenges of Defining Pediatric Polypharmacy
Polypharmacy, the practice of taking multiple medications to manage health conditions, is common for children. Many children today have a higher burden chronic illness and an increasing number of pharmaceuticals—often delivered in various doses throughout the day. Polypharmacy has been linked to a variety of pediatric and adult outcomes, including medication errors and readmission.1-3 Consequently, the Society of Hospital Medicine recognizes polypharmacy as a risk factor for readmission for adult populations.4 These adverse outcomes are related to both the human elements of polypharmacy (eg, cognitive burden, adherence) and the pharmacologic elements, including drug–drug interactions. For many children, the safety implications of polypharmacy may be more consequential due to the reliance of multiple caregivers to administer medications, which requires additional coordination to ensure that medications are administered and not duplicated. Dual administration of the same medication by both parents is the most common reason for pediatric calls to Poison Control Centers.5 Yet, there is a paucity of research in this area, with most of the pediatric literature focusing on the outpatient setting and specific populations, including epilepsy and mental health.6-8
How providers, patients, and families translate medication lists to counts of medications—and hence the burden of polypharmacy—is not clearly or consistently described. Often in studies of polypharmacy, researchers utilize medication claims data to count the number of medications a patient has filled from the pharmacy. However, in routine clinical practice, clinicians rarely have access to medication claims and thus rely on patient or family report, which may or may not match the list of medications in the patients’ medical records.
Therefore, linking polypharmacy research to the pragmatic complexities of clinical care requires greater clarity and consistent application of concepts. At hospital discharge, families receive a list of medications to take, including home medications to resume as well as newly prescribed medications. However, not all medications are equally essential to patients’ care regarding importance of administration (eg, hydrocortisone ointment versus an anticonvulsant medication). Patients, parents, and caregivers are ultimately responsible for determining which medications to prioritize and administer.
Although there is no standard numerical definition for how to identify polypharmacy, five medications is commonly considered the threshold for polypharmacy.9 A recent review of the pediatric polypharmacy literature suggested a lower threshold, with any two concurrent medications for at least a day.7 Yet, the best approach to “count” medications at hospital discharge is unclear. The simplest method is to tally the number of medications listed in the discharge summary. However, medications are sometimes listed twice due to different dosages administered at different times. Frequently, medications are prescribed on an as-needed basis; these medications could be administered routinely or very infrequently (eg, epinephrine for anaphylaxis). Over-the-counter medications are also sometimes included in discharge summaries and consideration should be given as to whether these medications count toward measures of polypharmacy. Over-the-counter medications would not be counted by a polypharmacy measure that relies on claims data if those medications are not paid by the insurer.
We sought consensus on how to count discharge medications through a series of informal interviews with hospitalists, nurses, and parents. We asked the seemingly simple question, “How many medications is this child on?” across a variety of scenarios (Figure). For panel A, all stakeholders agreed that this medication list includes two medications. All other scenarios elicited disagreement. For panel B, many people responded three medications, but others (often physicians) counted only clindamycin and therefore responded one medication.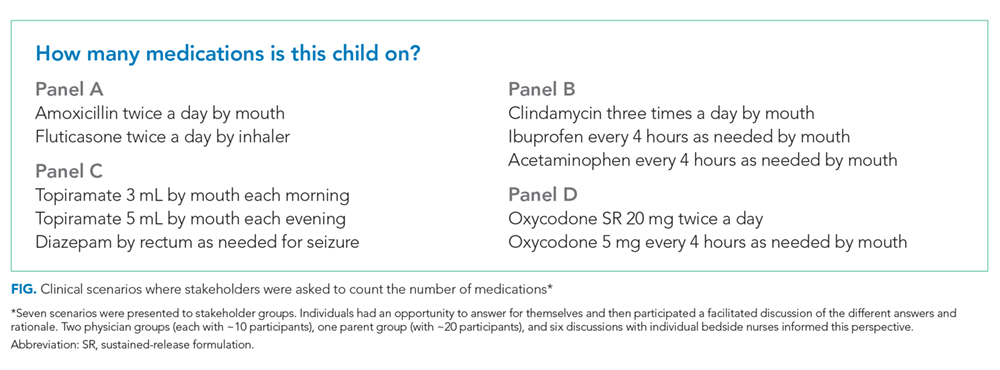
For panel C, stakeholders were split between one (only topiramate), two (topiramate and rectal diazepam), and three medications (two different doses of topiramate, which counted as two different medications, plus rectal diazepam). Interestingly, one parent reflected that they would count panel C differently, depending on with whom they were discussing the medications. If the parent were speaking with a physician, they would consider the two different doses of topiramate as a single medication; however, if they were conveying a list of medications to a babysitter, they would consider them as two different medications. Finally, panel D also split stakeholders between counting one and two medications, with some parents expressing confusion as to why the child would be prescribed the same medication at different times.
While our informal conversations with physicians, nurses, and families should not be construed as rigorous qualitative research, we are concerned about the lack of a shared mental model about the best way to count discharge polypharmacy. In reviewing the comments that we collected, the family voice stands out—physicians do not know how a parent or a caregiver will prioritize the medications to give to their child; physicians do not know whether families will count medications as a group or as separate entities. Although providers, patients, and families share a list of medications at discharge, this list may contain items not considered as “medications” by physicians.10 Nevertheless, the medication list provided at discharge is what the family must navigate once home. One way to consider discharge polypharmacy would be to count all the medications in the discharge summary, regardless of clinicians’ perceptions of necessity or importance. Electronic health record based tools should sum medications counts. Ultimately, further research is needed to understand the cognitive and care burden discharge polypharmacy places on families as well as understand this burden’s relationship to safety and transition outcomes.
Disclosures
Dr. Auger has nothing to disclose. Dr. Shah is the Editor-in-Chief of the Journal of Hospital Medicine. Dr. Davis has nothing to disclose. Dr. Brady reports grants from Agency for Healthcare Research and Quality, outside the submitted work.
Funding
This project is supported by a grant from the Agency for Healthcare Research and Quality (1K08HS204735-01A1).
1. Winer JC, Aragona E, Fields AI, Stockwell DC. Comparison of clinical risk factors among pediatric patients with single admission, multiple admissions (without any 7-day readmissions), and 7-day readmission. Hosp Pediatr. 2016;6(3):119-125. https://doi.org/10.1542/hpeds.2015-0110.
2. Feinstein J, Dai D, Zhong W, Freedman J, Feudtner C. Potential drug-drug interactions in infant, child, and adolescent patients in children’s hospitals. Pediatrics. 2015;135(1):e99-e108. https://doi.org/10.1542/peds.2014-2015.
3. Patterson SM, Cadogan CA, Kerse N, et al. Interventions to improve the appropriate use of polypharmacy for older people. Cochrane Database Syst Rev. 2014(10):CD008165. https://doi.org/10.1002/14651858.CD008165.pub3.
4. Society of Hospital Medicine. Project BOOST: better outcomes for older adults through safe transitions—implementation guide to improve care transitions.
5. Smith MD, Spiller HA, Casavant MJ, Chounthirath T, Brophy TJ, Xiang H. Out-of-hospital medication errors among young children in the United States, 2002-2012. Pediatrics. 2014;134(5):867-876. https://doi.org/10.1542/peds.2014-0309.
6. Baker C, Feinstein JA, Ma X, et al. Variation of the prevalence of pediatric polypharmacy: a scoping review. Pharmacoepidemiol Drug Saf. 2019;28(3):275-287. https://doi.org/10.1002/pds.4719.
7. Bakaki PM, Horace A, Dawson N, et al. Defining pediatric polypharmacy: a scoping review. PLoS One. 2018;13(11):e0208047. https://doi.org/10.1371/journal.pone.0208047.
8. Horace AE, Ahmed F. Polypharmacy in pediatric patients and opportunities for pharmacists’ involvement. Integr Pharm Res Pract. 2015;4:113-126. https://doi.org/10.2147/IPRP.S64535.
9. Masnoon N, Shakib S, Kalisch-Ellett L, Caughey GE. What is polypharmacy? A systematic review of definitions. BMC Geriatr. 2017;17(1):230. https://doi.org/10.1186/s12877-017-0621-2.
10. Auger KA, Shah SS, Huang B, et al. Discharge Medical Complexity, Change in Medical Complexity and Pediatric Thirty-day Readmission. J Hosp Med. 2019;14(8):474-481. https://doi.org/10.12788/jhm.3222.
11. Martin P, Tamblyn R, Benedetti A, Ahmed S, Tannenbaum C. Effect of a pharmacist-led educational intervention on inappropriate medication prescriptions in older adults: the D-PRESCRIBE randomized clinical trial. Jama. 2018;320(18):1889-1898. https://doi.org/10.1001/jama.2018.16131.
12. Page AT, Clifford RM, Potter K, Schwartz D, Etherton-Beer CD. The feasibility and effect of deprescribing in older adults on mortality and health: a systematic review and meta-analysis. Br J Clin Pharmacol. 2016;82(3):583-623. https://doi.org/10.1111/bcp.12975.
Polypharmacy, the practice of taking multiple medications to manage health conditions, is common for children. Many children today have a higher burden chronic illness and an increasing number of pharmaceuticals—often delivered in various doses throughout the day. Polypharmacy has been linked to a variety of pediatric and adult outcomes, including medication errors and readmission.1-3 Consequently, the Society of Hospital Medicine recognizes polypharmacy as a risk factor for readmission for adult populations.4 These adverse outcomes are related to both the human elements of polypharmacy (eg, cognitive burden, adherence) and the pharmacologic elements, including drug–drug interactions. For many children, the safety implications of polypharmacy may be more consequential due to the reliance of multiple caregivers to administer medications, which requires additional coordination to ensure that medications are administered and not duplicated. Dual administration of the same medication by both parents is the most common reason for pediatric calls to Poison Control Centers.5 Yet, there is a paucity of research in this area, with most of the pediatric literature focusing on the outpatient setting and specific populations, including epilepsy and mental health.6-8
How providers, patients, and families translate medication lists to counts of medications—and hence the burden of polypharmacy—is not clearly or consistently described. Often in studies of polypharmacy, researchers utilize medication claims data to count the number of medications a patient has filled from the pharmacy. However, in routine clinical practice, clinicians rarely have access to medication claims and thus rely on patient or family report, which may or may not match the list of medications in the patients’ medical records.
Therefore, linking polypharmacy research to the pragmatic complexities of clinical care requires greater clarity and consistent application of concepts. At hospital discharge, families receive a list of medications to take, including home medications to resume as well as newly prescribed medications. However, not all medications are equally essential to patients’ care regarding importance of administration (eg, hydrocortisone ointment versus an anticonvulsant medication). Patients, parents, and caregivers are ultimately responsible for determining which medications to prioritize and administer.
Although there is no standard numerical definition for how to identify polypharmacy, five medications is commonly considered the threshold for polypharmacy.9 A recent review of the pediatric polypharmacy literature suggested a lower threshold, with any two concurrent medications for at least a day.7 Yet, the best approach to “count” medications at hospital discharge is unclear. The simplest method is to tally the number of medications listed in the discharge summary. However, medications are sometimes listed twice due to different dosages administered at different times. Frequently, medications are prescribed on an as-needed basis; these medications could be administered routinely or very infrequently (eg, epinephrine for anaphylaxis). Over-the-counter medications are also sometimes included in discharge summaries and consideration should be given as to whether these medications count toward measures of polypharmacy. Over-the-counter medications would not be counted by a polypharmacy measure that relies on claims data if those medications are not paid by the insurer.
We sought consensus on how to count discharge medications through a series of informal interviews with hospitalists, nurses, and parents. We asked the seemingly simple question, “How many medications is this child on?” across a variety of scenarios (Figure). For panel A, all stakeholders agreed that this medication list includes two medications. All other scenarios elicited disagreement. For panel B, many people responded three medications, but others (often physicians) counted only clindamycin and therefore responded one medication.
For panel C, stakeholders were split between one (only topiramate), two (topiramate and rectal diazepam), and three medications (two different doses of topiramate, which counted as two different medications, plus rectal diazepam). Interestingly, one parent reflected that they would count panel C differently, depending on with whom they were discussing the medications. If the parent were speaking with a physician, they would consider the two different doses of topiramate as a single medication; however, if they were conveying a list of medications to a babysitter, they would consider them as two different medications. Finally, panel D also split stakeholders between counting one and two medications, with some parents expressing confusion as to why the child would be prescribed the same medication at different times.
While our informal conversations with physicians, nurses, and families should not be construed as rigorous qualitative research, we are concerned about the lack of a shared mental model about the best way to count discharge polypharmacy. In reviewing the comments that we collected, the family voice stands out—physicians do not know how a parent or a caregiver will prioritize the medications to give to their child; physicians do not know whether families will count medications as a group or as separate entities. Although providers, patients, and families share a list of medications at discharge, this list may contain items not considered as “medications” by physicians.10 Nevertheless, the medication list provided at discharge is what the family must navigate once home. One way to consider discharge polypharmacy would be to count all the medications in the discharge summary, regardless of clinicians’ perceptions of necessity or importance. Electronic health record based tools should sum medications counts. Ultimately, further research is needed to understand the cognitive and care burden discharge polypharmacy places on families as well as understand this burden’s relationship to safety and transition outcomes.
Disclosures
Dr. Auger has nothing to disclose. Dr. Shah is the Editor-in-Chief of the Journal of Hospital Medicine. Dr. Davis has nothing to disclose. Dr. Brady reports grants from Agency for Healthcare Research and Quality, outside the submitted work.
Funding
This project is supported by a grant from the Agency for Healthcare Research and Quality (1K08HS204735-01A1).
1. Winer JC, Aragona E, Fields AI, Stockwell DC. Comparison of clinical risk factors among pediatric patients with single admission, multiple admissions (without any 7-day readmissions), and 7-day readmission. Hosp Pediatr. 2016;6(3):119-125. https://doi.org/10.1542/hpeds.2015-0110.
2. Feinstein J, Dai D, Zhong W, Freedman J, Feudtner C. Potential drug-drug interactions in infant, child, and adolescent patients in children’s hospitals. Pediatrics. 2015;135(1):e99-e108. https://doi.org/10.1542/peds.2014-2015.
3. Patterson SM, Cadogan CA, Kerse N, et al. Interventions to improve the appropriate use of polypharmacy for older people. Cochrane Database Syst Rev. 2014(10):CD008165. https://doi.org/10.1002/14651858.CD008165.pub3.
4. Society of Hospital Medicine. Project BOOST: better outcomes for older adults through safe transitions—implementation guide to improve care transitions.
5. Smith MD, Spiller HA, Casavant MJ, Chounthirath T, Brophy TJ, Xiang H. Out-of-hospital medication errors among young children in the United States, 2002-2012. Pediatrics. 2014;134(5):867-876. https://doi.org/10.1542/peds.2014-0309.
6. Baker C, Feinstein JA, Ma X, et al. Variation of the prevalence of pediatric polypharmacy: a scoping review. Pharmacoepidemiol Drug Saf. 2019;28(3):275-287. https://doi.org/10.1002/pds.4719.
7. Bakaki PM, Horace A, Dawson N, et al. Defining pediatric polypharmacy: a scoping review. PLoS One. 2018;13(11):e0208047. https://doi.org/10.1371/journal.pone.0208047.
8. Horace AE, Ahmed F. Polypharmacy in pediatric patients and opportunities for pharmacists’ involvement. Integr Pharm Res Pract. 2015;4:113-126. https://doi.org/10.2147/IPRP.S64535.
9. Masnoon N, Shakib S, Kalisch-Ellett L, Caughey GE. What is polypharmacy? A systematic review of definitions. BMC Geriatr. 2017;17(1):230. https://doi.org/10.1186/s12877-017-0621-2.
10. Auger KA, Shah SS, Huang B, et al. Discharge Medical Complexity, Change in Medical Complexity and Pediatric Thirty-day Readmission. J Hosp Med. 2019;14(8):474-481. https://doi.org/10.12788/jhm.3222.
11. Martin P, Tamblyn R, Benedetti A, Ahmed S, Tannenbaum C. Effect of a pharmacist-led educational intervention on inappropriate medication prescriptions in older adults: the D-PRESCRIBE randomized clinical trial. Jama. 2018;320(18):1889-1898. https://doi.org/10.1001/jama.2018.16131.
12. Page AT, Clifford RM, Potter K, Schwartz D, Etherton-Beer CD. The feasibility and effect of deprescribing in older adults on mortality and health: a systematic review and meta-analysis. Br J Clin Pharmacol. 2016;82(3):583-623. https://doi.org/10.1111/bcp.12975.
© 2019 Society of Hospital Medicine
Discharge Medical Complexity, Change in Medical Complexity and Pediatric 30-day Readmission
Hospitalizations are disruptive, stressful, and costly for patients and families.1-5 Hospital readmissions subject families to the additional morbidity inherent to hospitalization and place patients at additional risk of hospital-acquired conditions or other harm.6-9 In pediatrics, hospital readmissions are common for specific conditions;10 with rates varying across institutions;10,11 and as many as one-third of unplanned pediatric readmissions are potentially preventable.12
Reducing pediatric readmissions requires a deeper understanding of the mechanisms through which readmissions occur. Medical complexity—specifically chronic conditions and use of medical technology—is associated with increased risk of readmission.13,14 Polypharmacy at discharge has also been associated with readmission.15,16 However, prior studies on polypharmacy and readmission risk examined the count of total medications and did not consider the nuances of scheduled versus as-needed medications, or the frequency of doses. These nuances may be critical to caregivers as discharge medical complexity can be overwhelming, even in diagnoses which are not traditionally considered complex.17 Finally, of potentially greater importance than medical complexity at discharge is a change in medical complexity during a hospitalization—for example, new diagnoses or new technologies that require additional education in hospital and management at home.
We sought to further understand the relationship between discharge medical complexity and readmission risk with regards to polypharmacy and home healthcare referrals at discharge. Specifically, we hypothesized that a change in medical complexity during an admission—ie, a new chronic diagnosis or new technology—would be a more prominent risk factor for readmission than discharge complexity alone. We examined these factors in the context of length of stay (LOS) since this is a marker of in-hospital severity of illness and a potentially modifiable function of time allowed for in-hospital teaching and discharge preparation.
METHODS
We conducted a retrospective, case-control study of pediatric hospitalizations at one tertiary care children’s hospital. Children <18 years were eligible for inclusion. Normal birth hospitalizations were excluded. We randomly selected one hospitalization from each child as the index visit. We identified cases, hospitalizations at C.S. Mott Children’s Hospital between 2008 and 2012 with a subsequent unplanned 30-day readmission,18 and matched them one to one with hospitalizations at the same hospital during the same period without subsequent readmission. We matched cases to controls based on the month of admission to account for seasonality of certain illnesses. We also matched on distance and direction from the hospital to the patient’s home to account for the potential to have readmissions to other institutions. We utilized both distance and direction recognizing that a family living 30 miles in one direction would be closer to an urban area with access to more facilities, as opposed to 30 miles in another direction in a rural area without additional access. We subsequently performed medical record review to abstract relevant covariates.
Primary Predictors
Medical Complexity Models (Models 1 and 2):
We evaluated three attributes of discharge medical complexity abstracted by medical record review—discharge medications, technology assistance (ie, tracheostomy, cerebral spinal fluid ventricular shunt, enteral feeding tube, central line), and the need for home healthcare after discharge. We counted discharge medications based on the number of medications listed on the discharge summary separated into scheduled or as needed.19 We also considered the number of scheduled doses to be administered in a 24-hour period (see Appendix methods for more information on counting discharge medications). For assistance by technology, we considered the presence of tracheostomy, cerebral spinal fluid ventricular shunt, enteral feeding tube, and central lines. While we describe these technologies separately, for multivariable analyses we considered the presence of any of the four types of technology.
Change in Medical Complexity Models (Models 3 and 4)
We examined two aspects of change in medical complexity—the presence of a new complex chronic condition (CCC)20 diagnosed during the hospitalization, and a new reliance on medical technology. The presence of new CCC was determined by comparing discharge diagnoses to past medical history abstracted by medical record review. A new CCC was defined as any complex chronic condition that was captured in the discharge diagnoses but was not evident in the past medical history. By definition, all CCCs coded during birth hospitalization (eg, at discharge from the neonatal intensive care unit) were assigned to “new” CCC. We calculated a kappa statistic to determine interrater reliability in determining the designation of new CCC. A sensitivity analysis examining these birth CCCs was also performed comparing no new CCC, new CCC, and new CCC after birth hospitalization. The methods appendix provides additional information on considering new CCCs. New technology, abstracted from chart review, was defined as technology placed during hospitalization that remained in place at discharge. If a child with existing technology had additional technology placed during the hospitalization (eg, a new tracheostomy in a child with a previously placed enteral feeding tube), the encounter was considered as having new technology placed.
Covariates
We created different sets of multivariable models to account for patient/hospitalization characteristics.
Statistical Analysis
A review of 600 cases and 600 controls yields 89% power to detect statistical significance for covariates with an odds ratio of 1.25 (β = 0.22) if the candidate covariate has low to moderate correlation with other covariates (<0.3). If a candidate covariate has a moderate correlation with other covariates (0.6), we have 89% power to detect an odds ratio of 1.35 (β = 0.30).21 We calculated odds of 30-days unplanned readmission using conditional logistic regression to account for matched case-control design. All the analyses were performed using STATA 13 (Stata Corp., College Station, Texas).
RESULTS
Of the 41,422 eligible index hospitalizations during the study period, 9.4% resulted in a 30-day unplanned readmission. After randomly selecting one hospitalization per child, there were 781 eligible cases. We subsequent matched all but one eligible case to a control. We randomly selected encounters for medical record review, reviewing a total of 1,212 encounters. After excluding pairs with incomplete records, we included 595 cases and 595 controls in this analysis (Figure). Patient/hospitalization characteristics are displayed in Table 1. The most frequent primary discharge diagnoses are displayed in Appendix Table 1.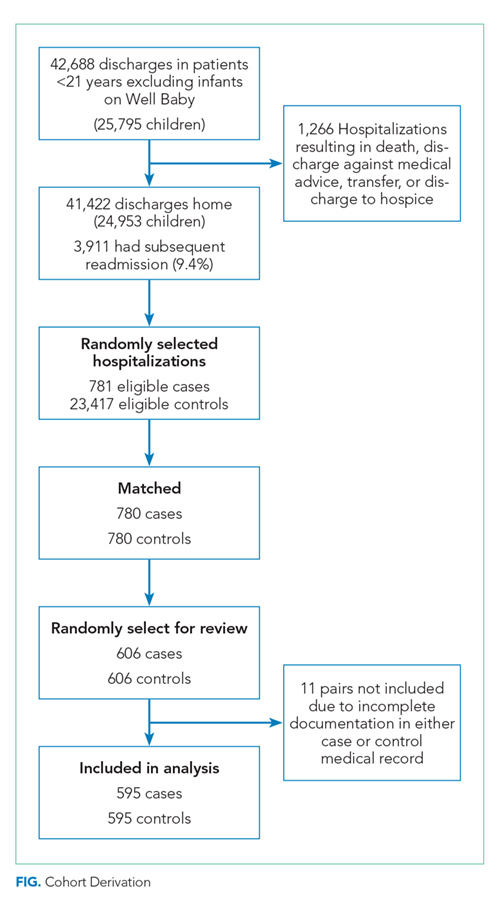
Models of Medical Complexity at Discharge
Polypharmacy after discharge was common for both readmitted and nonreadmitted patients. Children who experienced unplanned readmission in 30 days were discharged with a median of four different scheduled medications (interquartile range [IQR] 2,7) which translated into a median of six (IQR 3,12) scheduled doses in a 24-hour period. In comparison, children without an unplanned readmission had a median of two different scheduled medications (IQR 1,3) with a median of three (IQR 0,7) scheduled doses in a 24-hour period. Medical technology was more common in case children (42%) than in control children (14%). Central lines and enteral tubes were the most common forms of medical technology in both cases and controls. Home health referral was common in both cases (44%) and controls (23%; Table 1).
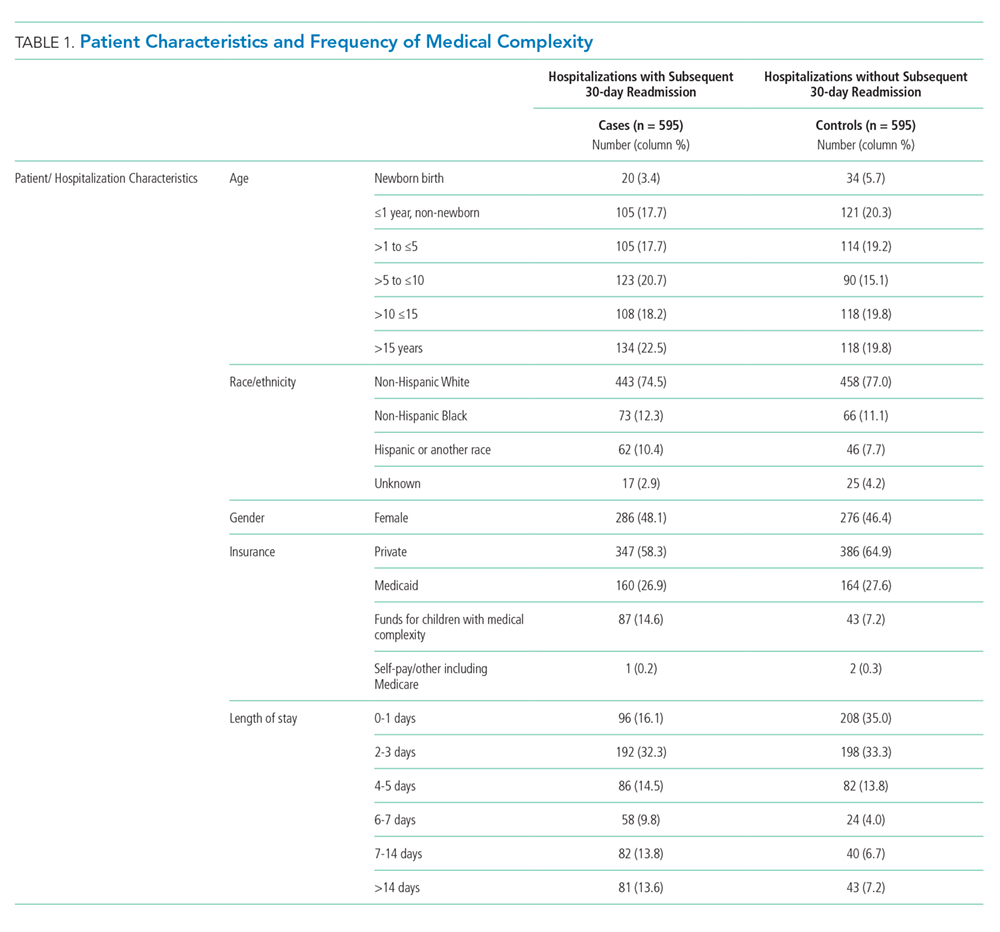
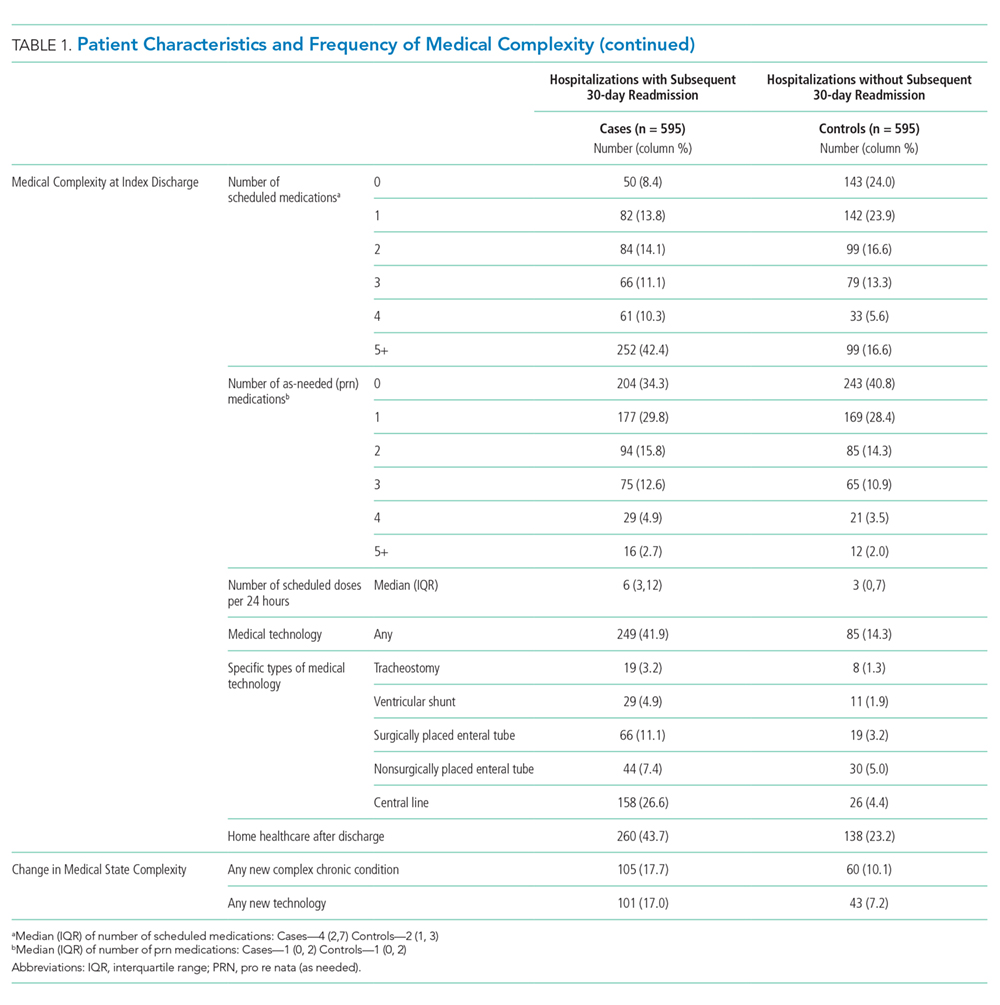
In Model 1 (adjusting only for patient characteristics; Table 3), being discharged on two or more scheduled medications was associated with higher odds of readmission compared to being discharged without medications, with additional medications associated with even higher odds of readmission. Children with any technology had higher odds of readmission than children without medical technology. Likewise, home healthcare visits after discharge were associated with elevated odds of readmission in multivariable analyses without LOS. However, after adding LOS to the model (Model 2), home healthcare visits were no longer significantly associated with readmission.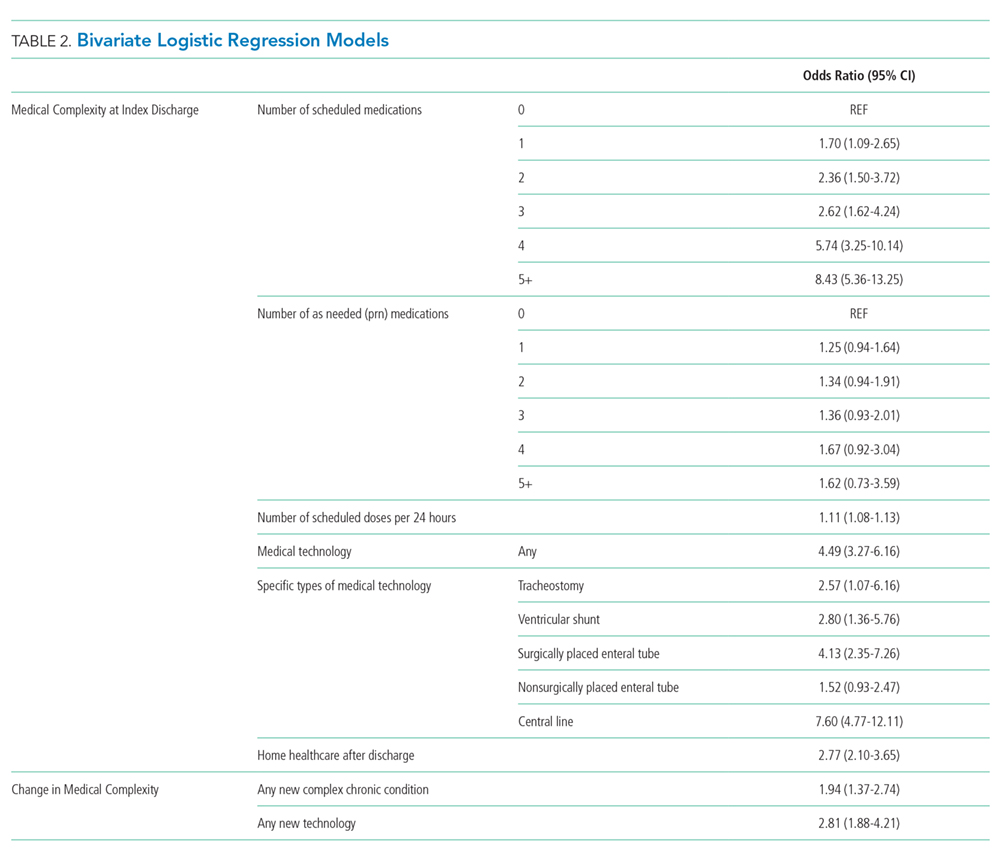
Change in Medical Complexity Models
The adjudication of new CCCs had good reliability (Κ = 0.72). New CCCs occurred in 18% and new technologies occurred in 17% of cases. Comparatively, new CCCs occurred in 10% and new technologies in 7% of hospitalizations in control children (Table 1). In bivariate analyses, both aspects of change in medical complexity were associated with higher odds of readmission (Table 2). In multivariate analysis with patient characteristics (Model 3; Table 3), all aspects of change in complexity were associated with elevated odds of readmission. A new CCC was associated with higher odds of readmission (adjusted OR (AOR) 1.75, 95% CI: 1.11-2.75) as was new technology during admission (AOR 1.84, 95%CI: 1.09-3.10). Furthermore, the odds of readmission for medical complexity variables (polypharmacy and home healthcare need) remained largely unchanged when adding the change in medical complexity variables (ie, comparing Model 1 and Model 3). However, when accounting for LOS (Model 4), neither the acquisition of a new CCC nor the addition of new technology was associated with readmission. The most common form of new technology was central line followed by nonsurgically placed enteral tube (Appendix Table 2). Finally, in sensitivity analyses (results not detailed), separating new CCC acquired at birth and new CCCs in nonbirth hospitalizations, compared to hospitalizations with no new CCC, yielded similar results as the primary analyses.
DISCUSSION
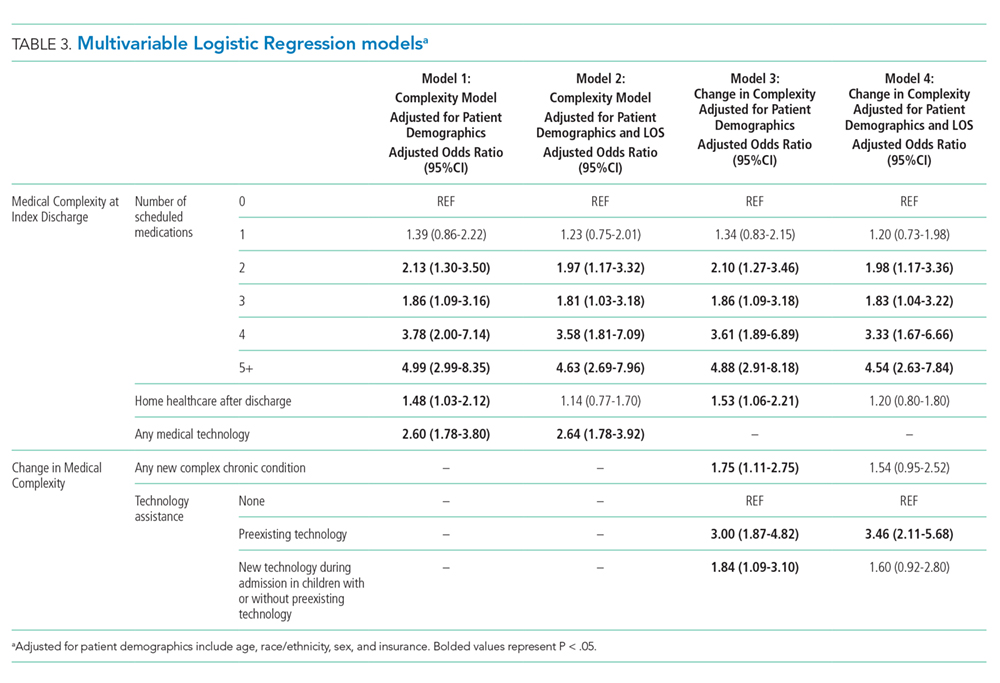
We examined multiple attributes of polypharmacy—the number of scheduled medications, number of as-needed medications, and number of scheduled doses per 24 hours. Interestingly, only the scheduled medications (count of medication and number of doses) were associated with elevated readmission risk. As-needed medications have heterogeneity in the level of importance from critical (eg, seizure rescue) to discretionary (eg, antipyretics, creams). The burden of managing these types of medications may still be high (ie, parents must decide when to administer a critical medication); however, this burden does not translate into increased readmission risk in this population.
Not surprisingly, greater medical complexity—as defined by higher numbers of scheduled discharge medications and technology assistance—is associated with 30-day readmission risk. Our analyses do not allow us to determine how much of the increased risk is due to additional care burden and risks of polypharmacy versus the inherent increase in complexity and severity of illness for which polypharmacy is a marker. Tailoring discharge regimens to the realities of daily life, with the goal of “minimally disruptive medicine”22,23 (eg, integrating manageable discharge medication routines into school and work schedules), is not a common feature of pediatric discharge planning. For adult patients with complex medical conditions, tailoring medication regimens in a minimally disruptive way is known to improve outcomes.24 Similarly, adopting minimally disruptive techniques to integrate the polypharmacy inherent in discharge could potentially mitigate some of the readmission risks for children and adolescents.
Contrary to our hypothesis, new technologies and new diagnoses did not confer additional readmission risk when accounting for LOS and patient characteristics. One potential explanation is varying risks conveyed by different types of new technologies placed during hospitalization. Central lines, the most common form of new technology, is associated with higher odds of reutilization in unadjusted analyses. However, the second most common form of new technology, nonsurgically placed enteral feeding tube, was not. Further analyses of the differential effects of new technology should be further examined in larger datasets. Additionally, the lack of additional readmission risk from new technology may relate to additional teaching and support provided to families of patients undergoing unfamiliar procedures offsets the risks inherent of greater complexity. If so, it may be that the more intensive teaching and postdischarge support provided to families with new technology or a new diagnosis could be replicated through refresher teaching during hospitalizations, when a patient’s state of health is status quo for the family (ie, the child was admitted and discharged with the same technology and diagnoses). This notion is supported by prior work that demonstrated successful readmission reduction interventions for children with chronic conditions often rely on enhanced education or coaching.25,26
We elected to present models both with and without LOS as a confounder because it is a potentially modifiable attribute of hospitalization. Change in medical complexity aspects were significantly associated with readmission in multivariable models without LOS. However, with the addition of LOS, they were no longer significant. Thus, the readmission risk of new complexity is accounted for by the readmission risk inherent in a longer LOS. This finding prompts additional questions that merit further study: is it that LOS is a general marker for heightened complexity, or is it that a longer LOS can modify readmission risk through additional in-hospital care and time for enhanced education?
Our study has several strengths. We were able to discern true complexity at the time of discharge through medical record review. For example, if a child had a peripherally inserted central catheter placed during hospitalization, it cannot be ascertained through administrative data without medical record review if the technology was removed or in place at discharge. Likewise, medical record review allows for identification of medical technology which is not surgically implanted (eg, nasogastric feeding tubes). Given the “fog” families report as part of their in-hospital experience and its threats to education and postdischarge contingency planning,17 we felt it important to evaluate medical technology regardless of whether or not it was surgically placed. Additionally, the more detailed and nuanced understanding gained of polypharmacy burden can better inform both risk prediction models and interventions to improve the transition from hospital to home.
This study
CONCLUSION
Medical complexity at discharge is associated with pediatric readmission risk. Contrary to our hypothesis, the addition of new technologies and new CCC diagnoses are not associated with pediatric readmission, after accounting for patient and hospitalization factors including LOS. The dynamics of LOS as a risk factor for readmission for children with medical complexity are likely multifaceted and merit further investigation in a multi-institutional study.
Disclosures
The authors report no potential conflicts of interest.
Funding
This work was supported by a grant from the Agency for Healthcare Research and Quality (1K08HS204735-01A1) and a grant from the Blue Cross Blue Shield of Michigan Foundation.
1. Diaz-Caneja A, Gledhill J, Weaver T, Nadel S, Garralda E. A child’s admission to hospital: a qualitative study examining the experiences of parents. Intensive Care Med. 2005;31(9):1248-1254. https://doi.org/10.1007/s00134-005-2728-8.
2. Lapillonne A, Regnault A, Gournay V, et al. Impact on parents of bronchiolitis hospitalization of full-term, preterm and congenital heart disease infants. BMC Pediatrics. 2012;12:171. https://doi.org/10.1186/1471-2431-12-171.
3. Leader S, Jacobson P, Marcin J, Vardis R, Sorrentino M, Murray D. A method for identifying the financial burden of hospitalized infants on families. Value Health. 2002;5(1):55-59. https://doi.org/10.1046/j.1524-4733.2002.51076.x.
4. Leidy NK, Margolis MK, Marcin JP, et al. The impact of severe respiratory syncytial virus on the child, caregiver, and family during hospitalization and recovery. Pediatrics. 2005;115(6):1536-1546. https://doi.org/10.1542/peds.2004-1149.
5. Rennick JE, Johnston CC, Dougherty G, Platt R, Ritchie JA. Children’s psychological responses after critical illness and exposure to invasive technology. J Dev Behav Pediatr. 2002;23(3):133-144. PubMed
6. Brennan TA, Leape LL, Laird NM, et al. Incidence of adverse events and negligence in hospitalized patients. Results of the Harvard Medical Practice Study I. N Engl J Med. 1991;324(6):370-376. https://doi.org/10.1056/NEJM199102073240604.
7. Kohn LT, Corrigan J, Donaldson MS. To err is human: building a safer health system. Washington DC: National Academy Press; 2000.
8. Landrigan CP, Parry GJ, Bones CB, Hackbarth AD, Goldmann DA, Sharek PJ. Temporal trends in rates of patient harm resulting from medical care. N Engl J Med. 2010;363(22):2124-2134. https://doi.org/10.1056/NEJMsa1004404.
9. Magill SS, Edwards JR, Bamberg W, et al. Multistate point-prevalence survey of healthcare-associated infections. N Engl J Med. 2014;370(13):1198-1208. https://doi.org/10.1056/NEJMoa1306801.
10. Berry JG, Toomey SL, Zaslavsky AM, et al. Pediatric readmission prevalence and variability across hospitals. JAMA. 2013;309(4):372-380. https://doi.org/10.1001/jama.2012.188351.
11. Bardach NS, Vittinghoff E, Asteria-Penaloza R, et al. Measuring hospital quality using pediatric readmission and revisit rates. Pediatrics. 2013;132(3):429-436. https://doi.org/10.1542/peds.2012-3527.
12. Toomey SL, Peltz A, Loren S, et al. Potentially preventable 30-day hospital readmissions at a children’s hospital. Pediatrics. 2016;138(2):pii: e20154182. https://doi.org/10.1542/peds.2015-4182.
13. Bucholz EM, Gay JC, Hall M, Harris M, Berry JG. Timing and causes of common pediatric readmissions. J Pediatr. 2018;200:240-248. https://doi.org/10.1016/j.jpeds.2018.04.044.
14. Berry JG, Hall DE, Kuo DZ, et al. Hospital utilization and characteristics of patients experiencing recurrent readmissions within children’s hospitals. JAMA. 2011;305(7):682-690. https://doi.org/10.1001/jama.2011.122.
15. Winer JC, Aragona E, Fields AI, Stockwell DC. Comparison of clinical risk factors among pediatric patients with single admission, multiple admissions (without any 7-day readmissions), and 7-day readmission. Hosp Pediatr. 2016;6(3):119-125. https://doi.org/10.1542/hpeds.2015-0110.
16. Brittan MS, Martin S, Anderson L, Moss A, Torok MR. An electronic health record tool designed to improve pediatric hospital discharge has low predictive utility for readmissions. J Hosp Med. 2018;13(11):779-782. https://doi.org/10.12788/jhm.3043.
17. Solan LG, Beck AF, Brunswick SA, et al. The family perspective on hospital to home transitions: a qualitative study. Pediatrics. 2015;136(6):e1539-e1549. https://doi.org/10.1542/peds.2015-2098.
18. Auger KA, Mueller EL, Weinberg SH, et al. A validated method for identifying unplanned pediatric readmission. J Pediatr. 2016;170:105-112. https://doi.org/10.1016/j.jpeds.2015.11.051.
19. Auger KA, Shah SS, Davis MD, Brady PW. Counting the Ways to Count Medications: The Challenges of Defining Pediatric Polypharmacy. J Hosp Med. 2019;14(8):506-507. https://doi.org/10.12788/jhm.3213.
20. Feudtner C, Feinstein JA, Zhong W, Hall M, Dai D. Pediatric complex chronic conditions classification system version 2: updated for ICD-10 and complex medical technology dependence and transplantation. BMC Pediatrics. 2014;14:199. https://doi.org/10.1186/1471-2431-14-199.
21. Hsieh FY. Sample size tables for logistic regression. Stat Med. 1989;8(7):795-802. https://doi.org/10.1002/sim.4780080704.
22. May C, Montori VM, Mair FS. We need minimally disruptive medicine. BMJ. 2009;339:b2803. https://doi.org/10.1136/bmj.b2803.
23. Leppin AL, Montori VM, Gionfriddo MR. Minimally disruptive medicine: a pragmatically comprehensive model for delivering care to patients with multiple chronic conditions. Healthcare (Basel). 2015;3(1):50-63. https://doi.org/10.3390/healthcare3010050.
24. Serrano V, Spencer-Bonilla G, Boehmer KR, Montori VM. Minimally disruptive medicine for patients with diabetes. Curr Diab Rep. 2017;17(11):104. https://doi.org/10.1007/s11892-017-0935-7.
25. Auger KA, Kenyon CC, Feudtner C, Davis MM. Pediatric hospital discharge interventions to reduce subsequent utilization: a systematic review. J Hosp Med. 2013;9(4):251-260. https://doi.org/10.1002/jhm.2134.
26. Coller RJ, Klitzner TS, Lerner CF, et al. Complex care hospital use and postdischarge coaching: a randomized controlled trial. Pediatrics. 2018;142(2):pii: e20174278. https://doi.org/10.1542/peds.2017-4278.
27. Hain PD, Gay JC, Berutti TW, Whitney GM, Wang W, Saville BR. Preventability of early readmissions at a children’s hospital. Pediatrics. 2013;131(1):e171-e181. https://doi.org/10.1542/peds.2012-0820.
28. Auger KA, Teufel RJ, 2nd, Harris JM, 2nd, et al. Children’s hospital characteristics and readmission metrics. Pediatrics. 2017;139(2). https://doi.org/10.1542/peds.2016-1720.
29. Gay JC, Agrawal R, Auger KA, et al. Rates and impact of potentially preventable readmissions at children’s hospitals. J Pediatr. 2015;166(3):613-619 e615. https://doi.org/10.1016/j.jpeds.2014.10.052.
Hospitalizations are disruptive, stressful, and costly for patients and families.1-5 Hospital readmissions subject families to the additional morbidity inherent to hospitalization and place patients at additional risk of hospital-acquired conditions or other harm.6-9 In pediatrics, hospital readmissions are common for specific conditions;10 with rates varying across institutions;10,11 and as many as one-third of unplanned pediatric readmissions are potentially preventable.12
Reducing pediatric readmissions requires a deeper understanding of the mechanisms through which readmissions occur. Medical complexity—specifically chronic conditions and use of medical technology—is associated with increased risk of readmission.13,14 Polypharmacy at discharge has also been associated with readmission.15,16 However, prior studies on polypharmacy and readmission risk examined the count of total medications and did not consider the nuances of scheduled versus as-needed medications, or the frequency of doses. These nuances may be critical to caregivers as discharge medical complexity can be overwhelming, even in diagnoses which are not traditionally considered complex.17 Finally, of potentially greater importance than medical complexity at discharge is a change in medical complexity during a hospitalization—for example, new diagnoses or new technologies that require additional education in hospital and management at home.
We sought to further understand the relationship between discharge medical complexity and readmission risk with regards to polypharmacy and home healthcare referrals at discharge. Specifically, we hypothesized that a change in medical complexity during an admission—ie, a new chronic diagnosis or new technology—would be a more prominent risk factor for readmission than discharge complexity alone. We examined these factors in the context of length of stay (LOS) since this is a marker of in-hospital severity of illness and a potentially modifiable function of time allowed for in-hospital teaching and discharge preparation.
METHODS
We conducted a retrospective, case-control study of pediatric hospitalizations at one tertiary care children’s hospital. Children <18 years were eligible for inclusion. Normal birth hospitalizations were excluded. We randomly selected one hospitalization from each child as the index visit. We identified cases, hospitalizations at C.S. Mott Children’s Hospital between 2008 and 2012 with a subsequent unplanned 30-day readmission,18 and matched them one to one with hospitalizations at the same hospital during the same period without subsequent readmission. We matched cases to controls based on the month of admission to account for seasonality of certain illnesses. We also matched on distance and direction from the hospital to the patient’s home to account for the potential to have readmissions to other institutions. We utilized both distance and direction recognizing that a family living 30 miles in one direction would be closer to an urban area with access to more facilities, as opposed to 30 miles in another direction in a rural area without additional access. We subsequently performed medical record review to abstract relevant covariates.
Primary Predictors
Medical Complexity Models (Models 1 and 2):
We evaluated three attributes of discharge medical complexity abstracted by medical record review—discharge medications, technology assistance (ie, tracheostomy, cerebral spinal fluid ventricular shunt, enteral feeding tube, central line), and the need for home healthcare after discharge. We counted discharge medications based on the number of medications listed on the discharge summary separated into scheduled or as needed.19 We also considered the number of scheduled doses to be administered in a 24-hour period (see Appendix methods for more information on counting discharge medications). For assistance by technology, we considered the presence of tracheostomy, cerebral spinal fluid ventricular shunt, enteral feeding tube, and central lines. While we describe these technologies separately, for multivariable analyses we considered the presence of any of the four types of technology.
Change in Medical Complexity Models (Models 3 and 4)
We examined two aspects of change in medical complexity—the presence of a new complex chronic condition (CCC)20 diagnosed during the hospitalization, and a new reliance on medical technology. The presence of new CCC was determined by comparing discharge diagnoses to past medical history abstracted by medical record review. A new CCC was defined as any complex chronic condition that was captured in the discharge diagnoses but was not evident in the past medical history. By definition, all CCCs coded during birth hospitalization (eg, at discharge from the neonatal intensive care unit) were assigned to “new” CCC. We calculated a kappa statistic to determine interrater reliability in determining the designation of new CCC. A sensitivity analysis examining these birth CCCs was also performed comparing no new CCC, new CCC, and new CCC after birth hospitalization. The methods appendix provides additional information on considering new CCCs. New technology, abstracted from chart review, was defined as technology placed during hospitalization that remained in place at discharge. If a child with existing technology had additional technology placed during the hospitalization (eg, a new tracheostomy in a child with a previously placed enteral feeding tube), the encounter was considered as having new technology placed.
Covariates
We created different sets of multivariable models to account for patient/hospitalization characteristics.
Statistical Analysis
A review of 600 cases and 600 controls yields 89% power to detect statistical significance for covariates with an odds ratio of 1.25 (β = 0.22) if the candidate covariate has low to moderate correlation with other covariates (<0.3). If a candidate covariate has a moderate correlation with other covariates (0.6), we have 89% power to detect an odds ratio of 1.35 (β = 0.30).21 We calculated odds of 30-days unplanned readmission using conditional logistic regression to account for matched case-control design. All the analyses were performed using STATA 13 (Stata Corp., College Station, Texas).
RESULTS
Of the 41,422 eligible index hospitalizations during the study period, 9.4% resulted in a 30-day unplanned readmission. After randomly selecting one hospitalization per child, there were 781 eligible cases. We subsequent matched all but one eligible case to a control. We randomly selected encounters for medical record review, reviewing a total of 1,212 encounters. After excluding pairs with incomplete records, we included 595 cases and 595 controls in this analysis (Figure). Patient/hospitalization characteristics are displayed in Table 1. The most frequent primary discharge diagnoses are displayed in Appendix Table 1.
Models of Medical Complexity at Discharge
Polypharmacy after discharge was common for both readmitted and nonreadmitted patients. Children who experienced unplanned readmission in 30 days were discharged with a median of four different scheduled medications (interquartile range [IQR] 2,7) which translated into a median of six (IQR 3,12) scheduled doses in a 24-hour period. In comparison, children without an unplanned readmission had a median of two different scheduled medications (IQR 1,3) with a median of three (IQR 0,7) scheduled doses in a 24-hour period. Medical technology was more common in case children (42%) than in control children (14%). Central lines and enteral tubes were the most common forms of medical technology in both cases and controls. Home health referral was common in both cases (44%) and controls (23%; Table 1).
In Model 1 (adjusting only for patient characteristics; Table 3), being discharged on two or more scheduled medications was associated with higher odds of readmission compared to being discharged without medications, with additional medications associated with even higher odds of readmission. Children with any technology had higher odds of readmission than children without medical technology. Likewise, home healthcare visits after discharge were associated with elevated odds of readmission in multivariable analyses without LOS. However, after adding LOS to the model (Model 2), home healthcare visits were no longer significantly associated with readmission.
Change in Medical Complexity Models
The adjudication of new CCCs had good reliability (Κ = 0.72). New CCCs occurred in 18% and new technologies occurred in 17% of cases. Comparatively, new CCCs occurred in 10% and new technologies in 7% of hospitalizations in control children (Table 1). In bivariate analyses, both aspects of change in medical complexity were associated with higher odds of readmission (Table 2). In multivariate analysis with patient characteristics (Model 3; Table 3), all aspects of change in complexity were associated with elevated odds of readmission. A new CCC was associated with higher odds of readmission (adjusted OR (AOR) 1.75, 95% CI: 1.11-2.75) as was new technology during admission (AOR 1.84, 95%CI: 1.09-3.10). Furthermore, the odds of readmission for medical complexity variables (polypharmacy and home healthcare need) remained largely unchanged when adding the change in medical complexity variables (ie, comparing Model 1 and Model 3). However, when accounting for LOS (Model 4), neither the acquisition of a new CCC nor the addition of new technology was associated with readmission. The most common form of new technology was central line followed by nonsurgically placed enteral tube (Appendix Table 2). Finally, in sensitivity analyses (results not detailed), separating new CCC acquired at birth and new CCCs in nonbirth hospitalizations, compared to hospitalizations with no new CCC, yielded similar results as the primary analyses.
DISCUSSION
We examined multiple attributes of polypharmacy—the number of scheduled medications, number of as-needed medications, and number of scheduled doses per 24 hours. Interestingly, only the scheduled medications (count of medication and number of doses) were associated with elevated readmission risk. As-needed medications have heterogeneity in the level of importance from critical (eg, seizure rescue) to discretionary (eg, antipyretics, creams). The burden of managing these types of medications may still be high (ie, parents must decide when to administer a critical medication); however, this burden does not translate into increased readmission risk in this population.
Not surprisingly, greater medical complexity—as defined by higher numbers of scheduled discharge medications and technology assistance—is associated with 30-day readmission risk. Our analyses do not allow us to determine how much of the increased risk is due to additional care burden and risks of polypharmacy versus the inherent increase in complexity and severity of illness for which polypharmacy is a marker. Tailoring discharge regimens to the realities of daily life, with the goal of “minimally disruptive medicine”22,23 (eg, integrating manageable discharge medication routines into school and work schedules), is not a common feature of pediatric discharge planning. For adult patients with complex medical conditions, tailoring medication regimens in a minimally disruptive way is known to improve outcomes.24 Similarly, adopting minimally disruptive techniques to integrate the polypharmacy inherent in discharge could potentially mitigate some of the readmission risks for children and adolescents.
Contrary to our hypothesis, new technologies and new diagnoses did not confer additional readmission risk when accounting for LOS and patient characteristics. One potential explanation is varying risks conveyed by different types of new technologies placed during hospitalization. Central lines, the most common form of new technology, is associated with higher odds of reutilization in unadjusted analyses. However, the second most common form of new technology, nonsurgically placed enteral feeding tube, was not. Further analyses of the differential effects of new technology should be further examined in larger datasets. Additionally, the lack of additional readmission risk from new technology may relate to additional teaching and support provided to families of patients undergoing unfamiliar procedures offsets the risks inherent of greater complexity. If so, it may be that the more intensive teaching and postdischarge support provided to families with new technology or a new diagnosis could be replicated through refresher teaching during hospitalizations, when a patient’s state of health is status quo for the family (ie, the child was admitted and discharged with the same technology and diagnoses). This notion is supported by prior work that demonstrated successful readmission reduction interventions for children with chronic conditions often rely on enhanced education or coaching.25,26
We elected to present models both with and without LOS as a confounder because it is a potentially modifiable attribute of hospitalization. Change in medical complexity aspects were significantly associated with readmission in multivariable models without LOS. However, with the addition of LOS, they were no longer significant. Thus, the readmission risk of new complexity is accounted for by the readmission risk inherent in a longer LOS. This finding prompts additional questions that merit further study: is it that LOS is a general marker for heightened complexity, or is it that a longer LOS can modify readmission risk through additional in-hospital care and time for enhanced education?
Our study has several strengths. We were able to discern true complexity at the time of discharge through medical record review. For example, if a child had a peripherally inserted central catheter placed during hospitalization, it cannot be ascertained through administrative data without medical record review if the technology was removed or in place at discharge. Likewise, medical record review allows for identification of medical technology which is not surgically implanted (eg, nasogastric feeding tubes). Given the “fog” families report as part of their in-hospital experience and its threats to education and postdischarge contingency planning,17 we felt it important to evaluate medical technology regardless of whether or not it was surgically placed. Additionally, the more detailed and nuanced understanding gained of polypharmacy burden can better inform both risk prediction models and interventions to improve the transition from hospital to home.
This study
CONCLUSION
Medical complexity at discharge is associated with pediatric readmission risk. Contrary to our hypothesis, the addition of new technologies and new CCC diagnoses are not associated with pediatric readmission, after accounting for patient and hospitalization factors including LOS. The dynamics of LOS as a risk factor for readmission for children with medical complexity are likely multifaceted and merit further investigation in a multi-institutional study.
Disclosures
The authors report no potential conflicts of interest.
Funding
This work was supported by a grant from the Agency for Healthcare Research and Quality (1K08HS204735-01A1) and a grant from the Blue Cross Blue Shield of Michigan Foundation.
1. Diaz-Caneja A, Gledhill J, Weaver T, Nadel S, Garralda E. A child’s admission to hospital: a qualitative study examining the experiences of parents. Intensive Care Med. 2005;31(9):1248-1254. https://doi.org/10.1007/s00134-005-2728-8.
2. Lapillonne A, Regnault A, Gournay V, et al. Impact on parents of bronchiolitis hospitalization of full-term, preterm and congenital heart disease infants. BMC Pediatrics. 2012;12:171. https://doi.org/10.1186/1471-2431-12-171.
3. Leader S, Jacobson P, Marcin J, Vardis R, Sorrentino M, Murray D. A method for identifying the financial burden of hospitalized infants on families. Value Health. 2002;5(1):55-59. https://doi.org/10.1046/j.1524-4733.2002.51076.x.
4. Leidy NK, Margolis MK, Marcin JP, et al. The impact of severe respiratory syncytial virus on the child, caregiver, and family during hospitalization and recovery. Pediatrics. 2005;115(6):1536-1546. https://doi.org/10.1542/peds.2004-1149.
5. Rennick JE, Johnston CC, Dougherty G, Platt R, Ritchie JA. Children’s psychological responses after critical illness and exposure to invasive technology. J Dev Behav Pediatr. 2002;23(3):133-144. PubMed
6. Brennan TA, Leape LL, Laird NM, et al. Incidence of adverse events and negligence in hospitalized patients. Results of the Harvard Medical Practice Study I. N Engl J Med. 1991;324(6):370-376. https://doi.org/10.1056/NEJM199102073240604.
7. Kohn LT, Corrigan J, Donaldson MS. To err is human: building a safer health system. Washington DC: National Academy Press; 2000.
8. Landrigan CP, Parry GJ, Bones CB, Hackbarth AD, Goldmann DA, Sharek PJ. Temporal trends in rates of patient harm resulting from medical care. N Engl J Med. 2010;363(22):2124-2134. https://doi.org/10.1056/NEJMsa1004404.
9. Magill SS, Edwards JR, Bamberg W, et al. Multistate point-prevalence survey of healthcare-associated infections. N Engl J Med. 2014;370(13):1198-1208. https://doi.org/10.1056/NEJMoa1306801.
10. Berry JG, Toomey SL, Zaslavsky AM, et al. Pediatric readmission prevalence and variability across hospitals. JAMA. 2013;309(4):372-380. https://doi.org/10.1001/jama.2012.188351.
11. Bardach NS, Vittinghoff E, Asteria-Penaloza R, et al. Measuring hospital quality using pediatric readmission and revisit rates. Pediatrics. 2013;132(3):429-436. https://doi.org/10.1542/peds.2012-3527.
12. Toomey SL, Peltz A, Loren S, et al. Potentially preventable 30-day hospital readmissions at a children’s hospital. Pediatrics. 2016;138(2):pii: e20154182. https://doi.org/10.1542/peds.2015-4182.
13. Bucholz EM, Gay JC, Hall M, Harris M, Berry JG. Timing and causes of common pediatric readmissions. J Pediatr. 2018;200:240-248. https://doi.org/10.1016/j.jpeds.2018.04.044.
14. Berry JG, Hall DE, Kuo DZ, et al. Hospital utilization and characteristics of patients experiencing recurrent readmissions within children’s hospitals. JAMA. 2011;305(7):682-690. https://doi.org/10.1001/jama.2011.122.
15. Winer JC, Aragona E, Fields AI, Stockwell DC. Comparison of clinical risk factors among pediatric patients with single admission, multiple admissions (without any 7-day readmissions), and 7-day readmission. Hosp Pediatr. 2016;6(3):119-125. https://doi.org/10.1542/hpeds.2015-0110.
16. Brittan MS, Martin S, Anderson L, Moss A, Torok MR. An electronic health record tool designed to improve pediatric hospital discharge has low predictive utility for readmissions. J Hosp Med. 2018;13(11):779-782. https://doi.org/10.12788/jhm.3043.
17. Solan LG, Beck AF, Brunswick SA, et al. The family perspective on hospital to home transitions: a qualitative study. Pediatrics. 2015;136(6):e1539-e1549. https://doi.org/10.1542/peds.2015-2098.
18. Auger KA, Mueller EL, Weinberg SH, et al. A validated method for identifying unplanned pediatric readmission. J Pediatr. 2016;170:105-112. https://doi.org/10.1016/j.jpeds.2015.11.051.
19. Auger KA, Shah SS, Davis MD, Brady PW. Counting the Ways to Count Medications: The Challenges of Defining Pediatric Polypharmacy. J Hosp Med. 2019;14(8):506-507. https://doi.org/10.12788/jhm.3213.
20. Feudtner C, Feinstein JA, Zhong W, Hall M, Dai D. Pediatric complex chronic conditions classification system version 2: updated for ICD-10 and complex medical technology dependence and transplantation. BMC Pediatrics. 2014;14:199. https://doi.org/10.1186/1471-2431-14-199.
21. Hsieh FY. Sample size tables for logistic regression. Stat Med. 1989;8(7):795-802. https://doi.org/10.1002/sim.4780080704.
22. May C, Montori VM, Mair FS. We need minimally disruptive medicine. BMJ. 2009;339:b2803. https://doi.org/10.1136/bmj.b2803.
23. Leppin AL, Montori VM, Gionfriddo MR. Minimally disruptive medicine: a pragmatically comprehensive model for delivering care to patients with multiple chronic conditions. Healthcare (Basel). 2015;3(1):50-63. https://doi.org/10.3390/healthcare3010050.
24. Serrano V, Spencer-Bonilla G, Boehmer KR, Montori VM. Minimally disruptive medicine for patients with diabetes. Curr Diab Rep. 2017;17(11):104. https://doi.org/10.1007/s11892-017-0935-7.
25. Auger KA, Kenyon CC, Feudtner C, Davis MM. Pediatric hospital discharge interventions to reduce subsequent utilization: a systematic review. J Hosp Med. 2013;9(4):251-260. https://doi.org/10.1002/jhm.2134.
26. Coller RJ, Klitzner TS, Lerner CF, et al. Complex care hospital use and postdischarge coaching: a randomized controlled trial. Pediatrics. 2018;142(2):pii: e20174278. https://doi.org/10.1542/peds.2017-4278.
27. Hain PD, Gay JC, Berutti TW, Whitney GM, Wang W, Saville BR. Preventability of early readmissions at a children’s hospital. Pediatrics. 2013;131(1):e171-e181. https://doi.org/10.1542/peds.2012-0820.
28. Auger KA, Teufel RJ, 2nd, Harris JM, 2nd, et al. Children’s hospital characteristics and readmission metrics. Pediatrics. 2017;139(2). https://doi.org/10.1542/peds.2016-1720.
29. Gay JC, Agrawal R, Auger KA, et al. Rates and impact of potentially preventable readmissions at children’s hospitals. J Pediatr. 2015;166(3):613-619 e615. https://doi.org/10.1016/j.jpeds.2014.10.052.
© 2019 Society of Hospital Medicine
Progress (?) Toward Reducing Pediatric Readmissions
Readmission rates have been used by payers to administer financial incentives or penalties to hospitals as a measure of quality. The Centers for Medicare and Medicaid Services (CMS) reduces payments to hospitals with excess readmissions for adult Medicare patients.1 Although the Medicare readmission penalties do not apply to children, several state Medicaid agencies have adopted policies to reduce reimbursement for hospitals with higher than expected readmission rates. These Medicaid programs often use potentially preventable readmission (PPR) rates calculated with proprietary software.2 As a result of these incentives and with a goal of improving care, many children’s hospitals have focused on reducing readmissions through participation in local, regional, and national collaboratives.3
Rates of unplanned readmissions in children are lower than in older adults, with all-cause 30-day pediatric readmission rates around 13%.4-7 Even so, as many as 30% of pediatric readmissions may be potentially preventable, with the most common transition failure involving a hospital factor, such as failure to recognize worsening clinical status prior to discharge.8 While readmission metrics are often judged across peer institutions, little is known about national trends over time. Therefore, we sought to examine readmission rates at children’s hospitals over a six-year timeframe to determine if progress has been made toward reducing readmissions.
METHODS
We utilized data from the Children’s Hospital Association Inpatient Essentials Database and included index hospitalizations from January 1, 2010 through June 30, 2016. This database contains demographic information, diagnosis and procedure codes, and All-Patient Refined Diagnosis-Related Groups (APR-DRGs; 3M Health Information Systems) to describe the principal reason for each hospitalization.9 We included 66 hospitals from 31 states plus the District of Columbia with complete data during the study period.
Seven-day all-cause (AC) readmission and PPR rates were calculated using the output from 3M potentially preventable readmission software (version 32). The PPR software utilizes a proprietary algorithm to designate potentially preventable readmissions based on diagnosis codes and the severity of illness (as measured by the APR-DRG severity of illness classification). We chose seven-day readmissions, as opposed to a longer window, as readmissions soon after discharge are more likely to be preventable8 and thus theoretically more amenable to prevention efforts. Quarterly rates were generated for each hospital and in aggregate across the population. We chose quarterly rates a priori to assess changes in rates without focusing on minor monthly fluctuations due to seasonal differences. We performed generalized linear mixed regression models with cluster adjustments at the hospital level to assess changes in readmission rates over time adjusted for case mix index, as admissions to children’s hospitals have increased in complexity over time.10,11 We operationalized the case mix index as an average of pediatric admissions’ relative weights at each hospital for the quarter.12 We assessed AC and PPR models separately. The average case mix index was a covariate in both regression models.
Finally, to determine if readmission reduction may be specific to particular conditions, we generated readmission rates for a select number of APR-DRGs. We focused on conditions with a very high percentage of AC readmissions classified as PPR (appendectomy, connective tissue disorders, ventricular shunt procedures, bronchiolitis, asthma, and sickle cell crisis) as well as those with a very low percentage of AC readmissions classified as PPR (gastrointestinal infections, hematologic disease, and bone marrow transplant [BMT]).5
RESULTS
We included 4.52 million admissions to the 66 included hospitals. Most hospitals (62%) were freestanding acute-care children’s hospitals. The hospitals were geographically diverse. Two-thirds had magnet status (Appendix Table 1). Appendix Table 2 displays patient/admission characteristics over time. Approximately 49% of children were non-Hispanic white, 19% were non-Hispanic black, and 19% were Hispanic. Half of the children were insured by Medicaid. These characteristics were stable over time, except case mix index, which increased during the study period (P = .04).
Across Diagnosis All-Cause and Potentially Preventable Readmission Rates
Over the study period, there were 227,378 AC seven-day readmissions (5.1% readmission rate), and 91,467 readmissions (40% of AC readmissions) were considered PPRs. Readmission rates did not vary over the study period (Figure, Panel A). The median AC seven-day readmission rate across all quarters was 5.1%, ranging from 4.3% to 5.3% (Figure, Panels A and B). The median seven-day PPR rate across all quarters was 2.5% and ranged from 2.1% to 2.5% (Figure, Panels A and C). When adjusted for case mix index, the AC rate increased slightly (on average 0.006% increase per quarter, P = .01) and PPR rates were unchanged over time (PPR model P = .14; Figure, Panel D).
Condition-Specific Readmission Rates
Of the condition-specific readmission rates, only the AC rate for BMT changed significantly, with a decrease of 0.1% per quarter, P = .048. None of the conditions had significant trends in increasing or decreasing readmission in PPR rates. Some conditions, including sickle cell and cerebrospinal fluid ventricular shunt procedures, had fluctuating readmission rates throughout the study period (Appendix Figure, Panels A-G).
DISCUSSION
Despite substantial national efforts to reduce pediatric readmissions,3 seven-day readmission rates at children’s hospitals have not decreased over six years. When individual conditions are examined, there are minor fluctuations of readmission rates over time but no clear trend of decreased readmission events.
Our results are contrary to findings in the Medicare population, where 30-day readmission rates have decreased over time.13,14 In these analyses, we focused on seven-day readmission, as earlier pediatric readmissions are more likely to be preventable. Importantly, the majority of our included hospitals (88%) participate in the Solutions for Patient Safety collaborative, which focuses on reducing seven-day readmissions. Thus, we are confident that a concerted effort to decrease readmission has been ongoing. Further, our findings are contrary to recent analyses indicating an increase in pediatric readmission rates using the pediatric all-condition readmission rate in the National Readmission Database.15 Our analyses are distinctly different in that they allow a focus on hospital-level performance in children’s hospitals. Although in our analyses the all-cause adjusted readmission rate did increase significantly over time (0.006% a quarter or 0.024% per year), this small increase is unlikely to be clinically relevant.
There are several potential reasons for the lack of change in pediatric readmission rates despite concerted efforts to decrease readmissions. First, pediatric readmissions across all conditions are relatively infrequent compared with adult readmission rates. Extrapolating from the largest pediatric study on readmission preventability,8 it is estimated that only two in 100 pediatric hospitalizations results in a PPR.16 Given the lack of robust pediatric readmission prediction tools, the ability to prospectively identify children at high risk for readmission and target interventions is challenging. Second, as we have previously described, children are readmitted after hospitalization for a wide variety of conditions.5 Medicare readmission penalties are leveraged on specific conditions; yet, Medicaid policies include all conditions. In pediatrics, successful interventions to reduce readmissions have focused on hospitalizations for specific conditions.17 In the only two large pediatric readmission reduction trials across multiple conditions, postdischarge homecare nursing contact did not reduce reutilization.18,19 It is challenging to decrease readmissions in heterogenous populations without a robust set of evidence-based interventions. Third, there are multiple ways to measure pediatric readmissions, and different institutions may focus on different methods. Given the proprietary nature and the reliance on retrospective administrative data, PPR rates cannot be assessed during admission and thus are not feasible as a real-time quality improvement outcome. Fourth, in contrast to other hospital quality metrics such as central line-associated bloodstream infections or catheter-associated urinary tract infection, the locus of control for readmission is not entirely within the purview of the hospital.
It is unclear what readmission rate in children is appropriate—or safe—and whether that level has already been met. National readmission prevention efforts may have collateral benefits such as improved communication, medication errors or adherence, and other important aspects of care during transitions. In this scenario, lower readmission rates may not reflect improved quality. Future research should focus on determining if and how readmission reduction efforts are helping to ease the transition to home. Alternatively, research should determine if there are better interventions to assist with transition challenges which should receive resources divested from failing readmission reduction efforts.
Using administrative data, we are limited in delineating truly preventable readmissions from nonpreventable readmissions. Nevertheless, we chose to focus on the PPR and AC metrics, as these are the most policy-relevant metrics. Additionally, we examined aggregate rates of readmission across a cohort of hospitals and did not assess for within-hospital changes in readmission rates. Thus, it is possible (and likely) that some hospitals saw improvements and others saw increases in readmission rates during the study period. We are unable to examine readmission rates at hospitals based on investment in readmission reduction efforts or individual state Medicaid reimbursement policies. Finally, we are unable to assess readmissions to other institutions; however, it is unlikely that readmissions to other hospitals have decreased significantly when readmissions to the discharging hospital have not changed.
Pediatric readmissions at children’s hospitals have not decreased in the past six years, despite widespread readmission reduction efforts. Readmission rates for individual conditions have fluctuated but have not decreased.
Disclosures
Dr. Auger reports grants from AHRQ, during the conduct of the study. Drs. Harris, Gay, Teufel, McLead, Neuman, Peltz, Morse, Del Beccaro, Simon, Argawal, and Fieldston have nothing to disclose. Dr. Shah is the Editor-in-Chief of the Journal of Hospital Medicine.
Funding
Dr. Auger’s research is funded by a K08 award from the Agency for Healthcare Research and Quality (1K08HS024735-01A).
1. Centers for Medicare & Medicaid Services. Readmissions Reduction Program (HRRP). https://www.cms.gov/Medicare/Medicare-Fee-for-Service-Payment/AcuteInpatientPPS/Readmissions-Reduction-Program.html. Accessed January 19, 2018.
2. 3M Health Information Systems. Potentially Preventable Readmissions Classification System: Methodology Overview. http://multimedia.3m.com/mws/media/1042610O/resources-and-references-his-2015.pdf. Accessed April 5, 2019.
3. Children’s Hospitals’ Solutions for Patient Safety. SPS prevention bundles: readmission. http://www.solutionsforpatientsafety.org/wp-content/uploads/SPS-Prevention-Bundles.pdf. Accessed January 11, 2017.
4. Berry JG, Toomey SL, Zaslavsky AM, et al. Pediatric readmission prevalence and variability across hospitals. JAMA. 2013;309(4):372-380. https://doi.org/10.1001/jama.2012.188351.
5. Gay JC, Agrawal R, Auger KA, et al. Rates and impact of potentially preventable readmissions at children’s hospitals. J Pediatr. 2015;166(3):613-619. https://doi.org/10.1016/j.jpeds.2014.10.052.
6. Auger KA, Teufel RJ, Harris JM, et al. Children’s hospital characteristics and readmission metrics. Pediatrics. 2017;139(2):e20161720. https://doi.org/10.1542/peds.2016-1720.
7. Joynt KE, Orav EJ, Jha AK. Thirty-day readmission rates for medicare beneficiaries by race and site of care. JAMA. 2011;305(7):675-681. https://doi.org/10.1001/jama.2011.123.
8. Toomey SL, Peltz A, Loren S, et al. Potentially preventable 30-day hospital readmissions at a children’s hospital. Pediatrics. 2016;138(2):e20154182. doi: 10.1542/peds.2015-4182.
9. Children’s Hospital Association. Pediatric analytic solutions. https://www.childrenshospitals.org/Programs-and-Services/Data-Analytics-and-Research/Pediatric-Analytic-Solutions. Accessed June 2, 2018.
10. Simon TD, Berry J, Feudtner C, et al. Children with complex chronic conditions in inpatient hospital settings in the United States. Pediatrics. 2010;126(4):647-655. https://doi.org/10.1542/peds.2009-3266.
11. Berry JG, Hall M, Hall DE, et al. Inpatient growth and resource use in 28 children’s hospitals: a longitudinal, multi-institutional study. JAMA Pediatr. 2013;167(2):170-177.https://doi.org/10.1001/jamapediatrics.2013.432.
12. Richardson T, Rodean J, Harris M, et al. Development of hospitalization resource intensity scores for kids (H-RISK) and comparison across pediatric populations. J Hosp Med. 2018;13(9):602-608. https://doi.org/10.12788/jhm.2948.
13. Zuckerman RB, Sheingold SH, Orav EJ, Ruhter J, Epstein AM. Readmissions, observation, and the hospital readmissions reduction program. N Engl J Med. 2016;374(16):1543-1551. https://doi.org/10.1056/NEJMsa1513024.
14. Desai NR, Ross JS, Kwon JY, et al. Association between hospital penalty status under the hospital readmission reduction program and readmission rates for target and nontarget conditions. JAMA. 2016;316(24):2647-2656. https://doi.org/10.1001/jama.2016.18533.
15. Bucholz EM, Toomey SL, Schuster MA. Trends in pediatric hospitalizations and readmissions: 2010-2016. Pediatrics. 2019;143(2):e20181958. https://doi.org/10.1542/peds.2018-1958.
16. Brittan M, Shah SS, Auger KA. Preventing pediatric readmissions: how does the hospital fit in? Pediatrics. 2016;138(2):e20161643. https://doi.org/10.1542/peds.2016-1643.
17. Auger KA, Kenyon CC, Feudtner C, Davis MM. Pediatric hospital discharge interventions to reduce subsequent utilization: a systematic review. J Hosp Med. 2014;9(4):251-260. https://doi.org/10.1002/jhm.2134.
18. Auger KA, Simmons JM, Tubbs-Cooley H, et al. Hospital to home outcomes (H2O) randomized trial of a post-discharge nurse home visit. Pediatrics. In press.
19. Auger KA, Shah SS, Tubbs-Cooley HL, et al. Effects of a 1-time nurse-led telephone call after pediatric discharge: the H2O II randomized clinical trial. JAMA Pediatr. 2018;172(9):e181482. https://doi.org/10.1001/jamapediatrics.2018.1482.
Readmission rates have been used by payers to administer financial incentives or penalties to hospitals as a measure of quality. The Centers for Medicare and Medicaid Services (CMS) reduces payments to hospitals with excess readmissions for adult Medicare patients.1 Although the Medicare readmission penalties do not apply to children, several state Medicaid agencies have adopted policies to reduce reimbursement for hospitals with higher than expected readmission rates. These Medicaid programs often use potentially preventable readmission (PPR) rates calculated with proprietary software.2 As a result of these incentives and with a goal of improving care, many children’s hospitals have focused on reducing readmissions through participation in local, regional, and national collaboratives.3
Rates of unplanned readmissions in children are lower than in older adults, with all-cause 30-day pediatric readmission rates around 13%.4-7 Even so, as many as 30% of pediatric readmissions may be potentially preventable, with the most common transition failure involving a hospital factor, such as failure to recognize worsening clinical status prior to discharge.8 While readmission metrics are often judged across peer institutions, little is known about national trends over time. Therefore, we sought to examine readmission rates at children’s hospitals over a six-year timeframe to determine if progress has been made toward reducing readmissions.
METHODS
We utilized data from the Children’s Hospital Association Inpatient Essentials Database and included index hospitalizations from January 1, 2010 through June 30, 2016. This database contains demographic information, diagnosis and procedure codes, and All-Patient Refined Diagnosis-Related Groups (APR-DRGs; 3M Health Information Systems) to describe the principal reason for each hospitalization.9 We included 66 hospitals from 31 states plus the District of Columbia with complete data during the study period.
Seven-day all-cause (AC) readmission and PPR rates were calculated using the output from 3M potentially preventable readmission software (version 32). The PPR software utilizes a proprietary algorithm to designate potentially preventable readmissions based on diagnosis codes and the severity of illness (as measured by the APR-DRG severity of illness classification). We chose seven-day readmissions, as opposed to a longer window, as readmissions soon after discharge are more likely to be preventable8 and thus theoretically more amenable to prevention efforts. Quarterly rates were generated for each hospital and in aggregate across the population. We chose quarterly rates a priori to assess changes in rates without focusing on minor monthly fluctuations due to seasonal differences. We performed generalized linear mixed regression models with cluster adjustments at the hospital level to assess changes in readmission rates over time adjusted for case mix index, as admissions to children’s hospitals have increased in complexity over time.10,11 We operationalized the case mix index as an average of pediatric admissions’ relative weights at each hospital for the quarter.12 We assessed AC and PPR models separately. The average case mix index was a covariate in both regression models.
Finally, to determine if readmission reduction may be specific to particular conditions, we generated readmission rates for a select number of APR-DRGs. We focused on conditions with a very high percentage of AC readmissions classified as PPR (appendectomy, connective tissue disorders, ventricular shunt procedures, bronchiolitis, asthma, and sickle cell crisis) as well as those with a very low percentage of AC readmissions classified as PPR (gastrointestinal infections, hematologic disease, and bone marrow transplant [BMT]).5
RESULTS
We included 4.52 million admissions to the 66 included hospitals. Most hospitals (62%) were freestanding acute-care children’s hospitals. The hospitals were geographically diverse. Two-thirds had magnet status (Appendix Table 1). Appendix Table 2 displays patient/admission characteristics over time. Approximately 49% of children were non-Hispanic white, 19% were non-Hispanic black, and 19% were Hispanic. Half of the children were insured by Medicaid. These characteristics were stable over time, except case mix index, which increased during the study period (P = .04).
Across Diagnosis All-Cause and Potentially Preventable Readmission Rates
Over the study period, there were 227,378 AC seven-day readmissions (5.1% readmission rate), and 91,467 readmissions (40% of AC readmissions) were considered PPRs. Readmission rates did not vary over the study period (Figure, Panel A). The median AC seven-day readmission rate across all quarters was 5.1%, ranging from 4.3% to 5.3% (Figure, Panels A and B). The median seven-day PPR rate across all quarters was 2.5% and ranged from 2.1% to 2.5% (Figure, Panels A and C). When adjusted for case mix index, the AC rate increased slightly (on average 0.006% increase per quarter, P = .01) and PPR rates were unchanged over time (PPR model P = .14; Figure, Panel D).
Condition-Specific Readmission Rates
Of the condition-specific readmission rates, only the AC rate for BMT changed significantly, with a decrease of 0.1% per quarter, P = .048. None of the conditions had significant trends in increasing or decreasing readmission in PPR rates. Some conditions, including sickle cell and cerebrospinal fluid ventricular shunt procedures, had fluctuating readmission rates throughout the study period (Appendix Figure, Panels A-G).
DISCUSSION
Despite substantial national efforts to reduce pediatric readmissions,3 seven-day readmission rates at children’s hospitals have not decreased over six years. When individual conditions are examined, there are minor fluctuations of readmission rates over time but no clear trend of decreased readmission events.
Our results are contrary to findings in the Medicare population, where 30-day readmission rates have decreased over time.13,14 In these analyses, we focused on seven-day readmission, as earlier pediatric readmissions are more likely to be preventable. Importantly, the majority of our included hospitals (88%) participate in the Solutions for Patient Safety collaborative, which focuses on reducing seven-day readmissions. Thus, we are confident that a concerted effort to decrease readmission has been ongoing. Further, our findings are contrary to recent analyses indicating an increase in pediatric readmission rates using the pediatric all-condition readmission rate in the National Readmission Database.15 Our analyses are distinctly different in that they allow a focus on hospital-level performance in children’s hospitals. Although in our analyses the all-cause adjusted readmission rate did increase significantly over time (0.006% a quarter or 0.024% per year), this small increase is unlikely to be clinically relevant.
There are several potential reasons for the lack of change in pediatric readmission rates despite concerted efforts to decrease readmissions. First, pediatric readmissions across all conditions are relatively infrequent compared with adult readmission rates. Extrapolating from the largest pediatric study on readmission preventability,8 it is estimated that only two in 100 pediatric hospitalizations results in a PPR.16 Given the lack of robust pediatric readmission prediction tools, the ability to prospectively identify children at high risk for readmission and target interventions is challenging. Second, as we have previously described, children are readmitted after hospitalization for a wide variety of conditions.5 Medicare readmission penalties are leveraged on specific conditions; yet, Medicaid policies include all conditions. In pediatrics, successful interventions to reduce readmissions have focused on hospitalizations for specific conditions.17 In the only two large pediatric readmission reduction trials across multiple conditions, postdischarge homecare nursing contact did not reduce reutilization.18,19 It is challenging to decrease readmissions in heterogenous populations without a robust set of evidence-based interventions. Third, there are multiple ways to measure pediatric readmissions, and different institutions may focus on different methods. Given the proprietary nature and the reliance on retrospective administrative data, PPR rates cannot be assessed during admission and thus are not feasible as a real-time quality improvement outcome. Fourth, in contrast to other hospital quality metrics such as central line-associated bloodstream infections or catheter-associated urinary tract infection, the locus of control for readmission is not entirely within the purview of the hospital.
It is unclear what readmission rate in children is appropriate—or safe—and whether that level has already been met. National readmission prevention efforts may have collateral benefits such as improved communication, medication errors or adherence, and other important aspects of care during transitions. In this scenario, lower readmission rates may not reflect improved quality. Future research should focus on determining if and how readmission reduction efforts are helping to ease the transition to home. Alternatively, research should determine if there are better interventions to assist with transition challenges which should receive resources divested from failing readmission reduction efforts.
Using administrative data, we are limited in delineating truly preventable readmissions from nonpreventable readmissions. Nevertheless, we chose to focus on the PPR and AC metrics, as these are the most policy-relevant metrics. Additionally, we examined aggregate rates of readmission across a cohort of hospitals and did not assess for within-hospital changes in readmission rates. Thus, it is possible (and likely) that some hospitals saw improvements and others saw increases in readmission rates during the study period. We are unable to examine readmission rates at hospitals based on investment in readmission reduction efforts or individual state Medicaid reimbursement policies. Finally, we are unable to assess readmissions to other institutions; however, it is unlikely that readmissions to other hospitals have decreased significantly when readmissions to the discharging hospital have not changed.
Pediatric readmissions at children’s hospitals have not decreased in the past six years, despite widespread readmission reduction efforts. Readmission rates for individual conditions have fluctuated but have not decreased.
Disclosures
Dr. Auger reports grants from AHRQ, during the conduct of the study. Drs. Harris, Gay, Teufel, McLead, Neuman, Peltz, Morse, Del Beccaro, Simon, Argawal, and Fieldston have nothing to disclose. Dr. Shah is the Editor-in-Chief of the Journal of Hospital Medicine.
Funding
Dr. Auger’s research is funded by a K08 award from the Agency for Healthcare Research and Quality (1K08HS024735-01A).
1. Centers for Medicare & Medicaid Services. Readmissions Reduction Program (HRRP). https://www.cms.gov/Medicare/Medicare-Fee-for-Service-Payment/AcuteInpatientPPS/Readmissions-Reduction-Program.html. Accessed January 19, 2018.
2. 3M Health Information Systems. Potentially Preventable Readmissions Classification System: Methodology Overview. http://multimedia.3m.com/mws/media/1042610O/resources-and-references-his-2015.pdf. Accessed April 5, 2019.
3. Children’s Hospitals’ Solutions for Patient Safety. SPS prevention bundles: readmission. http://www.solutionsforpatientsafety.org/wp-content/uploads/SPS-Prevention-Bundles.pdf. Accessed January 11, 2017.
4. Berry JG, Toomey SL, Zaslavsky AM, et al. Pediatric readmission prevalence and variability across hospitals. JAMA. 2013;309(4):372-380. https://doi.org/10.1001/jama.2012.188351.
5. Gay JC, Agrawal R, Auger KA, et al. Rates and impact of potentially preventable readmissions at children’s hospitals. J Pediatr. 2015;166(3):613-619. https://doi.org/10.1016/j.jpeds.2014.10.052.
6. Auger KA, Teufel RJ, Harris JM, et al. Children’s hospital characteristics and readmission metrics. Pediatrics. 2017;139(2):e20161720. https://doi.org/10.1542/peds.2016-1720.
7. Joynt KE, Orav EJ, Jha AK. Thirty-day readmission rates for medicare beneficiaries by race and site of care. JAMA. 2011;305(7):675-681. https://doi.org/10.1001/jama.2011.123.
8. Toomey SL, Peltz A, Loren S, et al. Potentially preventable 30-day hospital readmissions at a children’s hospital. Pediatrics. 2016;138(2):e20154182. doi: 10.1542/peds.2015-4182.
9. Children’s Hospital Association. Pediatric analytic solutions. https://www.childrenshospitals.org/Programs-and-Services/Data-Analytics-and-Research/Pediatric-Analytic-Solutions. Accessed June 2, 2018.
10. Simon TD, Berry J, Feudtner C, et al. Children with complex chronic conditions in inpatient hospital settings in the United States. Pediatrics. 2010;126(4):647-655. https://doi.org/10.1542/peds.2009-3266.
11. Berry JG, Hall M, Hall DE, et al. Inpatient growth and resource use in 28 children’s hospitals: a longitudinal, multi-institutional study. JAMA Pediatr. 2013;167(2):170-177.https://doi.org/10.1001/jamapediatrics.2013.432.
12. Richardson T, Rodean J, Harris M, et al. Development of hospitalization resource intensity scores for kids (H-RISK) and comparison across pediatric populations. J Hosp Med. 2018;13(9):602-608. https://doi.org/10.12788/jhm.2948.
13. Zuckerman RB, Sheingold SH, Orav EJ, Ruhter J, Epstein AM. Readmissions, observation, and the hospital readmissions reduction program. N Engl J Med. 2016;374(16):1543-1551. https://doi.org/10.1056/NEJMsa1513024.
14. Desai NR, Ross JS, Kwon JY, et al. Association between hospital penalty status under the hospital readmission reduction program and readmission rates for target and nontarget conditions. JAMA. 2016;316(24):2647-2656. https://doi.org/10.1001/jama.2016.18533.
15. Bucholz EM, Toomey SL, Schuster MA. Trends in pediatric hospitalizations and readmissions: 2010-2016. Pediatrics. 2019;143(2):e20181958. https://doi.org/10.1542/peds.2018-1958.
16. Brittan M, Shah SS, Auger KA. Preventing pediatric readmissions: how does the hospital fit in? Pediatrics. 2016;138(2):e20161643. https://doi.org/10.1542/peds.2016-1643.
17. Auger KA, Kenyon CC, Feudtner C, Davis MM. Pediatric hospital discharge interventions to reduce subsequent utilization: a systematic review. J Hosp Med. 2014;9(4):251-260. https://doi.org/10.1002/jhm.2134.
18. Auger KA, Simmons JM, Tubbs-Cooley H, et al. Hospital to home outcomes (H2O) randomized trial of a post-discharge nurse home visit. Pediatrics. In press.
19. Auger KA, Shah SS, Tubbs-Cooley HL, et al. Effects of a 1-time nurse-led telephone call after pediatric discharge: the H2O II randomized clinical trial. JAMA Pediatr. 2018;172(9):e181482. https://doi.org/10.1001/jamapediatrics.2018.1482.
© 2019 Society of Hospital Medicine
Comparison of Parent Report with Administrative Data to Identify Pediatric Reutilization Following Hospital Discharge
Prior healthcare utilization predicts future utilization;1 thus, providers should know when a child has had a recent healthcare visit. Healthcare providers typically obtain this information from parents and caregivers, who may not always provide accurate information.2-4
The Hospital to Home Outcomes study (H2O) was a randomized controlled trial conducted to assess the effects of a one-time home nurse visit following discharge on unplanned healthcare reutilization.5 We assessed reutilization through two sources: parent report via a postdischarge telephone call and administrative data. In this analysis, we sought to understand differences in reutilization rates by source by comparing parent report with administrative data.
METHODS
The H2O trial included children (<18 years) hospitalized on the hospital medicine (HM) or neuroscience (Neurology/Neurosurgery) services at Cincinnati Children’s Hospital Medical Center (CCHMC) from February 2015 to April 2016; they had an English-speaking parent and were discharged to home without skilled nursing care.6 For this analysis, we restricted the sample to children randomized to the control arm (discharge without a home visit), which reflects typical clinical care.
We used administrative data to capture 14-day reutilization (unplanned hospital readmissions, emergency department [ED] visits, or urgent care visits). CCHMC is the only pediatric admitting facility in the region and includes two pediatric EDs and five urgent care centers. We supplemented hospital data with a dataset (The Health Collaborative7) that included utilization at other regional facilities. Parent report was assessed via a research coordinator phone call 14-23 days after discharge. Parents were asked: “I’m going to [ask] about your child’s health since [discharge date]. Has s/he been hospitalized overnight? Has s/he been taken to the Emergency Room/Emergency Department (didn’t stay overnight)? Has s/he been taken to an urgent care?” We report 14-day reutilization rates by source (parent and/or administrative) and visit type.
We considered administrative data the gold standard for documentation of reutilization events for two reasons. First, all healthcare encounters generate billing and are therefore documented with verifiable coding. Second, we had access to data from our center and other regional healthcare facilities. Any parent-reported utilization to a facility not documented in either dataset was considered an unverifiable event (eg, outside our catchment region). Agreement between administrative and parent report of 14-day reutilization was summarized as positive agreement (reutilization documented in both administrative and parent report), negative agreement (no reutilization reported in either administrative or parent report), and overall agreement (combination of positive and negative agreement). We classified discrepancies as reutilization events in administrative data without parent report of reutilization or vice versa. We performed medical record review of discrepancies in our institutional data.
We summarized agreement by using the Cohen’s kappa statistic by reuse type (hospital readmission, ED, and urgent care visit) and overall (any reutilization event). Strength of agreement based on the kappa statistics was classified as poor (<0.20), fair (0.21-0.40), moderate (0.41-0.60), good (0.61-0.80), and very good (0.81-1.00).8 We used McNemar’s test to evaluate marginal homogeneity.
RESULTS
Of 749 children randomized to the standard of care arm, 723 parents completed the 14-day follow-up call and were included in this analysis. The median child age was two years (interquartile range: 0.4, 6.9), the median length of stay (LOS) was two days (1, 3), and the majority were white (62%). Payer mix varied, with 44% privately insured and 54% publicly insured. Most patients (83%) were admitted to the HM service, and the most common diagnoses groups for index admission were respiratory (35%), neurologic (14%), and gastrointestinal (9%) diseases.
Administrative data showed 63 children with any reutilization event; parents reported 63 with any reutilization event; 48 children had events reported by both sources. The overall agreement was high, ranging from 95.9% to 98.5% (Table 1) depending on visit type. The positive agreement (ie, parent and administrative data indicated reutilization) ranged from 47.6% to 76.2%. Negative agreement (ie, parent and administrative data agreed no reutilization) was very high, 97.7% to 99.2%. Parents reported three ED visits and four urgent care visits that were unverifiable due to lack of access to administrative data (sites of care reported were not included in our datasets).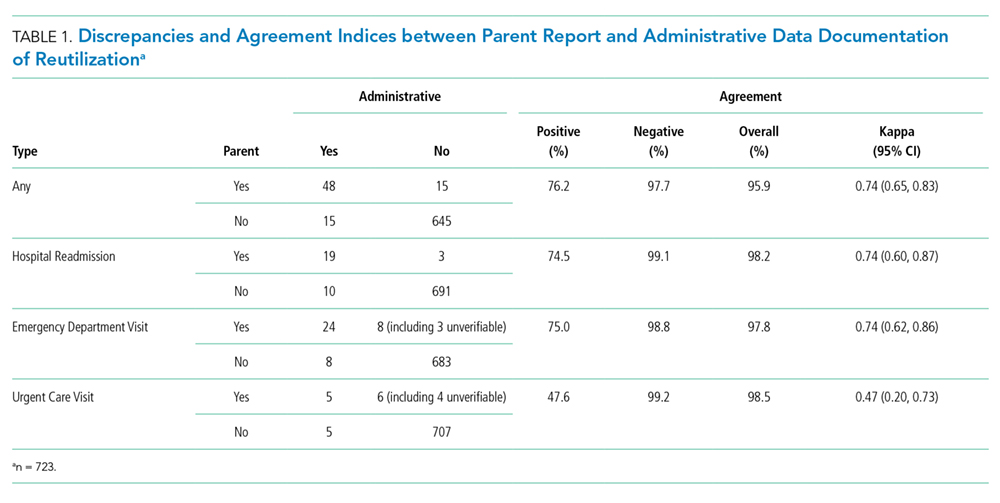
The kappa statistics indicated good agreement between parent report and administrative data for hospital readmission, ED visit, and composite any type of reutilization but moderate agreement for urgent care visit (Table 1).
Discrepancies were noted between parent report and administrative data (Table 2). In 15 children, a parent reported no reutilization when the administrative data included one; in 15 children, a parent reported a reutilization (including seven unverifiable events) when the administrative data revealed none. However, a few discrepancies were due to the incorrect site of care report (Table 2). Chart review of discrepancies involving CCHMC locations verified the accuracy of administrative data except in one case. In this case, a child’s ED revisit appeared to be a separate encounter but actually led to a hospital readmission.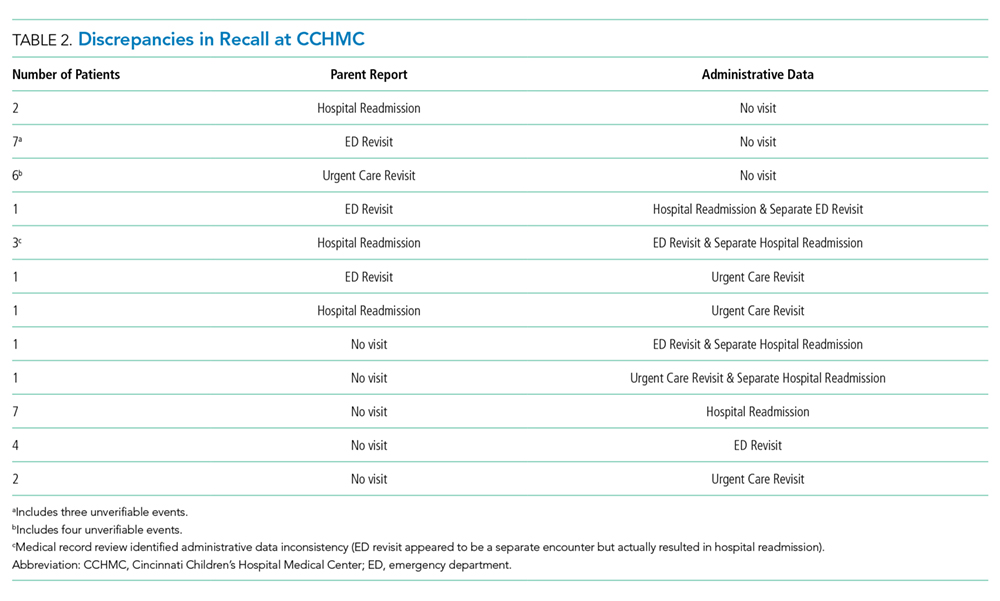
The 14-day reutilization rates by type (any, hospital readmission, ED visit, and urgent care visit) and data source (administrative data only, parent report only, and administrative or parent report) are depicted in the Appendix. Reutilization rates were similar when computed using administrative only or parent report only. However, reutilization rates increased slightly if a composite measure of any administrative data or parent report was utilized. No significant difference was found between administrative data and parent report in the marginal reuse proportions, with McNemar’s test P values all >.05 for hospital readmission, ED visit, and urgent care visit evaluated separately.
DISCUSSION
By comparing parent report of reutilization after hospital discharge through postdischarge phone calls with administrative data, we demonstrated high overall agreement between sources (95.9%); this finding is similar to prior research investigating the relationship between an established medical home and reutilization.9 However, this agreement is largely due to both sources reporting no reutilization. When revisits did occur, the agreement was notably lower, especially with regard to urgent care visits.
Discrepancies between sources have several possible explanations. First, parents may be confused by the framing of reutilization questions, perhaps lacking clarity around which visit we were referencing. Second, parents may experience limitations in health literacy10,11 with a lack of familiarity with healthcare language, such as the ability to delineate location types (for example, a parent may identify an urgent care visit as an ED visit, given their close proximity at our facility). Finally, our prior work identified that the “fog” of hospitalization,12 which is often a stressful and disruptive time for families, may linger after admission and could lead to difficulty in recalling detailed events.
Our findings have implications for effective care in a complex healthcare system where parent report may be the most practical method to obtain historical information, both within clinical care and in the context of research or quality measures, such as postdischarge utilization. Given that one of the greatest risk factors for readmission is prior utilization,1 the knowledge that a patient experienced a reutilization after a prior discharge might prompt the inpatient provider to better prepare families for subsequent transition to home.
To apply our findings practically, it is important to realize that a parent report may be sufficient when reporting that no revisit occurred, if there is also no record of a visit in accessible administrative data (such as an electronic health record). However, further questions or investigation should be considered when parents report a visit did occur or when administrative data indicate a visit occurred that the parent does not recall. Providers and researchers alike should remember to use health literacy universal precautions with all families, employing plain language without medical jargon.13 As linked electronic health record use becomes more prevalent, administrative data may be accessible in real-time, allowing for verification of family interview information. Administrative data beyond a single hospital system should be considered to effectively capture reutilization for research or quality efforts.
Our study has several limitations. Similar to most studies using reutilization outcomes, our data may miss a few unverifiable reuse events. By supplementing with additional regional data,7 we likely captured most events. Second, we did not include patients with limited English proficiency, although it is unclear how this might have biased our results. Third, while relatively few families did not complete the calls, it is possible that more discrepancies would have been noted in nonresponders. Fourth, research coordinators administering the calls followed a script to determine reutilization information; in clinical practice, a practitioner might not ask questions as clearly, which could negatively impact recall or might add clarifying follow-up questions to enhance recall. Finally, the analysis occurred in the setting of a randomized controlled trial that included children with relatively noncomplex health conditions with short LOS;6 thus, the results may not apply to other populations.
In conclusion, parent report and administrative data of reutilization following hospital discharge were usually in agreement when no reutilization occurred; however, discrepancies were noted more often when reutilizations occurred and may have care implications.
Collaborators
On behalf of the H2O Trial study group including: Joanne Bachus, BSN, RN; Andrew F. Beck, MD, MPH; Monica L. Borell, BSN, RN; Lenisa V. Chang, MA, PhD; Patricia Crawford, RN; Jennifer M. Gold, MSN, RN; Judy A. Heilman BSN, RN; Jane C. Khoury, PhD; Pierce Kuhnell, MS; Karen Lawley, BSN, RN; Allison Loechtenfeldt, BS; Colleen Mangeot, MS; Lynn O’Donnell, BSN, RN; Rita H. Pickler, PhD, RN; Hadley S. Sauers-Ford, MPH; Anita N. Shah, DO, MPH; Susan N. Sherman, DPA; Lauren G. Solan, MD, MEd; Karen P. Sullivan, BSN, RN; Susan Wade-Murphy, MSN, RN
Disclosures
Hospital to Home Outcomes team reports grants from the Patient Centered Outcomes Research Institute during the conduct of the study. Dr. White reports personal fees from the Institute for Health Care Improvement, outside the submitted work.
Funding
This work was supported by the Patient Centered Outcomes Research Institute (IHS-1306-0081 to Dr. S. Shah). All statements in this report, including findings and conclusions, are solely those of the authors and do not necessarily represent the views of the Patient-Centered Outcomes Research Institute, its Board of Governors, or the Methodology Committee. Dr Auger’s research is funded by the Agency for Healthcare Research and Quality (1K08HS024735).
1. Berry JG, Hall DE, Kuo DZ, et al. Hospital utilization and characteristics of patients experiencing recurrent readmissions within children’s hospitals. JAMA. 2011;305(7):682-690. doi: 10.1001/jama.2011.122. PubMed
2. Schwarz JN, Monti A, Savelli-Castillo I, Nelson LP. Accuracy of familial reporting of a child’s medical history in a dental clinic setting. Pediatr Dent. 2004;26(5):433-439. PubMed
3. Williams ER, Meza YE, Salazar S, Dominici P, Fasano CJ. Immunization histories given by adult caregivers accompanying children 3-36 months to the emergency department: are their histories valid for the Haemophilus influenzae B and pneumococcal vaccines? Pediatr Emerg Care. 2007;23(5):285-288. doi: 10.1097/01.pec.0000248699.42175.62. PubMed
4. Stupiansky NW, Zimet GD, Cummings T, Fortenberry JD, Shew M. Accuracy of self-reported human papillomavirus vaccine receipt among adolescent girls and their mothers. J Adolesc Health. 2012;50(1):103-105. doi: 10.1016/j.jadohealth.2011.04.010. PubMed
5. Tubbs-Cooley HL, Pickler RH, Simmons JM, et al. Testing a post-discharge nurse-led transitional home visit in acute care pediatrics: the Hospital-To-Home Outcomes (H2O) study protocol. J Adv Nurs. 2016;72(4):915-925. doi: 10.1111/jan.12882. PubMed
6. Auger KA, Simmons JM, Tubbs-Cooley HL, et al. Postdischarge nurse home visits and reuse: the hospital to home outcomes (H2O) trial. Pediatrics. 2018;142(1):e20173919. doi: 10.1542/peds.2017-3919. PubMed
7. The Health Collaborative. The Health Collaborative Healthbridge Analytics. http://healthcollab.org/hbanalytics/. Accessed August 11, 2017.
8. Altman DG. Practical statistics for medical research. Boca Raton, Florida: CRC Press; 1990.
9. Coller RJ, Klitzner TS, Saenz AA, Lerner CF, Nelson BB, Chung PJ. The medical home and hospital readmissions. Pediatrics. 2015;136(6):e1550-e1560. doi: 10.1542/peds.2015-1618. PubMed
10. Office of Disease Prevention and Health Promotion. US Department of Health and Human Services. Healthy People 2010: Understanding and Improving Health. 2nd ed. Washington, DC: US Government Printing Office; 2000.
11. Yin HS, Johnson M, Mendelsohn AL, Abrams MA, Sanders LM, Dreyer BP. The health literacy of parents in the United States: a nationally representative study. Pediatrics. 2009;124(3):S289-S298. doi: 10.1542/peds.2009-1162E. PubMed
12. Solan LG, Beck AF, Brunswick SA, et al. The family perspective on hospital to home transitions: a qualitative study. Pediatrics. 2015;136(6):e1539-e1549. PubMed
13. DeWalt DA CL, Hawk VH, Broucksou KA, Hink A, Rudd R, Brach C. Health Literacy Universal Precautions Toolkit. (Prepared by North Carolina Network Consortium, The Cecil G. Sheps Center for Health Services Research, The University of North Carolina at Chapel Hill, under Contract No. HHSA290200710014.). Rockville, MD: Agency for Healthcare Research and Quality; 2010.
Prior healthcare utilization predicts future utilization;1 thus, providers should know when a child has had a recent healthcare visit. Healthcare providers typically obtain this information from parents and caregivers, who may not always provide accurate information.2-4
The Hospital to Home Outcomes study (H2O) was a randomized controlled trial conducted to assess the effects of a one-time home nurse visit following discharge on unplanned healthcare reutilization.5 We assessed reutilization through two sources: parent report via a postdischarge telephone call and administrative data. In this analysis, we sought to understand differences in reutilization rates by source by comparing parent report with administrative data.
METHODS
The H2O trial included children (<18 years) hospitalized on the hospital medicine (HM) or neuroscience (Neurology/Neurosurgery) services at Cincinnati Children’s Hospital Medical Center (CCHMC) from February 2015 to April 2016; they had an English-speaking parent and were discharged to home without skilled nursing care.6 For this analysis, we restricted the sample to children randomized to the control arm (discharge without a home visit), which reflects typical clinical care.
We used administrative data to capture 14-day reutilization (unplanned hospital readmissions, emergency department [ED] visits, or urgent care visits). CCHMC is the only pediatric admitting facility in the region and includes two pediatric EDs and five urgent care centers. We supplemented hospital data with a dataset (The Health Collaborative7) that included utilization at other regional facilities. Parent report was assessed via a research coordinator phone call 14-23 days after discharge. Parents were asked: “I’m going to [ask] about your child’s health since [discharge date]. Has s/he been hospitalized overnight? Has s/he been taken to the Emergency Room/Emergency Department (didn’t stay overnight)? Has s/he been taken to an urgent care?” We report 14-day reutilization rates by source (parent and/or administrative) and visit type.
We considered administrative data the gold standard for documentation of reutilization events for two reasons. First, all healthcare encounters generate billing and are therefore documented with verifiable coding. Second, we had access to data from our center and other regional healthcare facilities. Any parent-reported utilization to a facility not documented in either dataset was considered an unverifiable event (eg, outside our catchment region). Agreement between administrative and parent report of 14-day reutilization was summarized as positive agreement (reutilization documented in both administrative and parent report), negative agreement (no reutilization reported in either administrative or parent report), and overall agreement (combination of positive and negative agreement). We classified discrepancies as reutilization events in administrative data without parent report of reutilization or vice versa. We performed medical record review of discrepancies in our institutional data.
We summarized agreement by using the Cohen’s kappa statistic by reuse type (hospital readmission, ED, and urgent care visit) and overall (any reutilization event). Strength of agreement based on the kappa statistics was classified as poor (<0.20), fair (0.21-0.40), moderate (0.41-0.60), good (0.61-0.80), and very good (0.81-1.00).8 We used McNemar’s test to evaluate marginal homogeneity.
RESULTS
Of 749 children randomized to the standard of care arm, 723 parents completed the 14-day follow-up call and were included in this analysis. The median child age was two years (interquartile range: 0.4, 6.9), the median length of stay (LOS) was two days (1, 3), and the majority were white (62%). Payer mix varied, with 44% privately insured and 54% publicly insured. Most patients (83%) were admitted to the HM service, and the most common diagnoses groups for index admission were respiratory (35%), neurologic (14%), and gastrointestinal (9%) diseases.
Administrative data showed 63 children with any reutilization event; parents reported 63 with any reutilization event; 48 children had events reported by both sources. The overall agreement was high, ranging from 95.9% to 98.5% (Table 1) depending on visit type. The positive agreement (ie, parent and administrative data indicated reutilization) ranged from 47.6% to 76.2%. Negative agreement (ie, parent and administrative data agreed no reutilization) was very high, 97.7% to 99.2%. Parents reported three ED visits and four urgent care visits that were unverifiable due to lack of access to administrative data (sites of care reported were not included in our datasets).
The kappa statistics indicated good agreement between parent report and administrative data for hospital readmission, ED visit, and composite any type of reutilization but moderate agreement for urgent care visit (Table 1).
Discrepancies were noted between parent report and administrative data (Table 2). In 15 children, a parent reported no reutilization when the administrative data included one; in 15 children, a parent reported a reutilization (including seven unverifiable events) when the administrative data revealed none. However, a few discrepancies were due to the incorrect site of care report (Table 2). Chart review of discrepancies involving CCHMC locations verified the accuracy of administrative data except in one case. In this case, a child’s ED revisit appeared to be a separate encounter but actually led to a hospital readmission.
The 14-day reutilization rates by type (any, hospital readmission, ED visit, and urgent care visit) and data source (administrative data only, parent report only, and administrative or parent report) are depicted in the Appendix. Reutilization rates were similar when computed using administrative only or parent report only. However, reutilization rates increased slightly if a composite measure of any administrative data or parent report was utilized. No significant difference was found between administrative data and parent report in the marginal reuse proportions, with McNemar’s test P values all >.05 for hospital readmission, ED visit, and urgent care visit evaluated separately.
DISCUSSION
By comparing parent report of reutilization after hospital discharge through postdischarge phone calls with administrative data, we demonstrated high overall agreement between sources (95.9%); this finding is similar to prior research investigating the relationship between an established medical home and reutilization.9 However, this agreement is largely due to both sources reporting no reutilization. When revisits did occur, the agreement was notably lower, especially with regard to urgent care visits.
Discrepancies between sources have several possible explanations. First, parents may be confused by the framing of reutilization questions, perhaps lacking clarity around which visit we were referencing. Second, parents may experience limitations in health literacy10,11 with a lack of familiarity with healthcare language, such as the ability to delineate location types (for example, a parent may identify an urgent care visit as an ED visit, given their close proximity at our facility). Finally, our prior work identified that the “fog” of hospitalization,12 which is often a stressful and disruptive time for families, may linger after admission and could lead to difficulty in recalling detailed events.
Our findings have implications for effective care in a complex healthcare system where parent report may be the most practical method to obtain historical information, both within clinical care and in the context of research or quality measures, such as postdischarge utilization. Given that one of the greatest risk factors for readmission is prior utilization,1 the knowledge that a patient experienced a reutilization after a prior discharge might prompt the inpatient provider to better prepare families for subsequent transition to home.
To apply our findings practically, it is important to realize that a parent report may be sufficient when reporting that no revisit occurred, if there is also no record of a visit in accessible administrative data (such as an electronic health record). However, further questions or investigation should be considered when parents report a visit did occur or when administrative data indicate a visit occurred that the parent does not recall. Providers and researchers alike should remember to use health literacy universal precautions with all families, employing plain language without medical jargon.13 As linked electronic health record use becomes more prevalent, administrative data may be accessible in real-time, allowing for verification of family interview information. Administrative data beyond a single hospital system should be considered to effectively capture reutilization for research or quality efforts.
Our study has several limitations. Similar to most studies using reutilization outcomes, our data may miss a few unverifiable reuse events. By supplementing with additional regional data,7 we likely captured most events. Second, we did not include patients with limited English proficiency, although it is unclear how this might have biased our results. Third, while relatively few families did not complete the calls, it is possible that more discrepancies would have been noted in nonresponders. Fourth, research coordinators administering the calls followed a script to determine reutilization information; in clinical practice, a practitioner might not ask questions as clearly, which could negatively impact recall or might add clarifying follow-up questions to enhance recall. Finally, the analysis occurred in the setting of a randomized controlled trial that included children with relatively noncomplex health conditions with short LOS;6 thus, the results may not apply to other populations.
In conclusion, parent report and administrative data of reutilization following hospital discharge were usually in agreement when no reutilization occurred; however, discrepancies were noted more often when reutilizations occurred and may have care implications.
Collaborators
On behalf of the H2O Trial study group including: Joanne Bachus, BSN, RN; Andrew F. Beck, MD, MPH; Monica L. Borell, BSN, RN; Lenisa V. Chang, MA, PhD; Patricia Crawford, RN; Jennifer M. Gold, MSN, RN; Judy A. Heilman BSN, RN; Jane C. Khoury, PhD; Pierce Kuhnell, MS; Karen Lawley, BSN, RN; Allison Loechtenfeldt, BS; Colleen Mangeot, MS; Lynn O’Donnell, BSN, RN; Rita H. Pickler, PhD, RN; Hadley S. Sauers-Ford, MPH; Anita N. Shah, DO, MPH; Susan N. Sherman, DPA; Lauren G. Solan, MD, MEd; Karen P. Sullivan, BSN, RN; Susan Wade-Murphy, MSN, RN
Disclosures
Hospital to Home Outcomes team reports grants from the Patient Centered Outcomes Research Institute during the conduct of the study. Dr. White reports personal fees from the Institute for Health Care Improvement, outside the submitted work.
Funding
This work was supported by the Patient Centered Outcomes Research Institute (IHS-1306-0081 to Dr. S. Shah). All statements in this report, including findings and conclusions, are solely those of the authors and do not necessarily represent the views of the Patient-Centered Outcomes Research Institute, its Board of Governors, or the Methodology Committee. Dr Auger’s research is funded by the Agency for Healthcare Research and Quality (1K08HS024735).
1. Berry JG, Hall DE, Kuo DZ, et al. Hospital utilization and characteristics of patients experiencing recurrent readmissions within children’s hospitals. JAMA. 2011;305(7):682-690. doi: 10.1001/jama.2011.122. PubMed
2. Schwarz JN, Monti A, Savelli-Castillo I, Nelson LP. Accuracy of familial reporting of a child’s medical history in a dental clinic setting. Pediatr Dent. 2004;26(5):433-439. PubMed
3. Williams ER, Meza YE, Salazar S, Dominici P, Fasano CJ. Immunization histories given by adult caregivers accompanying children 3-36 months to the emergency department: are their histories valid for the Haemophilus influenzae B and pneumococcal vaccines? Pediatr Emerg Care. 2007;23(5):285-288. doi: 10.1097/01.pec.0000248699.42175.62. PubMed
4. Stupiansky NW, Zimet GD, Cummings T, Fortenberry JD, Shew M. Accuracy of self-reported human papillomavirus vaccine receipt among adolescent girls and their mothers. J Adolesc Health. 2012;50(1):103-105. doi: 10.1016/j.jadohealth.2011.04.010. PubMed
5. Tubbs-Cooley HL, Pickler RH, Simmons JM, et al. Testing a post-discharge nurse-led transitional home visit in acute care pediatrics: the Hospital-To-Home Outcomes (H2O) study protocol. J Adv Nurs. 2016;72(4):915-925. doi: 10.1111/jan.12882. PubMed
6. Auger KA, Simmons JM, Tubbs-Cooley HL, et al. Postdischarge nurse home visits and reuse: the hospital to home outcomes (H2O) trial. Pediatrics. 2018;142(1):e20173919. doi: 10.1542/peds.2017-3919. PubMed
7. The Health Collaborative. The Health Collaborative Healthbridge Analytics. http://healthcollab.org/hbanalytics/. Accessed August 11, 2017.
8. Altman DG. Practical statistics for medical research. Boca Raton, Florida: CRC Press; 1990.
9. Coller RJ, Klitzner TS, Saenz AA, Lerner CF, Nelson BB, Chung PJ. The medical home and hospital readmissions. Pediatrics. 2015;136(6):e1550-e1560. doi: 10.1542/peds.2015-1618. PubMed
10. Office of Disease Prevention and Health Promotion. US Department of Health and Human Services. Healthy People 2010: Understanding and Improving Health. 2nd ed. Washington, DC: US Government Printing Office; 2000.
11. Yin HS, Johnson M, Mendelsohn AL, Abrams MA, Sanders LM, Dreyer BP. The health literacy of parents in the United States: a nationally representative study. Pediatrics. 2009;124(3):S289-S298. doi: 10.1542/peds.2009-1162E. PubMed
12. Solan LG, Beck AF, Brunswick SA, et al. The family perspective on hospital to home transitions: a qualitative study. Pediatrics. 2015;136(6):e1539-e1549. PubMed
13. DeWalt DA CL, Hawk VH, Broucksou KA, Hink A, Rudd R, Brach C. Health Literacy Universal Precautions Toolkit. (Prepared by North Carolina Network Consortium, The Cecil G. Sheps Center for Health Services Research, The University of North Carolina at Chapel Hill, under Contract No. HHSA290200710014.). Rockville, MD: Agency for Healthcare Research and Quality; 2010.
© 2019 Society of Hospital Medicine