User login
Significant HbA1c Lowering in Patients Achieving a Hepatitis C Virus Cure (FULL)
The immediate clinically significant reduction in hemoglobin A1c following HCV treatment observed in this study contrasts with the expected rise seen with normal disease progression.
According to estimates, between 2.7 and 3.9 million people are infected with hepatitis C virus (HCV) in the US, with worldwide infection estimated to be about 185 million people.1-3 The majority of patients infected with HCV develop a chronic infection, which is the leading cause of liver-related complications in the Western world, including cirrhosis, hepatocellular carcinoma, and the need for liver transplantation.4 In addition to the direct effects HCV has on the liver, extrahepatic complications can occur, often related to the immune-mediated mechanism of cryoglobulinemia, such as vasculitis, renal disease, and palpable purpura. Additionally, > 70 studies globally have associated HCV with insulin resistance and worsening glycemic control.5,6
The prevalence of patients infected with HCV that have comorbid type 2 diabetes mellitus (T2DM) is estimated to be about 30%.7,8 The landmark cross-sectional National Health and Nutrition Examination Survey III study found the prevalence of T2DM among HCV patients in the US aged > 40 years to be about 3-fold higher than those without HCV.9 These findings were further supported by a Taiwanese prospective community-based cohort study that found a higher incidence of T2DM in HCV-positive patients compared with HCV negative patients (hazard ratio [HR], 1.7; 95% CI, 1.3-2.1).10 This relationship appears to be separate from the diabetogenic effect of cirrhosis itself as a significantly higher prevalence of DM has been observed in people with HCV when compared with people with cirrhosis due to other etiologies.11 Although the mechanism for this relationship is not fully understood and is likely multifactorial, it is believed to primarily be an effect of the HCV core protein increasing phosphorylation of insulin receptor substrate-1.6,12,13 The increased presence of the inflammatory cytokine, tumor necrosis factor-α, is also believed to play a role in the effects on insulinreceptor substrate-1 as well as mediating hepatic insulin resistance, stimulating lipolysis, down-regulating peroxisome proliferator-activated receptor-γ, and interfering with β-cell function.14-17
The relationship between HCV and T2DM has been further established by measured improvements in insulin resistance among patients undergoing HCV treatment with the pre-2011 standard of care—peginterferon and ribavirin.Kawaguchi and colleagues found sustained treatment responders to have a significant decrease in both the homeostatic model assessment-insulin resistance (HOMA-IR) score, representing insulin resistance, and the HOMA-β score, representing β-cell function.18 Improvements in the HOMA-IR score were further validated by Kim and colleagues and a nested cohort within the Hepatitis C Long-term Treatment against Cirrhosis (HALT-C) trial.19,20 Furthermore, Romero-Gómez and colleagues found that patients achieving a cure from HCV treatment defined as a sustained virologic response (SVR) had a nearly 50% reduced risk of impaired fasting glucose or T2DM over a mean posttreatment follow-up of 27 months.21
The recent development of direct-acting antivirals (DAAs) has marked significant HCV treatment advances in terms of efficacy and tolerability, leading current guidelines to emphasize that nearly all patients with HCV would benefit from treatment.22 Despite these guidelines, issues have been documented throughout the US with payors often limiting this costly treatment to only those with advanced fibrotic disease.23 Although the benefits of HCV treatment on reducing liver-related morbidity and mortality may be most appreciated in individuals with advanced fibrotic liver disease, improvements in insulin resistance would suggest potential morbidity and mortality benefits beyond the liver in many more at-risk individuals.24
Increasingly, cases are being reported of new DAA regimens having a significant impact on reducing insulin resistance as demonstrated by marked decreases in antihyperglycemic requirements, fasting blood glucose, and hemoglobin A1c (HbA1c).25-30 One striking case describes a patient being able to de-escalate his regimen from 42 daily units of insulin to a single oral dipeptidyl peptidase-4 inhibitor while maintaining goal HbA1c level over a 2-year time period.31 A database-driven study of veterans found a mean HbA1c drop of 0.37% in its overall included cohort of patients with T2DM who achieved SVR from HCV DAA treatment.32
Despite these data, the individual predictability and variable magnitude of improved insulin resistance based on baseline HbA1c remains unknown. The objective of this study was to assess the impact of HCV treatment with short course DAAs on glucose control in veteran patients with T2DM at a single center.
Methods
This retrospective cohort study was performed at the Department of Veterans Affairs (VA) Northeast Ohio Healthcare System (VANEOHS) in Cleveland. This study received approval from the VANEOHS Institutional Review Board. Retrospective patient data were collected from the Veterans Health Administration (VHA) Computerized Patient Record System (CPRS) electronic health record. Collectively, the VHA has treated > 100,000 patients with DAAs, making it the largest provider of HCV treatment in the US. VANEOHS has treated nearly 2,000 patients with DAAs, rendering it one of the largest single-institution cohorts to be able to examine the effects of HCV treatment on subpopulations, such as patients with T2DM.
Patient Population
Patients were identified using ICD-9/10 codes for T2DM and medication dispense history of hepatitis C DAAs. Patients were included if they had a diagnosis of T2DM, were initiated on a hepatitis C DAA between February 1, 2014 to September 26, 2016. To be eligible, patients were required to have both a baseline HbA1c within 6 months prior to starting HCV treatment as well as a HbA1c within 4 months posttreatment. The HCV treatment included were new short-course DAAs, including sofosbuvir, simeprevir, ombitasvir/paritaprevir/ritonavir ± dasabuvir, ledipasvir/sofosbuvir, elbasvir/grazoprevir, and sofosbuvir/velpatasvir. Patients were excluded if they were not on any antihyperglycemic medications at the start of HCV treatment or did not complete a full HCV treatment course.
Baseline Characteristics
Pertinent demographic data collected at baseline included patient age, gender, HCV genotype, and presence of advanced fibrotic liver disease (defined as a Metavir fibrosis stage 4 on liver biopsy, transient elastography > 12.5 kPa, or radiologic evidence of cirrhosis). HCV treatment initiation and completion dates were collected along with treatment response at 12 weeks posttreatment. Patients were considered to have achieved SVR12 if their hepatitis C viral load remained undetectable at posttreatment day 77 or thereafter. Treatment relapse was defined as a patient who achieved an undetectable HCV RNA by the end of treatment but subsequently had detectable HCV RNA following treatment cessation.
Outcome Measures
Baseline HbA1c was defined as the HbA1c drawn closest to the date of HCV treatment initiation, at least 6 months prior to treatment. Immediate posttreatment HbA1c was defined as HbA1c drawn up to 4 months posttreatment, and sustained HbA1c was captured up to 18 months posttreatment. Antihyperglycemic medication regimens and doses were collected at baseline, the end of treatment, and 3 months posttreatment via medication dispense history as well as provider notes documented in CPRS.
The primary endpoint was the change in HbA1c up to 4 months posttreatment in patients achieving SVR12. Secondary endpoints included the sustained change in HbA1c up to 12- and 18-months posttreatment, as well as change in antihyperglycemic medications from baseline to the end of HCV treatment and from baseline to 3 months posttreatment in patients achieving SVR12.
Statistical Analysis
The anticipated sample size after inclusion and exclusion for this study was 160 patients. As HbA1c is a continuous variable and tested prior to treatment and up to 18-months posttreatment, a paired dependent 2-sided t test was used for this study. For a paired dependent t test with an α of 0.05 and a power of 80%, a sample size of 160 would be able to detect a moderately small, but clinically relevant effect size of 0.22. Descriptive statistics were used for secondary outcomes. For categorical data, frequencies and percentages are provided.
Results
A total of 437 patients were identified as having a diagnosis of T2DM and being prescribed a HCV DAA, of which 157 patients met inclusion criteria. The 280 excluded patients included 127 who were not on antihyperglycemics at the start of HCV treatment, 147 who did not have HbA1c data within the specified time frame, 4 were excluded due to delayed treatment initiation outside of the study time period, and 2 self-discontinued HCV treatment due to adverse drug reactions.
Baseline Demographics
The majority of patients were male (96%), primarily African American (56%), with a mean age of 62 years (Table 1). 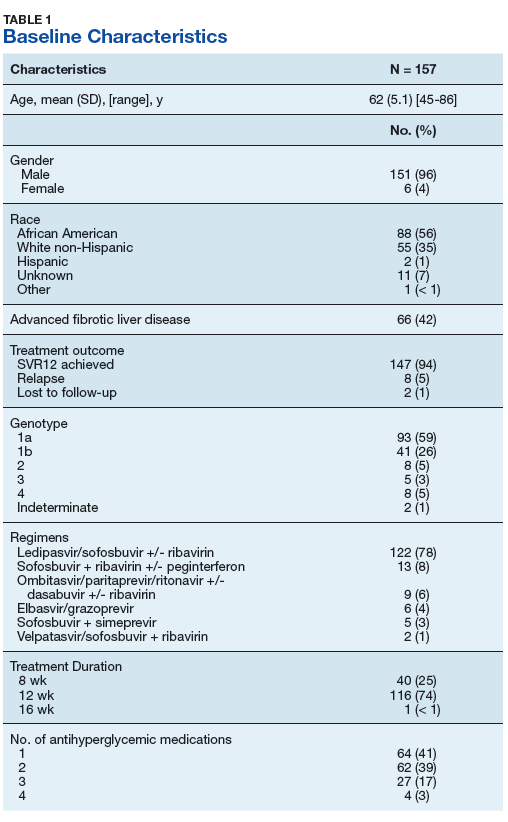
Metformin was the most commonly prescribed antihyperglycemic medication (62%), followed by insulin (54%), and sulfonylureas (40%) (Table 2). 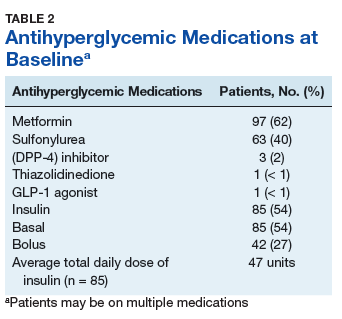
Primary and Secondary Endpoints
There was a significant immediate HbA1c lowering of 0.67% (from 7.67% to 7.00%; P < .001) in patients who achieved SVR12 over a mean of 2-months posttreatment (Figure 1). 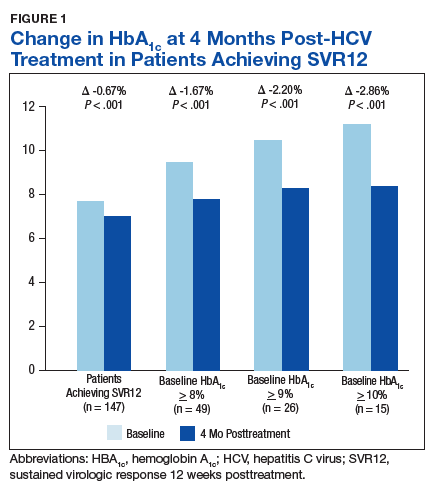
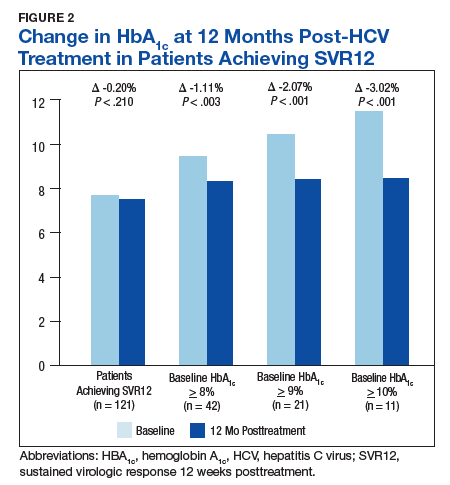
In the overall cohort of patients achieving SVR12, the HbA1c lowering was not sustained at 18 months posttreatment. However, a subanalysis demonstrated that patients with baseline HbA1c ≥ 8%, ≥ 9%, and ≥ 10% had an increasingly larger HbA1c Δ upon HCV treatment completion; the change in HbA1c for these subcohorts did remain significant at sustained time points. Patients with a baseline HbA1c ≥ 8%, ≥ 9%, and ≥ 10%, showed 18-month posttreatment HbA1c decreases of 1.65% (P < .001), 2.28% (P = .004), and 3.63% (P = .003), respectively (Figure 3). 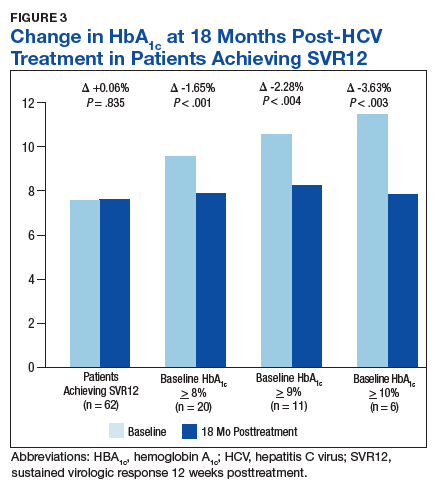
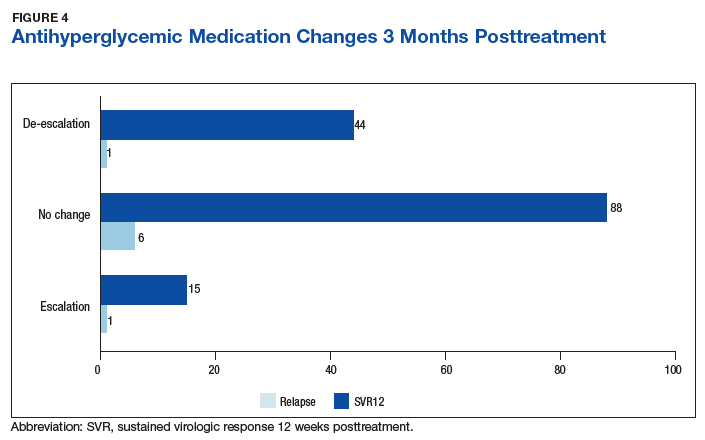
Of the 8 patients who relapsed, there was a significant decrease in HbA1c of 0.90% from 7.54% to 6.64% (P = .024) at 4 months posttreatment. Of the relapsers who had HbA1c values up to 12 months and 18-months posttreatment, the observed change in HbA1c was 0.61% and 0.2%, respectively. However, the data are limited by its small numbers. One (13%) of the HCV treatment relapsers had an escalation of their antihyperglycemic regimen, while 1 (13%) had a de-escalation, and the remaining 6 (75%) had no change.
Discussion
The immediate reduction in HbA1c following HCV treatment observed in this study of -0.67% is clinically significant and contrasts with the expected rise in HbA1c seen with normal disease progression. The results from this study are comparable to HbA1c reductions seen with certain oral, antihyperglycemic medications, such as DPP-4 inhibitors, meglitinides, and SGLT-2 inhibitors that have an average HbA1c lowering of 0.5% to 1%. This effect was increasingly magnified in patients with a higher baseline HbA1c.
The sustained effect on HbA1c may have not been seen in the overall cohort achieving SVR12 due to the fairly well-controlled mean baseline HbA1c for this older patient cohort. In addition to improvements in HbA1c, one-third of patients achieving SVR12 required de-escalation of concomitant antihyperglycemic medications. The de-escalation of antihyperglycemics may have made the sustained HbA1c impact underappreciated in the overall cohort. There were also limited sustained HbA1c data to evaluate at the time the review was completed.
Despite the clinically significant magnitude of HbA1c change, this study suggests that this effect is not predictable for all patients with DM achieving SVR12 from HCV treatment. Nineteen percent (28/147) of these patients neither had a decrease in their HbA1c nor a de-escalation of their antihyperglycemic treatment. Patients whose T2DM onset preceded or was independent of the diabetogenic effects of HCV may be more likely to have insulin resistance unaffected by hepatitis C viral clearance. Notably, the small number of treatment relapses in this study limits this group’s ability to serve as a comparator. However, one may expect a treatment relapse to have an initial decrease in insulin resistance while the hepatitis C viral load decreases below the level of detectability, yet the effects not be sustained once the HCV relapses.
Of the 35 patients who had their HbA1c decrease to < 6% following HCV treatment, concerningly 29 (83%) had either no change or even had an escalation in their antihyperglycemic regimen. This lack of de-escalation occurred despite 45% (13/29) of these patients continuing insulin posttreatment. These patients may be at a particularly high risk for hypoglycemia. Given the mean age of patients was 62 years, extremely tight glycemic control typically is not the goal for this older patient population with numerous comorbidities and high potential for hypoglycemia unawareness.
This raises concerns that patients with T2DM undergoing HCV treatment experience a new heightened risk of hypoglycemia, particularly if neither patients or providers managing DM are aware of the high potential for decreased antihyperglycemic needs upon achieving hepatitis C virologic response. It is important that these providers are aware of the mean decreased insulin resistance achieved from hepatitis C viral clearance. Providers managing DM should advise frequent serum blood glucose monitoring with close follow-up to allow for medication adjustments to prevent hypoglycemic episodes occurring during and after HCV treatment.
Limitations
The limitations of this study included small sample sizes in subgroups, and the retrospective design prohibited the ability to quantify and describe hypoglycemic events that may have occurred as a result of HCV treatment. In addition, the documentation of medication changes in CPRS may not have fully accounted for adjustments or self-discontinuations of DM medications. An alternative definition for change in antihyperglycemic medications may have accounted for the variable HbA1c-lowering between oral antihyperglycemic medications.
Finally, hemoglobin was not collected to account for any impact ribavirin-associated anemia may have had on the immediate posttreatment HbA1c values. Phase 3 DAA trials have demonstrated that between 7% and 9% of patients on ribavirin-containing DAA regimens are expected to have a hemoglobin < 10 g/dL during the HCV treatment course.33-36 Ribavirin-containing regimens may minimally impact the immediate posttreatment HbA1c result, but not necessarily the 12- or 18-month posttreatment HbA1c levels due to the reversible nature of this adverse effect (AE) following discontinuation of ribavirin.
Future studies may be strengthened by controlling for possible confounders such as concomitant ribavirin, adherence to antihyperglycemic medications, comorbidities, years since initial DM diagnosis, and lifestyle modifications, including a decrease of alcohol consumption. A prospective study also may include data on hypoglycemic events and further determine the sustained response by including an 18- or 24-month posttreatment HbA1c in the protocol.
Conclusion
The findings of this study validate the significant HbA1c changes post-HCV treatment described in the recent veteran database study.32 However, the current study’s validated patient chart data provide a better understanding of the changes made to antihyperglycemic regimens. This also is the first study describing this phenomenon of improved insulin resistance to only be observed in approximately 80% of patients infected with HCV and comorbid T2DM. Furthermore, the variable magnitude of HbA1c impact reliant on baseline HbA1c is informative for individual patient management. In addition to the direct benefits for the liver on hepatitis C viral eradication, improvements in HbA1c and the de-escalation of antihyperglycemic regimens may be a benefit of receiving HCV treatment.
The improved DM control achieved with hepatitis C viral eradication may represent an opportunity to prevent progressive DM and cardiovascular AEs. Additionally, HCV treatment may be able to prevent the onset of T2DM in patients at risk. Arguably HCV treatment has significant benefits in terms of health outcomes, quality of life, and long-term cost avoidance to patients beyond the well-described value of decreasing liver-related morbidity and mortality. This may be an incentive for payers to improve access to HCV DAAs by expanding eligibility criteria beyond those with advanced fibrotic liver disease.
Acknowledgments
This material is the result of work supported with the resources and the use of facilities at the VA Northeast Ohio Healthcare System.
1. Backus LI, Belperio PS, Loomis TP, Yip GH, Mole LA. Hepatitis C virus screening and prevalence among US veterans in Department of Veterans Affairs care. JAMA Intern Med. 2013;173(16):1549-1552.
2. Edlin BR, Eckhardt BJ, Shu MA, Holmberg SD, Swan T. Toward a more accurate estimate of the prevalence of hepatitis C in the United States. Hepatology. 2015;62(5):1353-1363.
3. World Health Organization. Guidelines for the screening, care and treatment of persons with hepatitis C infection. http://www.who.int/hiv/pub/hepatitis/hepatitis-c-guidelines/en/. Published April 2014. Accessed January 24, 2019.
4. Antonelli A, Ferri C, Galeazzi C, et al. HCV infection: pathogenesis, clinical manifestations and therapy. Clin Exp Rheumatol. 2008;26(1)(suppl 48):S39-S47.
5. Jacobson IM, Cacoub P, Dal Maso L, Harrison SA, Younossi ZM. Manifestations of chronic hepatitis C virus infection beyond the liver. Clin Gastroenterol Hepatol. 2010;8(12):1017-1029.
6. Antonelli A, Ferrari SM, Giuggioli D, et al. Hepatitis C virus infection and type 1 and type 2 diabetes mellitus. World J Diabetes. 2014;5(5):586-600.
7. Knobler H, Schihmanter R, Zifroni A, Fenakel G, Schattner A. Increased risk of type 2 diabetes mellitus in non-cirrhotic patients with hepatitis C. Mayo Clin Proc. 2000;75(4):355-359.
8. Hammerstad SS, Grock SF, Lee HJ, Hasham A, Sundaram N, Tomer Y. Diabetes and hepatitis C: a two-way association. Front Endocrinol (Lausanne). 2015;6:134.
9. Mehta SH, Brancati FI, Sulkowski MS, Strathdee SA, Szklo M, Thomas DL. Prevalence of type 2 diabetes mellitus among persons with hepatitis C virus infection in the United States. Ann Interns Med. 2000;133(8):592-599.
10. Wang CS, Wang ST, Yao WJ, Chang TT, Chou P. Hepatitis C virus infection and the development of type 2 diabetes in a community-based longitudinal study. Am J Epidemiol. 2007;166(2):196-203.
11. Allison ME, Wreghitt T, Palmer CR, Alexander GJ. Evidence for a link between hepatitis C virus infection and diabetes mellitus in a cirrhotic population. J Hepatol. 1994;21(6):1135-1139.
12. Kawaguchi T, Yoshida T, Harada M, et al. Hepatitis C virus down-regulates insulin receptor substrates 1 and 2 through up-regulation of suppressor of cytokine signaling 3. Am J Pathol. 2004;165(5):1499-1508.
13. Negro F, Alaei M. Hepatitis C virus and type 2 diabetes. World J Gastroenterol. 2009;15(13):1537-1547.
14. Knobler H, Schattner A. TNF-α, chronic hepatitis C and diabetes: a novel triad. QJM. 2005;98(1):1-6.
15. Greenberg AS, McDaniel ML. Identifying the links between obesity, insulin resistance and beta-cell function: potential role of adipocyte-derived cytokines in the pathogenesis of type 2 diabetes. Eur J Clin Invest. 2002;32(suppl 3):24-34.
16. Ruan H, Lodish HF. Insulin resistance in adipose tissue: direct and indirect effects of tumor necrosis factor-alpha. Cytokine Growth Factor Rev. 2003;14(5):447-455.
17. Kralj D, Virovic´ Jukic´ L, Stojsavljevic´ S, Duvnjak M, Smolic´ M, C˘urc˘ic´ IB. Hepatitis C virus, insulin resistance, and steatosis. J Clin Transl Hepatol. 2016;4(1):66-75.
18. Kawaguchi T, Ide T, Taniguchi E, et al. Clearance of HCV improves insulin resistance, beta-cell function, and hepatic expression of insulin receptor substrate 1 and 2. Am J Gastroenterol. 2007;102(3):570-576.
19. Kim HJ, Park JH, Park DI, et al. Clearance of HCV by combination therapy of pegylated interferon alpha-2a and ribavirin improves insulin resistance. Gut Liver. 2009;3(2):108-115.
20. Delgado-Borrego A, Jordan SH, Negre B, et al; Halt-C Trial Group. Reduction of insulin resistance with effective clearance of hepatitis C infection: results from the HALT-C trial. Clin Gastroenterol Hepatol. 2010;8(5):458-462.
21. Romero-Gómez M, Fernández-Rodríguez CM, Andrade RJ, et al. Effect of sustained virologic response to treatment on the incidence of abnormal glucose values in chronic hepatitis C. J Hepatol. 2008;48(5):721-727.
22. American Association for the Study of Liver Disease, Infectious Disease Society of America. HCV guidance: recommendations for testing, managing, and treating hepatitis C. http://www.hcvguidelines.org. Updated May 24, 20187. Accessed January 24, 2019.
23. Barua S, Greenwald R, Grebely J, Dore GJ, Swan T, Taylor LE. Restrictions for Medicaid reimbursement of sofosbuvir for the treatment of hepatitis C virus infection in the United States. Ann Intern Med. 2015;163(3):215-223.
24. Smith-Palmer J, Cerri K, Valentine W. Achieving sustained virologic response in hepatitis C: a systematic review of clinical, economic, and quality of life benefits. BMC Infect Dis. 2015;15:19.
25. Moucari R, Forestier N, Larrey D, et al. Danoprevir, an HCV NS3/4A protease inhibitor, improves insulin sensitivity in patients with genotype 1 chronic hepatitis C. Gut. 2010;59(12):1694-1698.
26. Pedersen MR, Backstedt D, Kakati BR, et al. Sustained virologic response to direct acting antiviral therapy improves components is associated with improvements in the metabolic syndrome. Abstract 1043. Presented at: The 66th Annual Meeting of the American Association for the Study of Liver Diseases: The Liver Meeting, October 2015; San Francisco, CA.
27. Doyle MA, Curtis C. Successful hepatitis C antiviral therapy induces remission of type 2 diabetes: a case report. Am J Case Rep. 2015;16:745-750.
28. Pavone P, Tieghi T, d’Ettore G, et al. Rapid decline of fasting glucose in HCV diabetic patients treated with direct-acting antiviral agents. Clin Microbiol Infect. 2016;22(5):462.e1-e3.
29. Pashun RA, Shen NT, Jesudian A. Markedly improved glycemic control in poorly controlled type 2 diabetes following direct acting antiviral treatment of genotype 1 hepatitis C. Case Reports Hepatol. 2016:7807921.
30. Stine JG, Wynter JA, Niccum B, Kelly V, Caldwell SH, Shah NL. Effect of treatment with direct acting antiviral on glycemic control in patients with diabetes mellitus and chronic hepatitis C. Ann Hepatol. 2017;16(2):215-220.
31. Davis TME, Davis WA, Jeffrey G. Successful withdrawal of insulin therapy after post-treatment clearance of hepatitis C virus in a man with type 2 diabetes. Am J Case Rep. 2017;18:414-417.
32. Hum J, Jou JH, Green PK, et al. Improvement in glycemic control of type 2 diabetes after successful treatment of hepatitis C virus. Diabetes Care. 2017;40(9):1173-1180.
33. Afdhal N, Zeuzem S, Kwo P, et al; ION-1 Investigators. Ledipasvir and sofosbuvir for untreated HCV genotype 1 infection. N Engl J Med. 2014;370(20):1889-1898.
34. Afdhal N, Reddy R, Nelson DR, et al; ION-2 Investigators. Ledipasvir and sofosbuvir for previously treated HCV genotype 1 infection. N Engl J Med. 2014:370 (16):1483-1493.
35. Ferenci P, Bernstein D, Lalezari J, et al; PEARL-III Study; PEARL-IV Study. ABT-450/r-ombitasvir and dasabuvir with or without ribavirin for HCV. N Engl J Med. 2014;370(21):1983-1992.
36. Poordad F, Hezode C, Trinh R, et al. ABT-450/r-ombitasvir and dasabuvir with ribavirin for hepatitis C with cirrhosis. N Engl J Med. 2014;370(21):1973-1982.
The immediate clinically significant reduction in hemoglobin A1c following HCV treatment observed in this study contrasts with the expected rise seen with normal disease progression.
The immediate clinically significant reduction in hemoglobin A1c following HCV treatment observed in this study contrasts with the expected rise seen with normal disease progression.
According to estimates, between 2.7 and 3.9 million people are infected with hepatitis C virus (HCV) in the US, with worldwide infection estimated to be about 185 million people.1-3 The majority of patients infected with HCV develop a chronic infection, which is the leading cause of liver-related complications in the Western world, including cirrhosis, hepatocellular carcinoma, and the need for liver transplantation.4 In addition to the direct effects HCV has on the liver, extrahepatic complications can occur, often related to the immune-mediated mechanism of cryoglobulinemia, such as vasculitis, renal disease, and palpable purpura. Additionally, > 70 studies globally have associated HCV with insulin resistance and worsening glycemic control.5,6
The prevalence of patients infected with HCV that have comorbid type 2 diabetes mellitus (T2DM) is estimated to be about 30%.7,8 The landmark cross-sectional National Health and Nutrition Examination Survey III study found the prevalence of T2DM among HCV patients in the US aged > 40 years to be about 3-fold higher than those without HCV.9 These findings were further supported by a Taiwanese prospective community-based cohort study that found a higher incidence of T2DM in HCV-positive patients compared with HCV negative patients (hazard ratio [HR], 1.7; 95% CI, 1.3-2.1).10 This relationship appears to be separate from the diabetogenic effect of cirrhosis itself as a significantly higher prevalence of DM has been observed in people with HCV when compared with people with cirrhosis due to other etiologies.11 Although the mechanism for this relationship is not fully understood and is likely multifactorial, it is believed to primarily be an effect of the HCV core protein increasing phosphorylation of insulin receptor substrate-1.6,12,13 The increased presence of the inflammatory cytokine, tumor necrosis factor-α, is also believed to play a role in the effects on insulinreceptor substrate-1 as well as mediating hepatic insulin resistance, stimulating lipolysis, down-regulating peroxisome proliferator-activated receptor-γ, and interfering with β-cell function.14-17
The relationship between HCV and T2DM has been further established by measured improvements in insulin resistance among patients undergoing HCV treatment with the pre-2011 standard of care—peginterferon and ribavirin.Kawaguchi and colleagues found sustained treatment responders to have a significant decrease in both the homeostatic model assessment-insulin resistance (HOMA-IR) score, representing insulin resistance, and the HOMA-β score, representing β-cell function.18 Improvements in the HOMA-IR score were further validated by Kim and colleagues and a nested cohort within the Hepatitis C Long-term Treatment against Cirrhosis (HALT-C) trial.19,20 Furthermore, Romero-Gómez and colleagues found that patients achieving a cure from HCV treatment defined as a sustained virologic response (SVR) had a nearly 50% reduced risk of impaired fasting glucose or T2DM over a mean posttreatment follow-up of 27 months.21
The recent development of direct-acting antivirals (DAAs) has marked significant HCV treatment advances in terms of efficacy and tolerability, leading current guidelines to emphasize that nearly all patients with HCV would benefit from treatment.22 Despite these guidelines, issues have been documented throughout the US with payors often limiting this costly treatment to only those with advanced fibrotic disease.23 Although the benefits of HCV treatment on reducing liver-related morbidity and mortality may be most appreciated in individuals with advanced fibrotic liver disease, improvements in insulin resistance would suggest potential morbidity and mortality benefits beyond the liver in many more at-risk individuals.24
Increasingly, cases are being reported of new DAA regimens having a significant impact on reducing insulin resistance as demonstrated by marked decreases in antihyperglycemic requirements, fasting blood glucose, and hemoglobin A1c (HbA1c).25-30 One striking case describes a patient being able to de-escalate his regimen from 42 daily units of insulin to a single oral dipeptidyl peptidase-4 inhibitor while maintaining goal HbA1c level over a 2-year time period.31 A database-driven study of veterans found a mean HbA1c drop of 0.37% in its overall included cohort of patients with T2DM who achieved SVR from HCV DAA treatment.32
Despite these data, the individual predictability and variable magnitude of improved insulin resistance based on baseline HbA1c remains unknown. The objective of this study was to assess the impact of HCV treatment with short course DAAs on glucose control in veteran patients with T2DM at a single center.
Methods
This retrospective cohort study was performed at the Department of Veterans Affairs (VA) Northeast Ohio Healthcare System (VANEOHS) in Cleveland. This study received approval from the VANEOHS Institutional Review Board. Retrospective patient data were collected from the Veterans Health Administration (VHA) Computerized Patient Record System (CPRS) electronic health record. Collectively, the VHA has treated > 100,000 patients with DAAs, making it the largest provider of HCV treatment in the US. VANEOHS has treated nearly 2,000 patients with DAAs, rendering it one of the largest single-institution cohorts to be able to examine the effects of HCV treatment on subpopulations, such as patients with T2DM.
Patient Population
Patients were identified using ICD-9/10 codes for T2DM and medication dispense history of hepatitis C DAAs. Patients were included if they had a diagnosis of T2DM, were initiated on a hepatitis C DAA between February 1, 2014 to September 26, 2016. To be eligible, patients were required to have both a baseline HbA1c within 6 months prior to starting HCV treatment as well as a HbA1c within 4 months posttreatment. The HCV treatment included were new short-course DAAs, including sofosbuvir, simeprevir, ombitasvir/paritaprevir/ritonavir ± dasabuvir, ledipasvir/sofosbuvir, elbasvir/grazoprevir, and sofosbuvir/velpatasvir. Patients were excluded if they were not on any antihyperglycemic medications at the start of HCV treatment or did not complete a full HCV treatment course.
Baseline Characteristics
Pertinent demographic data collected at baseline included patient age, gender, HCV genotype, and presence of advanced fibrotic liver disease (defined as a Metavir fibrosis stage 4 on liver biopsy, transient elastography > 12.5 kPa, or radiologic evidence of cirrhosis). HCV treatment initiation and completion dates were collected along with treatment response at 12 weeks posttreatment. Patients were considered to have achieved SVR12 if their hepatitis C viral load remained undetectable at posttreatment day 77 or thereafter. Treatment relapse was defined as a patient who achieved an undetectable HCV RNA by the end of treatment but subsequently had detectable HCV RNA following treatment cessation.
Outcome Measures
Baseline HbA1c was defined as the HbA1c drawn closest to the date of HCV treatment initiation, at least 6 months prior to treatment. Immediate posttreatment HbA1c was defined as HbA1c drawn up to 4 months posttreatment, and sustained HbA1c was captured up to 18 months posttreatment. Antihyperglycemic medication regimens and doses were collected at baseline, the end of treatment, and 3 months posttreatment via medication dispense history as well as provider notes documented in CPRS.
The primary endpoint was the change in HbA1c up to 4 months posttreatment in patients achieving SVR12. Secondary endpoints included the sustained change in HbA1c up to 12- and 18-months posttreatment, as well as change in antihyperglycemic medications from baseline to the end of HCV treatment and from baseline to 3 months posttreatment in patients achieving SVR12.
Statistical Analysis
The anticipated sample size after inclusion and exclusion for this study was 160 patients. As HbA1c is a continuous variable and tested prior to treatment and up to 18-months posttreatment, a paired dependent 2-sided t test was used for this study. For a paired dependent t test with an α of 0.05 and a power of 80%, a sample size of 160 would be able to detect a moderately small, but clinically relevant effect size of 0.22. Descriptive statistics were used for secondary outcomes. For categorical data, frequencies and percentages are provided.
Results
A total of 437 patients were identified as having a diagnosis of T2DM and being prescribed a HCV DAA, of which 157 patients met inclusion criteria. The 280 excluded patients included 127 who were not on antihyperglycemics at the start of HCV treatment, 147 who did not have HbA1c data within the specified time frame, 4 were excluded due to delayed treatment initiation outside of the study time period, and 2 self-discontinued HCV treatment due to adverse drug reactions.
Baseline Demographics
The majority of patients were male (96%), primarily African American (56%), with a mean age of 62 years (Table 1).
Metformin was the most commonly prescribed antihyperglycemic medication (62%), followed by insulin (54%), and sulfonylureas (40%) (Table 2).
Primary and Secondary Endpoints
There was a significant immediate HbA1c lowering of 0.67% (from 7.67% to 7.00%; P < .001) in patients who achieved SVR12 over a mean of 2-months posttreatment (Figure 1).
In the overall cohort of patients achieving SVR12, the HbA1c lowering was not sustained at 18 months posttreatment. However, a subanalysis demonstrated that patients with baseline HbA1c ≥ 8%, ≥ 9%, and ≥ 10% had an increasingly larger HbA1c Δ upon HCV treatment completion; the change in HbA1c for these subcohorts did remain significant at sustained time points. Patients with a baseline HbA1c ≥ 8%, ≥ 9%, and ≥ 10%, showed 18-month posttreatment HbA1c decreases of 1.65% (P < .001), 2.28% (P = .004), and 3.63% (P = .003), respectively (Figure 3).
Of the 8 patients who relapsed, there was a significant decrease in HbA1c of 0.90% from 7.54% to 6.64% (P = .024) at 4 months posttreatment. Of the relapsers who had HbA1c values up to 12 months and 18-months posttreatment, the observed change in HbA1c was 0.61% and 0.2%, respectively. However, the data are limited by its small numbers. One (13%) of the HCV treatment relapsers had an escalation of their antihyperglycemic regimen, while 1 (13%) had a de-escalation, and the remaining 6 (75%) had no change.
Discussion
The immediate reduction in HbA1c following HCV treatment observed in this study of -0.67% is clinically significant and contrasts with the expected rise in HbA1c seen with normal disease progression. The results from this study are comparable to HbA1c reductions seen with certain oral, antihyperglycemic medications, such as DPP-4 inhibitors, meglitinides, and SGLT-2 inhibitors that have an average HbA1c lowering of 0.5% to 1%. This effect was increasingly magnified in patients with a higher baseline HbA1c.
The sustained effect on HbA1c may have not been seen in the overall cohort achieving SVR12 due to the fairly well-controlled mean baseline HbA1c for this older patient cohort. In addition to improvements in HbA1c, one-third of patients achieving SVR12 required de-escalation of concomitant antihyperglycemic medications. The de-escalation of antihyperglycemics may have made the sustained HbA1c impact underappreciated in the overall cohort. There were also limited sustained HbA1c data to evaluate at the time the review was completed.
Despite the clinically significant magnitude of HbA1c change, this study suggests that this effect is not predictable for all patients with DM achieving SVR12 from HCV treatment. Nineteen percent (28/147) of these patients neither had a decrease in their HbA1c nor a de-escalation of their antihyperglycemic treatment. Patients whose T2DM onset preceded or was independent of the diabetogenic effects of HCV may be more likely to have insulin resistance unaffected by hepatitis C viral clearance. Notably, the small number of treatment relapses in this study limits this group’s ability to serve as a comparator. However, one may expect a treatment relapse to have an initial decrease in insulin resistance while the hepatitis C viral load decreases below the level of detectability, yet the effects not be sustained once the HCV relapses.
Of the 35 patients who had their HbA1c decrease to < 6% following HCV treatment, concerningly 29 (83%) had either no change or even had an escalation in their antihyperglycemic regimen. This lack of de-escalation occurred despite 45% (13/29) of these patients continuing insulin posttreatment. These patients may be at a particularly high risk for hypoglycemia. Given the mean age of patients was 62 years, extremely tight glycemic control typically is not the goal for this older patient population with numerous comorbidities and high potential for hypoglycemia unawareness.
This raises concerns that patients with T2DM undergoing HCV treatment experience a new heightened risk of hypoglycemia, particularly if neither patients or providers managing DM are aware of the high potential for decreased antihyperglycemic needs upon achieving hepatitis C virologic response. It is important that these providers are aware of the mean decreased insulin resistance achieved from hepatitis C viral clearance. Providers managing DM should advise frequent serum blood glucose monitoring with close follow-up to allow for medication adjustments to prevent hypoglycemic episodes occurring during and after HCV treatment.
Limitations
The limitations of this study included small sample sizes in subgroups, and the retrospective design prohibited the ability to quantify and describe hypoglycemic events that may have occurred as a result of HCV treatment. In addition, the documentation of medication changes in CPRS may not have fully accounted for adjustments or self-discontinuations of DM medications. An alternative definition for change in antihyperglycemic medications may have accounted for the variable HbA1c-lowering between oral antihyperglycemic medications.
Finally, hemoglobin was not collected to account for any impact ribavirin-associated anemia may have had on the immediate posttreatment HbA1c values. Phase 3 DAA trials have demonstrated that between 7% and 9% of patients on ribavirin-containing DAA regimens are expected to have a hemoglobin < 10 g/dL during the HCV treatment course.33-36 Ribavirin-containing regimens may minimally impact the immediate posttreatment HbA1c result, but not necessarily the 12- or 18-month posttreatment HbA1c levels due to the reversible nature of this adverse effect (AE) following discontinuation of ribavirin.
Future studies may be strengthened by controlling for possible confounders such as concomitant ribavirin, adherence to antihyperglycemic medications, comorbidities, years since initial DM diagnosis, and lifestyle modifications, including a decrease of alcohol consumption. A prospective study also may include data on hypoglycemic events and further determine the sustained response by including an 18- or 24-month posttreatment HbA1c in the protocol.
Conclusion
The findings of this study validate the significant HbA1c changes post-HCV treatment described in the recent veteran database study.32 However, the current study’s validated patient chart data provide a better understanding of the changes made to antihyperglycemic regimens. This also is the first study describing this phenomenon of improved insulin resistance to only be observed in approximately 80% of patients infected with HCV and comorbid T2DM. Furthermore, the variable magnitude of HbA1c impact reliant on baseline HbA1c is informative for individual patient management. In addition to the direct benefits for the liver on hepatitis C viral eradication, improvements in HbA1c and the de-escalation of antihyperglycemic regimens may be a benefit of receiving HCV treatment.
The improved DM control achieved with hepatitis C viral eradication may represent an opportunity to prevent progressive DM and cardiovascular AEs. Additionally, HCV treatment may be able to prevent the onset of T2DM in patients at risk. Arguably HCV treatment has significant benefits in terms of health outcomes, quality of life, and long-term cost avoidance to patients beyond the well-described value of decreasing liver-related morbidity and mortality. This may be an incentive for payers to improve access to HCV DAAs by expanding eligibility criteria beyond those with advanced fibrotic liver disease.
Acknowledgments
This material is the result of work supported with the resources and the use of facilities at the VA Northeast Ohio Healthcare System.
1. Backus LI, Belperio PS, Loomis TP, Yip GH, Mole LA. Hepatitis C virus screening and prevalence among US veterans in Department of Veterans Affairs care. JAMA Intern Med. 2013;173(16):1549-1552.
2. Edlin BR, Eckhardt BJ, Shu MA, Holmberg SD, Swan T. Toward a more accurate estimate of the prevalence of hepatitis C in the United States. Hepatology. 2015;62(5):1353-1363.
3. World Health Organization. Guidelines for the screening, care and treatment of persons with hepatitis C infection. http://www.who.int/hiv/pub/hepatitis/hepatitis-c-guidelines/en/. Published April 2014. Accessed January 24, 2019.
4. Antonelli A, Ferri C, Galeazzi C, et al. HCV infection: pathogenesis, clinical manifestations and therapy. Clin Exp Rheumatol. 2008;26(1)(suppl 48):S39-S47.
5. Jacobson IM, Cacoub P, Dal Maso L, Harrison SA, Younossi ZM. Manifestations of chronic hepatitis C virus infection beyond the liver. Clin Gastroenterol Hepatol. 2010;8(12):1017-1029.
6. Antonelli A, Ferrari SM, Giuggioli D, et al. Hepatitis C virus infection and type 1 and type 2 diabetes mellitus. World J Diabetes. 2014;5(5):586-600.
7. Knobler H, Schihmanter R, Zifroni A, Fenakel G, Schattner A. Increased risk of type 2 diabetes mellitus in non-cirrhotic patients with hepatitis C. Mayo Clin Proc. 2000;75(4):355-359.
8. Hammerstad SS, Grock SF, Lee HJ, Hasham A, Sundaram N, Tomer Y. Diabetes and hepatitis C: a two-way association. Front Endocrinol (Lausanne). 2015;6:134.
9. Mehta SH, Brancati FI, Sulkowski MS, Strathdee SA, Szklo M, Thomas DL. Prevalence of type 2 diabetes mellitus among persons with hepatitis C virus infection in the United States. Ann Interns Med. 2000;133(8):592-599.
10. Wang CS, Wang ST, Yao WJ, Chang TT, Chou P. Hepatitis C virus infection and the development of type 2 diabetes in a community-based longitudinal study. Am J Epidemiol. 2007;166(2):196-203.
11. Allison ME, Wreghitt T, Palmer CR, Alexander GJ. Evidence for a link between hepatitis C virus infection and diabetes mellitus in a cirrhotic population. J Hepatol. 1994;21(6):1135-1139.
12. Kawaguchi T, Yoshida T, Harada M, et al. Hepatitis C virus down-regulates insulin receptor substrates 1 and 2 through up-regulation of suppressor of cytokine signaling 3. Am J Pathol. 2004;165(5):1499-1508.
13. Negro F, Alaei M. Hepatitis C virus and type 2 diabetes. World J Gastroenterol. 2009;15(13):1537-1547.
14. Knobler H, Schattner A. TNF-α, chronic hepatitis C and diabetes: a novel triad. QJM. 2005;98(1):1-6.
15. Greenberg AS, McDaniel ML. Identifying the links between obesity, insulin resistance and beta-cell function: potential role of adipocyte-derived cytokines in the pathogenesis of type 2 diabetes. Eur J Clin Invest. 2002;32(suppl 3):24-34.
16. Ruan H, Lodish HF. Insulin resistance in adipose tissue: direct and indirect effects of tumor necrosis factor-alpha. Cytokine Growth Factor Rev. 2003;14(5):447-455.
17. Kralj D, Virovic´ Jukic´ L, Stojsavljevic´ S, Duvnjak M, Smolic´ M, C˘urc˘ic´ IB. Hepatitis C virus, insulin resistance, and steatosis. J Clin Transl Hepatol. 2016;4(1):66-75.
18. Kawaguchi T, Ide T, Taniguchi E, et al. Clearance of HCV improves insulin resistance, beta-cell function, and hepatic expression of insulin receptor substrate 1 and 2. Am J Gastroenterol. 2007;102(3):570-576.
19. Kim HJ, Park JH, Park DI, et al. Clearance of HCV by combination therapy of pegylated interferon alpha-2a and ribavirin improves insulin resistance. Gut Liver. 2009;3(2):108-115.
20. Delgado-Borrego A, Jordan SH, Negre B, et al; Halt-C Trial Group. Reduction of insulin resistance with effective clearance of hepatitis C infection: results from the HALT-C trial. Clin Gastroenterol Hepatol. 2010;8(5):458-462.
21. Romero-Gómez M, Fernández-Rodríguez CM, Andrade RJ, et al. Effect of sustained virologic response to treatment on the incidence of abnormal glucose values in chronic hepatitis C. J Hepatol. 2008;48(5):721-727.
22. American Association for the Study of Liver Disease, Infectious Disease Society of America. HCV guidance: recommendations for testing, managing, and treating hepatitis C. http://www.hcvguidelines.org. Updated May 24, 20187. Accessed January 24, 2019.
23. Barua S, Greenwald R, Grebely J, Dore GJ, Swan T, Taylor LE. Restrictions for Medicaid reimbursement of sofosbuvir for the treatment of hepatitis C virus infection in the United States. Ann Intern Med. 2015;163(3):215-223.
24. Smith-Palmer J, Cerri K, Valentine W. Achieving sustained virologic response in hepatitis C: a systematic review of clinical, economic, and quality of life benefits. BMC Infect Dis. 2015;15:19.
25. Moucari R, Forestier N, Larrey D, et al. Danoprevir, an HCV NS3/4A protease inhibitor, improves insulin sensitivity in patients with genotype 1 chronic hepatitis C. Gut. 2010;59(12):1694-1698.
26. Pedersen MR, Backstedt D, Kakati BR, et al. Sustained virologic response to direct acting antiviral therapy improves components is associated with improvements in the metabolic syndrome. Abstract 1043. Presented at: The 66th Annual Meeting of the American Association for the Study of Liver Diseases: The Liver Meeting, October 2015; San Francisco, CA.
27. Doyle MA, Curtis C. Successful hepatitis C antiviral therapy induces remission of type 2 diabetes: a case report. Am J Case Rep. 2015;16:745-750.
28. Pavone P, Tieghi T, d’Ettore G, et al. Rapid decline of fasting glucose in HCV diabetic patients treated with direct-acting antiviral agents. Clin Microbiol Infect. 2016;22(5):462.e1-e3.
29. Pashun RA, Shen NT, Jesudian A. Markedly improved glycemic control in poorly controlled type 2 diabetes following direct acting antiviral treatment of genotype 1 hepatitis C. Case Reports Hepatol. 2016:7807921.
30. Stine JG, Wynter JA, Niccum B, Kelly V, Caldwell SH, Shah NL. Effect of treatment with direct acting antiviral on glycemic control in patients with diabetes mellitus and chronic hepatitis C. Ann Hepatol. 2017;16(2):215-220.
31. Davis TME, Davis WA, Jeffrey G. Successful withdrawal of insulin therapy after post-treatment clearance of hepatitis C virus in a man with type 2 diabetes. Am J Case Rep. 2017;18:414-417.
32. Hum J, Jou JH, Green PK, et al. Improvement in glycemic control of type 2 diabetes after successful treatment of hepatitis C virus. Diabetes Care. 2017;40(9):1173-1180.
33. Afdhal N, Zeuzem S, Kwo P, et al; ION-1 Investigators. Ledipasvir and sofosbuvir for untreated HCV genotype 1 infection. N Engl J Med. 2014;370(20):1889-1898.
34. Afdhal N, Reddy R, Nelson DR, et al; ION-2 Investigators. Ledipasvir and sofosbuvir for previously treated HCV genotype 1 infection. N Engl J Med. 2014:370 (16):1483-1493.
35. Ferenci P, Bernstein D, Lalezari J, et al; PEARL-III Study; PEARL-IV Study. ABT-450/r-ombitasvir and dasabuvir with or without ribavirin for HCV. N Engl J Med. 2014;370(21):1983-1992.
36. Poordad F, Hezode C, Trinh R, et al. ABT-450/r-ombitasvir and dasabuvir with ribavirin for hepatitis C with cirrhosis. N Engl J Med. 2014;370(21):1973-1982.
Rethinking A1C targets for patients with mental illness?
The article, “Diabetes update: Your guide to the latest ADA standards,” by Shubrook, et al (J Fam Pract. 2016;65:310-318) is a precise review of current recommendations for diabetes. We would like to draw attention, however, to comorbid diabetes and mental illness.
Diabetes and serious mental illness often coincide, making the treatment of both conditions difficult and leading to higher rates of complications.1
The American Diabetes Association (ADA)’s “Standards of Medical Care in Diabetes” recognizes that hemoglobin A1C targets for patients should be individualized.2 We consider it important to discus
For example, a more lenient A1C goal may be appropriate when:
- the assessment of the patient shows that he or she is struggling with active symptoms of mental illness
- new medications with undesirable metabolic effects are prescribed or titrated
- social support is poor
- patients have limited confidence in their ability to accomplish tasks and goals
- patients have cognitive limitations
- patients abuse substances.
We suggest that when factors are favorable (eg, younger patient, well-controlled serious mental illness, adequate support, good cognitive skills, no hazardous use of substances, good level of confidence in the ability to control diabetes), the A1C target can be set lower. When the factors are less favorable (eg, older patient, poorly controlled mental illness, abusing substances, cognitive impairment), the target should be set higher and incrementally reduced as care engagement, circumstances, and symptom control improve.
There is a need for further research to investigate the factors that can impact diabetes self-management in patients with comorbid mental illness.
Corinna Falck-Ytter, MD
Stephanie W. Kanuch, MEd
Richard McCormick, PhD
Michael Purdum, PhD
Neal V. Dawson, MD
Shari D. Bolen, MD, MPH
Martha Sajatovic, MD
Cleveland, Ohio
1. Ducat L, Philipson LH, Anderson BJ. The mental health comorbidities of diabetes. JAMA. 2014;312:691-692.
2. American Diabetes Association. Standards of Medical Care in Diabetes—2016. Diabetes Care. 2016;39(Suppl 1). Available at: http://care.diabetesjournals.org/content/diacare/suppl/2015/12/21/39.Supplement_1.DC2/2016-Standards-of-Care.pdf. Accessed May 18, 2016.
The article, “Diabetes update: Your guide to the latest ADA standards,” by Shubrook, et al (J Fam Pract. 2016;65:310-318) is a precise review of current recommendations for diabetes. We would like to draw attention, however, to comorbid diabetes and mental illness.
Diabetes and serious mental illness often coincide, making the treatment of both conditions difficult and leading to higher rates of complications.1
The American Diabetes Association (ADA)’s “Standards of Medical Care in Diabetes” recognizes that hemoglobin A1C targets for patients should be individualized.2 We consider it important to discus
For example, a more lenient A1C goal may be appropriate when:
- the assessment of the patient shows that he or she is struggling with active symptoms of mental illness
- new medications with undesirable metabolic effects are prescribed or titrated
- social support is poor
- patients have limited confidence in their ability to accomplish tasks and goals
- patients have cognitive limitations
- patients abuse substances.
We suggest that when factors are favorable (eg, younger patient, well-controlled serious mental illness, adequate support, good cognitive skills, no hazardous use of substances, good level of confidence in the ability to control diabetes), the A1C target can be set lower. When the factors are less favorable (eg, older patient, poorly controlled mental illness, abusing substances, cognitive impairment), the target should be set higher and incrementally reduced as care engagement, circumstances, and symptom control improve.
There is a need for further research to investigate the factors that can impact diabetes self-management in patients with comorbid mental illness.
Corinna Falck-Ytter, MD
Stephanie W. Kanuch, MEd
Richard McCormick, PhD
Michael Purdum, PhD
Neal V. Dawson, MD
Shari D. Bolen, MD, MPH
Martha Sajatovic, MD
Cleveland, Ohio
1. Ducat L, Philipson LH, Anderson BJ. The mental health comorbidities of diabetes. JAMA. 2014;312:691-692.
2. American Diabetes Association. Standards of Medical Care in Diabetes—2016. Diabetes Care. 2016;39(Suppl 1). Available at: http://care.diabetesjournals.org/content/diacare/suppl/2015/12/21/39.Supplement_1.DC2/2016-Standards-of-Care.pdf. Accessed May 18, 2016.