User login
Impact of MC Intervention on QIs
Decompensated cirrhosis (DC) is defined as cirrhosis with at least 1 of the following complications: ascites, hepatocellular carcinoma, bleeding from portal hypertension, or hepatic encephalopathy. Patients with DC have a median survival estimated at 2 years compared to the 12‐year median survival of compensated cirrhotics.[1] In an era where quality of hospital care is being measured, and where progress is being made in the management of several conditions including congestive heart failure and nosocomial infections, little attention has been paid to DC. The burden of chronic liver failure is clear in the United States, where DC leads to more than 150,000 annual admissions to the hospital and accounts for 40,000 deaths annually.[2]
This burden of disease spurred quality improvement efforts in 2010, when a team of experts identified a set of literature‐based parameters or quality indicators (QI) for patients with cirrhosis.[3] We have demonstrated that adherence to these indicators fell far short of desired targets.[4] A year before their publication, an overall compliance of <50% with these metrics was measured at a single medical center.
We sought to improve the quality of care for patients with DC through implementation of mandatory consultation (MC) with a gastroenterologist for all patients admitted with DC. We assessed whether MC was associated with better care and improved outcomes (hospitalization length of stay [LOS], 30‐day readmission, and inpatient mortality) when compared to usual care (UC).[4]
MATERIALS AND METHODS
Design, Setting, and Patients
We conducted a cohort study comparing adherence to QI and outcomes of patients admitted with DC after the institution of an MC to a historical cohort of patients managed with UC (ie, before MC, adherence to QI for this group has been reported elsewhere).[4] Both cohorts included all patients aged >18 years with DC admitted to Baystate Medical Center, a tertiary care medical center in western Massachusetts. The UC cohort was collected between January 1, 2009 and December 31, 2009, and the MC cohort was assembled between June 1, 2011 and June 30, 2012.
As previously reported,[4] patients were considered for inclusion in the historical cohort if their International Classification of DiseasesNinth Revision discharge code pertained to chronic liver disease (see Supporting Information, Appendix 1, in the online version of this article). This list was broad by design to identify all patients with decompensated cirrhosis. A gastroenterologist (R.G.) then manually extracted charts from electronic medical records (EMRs) using a set of predefined clinical criteria, the same in both cohorts, to identify the patients with DC: cirrhosis with concomitant ascites, hepatic encephalopathy, or gastrointestinal (GI) bleeding secondary to portal hypertension. Other types of decompensated states, such as hepatocellular carcinoma, were not included as their management was not detailed in the QI.[3]
We included patients with suspected or established cirrhosis who had ascites confirmed radiographically or by exam, noting shifting dullness or fluid wave. However, patients were excluded if they lacked sufficient peritoneal fluid for bedside or image‐guided paracentesis. Cirrhotic patients were defined as having hepatic encephalopathy if the patient had altered mental status not secondary to seizures, cerebrovascular accident, or alcohol withdrawal. Finally, gastrointestinal bleeding in cirrhotic patients was defined as any upper or lower bleeding prompting hospital admission, or identified in the medical record as clinically significant by the attending physician.
The same QIs were measured in both cohorts. From the QI set,[3] we selected the 16 QIs that would apply to the management of inpatients (see Supporting Information, Appendix 2, in the online version of this article). Indicators developed for outpatient settings were not included. A quality score was calculated for each admission, defined as the proportion of QIs met divided by the number of QIs for which the patient was eligible. For example, a patient with hepatic encephalopathy but without GI bleeding or ascites would have a score calculated as the number of QIs met for hepatic encephalopathy and documentation of transplant evaluation divided by 3 (2 QIs for hepatic encephalopathy and 1 QI for transplant evaluation). If the patient met both QIs for hepatic encephalopathy, but the consultant failed to address liver transplant eligibility, the score would be 2/3=0.666.
After the institution of the MC, all inpatients with DC were identified within 24 hours of admission by a gastroenterologist (R.G., D.D.), who manually reviewed on a daily basis all admissions from EMRs. An author (R.G.) would then contact the admitting team (hospitalist or resident) to make sure that a gastroenterology consult was called and would then obtain the QI by manual extraction from the EMRs.
Of the 16 gastroenterologists who work at the hospital, 12 of them belong to several private practice groups, whereas 4 are employed by the hospital. As part of the intervention, all gastroenterologists were made aware of the intervention 1 month before the starting date, were provided with a checklist of the QIs of interest, and were encouraged to work with the hospitalist attendings to achieve compliance with the QIs. We reminded the gastroenterologists of the ongoing study during routine division meetings and regularly sought feedback from the hospitalists
The MC consisted of a systematic consultation by a gastroenterologist: any identified patient with DC would generate a mandatory GI consultation and would be assigned to a specialist depending on the roster coverage for that day. A close monitoring of the process allowed us to confirm that all patients admitted with DC were seen by a gastroenterologist. Patients were followed until their discharge, death, or readmission to our institution during the study period.
Outcomes
The primary outcome was defined as the rate of adherence to the QIs and overall QI score expressed as a proportion as noted above. Secondary outcomes included in‐hospital mortality, LOS, and 30‐day readmission rate. These parameters were abstracted from the medical record.
Covariates
The hospital EMR (Cerner Corporation, North Kansas City, MO) was used to extract patient demographic parameters such as gender, race, language, and age at time of admission. Other admission‐level details were extracted from the EMR including Model for End‐Stage Liver Disease (MELD) scores, documented comorbidities (including substance abuse, psychiatric diagnosis, diabetes mellitus, renal failure, congestive heart failure, coronary artery disease, and cancer), underlying etiology for cirrhosis, and reason for admission.
The study was approved by Baystate Medical Center's institutional review board.
Statistical Analysis
Summary statistics for outcomes and covariates were calculated as means/standard deviations (SDs), medians/emnterquartile range, and proportions. Univariable statistics (unpaired t tests, 1‐way analysis of variance, Fisher exact test, Spearman correlation) were used to identify possible demographic (eg, age, race) and clinical (eg, admission complaint) predictors of quality score and with 30‐day outcomes. For each admission, a composite quality score, also known as an opportunity model score,[5, 6] was calculated as a fraction (ie, the number of QIs met divided by the total number of possible QIs indicated by the patient's presentation). This fraction was then multiplied by 100 so as to express the QI score as a percent. Possible scores, therefore, ranged from 0 to 100%.
Calculation of the 30‐day incidence proportion of readmission after the first admission was restricted to patients whose readmission occurred in this hospital, and occurring up to 30‐days before study closure (June 1, 2012). In‐hospital death was examined as a function of QI score during that admission. To derive an unbiased, risk‐adjusted estimate of the association between quality score and outcomes, multiple linear regression (opportunity model score [OMS], LOS) or multiple Poisson regression models (30‐day readmission, in‐hospital death) were built. These included a dummy variable for the study period, as well as any potential confounder that was associated at P0.10, with both study period and the outcome in univariable analyses. Robust standard errors were specified to account for multiple admissions within patients. Marginal means or proportions were then estimated with 95% confidence intervals derived using the delta method. All analyses were performed using Stata 12.1 for Windows (StataCorp, College Station, TX).
RESULTS
A total of 303 patients were observed in 695 hospitalizations;149 patients in 379 admissions were observed in the UC cohort, and 154 patients in 316 admissions were observed in the MC cohort. Baseline demographics of all study admissions appear in Table 1. Patients seen in the MC cohort were younger, more likely to speak English, and less likely to be male or have comorbid diabetes mellitus. Most admissions (n=217, 57.2%; 95% confidence interval: 52.3%‐62.3%) were not evaluated by a gastroenterologist in the UC cohort but all were in the MC cohort.
| UC, N=379, N (%) or Mean/SD | MC, N=316, N (%) or Mean/SD | P Value* | |
|---|---|---|---|
| |||
| Age, y | 55.3/12.1 | 53.3/13.6 | 0.05 |
| English speaking | 261 (68.9%) | 261 (82.6%) | <0.001 |
| Male | 251 (66.2%) | 163 (53.5%) | 0.001 |
| Race | <0.001 | ||
| White | 301 (79.4%) | 262 (82.9%) | |
| Black | 31 (8.2%) | 40 (12.7%) | |
| Asian | 16 (4.2%) | 0 (0.0%) | |
| Other | 31 (8.2%) | 14 (4.4%) | |
| Comorbidities | |||
| Substance | 75 (19.8%) | 58 (18.4%) | 0.70 |
| abuse | |||
| Psychiatric | 123 (32.5%) | 103 (32.9%) | 0.94 |
| Diabetes mellitus | 175 (45.4%) | 115 (36.5%) | 0.02 |
| Renal failure | 74 (19.3%) | 55 (17.4%) | 0.50 |
| CHF | 38 (10.0%) | 24 (7.6%) | 0.35 |
| CAD | 26 (6.9%) | 17 (5.4%) | 0.43 |
| Cancer | 48 (12.7%) | 40 (12.7%) | 1.00 |
| Admission MELD | 15.6/6.9 | 17.0/7.0 | 0.006 |
| Serum creatinine | 1.43/1.94 | 1.42/1.30 | 0.91 |
| Reason for admission | |||
| Hepatology/GI | 318 (83.9%) | 257 (81.3%) | 0.42 |
| Renal failure | 85 (22.4%) | 90 (28.5%) | 0.08 |
| Encephalopathy | 151 (39.3%) | 113 (34.9%) | 0.24 |
| GI bleed | 78 (20.5%) | 57 (18.0%) | 1.00 |
| Abdominal pain | 116 (30.7%) | 114 (36.2%) | 0.15 |
| Ascites | 246 (64.9%) | 185 (58.5%) | 0.10 |
Admission Characteristics
The baseline clinical measures of all study admissions appear in Table 1. The UC and MC cohorts had similar characteristics, with the majority of patients with DC admitted for a gastrointestinal/hepatology‐related reason specifically for the management of ascites and hepatic encephalopathy. The patients in the MC cohort had a statistically higher MELD score on admission, which was not clinically relevant.
Quality Measures
Adherence to individual quality indices is shown in Table 2.
| Condition (Denominator) | Quality Indicator (Numerator) | UC (n=379), Met/Indicated | MC (n=316), Met/Indicated | P Value | |
|---|---|---|---|---|---|
| |||||
| Admissions with ascites | |||||
| 1 | Admissions to the hospital because of ascites or encephalopathy. | Diagnostic paracentesis during admission. | 77/193, 39.9%, (32.9%, 46.9%) | 111/135, 82.2% (75.7%, 88.8%) | <0.001 |
| 2 | No fibrinolysis or disseminated intravascular coagulation before paracentesis INR <2.5, >100,000 platelets. | No fresh frozen plasma or platelet replacement given. | 36/37, 97.3% (91.8%, 103.0%) | 41/42, 97.6% (92.8%, 102.4%) | 1.00 |
| 3 | All admissions with diagnostic paracentesis (not limited to admissions for ascites or hepatic encephalopathy). | Cell count differential, total protein, albumin, and culture/sensitivity all performed. | 31/49, 63.3% (49.3%‐77.3%) | 46/72 63.9% (52.7%, 75.0%) | 1.00 |
| 4 | Admissions with known portal hypertension‐related ascites receiving a paracentesis. | Ascitic fluid cell count and differential performed. | 15/104, 14.4% (7.6%‐ 21.3%) | 47/62, 75.8% (63.2%, 88.4%) | <0.001 |
| 5 | Serum sodium 110 mEq/L. | Fluid restriction and discontinuation of diuretics. | NA | NA | NA |
| 6 | Polymorphonuclear count of 250/mm3 in ascites. | Empiric antibiotics, 6 hours of results. | 10/13, 76.9% (50.4%‐ 103.4%) | 16/20, 80.0% (60.8%, 99.2%) | 1.00 |
| 7 | Ascitic fluid, total protein 1.1 gm/dL, serum bilirubin 2.5 mg/dL. | Prophylactic antibiotics. | 4/12, 33.3% (2.0%‐ 64.6%) | 18/30, 60.0%, (41.4%, 78.6%) | 0.18 |
| 8 | Normal renal function. | Salt restriction and diuretics (spironolactone and loop diuretics). | 57/186, 30.6%, (24.0%‐ 37.3%) | 81/122, 66.4%, (57.9%, 74.9%) | <0.001 |
| Total ascites subscore, mean/SD | 30%/36% | 67%/34% | <0.001 | ||
| GI bleeding | |||||
| 9 | Admissions with GI bleeding: variceal and nonvariceal, hematemesis and melena. | Upper endoscopy 24 hours of presentation. | 60/78, 76.9% (67.4%, 86.4%) | 52/57, 91.2% (83.7%, 98.8%) | 0.04 |
| 10 | Esophageal varices (active, stigmata of recent bleeding, or no other causes to explain bleeding). | Endoscopic variceal ligation/sublerotherapy. | 40/46, 87.0% (76.8%‐97.1%) | 30/32, 93.8% (84.9%, 100.0%) | 0.46 |
| 11 | Admissions with established/suspected upper GI bleeding. | Antibiotics within 24 hours of admission. | 27/69, 39.1% (27.3%‐ 50.9%) | 26/58, 44.8% (31.6%, 58.0%) | 0.59 |
| 12 | Admissions with established/suspected variceal bleeding. | Somatostatin/octreotide given within 12 hours of presentation. | 53/69, 76.8%, (66.6%‐ 87.0%) | 49/58, 84.5% (73.8%, 95.2%) | 0.37 |
| 13 | Recurrent bleeding within 72 hours of initial endoscopic hemostasis. | Repeat endoscopy or transjugular intrahepatic portosystemic shunt. | 5/5 100% | 2/3, 66.7% (76.8%, 210.0%) | 0.38 |
| Total GI subscore, mean/SD | 61%/38% | 74%/28% | 0.04 | ||
| Liver transplantation | |||||
| 14 | Admissions with MELD 15 or MELD 15 and decompensated status (ie, all admissions in our study). | Documented evaluation for liver transplantation. | 112/379, 29.6% (24.9%‐ 34.2%) | 231/316, 73.6% (68.7%, 78.5%) | <0.001 |
| Hepatic encephalopathy | |||||
| 15 | Admissions with hepatic encephalopathy. | Search for reversible factors documented. | 81/151, 53.6% (45.6%‐ 61.7 %) | 97/113, 85.8% (79.4%, 92.3%) | <0.001 |
| 16 | Admissions with hepatic encephalopathy. | Oral disaccharides/ rifaximin. | 144/151, 95.3% (91.9 %‐ 98.7 %) | 107/113, 94.7% (90.7%. 98.69%) | 1.00 |
| Total encephalopathy subscore, mean/SD | 75%/28% | 90%/24% | <0.001 | ||
Ascites
The management of ascites yielded 3 main differences between the 2 cohorts. Following the implementation of the MC, 82.2 % (111/135) of ascites‐related admissions led to a diagnostic paracentesis as compared to 39.9% (77/193) in the UC group (P<0.001).
In the MC cohort, 75.8% (47/62) of admissions with known portal hypertensionrelated ascites who received a paracentesis had an ascites cell count checked. In contrast, only 14.4% (15/104) in the UC group receiving paracentesis had a fluid cell count (P<0.001). The management of ascites in patients with normal renal function was optimal, with sodium restriction and diuretics combination in 66.4% (81/122) of the MC cohort, whereas this parameter in the UC cohort was only 30.6% (57/186) (P<0.001). There were no significant differences between the groups for the other QIs.
Variceal Bleeding
The MC group had a higher frequency of endoscopy within 24 hours of admissions than the UC group (91.2% [52/57] vs 76.9% [60/78], respectively; P<0.04). The rest had endoscopy later in the admission. Among admissions with bleeding from varices, banding was done 93.8% of the time for patients in the MC group (30/32), which was not statistically different than 87.0% (40/46) for patients seen in the UC group. In the remaining admissions, endoscopy only revealed nonbleeding large esophageal varices, and the endoscopist opted not to proceed with therapy. There were no statistically significant differences in the rest of the management.
Hepatic Encephalopathy
For hepatic encephalopathy, an empirical treatment was given to 95.3 % (144/151) patients in the UC group and 94.7% (107/113) of the patients in the MC group. We found better documentation of a search for underlying etiologies leading to hepatic encephalopathy in the MC cohort 85.8% (97/113) versus the UC cohort, which was only 53.6% (81/151) (P<0.001).
Evaluation for Liver Transplantation
Better documentation of evaluation for liver transplantation was seen in the MC group 73.6% (231/316) in comparison to the UC group 29.4% (111/379) (P<0.001).
Opportunity Score and Clinical Outcomes
As detailed above, care provided during the MC achieved a higher compliance with the QI shown with the QI score or OMS (Table 3). These improvements were not associated with statistically significant differences in in‐hospital death, LOS, or 30‐day readmission. To explore this further we also examined the direct association between the OMS and outcomes in the MC group by dividing patients into 2 groups: patients whose OMS was 80% and those whose OMS was <80% (see Supporting Information, Appendix 4, in the online version of this article). Although there were trends toward decreased in‐hospital death (6.4% vs 8.6%, P=0.26), increased 30‐day readmission (33.8% vs 23.0%, P=0.27), and decreased LOS (6.2 days vs 6.6 days, P=0.77), none of these differences achieved statistical significance.
| Unadjusted | Adjusted* | |||||
|---|---|---|---|---|---|---|
| UC | MC | Difference | UC | MC | Difference | |
| ||||||
| Opportunity model score | 0.46 | 0.77 | +0.31 (0.24, 0.39) | 0.46 | 0.77 | +0.30(0.23, 0.37) |
| In‐hospital death | 7.1% | 8.5% | +1.4 (0.3, +5.6) | 7.5% | 7.9% | +0.4% (4.0%, +4.5%) |
| Readmission within 30 days | 39.6% | 32.6% | 7.0% (16.4%, +2.5%) | 40.0% | 31.8% | 8.2%(18.0%, +1.5%) |
| Length of stay | 6.1d | 6.2d | +0.1d (1.0 d, +1.2 d) | 6.1d | 6.2d | +0.1d (1.0 d, +1.2d) |
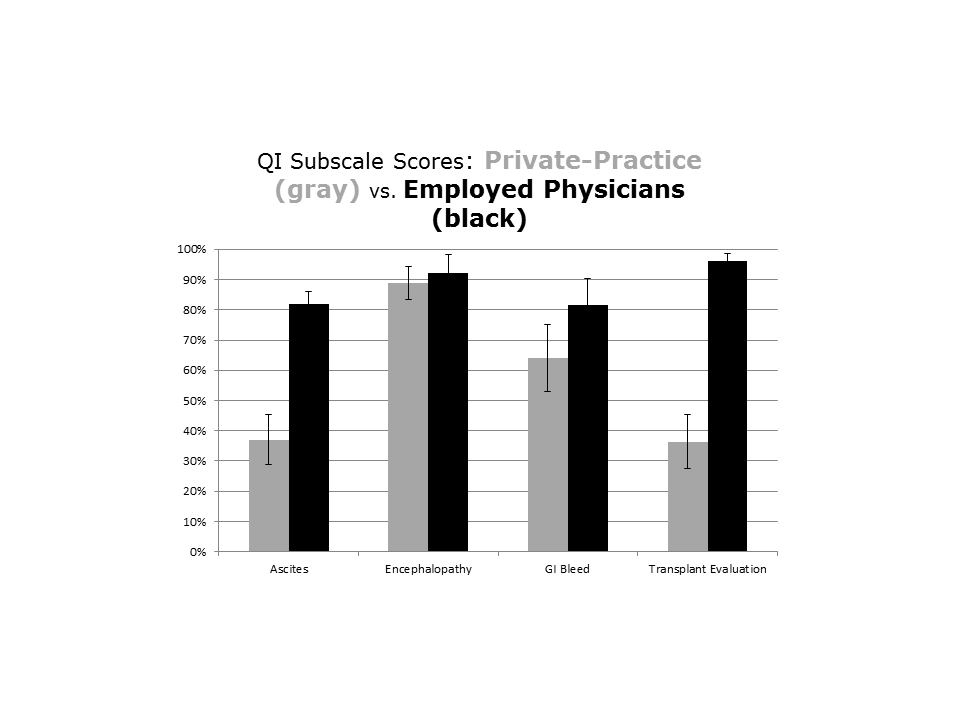
Mandatory Consultation Subgroups: Employed Versus Private Physicians
The type of employment of the gastroenterologist on consultation (employed by the hospital vs private practice) affected the management of the patients admitted with DC (see Supporting Information, Appendix 3, in the online version of this article). Patients seen by a hospital‐employed gastroenterologist were more likely to have a better documentation in regard to evaluation for liver transplantation and better management of ascites. Except for the prescription of antibiotics in patients presenting with GI bleeding, which were more often given by the employed physician (63% vs 23%, P=0.004), the management of hepatic encephalopathy and GI bleeding was similar between employed and private‐practice physicians.
DISCUSSION
In this evaluation of an MC intervention for patients with DC cared for at a large tertiary academic medical center, we found that the implementation of a routine consultation by a gastroenterologist led to greater adherence to recommended care processes when compared to UC. Overall, the management of ascites and the documentation of evaluation for liver transplantation were statistically superior in the intervention (MC) group. UC and MC were similar with respect to treatment of variceal bleeding and hepatic encephalopathy. Although we did not demonstrate changes in mortality, readmission, or LOS as a result of the MC intervention, our study was underpowered to detect clinically meaningful effects.
The gaps in care of patients with cirrhosis were reported before and after the publication of the formal QIs.[7, 8, 9, 10] These gaps remain relevant in the face of an increasing prevalence of DC along with a recent publication suggesting an underestimation of the burden of liver disease in the United States.[11] Ours is the first study to evaluate the impact on inpatients with DC of a liver service with a systematic, mandatory, specialist consultation. A previous study[12] had shown that a GI consultation would improve the care of patients with DC, but excluded patients with variceal bleeding, did not specifically measure the compliance with QIs, and more important, the GI consult was not mandatory.
Our study has several limitations that must be considered while weighing its findings. The patients were not randomly assigned but followed a pre‐established distribution depending on the call schedule. Some of the improvement we noted might be the result of secular trends; however, this remains unlikely given the lack of national initiatives or pay for performance programs. In the UC cohort, patients who were nonEnglish‐speaking were associated with a lower QI score, which could account for part of the improvement seen in the MC group that has a more prominent English‐speaking cohort. Readmissions could have occurred at other hospitals, and patients were not monitored in an outpatient setting. We did not observe a change in the secondary outcomes (30‐day readmission, LOS, in‐hospital death); however, our study was underpowered for that purpose. Given the complexity of the billing process we did not collect the costs of the MC, which is another limitation of our work. Future studies are needed to determine the cost‐effectiveness of the intervention.
This study shows that a dedicated team of physicians focused on compliance with QIs can achieve a rapid improvement, over a year, in providing higher‐quality care. This may be relevant at other institutions. The strength of our study is that our large tertiary academic medical center serves a large catchment area, with a mix of patients from both rural and urban communities. It is located in Massachusetts, where most of the population has had access to healthcare since 2006. Therefore, although this is a single‐center study, we expect our findings to be more generalizable and less subject to selection bias than other single‐center studies.
Importantly, the compliance with QIs was often far from being perfect in the MC group and was different across type of employment of providers, reflecting the challenges in changing practice among physicians.[13] In fact the QI scores of the private practice group did not change, and mirror the compliance observed at our institution in the previous study, before the implementation of the MC.[4] The difference in performance according to the type of employment of providers stems from 2 factors. First, a better documentation of the need of formal evaluation for liver transplantation by the employed gastroenterologists resulted in better compliance with this QI. Second, and more important, among the employed physicians, there was a readiness to assist the hospitalist with diagnostic/therapeutic paracentesis without relying on, for example, an interventional radiologist. This is reflected by the higher score in the management of ascites. Although our study was not designed to answer this directly, employed physicians may have been more engaged in the project and showed a greater willingness to change practice. In the future, linking reimbursement to quality of care will lead to improved accountability of consultants.
In this study we show that a direct involvement of a gastroenterologist improves the care of inpatients as measured by QIs. We theorize that a better coordination of the transition to outpatient care involving the specialist should lead to better outcomes, specifically a reduction in the 22% observed readmission rate within 30 days of patients with DC.[14, 15] As we move forward, a broader definition of outcomes should be addressed, taking into account patient‐related outcomes and preferences.[16] Future studies should define the relationship between the gastroenterologist and the hospitalist service, the role of physician assistants and nurse practitioners in implementing and monitoring compliance with QIs, and define how physicians and patients can be made accountable in the transition to the outpatient setting.
Disclosures
R.G.: Conception, data collection and interpretation, manuscript. J.F.: Data management, data analysis, manuscript. P.V.: Conception, data analysis, manuscript. P.L.: Conception, data interpretation, manuscript. T.L.: Dr. Lagu is supported by the National Heart, Lung, and Blood Institute of the National Institutes of Health under award number K01HL114745. Conception, data interpretation, manuscript. D.D.: Conception, data collection and interpretation, manuscript. A.B.: Data collection. J.S.: Data collection. Source of funding: internal. The authors report no conflicts of interest.
- , , . Natural history and prognostic indicators of survival in cirrhosis: a systematic review of 118 studies. J Hepatol. 2006;44:217–231.
- , , , . Efficacy of a chronic disease management model for patients with chronic liver failure. Clin Gastroenterol Hepatol. 2013;11:850–858.
- , , , et al. An Explicit Quality Indicator Set for Measurement of Quality of Care in Patients with Cirrhosis. Clin Gastroenterol Hepatol. 2010;8:709–717.
- , , , , , Desilets D. Measurement of the quality of care of patients admitted with decompensated cirrhosis. Liver Int. 2014:34:204–210.
- , . All‐or‐none measurement raises the bar on performance. JAMA. 2006;295:1168–1170.
- Joint Commission on Accreditation of Healthcare Organizations. Quality report user guide. Available at: http://www.jointcommission.org. Accessed May 30, 2011.
- , , , et al. Management of patients with cirrhosis in Southern California: results of a practitioner survey. J Clin Gastroenterol. 2006;40:156–161.
- , , , et al. Spanish Collaborative Study Group on Therapeutic Management In Liver Disease. Multicenter hospital study on prescribing patterns for prophylaxis and treatment of complications of cirrhosis. Eur J Clin Pharmacol. 2002;58:435–440.
- , , , et al. The quality of care provided to patients with cirrhosis and ascites in the Department of Veterans Affairs. Gastroenterology. 2012 143(1):70–77.
- , , , et al. Improved patient survival after acute variceal bleeding: a multicenter, cohort study. Am J Gastroenterol. 2003;98:653–659.
- , , , , . Underestimation of liver‐related mortality in the United States. Gastroenterology. 2013;145:375–382.
- , , , et al. Impact of gastroenterology consultation on the outcomes of patients admitted to the hospital with decompensated cirrhosis. Hepatology. 2001;34:1089–1095.
- , , , et al. Why don't physicians follow clinical practice guidelines? A framework for improvement. JAMA. 1999;282:1458–1465.
- , , , et al. Incidence and predictors of 30‐day readmission among patients hospitalized with advanced liver disease. Clin Gastroenterol Hepatol. 2011;9:254–259.
- , , , et al. Hospital Readmissions among patients with decompensated cirrhosis. Am J Gastroenterol. 2012;107:247–252.
- . Patient‐reported outcomes of cirrhosis. Clin Gastroenterol Hepatol. 2013;11:1043–1045.
Decompensated cirrhosis (DC) is defined as cirrhosis with at least 1 of the following complications: ascites, hepatocellular carcinoma, bleeding from portal hypertension, or hepatic encephalopathy. Patients with DC have a median survival estimated at 2 years compared to the 12‐year median survival of compensated cirrhotics.[1] In an era where quality of hospital care is being measured, and where progress is being made in the management of several conditions including congestive heart failure and nosocomial infections, little attention has been paid to DC. The burden of chronic liver failure is clear in the United States, where DC leads to more than 150,000 annual admissions to the hospital and accounts for 40,000 deaths annually.[2]
This burden of disease spurred quality improvement efforts in 2010, when a team of experts identified a set of literature‐based parameters or quality indicators (QI) for patients with cirrhosis.[3] We have demonstrated that adherence to these indicators fell far short of desired targets.[4] A year before their publication, an overall compliance of <50% with these metrics was measured at a single medical center.
We sought to improve the quality of care for patients with DC through implementation of mandatory consultation (MC) with a gastroenterologist for all patients admitted with DC. We assessed whether MC was associated with better care and improved outcomes (hospitalization length of stay [LOS], 30‐day readmission, and inpatient mortality) when compared to usual care (UC).[4]
MATERIALS AND METHODS
Design, Setting, and Patients
We conducted a cohort study comparing adherence to QI and outcomes of patients admitted with DC after the institution of an MC to a historical cohort of patients managed with UC (ie, before MC, adherence to QI for this group has been reported elsewhere).[4] Both cohorts included all patients aged >18 years with DC admitted to Baystate Medical Center, a tertiary care medical center in western Massachusetts. The UC cohort was collected between January 1, 2009 and December 31, 2009, and the MC cohort was assembled between June 1, 2011 and June 30, 2012.
As previously reported,[4] patients were considered for inclusion in the historical cohort if their International Classification of DiseasesNinth Revision discharge code pertained to chronic liver disease (see Supporting Information, Appendix 1, in the online version of this article). This list was broad by design to identify all patients with decompensated cirrhosis. A gastroenterologist (R.G.) then manually extracted charts from electronic medical records (EMRs) using a set of predefined clinical criteria, the same in both cohorts, to identify the patients with DC: cirrhosis with concomitant ascites, hepatic encephalopathy, or gastrointestinal (GI) bleeding secondary to portal hypertension. Other types of decompensated states, such as hepatocellular carcinoma, were not included as their management was not detailed in the QI.[3]
We included patients with suspected or established cirrhosis who had ascites confirmed radiographically or by exam, noting shifting dullness or fluid wave. However, patients were excluded if they lacked sufficient peritoneal fluid for bedside or image‐guided paracentesis. Cirrhotic patients were defined as having hepatic encephalopathy if the patient had altered mental status not secondary to seizures, cerebrovascular accident, or alcohol withdrawal. Finally, gastrointestinal bleeding in cirrhotic patients was defined as any upper or lower bleeding prompting hospital admission, or identified in the medical record as clinically significant by the attending physician.
The same QIs were measured in both cohorts. From the QI set,[3] we selected the 16 QIs that would apply to the management of inpatients (see Supporting Information, Appendix 2, in the online version of this article). Indicators developed for outpatient settings were not included. A quality score was calculated for each admission, defined as the proportion of QIs met divided by the number of QIs for which the patient was eligible. For example, a patient with hepatic encephalopathy but without GI bleeding or ascites would have a score calculated as the number of QIs met for hepatic encephalopathy and documentation of transplant evaluation divided by 3 (2 QIs for hepatic encephalopathy and 1 QI for transplant evaluation). If the patient met both QIs for hepatic encephalopathy, but the consultant failed to address liver transplant eligibility, the score would be 2/3=0.666.
After the institution of the MC, all inpatients with DC were identified within 24 hours of admission by a gastroenterologist (R.G., D.D.), who manually reviewed on a daily basis all admissions from EMRs. An author (R.G.) would then contact the admitting team (hospitalist or resident) to make sure that a gastroenterology consult was called and would then obtain the QI by manual extraction from the EMRs.
Of the 16 gastroenterologists who work at the hospital, 12 of them belong to several private practice groups, whereas 4 are employed by the hospital. As part of the intervention, all gastroenterologists were made aware of the intervention 1 month before the starting date, were provided with a checklist of the QIs of interest, and were encouraged to work with the hospitalist attendings to achieve compliance with the QIs. We reminded the gastroenterologists of the ongoing study during routine division meetings and regularly sought feedback from the hospitalists
The MC consisted of a systematic consultation by a gastroenterologist: any identified patient with DC would generate a mandatory GI consultation and would be assigned to a specialist depending on the roster coverage for that day. A close monitoring of the process allowed us to confirm that all patients admitted with DC were seen by a gastroenterologist. Patients were followed until their discharge, death, or readmission to our institution during the study period.
Outcomes
The primary outcome was defined as the rate of adherence to the QIs and overall QI score expressed as a proportion as noted above. Secondary outcomes included in‐hospital mortality, LOS, and 30‐day readmission rate. These parameters were abstracted from the medical record.
Covariates
The hospital EMR (Cerner Corporation, North Kansas City, MO) was used to extract patient demographic parameters such as gender, race, language, and age at time of admission. Other admission‐level details were extracted from the EMR including Model for End‐Stage Liver Disease (MELD) scores, documented comorbidities (including substance abuse, psychiatric diagnosis, diabetes mellitus, renal failure, congestive heart failure, coronary artery disease, and cancer), underlying etiology for cirrhosis, and reason for admission.
The study was approved by Baystate Medical Center's institutional review board.
Statistical Analysis
Summary statistics for outcomes and covariates were calculated as means/standard deviations (SDs), medians/emnterquartile range, and proportions. Univariable statistics (unpaired t tests, 1‐way analysis of variance, Fisher exact test, Spearman correlation) were used to identify possible demographic (eg, age, race) and clinical (eg, admission complaint) predictors of quality score and with 30‐day outcomes. For each admission, a composite quality score, also known as an opportunity model score,[5, 6] was calculated as a fraction (ie, the number of QIs met divided by the total number of possible QIs indicated by the patient's presentation). This fraction was then multiplied by 100 so as to express the QI score as a percent. Possible scores, therefore, ranged from 0 to 100%.
Calculation of the 30‐day incidence proportion of readmission after the first admission was restricted to patients whose readmission occurred in this hospital, and occurring up to 30‐days before study closure (June 1, 2012). In‐hospital death was examined as a function of QI score during that admission. To derive an unbiased, risk‐adjusted estimate of the association between quality score and outcomes, multiple linear regression (opportunity model score [OMS], LOS) or multiple Poisson regression models (30‐day readmission, in‐hospital death) were built. These included a dummy variable for the study period, as well as any potential confounder that was associated at P0.10, with both study period and the outcome in univariable analyses. Robust standard errors were specified to account for multiple admissions within patients. Marginal means or proportions were then estimated with 95% confidence intervals derived using the delta method. All analyses were performed using Stata 12.1 for Windows (StataCorp, College Station, TX).
RESULTS
A total of 303 patients were observed in 695 hospitalizations;149 patients in 379 admissions were observed in the UC cohort, and 154 patients in 316 admissions were observed in the MC cohort. Baseline demographics of all study admissions appear in Table 1. Patients seen in the MC cohort were younger, more likely to speak English, and less likely to be male or have comorbid diabetes mellitus. Most admissions (n=217, 57.2%; 95% confidence interval: 52.3%‐62.3%) were not evaluated by a gastroenterologist in the UC cohort but all were in the MC cohort.
| UC, N=379, N (%) or Mean/SD | MC, N=316, N (%) or Mean/SD | P Value* | |
|---|---|---|---|
| |||
| Age, y | 55.3/12.1 | 53.3/13.6 | 0.05 |
| English speaking | 261 (68.9%) | 261 (82.6%) | <0.001 |
| Male | 251 (66.2%) | 163 (53.5%) | 0.001 |
| Race | <0.001 | ||
| White | 301 (79.4%) | 262 (82.9%) | |
| Black | 31 (8.2%) | 40 (12.7%) | |
| Asian | 16 (4.2%) | 0 (0.0%) | |
| Other | 31 (8.2%) | 14 (4.4%) | |
| Comorbidities | |||
| Substance | 75 (19.8%) | 58 (18.4%) | 0.70 |
| abuse | |||
| Psychiatric | 123 (32.5%) | 103 (32.9%) | 0.94 |
| Diabetes mellitus | 175 (45.4%) | 115 (36.5%) | 0.02 |
| Renal failure | 74 (19.3%) | 55 (17.4%) | 0.50 |
| CHF | 38 (10.0%) | 24 (7.6%) | 0.35 |
| CAD | 26 (6.9%) | 17 (5.4%) | 0.43 |
| Cancer | 48 (12.7%) | 40 (12.7%) | 1.00 |
| Admission MELD | 15.6/6.9 | 17.0/7.0 | 0.006 |
| Serum creatinine | 1.43/1.94 | 1.42/1.30 | 0.91 |
| Reason for admission | |||
| Hepatology/GI | 318 (83.9%) | 257 (81.3%) | 0.42 |
| Renal failure | 85 (22.4%) | 90 (28.5%) | 0.08 |
| Encephalopathy | 151 (39.3%) | 113 (34.9%) | 0.24 |
| GI bleed | 78 (20.5%) | 57 (18.0%) | 1.00 |
| Abdominal pain | 116 (30.7%) | 114 (36.2%) | 0.15 |
| Ascites | 246 (64.9%) | 185 (58.5%) | 0.10 |
Admission Characteristics
The baseline clinical measures of all study admissions appear in Table 1. The UC and MC cohorts had similar characteristics, with the majority of patients with DC admitted for a gastrointestinal/hepatology‐related reason specifically for the management of ascites and hepatic encephalopathy. The patients in the MC cohort had a statistically higher MELD score on admission, which was not clinically relevant.
Quality Measures
Adherence to individual quality indices is shown in Table 2.
| Condition (Denominator) | Quality Indicator (Numerator) | UC (n=379), Met/Indicated | MC (n=316), Met/Indicated | P Value | |
|---|---|---|---|---|---|
| |||||
| Admissions with ascites | |||||
| 1 | Admissions to the hospital because of ascites or encephalopathy. | Diagnostic paracentesis during admission. | 77/193, 39.9%, (32.9%, 46.9%) | 111/135, 82.2% (75.7%, 88.8%) | <0.001 |
| 2 | No fibrinolysis or disseminated intravascular coagulation before paracentesis INR <2.5, >100,000 platelets. | No fresh frozen plasma or platelet replacement given. | 36/37, 97.3% (91.8%, 103.0%) | 41/42, 97.6% (92.8%, 102.4%) | 1.00 |
| 3 | All admissions with diagnostic paracentesis (not limited to admissions for ascites or hepatic encephalopathy). | Cell count differential, total protein, albumin, and culture/sensitivity all performed. | 31/49, 63.3% (49.3%‐77.3%) | 46/72 63.9% (52.7%, 75.0%) | 1.00 |
| 4 | Admissions with known portal hypertension‐related ascites receiving a paracentesis. | Ascitic fluid cell count and differential performed. | 15/104, 14.4% (7.6%‐ 21.3%) | 47/62, 75.8% (63.2%, 88.4%) | <0.001 |
| 5 | Serum sodium 110 mEq/L. | Fluid restriction and discontinuation of diuretics. | NA | NA | NA |
| 6 | Polymorphonuclear count of 250/mm3 in ascites. | Empiric antibiotics, 6 hours of results. | 10/13, 76.9% (50.4%‐ 103.4%) | 16/20, 80.0% (60.8%, 99.2%) | 1.00 |
| 7 | Ascitic fluid, total protein 1.1 gm/dL, serum bilirubin 2.5 mg/dL. | Prophylactic antibiotics. | 4/12, 33.3% (2.0%‐ 64.6%) | 18/30, 60.0%, (41.4%, 78.6%) | 0.18 |
| 8 | Normal renal function. | Salt restriction and diuretics (spironolactone and loop diuretics). | 57/186, 30.6%, (24.0%‐ 37.3%) | 81/122, 66.4%, (57.9%, 74.9%) | <0.001 |
| Total ascites subscore, mean/SD | 30%/36% | 67%/34% | <0.001 | ||
| GI bleeding | |||||
| 9 | Admissions with GI bleeding: variceal and nonvariceal, hematemesis and melena. | Upper endoscopy 24 hours of presentation. | 60/78, 76.9% (67.4%, 86.4%) | 52/57, 91.2% (83.7%, 98.8%) | 0.04 |
| 10 | Esophageal varices (active, stigmata of recent bleeding, or no other causes to explain bleeding). | Endoscopic variceal ligation/sublerotherapy. | 40/46, 87.0% (76.8%‐97.1%) | 30/32, 93.8% (84.9%, 100.0%) | 0.46 |
| 11 | Admissions with established/suspected upper GI bleeding. | Antibiotics within 24 hours of admission. | 27/69, 39.1% (27.3%‐ 50.9%) | 26/58, 44.8% (31.6%, 58.0%) | 0.59 |
| 12 | Admissions with established/suspected variceal bleeding. | Somatostatin/octreotide given within 12 hours of presentation. | 53/69, 76.8%, (66.6%‐ 87.0%) | 49/58, 84.5% (73.8%, 95.2%) | 0.37 |
| 13 | Recurrent bleeding within 72 hours of initial endoscopic hemostasis. | Repeat endoscopy or transjugular intrahepatic portosystemic shunt. | 5/5 100% | 2/3, 66.7% (76.8%, 210.0%) | 0.38 |
| Total GI subscore, mean/SD | 61%/38% | 74%/28% | 0.04 | ||
| Liver transplantation | |||||
| 14 | Admissions with MELD 15 or MELD 15 and decompensated status (ie, all admissions in our study). | Documented evaluation for liver transplantation. | 112/379, 29.6% (24.9%‐ 34.2%) | 231/316, 73.6% (68.7%, 78.5%) | <0.001 |
| Hepatic encephalopathy | |||||
| 15 | Admissions with hepatic encephalopathy. | Search for reversible factors documented. | 81/151, 53.6% (45.6%‐ 61.7 %) | 97/113, 85.8% (79.4%, 92.3%) | <0.001 |
| 16 | Admissions with hepatic encephalopathy. | Oral disaccharides/ rifaximin. | 144/151, 95.3% (91.9 %‐ 98.7 %) | 107/113, 94.7% (90.7%. 98.69%) | 1.00 |
| Total encephalopathy subscore, mean/SD | 75%/28% | 90%/24% | <0.001 | ||
Ascites
The management of ascites yielded 3 main differences between the 2 cohorts. Following the implementation of the MC, 82.2 % (111/135) of ascites‐related admissions led to a diagnostic paracentesis as compared to 39.9% (77/193) in the UC group (P<0.001).
In the MC cohort, 75.8% (47/62) of admissions with known portal hypertensionrelated ascites who received a paracentesis had an ascites cell count checked. In contrast, only 14.4% (15/104) in the UC group receiving paracentesis had a fluid cell count (P<0.001). The management of ascites in patients with normal renal function was optimal, with sodium restriction and diuretics combination in 66.4% (81/122) of the MC cohort, whereas this parameter in the UC cohort was only 30.6% (57/186) (P<0.001). There were no significant differences between the groups for the other QIs.
Variceal Bleeding
The MC group had a higher frequency of endoscopy within 24 hours of admissions than the UC group (91.2% [52/57] vs 76.9% [60/78], respectively; P<0.04). The rest had endoscopy later in the admission. Among admissions with bleeding from varices, banding was done 93.8% of the time for patients in the MC group (30/32), which was not statistically different than 87.0% (40/46) for patients seen in the UC group. In the remaining admissions, endoscopy only revealed nonbleeding large esophageal varices, and the endoscopist opted not to proceed with therapy. There were no statistically significant differences in the rest of the management.
Hepatic Encephalopathy
For hepatic encephalopathy, an empirical treatment was given to 95.3 % (144/151) patients in the UC group and 94.7% (107/113) of the patients in the MC group. We found better documentation of a search for underlying etiologies leading to hepatic encephalopathy in the MC cohort 85.8% (97/113) versus the UC cohort, which was only 53.6% (81/151) (P<0.001).
Evaluation for Liver Transplantation
Better documentation of evaluation for liver transplantation was seen in the MC group 73.6% (231/316) in comparison to the UC group 29.4% (111/379) (P<0.001).
Opportunity Score and Clinical Outcomes
As detailed above, care provided during the MC achieved a higher compliance with the QI shown with the QI score or OMS (Table 3). These improvements were not associated with statistically significant differences in in‐hospital death, LOS, or 30‐day readmission. To explore this further we also examined the direct association between the OMS and outcomes in the MC group by dividing patients into 2 groups: patients whose OMS was 80% and those whose OMS was <80% (see Supporting Information, Appendix 4, in the online version of this article). Although there were trends toward decreased in‐hospital death (6.4% vs 8.6%, P=0.26), increased 30‐day readmission (33.8% vs 23.0%, P=0.27), and decreased LOS (6.2 days vs 6.6 days, P=0.77), none of these differences achieved statistical significance.
| Unadjusted | Adjusted* | |||||
|---|---|---|---|---|---|---|
| UC | MC | Difference | UC | MC | Difference | |
| ||||||
| Opportunity model score | 0.46 | 0.77 | +0.31 (0.24, 0.39) | 0.46 | 0.77 | +0.30(0.23, 0.37) |
| In‐hospital death | 7.1% | 8.5% | +1.4 (0.3, +5.6) | 7.5% | 7.9% | +0.4% (4.0%, +4.5%) |
| Readmission within 30 days | 39.6% | 32.6% | 7.0% (16.4%, +2.5%) | 40.0% | 31.8% | 8.2%(18.0%, +1.5%) |
| Length of stay | 6.1d | 6.2d | +0.1d (1.0 d, +1.2 d) | 6.1d | 6.2d | +0.1d (1.0 d, +1.2d) |
Mandatory Consultation Subgroups: Employed Versus Private Physicians
The type of employment of the gastroenterologist on consultation (employed by the hospital vs private practice) affected the management of the patients admitted with DC (see Supporting Information, Appendix 3, in the online version of this article). Patients seen by a hospital‐employed gastroenterologist were more likely to have a better documentation in regard to evaluation for liver transplantation and better management of ascites. Except for the prescription of antibiotics in patients presenting with GI bleeding, which were more often given by the employed physician (63% vs 23%, P=0.004), the management of hepatic encephalopathy and GI bleeding was similar between employed and private‐practice physicians.
DISCUSSION
In this evaluation of an MC intervention for patients with DC cared for at a large tertiary academic medical center, we found that the implementation of a routine consultation by a gastroenterologist led to greater adherence to recommended care processes when compared to UC. Overall, the management of ascites and the documentation of evaluation for liver transplantation were statistically superior in the intervention (MC) group. UC and MC were similar with respect to treatment of variceal bleeding and hepatic encephalopathy. Although we did not demonstrate changes in mortality, readmission, or LOS as a result of the MC intervention, our study was underpowered to detect clinically meaningful effects.
The gaps in care of patients with cirrhosis were reported before and after the publication of the formal QIs.[7, 8, 9, 10] These gaps remain relevant in the face of an increasing prevalence of DC along with a recent publication suggesting an underestimation of the burden of liver disease in the United States.[11] Ours is the first study to evaluate the impact on inpatients with DC of a liver service with a systematic, mandatory, specialist consultation. A previous study[12] had shown that a GI consultation would improve the care of patients with DC, but excluded patients with variceal bleeding, did not specifically measure the compliance with QIs, and more important, the GI consult was not mandatory.
Our study has several limitations that must be considered while weighing its findings. The patients were not randomly assigned but followed a pre‐established distribution depending on the call schedule. Some of the improvement we noted might be the result of secular trends; however, this remains unlikely given the lack of national initiatives or pay for performance programs. In the UC cohort, patients who were nonEnglish‐speaking were associated with a lower QI score, which could account for part of the improvement seen in the MC group that has a more prominent English‐speaking cohort. Readmissions could have occurred at other hospitals, and patients were not monitored in an outpatient setting. We did not observe a change in the secondary outcomes (30‐day readmission, LOS, in‐hospital death); however, our study was underpowered for that purpose. Given the complexity of the billing process we did not collect the costs of the MC, which is another limitation of our work. Future studies are needed to determine the cost‐effectiveness of the intervention.
This study shows that a dedicated team of physicians focused on compliance with QIs can achieve a rapid improvement, over a year, in providing higher‐quality care. This may be relevant at other institutions. The strength of our study is that our large tertiary academic medical center serves a large catchment area, with a mix of patients from both rural and urban communities. It is located in Massachusetts, where most of the population has had access to healthcare since 2006. Therefore, although this is a single‐center study, we expect our findings to be more generalizable and less subject to selection bias than other single‐center studies.
Importantly, the compliance with QIs was often far from being perfect in the MC group and was different across type of employment of providers, reflecting the challenges in changing practice among physicians.[13] In fact the QI scores of the private practice group did not change, and mirror the compliance observed at our institution in the previous study, before the implementation of the MC.[4] The difference in performance according to the type of employment of providers stems from 2 factors. First, a better documentation of the need of formal evaluation for liver transplantation by the employed gastroenterologists resulted in better compliance with this QI. Second, and more important, among the employed physicians, there was a readiness to assist the hospitalist with diagnostic/therapeutic paracentesis without relying on, for example, an interventional radiologist. This is reflected by the higher score in the management of ascites. Although our study was not designed to answer this directly, employed physicians may have been more engaged in the project and showed a greater willingness to change practice. In the future, linking reimbursement to quality of care will lead to improved accountability of consultants.
In this study we show that a direct involvement of a gastroenterologist improves the care of inpatients as measured by QIs. We theorize that a better coordination of the transition to outpatient care involving the specialist should lead to better outcomes, specifically a reduction in the 22% observed readmission rate within 30 days of patients with DC.[14, 15] As we move forward, a broader definition of outcomes should be addressed, taking into account patient‐related outcomes and preferences.[16] Future studies should define the relationship between the gastroenterologist and the hospitalist service, the role of physician assistants and nurse practitioners in implementing and monitoring compliance with QIs, and define how physicians and patients can be made accountable in the transition to the outpatient setting.
Disclosures
R.G.: Conception, data collection and interpretation, manuscript. J.F.: Data management, data analysis, manuscript. P.V.: Conception, data analysis, manuscript. P.L.: Conception, data interpretation, manuscript. T.L.: Dr. Lagu is supported by the National Heart, Lung, and Blood Institute of the National Institutes of Health under award number K01HL114745. Conception, data interpretation, manuscript. D.D.: Conception, data collection and interpretation, manuscript. A.B.: Data collection. J.S.: Data collection. Source of funding: internal. The authors report no conflicts of interest.
- , , . Natural history and prognostic indicators of survival in cirrhosis: a systematic review of 118 studies. J Hepatol. 2006;44:217–231.
- , , , . Efficacy of a chronic disease management model for patients with chronic liver failure. Clin Gastroenterol Hepatol. 2013;11:850–858.
- , , , et al. An Explicit Quality Indicator Set for Measurement of Quality of Care in Patients with Cirrhosis. Clin Gastroenterol Hepatol. 2010;8:709–717.
- , , , , , Desilets D. Measurement of the quality of care of patients admitted with decompensated cirrhosis. Liver Int. 2014:34:204–210.
- , . All‐or‐none measurement raises the bar on performance. JAMA. 2006;295:1168–1170.
- Joint Commission on Accreditation of Healthcare Organizations. Quality report user guide. Available at: http://www.jointcommission.org. Accessed May 30, 2011.
- , , , et al. Management of patients with cirrhosis in Southern California: results of a practitioner survey. J Clin Gastroenterol. 2006;40:156–161.
- , , , et al. Spanish Collaborative Study Group on Therapeutic Management In Liver Disease. Multicenter hospital study on prescribing patterns for prophylaxis and treatment of complications of cirrhosis. Eur J Clin Pharmacol. 2002;58:435–440.
- , , , et al. The quality of care provided to patients with cirrhosis and ascites in the Department of Veterans Affairs. Gastroenterology. 2012 143(1):70–77.
- , , , et al. Improved patient survival after acute variceal bleeding: a multicenter, cohort study. Am J Gastroenterol. 2003;98:653–659.
- , , , , . Underestimation of liver‐related mortality in the United States. Gastroenterology. 2013;145:375–382.
- , , , et al. Impact of gastroenterology consultation on the outcomes of patients admitted to the hospital with decompensated cirrhosis. Hepatology. 2001;34:1089–1095.
- , , , et al. Why don't physicians follow clinical practice guidelines? A framework for improvement. JAMA. 1999;282:1458–1465.
- , , , et al. Incidence and predictors of 30‐day readmission among patients hospitalized with advanced liver disease. Clin Gastroenterol Hepatol. 2011;9:254–259.
- , , , et al. Hospital Readmissions among patients with decompensated cirrhosis. Am J Gastroenterol. 2012;107:247–252.
- . Patient‐reported outcomes of cirrhosis. Clin Gastroenterol Hepatol. 2013;11:1043–1045.
© 2014 Society of Hospital Medicine